Article

Modeling Tsunami-Induced Erosion of Bridge-Abutment Backfill

1
Department of Civil and Environmental Engineering, Nagoya University, Furo-cho, Chikusa-ku, Nagoya 464-8603, Japan
2
Central Japan Railway Company, JR Central Towers, 1-1-4, Meieki, Nakamura-ku, Nagoya 450-6101, Japan
*
Author to whom correspondence should be addressed.
J. Mar. Sci. Eng. 2020, 8(11), 922; https://doi.org/10.3390/jmse8110922
Submission received: 30 October 2020 / Revised: 8 November 2020 / Accepted: 12 November 2020 / Published: 15 November 2020
(This article belongs to the Section Coastal Engineering)

Abstract

:
Tsunamis can seriously damage bridges in coastal areas. Studies of such damage have elucidated the action of tsunami-induced forces on girders. However, tsunami-induced erosion of bridge-abutment backfill has been largely neglected. This article investigates this little-studied topic using hydraulic model experiments and numerical analyses. The results show that a tsunami erodes the backfill close to the abutment; the scale of the erosion increases with the duration of the tsunami. By contrast, the backfill on the far side of the abutment remains relatively intact. This suggests that the presence of the abutment accelerates the erosion of the backfill in its vicinity. A numerical simulation shows that the tsunami erodes the oval conical part of the backfill on the landward side of the onshore wing. When the erosion reaches the lower end of the wing the backfill begins to flow out from underneath. Thus, an increase in the soil-cover depth of the onshore wing might help slow down the erosion.

1. Introduction

Coastal areas can be damaged by tsunamis. Bricker et al. [1] have measured scour depths after the 2011 Tohoku earthquake and compared them with theoretical and empirical estimates. The comparison shows that Rajaratnam’s result [2] can give conservative scour depth predictions. Bressan et al. [3] have collected experimental data on tsunami-induced incipient motion of boulders and emphasized boulders can be moved when only partially submerged by the flow.
After the 2011 Tohoku earthquake, many bridges in the coastal area were also damaged by the tsunami. Of the 1,572 bridges on 11 Japanese national roads maintained by the Tohoku Regional Bureau of the Ministry of Land, Infrastructure, and Transport of Japan, 151 were affected, and 141 were damaged [4]. Specifically, 12 were washed away, 22 were scoured around their abutments, and 24 were scoured around their piers. Damage to bridges is an obstacle to recovery; it is essential that bridges remain functional after tsunamis.
Since the 2004 Sumatra earthquake, many papers have been written about tsunami-induced damage to bridges. This literature has been summarized in detail by Azadbakht and Yim [5]; most studies have used field surveys, hydraulic model experiments, and numerical analyses to understand how wave forces act on girders. For example, Wei et al. [6] have applied the smoothed particle hydrodynamics (SPH) to the impact of a tsunami bore on bridge piers. This study shows high bed shear stress zones are extended downstream of the piers. The present authors [7] have used hydraulic model experiments and numerical analyses to investigate how tsunami-induced forces affect the motion of bridge girders. The results show that the horizontal force acting on the girders can be evaluated by using the Morison equation and considering water-level fluctuations; the vertical force acting on the girders can be evaluated as the sum of the buoyancy force and the downforce (the lift force acting in the downward direction).
By contrast, tsunami-induced erosion of the backfill of bridge abutments has rarely been studied. Inoue et al. [8] and Yoshizaki et al. [9] investigated the mechanism of such erosion using centrifuge model experiments. These studies revealed that the downstream slope of the backfill was damaged by the overflowing tsunami regardless of the shape of the abutment and backfill, and that the ratio of the shear stress of the tsunami to the shear resistance of the backfill affected the damage. However, the overtopping duration of the tsunami was short, due to the limitations of the centrifuge, and the investigation was also limited from a geotechnical point of view; hence, the mechanism of tsunami-induced erosion of the backfill remains poorly understood.
In this study, the process of tsunami-induced erosion of the backfill of a bridge abutment is investigated using hydraulic model experiments and numerical analyses. In the hydraulic model experiments, a tsunami-modeled flow is directed towards a model of the abutment and backfill of the Numata overpass in Iwate Prefecture, Japan, a bridge damaged in the 2011 Tohoku-earthquake tsunami. The surface-profile change in the backfill before and after the tsunami is investigated. In the numerical analyses, a three-dimensional coupled fluid-structure-sediment-seabed interaction model (FS3M) [10,11] is applied to the results of the hydraulic model experiments. The predictive capability of the FS3M is demonstrated by a comparison with the experiment. The precise details of the erosion process of the backfill, which are difficult to observe experimentally, are investigated numerically instead.

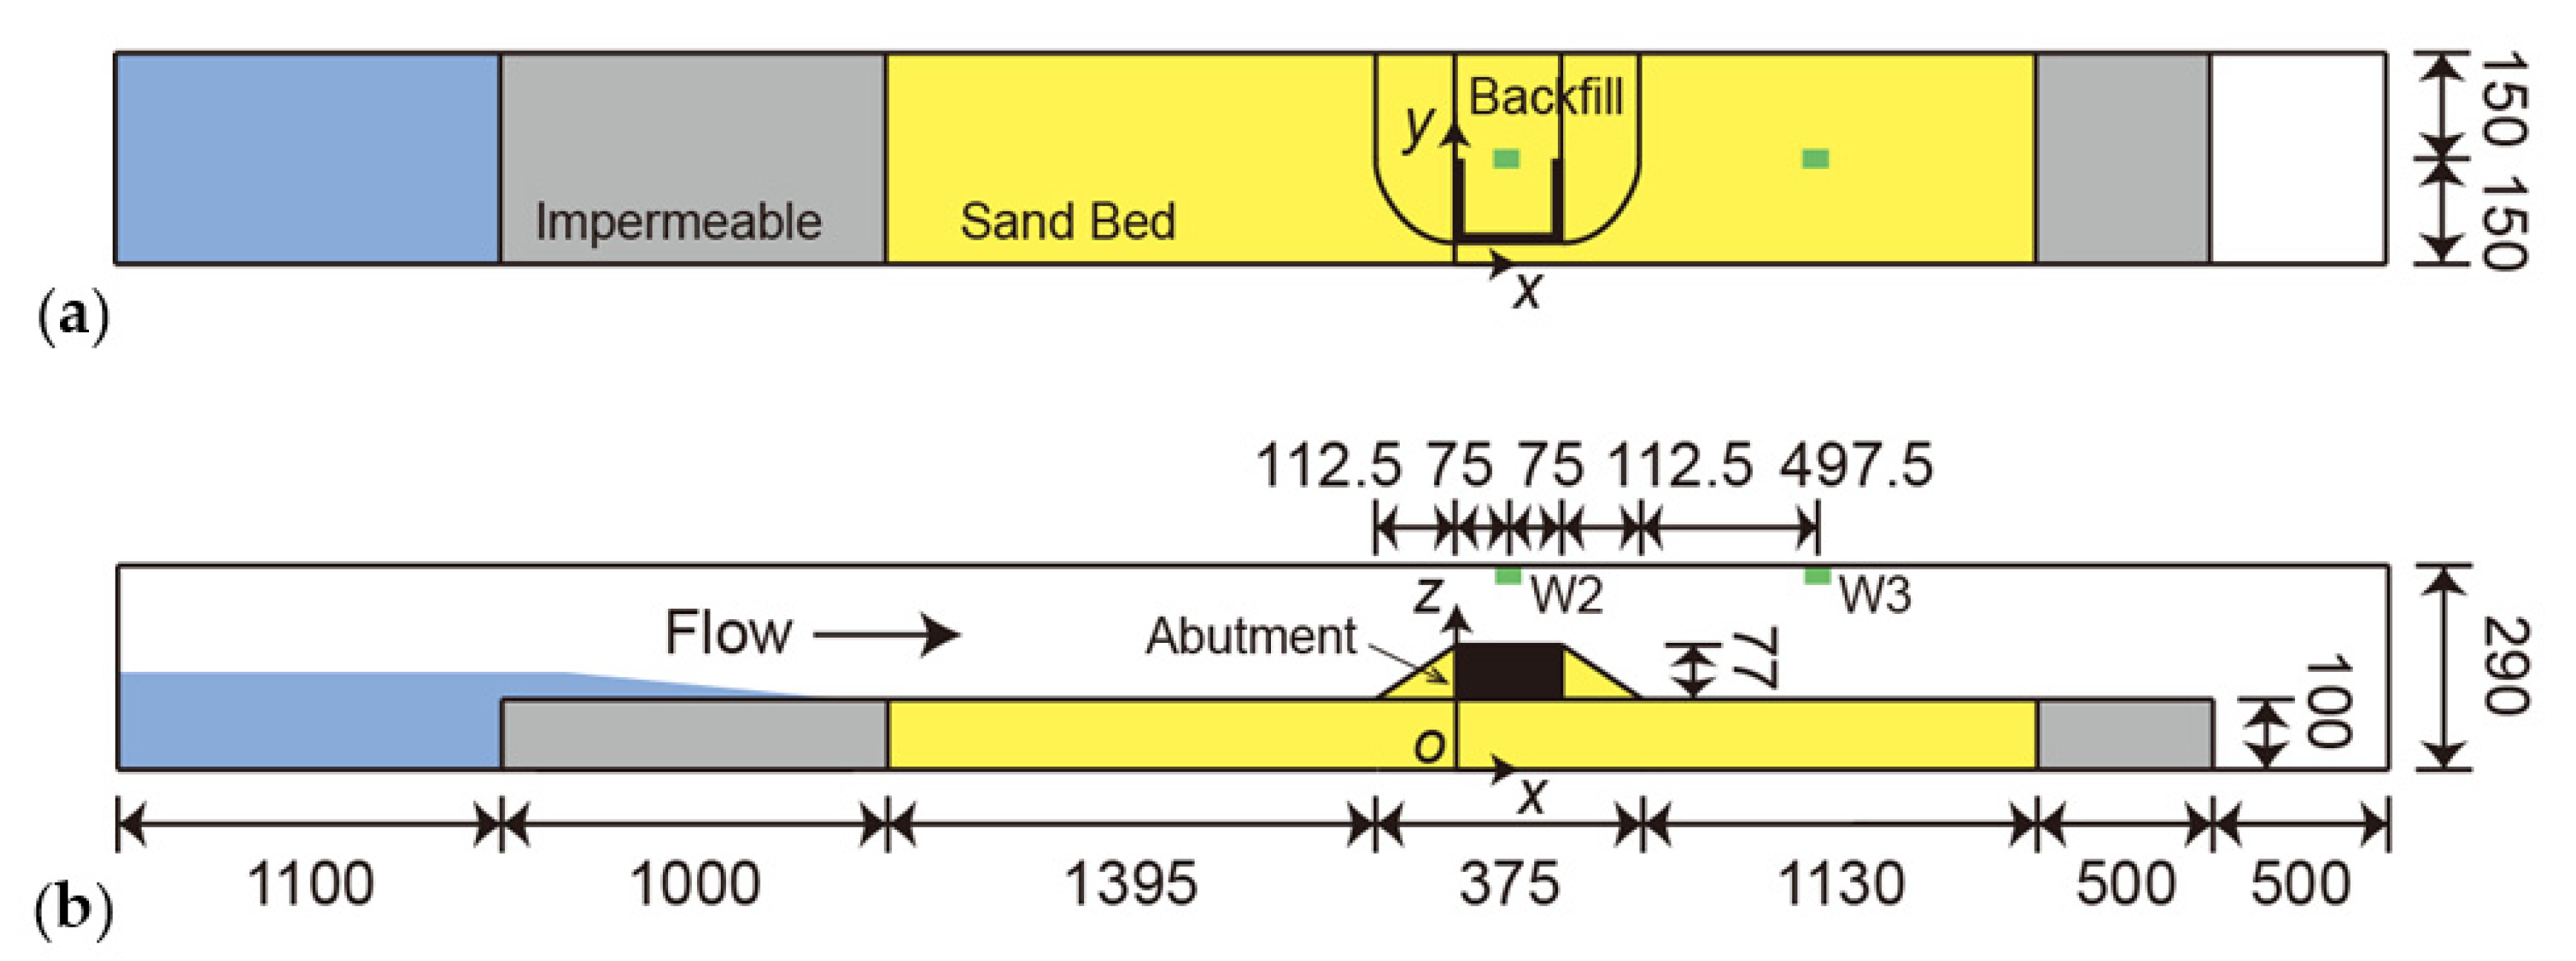
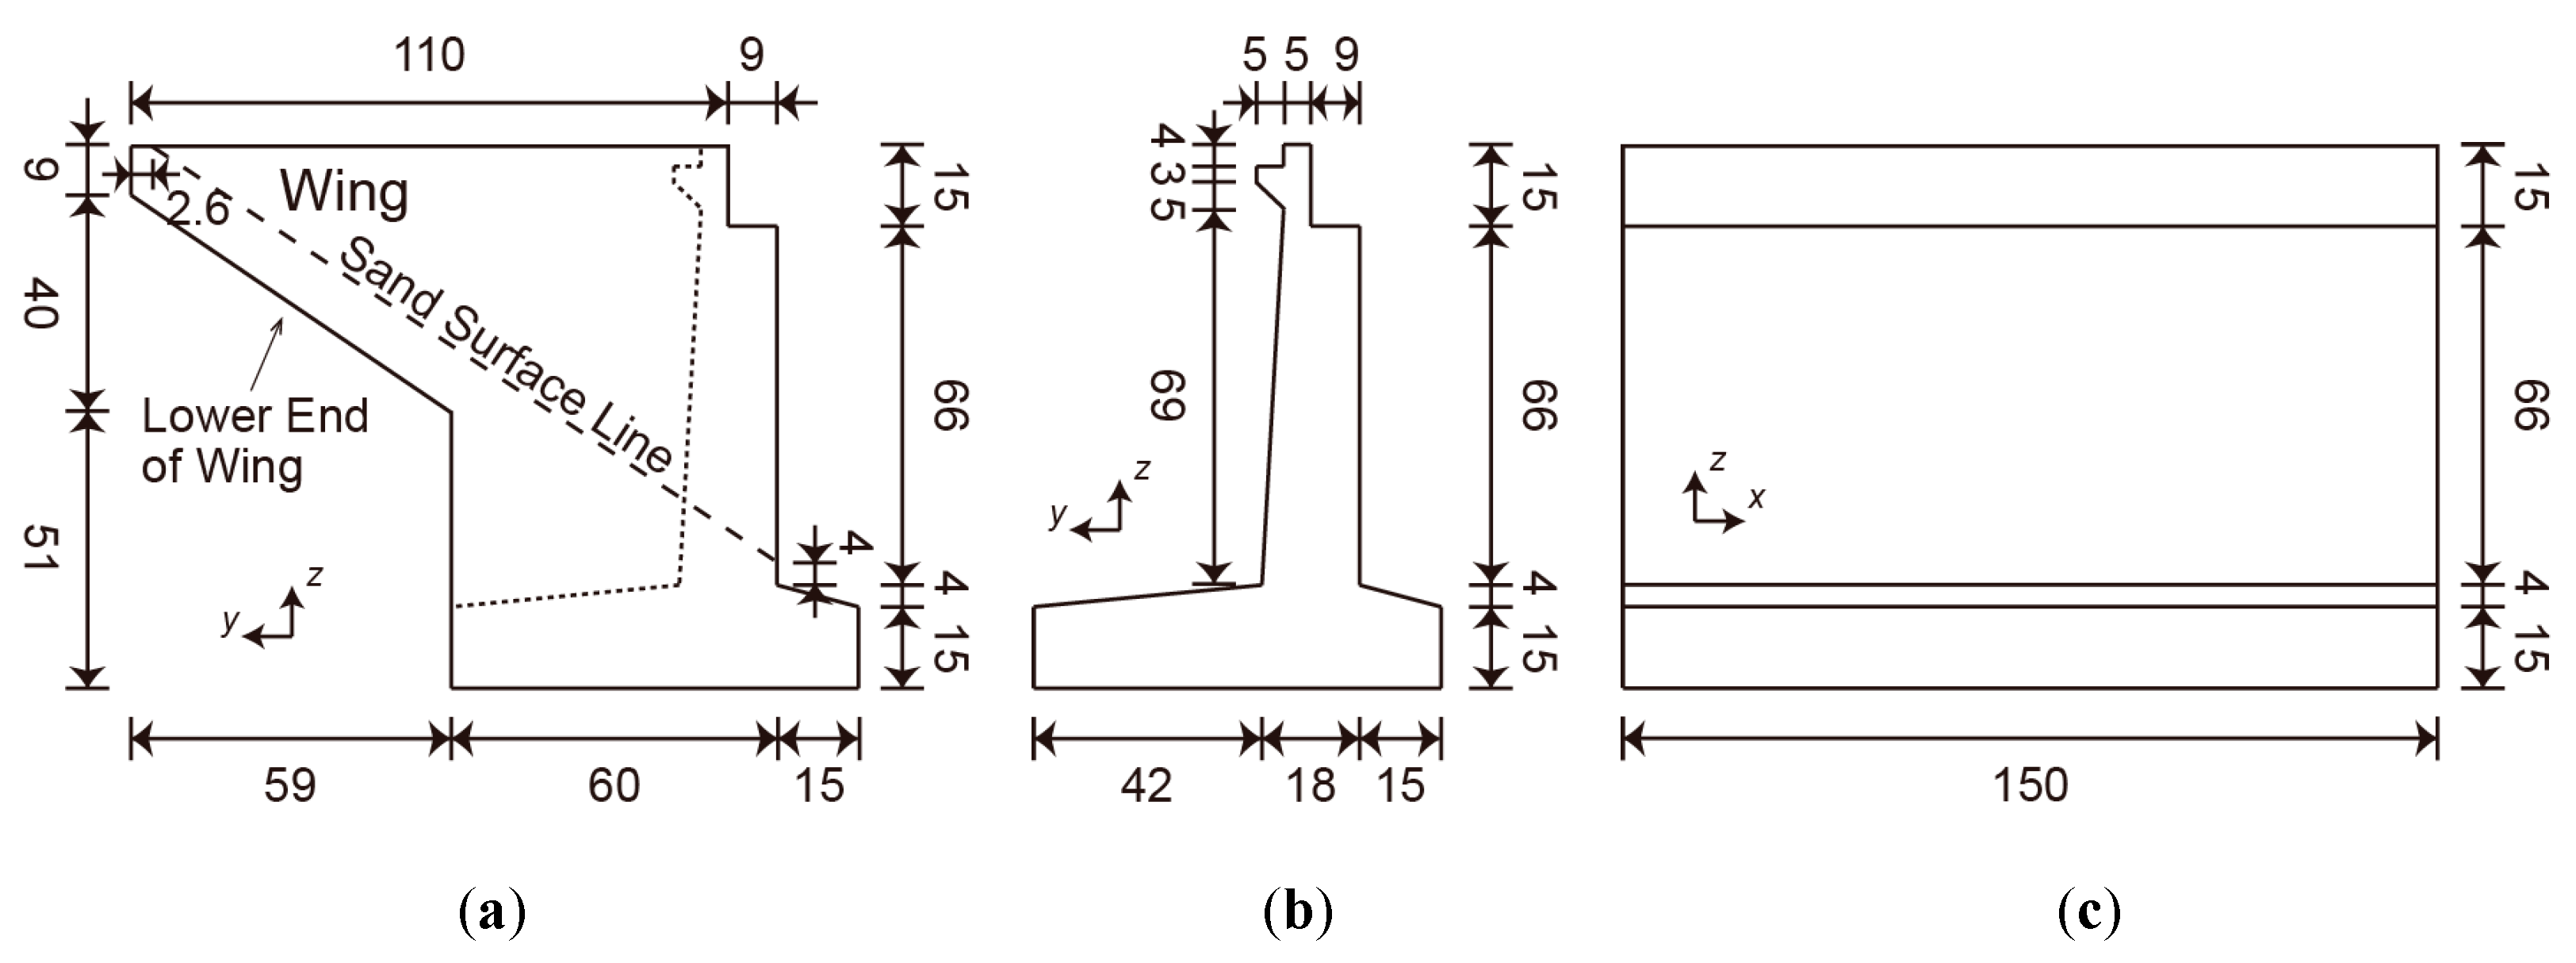
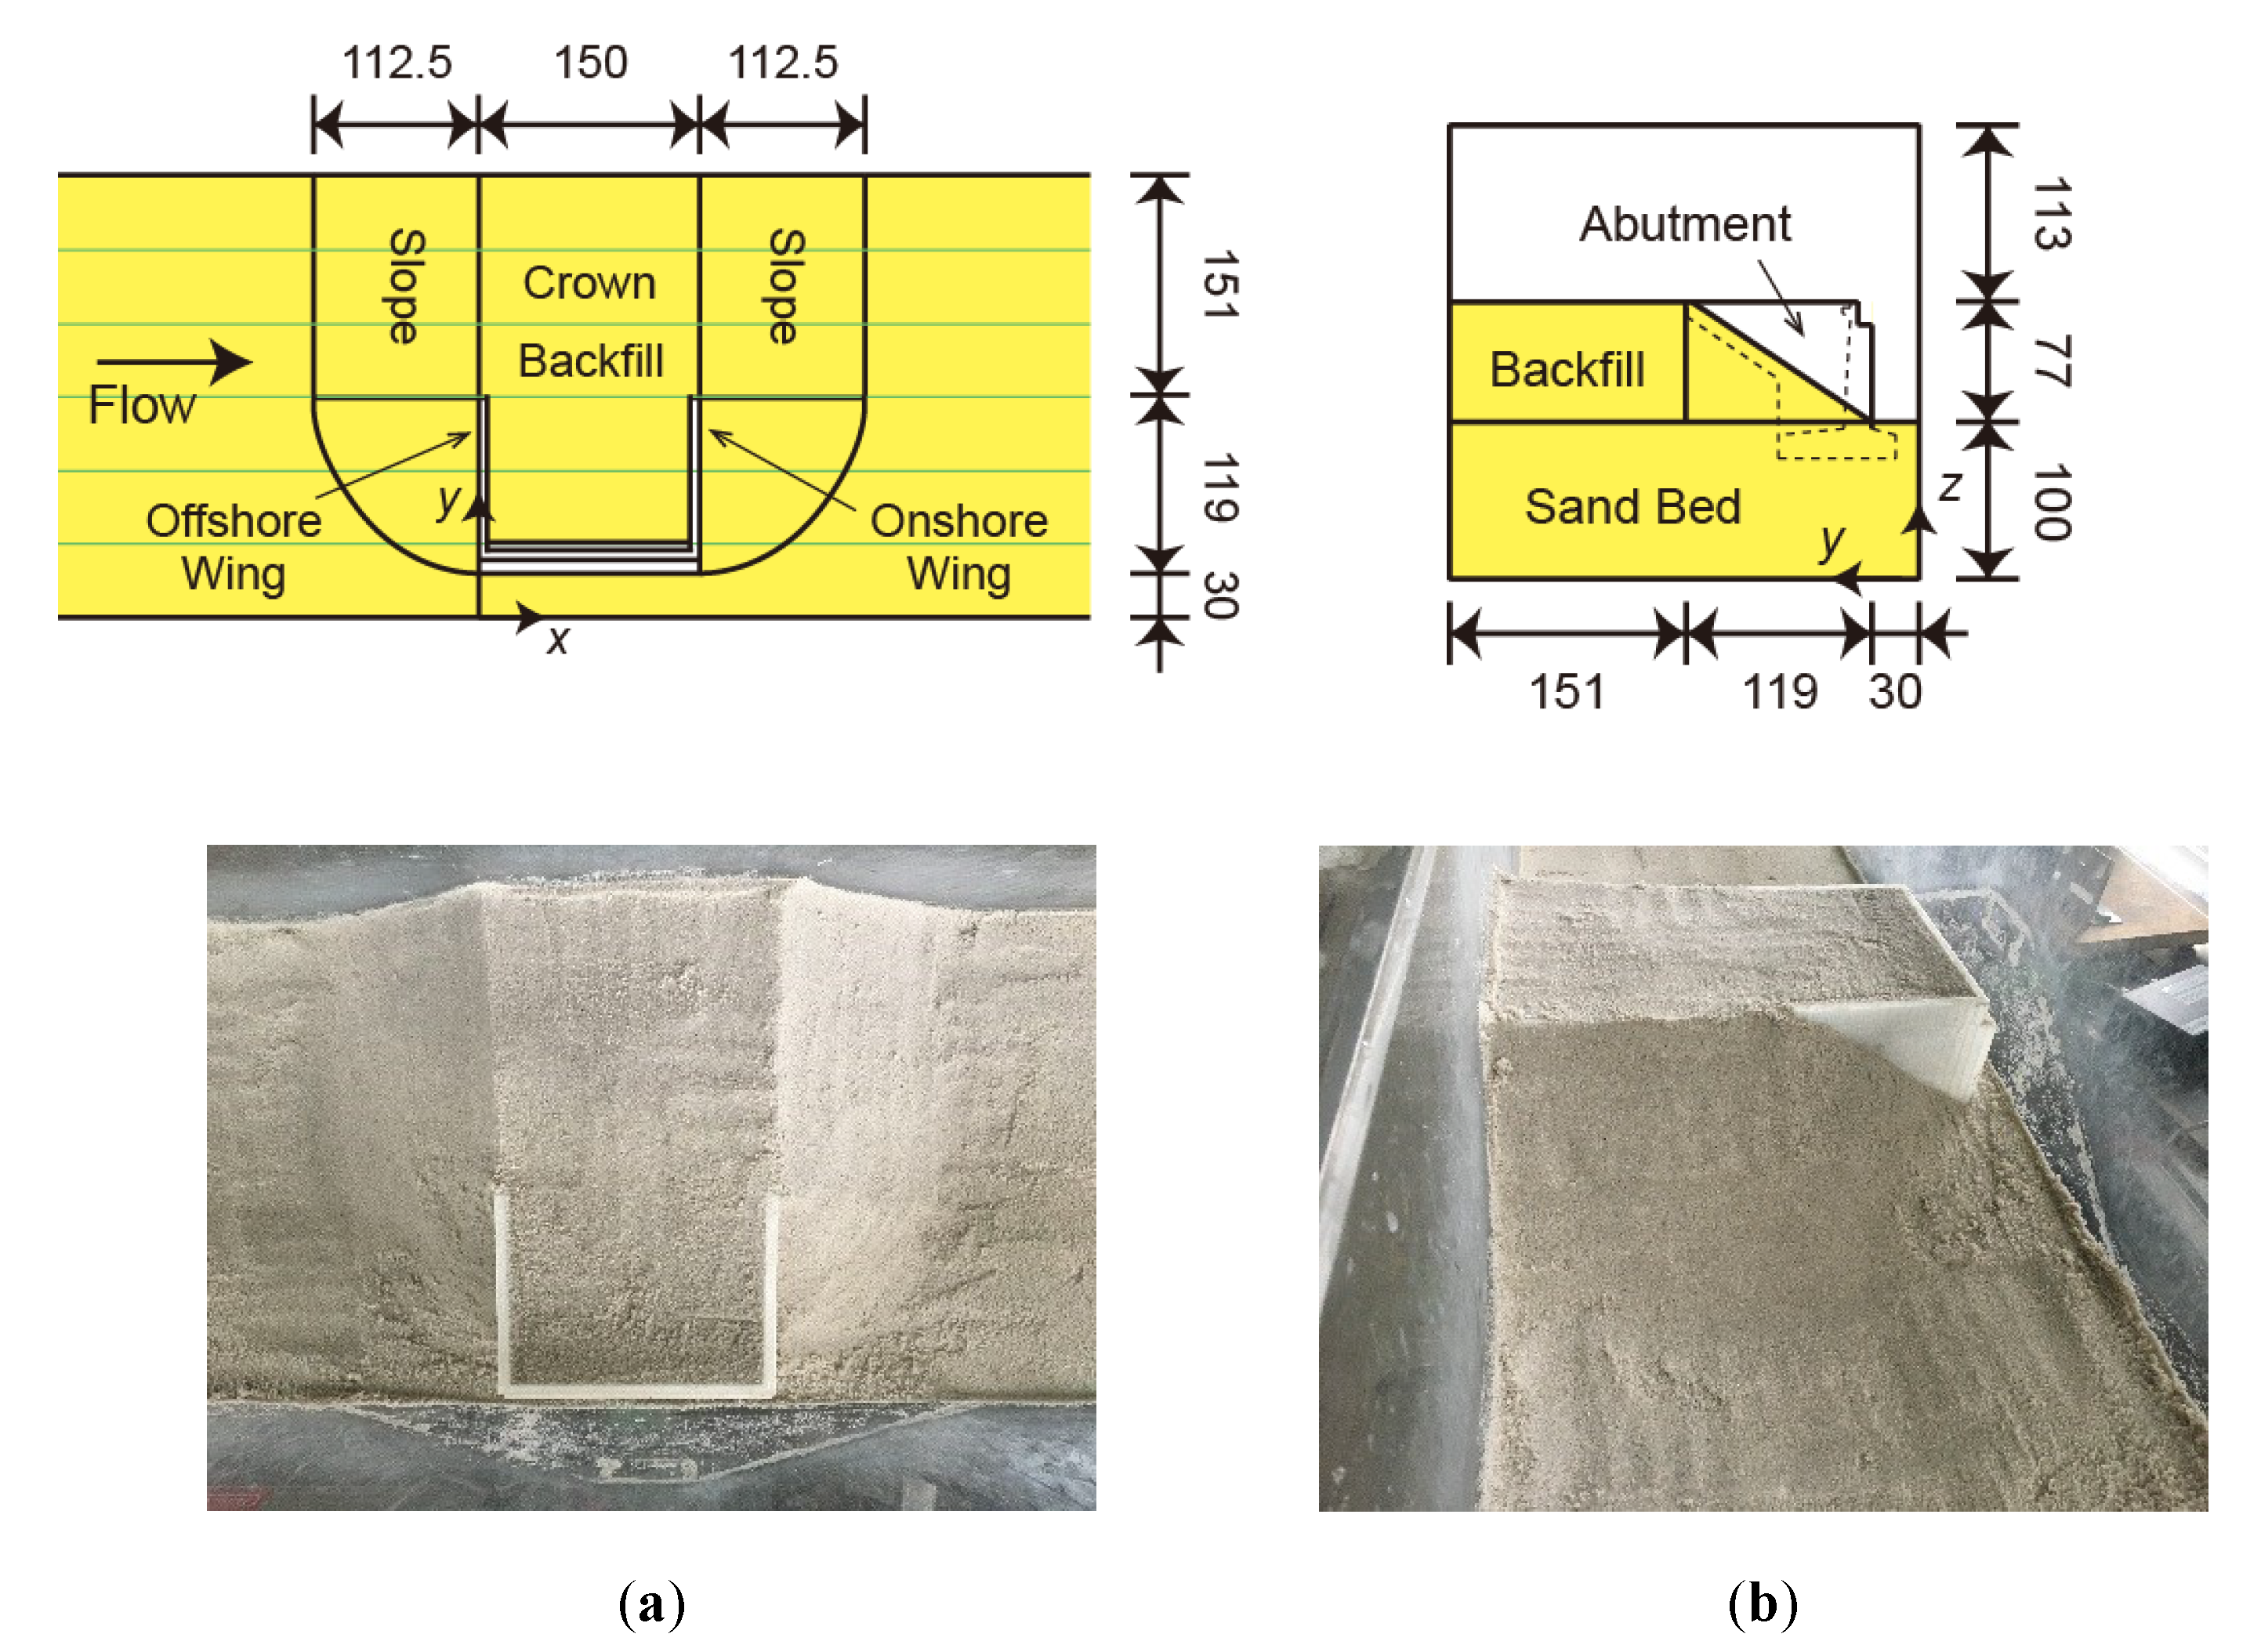
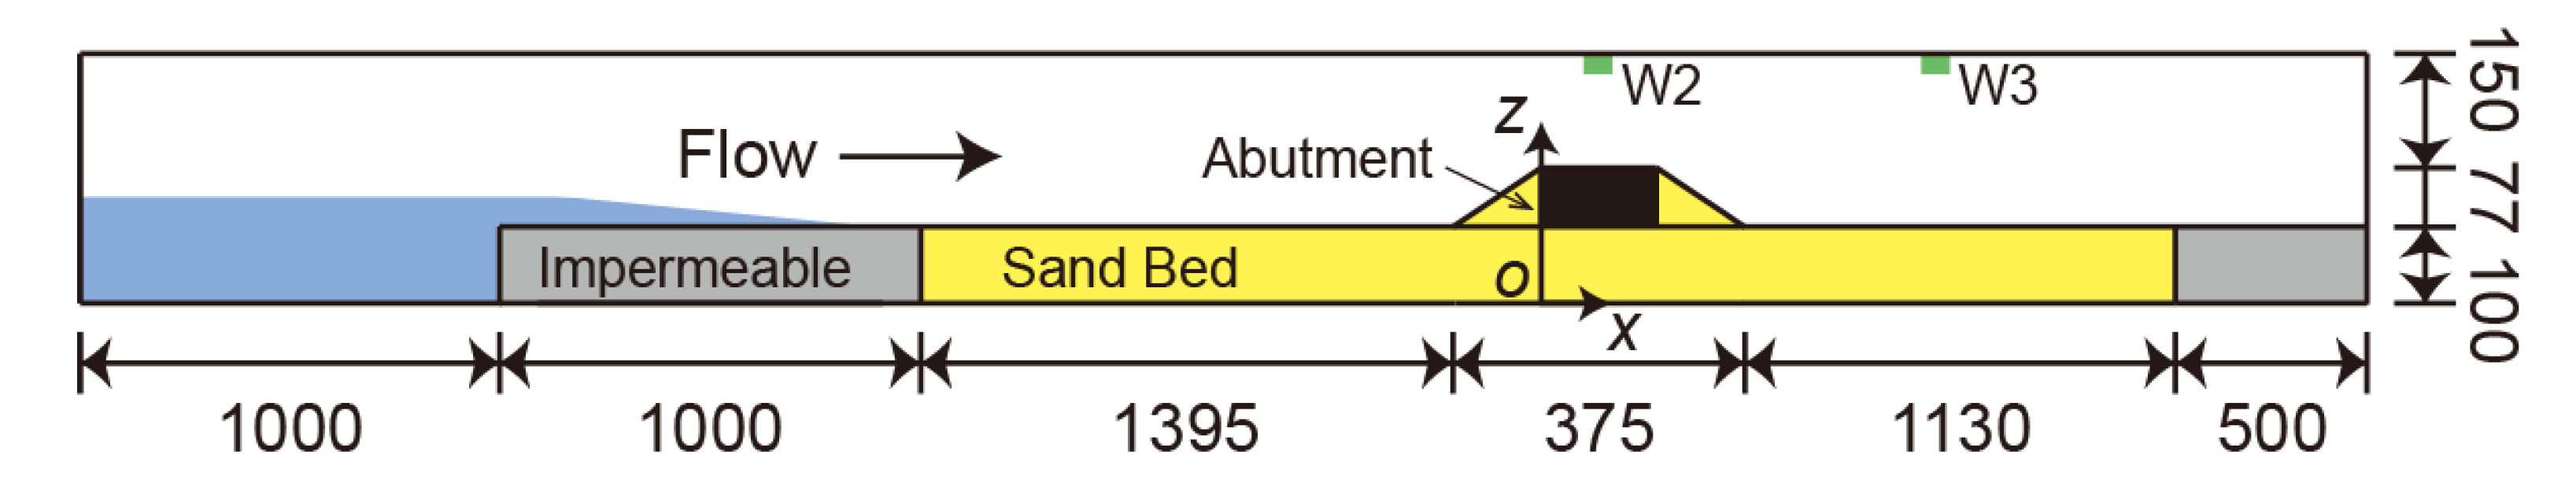
2. Experimental Setup and Conditions

A series of hydraulic model experiments were conducted at a length scale of 1/100 based on the Froude similarity law, using a 6.0 m long, 0.30 m wide, and 0.29 m high horizontal open channel.
Figure 1, Figure 2 and Figure 3 show schematically the experimental setup, with bridge abutment and backfill modeled on those of the Numata overpass. As shown in Figure 1, a 2.90 m long and 0.10 m thick sand bed was installed in the open channel; the abutment (shown in Figure 2) was fixed to the bottom of the channel using six pile models (each 10 mm in diameter and 75 mm long). The model of the abutment was designed with a 3D CAD and printed with a 3D printer. The backfill (crown width 150 mm, height 77 mm, slope 1/1.46), shown in Figure 3, was installed on the back of the abutment. The backfill on the offshore and shoreward sides of the abutment was designed to be one-quarter of an oval cone in each case. The sand bed and backfill were composed of silica sand No. 6 (Toyo Matelan Co.) with a median grain size of 0.2 mm. To keep the saturation constant between experimental runs, the sand in the sand bed was compacted approximately every 20 mm and submerged for over one hour after compacting. The sand in the backfill was adjusted to a water content of 10—13% and compacted in several layers. In Figure 1, the x axis is the horizontal along-channel direction, with its origin on the offshore surface (left surface in Figure 1) of the abutment; the y axis is the horizontal cross-channel direction, with its origin of the front surface (lower surface in Figure 1a) of the channel; and the z axis is the vertically upward direction, with its origin on the bottom of the channel. A tsunami-modeled flow was generated using two pumps (Koshin Ltd., PX-650) towards the positive x direction (left to right in Figure 1). The flow rate per unit width was 0.0260 m3/s/m. When the pumps were turned on, part of the flow initially passed through the gap between the abutment and the side wall of the channel. After that, the water level rose at the upstream side of the abutment, and the flow started to pass even over the abutment and backfill. This overflow process was observed in every cases.
During the tsunami, the water level was measured at the positions W2 and W3 along the centerline of the channel using two ultrasonic sensors (Omron Co., E4C-DS30L). A single-lens reflex camera (Panasonic Co., DMC-GH4) was used to take an interval shot of the backfill from the side of the channel opposite the abutment, and the shape of the backfill at the side of the channel was measured by image analysis. In the analysis, red lines were drawn manually at the surface of the backfill in photos and extracted automatically using an in-house Python script to convert x and z coordinate values. Before and after the tsunami, the surface profile of the embankment and sand bed was measured along five measurement lines, y = 0.05, 0.10, 0.15, 0.20, and 0.25 m, using five laser sensors (Keyence Co., LR-TB5000C).
Table 1 shows the different experimental cases. As shown in the table, the three times to run the pumps (pump-operating time) tpump were employed: tpump = 15, 30, and 50 s. For comparison with the numerical-simulation results, cases in which the backfill was installed without the abutment were also investigated. In these cases, the shape of the backfill was uniform along the channel width. To confirm reproducibility, two experimental runs were conducted in each experimental case. The first experimental run in each case is called “run 1”; the second is called “run 2”.

3. Experimental Results and Discussion

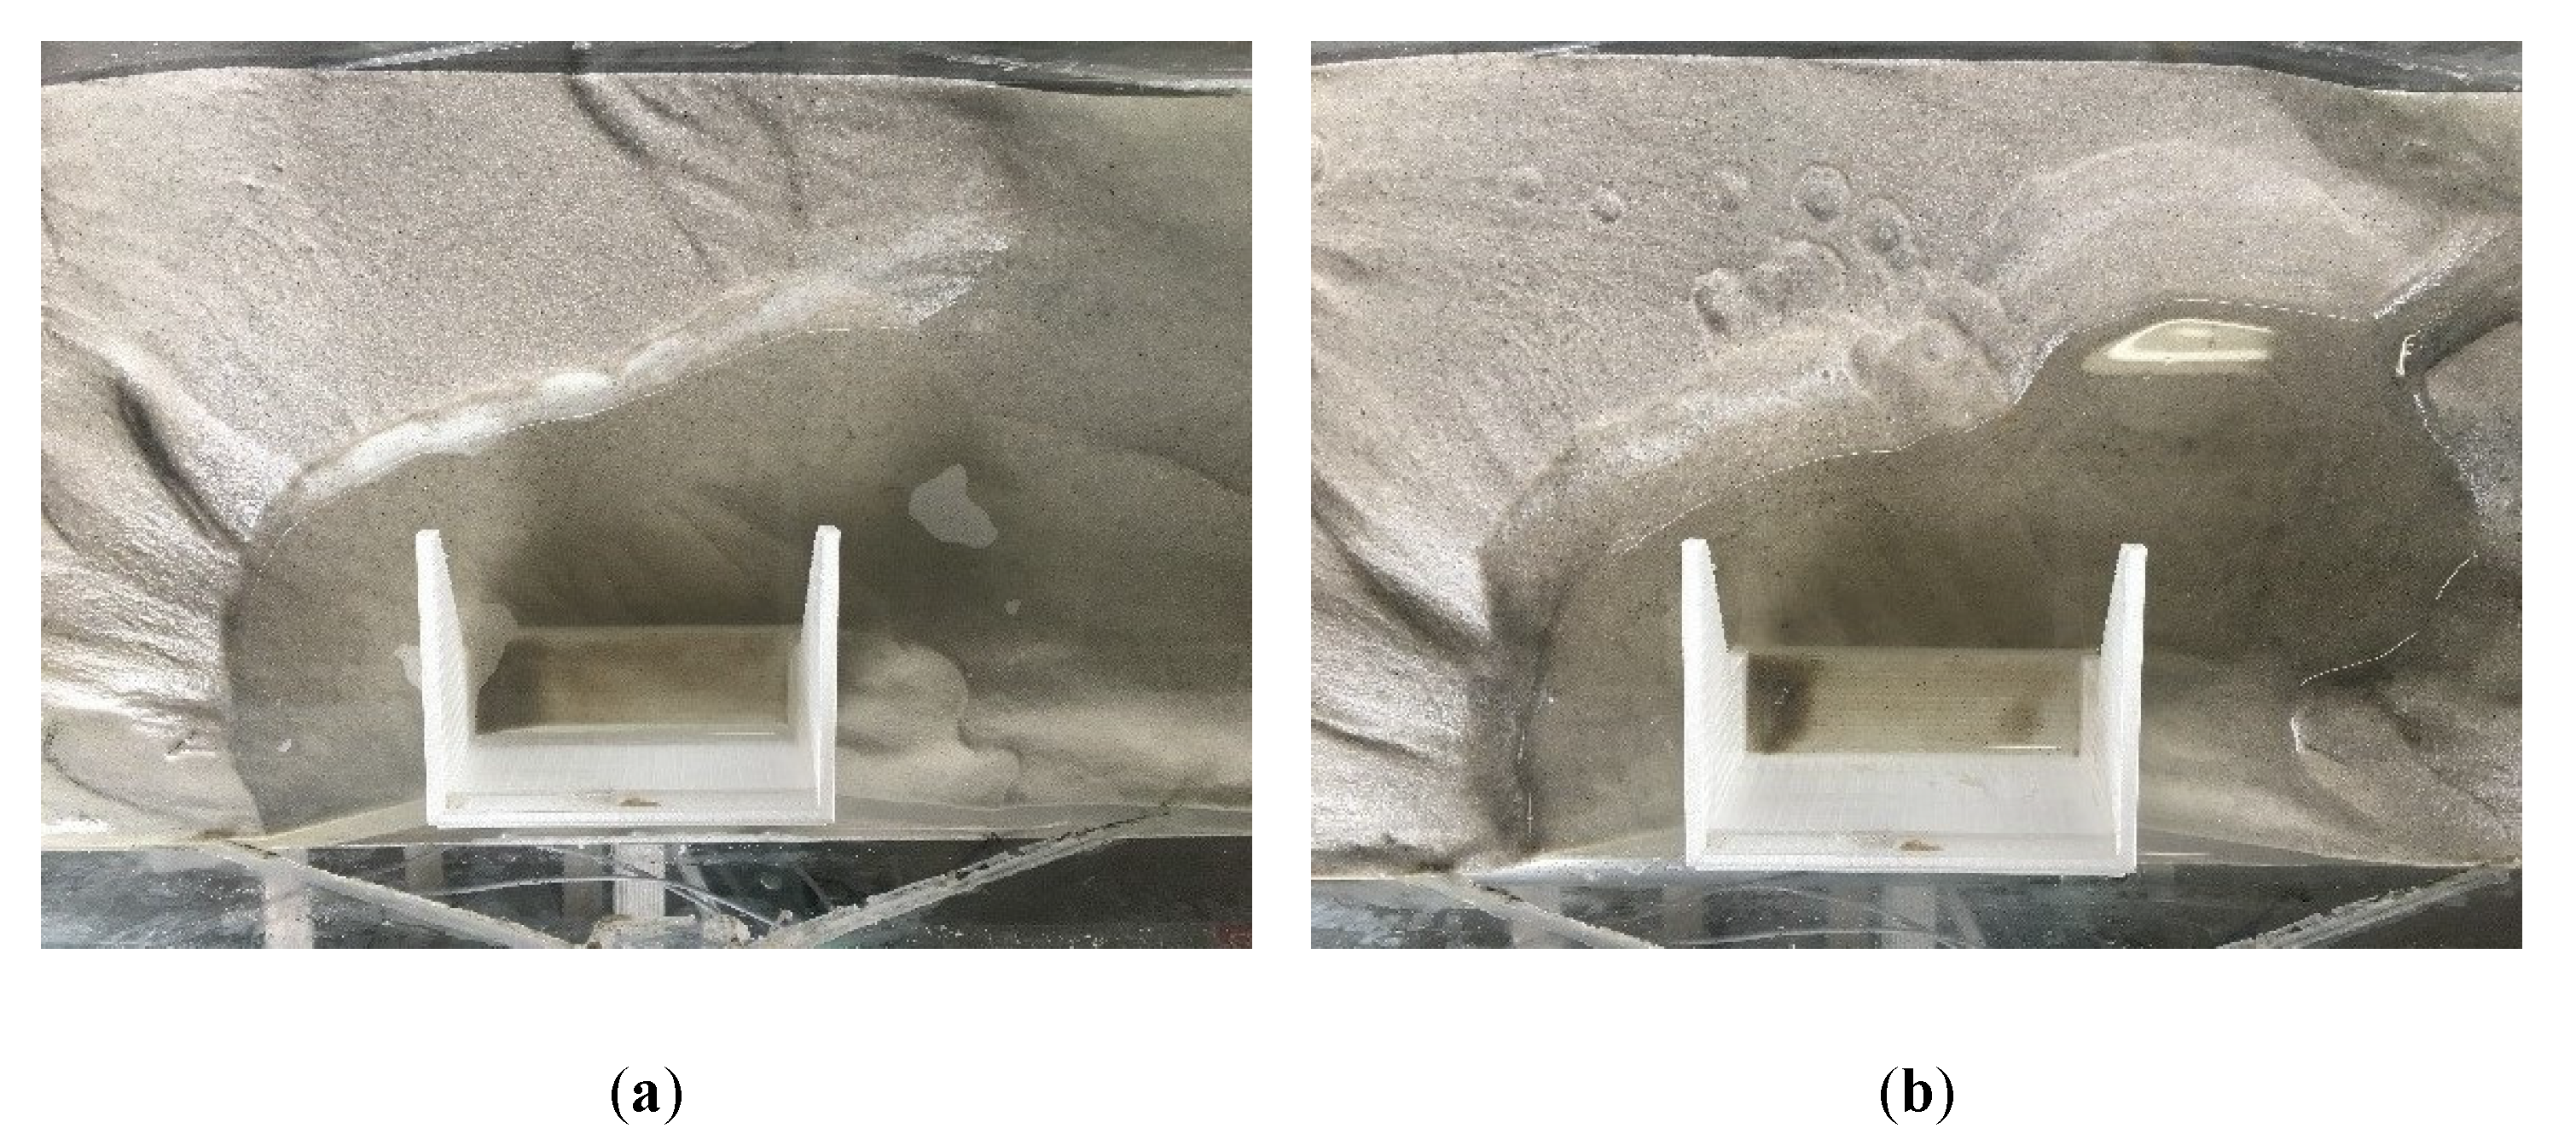
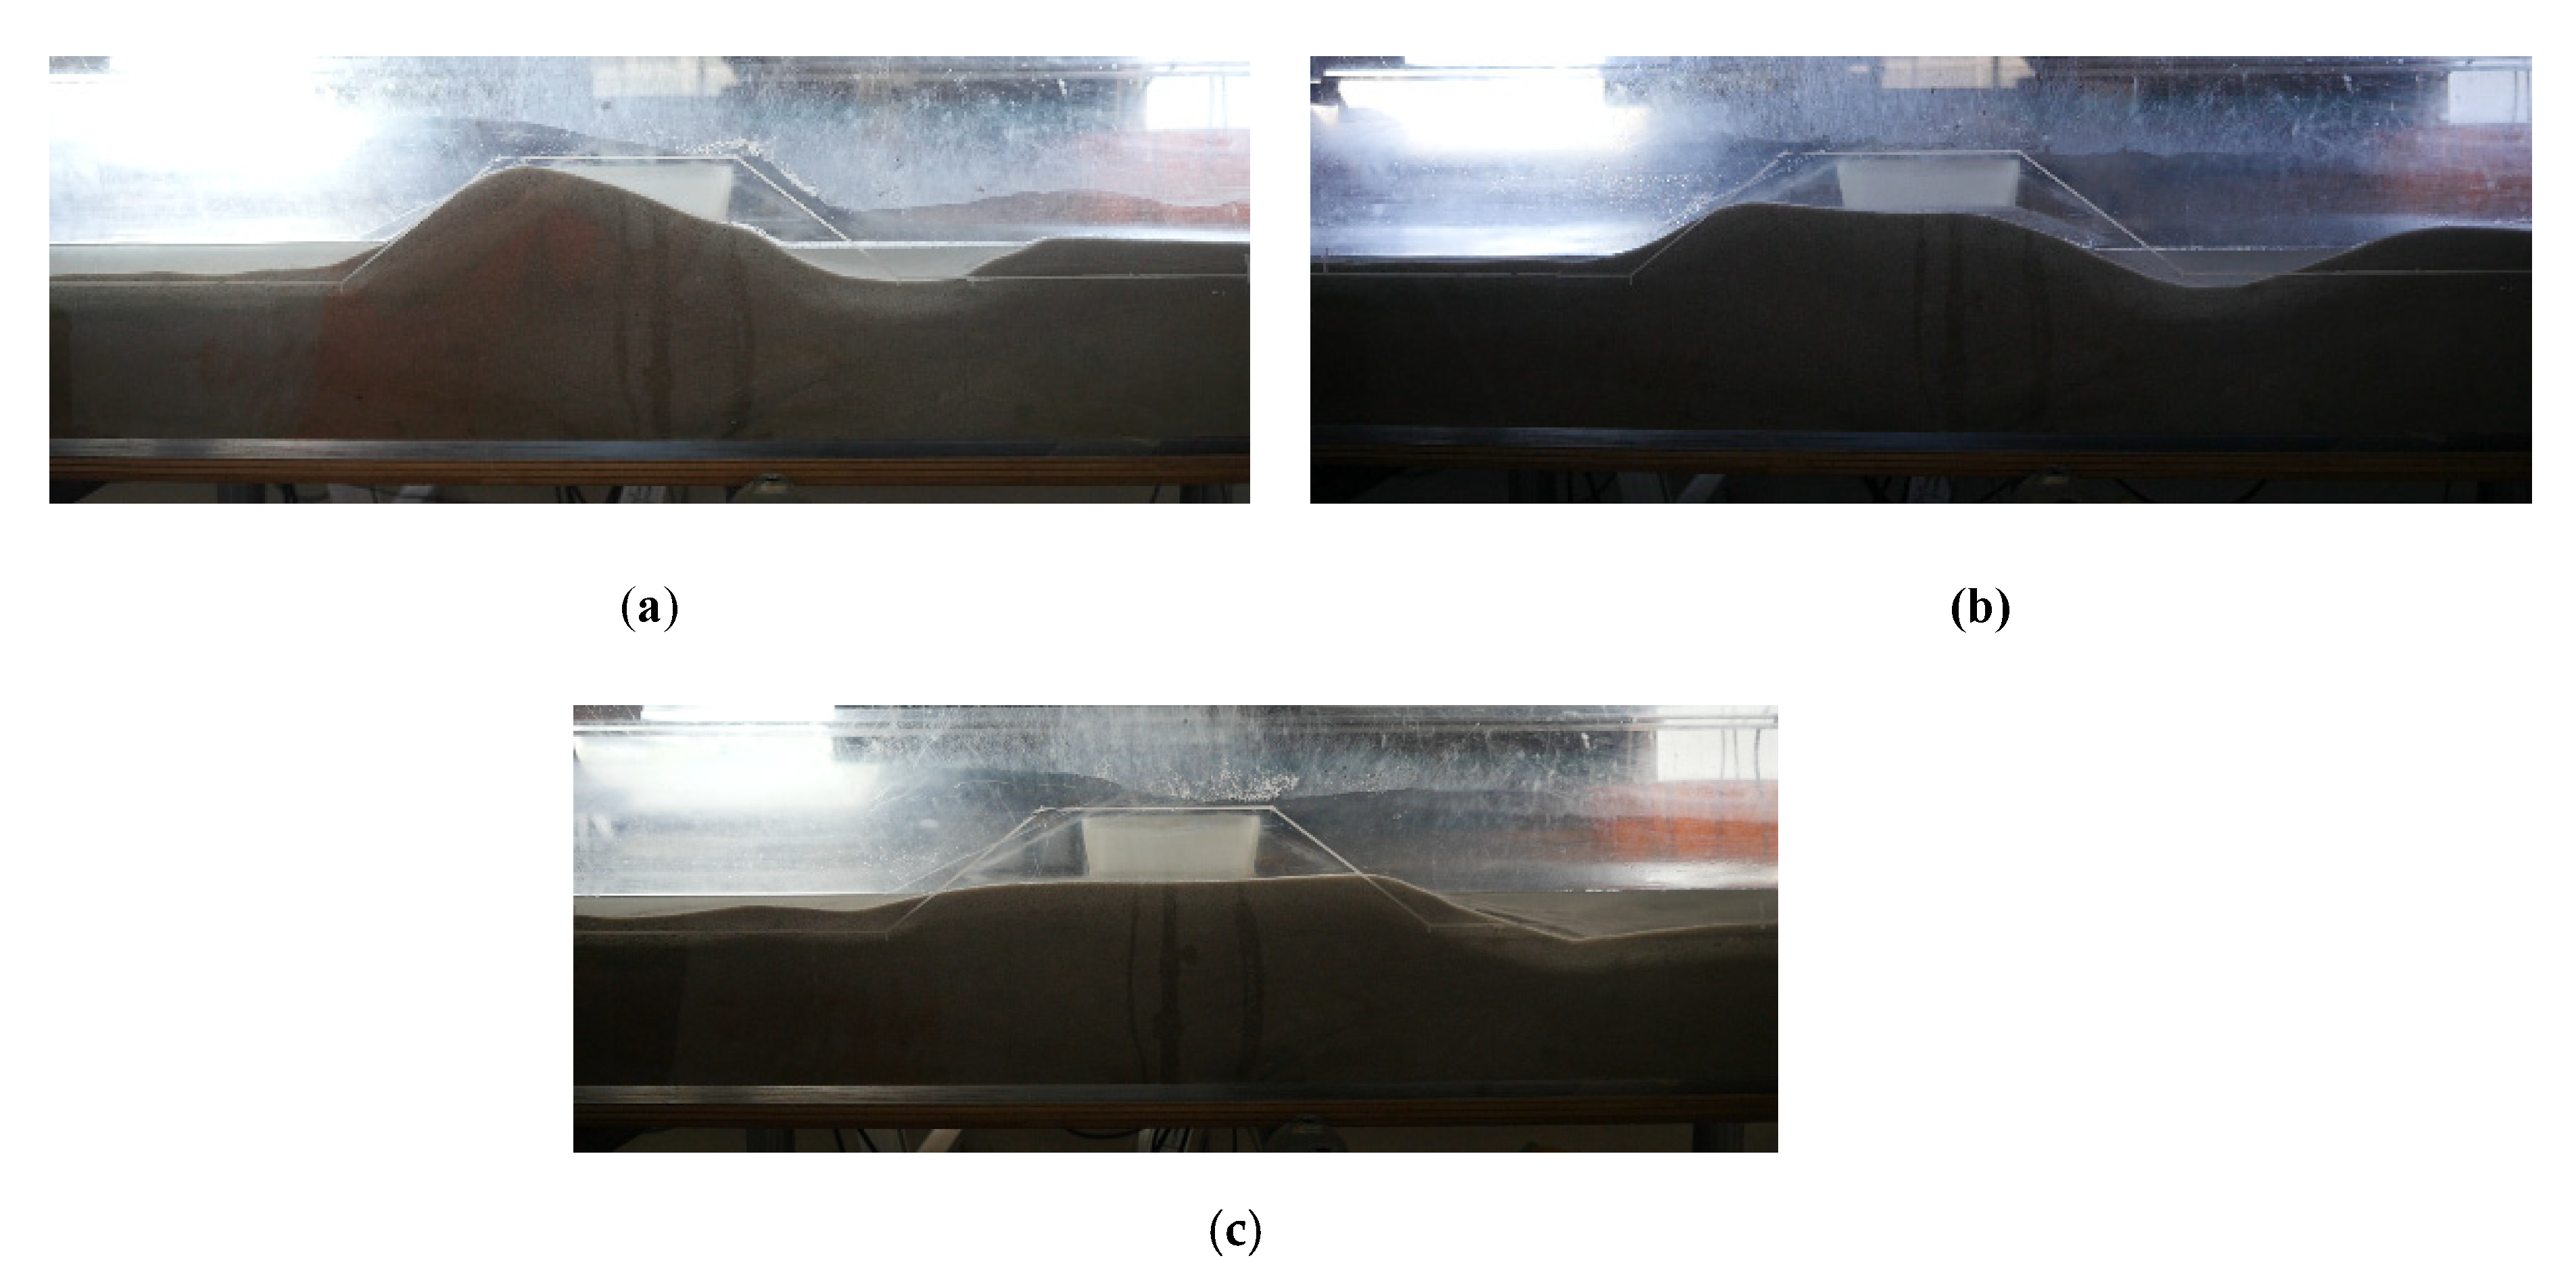
3.1. Surface Profile of Backfill after the Tsunami

Figure 4 shows photos of the abutment and vicinity taken after the tsunami. In the figure, the tsunami passes from left to right, and the white object at the near side is the abutment. Compared with the initial condition, shown in the lower panel of Figure 3a, the backfill of the abutment has eroded and almost completely disappeared. In addition, the local scouring has occurred around the abutment, and water remains in the hole created by the local scouring.
Figure 5 shows photos taken from the backfill side after the tsunami. In the figure, the tsunami passed from left to right. The white line written on the channel is the initial shape of the backfill, and the white object behind the backfill is the abutment. Figure 5b corresponds to the case in Figure 4a, and Figure 5c corresponds to the case in Figure 4b.
For tpump = 15 s, as shown in Figure 5a, the onshore (right) side of the backfill has been eroded, and the upper part of the onshore side of the abutment is visible. However, the offshore portion of the backfill remains, and the crown height of the backfill has not fallen significantly. Eroded sediment has been deposited on the onshore side at some distance from the backfill.
For tpump = 30 and 50 s, as shown in Figure 5b,c, the top portion of the backfill has been eroded, and the entire upper part of the abutment is visible. Furthermore, the crown height of the backfill has been significantly lowered. The decrease in crown height for tpump = 50 s is slightly larger than that for tpump = 30 s.

3.2. Surface Profile Change in Backfill Due to a Tsunami

Figure 6 shows the surface profile of the backfill around the abutment before and after the tsunami. In the figure, the crown of the abutment is shown in brown. The data between the measurement points were linearly interpolated using OriginPro (OriginLab Co.). The areas outside of y = 0.05 and 0.25 m are left blank: Measurements could not be performed in these regions, due to the limitations of the measuring equipment. In preliminary experiments, the surface profile at z ≤ 83 mm was also found to be unmeasurable, due to the influence of remaining water; thus, areas with z ≤ 83 mm are also shown as blank.
For tpump = 15 s, as shown in Figure 6a,b, the offshore (left) portion of the backfill away from the abutment has not been eroded because the crown height has not been lowered from the initial value z = 177 mm. The offshore side of the backfill inside the abutment also remains. However, the rest of the backfill has been eroded. In particular, the areas on the offshore and onshore sides of the abutment that are blank because z ≤ 83 mm are lowered below the initial surface level, due to local scouring.
For tpump = 30 s, as shown in Figure 6c,d, although the offshore portion of the backfill away from the abutment remains, the crown height is reduced from the initial value z = 177 mm to 142 mm. The rest of the backfill has been heavily eroded compared with tpump = 15 s. The scale of local scouring around the abutment has also increased. Specifically, the blank areas where z ≤ 83 mm on the offshore and onshore sides of the abutment are wider than those for tpump = 15 s. A blank area can be observed inside the abutment as well.
For tpump = 50 s, as shown in Figure 6e,f, a small amount of the backfill remains at a distance from the abutment. However, the scale of the erosion of the backfill and local scouring around the abutment is even larger than that for tpump = 30 s.
Figure 7 shows the changes in the surface profile of the backfill before and after the tsunami. In the figure, the areas where z ≤ 83 mm, shown as blank in Figure 6, are again shown as blank. The erosion of the embankment clearly increases with the increase in the duration of the tsunami, i.e., with tpump. The extent of the blank area around the abutment also increases, as does the scale of local scouring around the abutment. On the other hand, the level of the sand bed rises slightly on the onshore side of the backfill, suggesting that eroded sediment is deposited there. These phenomena occur in both runs.
It can be seen that the erosion of the backfill around the abutment is larger than that of the backfill away from the abutment. This suggests that the presence of the abutment increases the scale of the erosion of the backfill.

4. Numerical Conditions

The three-dimensional coupled fluid-structure-sediment-seabed interaction model (FS3M), which can simulate dynamic interaction between tsunami flow and backfill erosion, was applied to the hydraulic model experiments.
For completeness, a brief description of the FS3M is presented here. The FS3M consists of the main solver and four modules. The main solver is a large-eddy simulation (LES) model for incompressible viscous air, water, pore-air, and pore-water multi-phase flow that considers the motion of movable objects and the surface profile evolution of a sediment bed. The first module is a volume-of-fluid (VOF) module to track the air-water interface motion. The second module is an immersed-solid (IS) module for fluid-structure interaction (FSI) analysis of the movable objects. The third module is a sediment-transport (ST) module to compute the profile evolution of the sediment bed induced by bed-load and suspended sediment transport, and suspended sediment concentration that considers all transport processes (i.e., pickup, advection, diffusion, and settling). The fourth module is a finite-element-model (FEM) module for coupled soil-water analysis of the sediment bed. The VOF, IS, and ST modules are connected to the main solver using a two-way coupling procedure implemented at every time step to ensure fluid–structure–sediment interaction. Note that the main solver and the VOF and ST modules were employed here to compute tsunami-backfill interaction. The details of the FS3M can be found in References [10,11].
Figure 8 shows a computational domain schematically. The sand bed, abutment, and backfill are all set inside a 5.5 m long, 0.30 m wide, and 0.327 m high computational domain. To reduce the computational cost, the length of the computational domain was shortened by 0.5 m compared with the open channel used in the hydraulic model experiments. The height of the computational domain on the crown of the backfill was also raised from 0.133 m to 0.150 m, which is slightly higher than the channel in the hydraulic model experiments, to minimize the effect of boundary conditions on the top of the computational domain. The other sizes were set to be the same as in the hydraulic model experiments.
The median grain size for the sand bed and backfill was set to be 0.2 mm, as in the hydraulic model experiments. In the absence of experimental data, the density and porosity of the sand particles were assumed to be 2.65 × 10³ kg/m3 and 0.4, respectively. The static friction angle θs, the kinematic friction angle θd, the angle of repose θr, the criterion for starting a sand slide θr+, and the criterion for ending a sand slide θr were also unavailable. The value of θr was assumed to be 45.00° according to the maximum angle of the final surface profile of the sand bed in the hydraulic model experiments. For simplicity, the value of θr + θr+ was assumed to be equal to that of θr, i.e., θr+ = 0.00°, and the value of θrθr was assumed to be slightly smaller than that of θr, i.e., θr = 0.01°. From preliminary simulations changing these parameters under the condition θdθrθrθrθr + θr+θs, we determined θd = 27.00° and θs = 45.01°. The shape parameters α and n in the van Genuchten equation and the residual saturation were set to be α = 0.28 kPa-1, n = 12.898, and 13.5%; these values were given for Mikawa silica sand No. 6 in Sugii et al. [12]. The groundwater level was set to be z = 0.10 m, as in the hydraulic model experiments. The saturation below the groundwater level was assumed to be 100%, and the saturation above was assumed to be 28.8%, based on the water content of 10 to 13% in the hydraulic model experiments.
The region of the domain –0.15 ≤ x ≤ 0.60 m around the embankment, 0.039 ≤ y ≤ 0.049 m around the abutment wall, and 0.051 ≤ z ≤ 0.198 m around the embankment was divided into 7.5 × 5.0 × 1.75 mm uniform cells. The remainder of the domain was divided into nonuniform cells with increasing length in all directions to further reduce the computational cost. The offshore boundary was set to be the inflow boundary that provided a flow rate of 0.0260 m3/s/m per unit width, as in the hydraulic model experiments. The slip condition was applied to the surfaces of the abutment and the bottom boundary, the gradient-free condition to the onshore boundary, and the constant-pressure condition to the top boundary.
The same six cases treated in the hydraulic model experiments were used in the numerical simulation. From preliminary calculations, it was found that surface-profile change after 100 s was extremely small in the cases where the abutment was present, so the calculation in these cases was terminated after 100 s. On the other hand, surface profile change would continue for a very long time in the cases in which only the backfill was installed without the abutment (as will be explained in Section 5.1.1), so the calculation was carried out up to 1000 s in these cases.

5. Numerical Results and Discussion

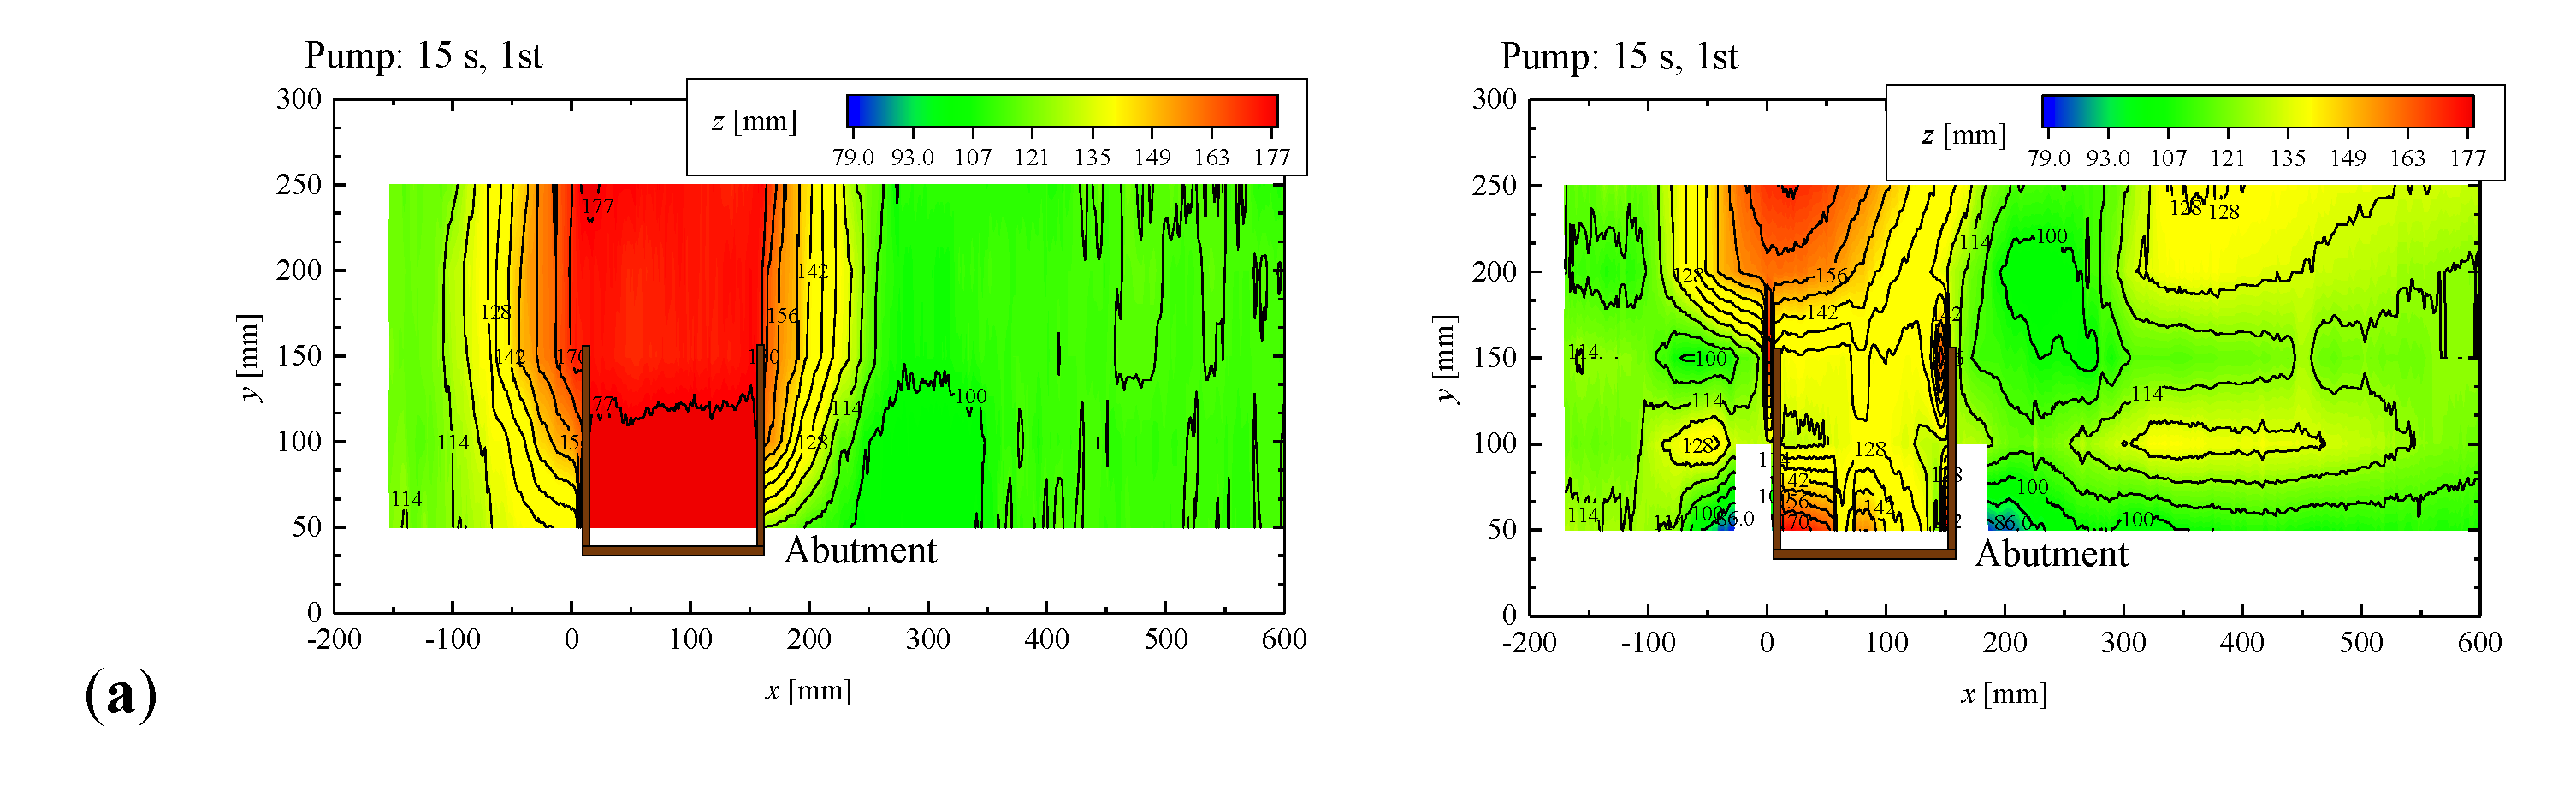
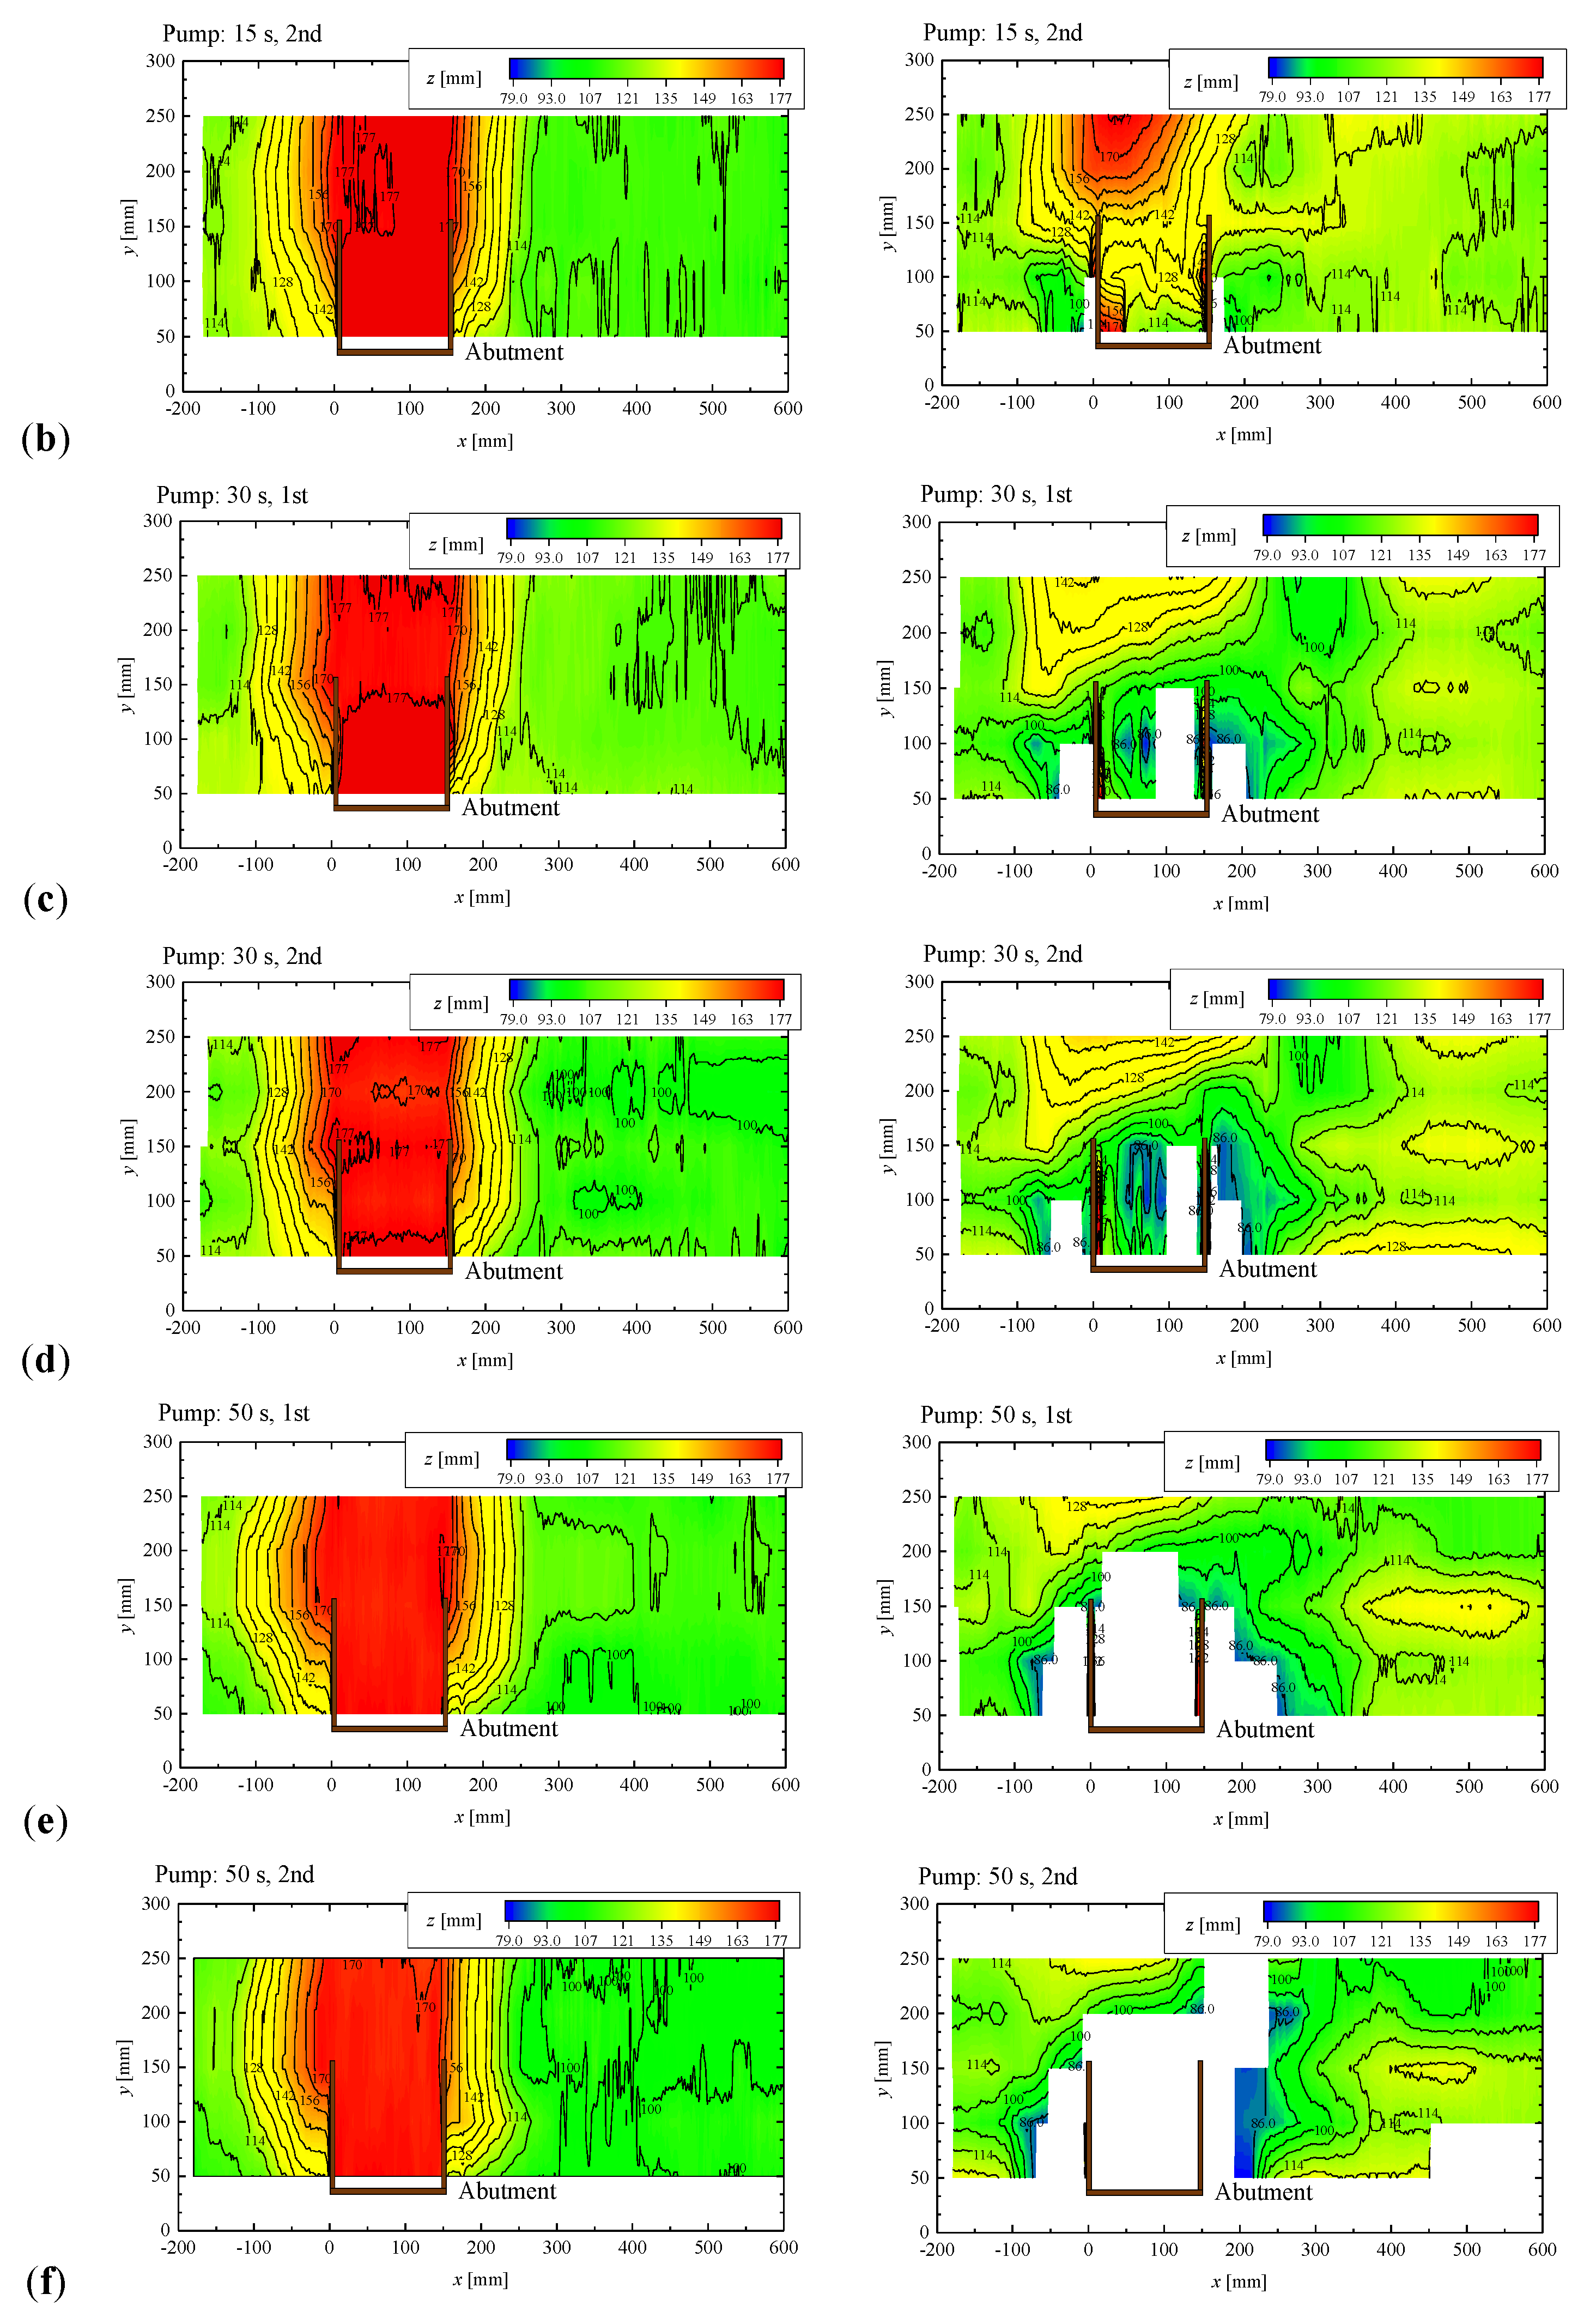
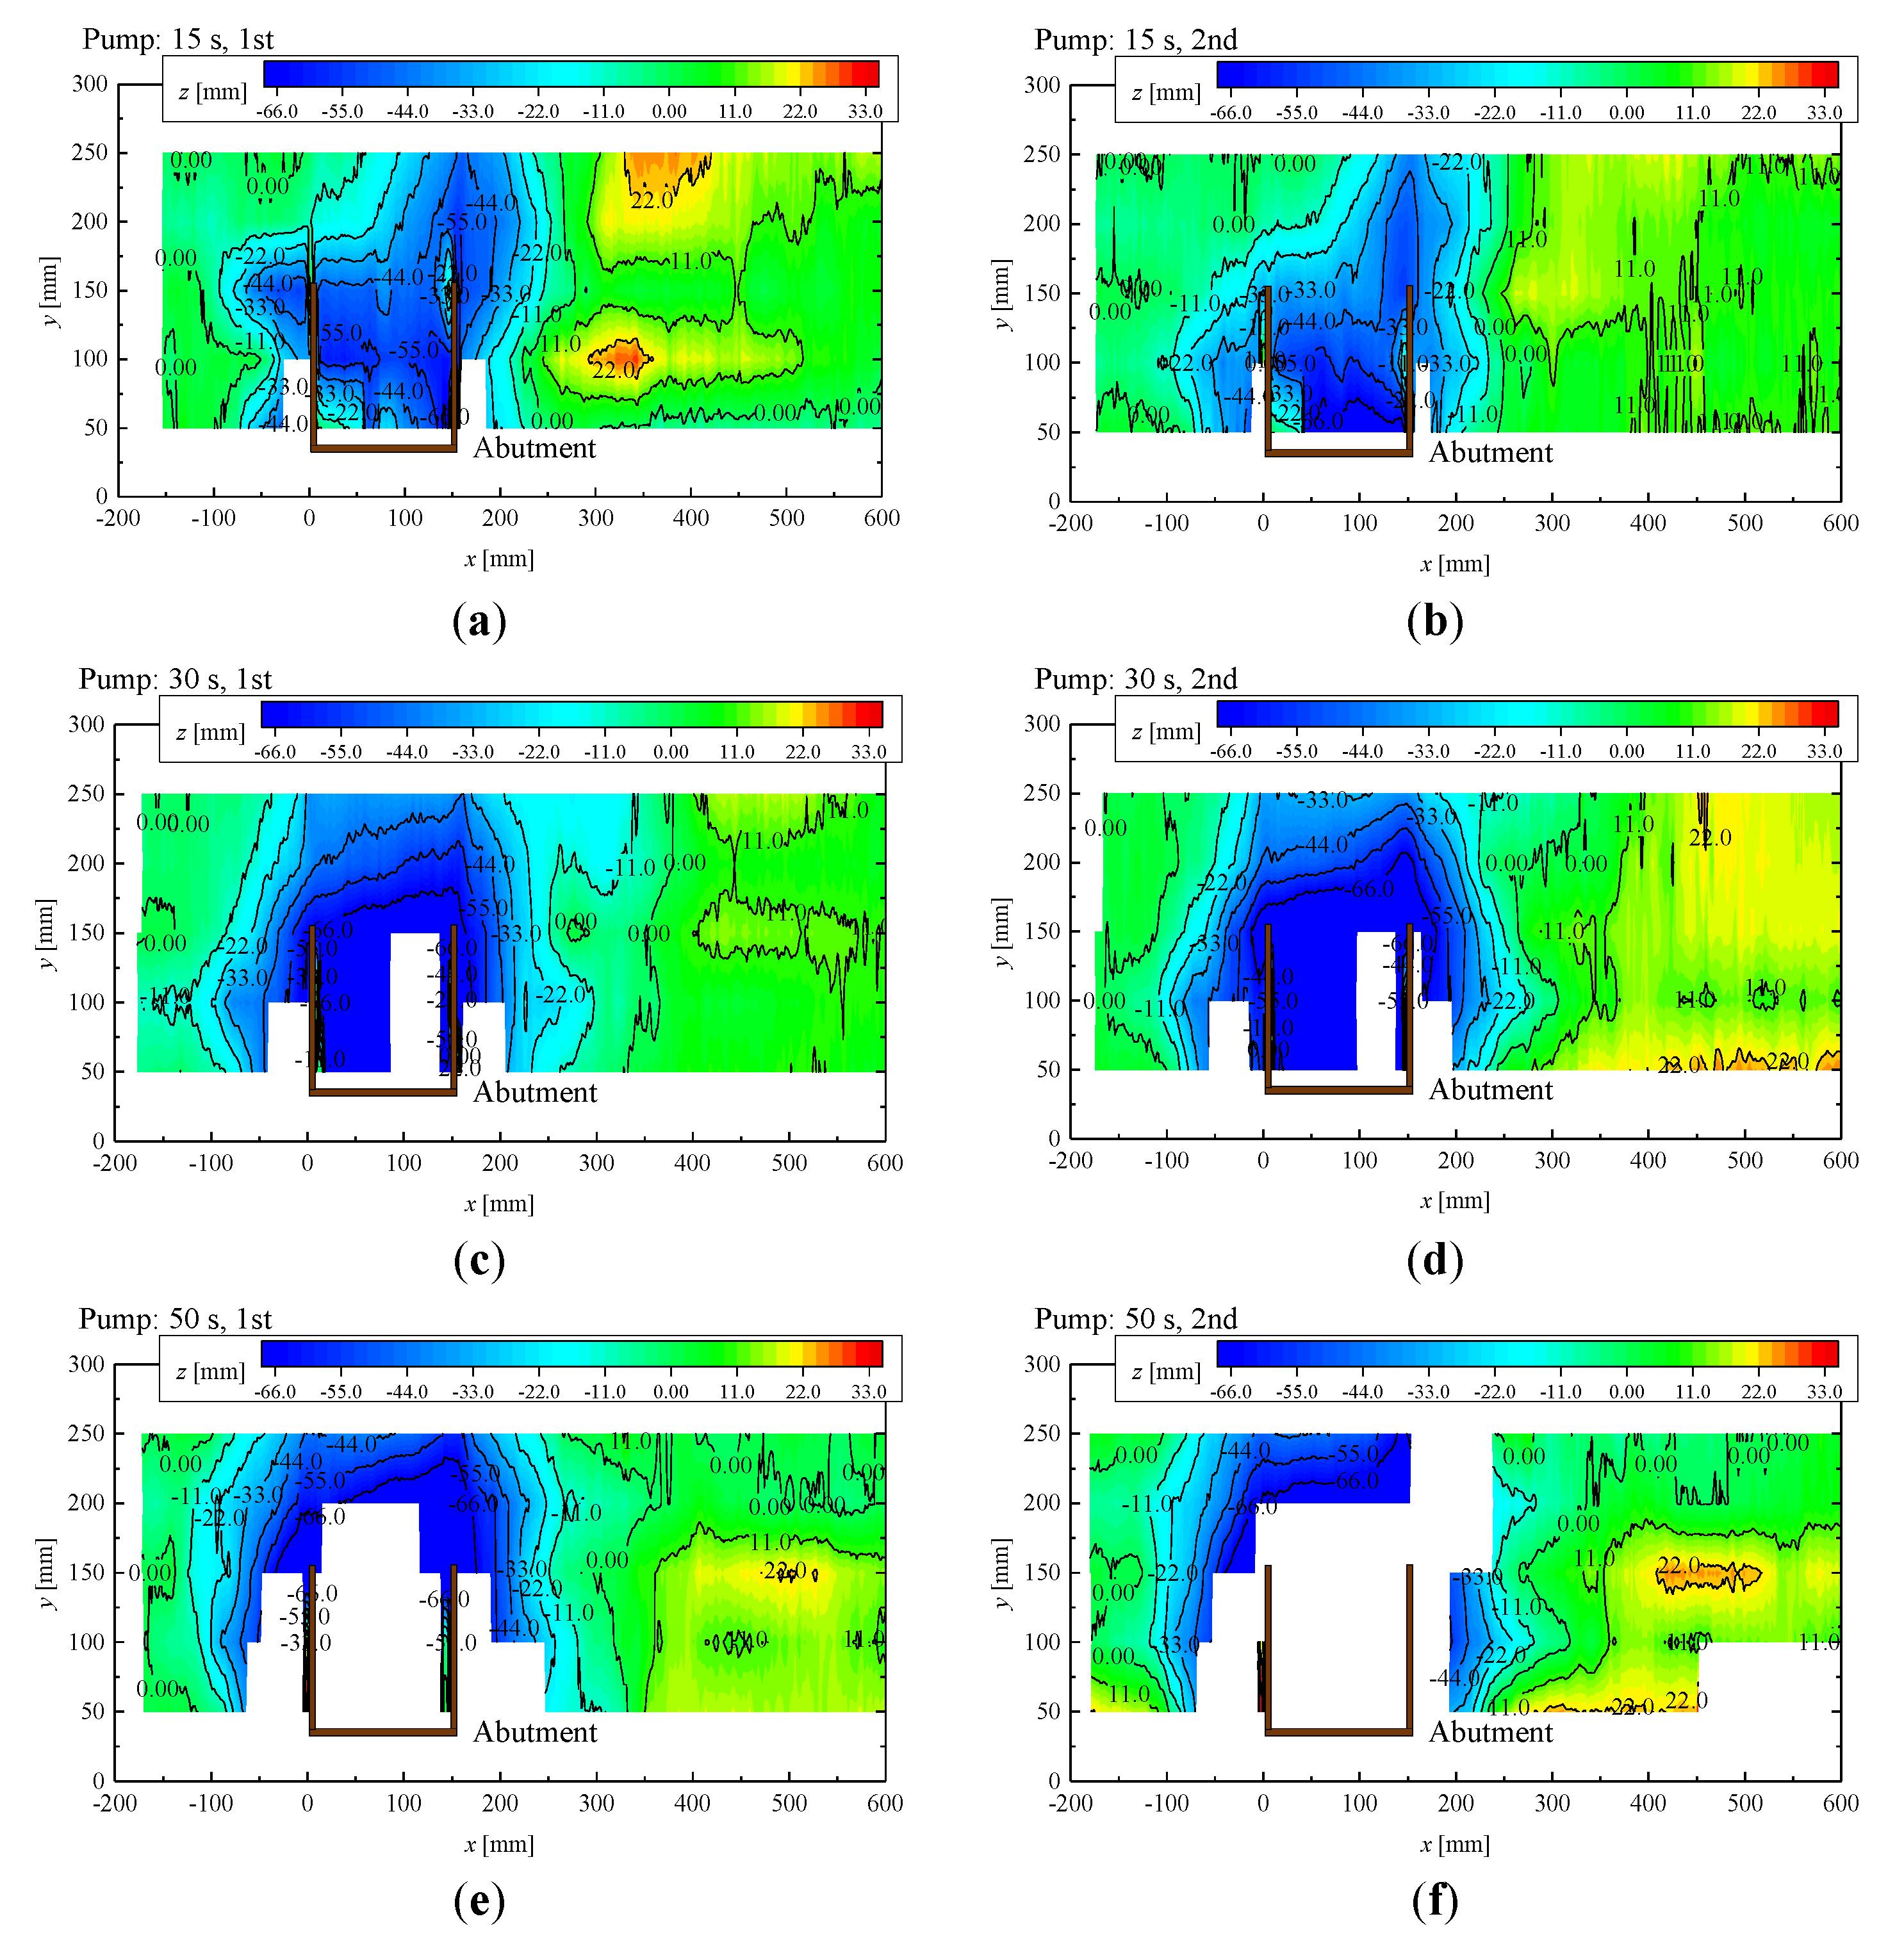
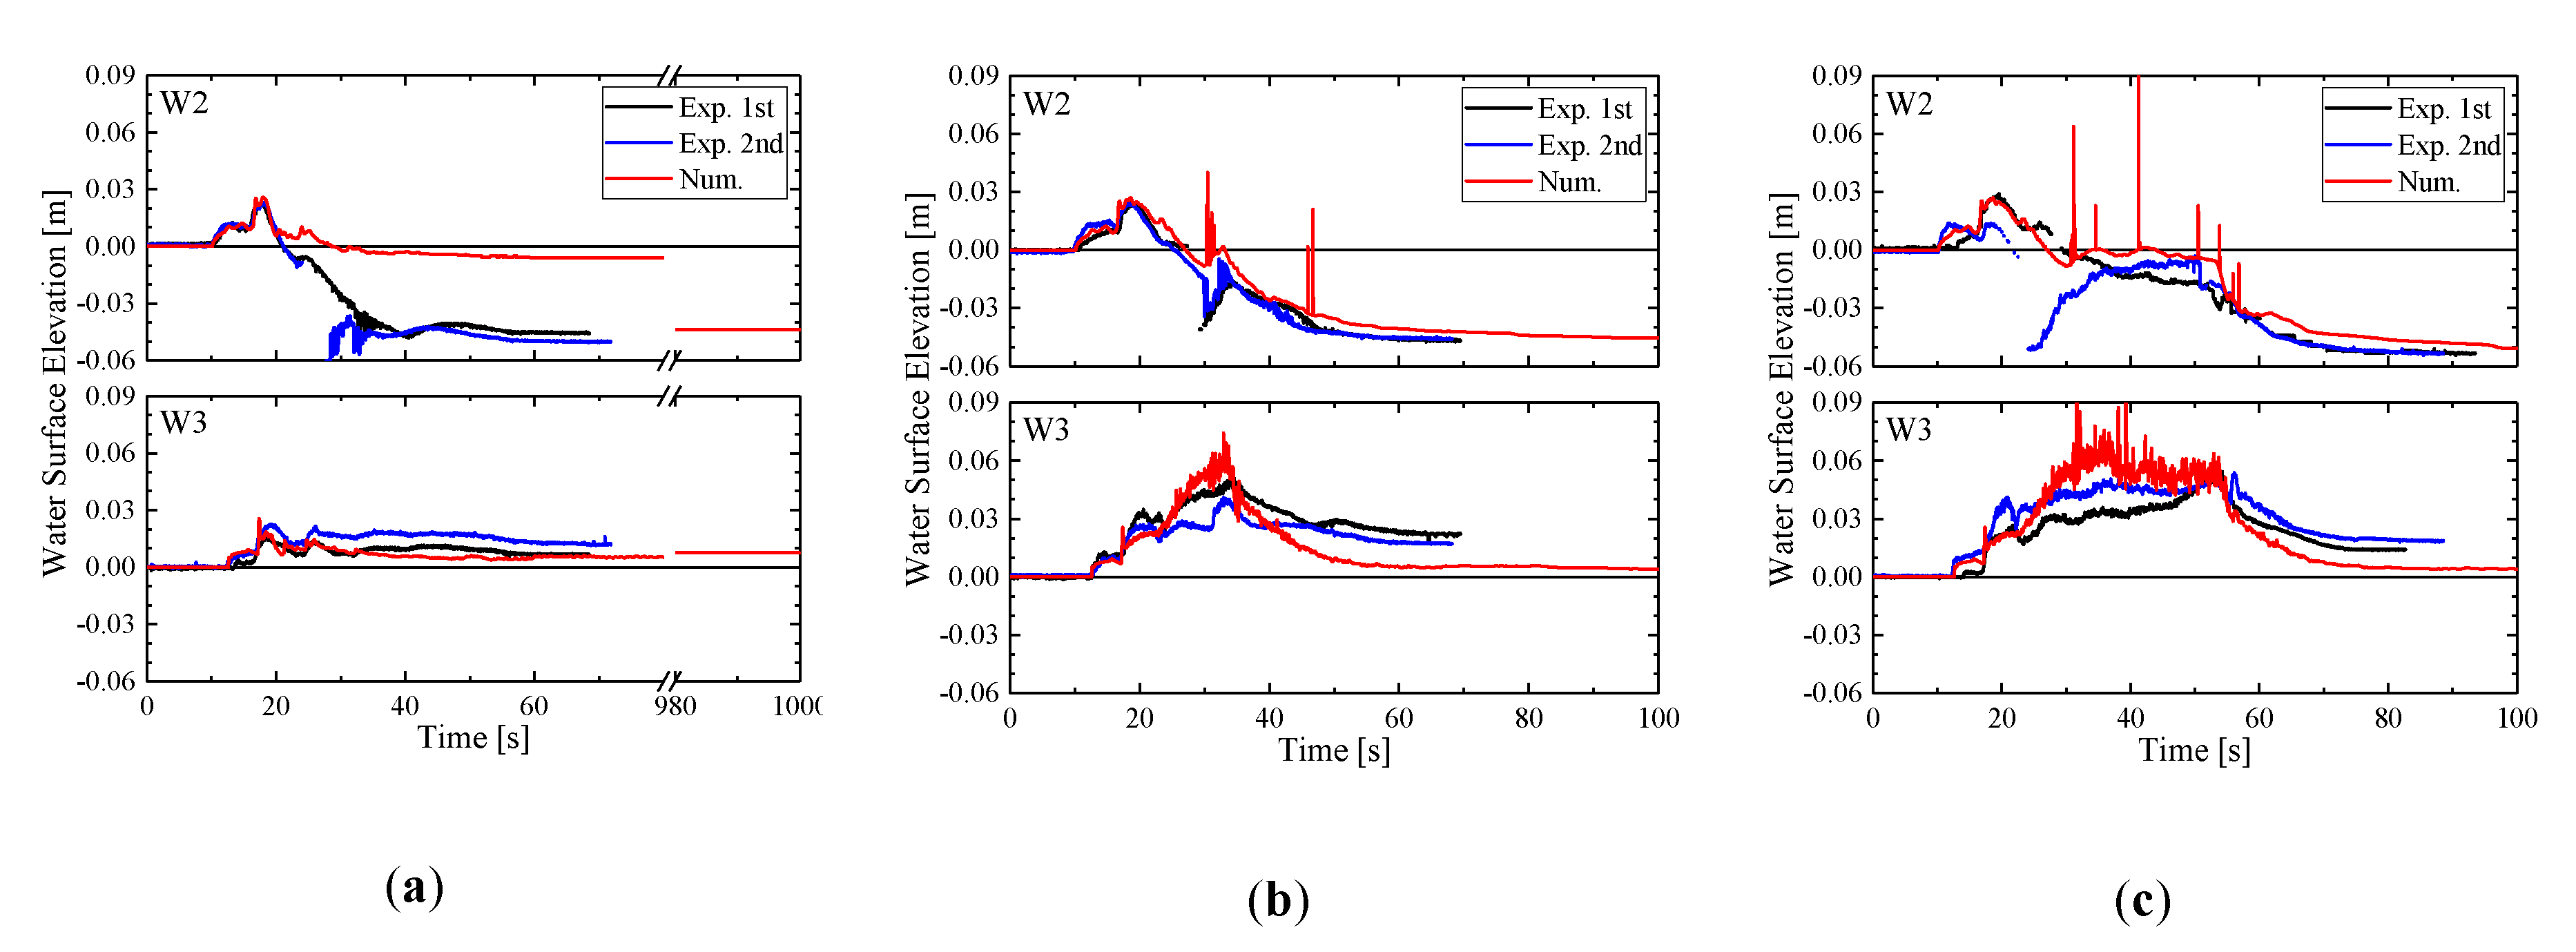
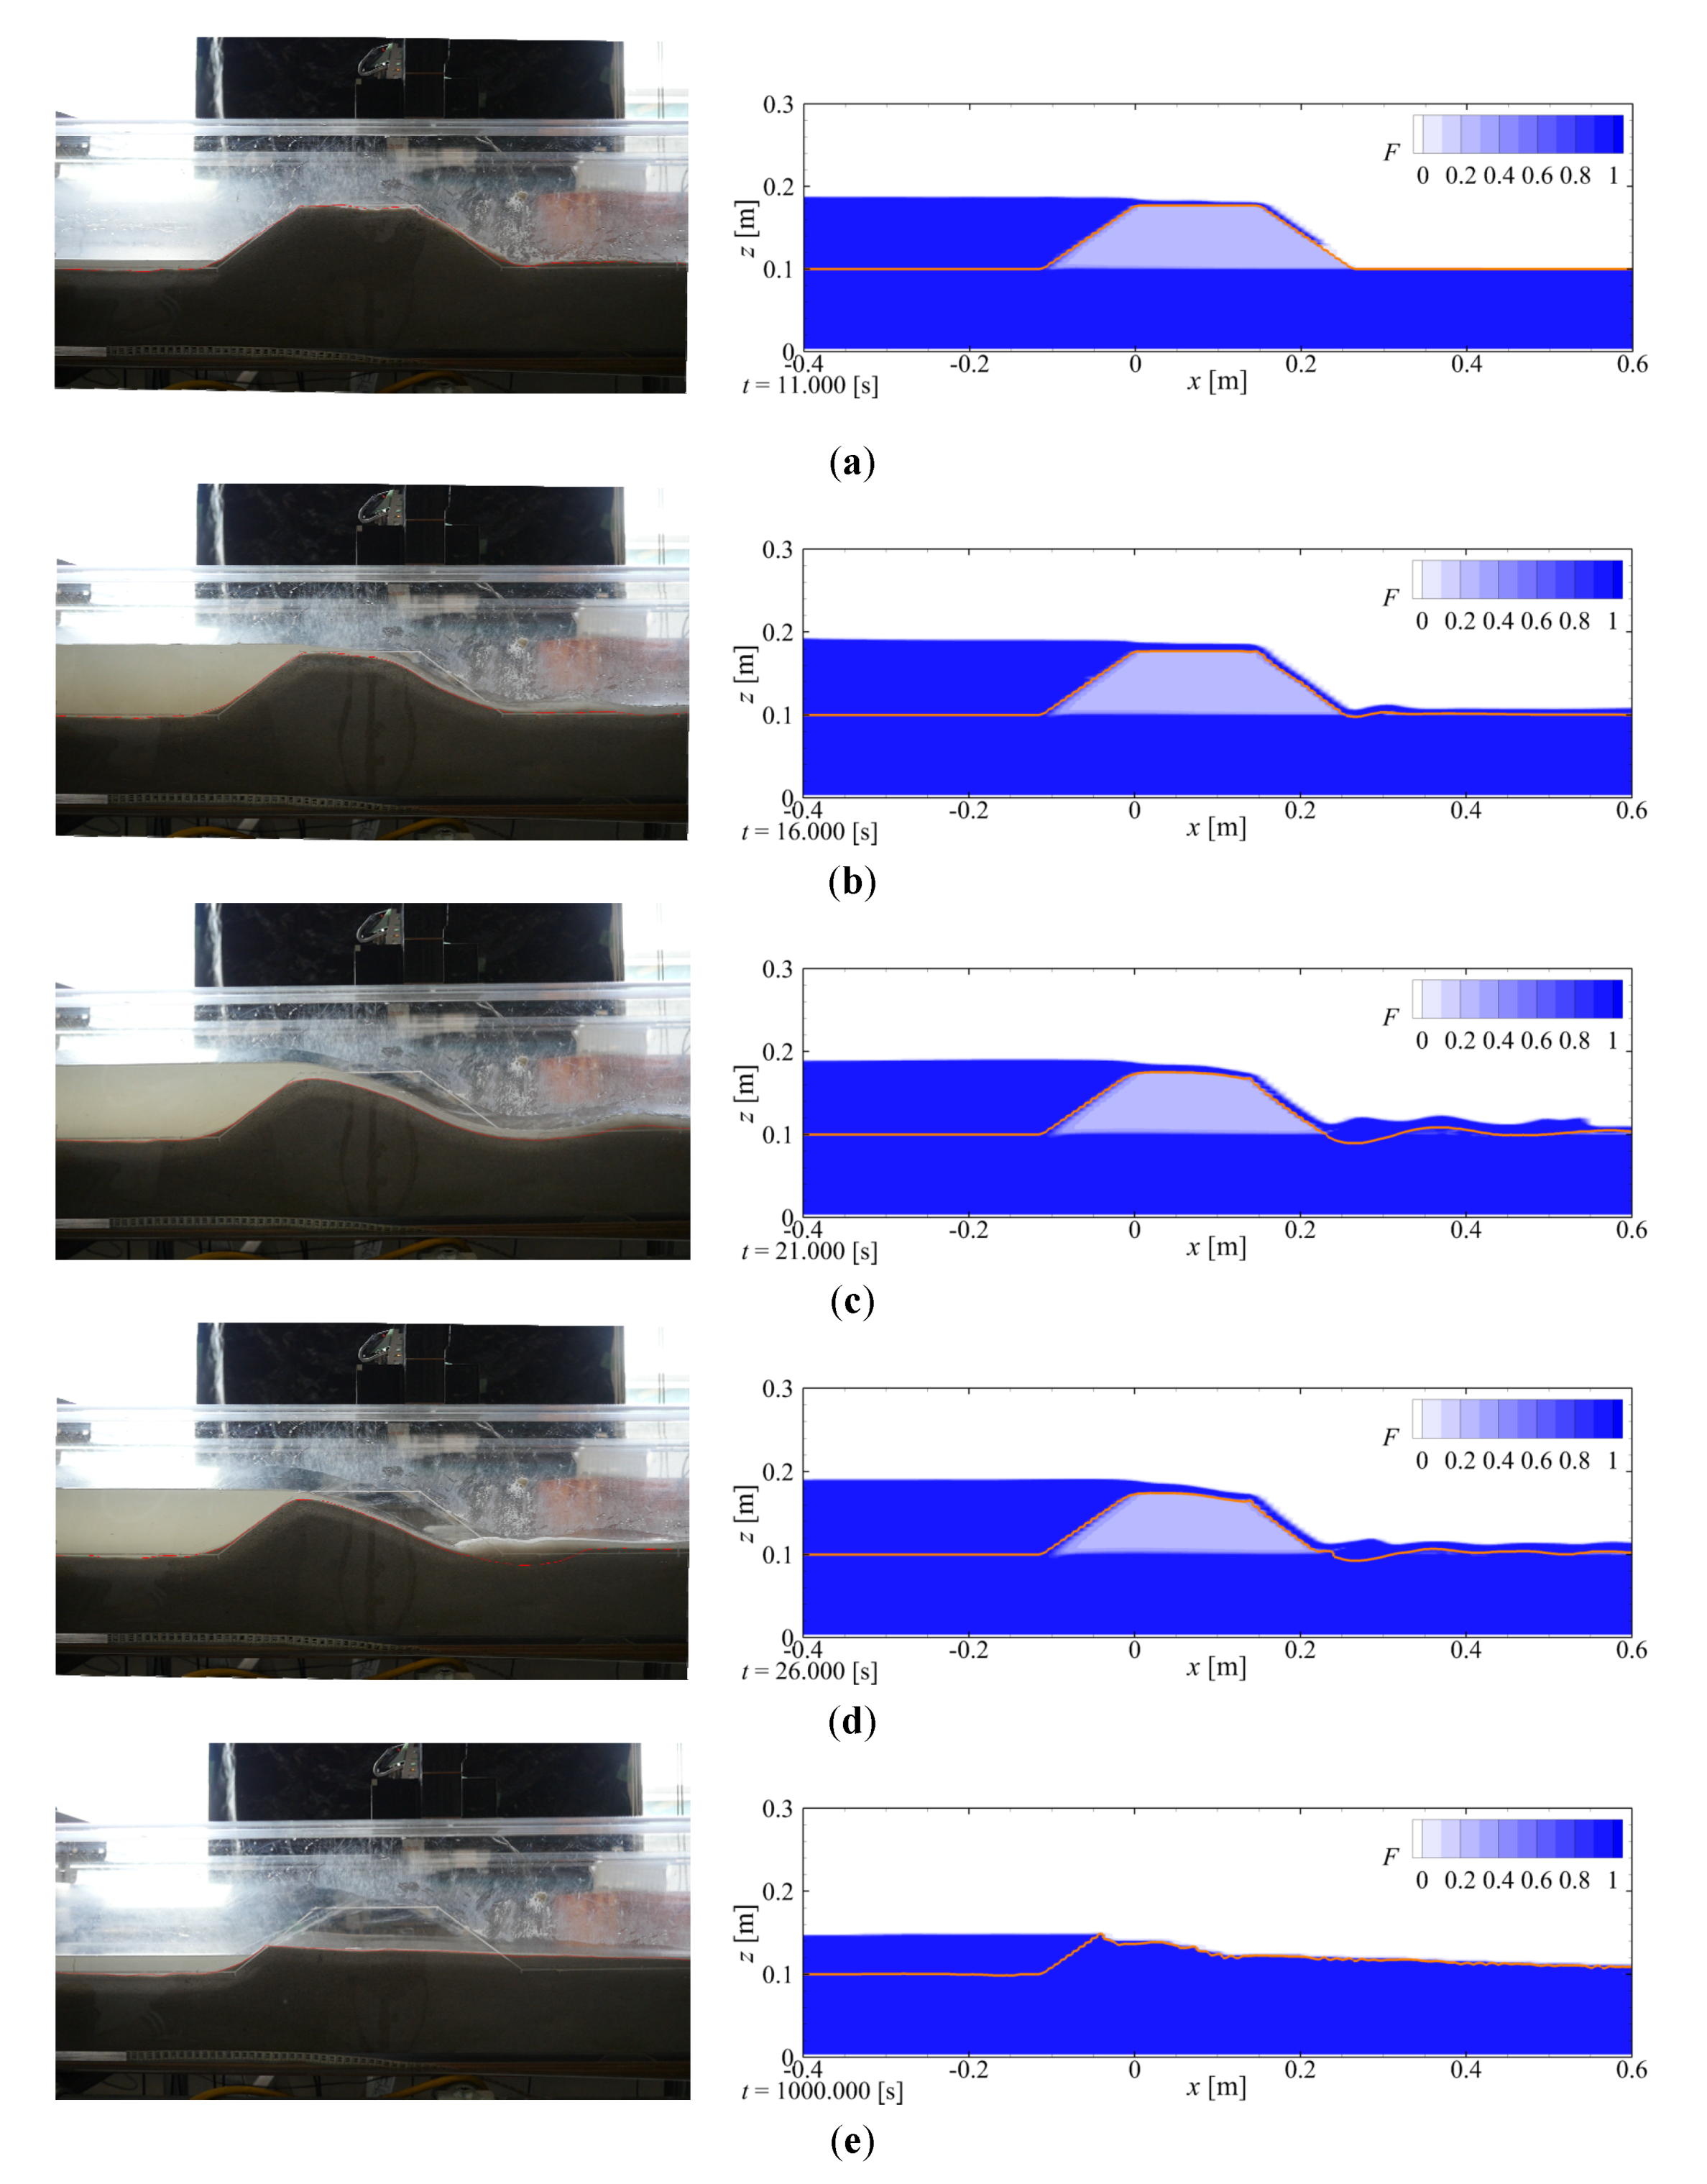
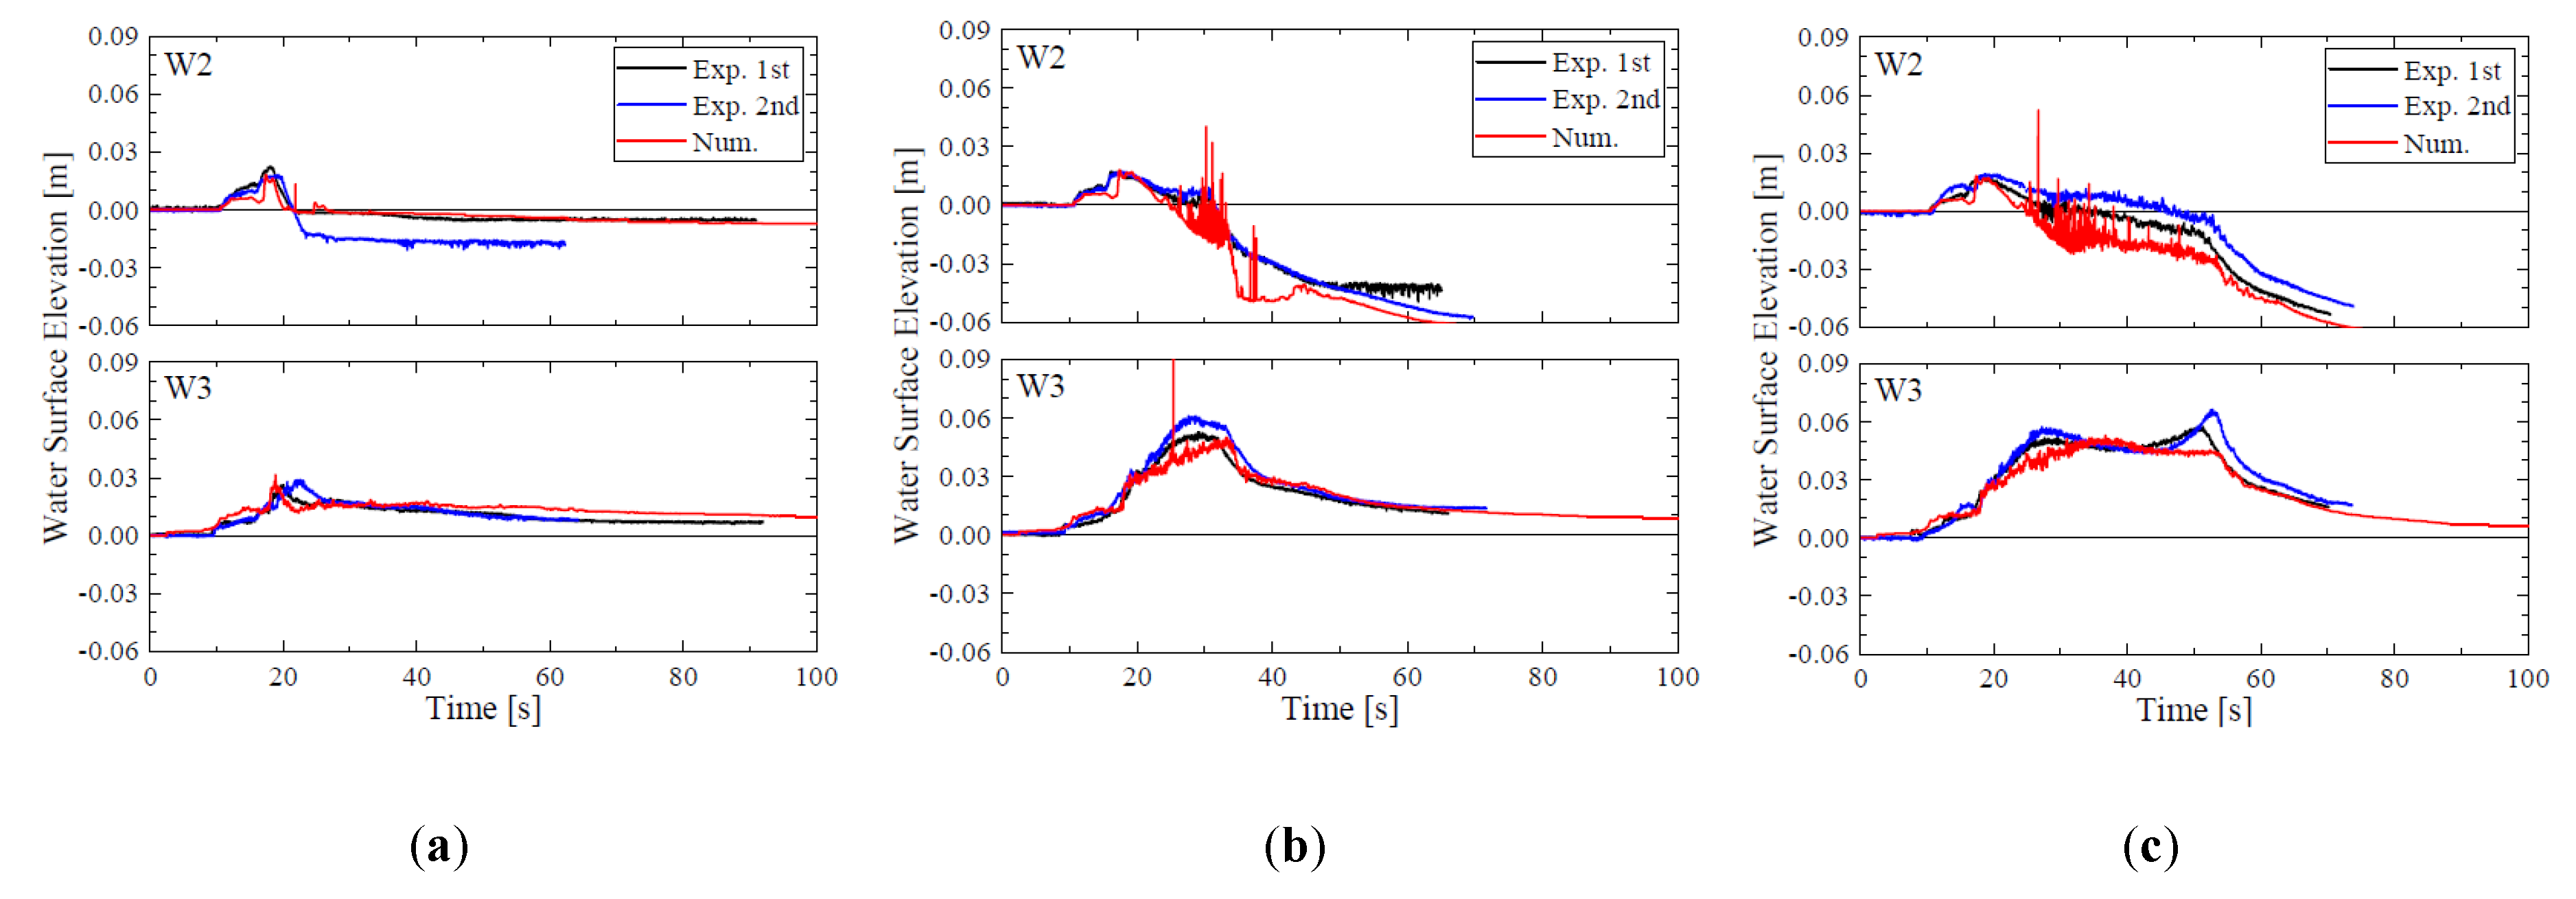
5.1. Predictive Capability of FS3M

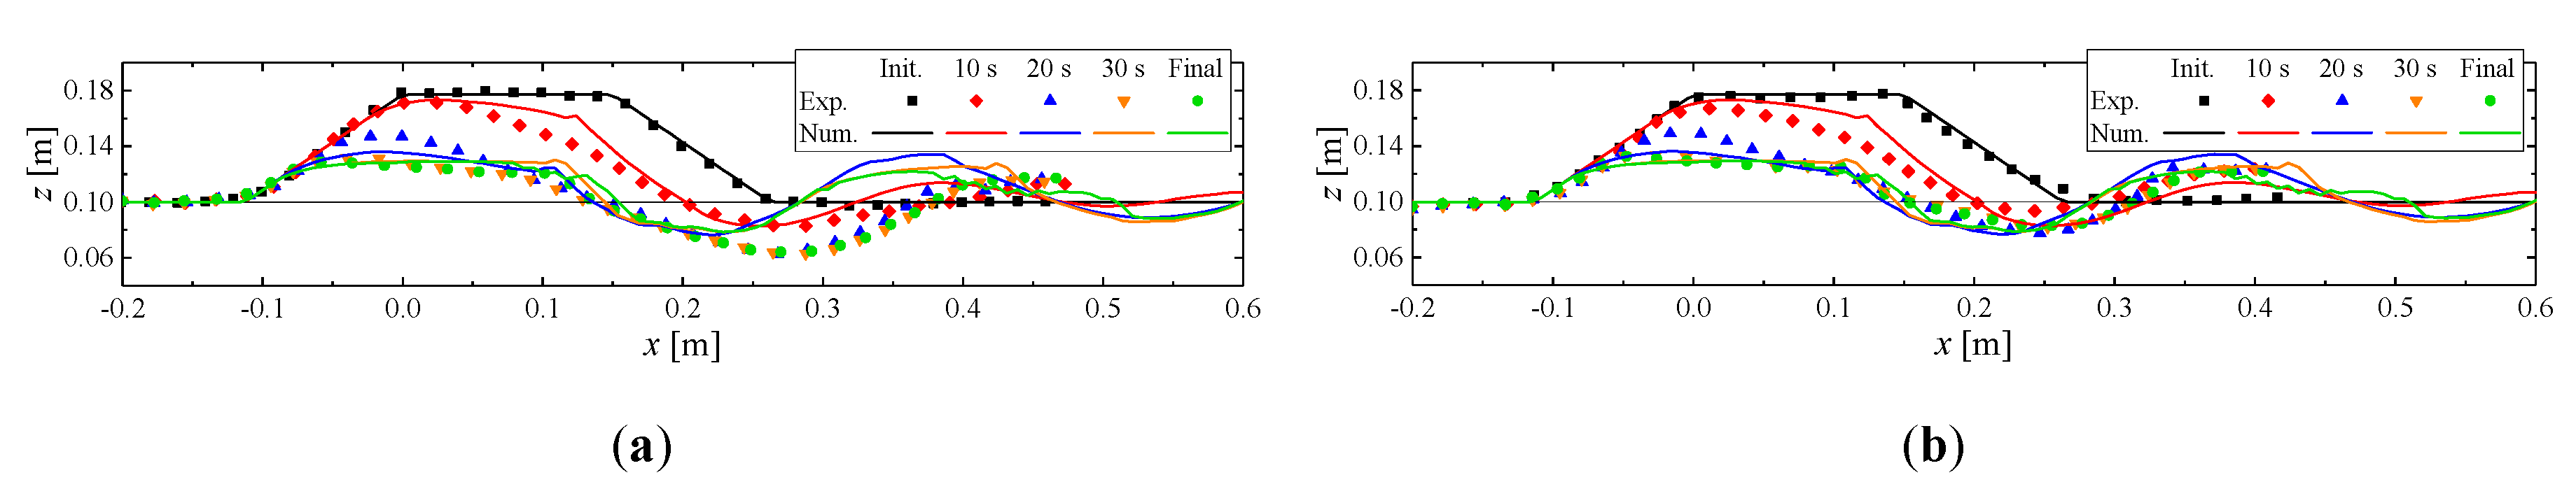
5.1.1. Comparison in Cases with Only Backfill

Figure 9 shows a comparison of water-surface fluctuations at the crown of the backfill, W2 (see Figure 1), and at the landward side of the backfill, W3. At W2, the initial level of the crown of the backfill (i.e., z = 0.177 m) was set to be 0 in the upper figures. At W3, the initial level of the surface of the sand bed (i.e., z = 0.10 m) was set to be 0 in the lower figures. In the hydraulic model experiments, the position of the water or sand surface closest to the ultrasonic sensor would be measured; hence, the numerical results also showed the position of the uppermost water or sand surface. At W2, some experimental data were missing, due to water-surface turbulence, so the black and blue curves in Figure 9 are interrupted at some points. The numerical results are presented as they are, even though the variation on the pulse, due to water droplets is included. The time on the horizontal axis is the time from the start of the computation.
For tpump = 30 and 50 s, as shown in Figure 9b,c, the experimental data (black and blue lines) show that the water level rose slightly with the passage of the tsunami, became almost constant, and then rose again. After that, the water level at W2 decreased below zero as the crown height of the backfill was lowered, while the water level at W3 continued to be above zero. The same process can be observed in the numerical results (red lines).
For tpump = 15 s, as shown in Figure 9a, the decrease in the water level at W2 after 20 s was smaller than that in the hydraulic model experiments. However, the water level at 1000 s was almost the same as the final value of the experimental data. This is because although the erosion of the backfill in the numerical results was slower than in the experimental data, the final shape of the backfill was almost the same in both, as will be discussed later.
Figure 10, Figure 11 and Figure 12 show a comparison of surface-profile changes in the backfill. Note that, in these figures, the time origin is the start of the overflow, not the start of the computation, as shown in Figure 9.
For tpump = 30 and 50 s, as shown in Figure 11 and Figure 12, the shape of the backfill, especially the change in the scour depth behind the backfill and the final surface profile of the backfill, is consistent between the experimental data and numerical results. However, the erosion of the landward edge of the backfill crown at 10 s tends to be slightly slower, and the erosion of the backfill crown at 20 s tends to be slightly faster than in the experimental data. In addition, the location of the deposition on the landward side of the backfill is slightly closer to the backfill in the numerical analyses than in the hydraulic model experiments.
For tpump = 15 s, as shown in Figure 10, the final shape of the backfill in the numerical analyses is consistent with that in the hydraulic model experiments. However, the erosion up to 15 s tends to be slower than the experimental data indicate. Figure 13 shows a comparison of the wave field around the backfill. In the right panel, t is the time from the start of the computation. F is the volume-of-fluid (VOF) function representing the volume fraction of water in each cell, i.e., F = 0 for pure air, 0 < F < 1 for air-water interface and unsaturated sand, and F = 1 for pure water. The orange lines indicate the surface of the backfill and sand bed. From Figure 13a, the flow over the backfill begins to occur at t = 11 s. After that, as shown in Figure 13b–d, the backfill continues to be eroded even slowly in the hydraulic model experiments. By contrast, the numerical analysis shows that the change in the surface profile of the backfill is small. However, Figure 13e shows that the final surface profile of the backfill is consistent with each other. In this case, as shown in Figure 13, the flow over the backfill remains very thin. Although no figure is presented here, a similar phenomenon can be observed up to 10 s for tpump = 30 and 50 s. Why the evolution of the erosion tends to be slightly slower when the flow over the backfill is very thin is a topic for future research.

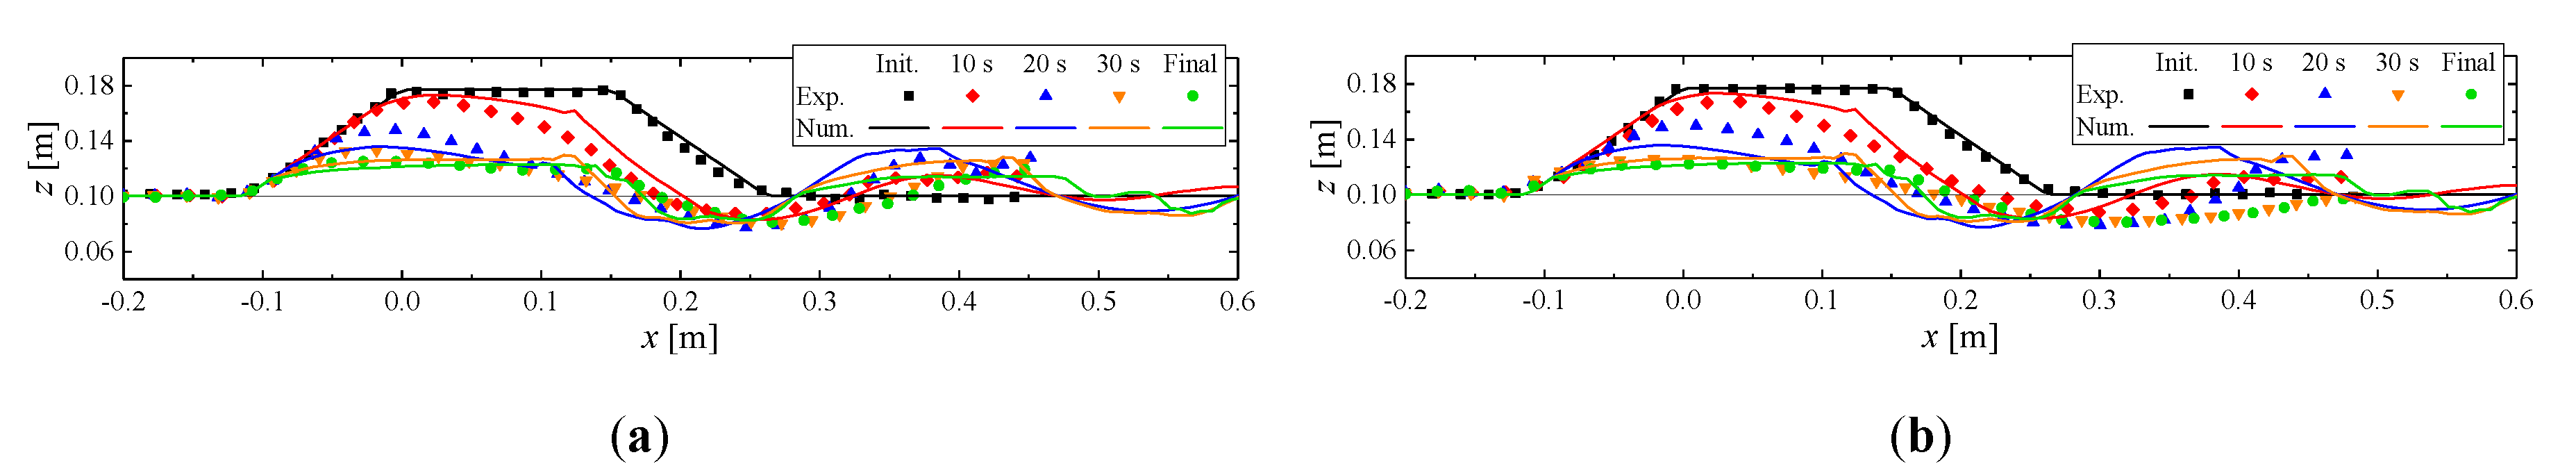
5.1.2. Comparison in Cases with Abutment and Backfill

Figure 14 shows a comparison of water-surface fluctuations at W2 and W3. As in Figure 9, the experimental data have a missing time, and the numerical results include noise on the pulse.
Figure 14 illustrates that the trend of the water surface fluctuations in the numerical results is similar to that in the experimental data. However, the decrease in the water level at W2 is underestimated for run 1 of tpump = 15 s and overestimated for tpump = 30 and 50 s. This is because the calculated drop in the crown height of the backfill was smaller for tpump = 15 s and larger for tpump = 30 and 50 s compared with the hydraulic model experiments, as will be described below.
A top view of the backfill after the tsunami is shown in Figure 15, and its contour map is shown in Figure 16. In Figure 15, the abutment is shown in gray, the backfill in orange, and the water surface in blue. In Figure 16, the crown of the abutment is shown in brown.
Comparison with Figure 6 shows that the numerical results were reasonably consistent with the experimental data, in that local scouring was formed around the abutment, whereas, away from the abutment, the backfill remained. However, the drop in the crown height is smaller than that in the experimental data. In the presence of the abutment, the tsunami passed through the opening in front of it, and the overflow over the backfill was thinner than when the abutment was absent. Thus, the backfill was eroded more slowly.
From Section 5.1.1 and Section 5.1.2, we conclude that the FS3M can predict the results of hydraulic model experiments reasonably well in terms of water-surface fluctuations and surface-profile change in the backfill, especially for tpump = 30 and 50 s. However, the computational accuracy of the erosion rate under thin overflow remains an issue.

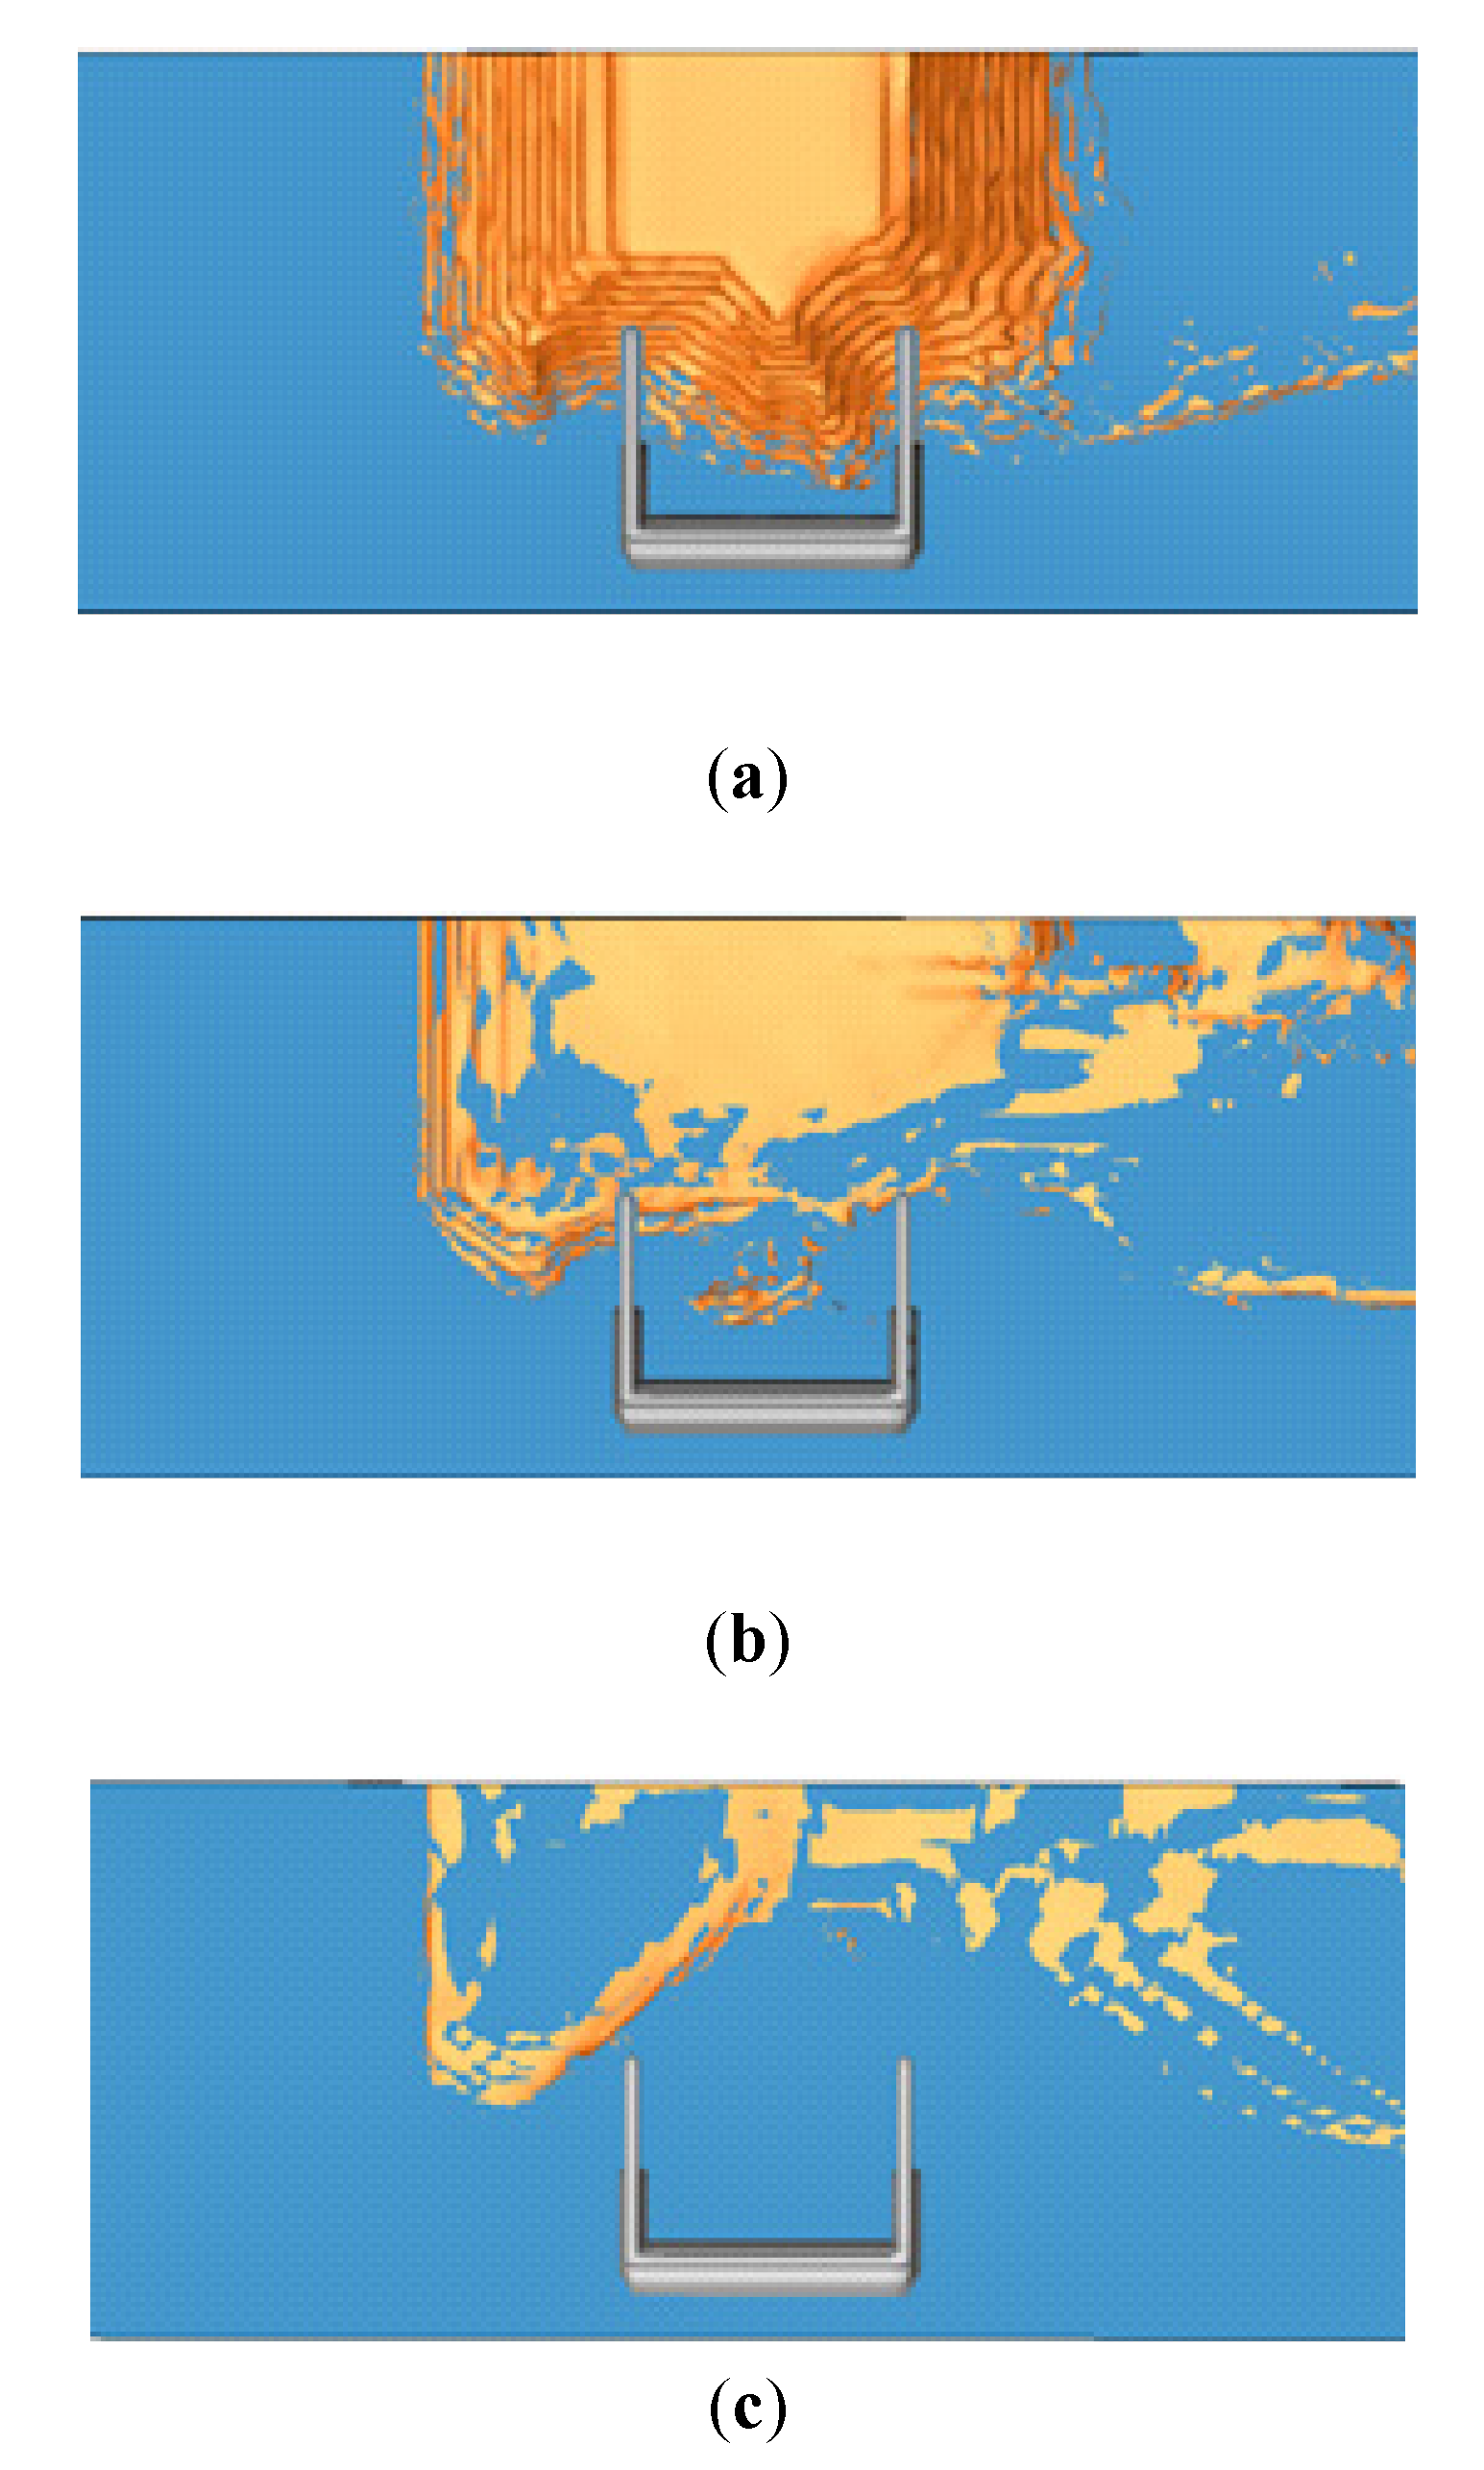
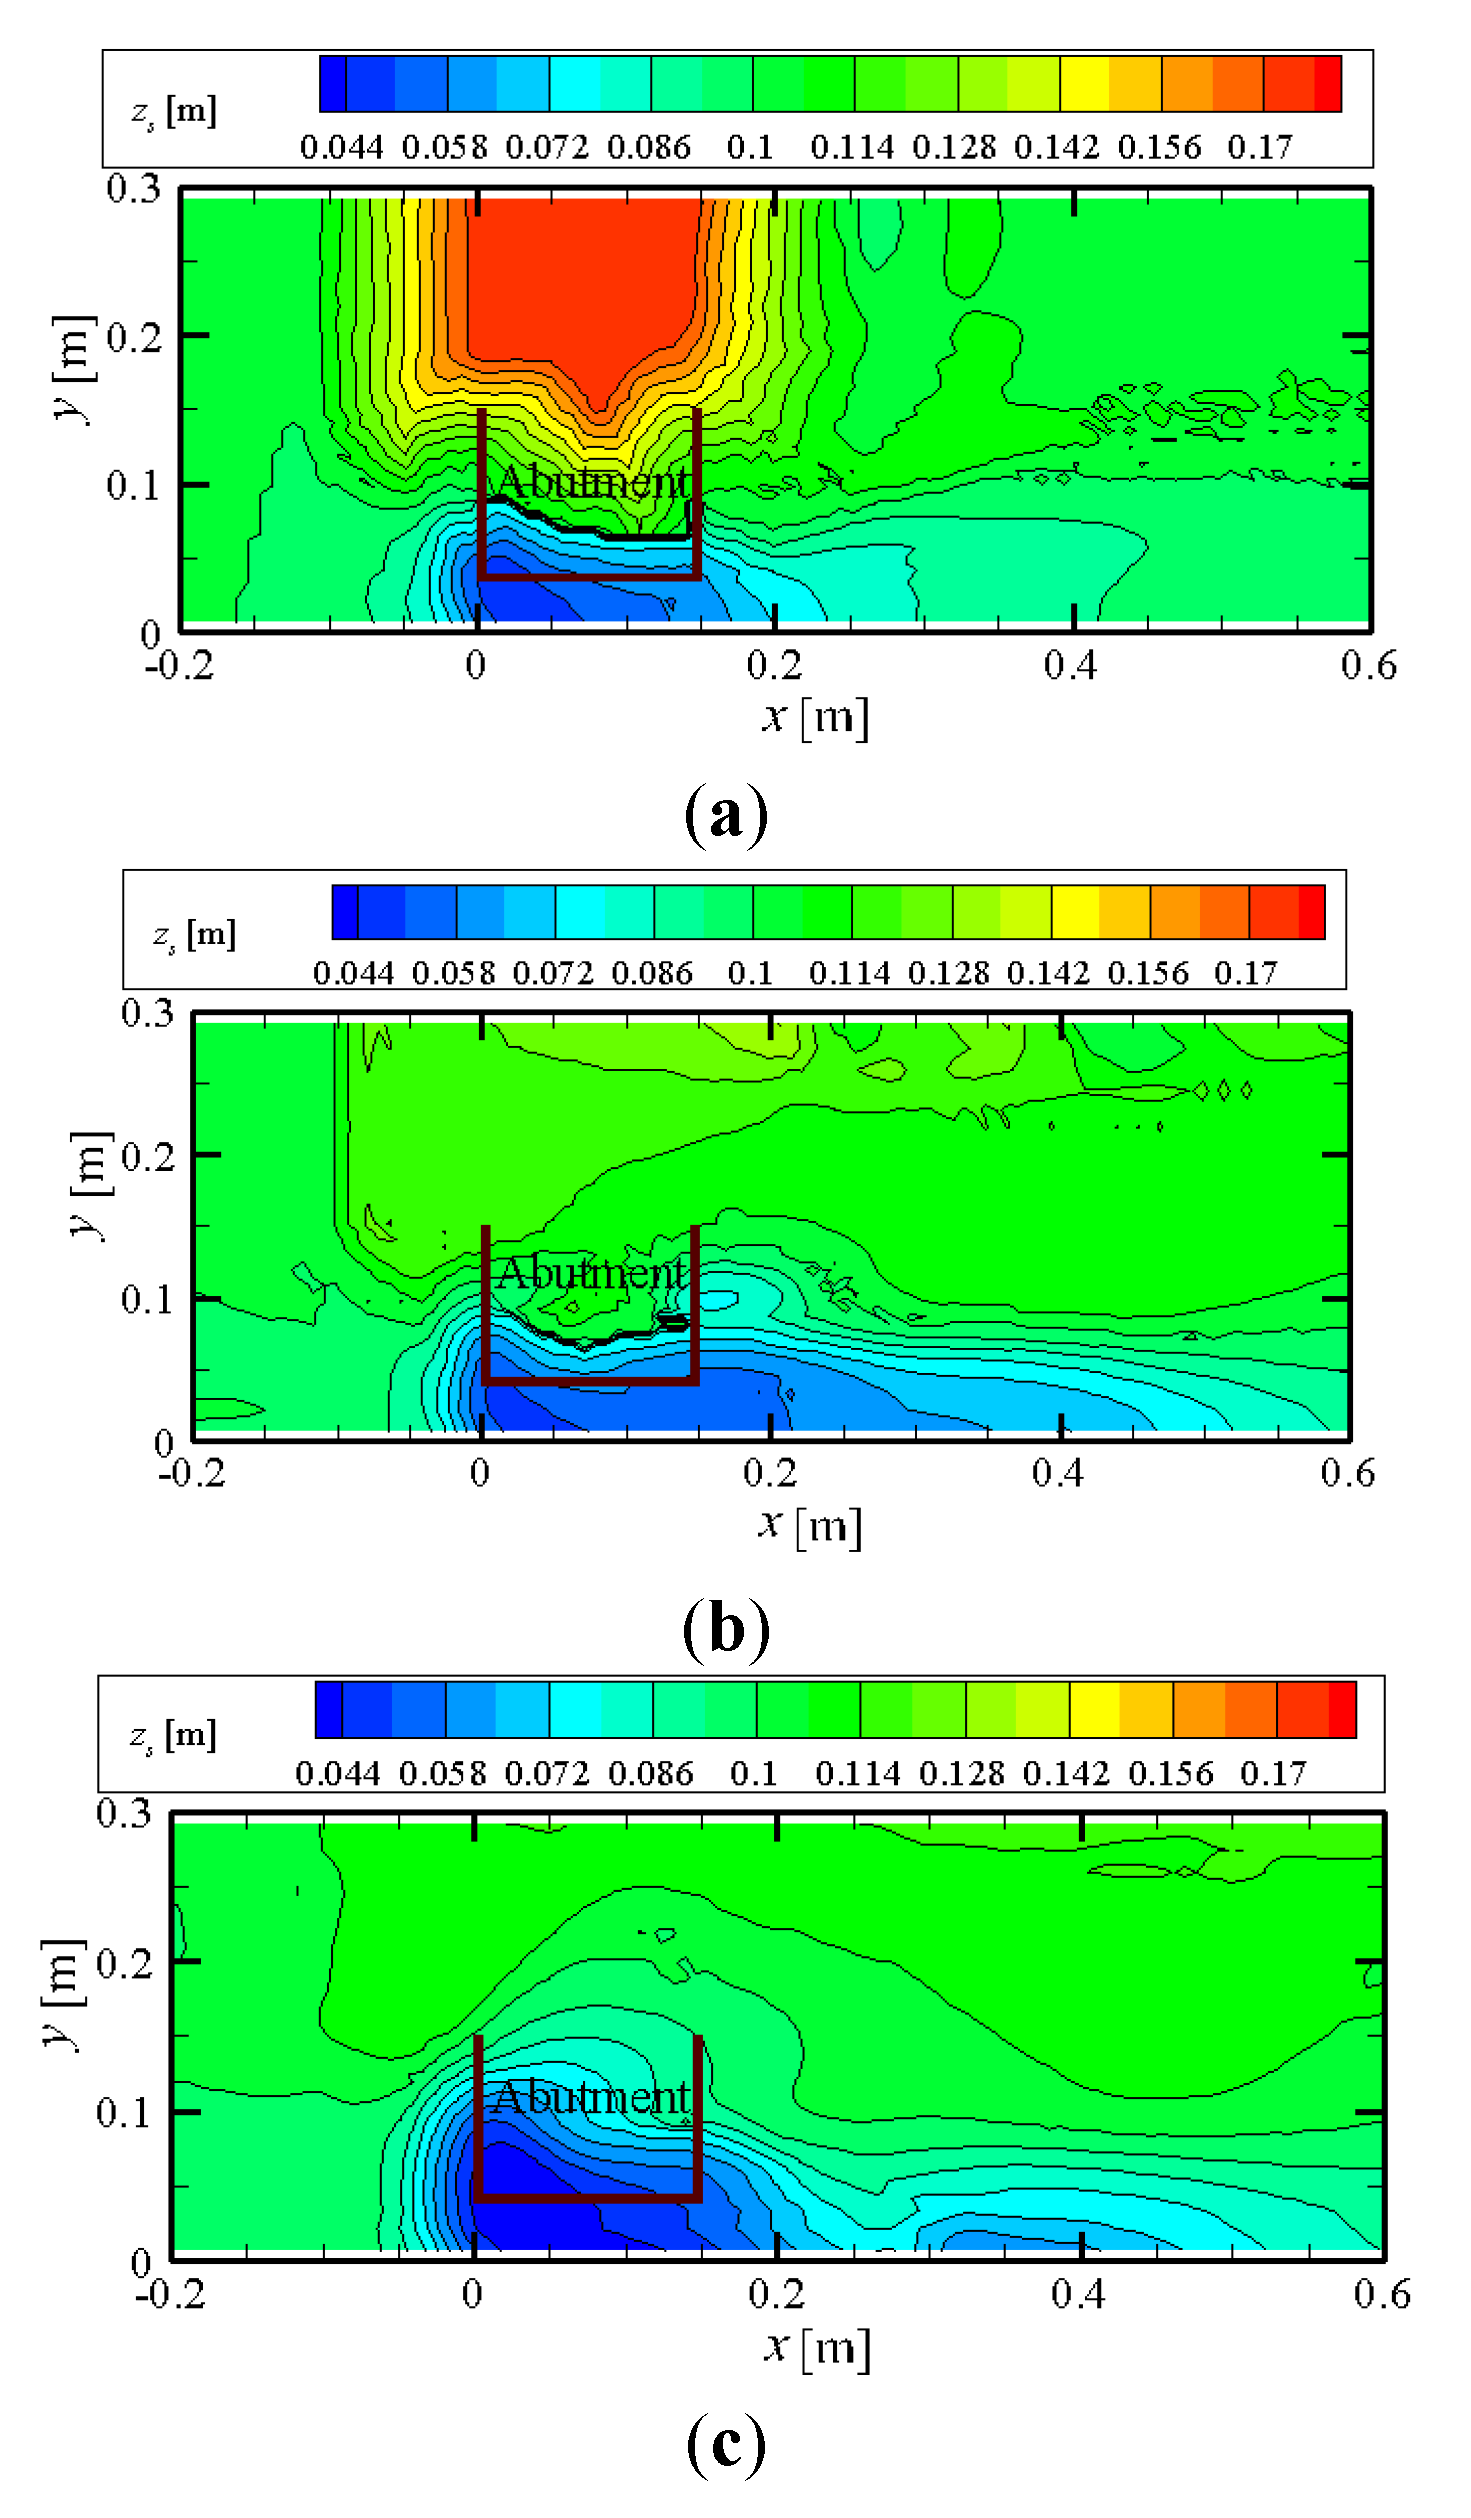
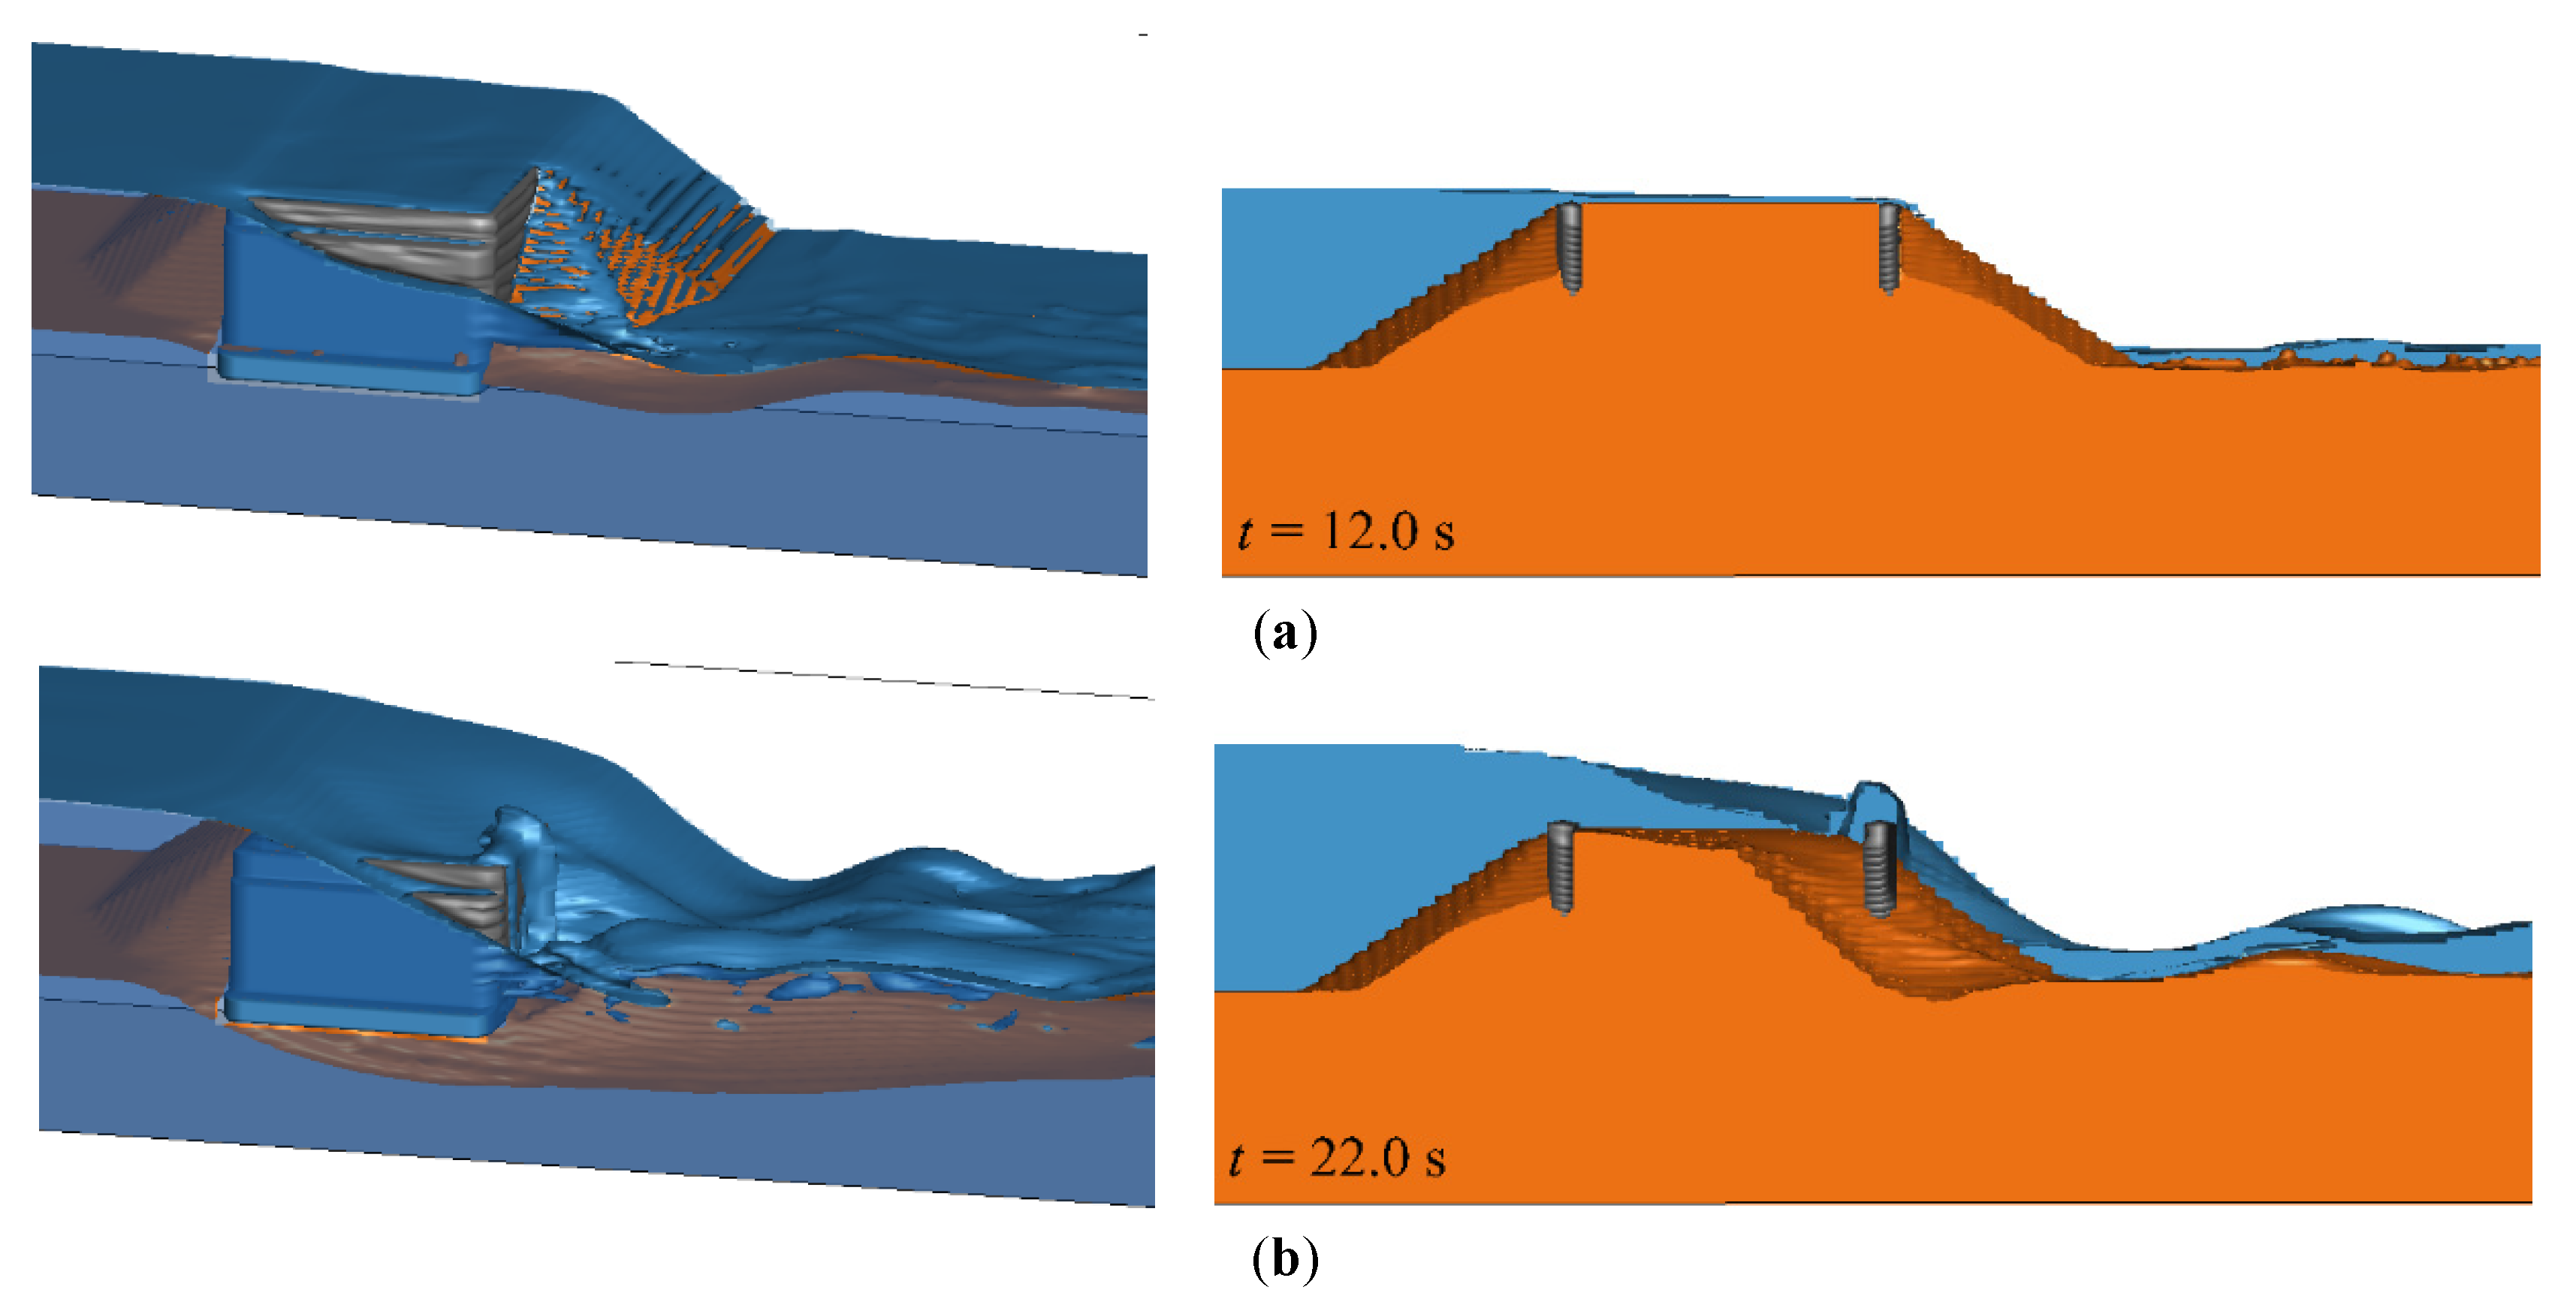
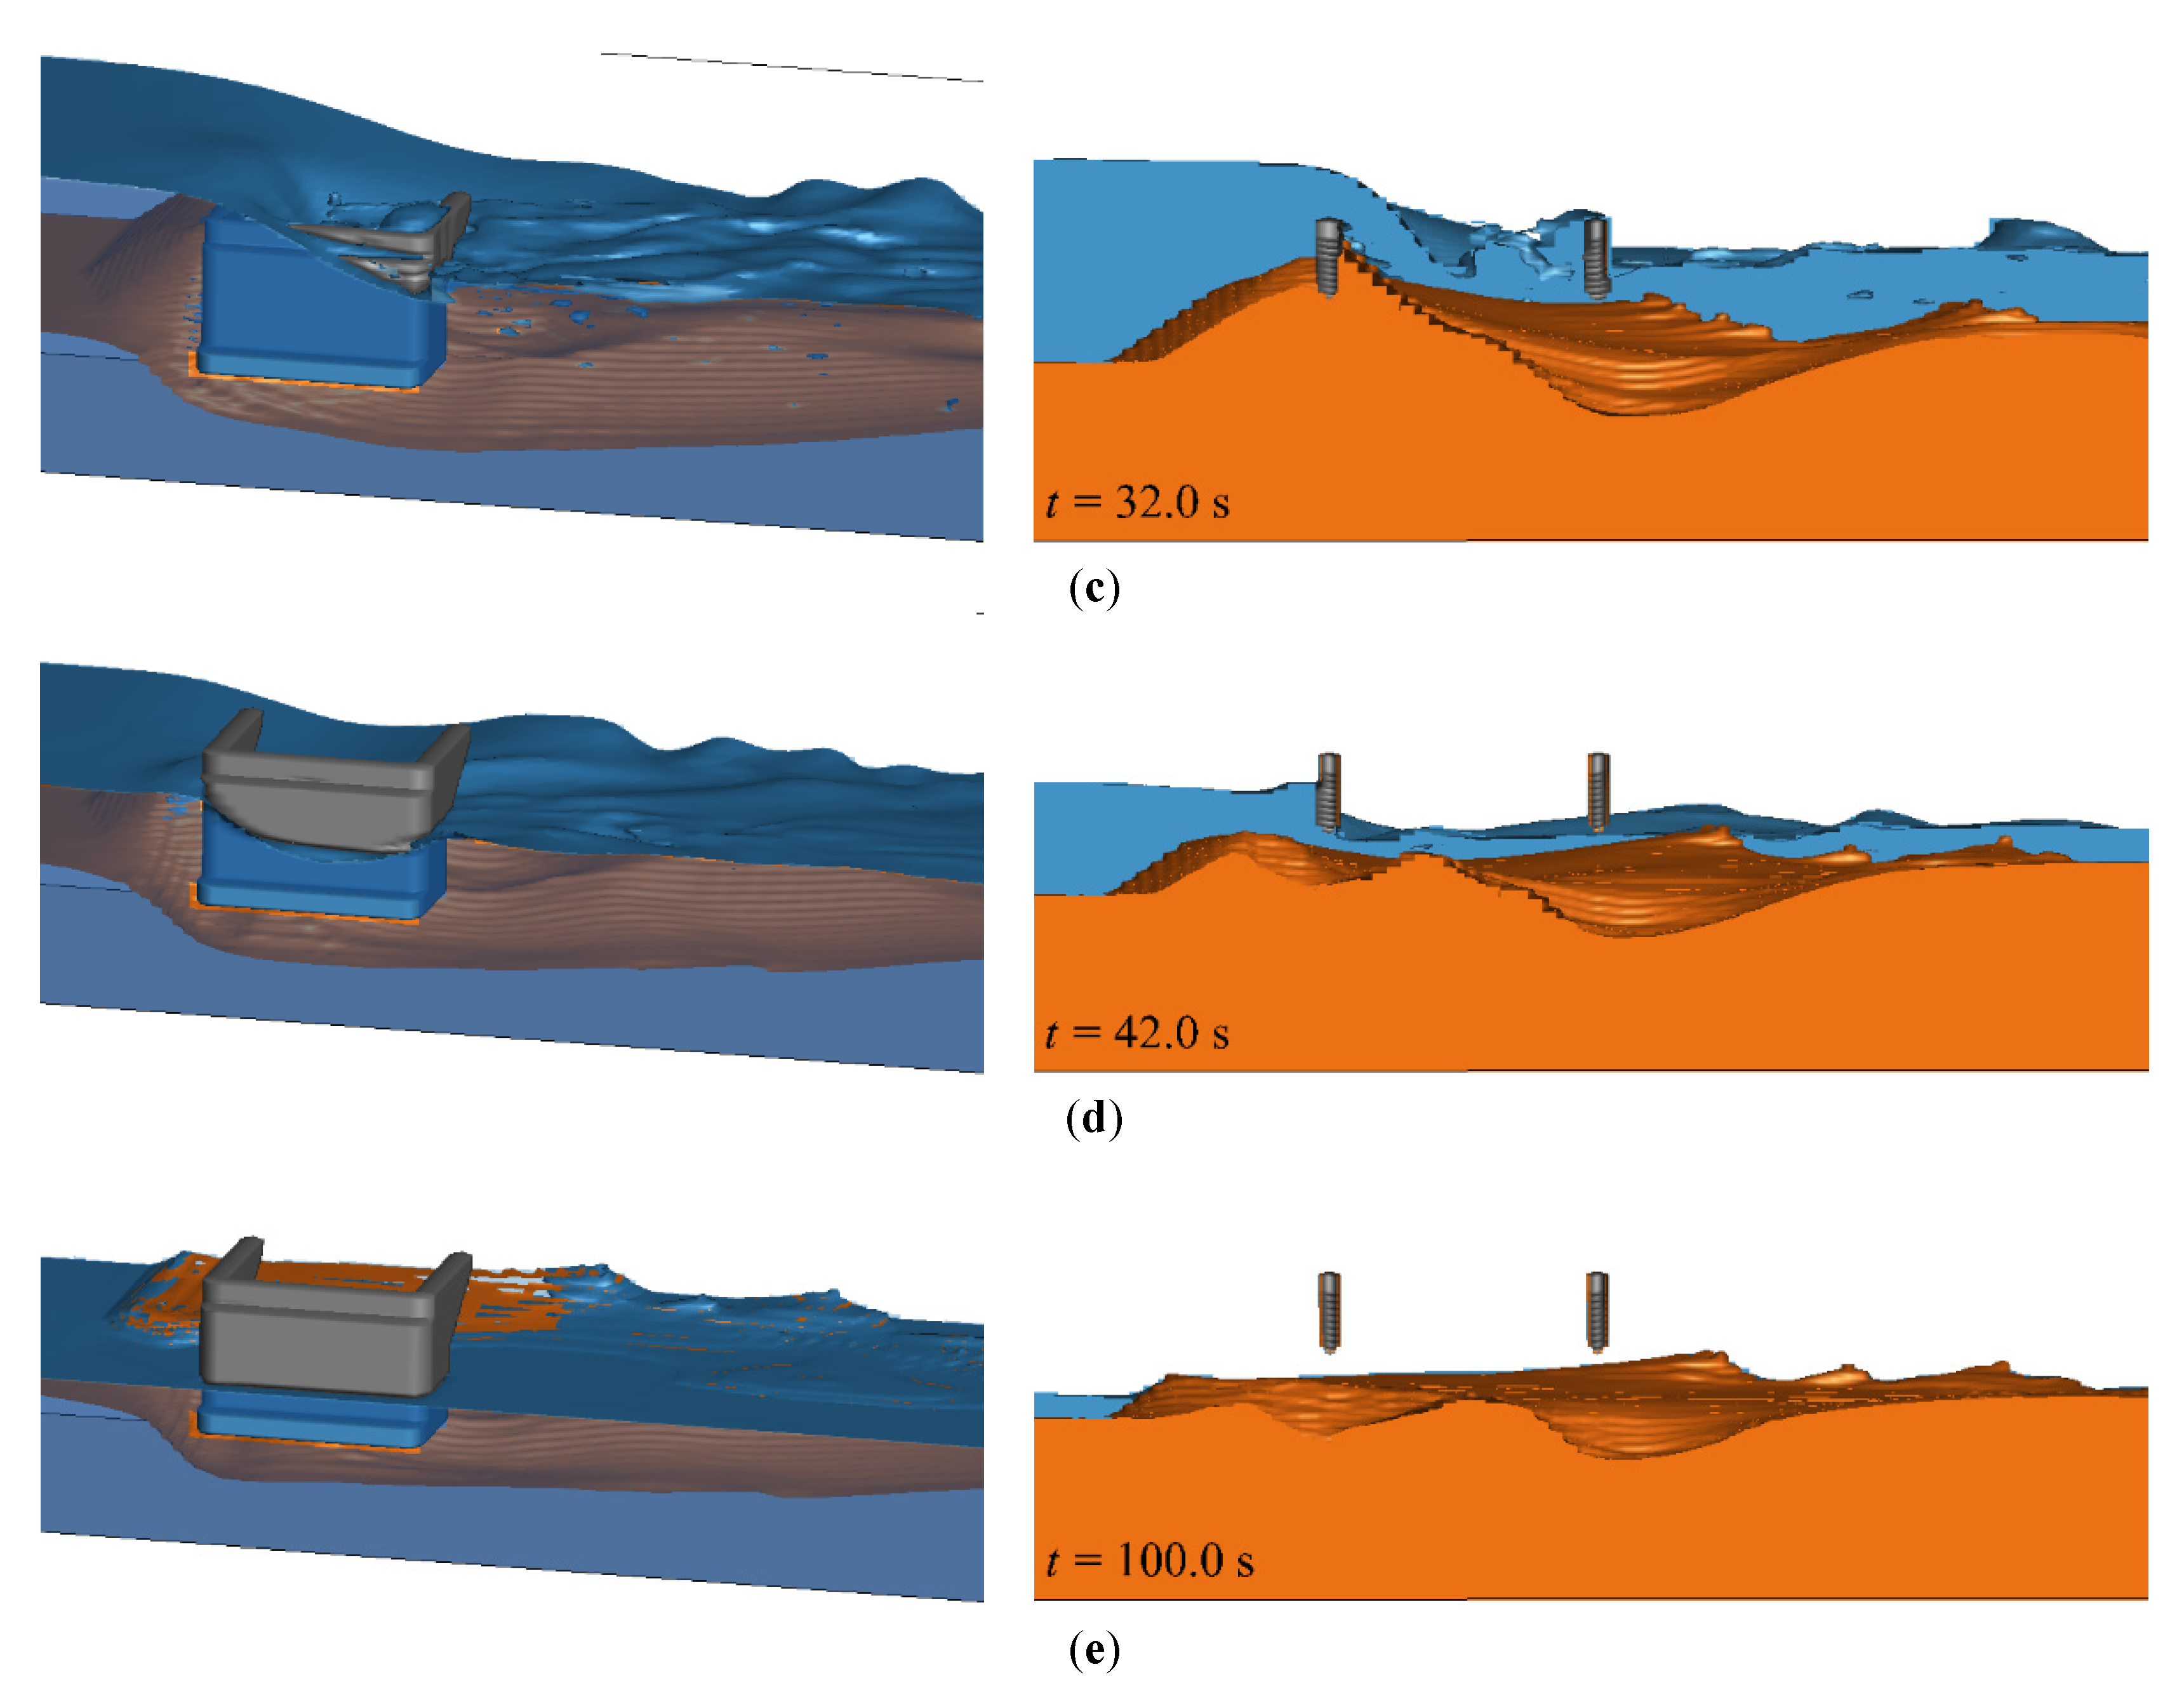
5.2. Erosion Process of Backfill

In the hydraulic model experiments, the surface profile of the backfill could only be measured before and after the tsunami, so that it was not possible to examine how the process of erosion evolved over time. In this section, the erosion process of the backfill is investigated using the FS3M.
Figure 17 shows the erosion process of the backfill for tpump = 30 s. The left panel in each figure is a bird’s-eye view, while the right panel is a cross-sectional view at y = 100 mm from the abutment side. The abutment is shown in gray, the backfill in orange, and the water surface in blue.
From Figure 17a,b, the landward flow over the crown of the abutment drops down along the onshore wing, and the landward flow over the crown of the backfill radiates down the oval conical part of the backfill. These two flows merge and cause the erosion of the conical part of the backfill. When the erosion reaches the lower end of the wing, the backfill begins to flow out from underneath the wing, and the erosion of the backfill begins to occur inside the abutment, as shown in Figure 17b. After that, as shown in Figure 17c, the erosion of the backfill progresses inside the abutment. When the erosion reaches the offshore wing, the erosion occurs under the offshore wing, as shown in Figure 17d. Finally, as shown in Figure 17e, not only the backfill inside the abutment, but also that away from it is totally eroded.
These results reveal that the backfill inside the abutment begins to flow out from underneath the onshore wing. This suggests that an increase in the soil cover depth of the onshore wing would slow down the erosion of the backfill inside the abutment.

6. Conclusions

In this study, tsunami-induced erosion of the backfill of a bridge abutment was investigated with hydraulic model experiments and numerical analyses using the FS3M. The main conclusions of this study are summarized as follows:
  • The tsunami caused erosion and local scouring of the backfill around the abutment. The scale of the erosion and local scouring increased with the duration of the tsunami. By contrast, the backfill on the far side of the abutment remained in place. This suggests that the proximity of the abutment accelerates the erosion of the backfill.
  • From a comparison between the experimental data and numerical results, the capability of the FS3M to predict water-surface fluctuations and the surface-profile change in the backfill was demonstrated.
  • The erosion process of the backfill around the abutment was revealed by the numerical analysis. The tsunami eroded the oval conical part of the backfill on the landward side of the onshore wing. When the erosion reached the lower end of the wing, the backfill began to flow out from underneath the wing. Increasing the depth of soil cover on the onshore wing might, therefore be effective in slowing down the erosion.
The mechanism of the erosion of the backfill, however, was demonstrated unsatisfactorily, due to the small-scale experiments where the scale effects were unavoidable. To address this issue, it is recommended that further experiments be conducted on a larger scale.

Author Contributions

Conceptualization, T.N.; methodology, T.N., Y.-H.C., and N.M.; software, T.N.; validation, T.N., Y.-H.C., and N.M.; investigation, T.N. and Y.N.; writing—original draft preparation, T.N.; writing—review and editing, Y.-H.C. and N.M.; visualization, Y.N.; project administration, T.N.; funding acquisition, T.N. All authors have read and agreed to the published version of the manuscript.

Funding

This research was supported by the Japan Society for the Promotion of Science (JSPS) under Grant-in-Aid for Scientific Research (C) (PI: Tomoaki Nakamura; Grant No.: 18K04364).

Acknowledgments

The authors appreciate critical review comments from two anonymous reviewers, which greatly improved an earlier draft of this manuscript.

Conflicts of Interest

The authors declare no conflict of interest.

References

  1. Bricker, J.D.; Fransis, M.; Nakayama, A. Scour depths near coastal structures due to the 2011 Tohoku Tsunami. J. Hydraul. Res. 2012, 50, 637–641. [Google Scholar] [CrossRef]
  2. Rajaratnam, N. Erosion by plane turbulent jets. J. Hydraul. Res. 1981, 19, 339–358. [Google Scholar] [CrossRef]
  3. Bressan, L.; Guerrero, M.; Antonini, A.; Petruzzelli, V.; Archetti, R.; Lamberti, A.; Tinti, S. A laboratory experiment on the incipient motion of boulders by high-energy coastal flows. Earth Surf. Process. Landf. 2018, 43, 2935–2947. [Google Scholar] [CrossRef] [Green Version]
  4. JSCE (Japan Society of Civil Engineers). Part II: Final Report of Tsunami Damage Analysis WG. In Final Report of Subcommittee on Damage Analysis of Bridges Due to Great East. Japan Earthquake; Earthquake Engineering Committee, JSCE: Tokyo, Japan, 2015. (In Japanese) [Google Scholar]
  5. Azadbakht, M.; Yim, S.C. Simulation and estimation of tsunami loads on bridge superstructure. J. Waterw. Portcoastalocean Eng. 2015, 141, 04014031. [Google Scholar] [CrossRef]
  6. Wei, Z.; Dalrymple, R.A.; Hérault, A.; Bilotta, G.; Rustico, E.; Yeh, H. SPH modeling of dynamic impact of tsunami bore on bridge piers. Coast. Eng. 2015, 104, 26–42. [Google Scholar] [CrossRef]
  7. Nakamura, T.; Sawa, Y.; Mizutani, N. Study on the evaluation of temporal change in horizontal and vertical tsunami forces acting on a bridge superstructure. Coast. Eng. J. 2016, 58, 1640020-1. [Google Scholar] [CrossRef] [Green Version]
  8. Inoue, T.; Miyamoto, K.; Yoshizaki, F.; Nagase, H.; Hirooka, A. Centrifuge model experiments on tsunami-induced damage mechanism of backfill of bridge abutment with different shapes. In Proceedings of the 49th Annual Meeting of Japan National Conference on Geotechnical Engineering, Kitakyushu, Japan, 15–17 July 2014; pp. 1897–1899. (In Japanese). [Google Scholar]
  9. Yoshizaki, F.; Fujioka, D.; Hirooka, A.; Nagase, H. Centrifuge model experiments on the effect of pseudo-tsunami flow on damage situation of abutment backfill. In Proceedings of the 50th Annual Meeting of Japan National Conference on Geotechnical Engineering, Sapporo, Japan, 1–4 September 2015; pp. 1177–1178. (In Japanese). [Google Scholar]
  10. Nakamura, T.; Mizutani, N. Development of fluid-sediment-seabed interaction model and its application. In Proceedings of the 34th International Conference on Coastal Engineering, Seoul, Korea, 15–20 September 2014; p. 8. [Google Scholar]
  11. Nakamura, T.; Yim, S.C.; Mizutani, N. Three-dimensional fluid-structure-sediment interaction modeling with application to local scouring around a movable cylinder. J. Offshore Mech. Arct. Eng. 2013, 135. [Google Scholar] [CrossRef]
  12. Sugii, T.; Yamada, K.; Okumura, K. Discussion on hydraulic conductivity of unsaturated sand at high saturation. In Proceedings of the Annual Meeting of Chubu Branch, Shimizu, Japan, 8 March 2002; pp. 267–268. (In Japanese). [Google Scholar]
Figure 1. Experimental setup (unit: mm; W2, W3: locations of the ultrasonic sensors). Water is shown in blue, sand bed, and backfill in yellow, impermeable bottom in gray: (a) top view; (b) side view.
Jmse 08 00922 g001
Figure 2. Bridge abutment (unit: mm): (a) side view; (b) cross-sectional view; (c) front view.
Jmse 08 00922 g002
Figure 3. Backfill (unit: mm). In the lower panel, the white object is abutment: (a) top view. Green lines show measurement lines for a surface profile of backfill and sand bed; (b) side view.
Jmse 08 00922 g003
Figure 4. Top view of the backfill after the tsunami (run 1): (a) tpump = 30 s; (b) tpump = 50 s. The tsunami passed from left to right. The white object at near side is the abutment. The rightward direction is x axis, upward direction is y axis.
Jmse 08 00922 g004
Figure 5. Side view of the backfill after the tsunami (run 1): (a) tpump = 15 s; (b) tpump = 30 s; (c) tpump = 50 s. The tsunami passed from left to right. The white line in the channel shows the initial shape of the backfill; the white object behind the backfill is abutment. The rightward direction is x axis, upward direction is z axis.
Jmse 08 00922 g005
Figure 6. Surface profile of the backfill before (left) and after (right) the tsunami. The tsunami passed from left. (a) tpump = 15 s, run 1; (b) tpump = 15 s, run 2; (c) tpump = 30 s, run 1; (d) tpump = 30 s, run 2; (e) tpump = 50 s, run 1; (f) tpump = 50 s, run 2.
Jmse 08 00922 g006aJmse 08 00922 g006b
Figure 7. Surface profile change in the backfill before and after the tsunami. The tsunami passed from left. (a) tpump = 15 s, run 1; (b) tpump = 15 s, run 2; (c) tpump = 30 s, run 1; (d) tpump = 30 s, run 2; (e) tpump = 50 s, run 1; (f) tpump = 50 s, run 2.
Jmse 08 00922 g007
Figure 8. Computational domain of fluid-structure-sediment-seabed interaction model in cases with abutment and backfill (unit: mm; W2, W3: output locations of water surface fluctuations).
Jmse 08 00922 g008
Figure 9. Comparison of numerical and experimental results for water surface fluctuations (no abutment) at points W2 and W3: (a) tpump = 15 s; (b) tpump = 30 s; (c) tpump = 50 s.
Jmse 08 00922 g009
Figure 10. Comparison of the evolution of the backfill (no abutment, tpump = 15 s): (a) run 1; (b) run 2.
Jmse 08 00922 g010
Figure 11. Comparison of the evolution of the backfill (no abutment, tpump = 30 s): (a) run 1; (b) run 2.
Jmse 08 00922 g011
Figure 12. Comparison of the evolution of the backfill (no abutment, tpump = 50 s): (a) run 1; (b) run 2.
Jmse 08 00922 g012
Figure 13. Comparison of the wave field around the abutment for tpump = 15 s (left: experimental data for run 2; right: numerical results): (a) t = 11.0 s; (b) t = 16.0 s; (c) t = 21.0 s; (d) t = 26.0 s; (e) t = 1000 s (final). (t: time from start of computation. F: VOF function).
Jmse 08 00922 g013
Figure 14. Comparison of the water surface fluctuations (with abutment) at points W2 and W3: (a) tpump = 15 s; (b) tpump = 30 s; (c) tpump = 50 s.
Jmse 08 00922 g014
Figure 15. Top view of the backfill after the tsunami: (a) tpump = 15 s; (b) tpump = 30 s; (c) tpump = 50 s. (Gray: abutment; Orange: backfill; Blue: water).
Jmse 08 00922 g015
Figure 16. Final surface profile of the backfill: (a) tpump = 15 s; (b) tpump = 30 s; (c) tpump = 50 s. (Brown: crown of abutment).
Jmse 08 00922 g016
Figure 17. Erosion process of the backfill around the abutment for tpump = 30 s (left: bird’s-eye view; right: cross-sectional view of y = 100 mm): (a) t = 12.0 s; (b) t = 22.0 s; (c) t = 32.0 s; (d) t = 42.0 s; (e) t = 100.0 s (final). (Gray: abutment; Orange: backfill; Blue: water).
Jmse 08 00922 g017aJmse 08 00922 g017b
Table 1. Experimental conditions for different pump-operating times tpump.
Tpump [s]AbutmentRun
15Abutment, backfill1, 2
30Abutment, backfill1, 2
50Abutment, backfill1, 2
15Only backfill (no abutment)1, 2
30Only backfill (no abutment)1, 2
50Only backfill (no abutment)1, 2
Publisher’s Note: MDPI stays neutral with regard to jurisdictional claims in published maps and institutional affiliations.

