Article

Observations and Preliminary Vulnerability Assessment of a Hybrid Dune-Based Living Shoreline

1
Department of Civil and Environmental Engineering, University of California, Los Angeles, CA 90095, USA
2
GHD Consulting, San Diego, CA 92123, USA
3
California Coastal Conservancy, Oakland, CA 94612, USA
*
Author to whom correspondence should be addressed.
J. Mar. Sci. Eng. 2020, 8(11), 920; https://doi.org/10.3390/jmse8110920
Submission received: 6 October 2020 / Revised: 5 November 2020 / Accepted: 8 November 2020 / Published: 15 November 2020
(This article belongs to the Special Issue Resilient Flood Defences)

Abstract

:
A novel hybrid (e.g., vegetation, sand, cobble, rip-rap) nature-based dune structure was constructed at Cardiff State Beach in Encinitas, California, to protect a critical transportation artery from undermining and frequent flooding. A collaboration between regulators, funders, state agencies, professional practice and academia developed a high resolution robust unmanned aerial vehicle (UAV) based monitoring strategy to observe dune construction and evolution. Fifteen construction surveys were conducted to observe each substrate element for future morphodynamic modeling efforts. Six post-construction surveys were conducted to observe seasonal and storm-by-storm dune evolution. Backshore vulnerability was assessed using a sixty-one year time series of tides and hindcast wave forcing fit to a general extreme value distribution. The dune crest is above calculated 100-year water levels; however, the dune remains vulnerable to mass wasting caused by swash interaction at the toe of the dune. Sea-level rise will substantially increase the probability of dune erosion, breaching, and overtopping.

1. Introduction

Climate change is driving sea-level rise at a rate of around 3–4 mm/yr [1,2] and the global mean sea-level rise is projected to be anywhere from 0.28 to 0.98 m by 2100, depending on modeling methodology and the carbon dioxide emissions scenario [3,4,5]. However, these estimates likely under-represent future rise rates given the uncertainty in ocean warming and ice dynamics, particularly in Antarctica [6,7,8,9]. Global sea-level rise will increase the frequency and severity of high water levels and flooding events [5]. Over 30 days of annual flooding will be reached by 2050, and near daily flooding (under RCP 4.5) will occur by 2100 for many areas across the globe [10]. This acceleration in coastal flooding will impact increasingly larger coastal populations [11,12]. Upgrading coastal defenses and nourishing beaches would reduce these impacts roughly by three orders of magnitude [5]. Implementing coastal protection against increased flooding events outweigh the costs of inaction, and without these protection measures, hundreds of millions of people will be displaced [5,13].
Traditional coastal engineering practice uses hard infrastructure such as sea walls, revetments, and rubble-mound dikes to armor vulnerable landward regions against extreme flooding, especially along highly energetic coastlines. Research on hard engineering structure design and for critical runup and overtopping limits are found extensively in the literature [14,15,16,17]. Hard structures are effective at reducing wave impact and damage from extreme storm events; however, they may adversely impact the coast by limiting recreation opportunities, damaging coastal ecosystems and promoting passive, or long-term, erosion [18,19,20]. Additionally they alter coastline accretion and erosion dynamics and are incapable of natural adaptation to evolving sea levels and energetic waves [20,21].
Soft engineering structures (i.e., man-made dunes) are an alternative to these traditional designs. Artificial sand dunes or beach berms are sand structures that deflect high water or energetic wave events [22,23,24]. They reduce the magnitude of erosion forces or relocate coastal forces away from the coastline [23]. Artificial dunes are widely used along the coasts of the United States, Europe, and Australia. In California, they are used as seasonal coastal protection against flooding from winter wave storms [23,24,25]. Additionally, they serve as a sediment reservoir for the lower beach and can be adapted to sea-level rise with additional sediment without requiring extensive redesign and expensive hard structure building [17]. These structures may be particularly effective in highly urbanized, constrained coastal areas lacking space to accommodate other natural defense solutions [20,24,25]. Additionally, the capital and maintenance costs of soft or hybrid structures may be less than similarly sized hard structures [17,26,27,28]. Soft dune structures present potential management challenges on highly energetic coastlines including emergency post-storm maintenance, nourishment and sand budget maintenance. Furthermore, if storm events coincide with high water levels and are sufficiently energetic, dunes may fail in a single storm or tide cycle.
Larger grain sizes such as cobbles represent an intermediary on the continuum of soft (sand) to hard (e.g., revetment, sea wall) structures. Cobble (∼70–300 mm) naturally occurs on west coast beaches, are resilient to large wave events [29] and have been considered as a superior backshore armoring method [30,31]. Komar and Allan [32] report on a large composite artificial dune at Cape Lookout State Park that consisted of geotextile bags, cobble and sand and found that despite significant construction flaws (low cobble elevations along portions of berm), it has successfully protected the backshore at a lower cost than a traditional revetment. A cobble “mattress” (berm) was installed in September 2000 at Surfer’s Point in Ventura, California, as a part of a managed retreat program. Generally, the berm has been considered a success and Phase 1 was completed in 2011 [33]; however, no scientific literature has been published summarizing the findings of berm stability. A paucity of field observations fundamentally limit our understanding of cobble stability and transport [34,35].
Hybrid coastal structures combine the strengths of both the soft and hard structures to better defend against coastal flooding [36]. Typically, for hybrid dunes, these structures consist of a static, hard structure, such as a wall, rubble mound, dike, or revetment buried and covered with a dynamic sand dune. The ’soft’ portion of the structure (vegetation, sand) provides protective benefits (i.e., reducing flow velocities, minimizing transport) and adapts to coastal forcing, while the hard structure provides a traditional protective measure. For example, a relic seawall buried by a sand dune in Bay Head, New Jersey, was found to have resulted in less overwash and damage to the structures behind it compared to a similar sand-only dune, which was breached in the neighboring community Mantoloking during Hurricane Sandy in 2012 [37,38,39]. Similarly, in a wave flume experiment a sand-buried sea wall provided superior protection compared to a sand dune alone [40]. Although beach morphology and erosion of sand-fronted hard structures have been addressed in the literature, the impact of hybrid structures on backshore vulnerability are critically lacking. The paucity of design guidance is identified as a fundamental coastal engineering challenge [17].
Nature-based, or eco-engineering, living shoreline elements such as artificial reefs, marsh restoration, and native vegetated dune systems may be directly incorporated into hybrid designs [20,21,41,42]. Living shorelines are a coastal engineering stabilization method to protect coastlines while at the same time restoring and providing natural habitats and coastal ecosystems [20]. They utilize nature-based components, such as planting vegetation or restoring marshlands [20]. Living shorelines represent an attractive sea-level rise adaptation strategy balancing coastal protection, available adaptation space, ecological and recreational benefits. Dune restorations, a soft eco-engineering approach, are typically built for coastal defense and have the potential to follow and adapt with natural erosion and accretion patterns; they can be successful if properly maintained and nourished [42]. Recently an eco-friendly dune stabilization pilot project utilizing mineral colloidal silica has shown potential promise for increasing dune resilience [43]. Vegetated sand dunes are successfully utilized in many countries to limit the effects of coastal erosion and flooding, from Europe [44,45,46,47,48,49,50,51] to the United States [52,53,54,55,56,57]. Vegetation has the ability to attenuate waves, absorb and reduce storm surge, and minimize backshore flooding [20,21,41,42], and several studies have been published on the benefits of vegetation in other living shoreline coastal protection projects, such as wetlands and mangroves [20,42,58,59]. Additionally, it has been found that vegetation incorporated into beach dunes can dissipate wave energy and reduce dune erosion [60,61]. High-energy and urbanized coastlines, such as those in Southern California, would benefit from hybrid dune-based living shoreline structures that provide the necessary coastal protection in the available footprint while simultaneously enhancing the ecological and recreational aspects of public beach spaces.
Monitoring is fundamental to assessing the efficacy of living shoreline projects and developing future sea-level rise adaptation strategies. A number of survey methods (i.e., stereo video, manual survey, unmanned aerial vehicle (UAV) photogrammetry, LiDAR) have been used to investigate topographic dune change ([51,62,63,64], respectively). Unmanned aerial vehicle photogrammetry is widely used for geoscience applications and coastal topographic monitoring [51,63,65,66,67,68]. UAV-based photogrammetry methods are more cost effective and faster than alternative survey methods [51,63,66,68], while providing elevation data quality similar to high-accuracy laser scanning [68]. Hybrid structures present considerable monitoring and modeling challenges, specifically accurately depicting the buried multi-layer and ecological components and how these characteristics correspond to structural performance on both event and long-term time scales. The purpose of this research is to observe dune evolution at Cardiff State Beach (Figure 1) and assess the backshore vulnerability to extreme water levels and sea-level rise before and after the construction of a novel hybrid rock-cobble-sand-vegetated dune system.

2. Methods

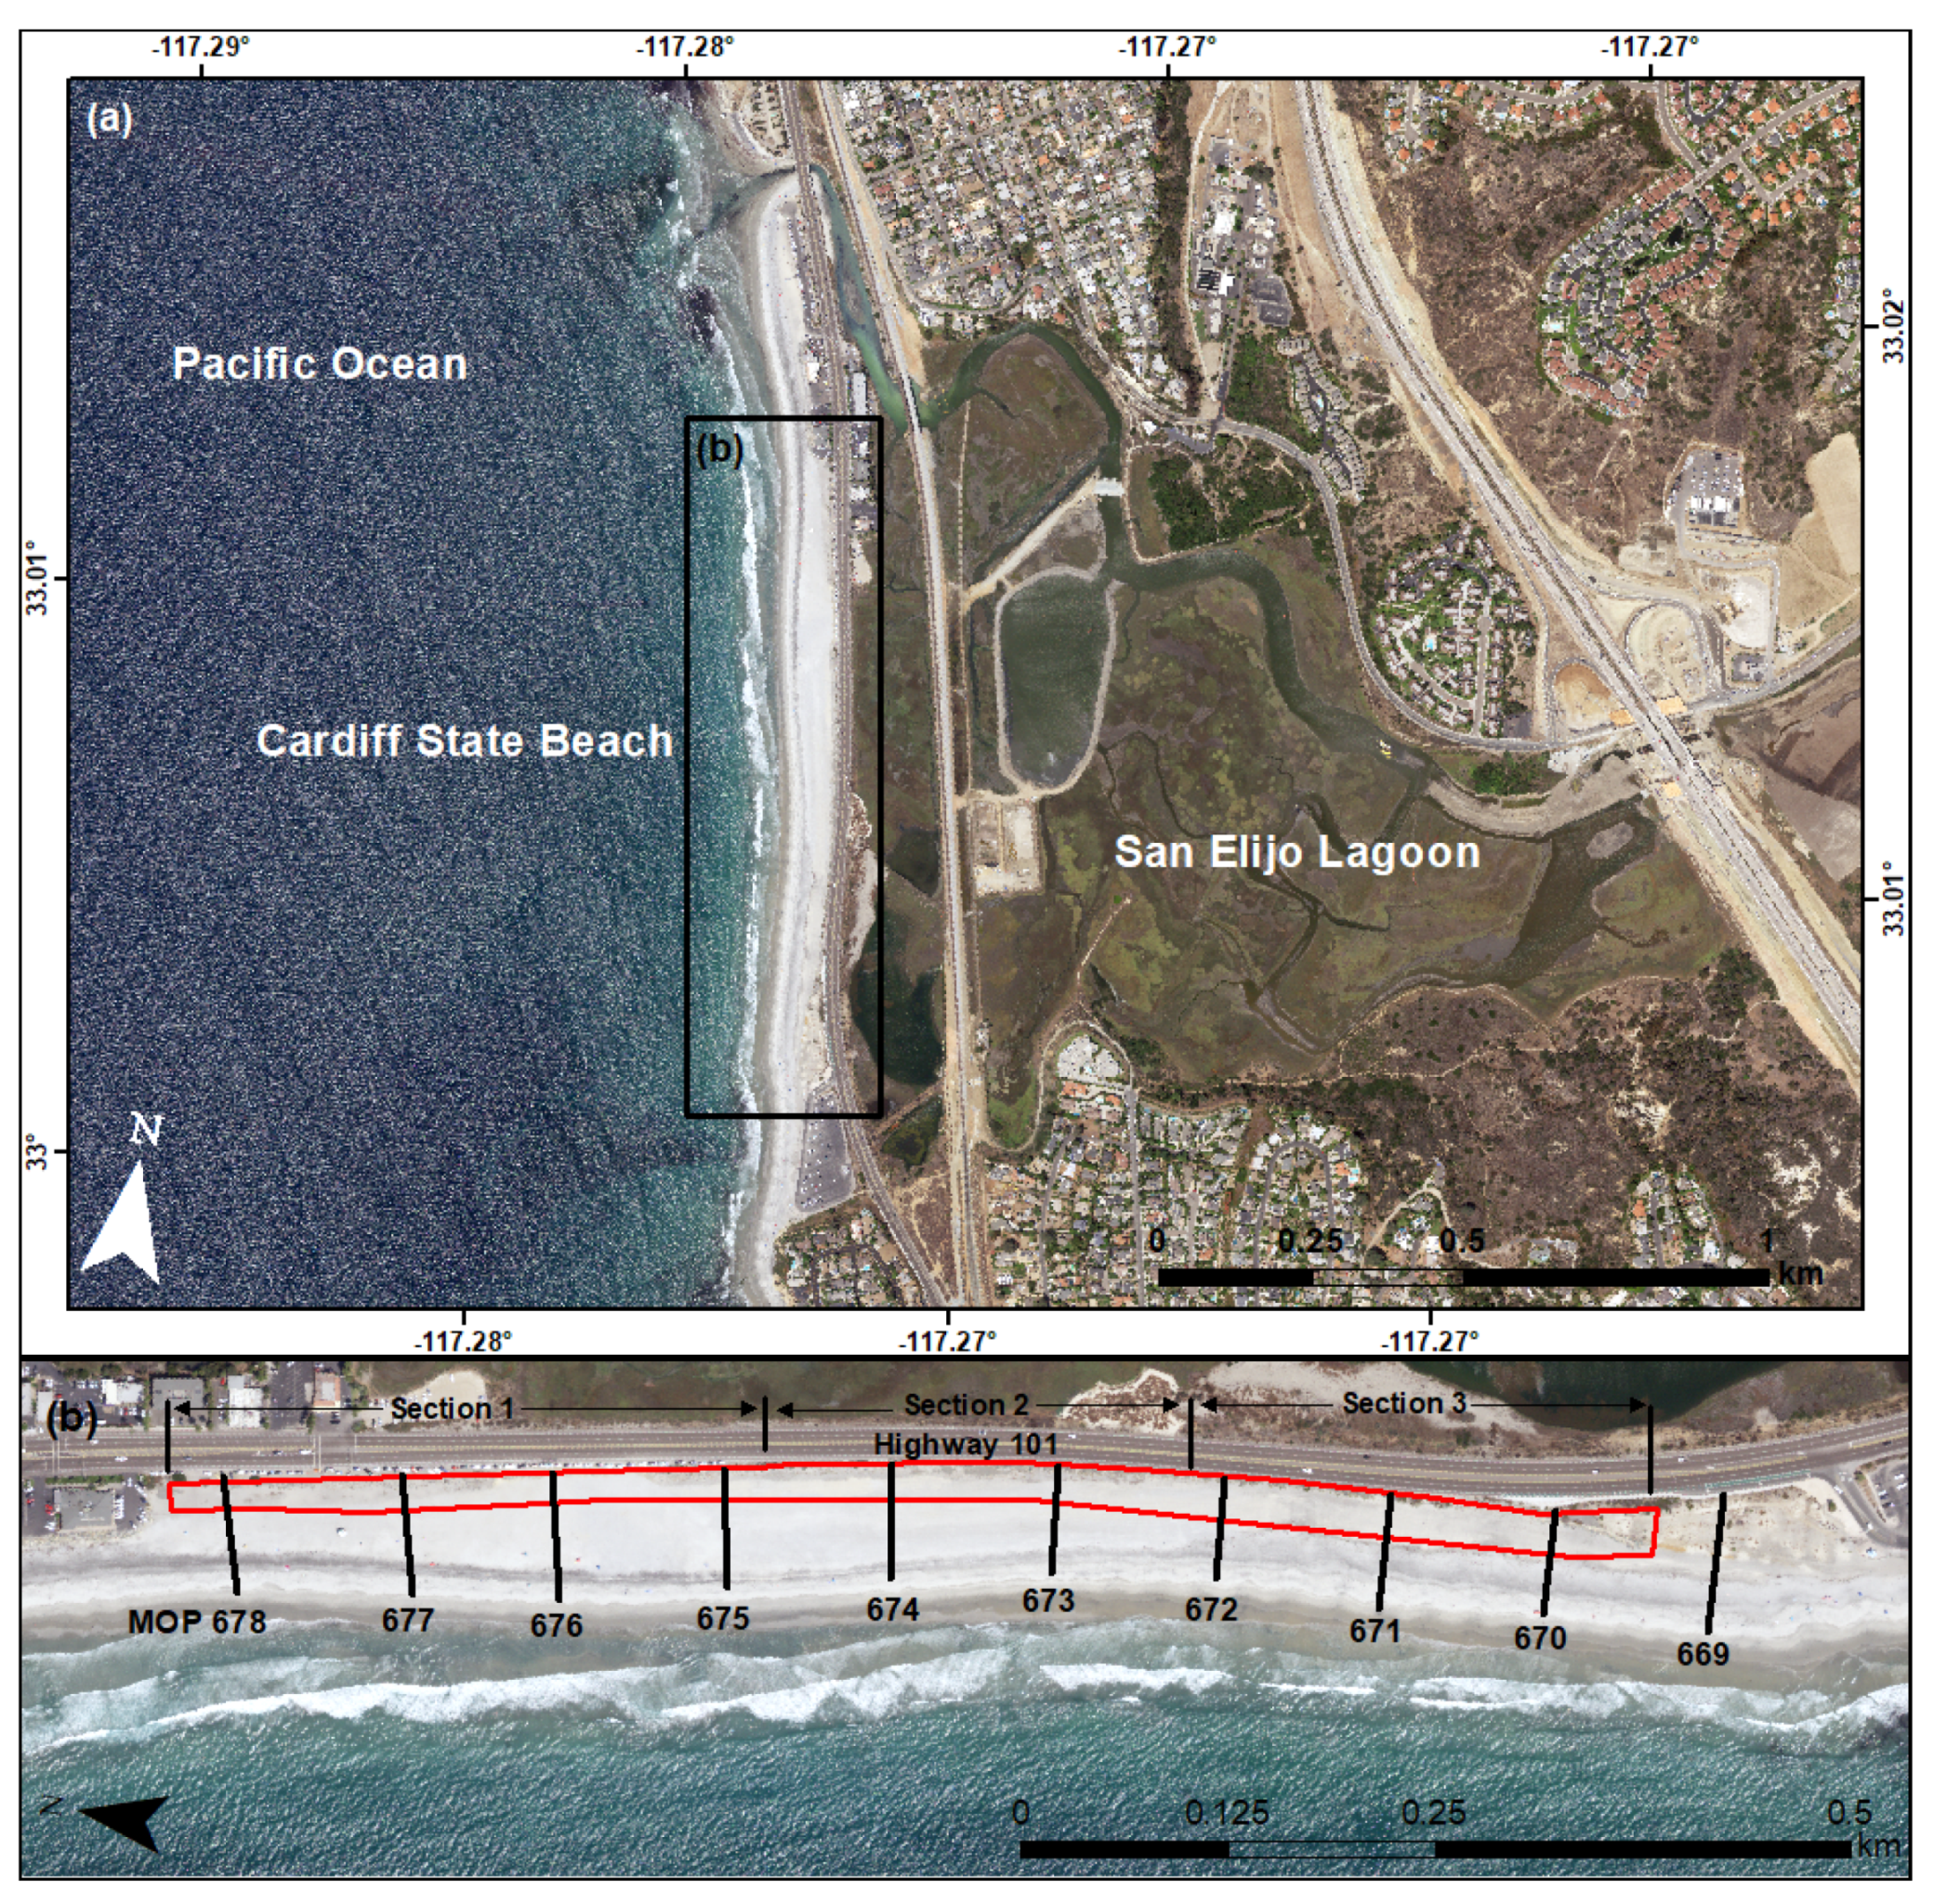
2.1. Site Description

Cardiff State Beach is a low-lying sand spit fronted by the Pacific Ocean and backed by San Elijo Lagoon located in northern San Diego County (Figure 1a). These low-lying lagoonal systems are prevalent along the West Coast and are particularly vulnerable to sea level rise [69]. Highway 101 along Cardiff State Beach (Figure 2) has been flooded and damaged numerous times from extreme wave events, coastal erosion, and high tides [70]. The highway serves as a critical coastal transportation artery and has been closed over 40 times during energetic wave events [70]. In Southern California, winter wave energy is primarily from storms originating in the Pacific Northwest ( 240 < D p < 320 ) with significant wave heights over 2 m and swell frequencies of 12–18 s [71]. The California State Coastal Conservancy and Ocean Protection Council were the principal funders of a large living shoreline project intended to protect Highway 101 until 2050, serve as a sea-level rise adaptation strategy, provide native dune habitat, and increase public access to the coast. The central protective feature is a novel hybrid sand-cobble-rock dune design. The dune is planted with native vegetation to limit aeolian transport, stabilize sediment, and enhance ecological productivity.

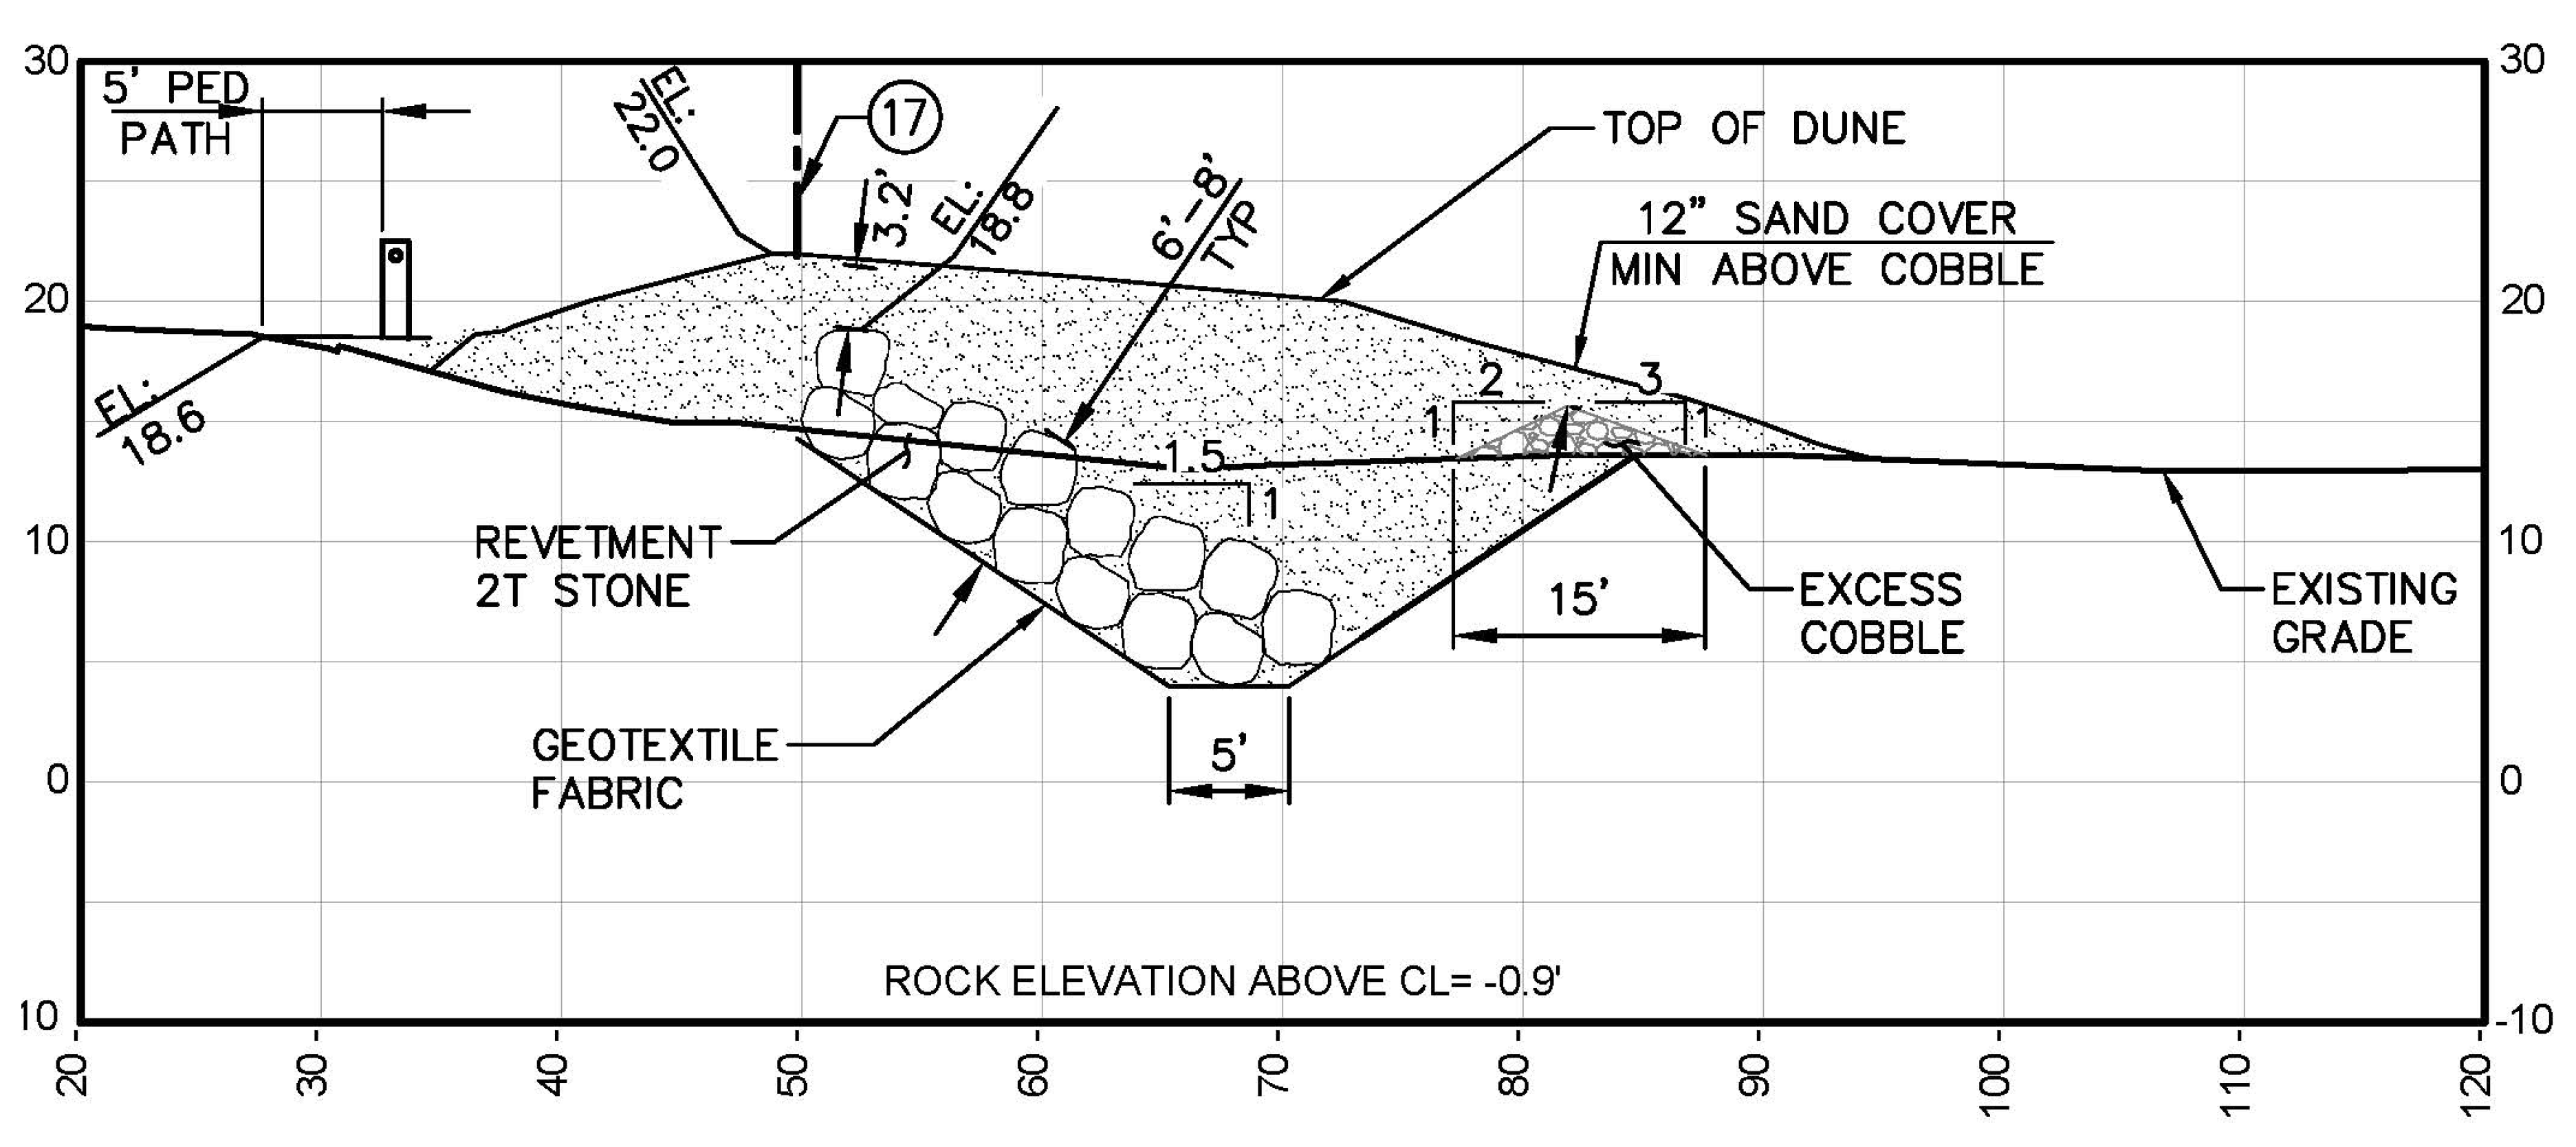
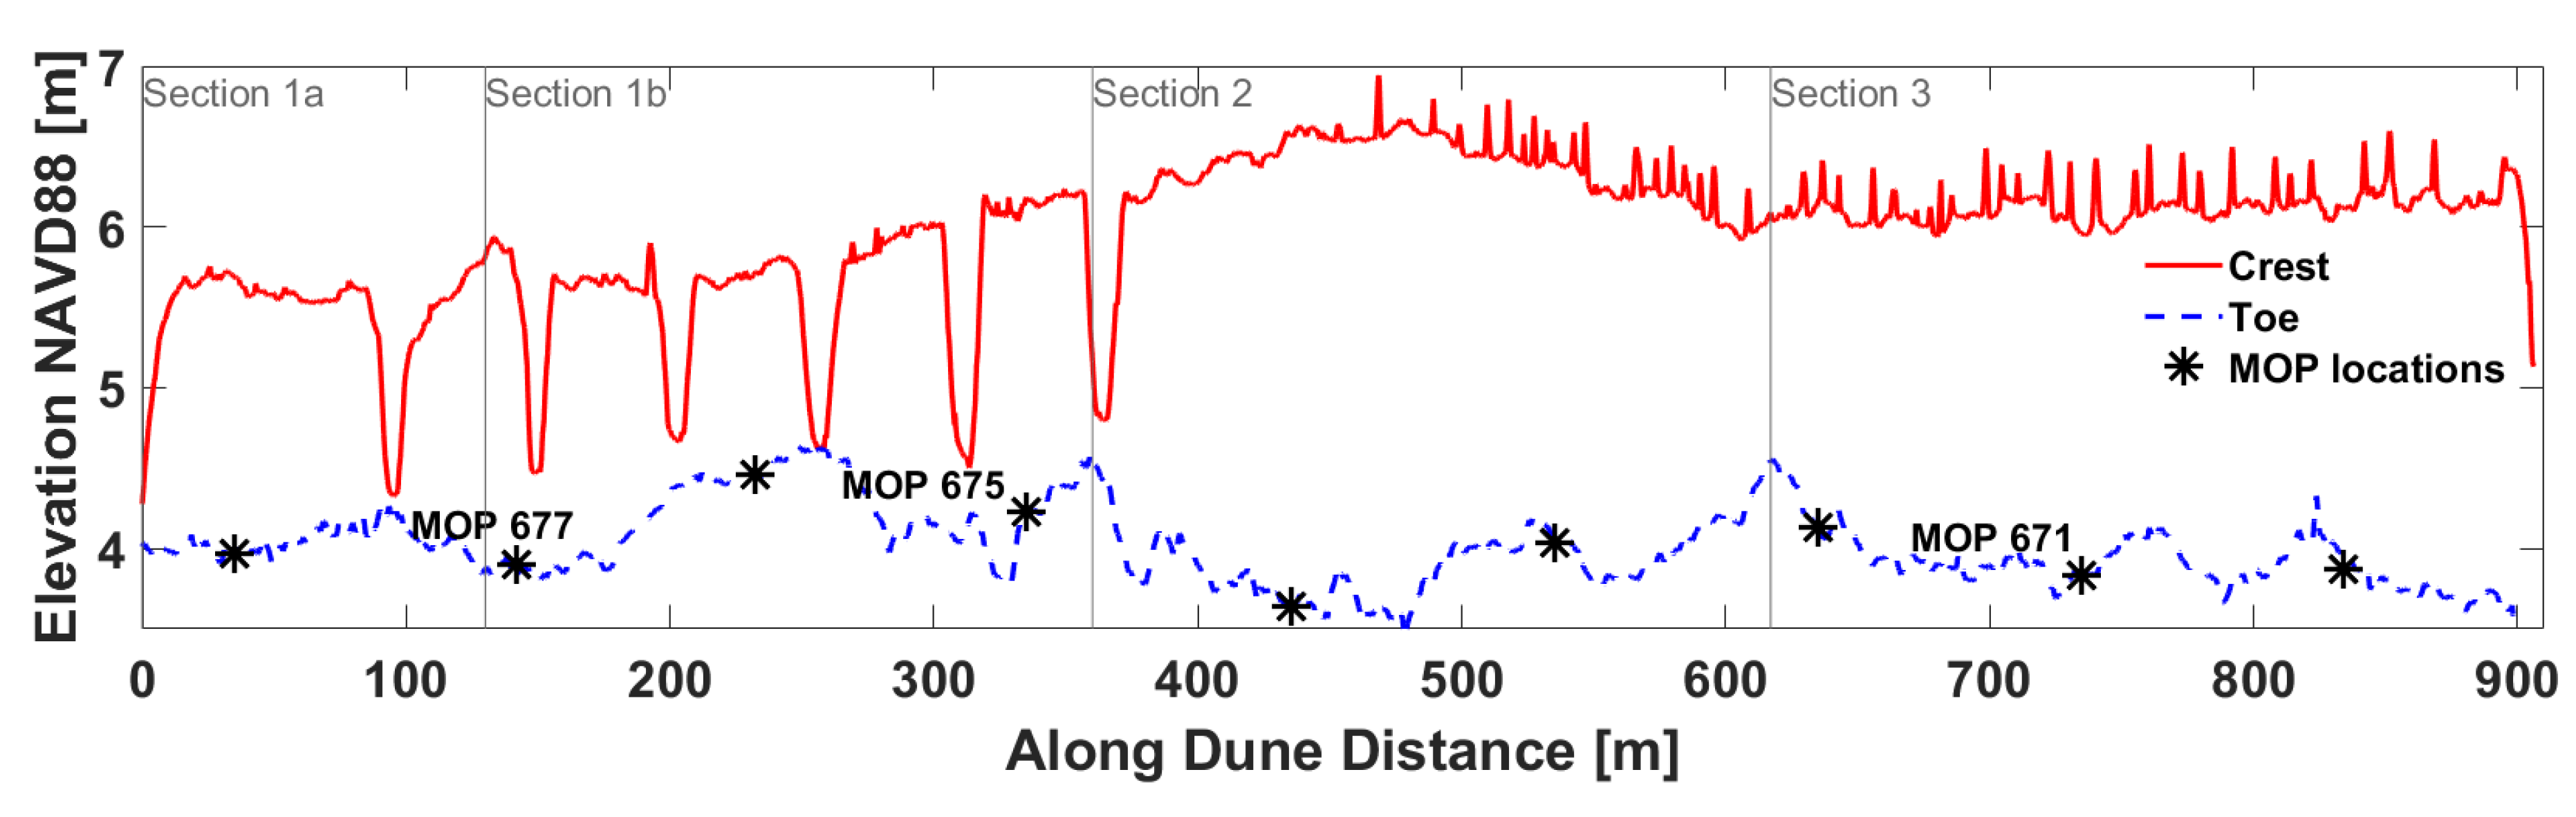
2.2. Dune Description

The hybrid dune consists of buried rip-rap (remnant and imported) topped by a sand berm with a toe comprised of native cobble. It was constructed between November 2018 and June 2019 in a series of four phases: 1a, 1b, 2, and 3 (Figure 1b). Each construction phase began with a trench excavation and placement of geotextile lining to limit sediment settlement. Buried rip-rap was placed on the landward slope of the trench into a revetment (Figure 3) and then filled with native dredged sand from the adjacent San Elijo Lagoon mouth. The rip-rap used for the revetment was a combination of existing rock (approximately 1.8 to 3.6 metric tons each), reuse of rock from a nearby source, and purchased quarry rock. Imported rock was sized to match the existing in-situ rock. The native sand grain size for San Elijo/Cardiff State Beach is approximately 0.16 mm [72]. The buried rubble-mound revetment was designed in accordance with the U.S. Army Corps of Engineers Coastal Engineering Manual and provides additional protection against undermining and flooding of Highway 101 should all top sand erode. A cobble berm was placed on top of this sand to serve as the toe of the dune (Figure 3). Similarly, the cobble toe behaves as additional fortification if the sand is removed during energetic events [70].
Finally, sand was placed atop revetment, sand fill, and cobble toe and contoured into mounds for planting native vegetation. In total, approximately 13,266 metric tons of rip-rap, 1682 m 3 of cobble, and 22,937 m 3 of native dredged sand was placed for the project.
Section 1 (Figure 1b), closest to parking at the northern entrance of the project, is characterized by a series of pedestrian access ways that run through the project, as well as native vegetation seeded from adjacent San Elijo Lagoon. The access ways are concentrated in the northern portion of the project to reduce foot traffic in the snowy plover nesting area further southward. Sections 2 and 3 (Figure 1b) were also seeded with native vegetation later after project completion. The goal of the planted vegetation is to prevent sand loss during overtopping events, promote aeolian accretion, and provide habitat. The entire project is backed by a sand fence adjacent to the highway to prevent wind-blown sand accumulation on the highway. Sand fences were also placed approximately every 15 m in section 1 and every 10 m in sections 2 and 3 in the southwest to northeast direction along the dune.

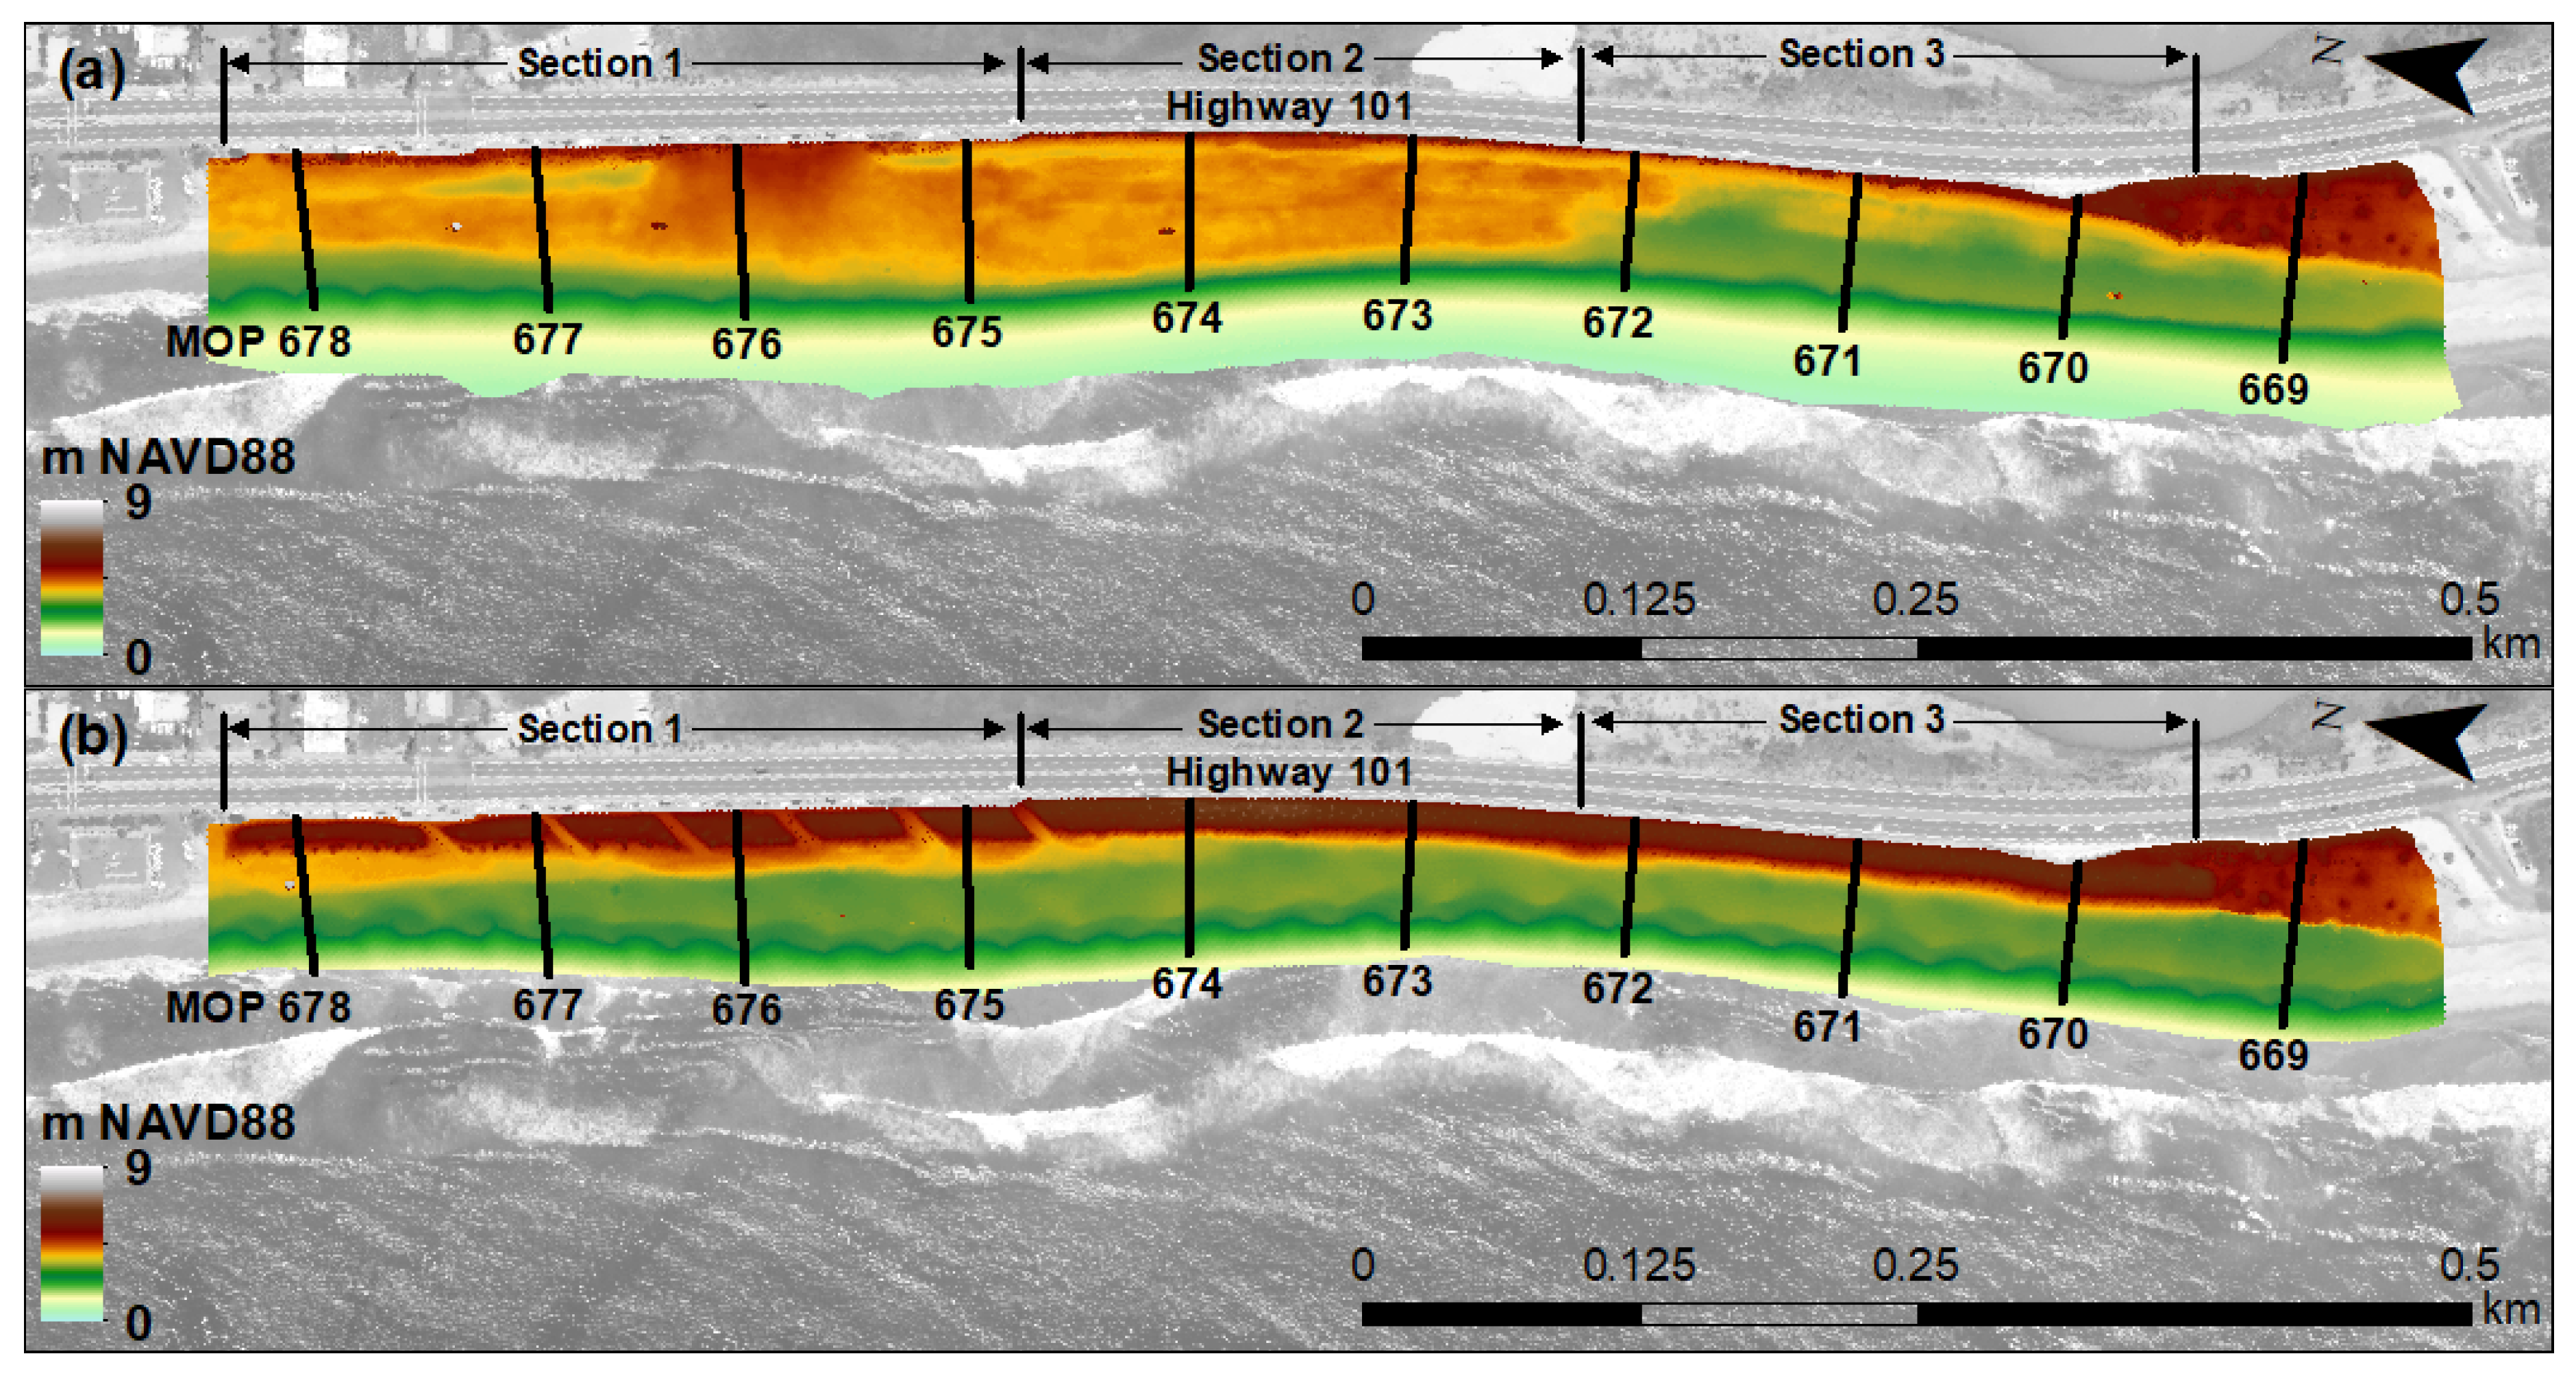
2.3. Beach Topography Observations

Beach and dune topographic data were derived from UAV photogrammetry to monitor project construction and seasonal sand volume changes. The surveys were conducted with the goal of capturing the spatial placement and volumes of each substrate placement during construction and seasonal beach and dune evolution. Data collected spans from October 2018 to April 2020, capturing the entire construction phase and two winter erosion seasons (Table 1). Obtaining internal substrate dimensions (placement and grain size dimensions) is critical to future numerical modeling efforts. One pre-construction survey (10/9/2018), fourteen construction surveys, and six post-construction surveys were conducted. Surveys post April 2019 captured the project’s evolution and performance during its first winter erosion season. The monitoring project is ongoing, with quarterly surveys and pre/post storm event surveys planned through 2024.
A DJI (SZ DJI Technology Company, Shenzen, China) Phantom 4 Pro UAV with a 20 million pixel camera was used to capture aerial images. UAV flight missions were planned with the free DJI GS Pro application (SZ DJI Technology Company, Shenzen, China) for Apple iPad mini 4. The flight was planned as a 3D Map Area mission type, with latitudinal and longitudinal image overlap both set to 80%, flight altitude set to about 73 m above ground level, and image acquisition frequency of about 0.5 Hz for each survey. The altitude was chosen to obtain a final data resolution of about 2 cm/pixel.
A ProMark 700 GNSS receiver was used to geolocate ground control points (GCPs) using network Realtime Kinematic (RTK) position corrections from Scripps Orbit and Permanent Array Center (SOPAC) SIO5 base with a baseline of ∼18 km. GCP density is approximately 3 GCP/hectare, higher than the 0.5 GCP/ha recommendation for generating highly accurate digital elevation models (DEM) and orthomosaics [73]. GCPs consist of 0.3 by 0.3 m wooden panels with a 2.54 by 2.54 cm center to easily identify and mark in images during photogrammetric processing.
Structure-from-motion (SfM) software was utilized to generate topographical data products (e.g., DEMs) from UAV imagery data. Automatic photogrammetric image processing was conducted using Pix4Dmapper (version 4.4.12) software, from which georectified point clouds, orthomosaics, and digital elevation models were produced from the raw UAV images and ground control point x, y, z information (Figure 4 and Figure 5). GNSS GCPs were used to improve geolocalization accuracy and were imported into Pix4D, where the centers of each were manually identified in each UAV image they appeared. Pix4D utilizes binary descriptors to photo-match points [74]. The matched points are then used, along with the image positions and orientations, to obtain the exact position (three-dimensional coordinates) and orientation of the UAV camera for every image. The three-dimensional points (point clouds) are interpolated to then form a triangulated irregular network (TIN), from which the digital elevation model and orthomosaic are obtained [74]. The orthomosaic and DEM resolutions average about 2 cm 2 per pixel, with a projected coordinate system of WGS 1984 UTM Zone 11N, North American Vertical Datum of 1988 (NAVD88). All elevation values here, from both UAV-derived elevation products and water levels, are referenced to NAVD88 unless otherwise specified.
CloudCompare 2.11.1 Anoia, an open source 3D point cloud and mesh processing software, was utilized to clean and filter data sets with significant vegetation. ESRI (Redlands, CA, USA) ArcMap 10.5 and 10.6 was utilized to inspect and analyze DEMs to obtain spatial placement of each substrate, to determine dune characteristics (length, crest height, toe locations) and to determine beach and dune sand volume changes. The crest and toe were delineated through visual and slope analysis in ArcMap. The elevation gradient, or slope, of each cell of the DEM were calculated in ArcMap, and the dune toe was identified where the beach slope transitioned from approximately 1 degree to 6 degrees. Additionally, the flow direction from each DEM cell to its steepest downslope neighbor was calculated with the “Flow Direction” tool in ArcMap [75].
The dune crest was identified at the interface of the west and east flow directions. Delineation of dune geometries is required to assess vulnerability of the project to runup, overtopping, and high total water levels (TWLs), as well as to monitor erosion and movement of dune features. Autodesk (San Rafael, CA, USA) AutoCAD 2020 was utilized to inspect and compare construction as-built data obtained as each portion of the dune was constructed (trench, revetment, cobble, sand).

2.4. Vulnerability Assessment: Maximum Water Level and Wave Runup Estimates

The study site’s vulnerability to 50 and 100-year water level events, both pre- and post-dune construction, was evaluated by estimating total water levels (TWL) from open coast water levels and wave runup estimated using the formulation from Stockdon et al. (2006). R 2 % has been previously field validated [76,77,78], and widely employed in coastal hazard assessments (e.g., [9,78,79,80,81,82]). Equation (1) shows the 2 % exceedance of wave runup [76], where β is the slope, H 0 is the deep water significant wave height, and the deep water wave length, L 0 = g / 2 π f p 2 , is computed from the peak frequency, f p .
R 2 % = 1.1 0.35 β H 0 L 0 0.5 + [ H 0 L 0 ( 0.563 β 2 + 0.004 ) ] 0.5 2
Total water level is defined as the sum of the nearest the NOAA tide gauge (La Jolla, CA, USA, 9410230 [83]) observed water levels (OWL) and R 2 % and is given by,
T W L = O W L + R 2 %
Hourly significant wave heights and peak frequencies at the 10 m depth were estimated from a 61-year wave hindcast obtained from the United States Geological Survey [84]. Pre-construction beach foreshore slopes and crests were estimated from 10 years of monthly Cardiff State Beach topography data collected by Scripps Institution of Oceanography [72]. Both wave hindcast and beach elevation values were estimated along ten shore-normal transects at existing Monitoring and Prediction (MOP) profiles established by Scripps Institution of Oceanography Coastal Data Information Program (CDIP) program [85]. The MOP profiles, here MOP D0669 through MOP D0678 (referred as MOP 669 to MOP 678 in this study), are spaced every 100 m alongshore, from the southern to northern end of the project site, as shown in Figure 1b. Annual and seasonal mean foreshore slopes of each of the ten MOP lines were calculated from 0 m NAVD88 (∼MLLW) to the beach crest. Slopes of profile data that did not reach 0 m NAVD88 were calculated from the closest available point. Seasonal foreshore slopes were used to calculate total water levels in each corresponding season.
Hourly total water levels were estimated for MOP profiles 669 to 678 from 1948 to 2008, and annual maxima extracted. These annual maxima were fit to the Generalized Extreme Value (GEV) distribution to minimize the negative log-likelihood (e.g., [79,86,87]). The GEV distribution can be utilized to statistically model and estimate the probability of extreme events [88] and has been widely used to quantify the frequency of extreme wave and total water level events [9,86,89,90,91,92]. Specifically, the GEV distribution should be used to estimate extreme water levels along open-coastlines such as the Pacific [79,86]. The annual maxima (n = 61) were fit to the GEV distribution minimizing the negative log-likelihood to estimate the 50- and 100-year TWL values.
The number of storm events, defined as consecutive hourly TWL events that occurred less than 72 h apart, that exceeded the pre-construction annual mean beach crest and post-construction dune crest were calculated, as well as the number of TWL events that reached and therefore would interact with the post-construction dune toe. These hourly total water levels were then estimated with the addition of sea-level rise. Sea-level rise projections from the Intergovernmental Panel on Climate Change (IPCC) for representative concentration pathway (RCP) 4.5, a moderate projection, and RCP 8.5, an extreme projection with little reductions in carbon emissions, were utilized [6]. The 61-year TWL time series, assuming wave stationarity, was superposed on the RCP 4.5 and 8.5 sea-level rise curves from 2020 to 2080 to obtain a projected TWL time series. Annual maxima and hourly TWL values were compared with dune toe and crest elevations to assess backshore vulnerability.

3. Results

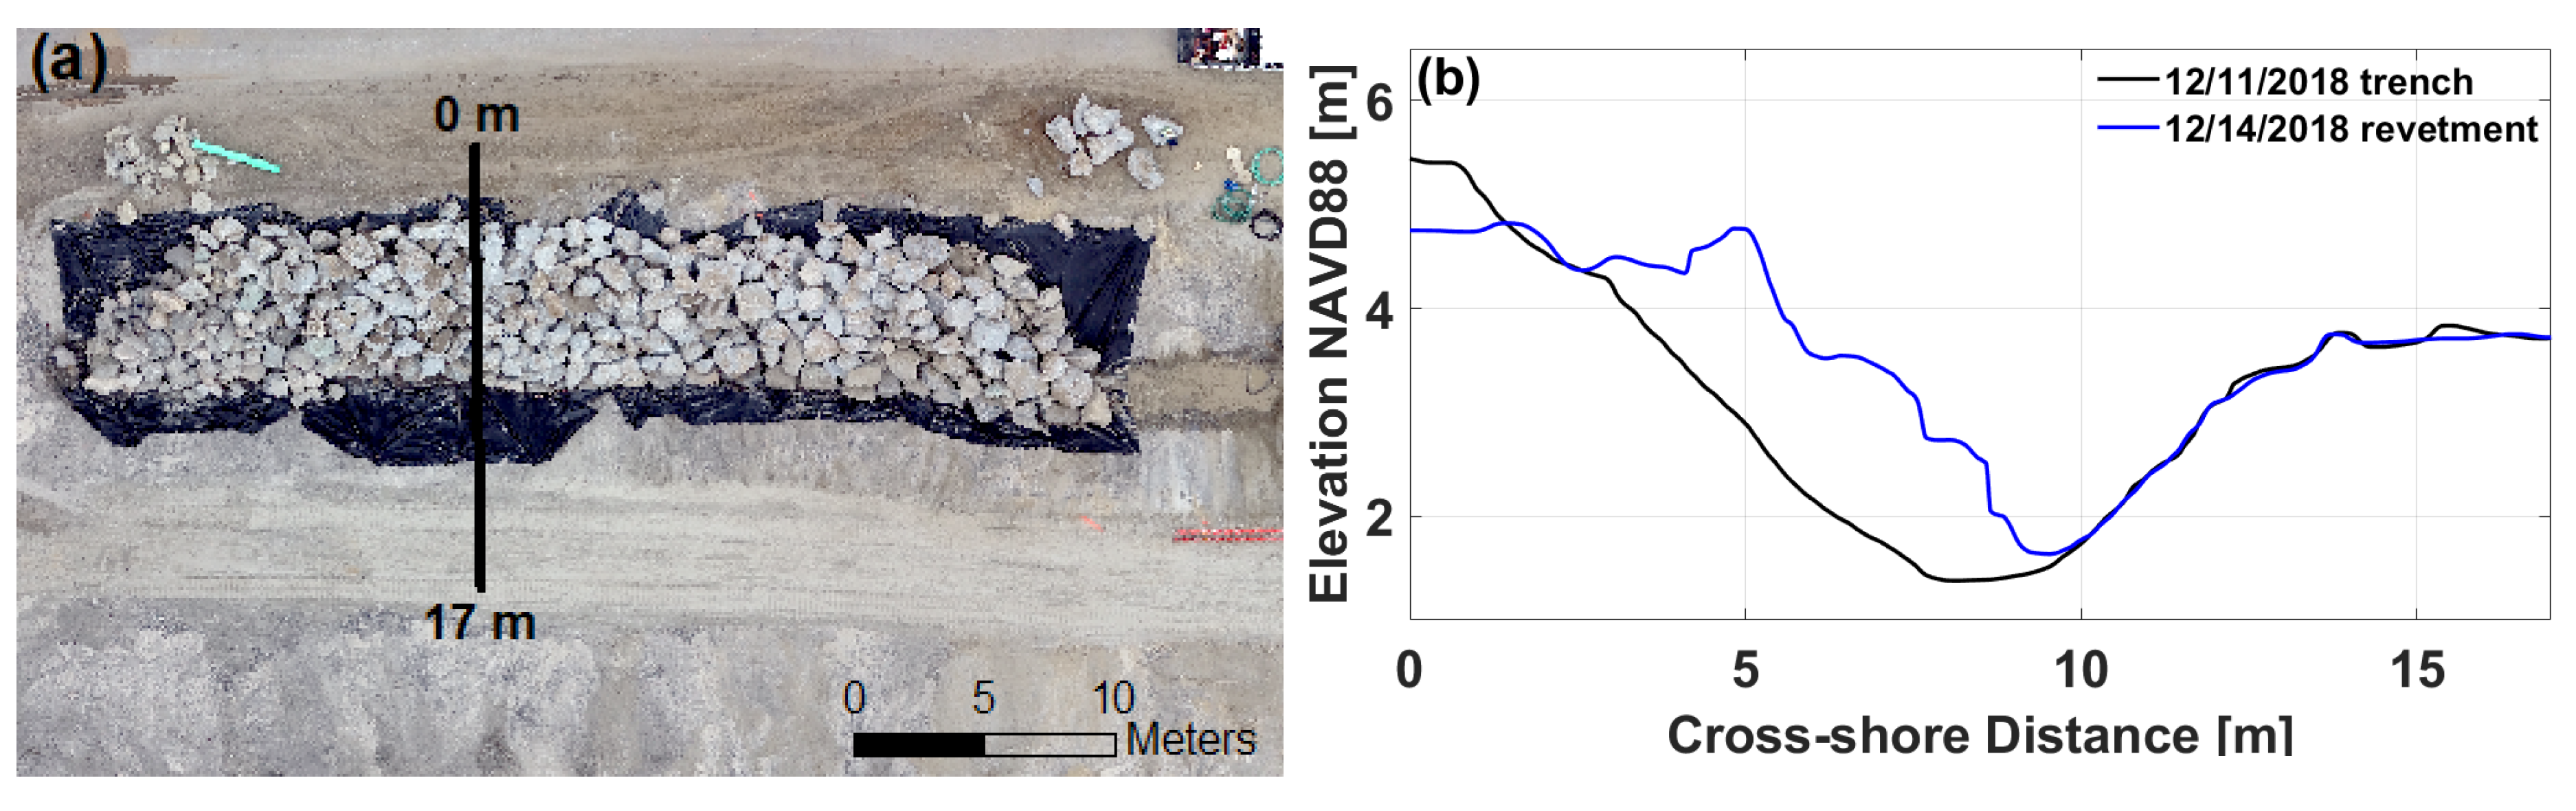
3.1. Substrate Placement Observations and Volume Determination
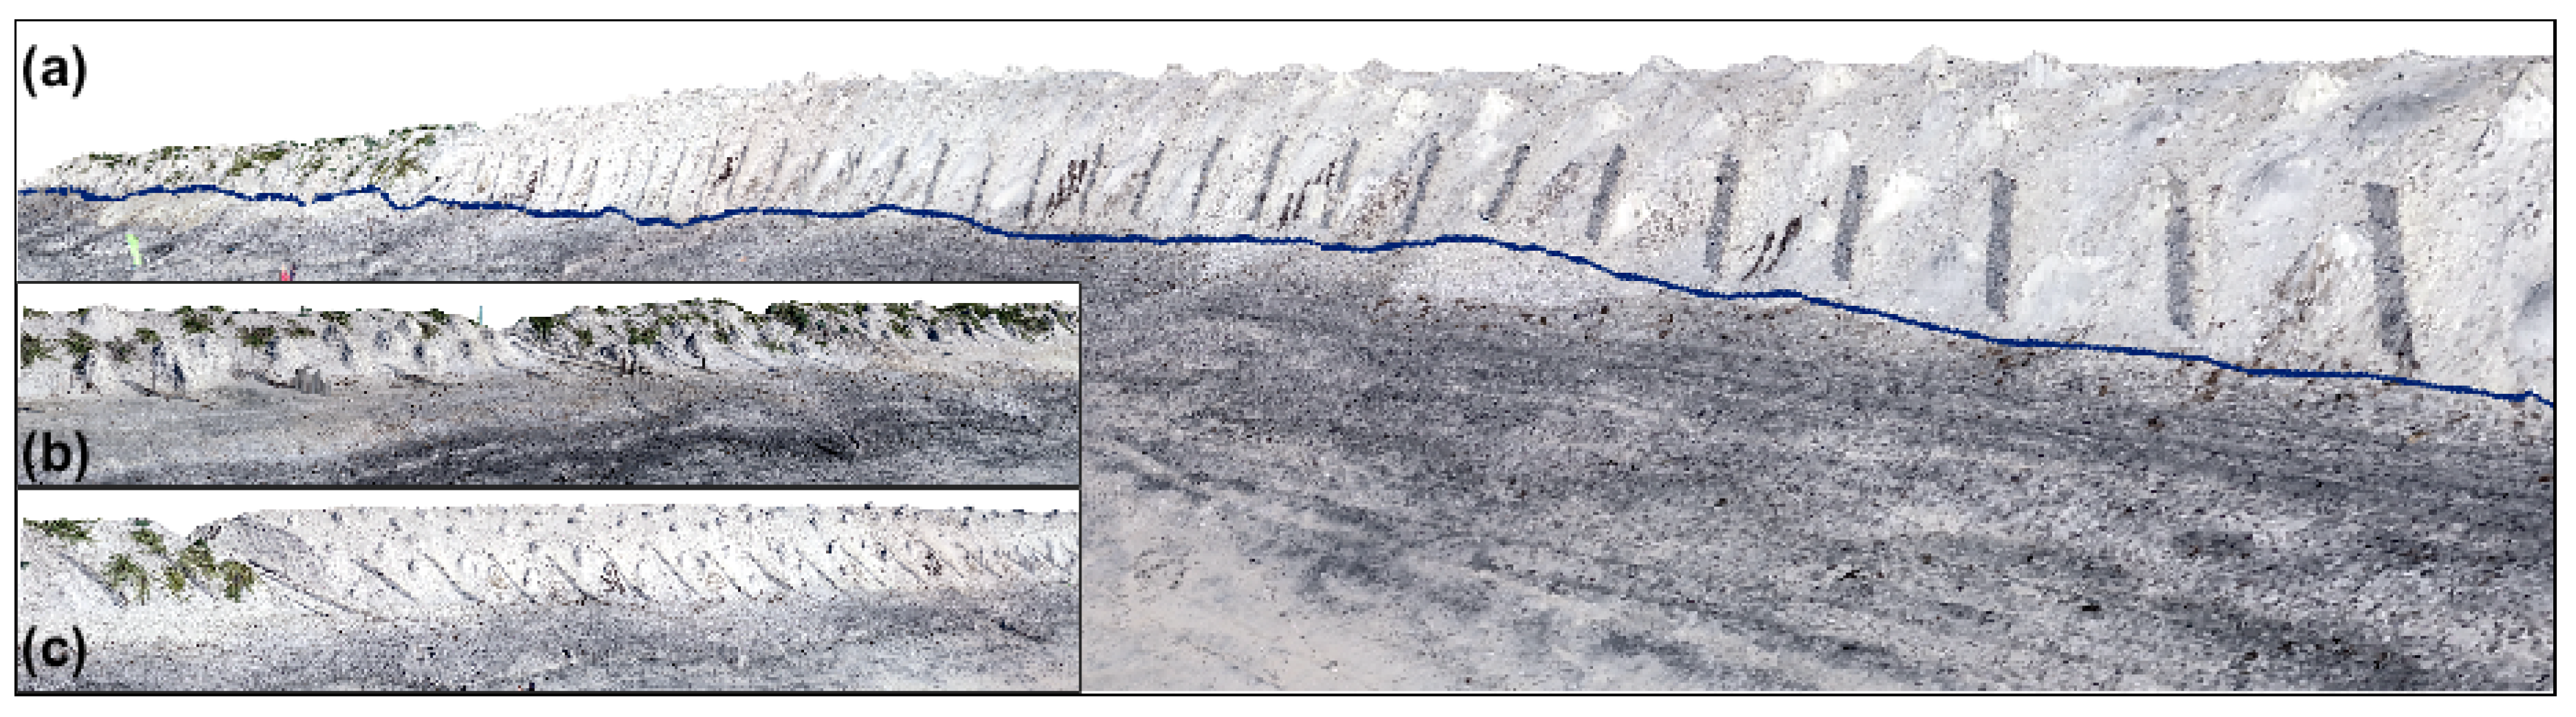
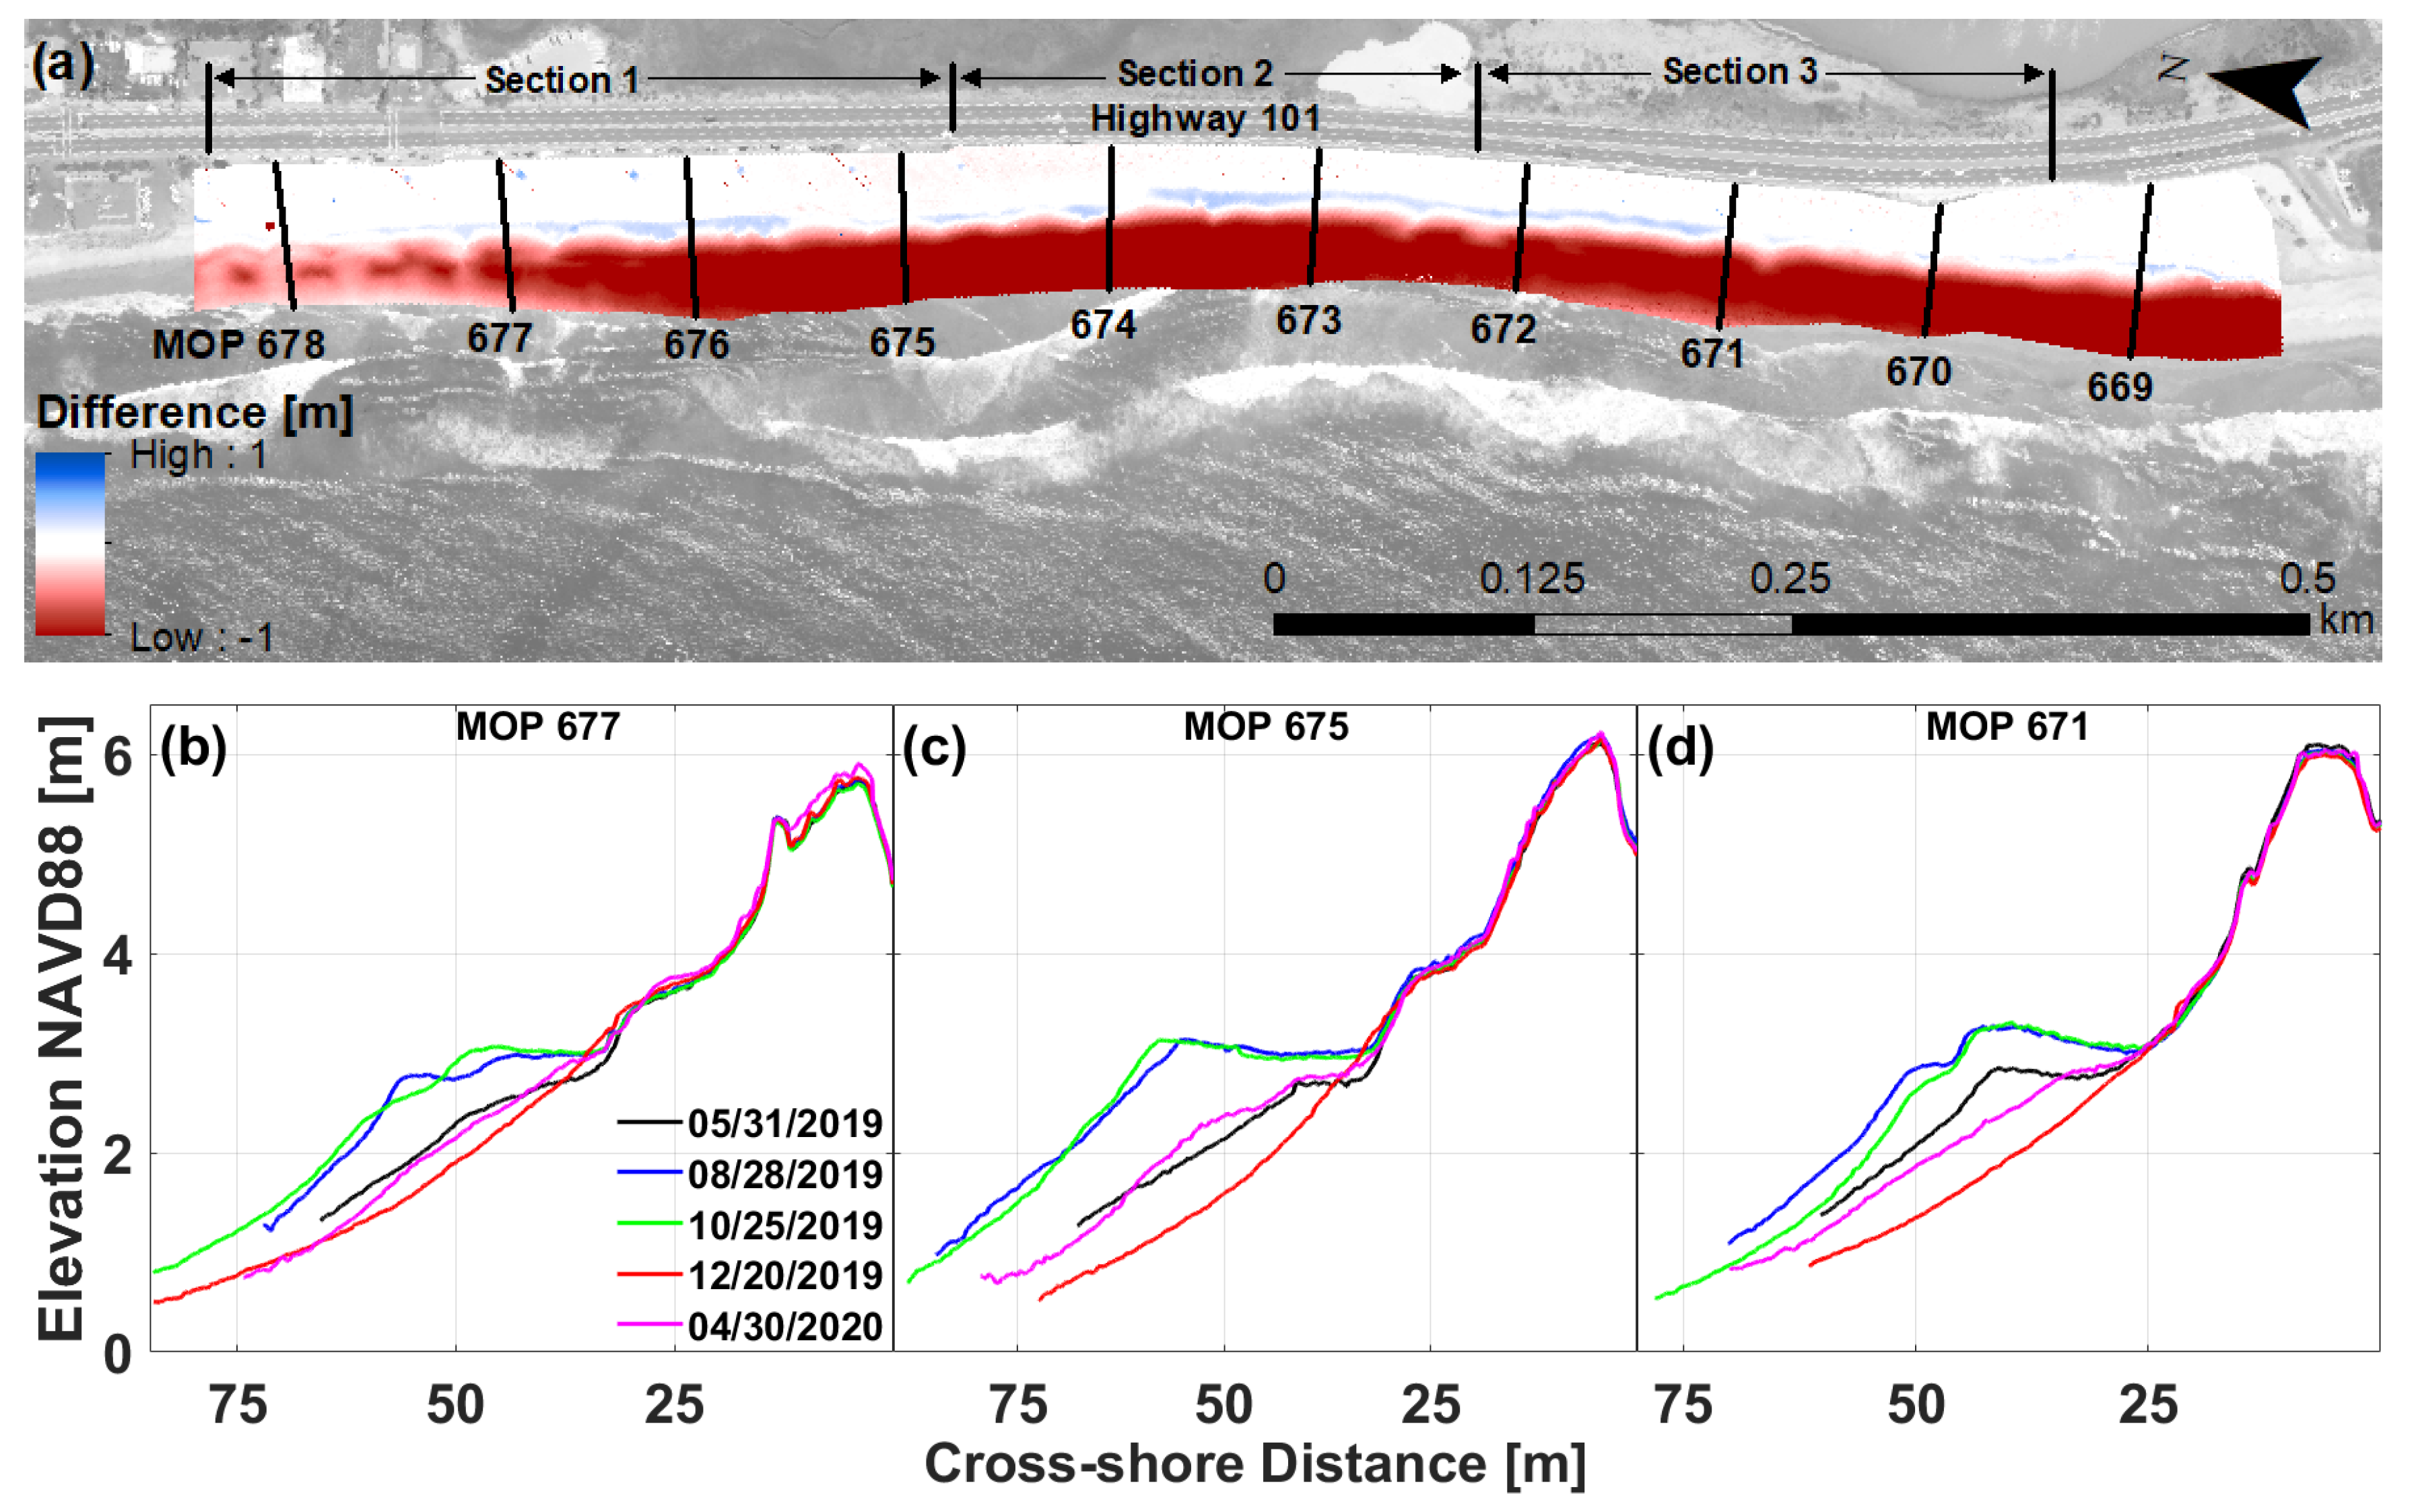
Manual inspection of both orthomosaics and DEMs derived from data collected during project construction determined the percentage of captured completed placement of each substrate. The UAV surveys captured about 30% of the completed trench creation, 34% of the completed revetment placement, and 41% of the completed cobble toe placement. Only in one area, approximately 183 m south from the project start in section 1, the UAV surveys captured all three completed phases: trench, revetment, and cobble. The UAV-derived orthomosaics and DEMs provide detailed information (e.g., rock volume, grain size) beyond the in-situ construction survey points taken at 3–8 m intervals. For example, Figure 6 shows the exact cross-shore placement and rock size of the buried rip-rap.

3.2. Dune Evolution

The final dune topography immediately post-construction is shown in Figure 4 and Figure 5. It is approximately 900 m in length, with the crest varying from about 5.5 m in section 1 to 6.5 m in sections 2 and 3 (Figure 7). The dune toe elevation is about 4 m across the length of the dune (Figure 7). Six full-beach photogrammetric UAV surveys were conducted post-construction to monitor topographic changes. From August 2019 to April 2020, the dune experienced negligible change, while the upper beach (∼2–3 m NAVD88) experienced typical winter erosion (Figure 8a). Elevation change analysis was conducted on cross-shore profiles every 100 m along the beach, and three were selected to illustrate the range of changes. The northernmost profile, MOP 677, experienced the least erosion (Figure 8b), while MOP 675 experienced the most foreshore erosion, with the 2 m contour moving about 25 m landward (Figure 8c). Significant vegetation is observed in section 1, with profile MOP 677 experiencing about 11 cm of dense vegetation growth between December 2019 and April 2020 (Figure 8b).
Additionally, the UAV-derived data captured the formation of gullies during intense, short-period rainstorms that passed over San Diego. The storm water discharge from Highway 101 overflowed the raised curb separating the highway from the walkway, eroding gullies in the access ways and exposing the buried revetment (Figure 9a). The cause of gully formation was most likely due to voids and settlement of the revetment underneath. Gully depth and extent were resolved by the UAV-derived DSM, and most gullies reached a depth of about half a meter (Figure 9b).

3.3. Vulnerability Assessment

MOP transects 671 and 677 were previously identified (i.e., historical reports of wave overtopping and erosion) as profiles of interest to explore potential sea level rise vulnerability. MOP 671 is located in a wave focusing area and has the lowest annual mean beach crest height pre-construction of all ten profiles, and MOP 677 is a region of the beach historically known to overtop and flood Highway 101. The time-averaged beach crests pre-construction of MOP 671 and 677 are 3.16 and 3.85 m NAVD88, respectively. Sixty annual maximum TWL values exceeded the MOP 671 mean beach crest and 38 exceeded the MOP 677 mean beach crest value (Figure 10). Post-construction, the dune crest at MOP 671 and MOP 677 was 6.04 and 5.75 m, respectively, and no annual maximum TWL values exceed these dune crest values (Figure 10).
The TWL value associated with the 50-year and 100-year return periods derived from the generalized extreme value (GEV) distribution for MOP 671 are 4.73 and 4.87 m NAVD88, respectively (Figure 10). These values for MOP 677 are 5.06 and 5.21 m NAVD88, respectively (Figure 10). The new dune’s crest heights are substantially higher than the 100-year event (Figure 10).
TWLs are expected to interact with the dune toe (i.e., ‘collision regime’ [93]). Schubert et al., 2015 [94] and Gallien et al., 2015 [24] suggested that dune failure may occur through sustained dune toe interaction without ever overtopping the dune. The dune toe values for MOP 671 and 677 are 3.83 and 3.90 m NAVD88, respectively (Figure 7 and Figure 10). Results suggest that with the superposition of sea level rise from 2020–2080, the dune toe would interact with water levels for a total of 268 h at MOP 671 and 508 h at MOP 677, or 4.4 and 8.3 h per year on average, respectively.

4. Discussion

Ideally, UAV surveys capture each substrate placement immediately after completion before beginning placement of the next substrate. This allows the exact volume and placement of rip-rap, cobble, and sand to be extracted along the entire project if needed for hydrodynamic and morphological modeling. However, due to a constantly-evolving construction schedule, placement of the next substrate would begin before completion of the previous substrate. The UAV surveys were able to capture individually completed substrates in certain portions along the project; however, portions missing this information need to be supplemented with construction drawings and in-situ as-built data to derive trench, revetment backing, cobble toe, and sand fill placement and volumes.
The first winter season was relatively quiescent from a wave energy perspective. Although the living shoreline crest height is substantially above the expected stationary 100-year total water level event, this does not imply the dune may not experience substantial erosion. Critically, a dune may fail from sustained collision through mass wasting (i.e., notching, undercutting, avalanching) (e.g., [24,93,94,95,96]). If the 61-year TWL time series were repeated and projected from 2020 to 2080 (refer to Section 2.4), the dune toe would interact with the TWL on average about 4.4 h/year at MOP 671 and 8.3 h/year at MOP 677 at current sea levels (Figure 11). This would represent approximately 2–4 erosive storm events per year. From a management perspective, this level of exposure would likely be tractable. Periodic San Elijo lagoon mouth beneficial dredging reuse as dune renourishment would be able to augment the beach–dune system subsequent to energetic winters. However, as sea levels increase, dune toe-swash interaction increases exponentially (Figure 11), which has significant dune management implications. Even at RCP 4.5, by 2050 and 2070, the collision regime is 10–20 h/year for both MOP profiles (Figure 11). If this set of ∼5–10 storms arrived in succession during an active winter season, dune maintenance may be impossible and lead to substantial erosion or breaching. At 2070, fifty years from project construction, the more extreme sea-level rise scenario RCP 8.5 increases the average interaction hours to about 30 h/year (Figure 11). Notably, this analysis considered only sand elevation. Substantial vegetation is present on section 1 of the dune that may promote resilience beyond the sand structure alone.
Although this study does not conduct an initial sand erosion modeling assessment, accurate morphological modeling is critical to evaluating the dune’s evolving vulnerability. Here, the projected collision hours were determined, but the number of hours it can sustain before failure is unknown, especially in combination with the buried cobble toe and rock revetment. The buried cobble berm toe may provide additional erosion protection and stability, and even as sand erodes, the berm could potentially migrate landward and continue providing protection [29,30,31,35]. Notably, the cobble and rock create large void spaces, which enhance infiltration processes, limit erosion and potentially stabilize the dune toe and sand covering (e.g., [97]). The buried revetment backing the structure may also provide additional erosion and overtopping protection [17,40,98]. Morphodynamic modeling of the cobble and rip-rap components of this structure will prove challenging, as current numerical models such as CSHORE [40,99], XBeach [100], and XBeach-G [31] can model buried, impermeable structures and coarse-grained barrier beaches, but cannot model the combined movement of both rock/gravel and sand.

5. Conclusions

Fifteen topographic unmanned aerial vehicle (UAV) surveys were conducted to observe each construction phase and its individual components (rock, cobble, sand) for future numerical modeling studies. Multiple post-construction surveys (mean lower low water to Highway 101) have been completed and four additional years of quarterly and storm erosion surveys are scheduled to examine beach–dune system evolution and living shoreline performance. UAV surveys are able to quantitatively capture the internal dune structure; however, depending on construction scheduling this may sometimes be impossible.
Overall, seasonal beach change was typical for the region, and the dune topography was relatively unchanged from May 2019 to April 2020 (see Table 1). Notably, however, the winter was not particularly energetic and the beach was nourished, and therefore artificially wide, prior to dune construction. Foreshore and dune erosion are anticipated if energetic wave events coincide with high tides. Significant vegetation is developing on the dune profile and will likely increase the living shoreline’s resilience. The hybrid dune structure significantly decreased backshore marine flood vulnerability. However, in precipitation events, the landward side of the dune was impacted by storm water runoff. Gullies formed from rapid infiltration of surface water and required emergency maintenance. Additional landward hydrology studies are underway to improve storm water drainage.
There is a complete paucity of design guidance for and observations of these novel hybrid dune structures. Comprehensive assessments of engineered living shorelines are needed to understand the physical dynamics of complex hybrid dunes and expected resilience conferred by various design elements (e.g., vegetation, sand, cobble, rock). This requires both high spatiotemporal observations and fundamental morphodynamic model development and validation. Large scale flume and field observations are urgently needed to investigate multi-scale physical processes and develop critical validation datasets. Physics-based hydromorphodynamic model development that can resolve both small and large grain motion (e.g., SedWaveFoam [101], XBeach-G [31], respectively) is fundamental to future hybrid structure design and assessment.

Author Contributions

M.A.W. collected and processed all geospatial data, created figures and authored the manuscript. B.L. led the design of the structure. E.B.S. was instrumental in the conceptualizing, coordinating and building of the living shoreline project, T.W.G. conceptualized and funded the project, authored text, and edited the manuscript and figures. All authors have read and agreed to the published version of the manuscript.

Funding

This research was funded by the California Coastal Conservancy under Grant Number 17-005. The UCLA Cota-Robles fellowship provided partial graduate student support.

Acknowledgments

The City of Encinitas, Kathy Weldon (former Coastal Manager for the City of Encinitas), Jayme Timberlake (Coastal Manager for the City of Encinitas), Darren Smith (California State Parks), Connor Ofsthun (Moffatt & Nichol), Robert Patton and West-Tech Construction were instrumental in site access and facilitating surveys. Burson Tang, Marie-Pierre Delisle, Joseph Lucey, Nikos Kalligeris, Yeulwoo Kim and CEE 129L students participated in field observations that made this manuscript possible. Moffatt and Nichol and GHD provided dune design information and facilitated construction survey coordination. Bradley Nussbaum (The Nature Collective) and Carolyn Lieberman (U.S. Fish and Wildlife Service) provided information on plant palette. The authors would like to thank the anonymous reviewers who provided feedback on this manuscript.

Conflicts of Interest

The funders had no role in the design of the study; in the collection, analyses, or interpretation of data; in the writing of the manuscript, or in the decision to publish the results.

References

  1. Yin, J.; Griffies, S.M.; Stouffer, R.J. Spatial variability of sea level rise in twenty-first century projections. J. Clim. 2010, 23, 4585–4607. [Google Scholar] [CrossRef]
  2. Watson, C.S.; White, N.J.; Church, J.A.; King, M.A.; Burgette, R.J.; Legresy, B. Unabated global mean sea-level rise over the satellite altimeter era. Nat. Clim. Chang. 2015, 5, 565–568. [Google Scholar] [CrossRef]
  3. Horton, B.P.; Rahmstorf, S.; Engelhart, S.E.; Kemp, A.C. Expert assessment of sea-level rise by AD 2100 and AD 2300. Quat. Sci. Rev. 2014, 84, 1–6. [Google Scholar] [CrossRef]
  4. Kopp, R.E.; Horton, R.M.; Little, C.M.; Mitrovica, J.X.; Oppenheimer, M.; Rasmussen, D.J.; Strauss, B.H.; Tebaldi, C. Probabilistic 21st and 22nd century sea-level projections at a global network of tide-gauge sites. Earths Future 2014, 2, 383–406. [Google Scholar] [CrossRef]
  5. Wong, P.P.; Losada, I.J.; Gattuso, J.P.; Hinkel, J.; Khattabi, A.; McInnes, K.L.; Saito, Y.; Sallenger, A. Coastal systems and low-lying areas. In Climate Change 2014: Impacts, Adaptation, and Vulnerability. Part A: Global and Sectoral Aspects. Contribution of Working Group II to the Fifth Assessment Report of the Intergovernmental Panel on Climate Change; Cambridge University Press: Cambridge, UK; New York, NY, USA, 2014; Volume 2104, pp. 361–409. [Google Scholar]
  6. Church, J.A.; Clark, P.U.; Cazenave, A.; Gregory, J.M.; Jevrejeva, S.; Levermann, A.; Merrifield, M.A.; Milne, G.A.; Nerem, R.S.; Nunn, P.D.; et al. Sea level change. In Climate Change 2013: The Physical Science Basis. Contribution of Working I to the Fifth Assessment Report of the Intergovernmental Panel on Climate Change; Cambridge University Press: Cambridge, UK; New York, NY, USA, 2013. [Google Scholar]
  7. Slangen, A.B.; Carson, M.; Katsman, C.A.; van de Wal, R.S.; Köhl, A.; Vermeersen, L.L.; Stammer, D. Projecting twenty-first century regional sea-level changes. Clim. Chang. 2014, 124, 317–332. [Google Scholar] [CrossRef]
  8. DeConto, R.M.; Pollard, D. Contribution of Antarctica to past and future sea-level rise. Nature 2016, 531, 591–597. [Google Scholar] [CrossRef]
  9. Vitousek, S.; Barnard, P.L.; Fletcher, C.H.; Frazer, N.; Erikson, L.; Storlazzi, C.D. Doubling of coastal flooding frequency within decades due to sea-level rise. Sci. Rep. 2017, 7, 1399. [Google Scholar] [CrossRef]
  10. Sweet, W.V.; Park, J. From the extreme to the mean: Acceleration and tipping points of coastal inundation from sea level rise. Earths Future 2014, 2, 579–600. [Google Scholar] [CrossRef]
  11. Nicholls, R.; Wong, P.; Burkett, V.; Codignotto, J.; Hay, J.; McLean, R.; Ragoonaden, S.; Woodroffe, C. Coastal systems and low-lying areas. In Climate Change 2007: Impacts, Adaptation and Vulnerability. Contribution of Working Group II to the Fourth Assessment Report of the Intergovernmental Panel on Climate Change; Cambridge University Press: Cambridge, UK, 2007; pp. 315–356. [Google Scholar]
  12. Crossett, K.; Ache, B.; Pacheco, P.; Haber, K. National Coastal Population Report: Population Trends from 1970 to 2010; NOAA State of the Coast Report Series; National Oceanic and Atmospheric Administration, Department of Commerce/United States Census Bureau: Washington, DC, USA, 2013; p. 22.
  13. Hinkel, J.; Aerts, J.C.; Brown, S.; Jiménez, J.A.; Lincke, D.; Nicholls, R.J.; Scussolini, P.; Sanchez-Arcilla, A.; Vafeidis, A.; Addo, K.A. The ability of societies to adapt to twenty-first-century sea-level rise. Nat. Clim. Chang. 2018, 8, 570–578. [Google Scholar] [CrossRef]
  14. De Waal, J.; Van der Meer, J. Wave runup and overtopping on coastal structures. Coast. Eng. 1992, 1993, 1758–1771. [Google Scholar]
  15. Pullen, T.; Allsop, N.; Bruce, T.; Kortenhaus, A.; Schüttrumpf, H.; Van der Meer, J. EurOtop Wave Overtopping of Sea Defences and Related Structures: Assessment Manual; EA/ENW/KFKI; Boyens Medien GmbH: Hyde, Germany, 2007. [Google Scholar]
  16. van der Meer, J.; Allsop, N.; Bruce, T.; De Rouck, T.; Kortenhous, A.; Pullen, T.; Schüttrumpf, H.; Troch, P.; Zanuttigh, B. EurOtop: Manual on Wave Overtopping of Sea Defences and Related Structures: An Overtopping Manual Largely Based on European Research, but for Worldwide Application; Van der Meer Consulting: Akkrum, The Netherlands, 2016. [Google Scholar]
  17. Almarshed, B.; Figlus, J.; Miller, J.; Verhagen, H.J. Innovative Coastal Risk Reduction through Hybrid Design: Combining Sand Cover and Structural Defenses. J. Coast. Res. 2020, 36, 174. [Google Scholar] [CrossRef]
  18. Griggs, G.B. The impacts of coastal armoring. Shore Beach 2005, 73, 13–22. [Google Scholar]
  19. Pendleton, L.; Mohn, C.; Vaughn, R.K.; King, P.; Zoulas, J.G. Size matters: The economic value of beach Erosion and Nourishment in Southern California. Contemp. Econ. Policy 2012, 30, 223–237. [Google Scholar] [CrossRef]
  20. Temmerman, S.; Meire, P.; Bouma, T.J.; Herman, P.M.; Ysebaert, T.; De Vriend, H.J. Ecosystem-based coastal defence in the face of global change. Nature 2013, 504, 79–83. [Google Scholar] [CrossRef] [PubMed]
  21. Sutton-Grier, A.E.; Wowk, K.; Bamford, H. Future of our coasts: The potential for natural and hybrid infrastructure to enhance the resilience of our coastal communities, economies and ecosystems. Environ. Sci. Policy 2015, 51, 137–148. [Google Scholar] [CrossRef] [Green Version]
  22. Bruun, P. Beach scraping—Is it damaging to beach stability? Coast. Eng. 1983, 7, 167–173. [Google Scholar] [CrossRef]
  23. Edge, B.L.; Ewing, L.; Erickson, K.M.; Magoon, O.T. Application of coastal engineering in coastal zone management. In Advances in Coastal Structure Design; ASCE: Reston, VA, USA, 2003; pp. 200–215. [Google Scholar]
  24. Gallien, T.W.; O’Reilly, W.C.; Flick, R.E.; Guza, R.T. Geometric properties of anthropogenic flood control berms on southern California beaches. Ocean Coast. Manag. 2015, 105, 35–47. [Google Scholar] [CrossRef] [Green Version]
  25. Gallien, T.; Kalligeris, N.; Delisle, M.P.; Tang, B.X.; Lucey, J.; Winters, M. Coastal flood modeling challenges in defended urban backshores. Geosciences 2018, 8, 450. [Google Scholar] [CrossRef] [Green Version]
  26. Basco, D.R. The economic analysis of “soft” versus “hard” solutions for shore protection: An example. Coast. Eng. 1998, 1999, 1449–1460. [Google Scholar]
  27. Rella, A.; Miller, J. A Comparative Cost Analysis of Ten Shore Protection Approaches at Three Sites under Two Sea Level Rise Scenarios; Hudson River Sustainable Shorelines Project: Staatsburg, NY, USA, 2012. [Google Scholar]
  28. Glick, P.; Kostyack, J.; Pittman, J.; Briceno, T.; Wahlund, N. Natural Defenses from Hurricanes and Floods: Protecting America’s Communities and Ecosystems in an Era of Extreme Weather; National Wildlife Federation: Washington, DC, USA, 2014. [Google Scholar]
  29. Everts, C.; Eldon, C.; Moore, J. Performance of cobble berms in Southern California. Shore Beach 2002, 70, 5–14. [Google Scholar]
  30. Allan, J.; Komar, P. Environmentally compatible cobble berm and artificial dune for shore protection. Shore Beach 2004, 72, 9–18. [Google Scholar]
  31. McCall, R.T.; Masselink, G.; Poate, T.G.; Roelvink, J.A.; Almeida, L.P.; Davidson, M.; Russell, P.E. Modelling storm hydrodynamics on gravel beaches with XBeach-G. Coast. Eng. 2014, 91, 231–250. [Google Scholar] [CrossRef] [Green Version]
  32. Komar, P.D.; Allan, J.C. “Design with Nature” Strategies for Shore Protection: The Construction of a Cobble Berm and Artificial Dune in an Oregon State. In Puget Sound Shorelines and the Impacts of Armoring—Proceedings of a State of the Science Workshop, May 2009; U.S. Geological Survey Scientific Investigations Report 2010-5254; 2010; pp. 117–126. Available online: https://www.google.com.hk/url?sa=t&rct=j&q=&esrc=s&source=web&cd=&ved=2ahUKEwjcsMeg9IPtAhVJc3AKHczsAxsQFjAAegQIAxAC&url=https%3A%2F%2Fpubs.usgs.gov%2Fsir%2F2010%2F5254%2Fpdf%2Fsir20105254.pdf&usg=AOvVaw0ZTnpyBm8Mo9M2ISF4c0pM (accessed on 15 November 2020).
  33. Kochnower, D.; Reddy, S.M.; Flick, R.E. Factors influencing local decisions to use habitats to protect coastal communities from hazards. Ocean Coast. Manag. 2015, 116, 277–290. [Google Scholar] [CrossRef] [Green Version]
  34. Dickson, M.E.; Kench, P.S.; Kantor, M.S. Longshore transport of cobbles on a mixed sand and gravel beach, southern Hawke Bay, New Zealand. Mar. Geol. 2011, 287, 31–42. [Google Scholar] [CrossRef]
  35. Matsumoto, H.; Young, A.P.; Guza, R.T. Observations of surface cobbles at two southern California beaches. Mar. Geol. 2020, 419, 106049. [Google Scholar] [CrossRef]
  36. Boers, M. Technisch Rapport Duinwaterkeringen en Hybride Keringen 2011. 1206018-001-HYE-0009. 2012. Available online: https://www.google.com.hk/url?sa=t&rct=j&q=&esrc=s&source=web&cd=&ved=2ahUKEwi0p9e59IPtAhUEat4KHQZdAiUQFjAKegQIAhAC&url=https%3A%2F%2Frepository.tudelft.nl%2Fislandora%2Fobject%2Fuuid%3Ab8ab1c44-e5aa-4b49-a5d8-98d9e4044878%2Fdatastream%2FOBJ%2Fdownload&usg=AOvVaw2hBE3MGQ08dMqZzdCFFUhi (accessed on 15 November 2020).
  37. Irish, J.L.; Lynett, P.J.; Weiss, R.; Smallegan, S.M.; Cheng, W. Buried relic seawall mitigates Hurricane Sandy’s impacts. Coast. Eng. 2013, 80, 79–82. [Google Scholar] [CrossRef]
  38. Walling, K.; Herrington, T.; Miller, J.K. Hurricane Sandy damage comparison: Oceanfront houses protected by a beach and dune system with vs. without a rock seawall. Shore Beach 2016, 84, 35–41. [Google Scholar]
  39. Nordstrom, K.F.; Jackson, N.L. Constraints on restoring landforms and habitats on storm-damaged shorefront lots in New Jersey, USA. Ocean Coast. Manag. 2018, 155, 15–23. [Google Scholar] [CrossRef]
  40. Kobayashi, N.; Kim, H.D. Rock Seawall in the Swash Zone to Reduce Wave Overtopping and Overwash of a Sand Beach. J. Waterw. Port Coast. Ocean Eng. 2017, 143, 04017033. [Google Scholar] [CrossRef]
  41. Saleh, F.; Weinstein, M.P. The role of nature-based infrastructure (NBI) in coastal resiliency planning: A literature review. J. Environ. Manag. 2016, 183, 1088–1098. [Google Scholar] [CrossRef]
  42. Morris, R.L.; Konlechner, T.M.; Ghisalberti, M.; Swearer, S.E. From grey to green: Efficacy of eco-engineering solutions for nature-based coastal defence. Glob. Chang. Biol. 2018, 24, 1827–1842. [Google Scholar] [CrossRef] [PubMed]
  43. D’Alessandro, F.; Tomasicchio, G.R.; Francone, A.; Leone, E.; Frega, F.; Chiaia, G.; Saponieri, A.; Damiani, L. Coastal sand dune restoration with an eco-friendly technique. Aquat. Ecosyst. Health Manag. 2020, 1–8. [Google Scholar] [CrossRef]
  44. Dias, J.A.; Ferreira, Ó.; Matias, A.; Vila-Concejo, A.; Sá-Pires, C. Evaluation of soft protection techniques in barrier islands by monitoring programs: Case studies from Ria Formosa (Algarve-Portugal). J. Coast. Res. 2003, 35, 117–131. [Google Scholar]
  45. Matias, A.; Ferreira, Ó.; Mendes, I.; Dias, J.A.; Vila-Concejo, A. Artificial Construction of Dunes in the South of Portugal. J. Coast. Res. 2005, 213, 472–481. [Google Scholar] [CrossRef]
  46. Nordstrom, K.F.; Gamper, U.; Fontolan, G.; Bezzi, A.; Jackson, N.L. Characteristics of coastal dune topography and vegetation in environments recently modified using beach fill and vegetation plantings, Veneto, Italy. Environ. Manag. 2009, 44, 1121–1135. [Google Scholar] [CrossRef] [PubMed]
  47. Ceia, F.R.; Patrício, J.; Marques, J.C.; Dias, J.A. Coastal vulnerability in barrier islands: The high risk areas of the Ria Formosa (Portugal) system. Ocean Coast. Manag. 2010, 53, 478–486. [Google Scholar] [CrossRef]
  48. Garcia, T.; Ferreira, Ó.; Matias, A.; Dias, J.A. Overwash vulnerability assessment based on long-term washover evolution. Nat. Hazards 2010, 54, 225–244. [Google Scholar] [CrossRef]
  49. Hanley, M.; Hoggart, S.; Simmonds, D.; Bichot, A.; Colangelo, M.; Bozzeda, F.; Heurtefeux, H.; Ondiviela, B.; Ostrowski, R.; Recio, M.; et al. Shifting sands? Coastal protection by sand banks, beaches and dunes. Coast. Eng. 2014, 87, 136–146. [Google Scholar] [CrossRef]
  50. Karunarathna, H.; Brown, J.; Chatzirodou, A.; Dissanayake, P.; Wisse, P. Multi-timescale morphological modelling of a dune-fronted sandy beach. Coast. Eng. 2018, 136, 161–171. [Google Scholar] [CrossRef]
  51. Pagán, J.I.; Bañón, L.; López, I.; Bañón, C.; Aragonés, L. Monitoring the dune-beach system of Guardamar del Segura (Spain) using UAV, SfM and GIS techniques. Sci. Total Environ. 2019, 687, 1034–1045. [Google Scholar] [CrossRef]
  52. Mendelssohn, I.A.; Hester, M.W.; Monteferrante, F.J.; Talbot, F. Experimental dune building and vegetative stabilization in a sand- deficient barrier island setting on the Louisiana coast, USA. J. Coast. Res. 1991, 7, 137–149. [Google Scholar]
  53. Miller, D.L.; Thetford, M.; Yager, L. Evaluation of sand fence and vegetation for dune building following overwash by Hurricane Opal on Santa Rosa Island, Florida. J. Coast. Res. 2001, 17, 936–948. [Google Scholar]
  54. Nordstrom, K.F.; Hartman, J.M.; Freestone, A.L.; Wong, M.; Jackson, N.L. Changes in topography and vegetation near gaps in a protective foredune. Ocean Coast. Manag. 2007, 50, 945–959. [Google Scholar] [CrossRef]
  55. Sigren, J.M.; Figlus, J.; Armitage, A.R. Coastal sand dunes and dune vegetation: Restoration, erosion, and storm protection Coastal Ridge-Runnel Migration View project Rapid storm response unit for the upper Texas Gulf coast View project. Shore Beach 2014, 82, 5–12. [Google Scholar]
  56. Harris, M.E.; Ellis, J.T.; Barrineau, P. Evaluating the geomorphic response from sand fences on dunes impacted by hurricanes. Ocean Coast. Manag. 2020, 193. [Google Scholar] [CrossRef]
  57. Wernette, P.; Houser, C.; Lehner, J.; Evans, A.; Weymer, B. Investigating the Impact of Hurricane Harvey and Driving on Beach-Dune Morphology. Geomorphology 2020, 358. [Google Scholar] [CrossRef]
  58. Temmerman, S.; De Vries, M.B.; Bouma, T.J. Coastal marsh die-off and reduced attenuation of coastal floods: A model analysis. Glob. Planet. Chang. 2012, 92, 267–274. [Google Scholar] [CrossRef]
  59. Zhang, K.; Liu, H.; Li, Y.; Xu, H.; Shen, J.; Rhome, J.; Smith III, T.J. The role of mangroves in attenuating storm surges. Estuar. Coast. Shelf Sci. 2012, 102, 11–23. [Google Scholar] [CrossRef]
  60. Silva, R.; Martínez, M.; Odériz, I.; Mendoza, E.; Feagin, R. Response of vegetated dune–beach systems to storm conditions. Coast. Eng. 2016, 109, 53–62. [Google Scholar] [CrossRef]
  61. Odériz, I.; Knöchelmann, N.; Silva, R.; Feagin, R.A.; Martínez, M.L.; Mendoza, E. Reinforcement of vegetated and unvegetated dunes by a rocky core: A viable alternative for dissipating waves and providing protection? Coast. Eng. 2020, 158, 103675. [Google Scholar] [CrossRef]
  62. Palmsten, M.; Holman, R. Laboratory investigation of dune erosion using stereo video. Coast. Eng. 2012, 60, 123–135. [Google Scholar] [CrossRef]
  63. Bañón, L.; Pagán, J.I.; López, I.; Banon, C.; Aragonés, L. Validating UAS-Based Photogrammetry with Traditional Topographic Methods for Surveying Dune Ecosystems in the Spanish Mediterranean Coast. J. Mar. Sci. Eng. 2019, 7, 297. [Google Scholar] [CrossRef] [Green Version]
  64. Splinter, K.; Kearney, E.; Turner, I. Drivers of alongshore variable dune erosion during a storm event: Observations and modelling. Coast. Eng. 2018, 131, 31–41. [Google Scholar] [CrossRef]
  65. Westoby, M.J.; Brasington, J.; Glasser, N.F.; Hambrey, M.J.; Reynolds, J.M. ‘Structure-from-Motion’ photogrammetry: A low-cost, effective tool for geoscience applications. Geomorphology 2012, 179, 300–314. [Google Scholar] [CrossRef] [Green Version]
  66. Casella, E.; Rovere, A.; Pedroncini, A.; Stark, C.P.; Casella, M.; Ferrari, M.; Firpo, M. Drones as tools for monitoring beach topography changes in the Ligurian Sea (NW Mediterranean). GeoMar. Lett. 2016, 36, 151–163. [Google Scholar] [CrossRef]
  67. Papakonstantinou, A.; Topouzelis, K.; Pavlogeorgatos, G. Coastline Zones Identification and 3D Coastal Mapping Using UAV Spatial Data. ISPRS Int. J. GeoInf. 2016, 5, 75. [Google Scholar] [CrossRef] [Green Version]
  68. Guisado-Pintado, E.; Jackson, D.W.; Rogers, D. 3D mapping efficacy of a drone and terrestrial laser scanner over a temperate beach-dune zone. Geomorphology 2019, 328, 157–172. [Google Scholar] [CrossRef]
  69. Harvey, M.E.; Giddings, S.N.; Stein, E.D.; Crooks, J.A.; Whitcraft, C.; Gallien, T.; Largier, J.L.; Tiefenthaler, L.; Meltzer, H.; Pawlak, G.; et al. Effects of Elevated Sea Levels and Waves on Southern California Estuaries During the 2015–2016 El Niño. Estuaries Coasts 2020, 43, 256–271. [Google Scholar] [CrossRef] [Green Version]
  70. Moffatt & Nichol. Cardiff Beach Living Shoreline Project Final Feasibility Study; Technical Report; Moffatt & Nichol: San Diego, CA, USA, 2015. [Google Scholar]
  71. Adams, P.N.; Inman, D.L.; Graham, N.E. Southern California deep-water wave climate: Characterization and application to coastal processes. J. Coast. Res. 2008, 24, 1022–1035. [Google Scholar] [CrossRef]
  72. Ludka, B.C.; Guza, R.T.; O’Reilly, W.C.; Merrifield, M.A.; Flick, R.E.; Bak, A.S.; Hesser, T.; Bucciarelli, R.; Olfe, C.; Woodward, B.; et al. Sixteen years of bathymetry and waves at San Diego beaches. Sci. Data 2019, 6, 161. [Google Scholar] [CrossRef] [Green Version]
  73. Coveney, S.; Roberts, K. Lightweight UAV digital elevation models and orthoimagery for environmental applications: Data accuracy evaluation and potential for river flood risk modelling. Int. J. Remote Sens. 2017, 38, 3159–3180. [Google Scholar] [CrossRef] [Green Version]
  74. Küng, O.; Strecha, C.; Beyeler, A.; Zufferey, J.C.; Floreano, D.; Fua, P.; Gervaix, F. The Accuracy of Automatic Photogrammetric Techniques on Ultra-Light UAV Imagery. In Proceedings of the International Conference on Unmanned Aerial Vehicle in Geomatics (UAV-g), IAPRS, Zurich, Switzerland, 14–16 September 2011. [Google Scholar]
  75. Environmental Systems Research Institute, Inc. (ESRI). Flow Direction. 2016. Available online: https://desktop.arcgis.com/en/arcmap/10.3/tools/spatial-analyst-toolbox/flow-direction.htm (accessed on 15 November 2020).
  76. Stockdon, H.F.; Holman, R.A.; Howd, P.A.; Sallenger, A.H. Empirical parameterization of setup, swash, and runup. Coast. Eng. 2006, 53, 573–588. [Google Scholar] [CrossRef]
  77. Fiedler, J.W.; Brodie, K.L.; McNinch, J.E.; Guza, R.T. Observations of runup and energy flux on a low-slope beach with high-energy, long-period ocean swell. Geophys. Res. Lett. 2015, 42, 9933–9941. [Google Scholar] [CrossRef] [Green Version]
  78. Melet, A.; Meyssignac, B.; Almar, R.; Le Cozannet, G. Under-estimated wave contribution to coastal sea-level rise. Nat. Clim. Chang. 2018, 8, 234–239. [Google Scholar] [CrossRef]
  79. Federal Emergency Management Agency (FEMA) of the United States. Final Draft Guidelines for Coastal Flood Hazard Analysis and Mapping for the Pacific Coast of the United States; Technical Report; Federal Emergency Management Agency (FEMA): Washington, DC, USA, 2005.
  80. Heberger, M.; Cooley, H.; Herrera, P.; Gleick, P.H.; Moore, E. The Impacts of Sea-Level Rise on the California Coast; Pacific Institute: Oakland, CA, USA, 2009. [Google Scholar]
  81. Gallien, T.W. Validated coastal flood modeling at Imperial Beach, California: Comparing total water level, empirical and numerical overtopping methodologies. Coast. Eng. 2016, 111, 95–104. [Google Scholar] [CrossRef] [Green Version]
  82. Serafin, K.A.; Ruggiero, P.; Stockdon, H.F. The relative contribution of waves, tides, and nontidal residuals to extreme total water levels on US West Coast sandy beaches. Geophys. Res. Lett. 2017, 44, 1839–1847. [Google Scholar]
  83. National Oceanic and Atmospheric Administration. NOAA Tides and Currents; 2020. Available online: https://tidesandcurrents.noaa.gov/ (accessed on 15 November 2020).
  84. Shope, J.B.; Erikson, L.H.; Barnard, P.L.; Storlazzi, C.D.; Serafin, K.A.; Doran, K.J.; Stockdon, H.F.; Reguero, B.G.; Mendez, F.J.; Castanedo, S.; et al. Characterizing Storm-Induced Coastal Change Hazards along the U.S. West Coast: U.S. Geological Survey Summary of Methods to Accompany Data Release; U.S. Geological Survey: Liston, VA, USA, 2020.
  85. O’Reilly, W.C.; Olfe, C.B.; Thomas, J.; Seymour, R.J.; Guza, R.T. The California coastal wave monitoring and prediction system. Coast. Eng. 2016, 116, 118–132. [Google Scholar] [CrossRef] [Green Version]
  86. Huang, W.; Xu, S.; Nnaji, S. Evaluation of GEV model for frequency analysis of annual maximum water levels in the coast of United States. Ocean Eng. 2008, 35, 1132–1147. [Google Scholar] [CrossRef]
  87. Xu, S.; Huang, W. Estimating extreme water levels with long-term data by GEV distribution at Wusong station near Shanghai city in Yangtze Estuary. Ocean Eng. 2011, 38, 468–478. [Google Scholar] [CrossRef]
  88. Coles, S.; Bawa, J.; Trenner, L.; Dorazio, P. An Introduction to Statistical Modeling of Extreme Values; Springer: London, UK, 2001; Volume 208. [Google Scholar]
  89. Muir, L.R.; El-Shaarawi, A. On the calculation of extreme wave heights: A review. Ocean Eng. 1986, 13, 93–118. [Google Scholar] [CrossRef]
  90. Tawn, J.A. Estimating probabilities of extreme sea-levels. J. R. Stat. Soc. Ser. C Appl. Stat. 1992, 41, 77–93. [Google Scholar] [CrossRef]
  91. Ruggiero, P.; Komar, P.D.; McDougal, W.G.; Marra, J.J.; Beach, R.A. Wave runup, extreme water levels and the erosion of properties backing beaches. J. Coast. Res. 2001, 17, 407–419. [Google Scholar]
  92. Serafin, K.A.; Ruggiero, P. Simulating extreme total water levels using a time-dependent, extreme value approach. J. Geophys. Res. Oceans 2014, 119, 6305–6329. [Google Scholar] [CrossRef] [Green Version]
  93. Sallenger, J. Storm impact scale for barrier islands. J. Coast. Res. 2000, 16, 890–895. [Google Scholar]
  94. Schubert, J.E.; Gallien, T.W.; Majd, M.S.; Sanders, B.F. Terrestrial laser scanning of anthropogenic beach berm erosion and overtopping. J. Coast. Res. 2015, 31, 47–60. [Google Scholar] [CrossRef] [Green Version]
  95. Erikson, L.H.; Larson, M.; Hanson, H. Laboratory investigation of beach scarp and dune recession due to notching and subsequent failure. Mar. Geol. 2007, 245, 1–19. [Google Scholar] [CrossRef] [Green Version]
  96. Palmsten, M.L.; Holman, R.A. Infiltration and instability in dune erosion. J. Geophys. Res. Oceans 2011, 116. [Google Scholar] [CrossRef] [Green Version]
  97. McCall, R.T.; Masselink, G.; Roelvink, D.; Russell, P.; Davidson, M.; Poate, T. Modelling overwash and infiltration on gravel barriers. Coast. Eng. Proc. 2012, 1, 34. [Google Scholar] [CrossRef] [Green Version]
  98. Figlus, J.; West, N.A.; Almarshed, B.; Jonkman, S.N. Conceptual Design and Physical Model Study of Core-Enhanced Dunes as Hybrid Coastal Defence Structures. In Coastal Structures and Solutions to Coastal Disasters 2015: Resilient Coastal Communities; American Society of Civil Engineers: Reston, VA, USA, 2017; pp. 65–73. ISBN 9780784480304. [Google Scholar] [CrossRef]
  99. Kobayashi, N. Coastal Sediment Transport Modeling for Engineering Applications. J. Waterw. Port Coast. Ocean Eng. 2016, 142, 03116001. [Google Scholar] [CrossRef]
  100. Roelvink, D.; Reniers, A.; van Dongeren, A.; van Thiel de Vries, J.; McCall, R.; Lescinski, J. Modelling storm impacts on beaches, dunes and barrier islands. Coast. Eng. 2009, 56, 1133–1152. [Google Scholar] [CrossRef]
  101. Kim, Y.; Mieras, R.S.; Cheng, Z.; Anderson, D.; Hsu, T.J.; Puleo, J.A.; Cox, D. A numerical study of sheet flow driven by velocity and acceleration skewed near-breaking waves on a sandbar using SedWaveFoam. Coast. Eng. 2019, 152, 103526. [Google Scholar] [CrossRef]
Figure 1. (a) Study site outlined in black of the Cardiff Living Shoreline project in northern San Diego County, California, United States. (b) Study site with red outline indicating project footprint, section labels indicating each stage of project construction, and black numbered lines indicating each Coastal Data Information Program (CDIP) Monitoring and Prediction (MOP) beach profile that was analyzed in this study (See Section 2.4 for details).
Jmse 08 00920 g001
Figure 2. Flooding and undermining of Highway 101 in the study area during a March 2010 event. Courtesy of City of Encinitas.
Jmse 08 00920 g002
Figure 3. Original construction cross-section drawing of the Cardiff Living Shoreline Project. The dune is backed by large rip-rap, fronted by a native, smaller grain size native cobble toe, and topped with native sand. All measurements are in feet and elevations are NAVD88. Courtesy of Moffatt and Nichol, 2015 [70].
Jmse 08 00920 g003
Figure 4. Pre-construction (a) and post-construction (b) digital elevation models derived from UAV photogrammetric surveys from 9 October 2018 and 28 August 2019, respectively. Section labels indicate each stage of project construction, and black numbered lines indicate each Monitoring and Prediction (MOP) beach profile that was analyzed in this study (See Section 2.4 for details).
Jmse 08 00920 g004
Figure 5. (a) Three-dimensional representation of living shoreline derived from UAV orthoimagery collected 20 December 2019 viewing northward. Blue line indicates toe delineation. (b) View looking southward on heavily vegetated section 1 with pedestrian access ways. (c) View looking southward on sections 2 and 3 with sand fences visible.
Jmse 08 00920 g005
Figure 6. (a) Orthoimage of completed trench lined with completed revetment from UAV survey conducted 14 December 2018. Orthoimagery reveals size of individual pieces of rip-rap that as-built data cannot. (b) Transects derived from data collected on 11 December 2018 during trench digging and on December 14th 2018 during revetment placement.
Jmse 08 00920 g006
Figure 7. Dune crest (solid red line) and toe (blue dashed line) elevations estimated from 28 August 2019 UAV survey. Low crest elevations at about 4.5 m NAVD88 indicate pedestrian access way locations. Each section of the dune and MOP transect locations are labeled.
Jmse 08 00920 g007
Figure 8. (a) Digital elevation models (DEM) differences (color bar) from 8/28/2019 to 12/20/2019. Significant foreshore erosion is observed. MOP profiles 677 (b), 675 (c), and 671 (d) are shown with an additional spring survey (4/30/2020) highlighting significant vegetation growth along MOP 677 (magenta).
Jmse 08 00920 g008
Figure 9. (a) Gully erosion in the pedestrian access ways can be viewed from UAV orthoimagery and (b) the gully depth along a transect derived from the UAV DSM. The depths of the gullies were up to a half meter in some areas.
Jmse 08 00920 g009
Figure 10. Annual maximum total water level (TWL) values from 1948 to 2008 for each MOP line without sea-level rise (blue markers). TWL time series superposed to 2020 to 2080 with projected sea-level rise for RCP 4.5 and 8.5 added (green and red markers, respectively). Black horizontal lines indicate values of mean beach crest pre-construction, dune crest and toe post-construction, and the 50 and 100-year TWL values.
Jmse 08 00920 g010
Figure 11. Average hours per year of dune toe interaction (collision hours) for MOP lines 671 (black curve) and 677 (blue curve) with added sea-level rise projected under RCP 4.5 and 8.5 at 2050 (circles) and 2070 (triangles).
Jmse 08 00920 g011
Table 1. Survey dates, hydrodynamic conditions and beach volumes. Tide (NOAA gauge 9410230), significant wave height, and peak period (CDIP buoy 100) at time of survey are listed. Beach volumes in cubic meters are listed above mean sea-level (MSL, 0.774 m NAVD88) and the upper beach (>2 m NAVD88). Hyphens indicate no data available.
TideH s T p Section 1Section 2Section 3
Date(m)(m)(s)MSLUpperMSLUpperMSLUpper
10/09/20180.391.4612.587,66548,60160,39034,98453,33027,269
11/28/20181.531.5614.2984,14650,839----
12/04/20180.020.4412.5068,39641,976----
12/11/20181.301.4715.3864,05141,019----
12/14/20181.081.3414.2966,37540,72340,61523,216--
12/17/20180.382.1020.0068,85541,17540,23423,420--
12/18/20180.231.8716.6768,06241,15639,39122,607--
12/19/2018−0.441.5715.3865,94539,82637,47921,795--
01/10/20191.332.2113.3361,39936,11337,58736,11339,73518,907
01/22/20190.1871.3710.5350,56328,79228,58615,64532,68116,094
02/01/20190.1260.915.38------
03/07/20191.061.2611.11--31,45517,401--
03/22/20191.3581.4213.33--34,49219,60438,06020,446
04/05/20190.6460.7713.33--74534033--
04/15/2019−0.0890.8712.556,15831,96238,40222,59241,25822,935
05/31/20190.3851.3614.2963,93234,10345,47725,66950,80328,400
08/28/20190.6461.0720.0073,87140,28853,69630,15757,25132,154
10/25/20190.1730.729.0973,37539,96752,13030,08754,74332,046
12/12/20190.3041.0712.5-35,598-26,191-26,636
12/20/20190.3650.9311.7661,45134,22340,83124,32044,84526,254
04/30/20200.0470.9610.5363,01734,58045,22425,22451,00828,764
Publisher’s Note: MDPI stays neutral with regard to jurisdictional claims in published maps and institutional affiliations.

