Article

Experimental Observations on Impact Velocity and Entrapped Air for Standing Wave Impacts on Vertical Hydraulic Structures with Overhangs

Department of Hydraulic Engineering, Faculty of Civil Engineering and Geosciences, Delft University of Technology, Stevinweg 1, 2628 CN Delft, The Netherlands
*
Author to whom correspondence should be addressed.
J. Mar. Sci. Eng. 2020, 8(11), 857; https://doi.org/10.3390/jmse8110857
Submission received: 12 October 2020 / Accepted: 27 October 2020 / Published: 30 October 2020
(This article belongs to the Special Issue Dynamic Response of Marine Structures under Wave Action)

Abstract

:
This study focusses on increasing the understanding on vertical hydraulic structures with relatively short overhangs subjected to standing wave impacts. To this end, the impact velocity and the entrapped air are studied in detail, given their influence on the impulsive loading characteristics and consequently on the structural dynamic response. This study is based on regular wave laboratory experimental data obtained for relatively short overhangs with respect to the wave length and with respect to the overhang height. The laboratory tests illustrate the complex wave hydrodynamics before the wave impacts, influenced by the incident wave conditions and structural characteristics. Regarding the impact velocity, the experimental measurements with a wall wave gauge in the tests without overhangs show that the maximum upward velocities deviate from linear wave theory between +5.5% and +13.0%, while the zero-crossing upward velocities deviate from linear wave theory between +1.9% and +7.0%. The zero-crossing upward velocities estimated from third order wave theory deviate from the linear wave theory between +1.8% and +4.7%. In the tests with overhangs, the maximum upward velocity below the overhang estimated by camera recording measurements deviates from linear wave theory between −11.8% and +13.4%. It was also found that when considering the experimental impact velocity from camera recordings in the tests with overhangs, the mean effective bounce-back factor β deviates relatively little from when linear wave theory is used (≈1%), while the uncertainty described by the standard deviation increases significantly (≈35%). Regarding the entrapped air, it is shown that the interaction between incident wave parameters and structural configurations leads to a large variation in the entrapped air area, up to a factor of 5.7 for shorter overhangs and a factor of 9.5 for longer overhangs. This variability in entrapped air characteristics leads to significant effects on the loading on the structure, as observed by the variability on pressure measurements. The experimental results showed increasing impact durations and increasing effective bounce-back factor β in the tests with increasing entrapped air dimensions. This study highlights the importance of the details of the impact velocity and entrapped air for load estimations during the design of vertical hydraulic structures exposed to standing wave impacts. This is particularly important for thin structures such as steel gates which are susceptible to a dynamic behaviour under such impulsive loads.

1. Introduction

During the next years and decades, a wide range of new vertical hydraulic structures will be designed and constructed worldwide. Furthermore, a number of existing vertical hydraulic structures will be renewed and modernised after the end of their original design lifetime, due to more strict safety requirements, due to increased environmental loads or due to a combination of these factors. Wave loads, and more precisely wave impacts, usually play an important role in the design of these hydraulic structures. Thus, extended knowledge on the design of vertical hydraulic structures exposed to wave impacts is needed. According to Reference [1], three different wave impact types can take place at hydraulic structures: caused by breaking waves on a vertical wall, caused by overtopping waves on a crest wall and caused by non-breaking waves on a vertical wall with a horizontal overhang. Among these three configurations, this study focusses on wave impacts on vertical hydraulic structures with horizontal overhangs, generated by non-breaking standing waves.
As described in Reference [1], previous studies focused on wave impacts generated by breaking waves acting on vertical walls [2,3,4,5,6,7,8,9]. Vertical walls with long overhangs were also studied but only exposed to breaking wave impacts [10], while References [11,12] addressed wave impacts on structures exposed to overtopping waves. Furthermore, wave impact loads acting on piers and bridge decks were studied in References [13,14,15,16]. Also, References [17,18,19] show recent numerical and experimental models and tools for assessing slamming loads on offshore structures, natural gas tanks and ship hulls. In opposition to this, an important knowledge gap existed until recently regarding wave impact loads generated by non-breaking standing waves on vertical structures with overhangs, which can be found in storm surge barriers, flood gates, sluice gates, dewatering sluices, lock gates and crest walls [20,21,22,23]. Nevertheless, this gets increasing attention, as recently addressed by Reference [1], with a validation of the pressure-impulse theory applied to wave impacts caused by non-breaking standing waves on vertical hydraulic structures with short overhangs. The present study has the aim to extend the existing knowledge on this particular type of wave impact by means of a more detailed analysis of additional measurements from the experiments presented in Reference [1], considering the impact velocity and the entrapped air.

1.1. Literature

Bagnold [2] is a fundamental reference on the study of impulsive loading caused by wave breaking, based on two important observations. Firstly, describing that although the maximum measured pressure peaks varied significantly from impact to impact, the pressure impulse (i.e., area enclosed by the pressure-time curve) was remarkably more constant. Secondly, observing that the highest measured pressure peaks took place when the air cushion is smaller but not zero. In addition, Bagnold [2] introduced the piston model for the effect of entrapped air cushions in wave impacts, which has been later used and extended, among others, in References [6,20].
During the design and construction of the Delta Works (1953–1997), a wide range of laboratory test campaigns took place in The Netherlands, in order to study the wave loads acting on these hydraulic structures. These tests examined structures such as the Eastern Scheldt Storm Surge Barrier, where wave loadings were studied considering various geometries which included vertical walls with overhangs [20,24,25]. However, these studies did not present general design guidelines, as they were focused on the design optimization of these singular structures. Based on these experimental tests, Reference [26] concludes that water can be considered incompressible for conditions such as wave impacts on hydraulic structures. Furthermore, Reference [27] concludes that air pockets have a decisive influence on the characteristics and magnitudes of wave impacts. More recently, Hofland [28] studied the sluice gates of the Afsluitdijk subjected to wave loads, by means of experimental tests that included the effect of the existing overhang (i.e., defence beam) and ventilation gaps.
The pressure-impulse theory applied to wave impacts was introduced by References [29,30]. This model is based on the Navier-Stokes equation of motion and allows to determine the pressure-impulse caused by a wave impact. These first two studies address a vertical wall with a horizontally-moving water volume (which describes a simplified breaking wave) impacting on the vertical wall. Furthermore, Wood and Peregrine [31] extended this theory to a different configuration, which addresses a vertically-upward-moving water volume (which describes a simplified reflecting wave) impacting on a horizontal surface. Later on, References [32,33,34] studied the presence of air in wave impact conditions, and Reference [35] summarized the pressure-impulse theory contributions. The majority of the studies on pressure-impulse theory are analytical with limited experimental validation in References [33,34]. These studies include mainly breaking waves experimental data and lead to only partial validation of the theory. This low agreement between theory and experiments is considered to be caused by the complicated kinematics observed in breaking waves, and which may not be correctly described by a uniform impact velocity. The experimental validation presented in Reference [1], considering a combination of models from References [29,30,31], addressed a configuration with an expected more uniform and predictable impact velocity caused by non-breaking standing waves and obtained a closer confirmation of the theory.
Several theories exist regarding standing wave motion at vertical walls. Besides linear wave theory, earlier theories used in engineering to predict wave loads of standing waves are the ones introduced by Sainflou [36] and Miche [37]. Later, following the work for infinite depth and lower orders [38,39], a fourth order Stokes-like expansion for standing waves in finite water depth was developed by Goda [40]. This solution was tested for a wide range of conditions, and the load were found to be predicted well. Several further adaptations of these theories were made to partial reflection [41] and short-crested waves [42]. Similar to progressive waves, higher standing waves (compared to water depth and wave length), exhibit more non-linear effects. Hedges [43] presents the regions of applicability for wave theories, based on the Ursell Number. Fenton [44] suggests that equal to progressive waves, the Ursell Number governs the region of application of the higher order wave theories, and that the same limiting values might apply. Similarly, for long waves compared to the water depth, cnoidal wave theory applies [45]. Romanczyk [46] describes that steep standing waves become remarkably unstable. The majority of the mentioned studies refer to regular standing waves. Furthermore, most validating experiments focus on the load exerted on the wall, and not the velocity of the surface that is required in the present study. Lastly, no theories were found that focussed on water motion at a vertical wall with a protruding element near the water surface.
Regarding the preliminary design of hydraulic structures under impulsive loadings, Reference [47] highlighted the advantages of using the pressure-impulse and the force-impulse in design, instead of the peak pressures and peak force. Also, Reference [47] proposed a model for estimating the reaction forces from impulsive wave impact loads. Moreover, Reference [48] introduced a semi-analytical model which is capable of predicting the bending vibrations of flood gates and other elastic hydraulic structures subjected to impulsive wave impact loads.

1.2. Paper Aims

The previously described existing literature highlights the need for extended knowledge on wave impacts on vertical structures with overhangs. In consequence, two processes have a remarkable relevance: the impact velocity and the entrapped air. These two processes are addressed in this study by means of experimental observations with regular waves. Laboratory data includes the incident wave field, pressure measurements, wall wave gauge measurements and camera recording measurements of water level and wave surface velocity. Section 2 describes the laboratory experiments carried out. The wave impact velocity is addressed in Section 3, while the entrapped air is addressed in Section 4. Section 5 summarizes the main conclusions of this paper.

2. Laboratory Experiments

This study analyses regular wave experimental data obtained from a test campaign carried out in 2019, at the wave flume of the Hydraulic Engineering Laboratory at Delft University of Technology, see Figure 1. This test campaign included different structure configurations (i.e., vertical walls and vertical walls with overhangs), various regular incident wave conditions and different instrumentation (i.e., wave gauges, camera and a pressure sensor). The wave flume used is 42 m long, 1 m high and 0.8 m wide. The piston-type wave generation system includes second order steering (i.e., second order effects of the first higher and lower harmonics are considered in the wave paddle motion, resembling waves that occur in nature) and active reflection compensation (ARC) (i.e., the wave paddle compensates for the waves reflected by the structure preventing them to re-reflect back into the test area). Figure 1a shows an overview of the experimental test area, Figure 1b illustrates in more detail the structure during a wave impact, while Figure 1c presents a front view of the vertical wall configuration with an integrated wall wave gauge. More details on the experimental setup are presented hereafter.

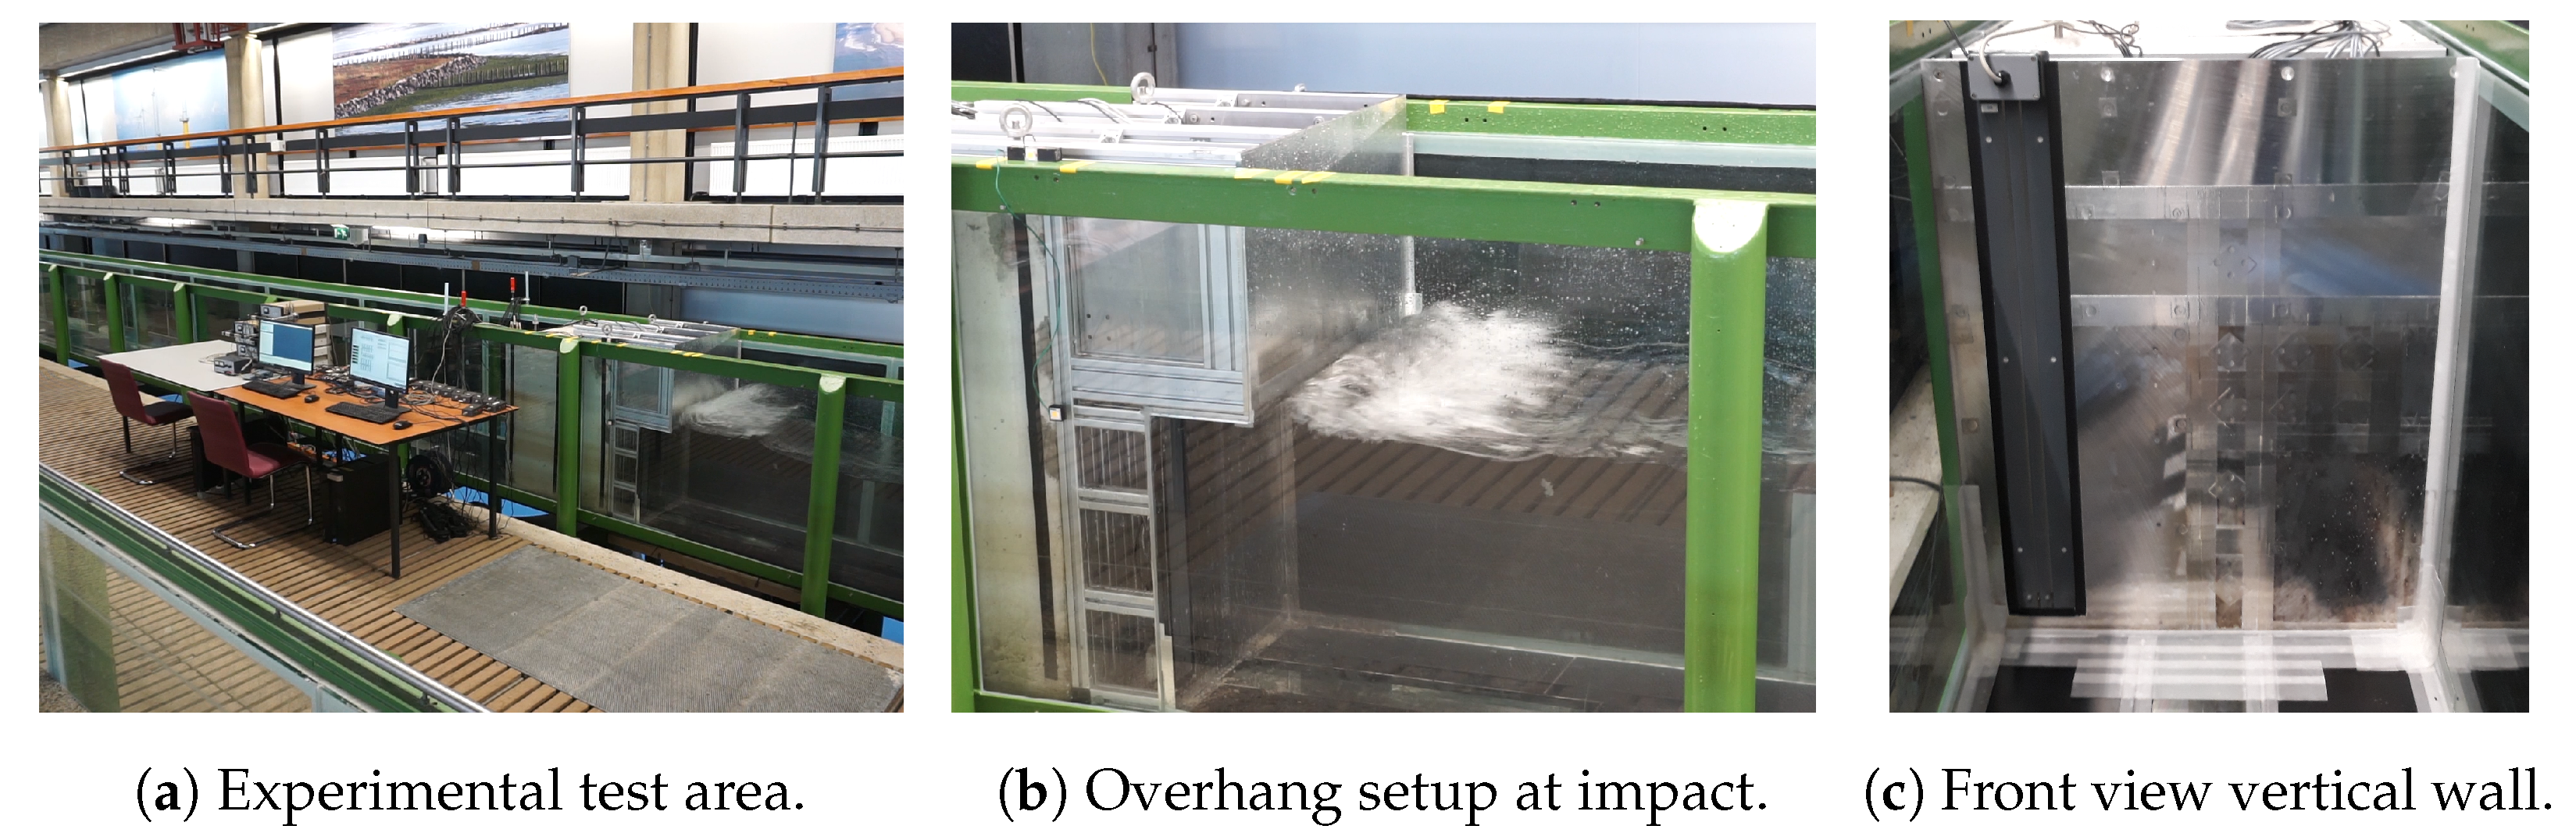
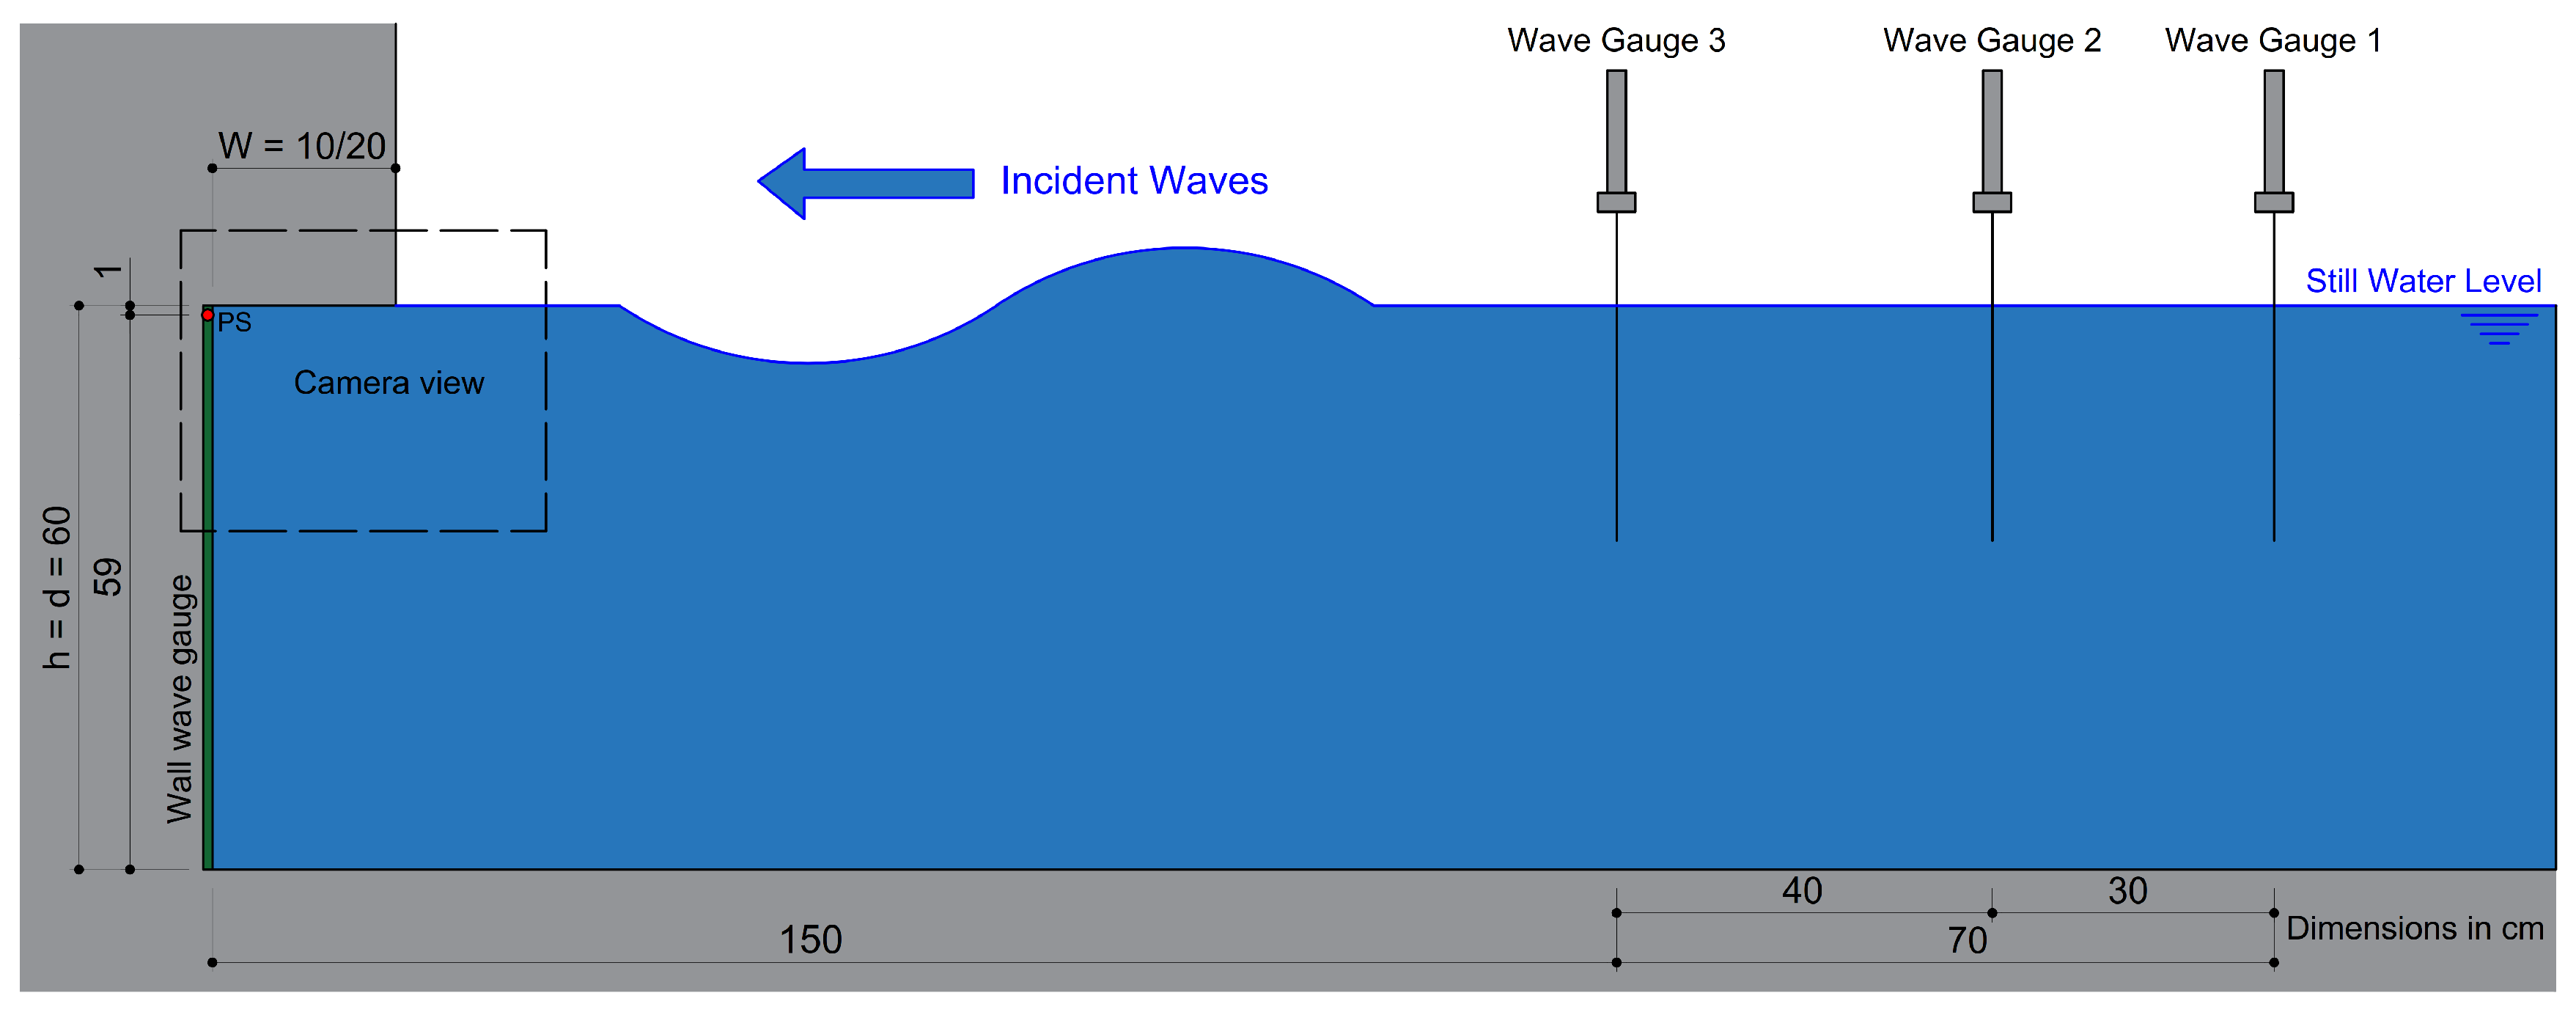
2.1. Experiment Description

The test setup was located at 23.3 m away from the wave paddle, see Figure 1. At this location, the aluminium test structure was mounted on a 1500 kg concrete block. The function of this concrete block (0.8 m wide, 0.8 m long and 1 m high) was to provide stability for the structure subjected to wave impacts. The test structure was built with 10 mm thick aluminium plates supported by aluminium profiles connected to the concrete block. Three different configurations were tested: a vertical wall with no overhang, a vertical wall with a shorter overhang ( W = 0.1 m) and a vertical wall with a longer overhang ( W = 0.2 m). In total, 15 tests were carried out: five with no overhang, five with a shorter overhang (named with the addition of “S”) and five with a longer overhang (named with the addition of “L”). Table 1 summarizes the regular incident wave conditions, including the overhang length (W), the overhang height (h), the water level (d), the mean incident wave height (H), the variability of the incident wave height ( σ H / μ H ), the mean wave period (T), the mean local wave length according to linear wave theory for transitional depth (L), the mean steepness ( s = H / L ), the reflection coefficient ( c r ), the Ursell Number ( U r = H L 2 / d 3 ) and the impact type as described in Reference [1]. For the tests with overhangs, the still water depth was equal to the overhang height ( d = h = 0.6 m), which can also de described as a situation of zero freeboard, see Figure 2. Under these circumstances, the wave surface is expected to have the maximum upward velocity when impacting the overhang. Consequently, this is expected to lead to the highest impact loads. For all configurations, 50 regular waves were analysed in each test, so the variability and repeatability of wave magnitudes could be evaluated.

2.2. Instrumentation

The incident and reflected waves were obtained at 1.5 m away from the vertical wall, following the method described by Zelt and Skjelbreia [49]. To this end, an array of 3 wave gauges with a sampling rate of 100 Hz were used, see their location in Figure 2. In addition, a wall wave gauge with its electrodes integrated flush in the wall (identical to wave gauges placed at wave generation paddles with ARC systems, see Figure 1c) was installed in the vertical wall, located at 12 cm away from the wave flume glass wall. This wall wave gauge had a sampling rate of 1000 Hz and was used for the measurement of the water level and the wave surface velocity at the vertical wall. All wave gauges included water conductivity compensation devices, to guarantee the accuracy of the measurements in all circumstances, correcting for temperature variations throughout the tests.
The recordings of an Olympus Tough TG-5 camera are used in this study for the tests with overhangs, see camera field of view in Figure 2. The camera was used with a frame rate of 59.94 fps and a resolution of 1920 × 1080, located slightly below the overhang level and 50 cm away from the wave flume glass wall. These camera recordings are synchronized with the measurements from the pressure sensor and wave gauges through LED light pulses recorded by the camera. The camera recordings are available for a limited number of waves, including the five first consecutive waves (tests AS, BS, ES, AL, BL, EL) or the three first consecutive waves (tests CS, DS, CL, DL). From these camera recordings, the wave surface is manually recognized by defining several wave surface points on each image frame using Matlab. These pixel coordinates are calibrated with the help of markers on the inner side of the flume glass wall. From this, the water level and wave surface velocity are derived. Furthermore, the use of transparent overhangs to capture air dynamics from inside the structure were considered. Nevertheless, the larger deformations of the polycarbonate elements under wave impacts and its expected influence on the pressure evolution favoured maintaining a full aluminium structure.
A Kulite HKM-375M-SG pressure sensor with 1 bar measurement range and sealed gauge is used in this study, screwed flush in the aluminium surface. The pressure sensor is located in the middle of the wave flume (40 cm away from the flume glass wall) and in the corner between wall and overhang, see ‘PS’ in Figure 2. The sampling frequency was 20 kHz. The calibrations obtained before the test campaign were regularly checked during and after the test campaign, with before-after differences in calibration factors of 0.12%. The pressures shown in this study are dynamic pressures, which are obtained after removing the hydrostatic pressures (i.e., pressures recorded prior to the wave motion) from the pressure measurements.

3. Impact Velocity

The wave impact velocity is a key parameter for determining the magnitudes and characteristics of the loads generated by a given wave impact. Furthermore, the wave impact velocity is also required in order to obtain dimensional values from theoretical estimations based on the pressure-impulse theory. Thus, this section addresses the study of the wave impact velocity considering theoretical expressions and experimental measurements.

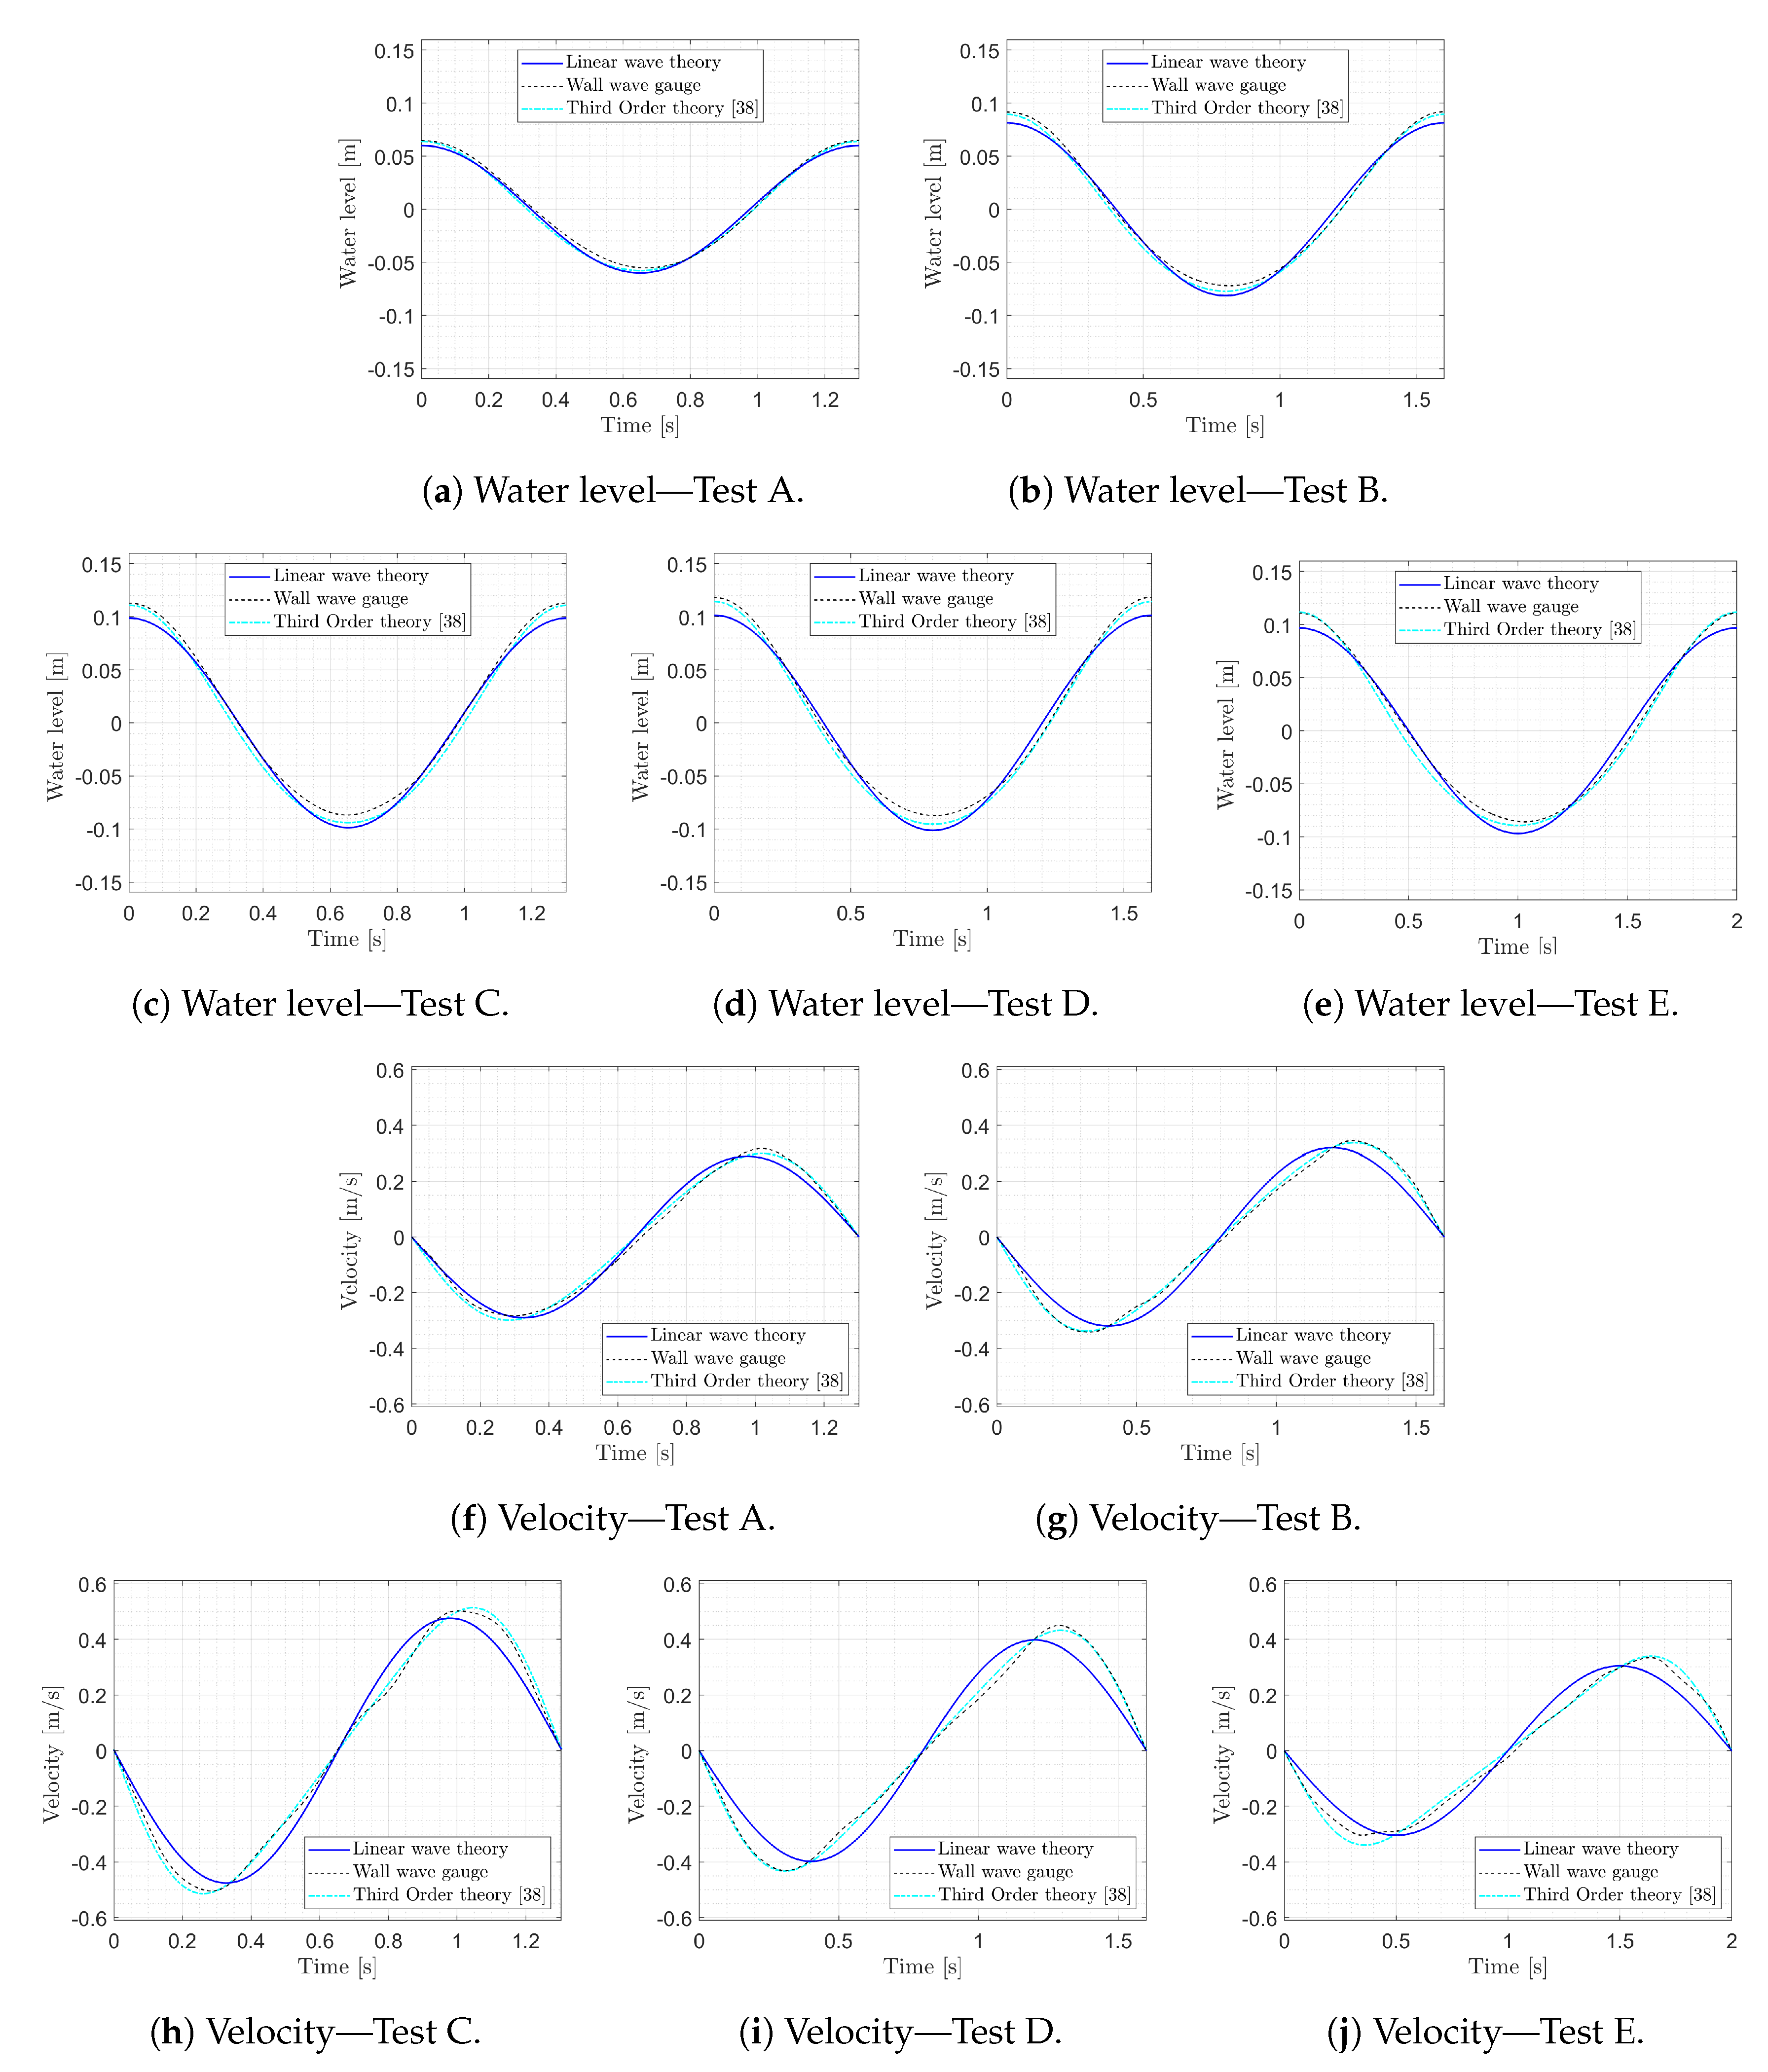
3.1. Theoretical Estimation

A theoretical method to estimate standing wave impact velocities was presented in Reference [1] based on linear wave theory. Considering the Ursell Number obtained for the different tests (see Table 1), the use of linear wave theory is suitable according to the criteria presented in Reference [43]. Thus, the advantages of this method are the suitability for describing the wave motion and the simplicity of the expressions that can be used in future design guidance. According to Reference [1], the wave impact velocity (U) can be obtained from Equation (1), for the condition of zero freeboard ( d = h ) and considering a 100% of wave reflection at the wall (reflection coefficient c r = 1 ). A 100% of wave reflection is applicable in this case as the incident wave is not affected by the presence of the overhang within the period T / 2 prior to the instant when the wave impact takes place.
U = ω H i ,
where U is the wave impact velocity, ω is the angular wave frequency ( ω = 2 π / T , where T is the incident wave period) and H i is the incident wave height.

3.2. Impact Velocity without Overhangs

This section compares the theoretical expression for the wave impact velocity based on linear wave theory (see Section 3.1) with the measurements by the wall wave gauge in the tests without an overhang. Figure 3 show the comparison between measurements and theoretical estimations for the water level and wave surface velocity. For the theoretical estimations, a reflection coefficient of 100% ( c r = 1 ) is considered. In addition to linear wave theory, the water level and wave surface velocity estimated by the third order wave theory from Reference [38] is also presented in Figure 3.
As shown in Figure 3, the theoretical estimations based on the linear wave theory describe rather accurately the water level and wave surface velocity at the wall. Given its accuracy and simplicity, this theoretical method is recommended to describe this wave field. Table 2 shows the differences between the impact velocity estimated by the linear wave theory ( U T ), with the measured maximum upward velocity ( U E M a x ), the measured zero-crossing upward velocity ( U E Z e r o ) and the zero-crossing upward velocity estimated by the third order wave theory ( U 3 Z e r o ). It is observed that the maximum upward velocities deviate more from linear wave theory (i.e., between +5.5% and +13.0%), while the zero-crossing upward velocities deviate less from linear wave theory (i.e., between +1.9% and +7.0%). The zero-crossing upward velocities estimated by the third order wave theory deviate slightly from the linear wave theory (i.e., between +1.8% and +4.7%).

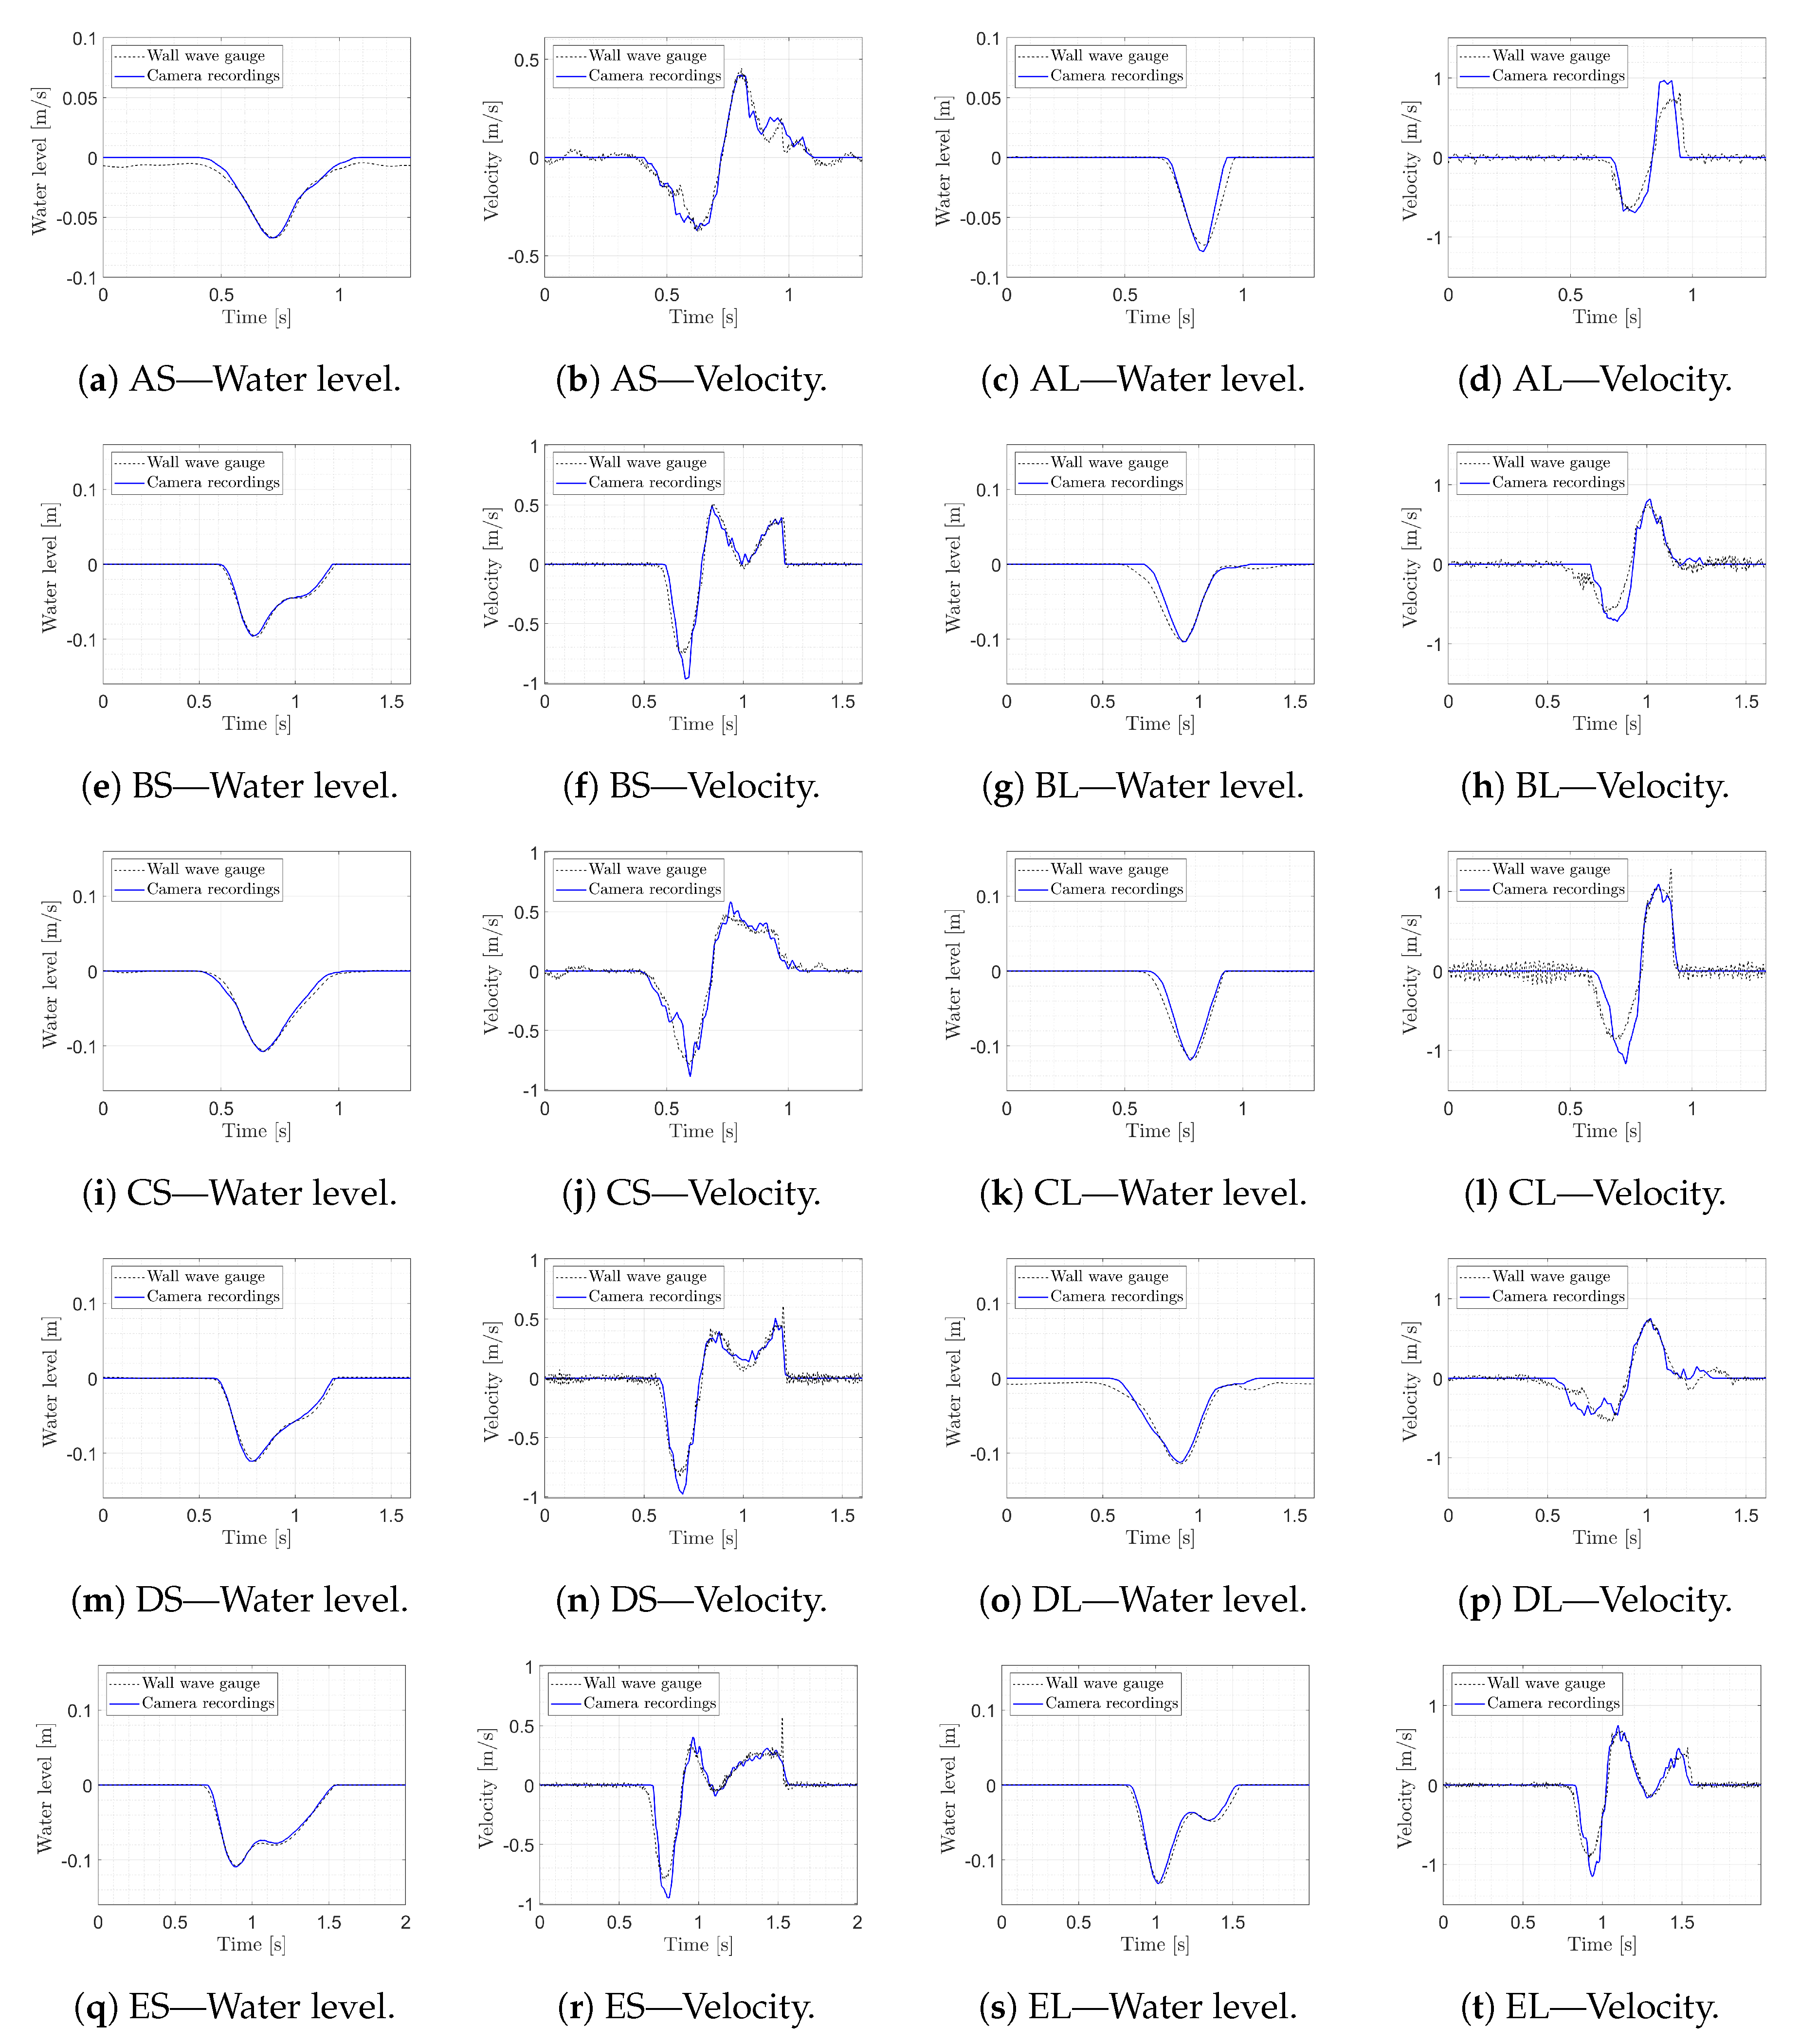
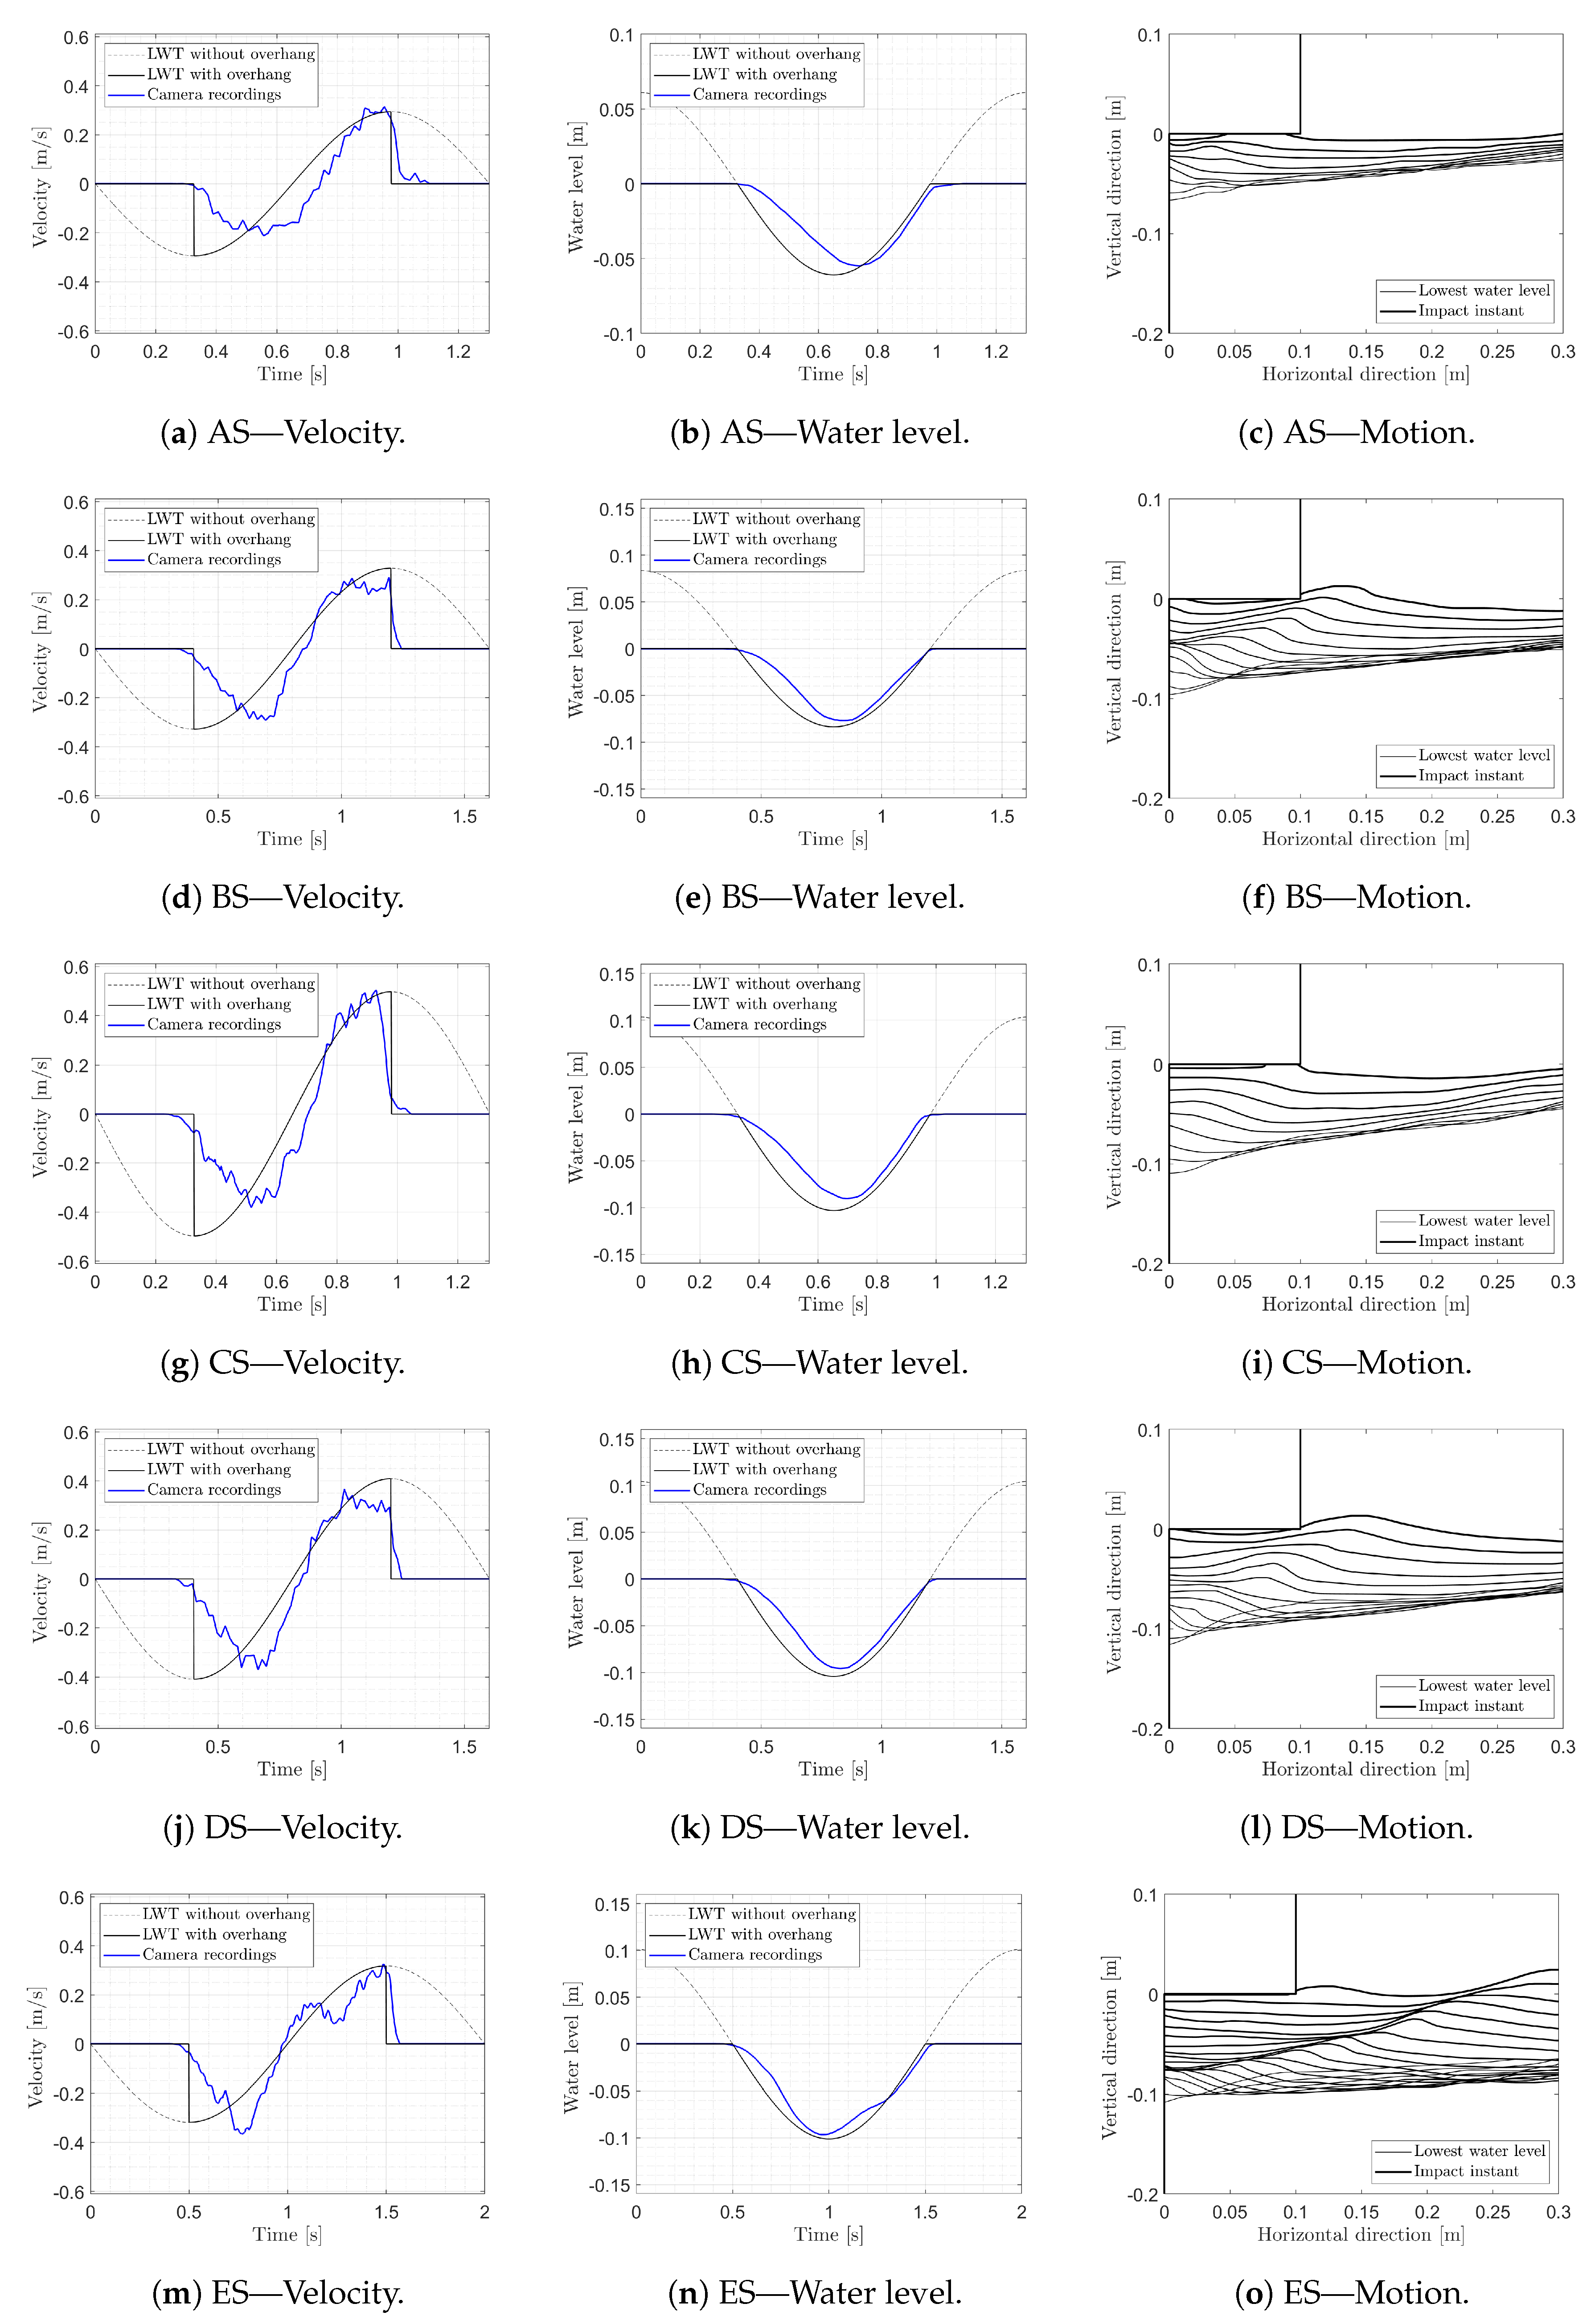
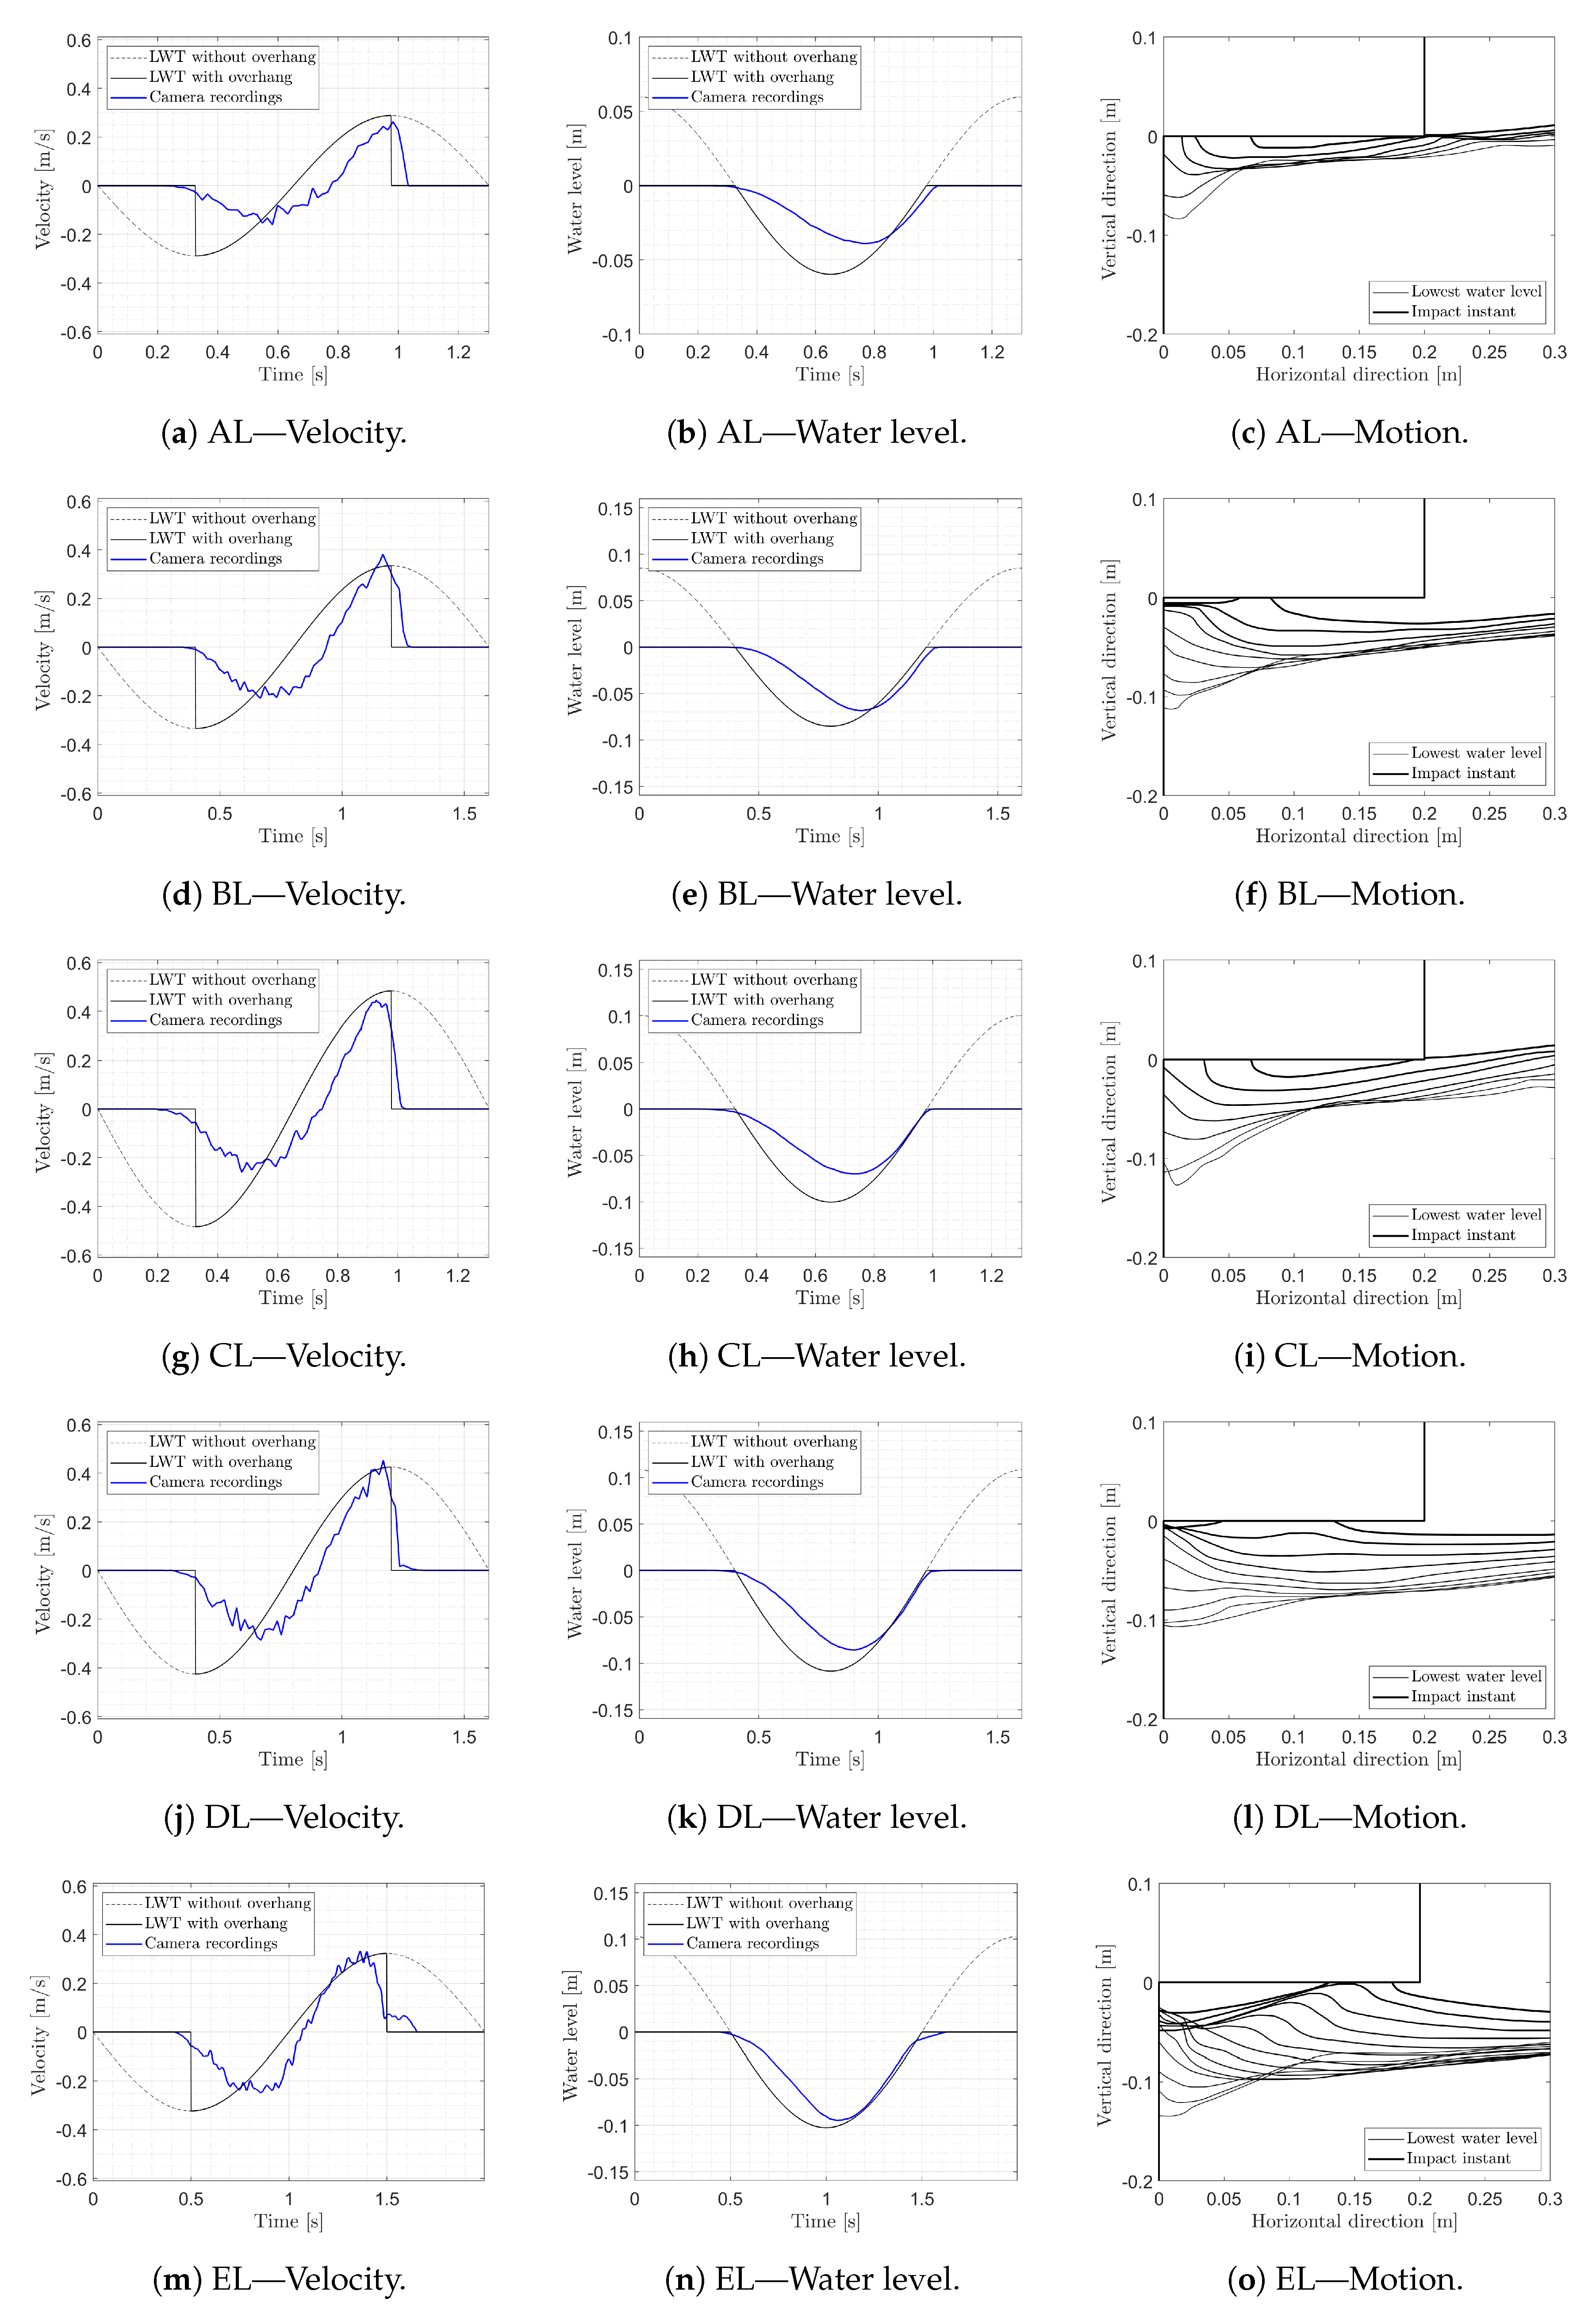
3.3. Impact Velocity with Overhangs

This section addresses the wave impact velocity for tests with an overhang. The measurements of the wall wave gauge are only obtained locally at the wall, without fully representing the complete wave (velocity) field beneath the overhang and includes local velocities created by splashes and other oscillations. Thus, camera recording measurements are used instead, which are able to describe the velocity along the wave surface beneath the overhang. Nevertheless, the velocity measurements from the camera recording measurements at the wall (averaged within 10 mm from the wall) are first compared in Figure 4 with the wall wave gauge measurements to validate the camera recordings.
Figure 4 shows that a close agreement is found from this comparison, so the camera recording measurements can be used hereafter for the study of the impact velocity for tests with the presence of an overhang. Nevertheless, four minor discrepancies in this comparison should be explained. Firstly, discrepancies in the negative velocities in various tests are found to be caused by conditions where a thin layer of water remains at the wall, captured by the camera as a sudden fall and by the wall wave gauge as a progressive fall. Secondly, discrepancies in positive velocities are found to be caused by conditions with a highly aerated water portion at the wall, captured by the camera as a sudden rise and by the wall wave gauge as a progressive rise (e.g., higher peak for test AL). Thirdly, discrepancies in the water level for test AS and DL are caused by a stationary air bubble located under the overhang throughout the wave cycle. Fourth, high short velocity peaks for the wall wave gauge data is considered to be caused by sudden air bubbles displacement affecting the conductivity at the wall wave gauge (e.g., tests CL, DS and ES). Furthermore, this comparison is used to better adjust the synchronization of the camera recording measurements in all the tests, taking as reference the wall wave gauge wave surface velocity measurements.
The camera recordings are used in this study to characterize the displacement of water surface before the wave impact. From each image frame from the camera recordings, the water surface was recognized. This is used to estimate the wave impact velocity and the non-uniformity of the wave surface before and during the wave impact. The water level and wave surface velocity presented hereafter are calculated as the average along the length of the overhang, 0.1 m for the shorter overhang and 0.2 m for the longer overhang. Figure 5 presents the results for the shorter overhang, while Figure 6 presents the results for the longer overhang. Table 3 summarizes the results for tests with overhangs, describing the differences between the impact velocity estimated by the linear wave theory ( U T ), with the measured maximum upward velocity ( U E M a x O H ). In this study, U T is calculated and showed in all graphs as the value obtained at the wall position, without averaging over the overhang length. This leads to a difference of between 0.11% to 0.35% in the obtained velocities for shorter overhangs and to a difference of between 0.39% to 1.26% in the obtained velocities for longer overhangs. This method allows consistency and simplicity in this study, with impact velocities obtained from Equation (1).
From Figure 5 and Figure 6 a few observations can be made. As shown in the third column in both figures, the wave surface motion before the impact presents large variability between the different tests. This illustrates the complex hydrodynamics that affects the wave surface displacement before the wave impacts, influenced by the incident wave conditions and structural characteristics. These complex hydrodynamics are observed both for the shorter and the longer overhang. As a consequence, the wave surface velocity and water level shown in the first and second columns also present a significant variability and differences from the theoretical estimations. Table 3 summarizes the differences between the experimental measurements for the wave surface velocity compared with linear wave theory, ranging between −11.8% and +13.4%. This table also presents the effective bounce-back factor β U T as calculated in Reference [1] considering the wave impact velocity according to linear wave theory, and the effective bounce-back factor β U E M a x O H considering the wave impact velocity according to camera recordings. For the 10 tests considered in this study the effective bounce-back factor β U E M a x O H presents a higher mean and standard deviation ( μ = 1.21 and σ = 0.16 ) than β U T ( μ = 1.19 and σ = 0.12 ). These experimental results illustrate that when considering the impact velocity from camera recordings, the mean effective bounce-back factor deviates relatively little from when linear wave theory is used (1.21 instead of 1.19, ≈1% difference) while the uncertainty described by the standard deviation increases significantly (0.16 instead of 0.12, ≈35% difference). The values of β U T presented in this study are slightly different than in Reference [1] ( μ = 1.17 and σ = 0.11 ) since a reduced amount of tests are used here. Thus, the values of β U T from Reference [1] are recommended to be considered as a reference.

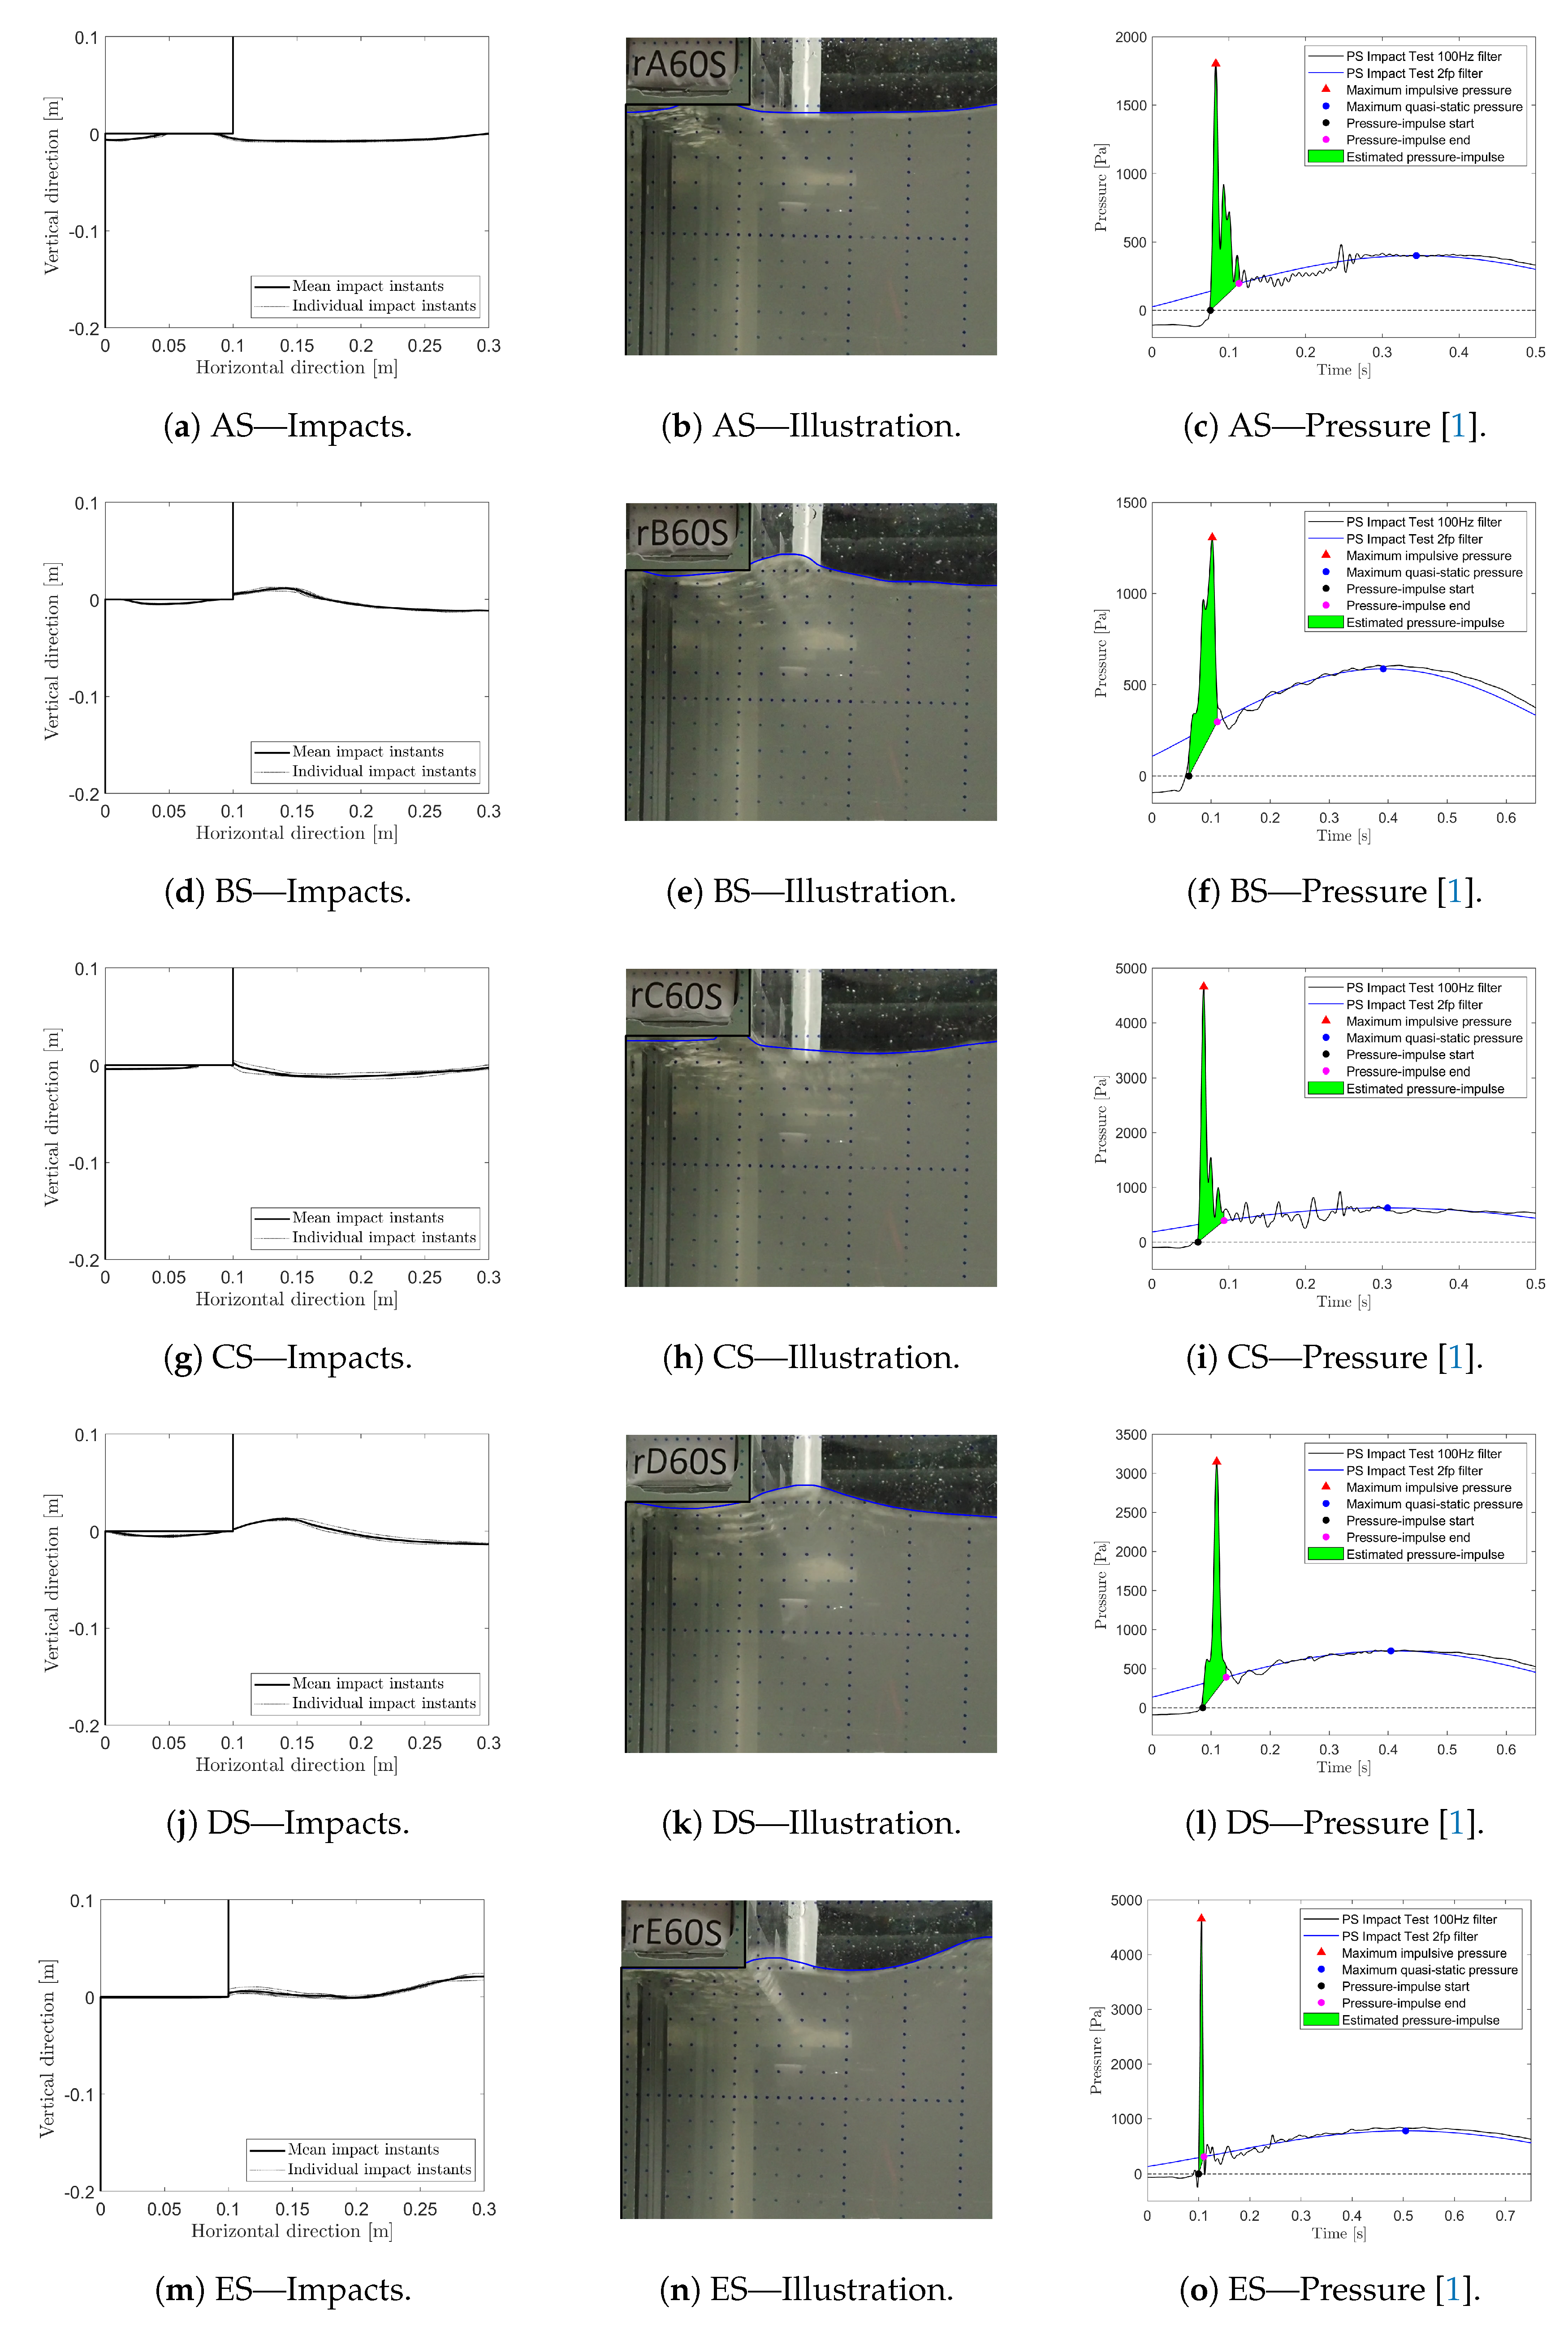
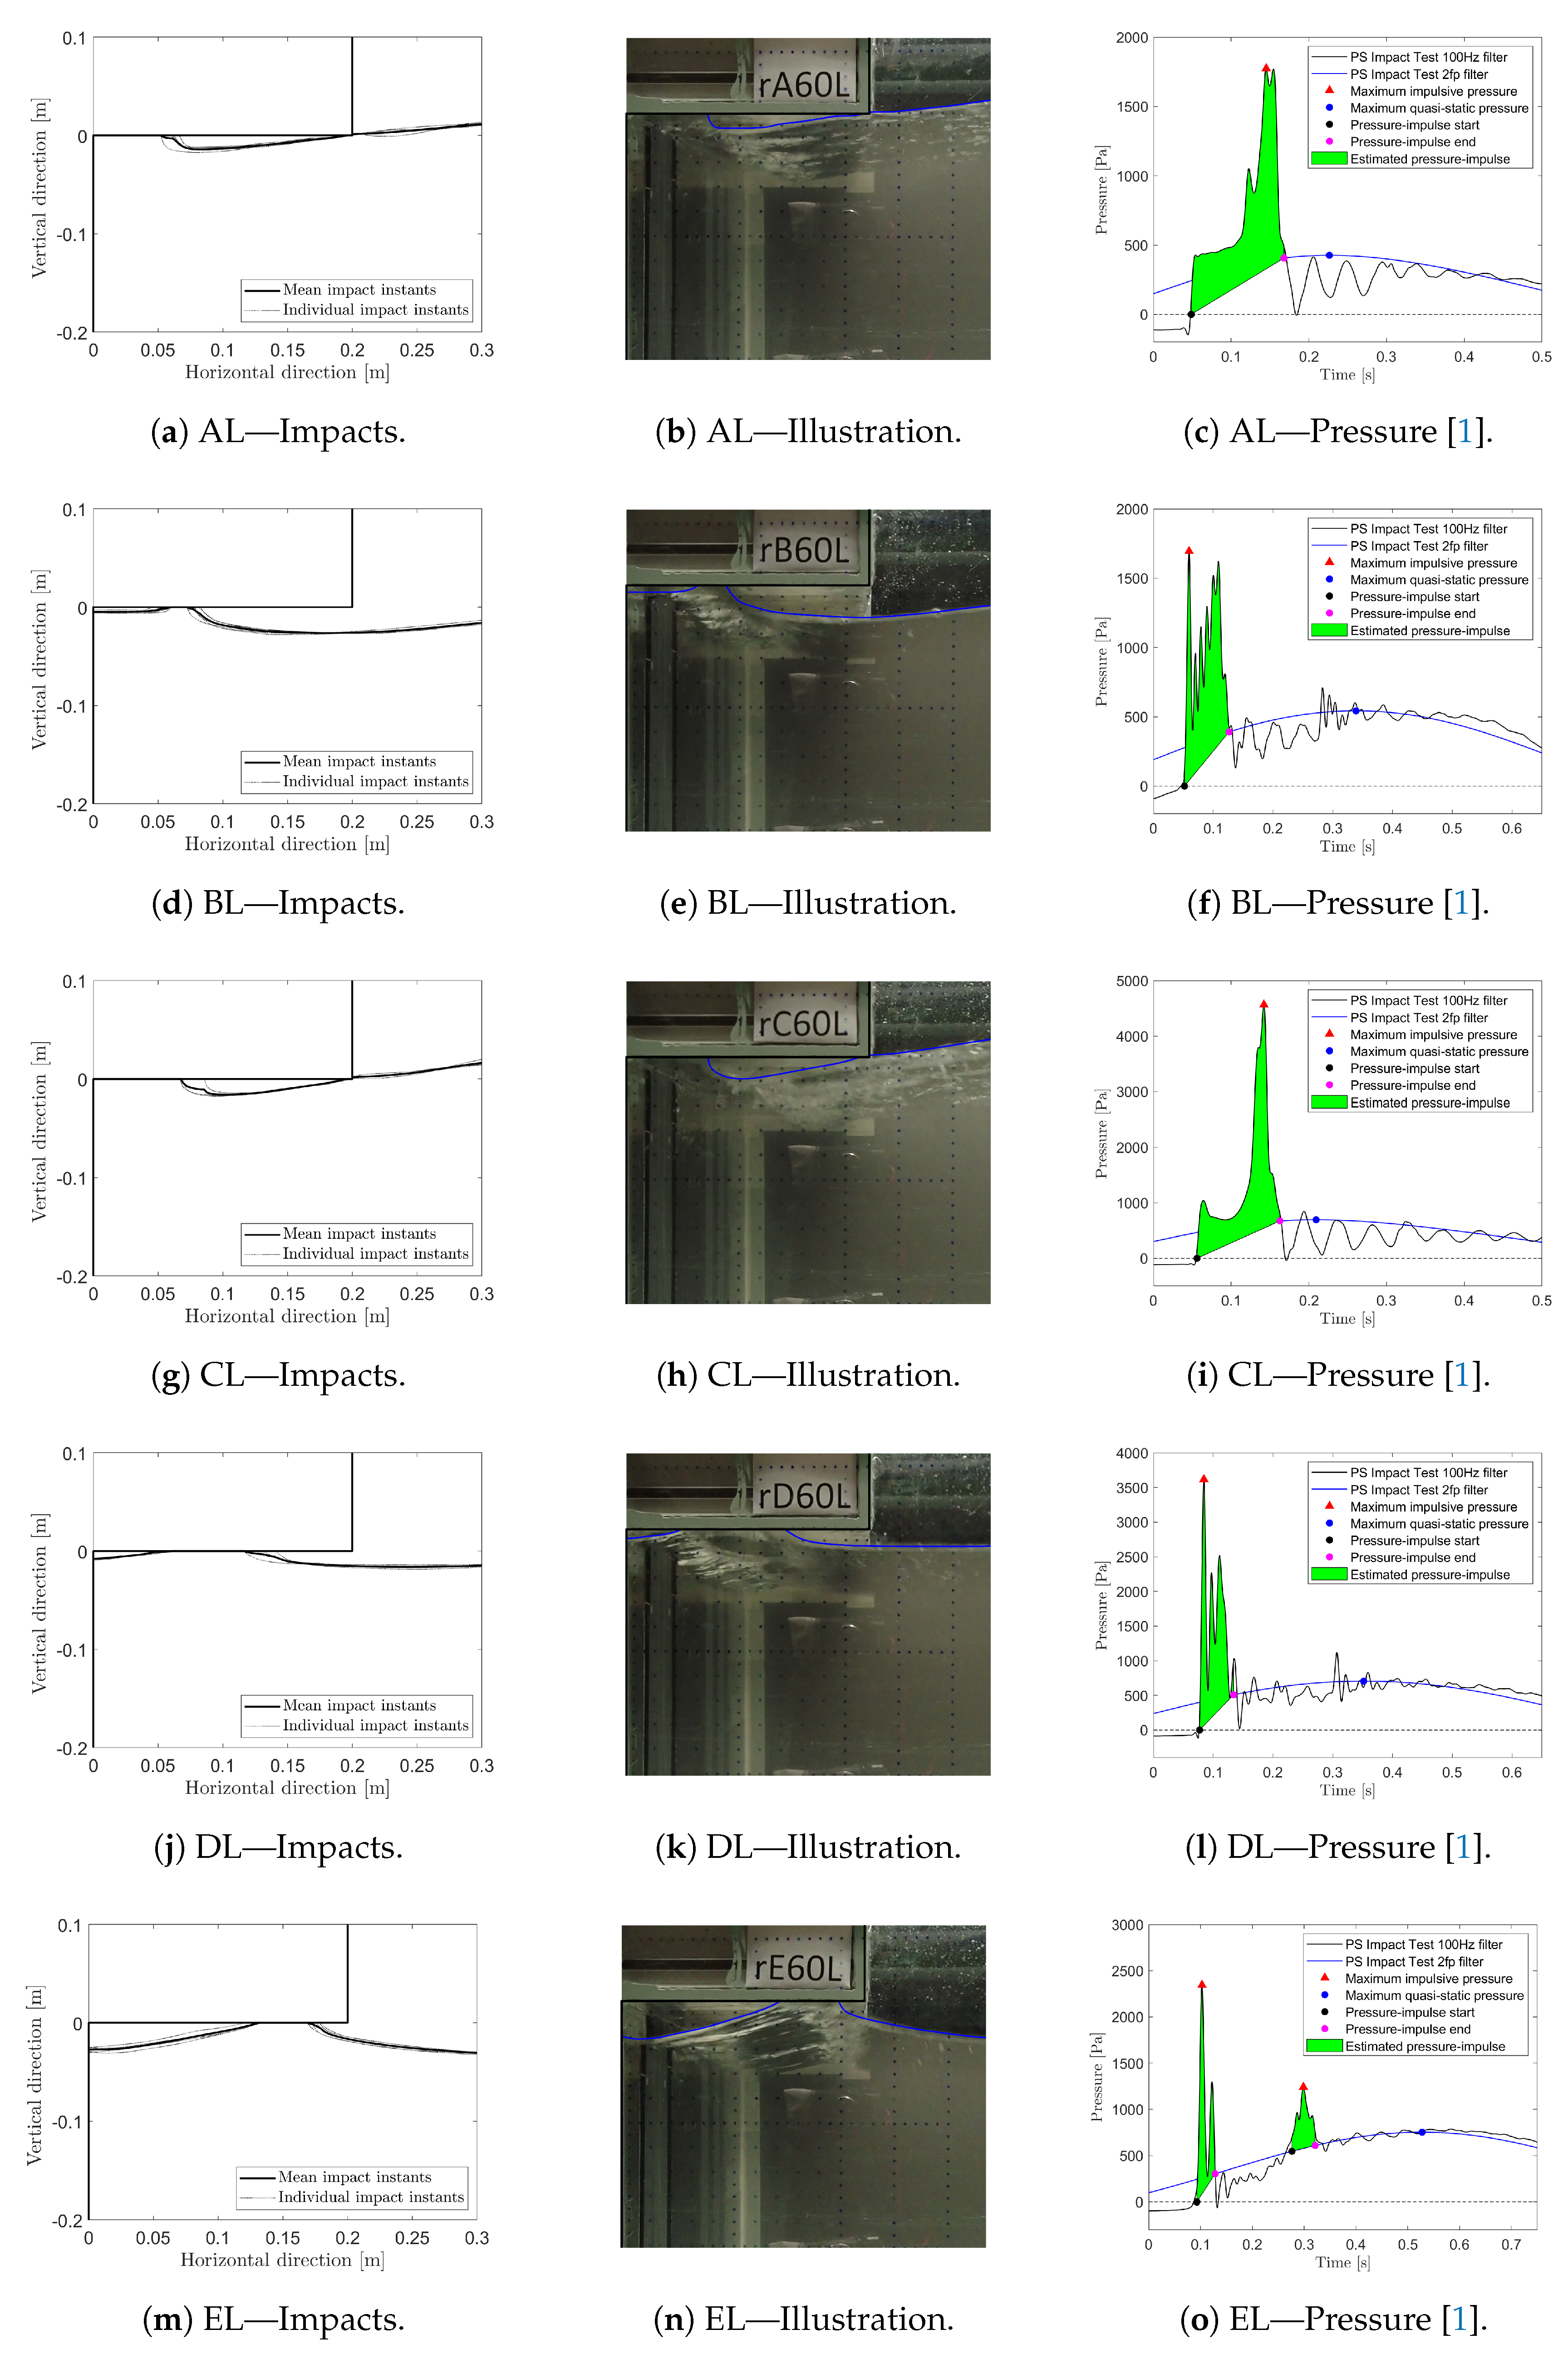
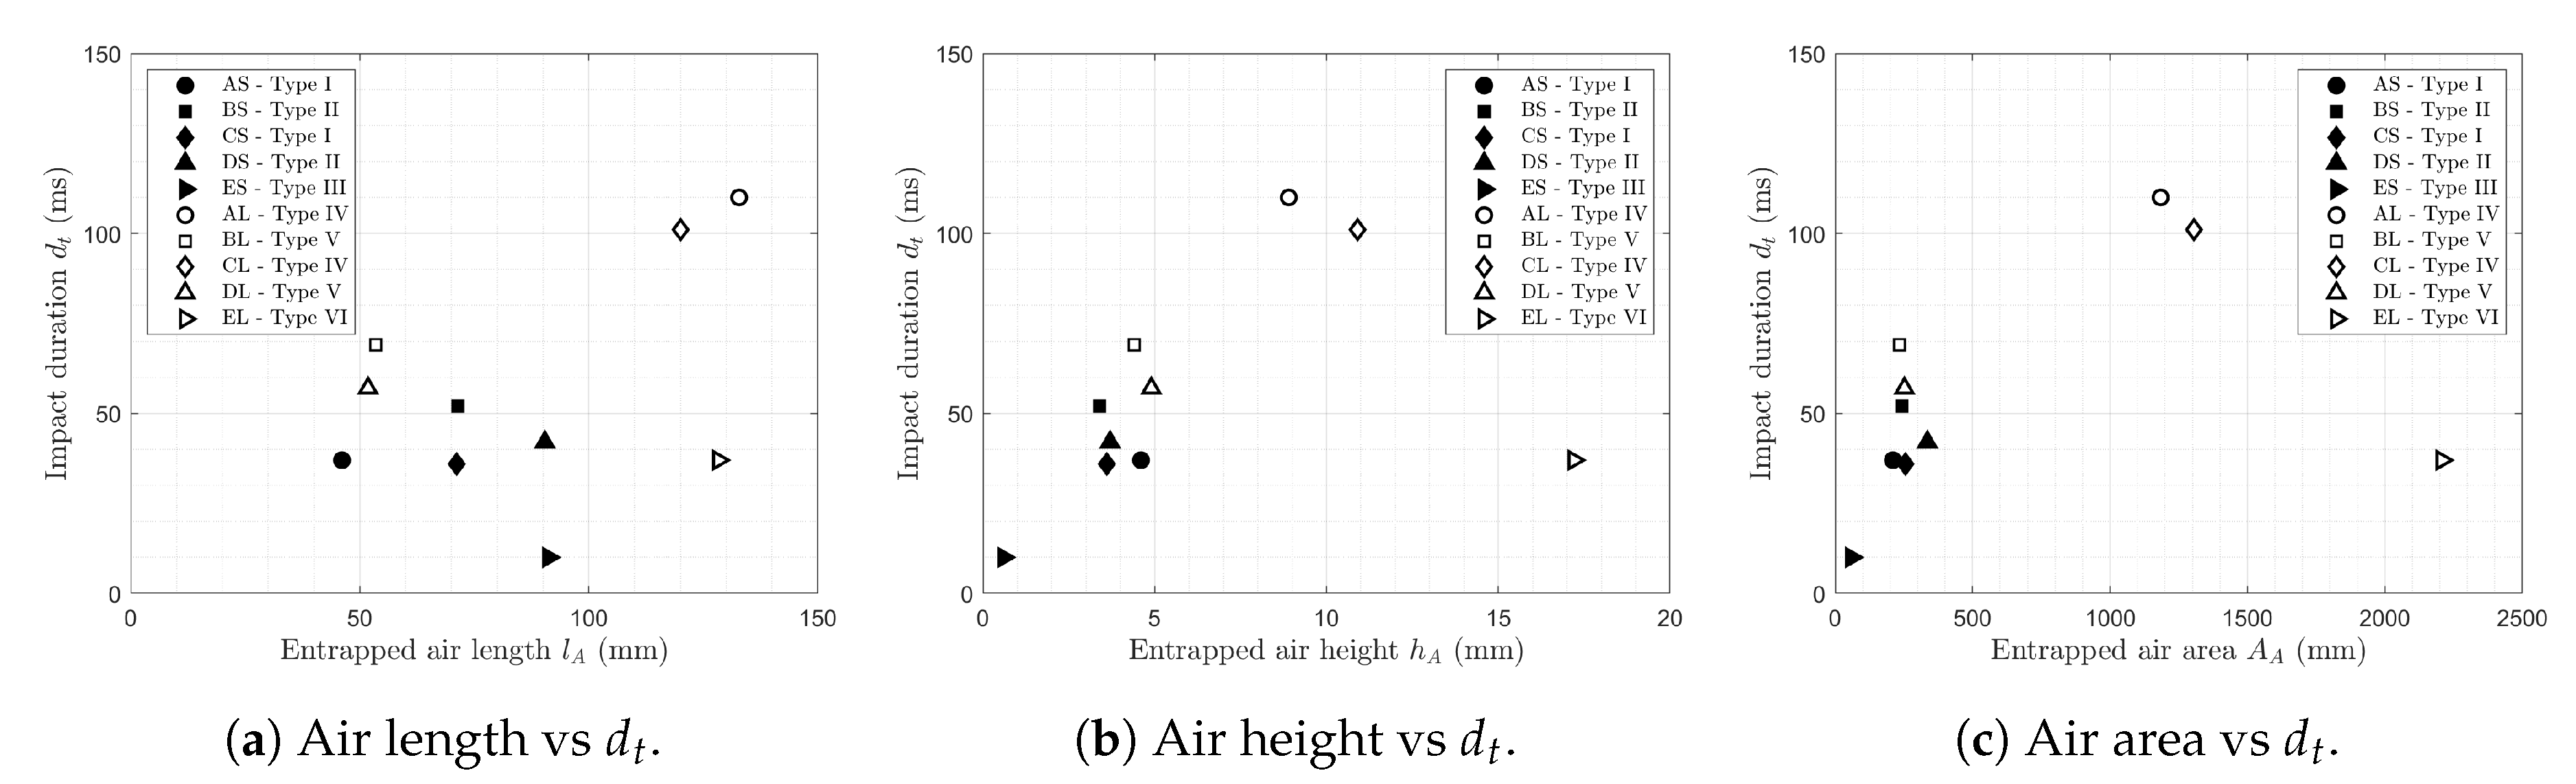
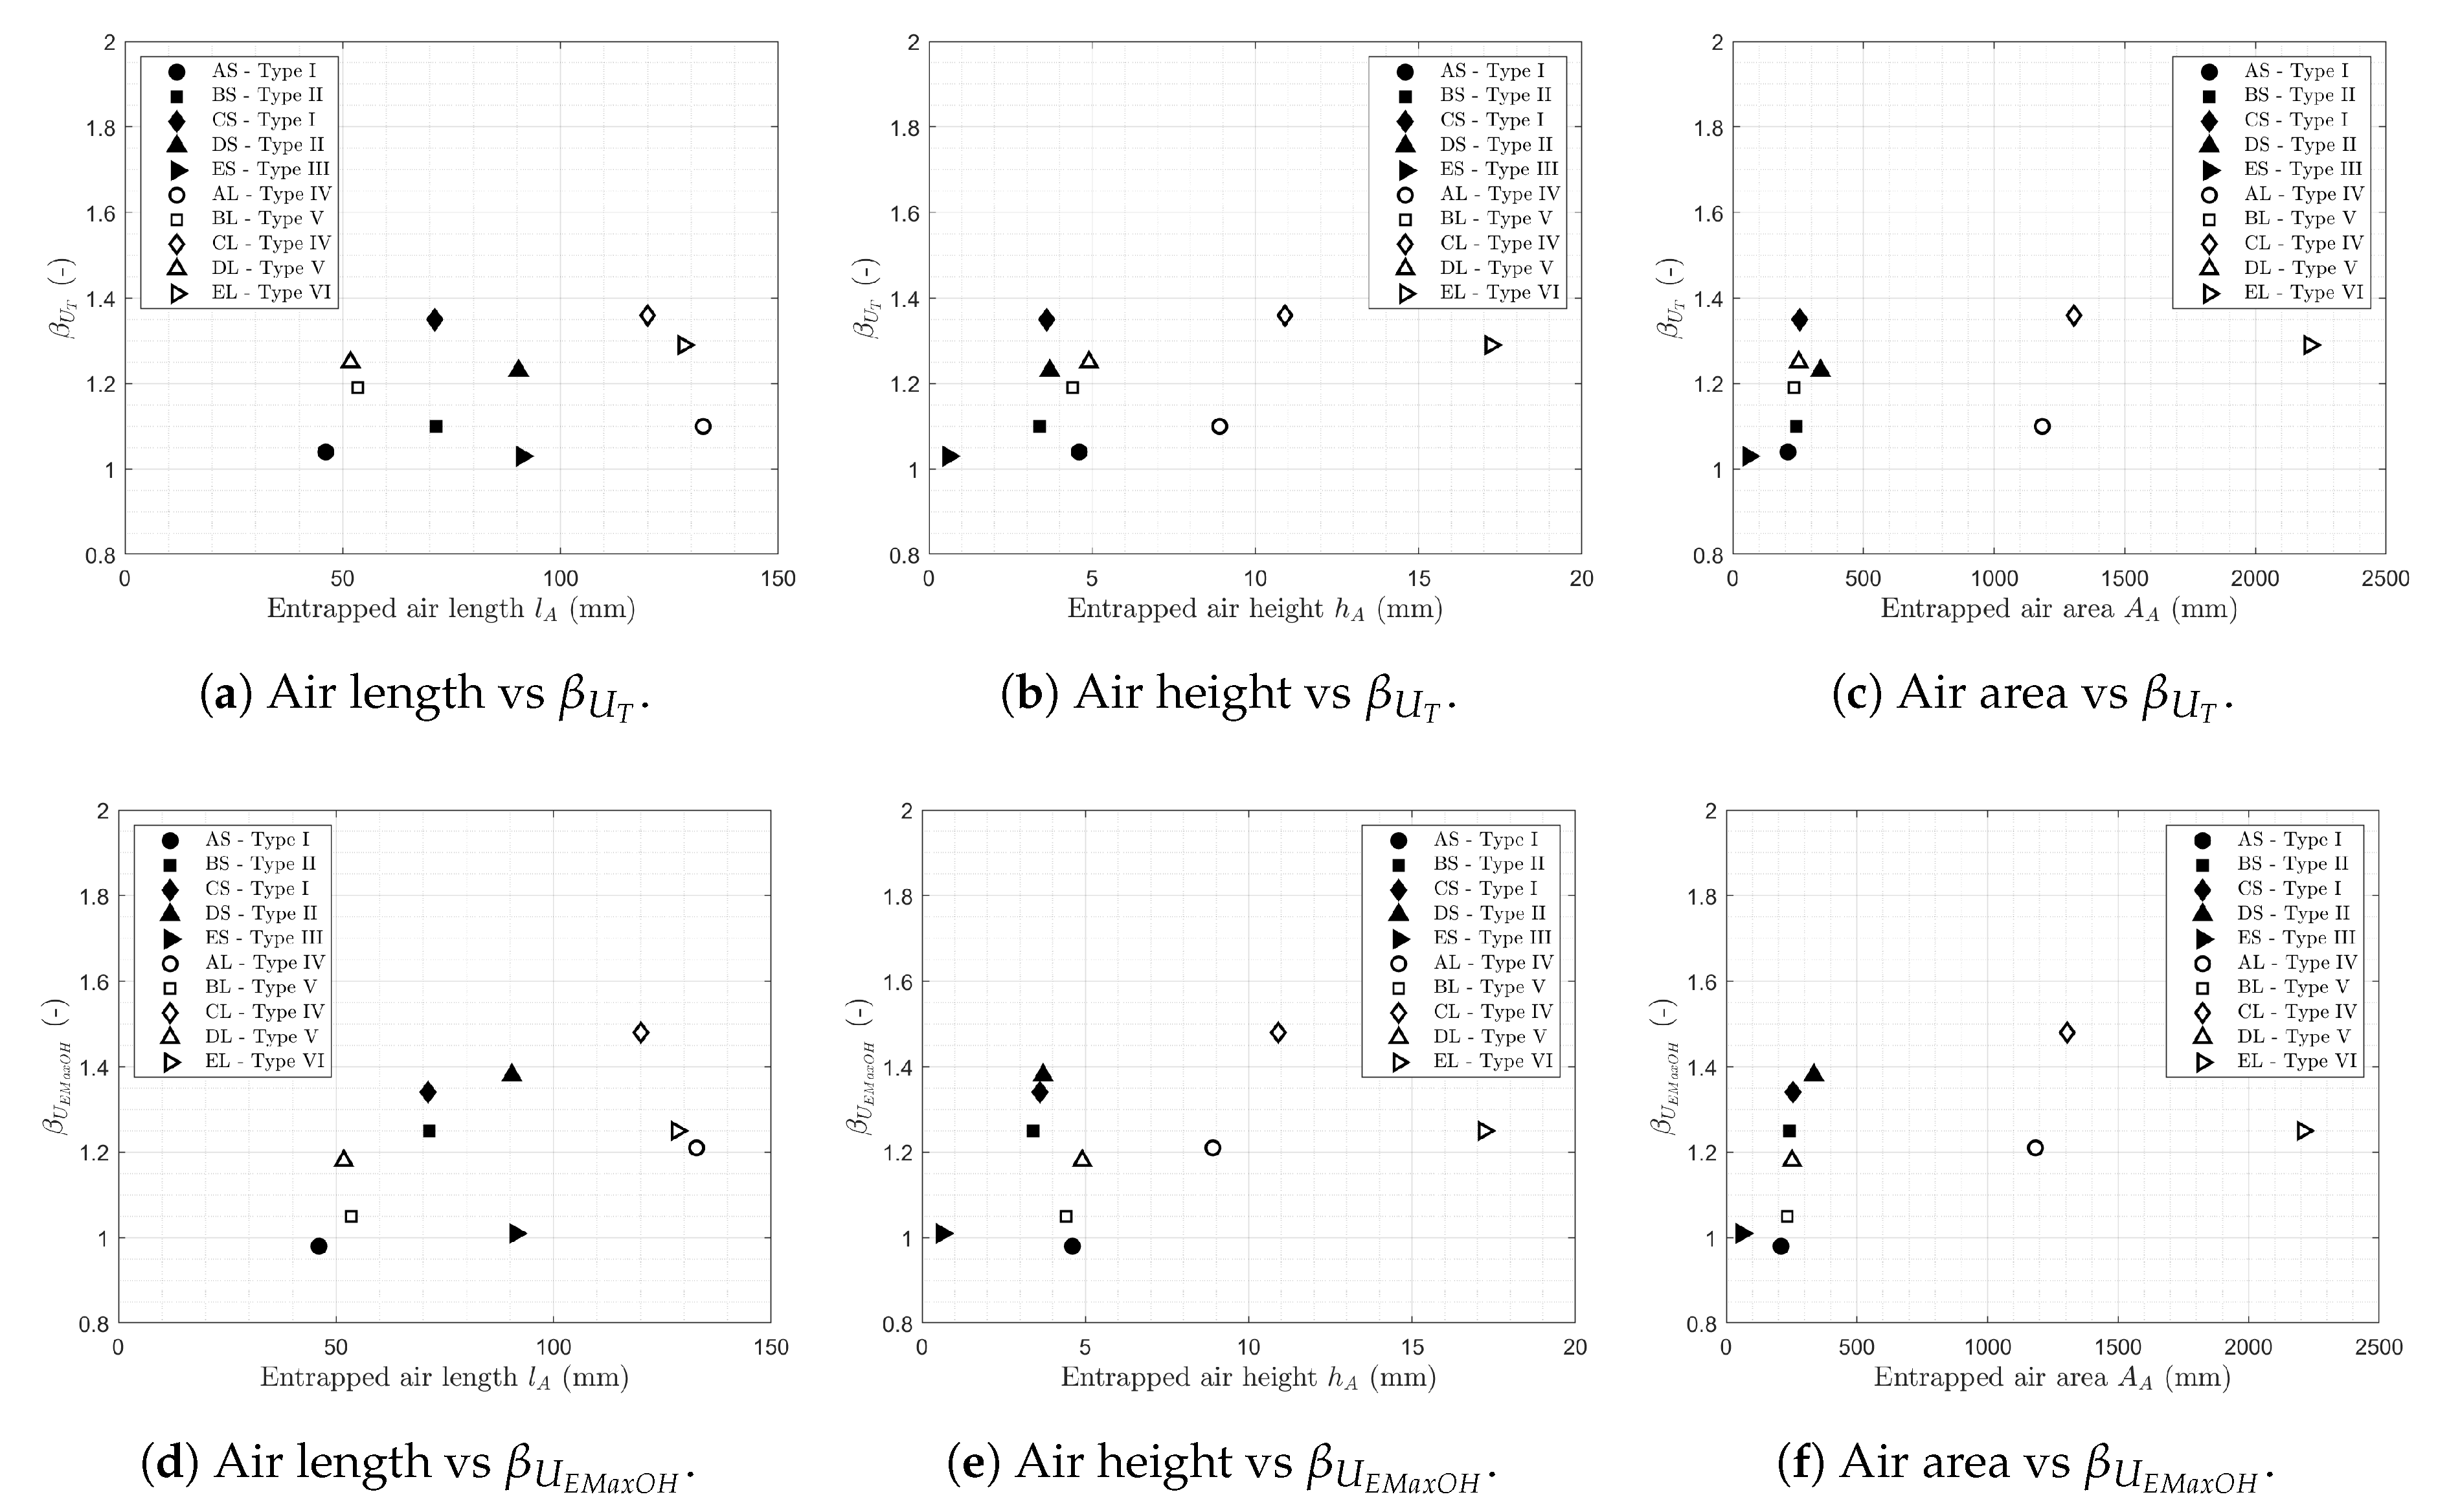
4. Entrapped Air Size Quantification

The presence of air is regarded as a source of dynamic processes which has led to a high degree of uncertainty in the study of wave impacts [2], including a decisive influence on the magnitudes and characteristics of wave impacts. Thus, the presence of air affects the variability and predictability of wave impact magnitudes and the characteristics of the pressure/force time-series, including their pressure/force peaks and impact durations. Moreover, the presence of air pockets in wave impacts may lead to pressure oscillations in the water column caused by the compression and decompression of air bubbles [27]. This section aims to extend the knowledge on wave impacts by quantifying the amount of entrapped air in the experiments with wave impacts caused by the presence of an overhang. The complex hydrodynamics shown in Figure 5 and Figure 6 affects directly these characteristics and variabilities of the entrapped air dimensions.
Figure 7 and Figure 8 show the wave surface at the instant of wave impact and the corresponding pressure signal, for shorter and longer overhang respectively. In these figures, the first column shows the water level at the impact instant for the various recorded waves and the average impact instant position from these waves. In the second column, the impact instant is shown for the first of these waves, while in the third column the pressure signal is shown also for this first wave impact. Entrapped air dimensions were determined from the contours of the average impact instant position. These are presented in Table 4, including the mean entrapped air length ( l A ), the variability of the entrapped air length ( σ l A / μ l A ), the mean entrapped air height ( h A ), the variability of the entrapped air height ( σ h A / μ h A ), the mean entrapped air area ( A A ) and the variability of the entrapped air area ( σ A A / μ A A ). The impact duration ( d t ) determined from the pressure signal (according to Reference [1]) is also included.
A few observations can be made on the characteristics of the entrapped air measured in the laboratory experiments, as shown in Figure 7 and Figure 8. It is found that the different tests lead to radically different dimensions and characteristics of entrapped air, caused by the interaction of incident wave parameters with structural configurations. For the tests with a shorter overhang, the differences in entrapped air area are up to a factor of 5.7 (factors of 2.0 for entrapped air length and 7.7 for entrapped air height), while for the tests with a longer overhang these differences in entrapped air area are up to a factor of 9.5 (factors of 2.6 for entrapped air length and 3.9 for entrapped air height). This variability on the entrapped air is expected to be the main cause of the radically different pressure time-series in the different tests, as shown in the pressure sensor measurements. Furthermore, it is observed that the entrapped air pockets are rather flat, in contrast to what can be observed in breaking waves, and more similar to the piston model from Bagnold [2].
For tests with shorter overhangs, Figure 5 and Figure 7 are analysed together, considering also the six impacts types from Reference [1]. For tests AS and CS an air pocket is found directly at the wall. This is named as Type I impact, which has one single peak, an intermediate level of vibrations and an intermediate impact duration. For tests BS and DS an air pocket is found away from the wall. This is named as Type II impact, which has one single peak, almost no vibrations and an intermediate impact duration. The presence of an air pocket away from the wall is caused by a previous run-up of the wave at the wall and a first pre-impact observed in the pressure signal for tests BS and DS. For test ES, a minimum air pocket is found below the overhang. This is named as Type III impact, which has one single peak, a reduced level of vibrations and a very short impact duration. For tests with longer overhangs, Figure 6 and Figure 8 are also analysed together. For tests AL and CL an air pocket is found away from the wall. This is named as Type IV impact, which has one stepped wide peak, an intermediate level of low frequency vibrations and a very long impact duration. The presence of this air pocket away from the wall is caused by a previous run-up of the wave at the wall and a first pre-impact observed in the pressure signal for tests AL and CL. For tests BL and DL an air pocket is found directly at the wall. This is named as Type V impact, which has one peak with a close secondary peak, large vibrations and a long impact duration. For test EL, an extremely large air pocket is found below the overhang. This is named as Type VI impact, which has two peaks within an interval of 0.2 s ( T / 10 ), an intermediate level of vibrations and an intermediate impact duration. This double impact (see Figure 6o and Figure 8o) occurs as the wave surface first hits the outer edge of the overhang, before a second pressure peak occurs when the wave surface at the wall impacts the overhang.
Figure 9 presents a comparison between the entrapped air dimensions (i.e., length, height and area) and the impact duration. According to these results, the increase in the entrapped air dimensions is closely related to an increase in the impact duration. This relation is caused by the compression of air during the wave impact, as it is predicted by References [2,6]. The discrepancy for the double peak EL test is explained by the fact that the impact duration is calculated as the impact duration of the first of the two pressure peaks. For the tests AL and CL with a strong pre-peak, it is important to mention that the impact duration is much longer due to this pre-peak. Nevertheless, for all the tests (besides for test EL) a rather strong correlation exists between impact duration and entrapped air dimensions. Among the entrapped air dimensions, the entrapped air height ( h A ) shows the strongest correlation with the impact duration. The entrapped air area ( A A ) also show a high correlation with the impact duration, while the entrapped air length ( l A ) does not show any clear trend. Furthermore, Figure 9 also shows that the entrapped air height and entrapped air length are related to the overhang length (W). It is observed that for the tests with the longer overhangs, the entrapped air pockets are thicker and longer. This suggests that the overhang length may determine both the maximum entrapped air length and the maximum entrapped air height.
Figure 10 presents a comparison between the entrapped air dimensions (i.e., length, height and area) and the effective bounce back factor β (including β U T and β U E M a x O H ). For all cases, larger β values are found for larger entrapped air dimensions. These relations highlight that the effective bounce-back factor β accounts for the entrapped air dimensions, but the associated scatter also shows that β is affected by other processes and uncertainties. Furthermore, this scatter in the observed trends between β and entrapped air height is larger in Figure 10d/e/f for β U E M a x O H (where the impact velocity is obtained from camera recordings) than in Figure 10a/b/c for β U T (where the impact velocity is obtained from linear wave theory). In summary, according to experiments analysed in this study, the increase in the entrapped air dimensions is linked to an increase of the variability of wave impact magnitudes, an increase of pressure/force impulses, an increase of the impact durations and a decrease of the pressure/force peaks.

5. Conclusions

The impact velocity and the entrapped air are two main processes with a significant effect on the loading characteristics (e.g., impact magnitudes, duration, oscillations and variability) for wave impacts on vertical structures with overhangs. Furthermore, these loading characteristics are particularly important for slender structures which are especially susceptible to dynamic behaviour under such impulsive loads. Thus, impact velocity and entrapped air are studied by means of laboratory experiments. This study analysed laboratory data for relatively short overhangs with respect to the wave length ( 12.1 < L / W < 43.6 ) and with respect to the overhang height ( 3 < h / W < 6 ). These structures were tested in a wave flume subjected to low-steepness, non-breaking regular waves.
The impact velocity according to linear wave theory is reasonably in agreement with experimental measurements from a wall wave gauge for tests without overhangs, with maximum upward velocities deviating from linear wave theory between +5.5% and +13.0%, while the zero-crossing upward velocities deviate from linear wave theory between +1.9% and +7.0%. The zero-crossing upward velocities estimated from third order wave theory deviate from the linear wave theory between +1.8% and +4.7%. In the tests with overhangs, the maximum upward velocity below the overhang estimated by camera recording measurements deviates from linear wave theory between −11.8% and +13.4%. These larger deviations for the tests with overhangs illustrate the complex hydrodynamics that affects the wave surface displacement before the wave impacts, influenced by the incident wave conditions and structural characteristics. It was also found that when considering the impact velocity from camera recordings, the mean effective bounce-back factor β deviates relatively little from when linear wave theory is used (1.21 instead of 1.19, ≈1% difference) while the uncertainty described by the standard deviation increases significantly (0.16 instead of 0.12, ≈35% difference).
The entrapped air dimensions also present large variations between the tests, caused by the interaction between incident wave parameters and structural configurations. It was found differences in the entrapped air area up to a factor of 5.7 for shorter overhangs and a factor of 9.5 for longer overhangs. This variability in the entrapped air characteristics is expected to lead to significant effects on the loading on the structure caused by these wave impacts, as observed by the pressure measurements. Furthermore, the relation between the increase of impact durations caused by increased entrapped air dimensions is found in the experimental measurements. Among the entrapped air dimensions, the entrapped air height shows the strongest correlation with the impact duration. The entrapped air area also show a high correlation with the impact duration, while the entrapped air length does not show any clear trend. A relation is also found between increasing effective bounce-back factor β for increasing entrapped air dimensions. This relation highlights that the effective bounce-back factor β accounts for the entrapped air dimensions, but the associated scatter also shows that β is affected by other processes and uncertainties. Furthermore, this scatter in the observed trend between β and entrapped air length is larger for β U E M a x O H (where the impact velocity is obtained from camera recordings) than for β U T (where the impact velocity is obtained from linear wave theory).
This study highlights the importance of the details of the impact velocity and entrapped air for determining the standing wave impact load on vertical structures with overhangs. These two factors show a large variability caused mainly by the interaction between the structure and the incident wave field. Thus, more extensive research in this area is recommended, including the use of numerical methods. The combination of analytical, experimental and numerical methods would allow to further reduce the existing uncertainties and increase the reliability in the design of vertical hydraulic structures with overhangs. This is particularly important for thin structures such as steel gates which are especially susceptible to a dynamic behaviour under such impulsive loads.

Author Contributions

Conceptualization, methodology, validation, investigation, writing-review and editing: E.d.A and B.H.; formal analysis, data curation, writing-original draft preparation, visualization: E.d.A.; resources, supervision, project administration, funding acquisition: B.H. All authors have read and agreed to the published version of the manuscript.

Funding

This study is part of the DynaHicS (Dynamics of Hydraulic Structures) research programme, supported by NWO (Nederlandse Organisatie voor Wetenschappelijk Onderzoek) grant ALWTW.2016.041.

Conflicts of Interest

The authors declare no conflict of interest.

References

  1. De Almeida, E.; Hofland, B. Validation of pressure-impulse theory for standing wave impact loading on vertical hydraulic structures with short overhangs. Coast. Eng. 2020, 159, 103702. [Google Scholar] [CrossRef]
  2. Bagnold, R.A. Wave-pressure research. Inst. Civ. Eng. 1939, 12, 202–226. [Google Scholar] [CrossRef]
  3. Minikin, R.R. Winds, Waves and Maritime Structures; Griffin: London, UK, 1950. [Google Scholar]
  4. Goda, Y. A new method of wave pressure calculation for the design of composite breakwater. In Proceedings of the Coastal Engineering Conference, Copenhagen, Denmark, 24–28 June 1974. [Google Scholar]
  5. Takahashi, S.; Tanimoto, K.; Shimosako, K. A Proposal of impulsive pressure coefficient for design of composite breakwaters. In Proceedings of the International Conference of Hydro-Technical Engineering for Port and Harbour Construction, Yokosuka, Japan, 19–21 October 1994. [Google Scholar]
  6. Mitsuyasu, H. Shock pressure of breaking wave. In Proceedings of the Coastal Engineering Conference, Orlando, FL, USA, 2–6 September 1996. [Google Scholar]
  7. Partenscky, H.W. Dynamic forces due to waves breaking at vertical coastal structures. In Proceedings of the Coastal Engineering Conference, Sol-Malaga, Spain, 20–25 June 1988. [Google Scholar]
  8. Oumeraci, H.; Kortenhaus, A.; Allsop, W.; de Groot, M.; Crouch, R.; Vrijling, H.; Voortman, H. Proverbs: Probabilistic Design Tools for Vertical Breakwaters; Balkema: Lisse, The Netherlands, 2001. [Google Scholar]
  9. Cuomo, G.; Allsop, W.; Bruce, T.; Pearson, J. Breaking wave loads at vertical seawalls and breakwaters. Coast. Eng. 2010, 57, 424–439. [Google Scholar] [CrossRef] [Green Version]
  10. Kisacik, D.; Troch, P.; Bogaert, P.V.; Caspeele, R. Investigation of uplift impact forces on a vertical wall with an overhanging horizontal cantilever slab. Coast. Eng. 2014, 90, 12–22. [Google Scholar] [CrossRef]
  11. Chen, X.; Hofland, B.; Altomare, C.; Suzuki, T.; Uijttewaal, W. Forces on a vertical wall on a dike crest due to overtopping flow. Coast. Eng. 2015, 95, 94–104. [Google Scholar] [CrossRef]
  12. Chen, X.; Hofland, B.; Uijttewaal, W. Maximum overtopping forces on a dike-mounted wall with a shallow foreshore. Coast. Eng. 2016, 116, 89–102. [Google Scholar] [CrossRef]
  13. McConnell, K.; Allsop, W.; Cruickshank, I. Piers, Jetties and Related Structures Exposed to Waves: Guidelines for Hydraulic Loadings; Thomas Telford Publishing: London, UK, 2004. [Google Scholar]
  14. Cuomo, G.; Tirindelli, M.; Allsop, W. Wave-in-deck loads on exposed jetties. Coast. Eng. 2007, 54, 657–679. [Google Scholar] [CrossRef]
  15. Seiffert, B.; Hayatdavoodi, M.; Ertekin, R.C. Experiments and computations of solitary-wave forces on a coastal-bridge deck. Part I: Flat Plate. Coast. Eng. 2014, 88, 194–209. [Google Scholar] [CrossRef]
  16. Hayatdavoodi, M.; Seiffert, B.; Ertekin, R.C. Experiments and computations of solitary-wave forces on a coastal-bridge deck. Part II: Deck with girders. Coast. Eng. 2014, 88, 210–228. [Google Scholar] [CrossRef]
  17. Dias, F.; Ghidaglia, J.M. Slamming: Recent Progress in the Evaluation of Impact Pressures. Annu. Rev. Fluid Mech. 2018, 50, 243–273. [Google Scholar] [CrossRef]
  18. Sonneville, B.; Hofland, B.; Mowinckel, A.; Paulsen, B. Wave impact loads on offshore gravity based structure. In Proceedings of the OMAE Conference, St. John’s, NL, Canada, 31 May–5 June 2015. [Google Scholar]
  19. Bogaert, H. An experimental investigation of sloshing impact physics in membrane LNG tanks on foating structures. Ph.D. Thesis, Delft University of Technology, Delft, The Netherlands, 2018. [Google Scholar]
  20. Ramkema, C. A model law for wave impacts on coastal structures. In Proceedings of the Coastal Engineering Conference, Hamburg, Germany, 27 August–3 September 1978. [Google Scholar]
  21. Castellino, M.; Sammarco, P.; Romano, A.; Martinelli, L.; Ruol, P.; Franco, L.; Girolamo, P.D. Large impulsive forces on recurved parapets under non-breaking waves. A numerical study. Coast. Eng. 2018, 136, 1–15. [Google Scholar] [CrossRef]
  22. Martinelli, L.; Ruol, P.; Volpato, M.; Favaretto, C.; Castellino, M.; Girolamo, P.D.; Franco, L.; Romano, A.; Sammarco, P. Experimental investigation on non-breaking wave forces and overtopping at the recurved parapets of vertical breakwaters. Coast. Eng. 2018, 141, 52–67. [Google Scholar] [CrossRef]
  23. de Almeida, E.; Hofland, B.; Jonkman, S. Wave impact pressure-impulse on vertical structures with overhangs. In Proceedings of the Coastal Structures Conference, Hannover, Germany, 30 September–2 October 2019. [Google Scholar]
  24. WL. Wave impacts on the gate in the Eastern Scheldt caisson. In Dutch: Golfklappen op de Schuif in de Oosterschelde-Caisson; Verslag M 1335 deel I; WL Delft Hydraulics (Presently Deltares): Delft, The Netherlands, 1977. [Google Scholar]
  25. WL. Wave impacts against concrete perforated gates. In Dutch: Golfklappen Tegen Betonnen Roosterschuiven; Verslag M 1381 deel II; WL Delft Hydraulics (Presently Deltares): Delft, The Netherlands, 1978. [Google Scholar]
  26. WL. Wave impacts: A piston model with compressible water. In Dutch: Golfklappen: Een Zuigermodel Met Samendrukbaar Water; Verslag M 1335 deel II; WL Delft Hydraulics (Presently Deltares): Delft, The Netherlands, 1979. [Google Scholar]
  27. WL. Wave impacts: A literature review and scale effects in model studies. In Dutch: Golfklappen: Een Literaturroverzicht en Schaaleffekten in Modelonderzoek; Verslag M 1335 deel III; WL Delft Hydraulics (Presently Deltares): Delft, The Netherlands, 1979. [Google Scholar]
  28. Hofland, B. Modeltesten Golfkrachten Spuisluizen Afsluitdijk; Meetrapport 1220263; Deltares: Delft, The Netherlands, 2015. [Google Scholar]
  29. Cooker, M.J.; Peregrine, D.H. A model for breaking wave impact pressures. In Proceedings of the Coastal Engineering Conference, Delft, The Netherlands, 2–6 July 1990. [Google Scholar]
  30. Cooker, M.J.; Peregrine, D.H. Pressure-impulse theory for liquid impact problems. J. Fluid Mech. 1995, 297, 193–214. [Google Scholar] [CrossRef]
  31. Wood, D.J.; Peregrine, D.H. Wave impact beneath a horizontal surface. In Proceedings of the Coastal Engineering Conference, Orlando, FL, USA, 2–6 September 1996. [Google Scholar]
  32. Peregrine, D.H.; Thais, L. The effect of entrained air in violent wave impacts. J. Fluid Mech. 1996, 325, 377–397. [Google Scholar] [CrossRef]
  33. Wood, D.J.; Peregrine, D.H.; Bruce, T. Study of wave impact against a wall with pressure-impulse theory. I: Trapped air. J. Waterw. Port Coast. Ocean. Eng. 2000, 126, 182–190. [Google Scholar] [CrossRef]
  34. Bredmose, H.; Peregrine, D.; Bullock, G. Violent breaking wave impacts. Part 2: Modelling the effect of air. J. Fluid Mech. 2009, 641, 389–430. [Google Scholar] [CrossRef]
  35. Peregrine, D.H. Water-wave impact on walls. Annu. Rev. Fluid Mech. 2003, 35, 23–43. [Google Scholar] [CrossRef]
  36. Sainflou, M. Essai sur les digues maritimes verticales. Ann. Des Ponts Chaussées 1928, 98, 5–48. [Google Scholar]
  37. Miche, M. Mouvement ondulatoire de la mer en profondeur constante ou decroissante. Ann. Des. Ponts Chaussées 1944, 121, 285–318. [Google Scholar]
  38. Tadjbakhsh, I.; Keller, J.B. Standing surface waves of finite amplitude. J. Fluid Mech. 1960, 8, 442–451. [Google Scholar] [CrossRef]
  39. Penney, W.G.; Price, A.T.; Martin, J.C.; Moyce, W.J.; Thornhill, C.K. Finite periodic stationary gravity waves in a perfect liquid. Philos. Trans. R. Soc. Lond. 1952, 244, 254–284. [Google Scholar]
  40. Goda, Y. Finite periodic stationary gravity waves in a perfect liquid. Coast. Eng. Jpn. 1967, 10, 1–11. [Google Scholar] [CrossRef]
  41. Jeng, D. Wave kinematics of partial reflection from a vertical wall. Ocean. Eng. 2002, 29, 1711–1724. [Google Scholar] [CrossRef]
  42. Teo, H. Wave pressures on a vertical wall due to short-crested waves: Fifth-order approximation. Ocean. Eng. 2003, 30, 2157–2166. [Google Scholar] [CrossRef]
  43. Hedges, T. Regions of validity of analytical wave theories. ICE Water Marit. Energy 1995, 112, 111–114. [Google Scholar] [CrossRef]
  44. Fenton, J.D. Wave Forces on Vertical Walls. J. Waterw. Port Coast. Ocean. Eng. 1985, 111, 693–718. [Google Scholar] [CrossRef]
  45. Bridges, T.J. Wave Forces on Vertical Walls. J. Waterw. Port Coast. Ocean. Eng. 1986, 29, 2819–2827. [Google Scholar]
  46. Romanczyk, W. Instability of nonlinear standing waves in front of a vertical wall. J. Fluids Struct. 2007, 23, 733–753. [Google Scholar] [CrossRef]
  47. Chen, X.; Hofland, B.; Molenaar, W.; Capel, A.; Gent, M.R.V. Use of impulses to determine the reaction force of a hydraulic structure with an overhang due to wave impact. Coast. Eng. 2019, 147, 75–88. [Google Scholar] [CrossRef]
  48. Tieleman, O.C.; Tsouvalas, A.; Hofland, B.; Jonkman, S.N. A three dimensional semi-analytical model for the prediction of gate vibrations. Mar. Struct. 2019, 65, 134–153. [Google Scholar] [CrossRef] [Green Version]
  49. Zelt, J.; Skjelbreia, J. Estimating Incident and Reflected Wave Fields Using an Arbitrary Number of Wave Gauges. In Proceedings of the Coastal Engineering Conference, Venice, Italy, 4–9 October 1992. [Google Scholar]
Figure 1. Overview of the experimental facility and model setup.
Jmse 08 00857 g001
Figure 2. Test setup and instrumentation, adapted from Reference [1]. All dimensions in centimetres.
Jmse 08 00857 g002
Figure 3. Water level and wave surface velocity for tests without overhangs. Comparison between linear wave theory (solid blue lines), measurements at the vertical wall with a wall wave gauge (dashed black lines) and third order wave theory based on Reference [38] (point-dashed cyan lines).
Jmse 08 00857 g003
Figure 4. Water level and wave surface velocity at the wall for tests with overhangs. Comparison between wall wave gauge measurements (dashed black lines) and camera measurements averaged within 10 mm from the wall (solid blue lines).
Jmse 08 00857 g004
Figure 5. Tests with shorter overhangs. Left and centre: water level and wave surface velocity from camera recordings averaged over the overhang width (solid blue lines) compared with theoretical estimations (black lines). Right: wave motion before wave impact.
Jmse 08 00857 g005
Figure 6. Tests with longer overhangs. Left and centre: water level and wave surface velocity from camera recordings averaged over the overhang width (solid blue lines) compared with theoretical estimations (black lines). Right: wave motion before wave impact.
Jmse 08 00857 g006
Figure 7. Wave surface and entrapped air at wave impact instant for tests with a shorter overhang. The impact instant shown in the images (left and center column) corresponds to the camera frame intermediately before the pressure-impulse start point shown in the pressure plots in the right column.
Jmse 08 00857 g007
Figure 8. Wave surface and entrapped air at wave impact instant for tests with a longer overhang. The impact instant shown in the images (left and center column) corresponds to the camera frame intermediately before the pressure-impulse start point shown in the pressure plots in the right column (for test EL, the impact instant corresponds to the first peak).
Jmse 08 00857 g008
Figure 9. Entrapped air dimensions in comparison with impact duration.
Jmse 08 00857 g009
Figure 10. Entrapped air dimensions in comparison with effective bounce-back factor.
Jmse 08 00857 g010
Table 1. Summary of measured incident wave conditions.
TestW [m]h [m]d [m]H [m] σ H μ H [%]T [s]L [m]s [-] c r [-] U r [-]Impact Type [-]
A--0.60.0603.31.302.420.0250.981.6No impact
B--0.60.0811.71.603.270.0250.994.0No impact
C--0.60.0993.11.302.430.0410.982.7No impact
D--0.60.1012.31.603.270.0310.995.0No impact
E--0.60.0970.52.004.360.0220.998.5No impact
AS0.10.60.60.0612.31.302.420.0250.841.7Type I
BS0.10.60.60.0841.81.603.270.0260.934.1Type II
CS0.10.60.60.1033.71.312.430.0420.812.8Type I
DS0.10.60.60.1042.41.603.270.0320.945.2Type II
ES0.10.60.60.1010.42.004.360.0230.928.9Type III
AL0.20.60.60.0601.31.302.420.0250.671.6Type IV
BL0.20.60.60.0853.11.603.270.0260.784.2Type V
CL0.20.60.60.1002.01.302.430.0410.632.7Type IV
DL0.20.60.60.1083.51.603.270.0330.745.4Type V
EL0.20.60.60.1030.62.004.360.0240.829.0Type VI
Table 2. Impact velocity for tests without overhang.
Test U T [m/s] U EMax [m/s] U EMax to U T [%] U EZero [m/s] U EZero to U T [%] U 3 Zero [m/s] U 3 Zero to U T [%]
A0.2900.316+9.20.310+7.00.295+1.8
B0.3190.345+8.00.332+3.80.329+3.0
C0.4750.502+5.50.499+4.90.498+4.7
D0.3970.449+13.00.423+6.50.416+4.6
E0.3040.334+9.90.310+1.90.317+4.2
Table 3. Impact velocity for tests with overhangs.
Condition U T [m/s] U EMaxOH [m/s] U EMaxOH to U T [%] β U T [-] β U EMaxOH [-]
AS0.2940.313+6.61.040.98
BS0.3280.289−11.81.101.25
CS0.4970.502+1.11.351.34
DS0.4090.365−10.81.231.38
ES0.3180.326+2.41.031.01
AL0.2880.261−9.31.101.21
BL0.3350.379+13.41.191.05
CL0.4830.445−8.01.361.48
DL0.4260.451+6.11.251.18
EL0.3230.333+3.11.291.25
Table 4. Summary of entrapped air dimensions.
Test l A [mm] σ l A μ l A [%] h A [mm] σ h A μ h A [%] A A [mm 2 ] σ A A μ A A [%] d t [ms]
AS46.16.64.68.3210.09.637
BS71.46.43.412.9242.47.652
CS71.13.43.67.5255.710.536
DS90.45.03.712.5335.59.142
ES91.29.60.622.459.214.010
AL132.82.88.914.51184.016.5110
BL53.511.34.424.3233.332.669
CL120.19.210.96.51304.815.3101
DL51.816.04.912.1252.010.057
EL128.33.417.212.52207.615.137
Publisher’s Note: MDPI stays neutral with regard to jurisdictional claims in published maps and institutional affiliations.

