Article

SPH Simulations of Real Sea Waves Impacting a Large-Scale Structure

by
Corrado Altomare
1,2,
Angelantonio Tafuni
3,*,
José M. Domínguez
4,
Alejandro J. C. Crespo
4,
Xavi Gironella
1 and
Joaquim Sospedra
1
1
Maritime Engineering Laboratory, Universitat Politècnica de Catalunya, BarcelonaTech, 08034 Barcelona, Spain
2
Department of Civil Engineering, Ghent University, B-9052 Ghent, Belgium
3
School of Applied Engineering and Technology, New Jersey Institute of Technology, Newark, NJ 07102, USA
4
Environmental Physics Laboratory, Campus Sur, Universidade de Vigo, 32004 Ourense, Spain
*
Author to whom correspondence should be addressed.
J. Mar. Sci. Eng. 2020, 8(10), 826; https://doi.org/10.3390/jmse8100826
Submission received: 18 September 2020 / Revised: 8 October 2020 / Accepted: 14 October 2020 / Published: 21 October 2020
(This article belongs to the Special Issue Wave Interactions with Coastal Structures)

Abstract

:
The Pont del Petroli is a dismissed pier in the area of Badalona, Spain, with high historical and social value. This structure was heavily damaged in January 2020 during the storm Gloria that hit southeastern Spain with remarkable strength. The reconstruction of the pier requires the assessment and characterization of the wave loading that determined the structural failure. Therefore, a state-of-the-art Computational Fluid Dynamic (CFD) code was employed herein as an aid for a planned experimental campaign that will be carried out at the Maritime Engineering Laboratory of Universitat Politècnica de Catalunya-BarcelonaTech (LIM/UPC). The numerical model is based on Smoothed Particle Hydrodynamics (SPH) and has been employed to simulate conditions very similar to those that manifested during the storm Gloria. The high computational cost for a full 3-D simulation has been alleviated by means of inlet boundary conditions, allowing wave generation very close to the structure. Numerical results reveal forces higher than the design loads of the pier, including both self-weight and accidental loads. This demonstrates that the main failure mechanism that led to severe structural damage of the pier during the storm is related to the exceeded lateral soil resistance. To the best of the authors’ knowledge, this research represents the first known application of SPH open boundary conditions to model a real-world engineering case.

1. Introduction

In January 2020, the sea storm Gloria [1] struck the Mediterranean coasts of Spain and France with remarkable strength. The combination of extreme wave conditions, wind velocities, and the long event duration caused severe damage to assets and infrastructures. Many coastal platforms suffered from extensive damage due to the impact of big waves and fatigue. One of these is the Pont del Petroli, a pier located in Badalona, in the northern area of Barcelona, Spain. It is a structure integrated into the coastline with high historical, scientific and social value, and it was heavily damaged by the storm Gloria. Changes in the bathymetry of the area where the pier is built, together with extreme wave conditions that were not accounted for in the design and building process of the pier, led to stresses that the structure was eventually unable to withstand. As a result, the main platform of the pier suffered from serious damage, most likely due to the induced shear stress in the concrete and exceeded soil bearing capacity. Moreover, one of the beams that form the footbridge was completely washed away. Parts of the damaged structure were removed after the storm for safety reasons. The local authorities of Badalona intend to repair and rebuild the pier mainly for its social and historical value to the city of Barcelona. However, there is a lack of knowledge regarding the exact weather conditions that led to such high damage during storm Gloria.
With the aim to cover this gap, an experimental campaign is currently under development at the Maritime Engineering Laboratory at Universitat Politècnica de Catalunya—BarcelonaTech (LIM/UPC), in Barcelona, Spain. The main goal is to reproduce the loads exerted on the pier by wave conditions similar to those that manifested during the sea storm Gloria. The pier will be modeled in the large-scale wave flume of the Maritime Engineering Laboratory at UPC. In preparation for the experimental campaign, numerical simulations have been chosen as a means to obtain accurate predictions of water flow around the pier under certain extreme weather conditions.
The use of Computational Fluid Dynamics (CFD) for enabling the study of fluid–structure interaction (FSI) and wave–structure interaction (WSI) problems, as well as the structural analysis of onshore and offshore facilities, has a long history. The first methods were based on potential flow theory [2,3,4,5,6], usually resorting to a velocity potential that satisfies a set of simplified governing equations (often times represented by the Euler equations) throughout the fluid domain. The employment of these techniques would request assumptions such as irrotational, inviscid fluid flow, linear or nonlinear wave theory and small displacements. However, the solution of the Navier–Stokes (NS) equations, with the incorporation of an accurate treatment for the viscous terms as well as the air–water interface, is generally required for WSI problems involving violent breaking and extreme wave loads. These equations can generally be discretized on a 2- or 3-D grid by the use of well-established techniques such as the Finite Volume (FV) or Finite Element (FE) methods. With the advent of new and more powerful hardware, including Central Processing Unit (CPU) and Graphics Processing Unit (GPU), the efficiency and effectiveness of the aforementioned methodologies have improved significantly, allowing the study of real-life problems [7,8,9,10,11].
In the last few decades, numerous additional CFD algorithms have been devised and perfected to address the ever increasing complexity of computer-aided simulations for the solution of challenging engineering problems. Among these is Smoothed Particle Hydrodynamics (SPH) [12,13,14], a fully Lagrangian meshless method that has been adapted from an original astrophysics framework to subsequent use in problems of free-surface hydrodynamics [15,16,17]. SPH has numerous advantages when simulating problems in the context of offshore and other marine structure analyses. Due to their fully Lagrangian nature, SPH particles do not require explicit routines that model advection, therefore the treatment of free-surface boundary conditions becomes seamless also in the case of large deformations, such as during the breaking process of a wave. Moreover, SPH has excellent conservation properties, not only for energy and linear momentum, but also for angular momentum. These and other aspects make SPH particularly suited for studying WSI and FSI problems [18,19]. In [20], several test cases were investigated, including a dam break flow past a fixed rigid column and the dynamical response of a floating object to the impact of incoming waves. The results suggest excellent agreement of SPH simulations with experimental benchmark data. In the context of marine structures and their dynamical response to large wave loads, the work of [21] proposes a hybrid SPH-FE method where the strength of SPH in simulating complex free surface flow is mixed with the high accuracy of the FE method in simulating the dynamics of the structure. Therein, a dam break flow was also investigated but with the presence of a flexible structure downstream, showing very good agreement with other methods. The authors of [22] build on the idea of coupling with other methods by employing a state-of-the-art SPH code together with a lumped-mass mooring dynamics model for the simulation of floating moored devices in regular waves. The comparison with experiments suggests that SPH is an excellent candidate for simulating freely and moored floating objects undergoing WSI. However, the authors anticipate the need for more work to cover a larger range of sea states, with an emphasis on irregular waves. All the aforementioned cases employ a one-phase flow approach, where the liquid is generally (though not always) modeled as a weakly-compressible fluid while the gas phase is neglected. Nevertheless, the capability of SPH of handling two-phase flow is also an active area of research with significant contributions available in the literature. The interested reader is referred to the following studies for a representative (though non-exhaustive) list of computational analyses with multi-phase SPH models in the contest of FSI and WSI [19,23,24,25].
In the present work, the open-source SPH code DualSPHysics [26] was employed to simulate the local wave conditions that determined the failure of the Pont del Petroli, and to analyze the wave–structure interaction. In particular, DualSPHysics was employed to characterize the wave loads on each pier element, with particular attention to those that were severely damaged during the sea storm Gloria. DualSPHysics is currently one of the most advanced CFD models based on SPH, with the latest developments significantly improving the efficiency of the solver for use on GPU and multi-GPU, as well as for coupling with other schemes and techniques [27,28,29]. Results from this work will be instrumental in the subsequent experimental campaign that will be carried out for the final design of the upgraded Pont del Petroli.
A description of the damage brought by storm Gloria to the Pont del Petroli and the possible source of it is presented next.

2. Study Case

2.1. The Pont del Petroli Pier

The Pont del Petroli was built in the 1960s to enable the transfer of oil from tankers onto land. The pier extends for approximately 250 m at sea near the Badalona sandy beach, close to Barcelona, Spain (Figure 1). The pier went out of industrial usage in 1990. In 2001, there was a popular opposition to its demolition and a proposal to adapt the pier for public use. The Pont del Petroli was then handed over to the Badalona City Council in 2003, with the council starting construction work in 2009 to repurpose the jetty into a leisure facility for public use. Taking advantage of this remodeling, LIM/UPC designed, integrated and installed scientific equipment all along the pier, effectively creating a base for sea and atmospheric monitoring. Because of this, the pier is now the only of such equipped coastal stations on the Catalan coast, unique on the Eastern coast of Spain, and a very rare instance in the entire Mediterranean sea. The pier has a front platform located 6 m above the mean water level that can be reached via a 3 m-wide and 240 m-long footbridge. The platform consists of a 9.75 m × 6.75 m armored concrete slab supported by perpendicular beams, also built in concrete. The footbridge structure is made of π -shaped concrete beams, each being 15 m long, and is supported by one pile cap on each extreme. Between 2 and 4 metallic 14 inch diameter piles are connected to the pile caps to support the whole structure. In total, there are 16 groups of piles, 14 of which with only two piles connected to the pile cap, while the remaining two are connected with four piles. A total of 20 piles are placed below the platform, connected to the supporting beams.
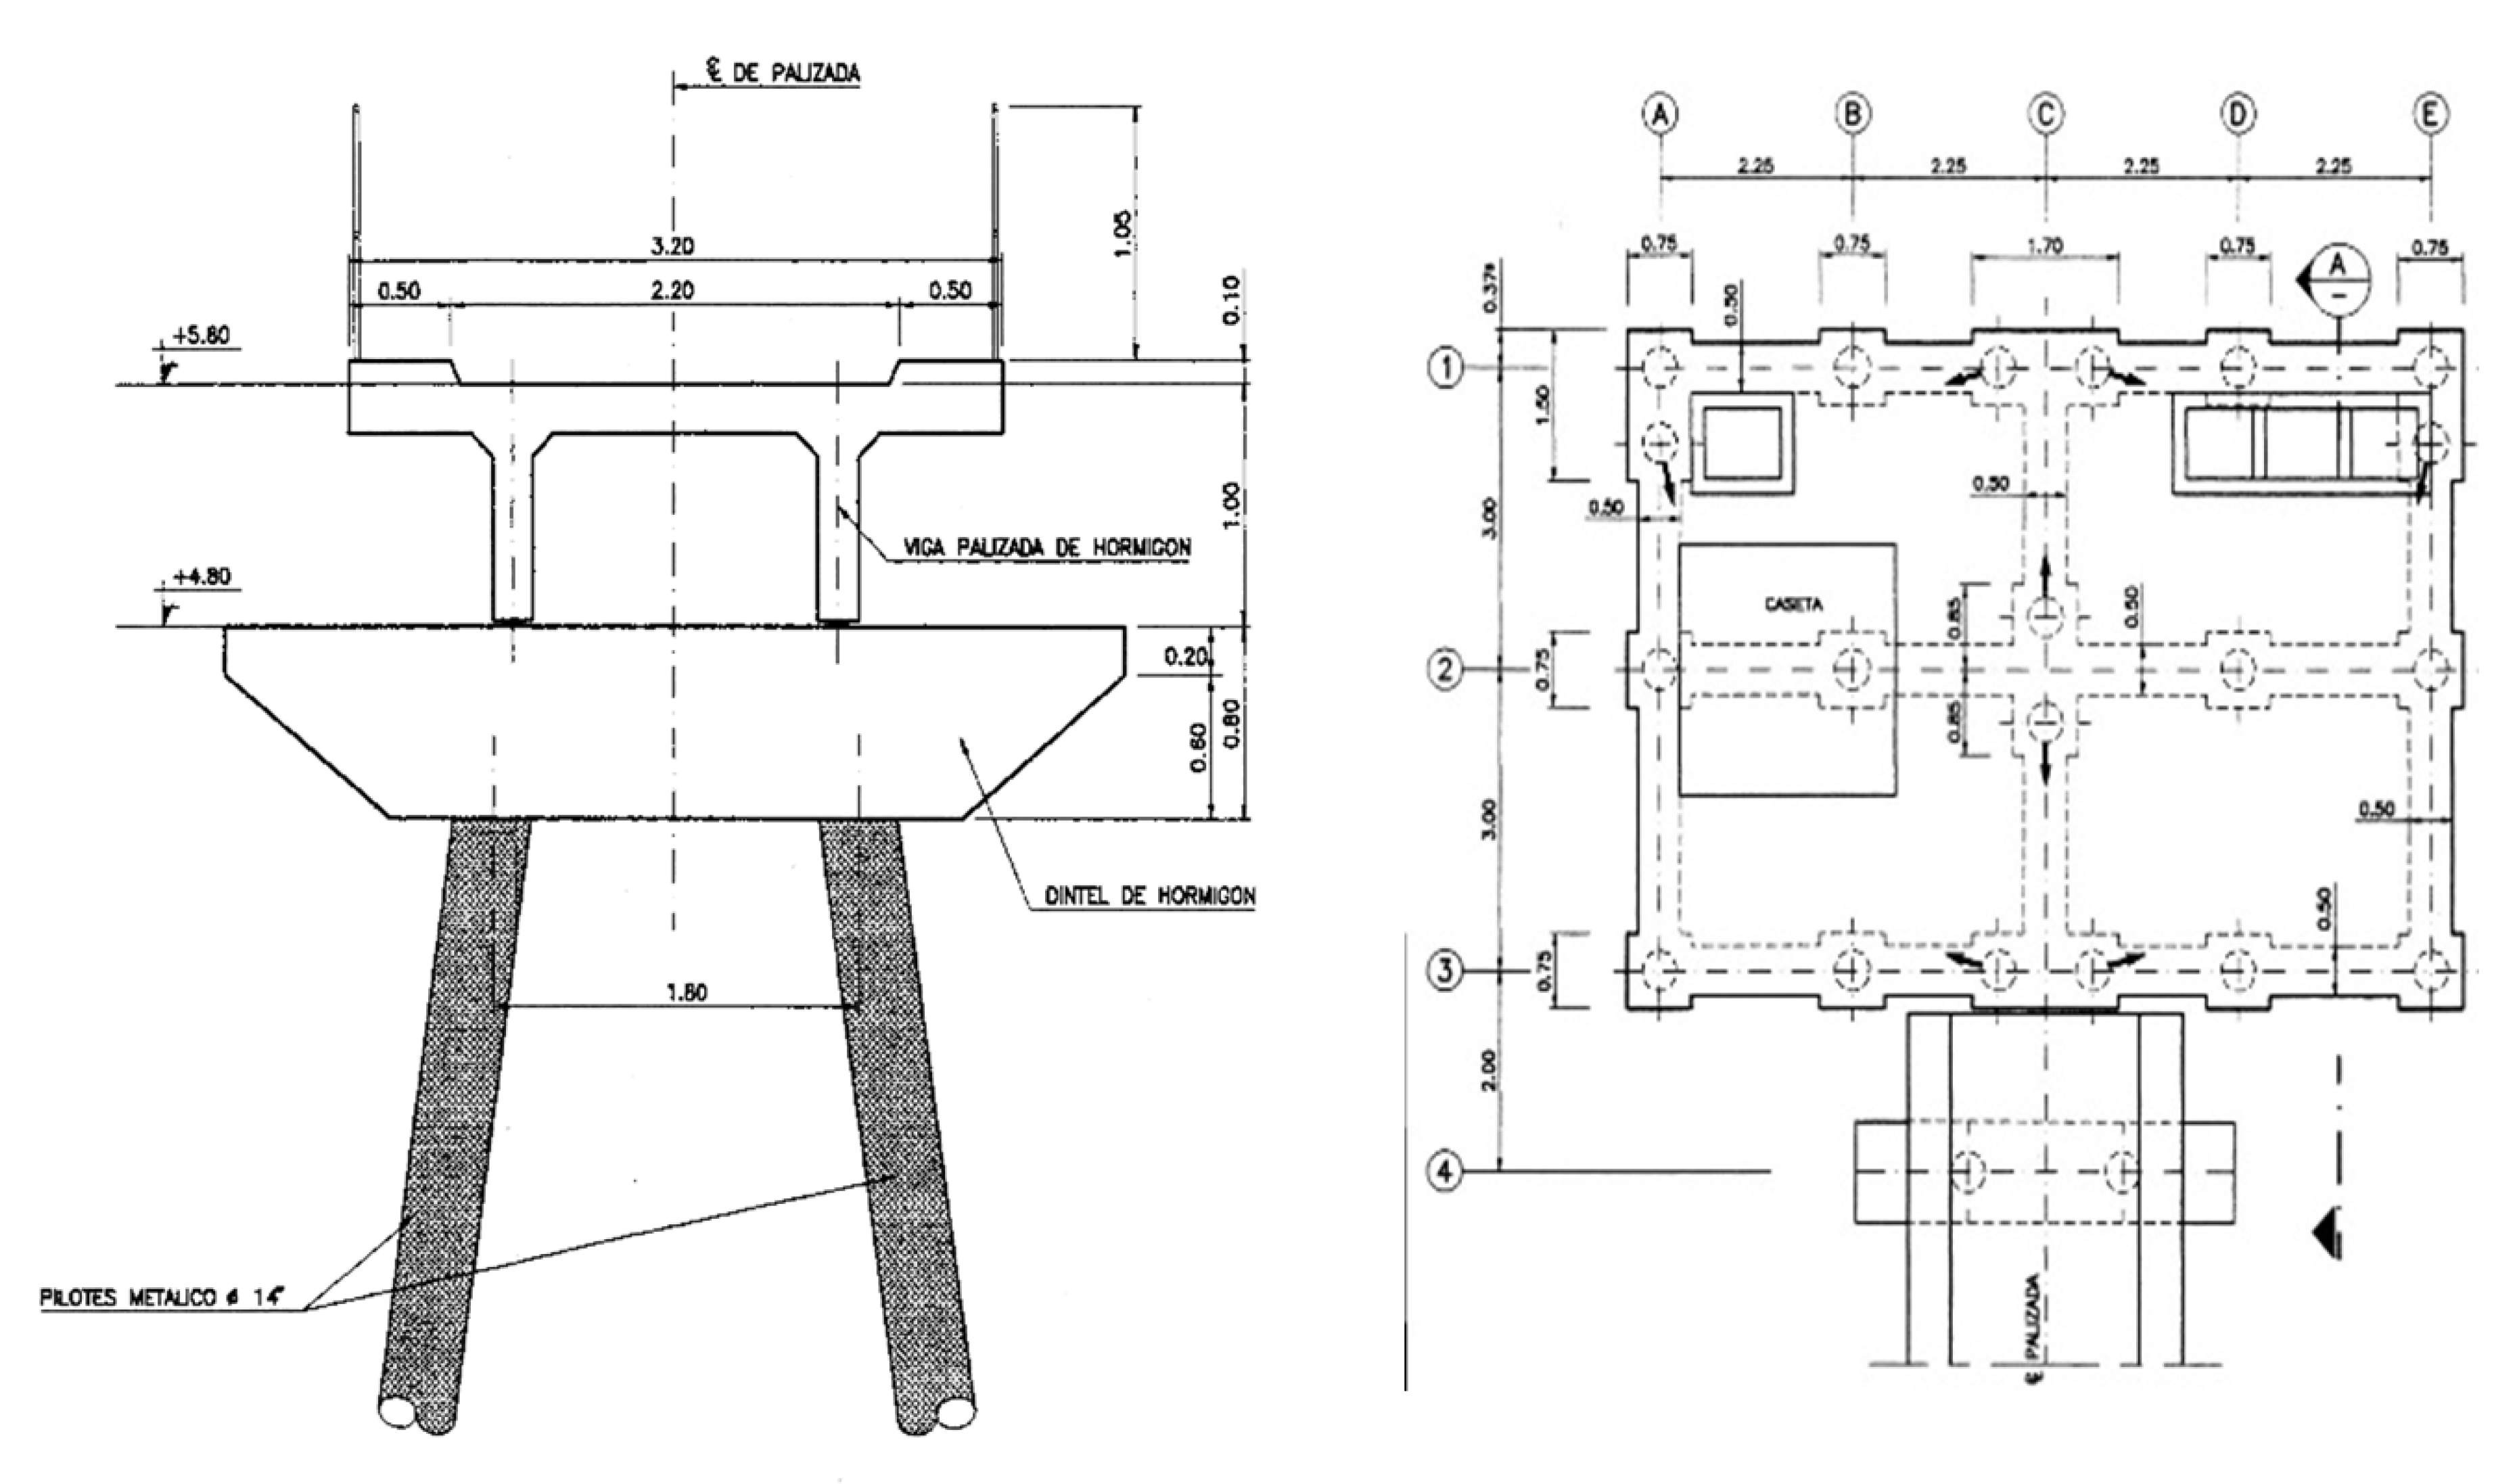
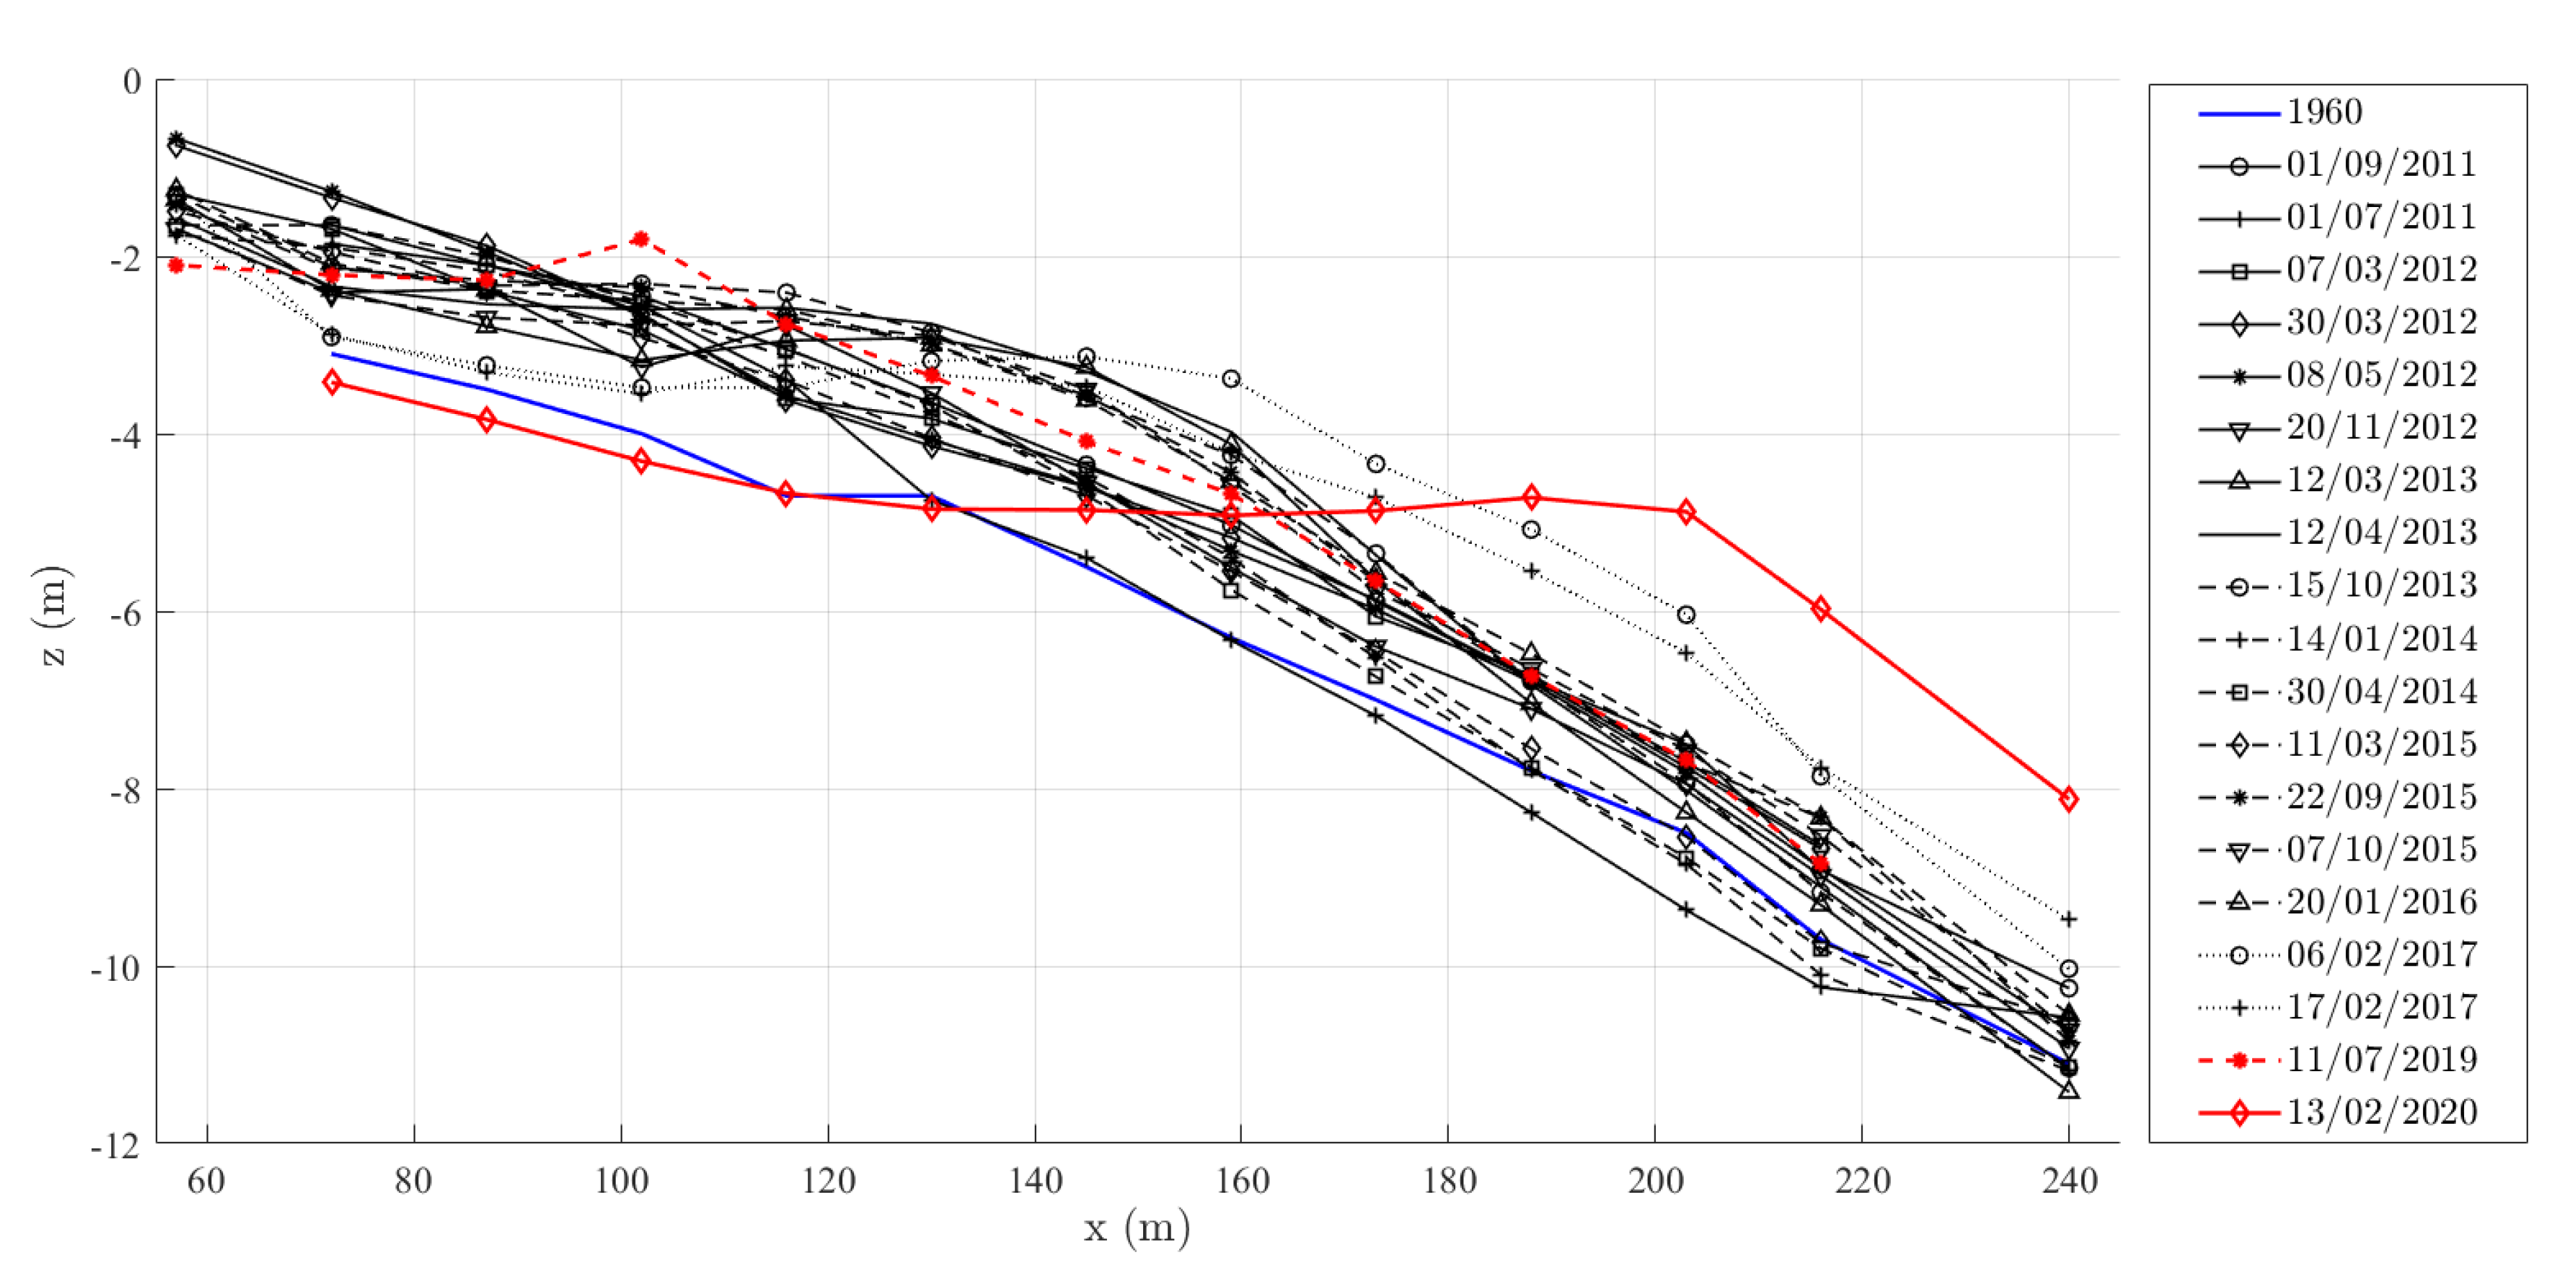
Sketches of each element are depicted in Figure 2. The piles below the pile caps present an inclination of 7.5 degrees with respect to the vertical direction. The piles are embedded about 6 m deep into the sandy bottom, as detected from the original design report. The main exposed area, the self-weight and the total distributed load for each element that forms the pier are reported in Table 1. All values are extracted from the original report on the structural design of the pier and have been checked carefully. The water depth and beach profile at the Pont del Petroli location changed significantly since its date of construction. Initially conceived with a water depth of 12 m at the deepest point (i.e., at the toe of the platform), the pier experienced radical changes related to both the water depth and bottom slope. LIM/UPC carried out 19 bathymetric surveys in the period between 2011 and 2020, the last one being carried out right after storm Gloria. Results from these surveys are shown in Figure 3, where the original profile from the design report is highlighted in blue while the profiles right before and after the passage of storm Gloria are indicated in red. The x - distance is measured from the land-side—the beginning of the footbridge. The platform toe is located at x = 240 m. The most seaward footbridge beam and the platform are located between x = 216 and x = 240 m. The vertical axes express the distance from the mean water level, being positive if upwards. While for the rear part of the pier, from the fourth pile cap to the shoreline, the bottom slope did not show remarkable modifications and remained on average between 1:30 and 1:25, the front and most seaward part, from the fourth pile cap to the platform, showed the greatest change, especially in terms of the local water depth. The local sand accretion determined a reduction of the water depth from the initial 12 to almost 9 m. While an almost linear trend had been observed during the past years, a sudden change was surveyed after storm Gloria in early 2020. The measured water depth at the toe of the platform was observed to be 8 m, hence 4 m less than the design value.

2.2. Storm Gloria: Description and Damage to the Pont del Petroli

Since its refurbishment and opening to the public in 2009, the Pont del Petroli pier has been subjected to several storms, some of which caused serious damage and a subsequent need for major repair work (i.e., storms in 2107 and 2020). In particular, the sea storm Gloria left the pier badly damaged, forcing the local government to close public access to it. The pier platform and the first beam attached to it experienced the most severe damage. The platform was partly destroyed and the beam was washed away together with the first pile cap.
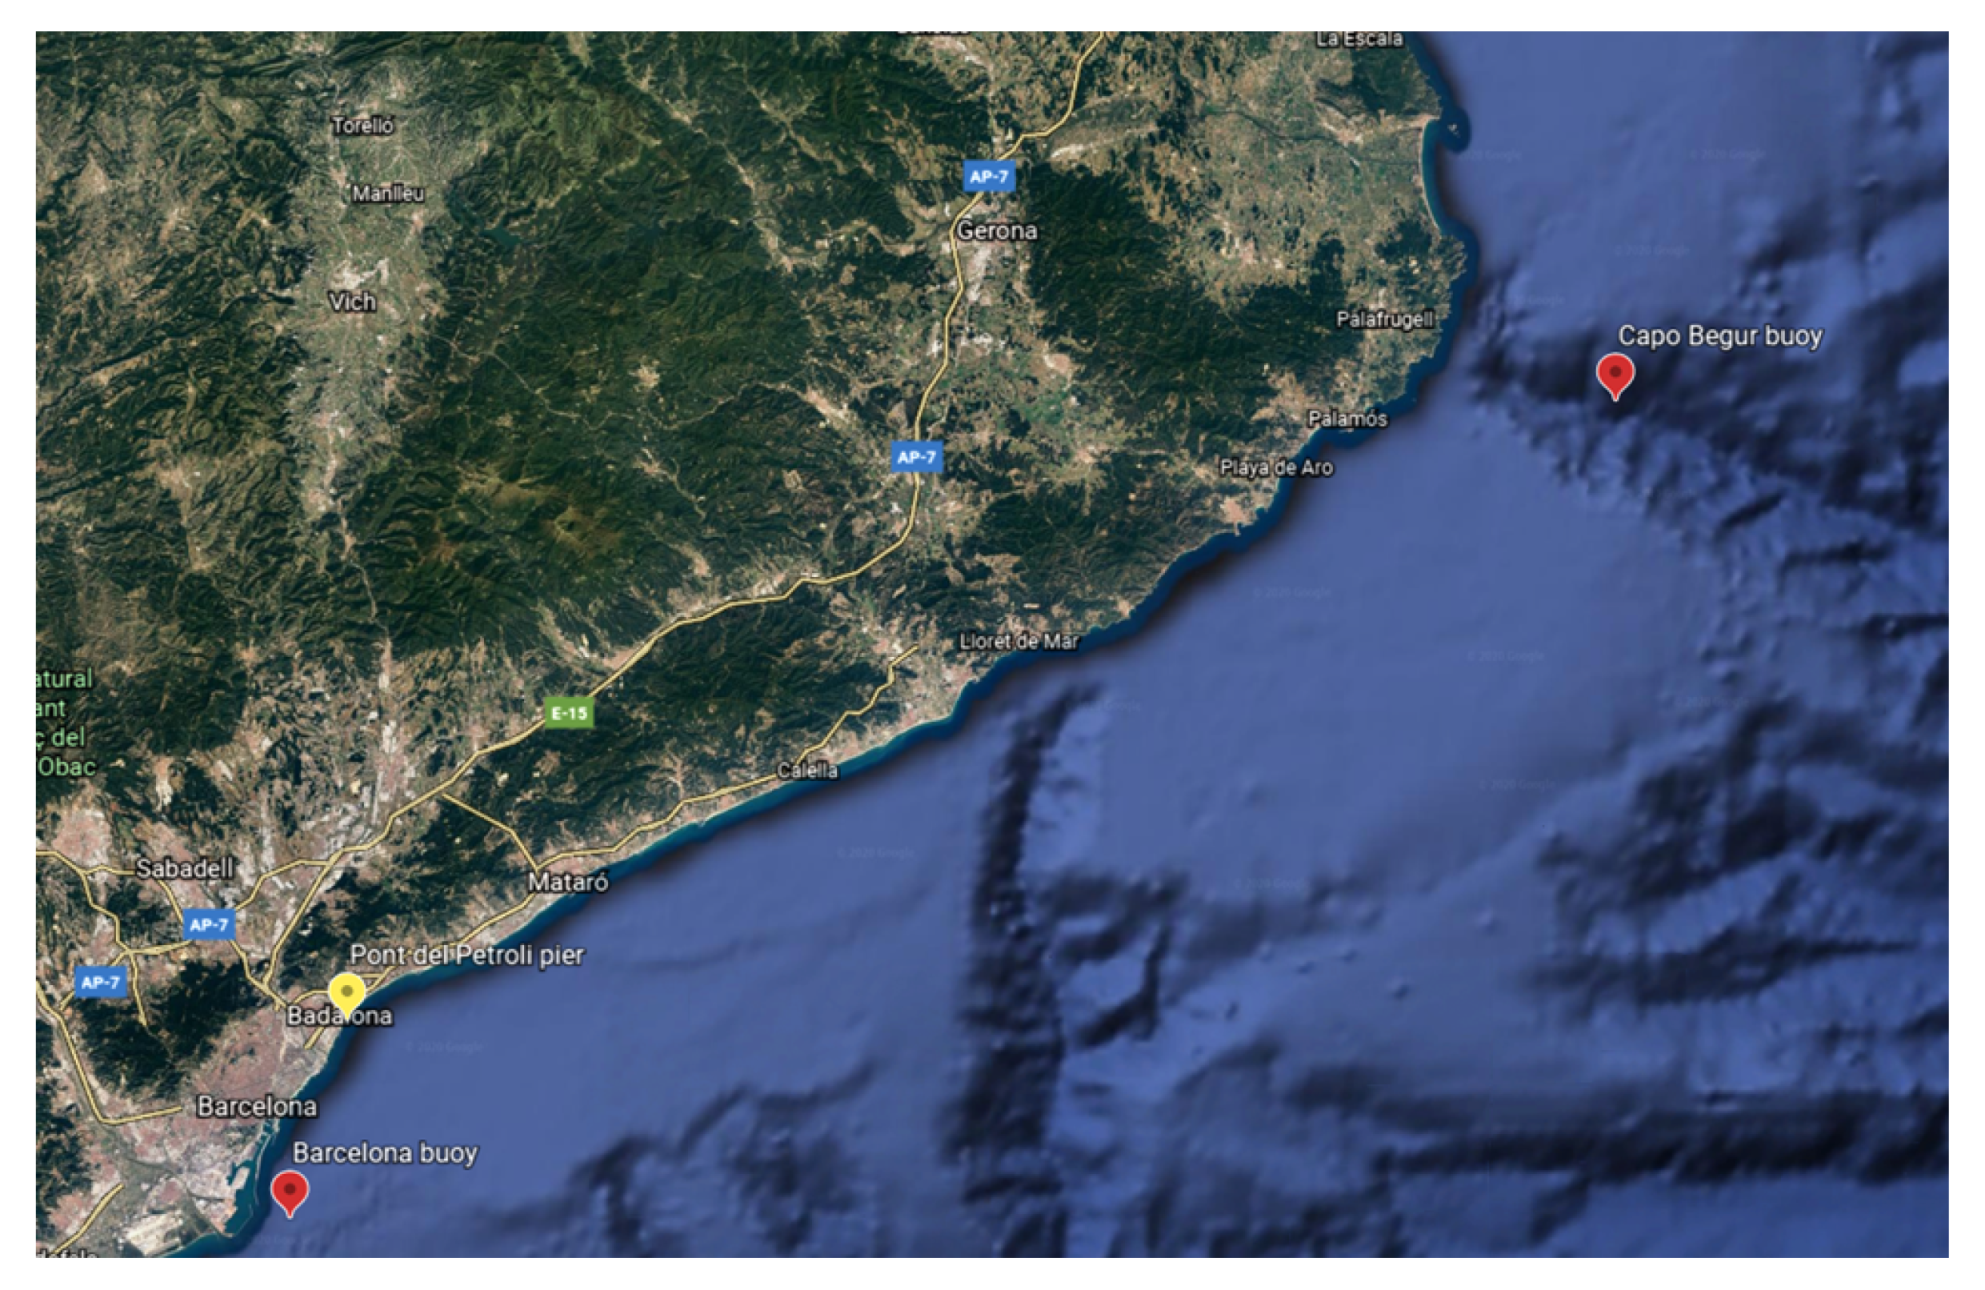
It is difficult to characterize the wave climate in the area surrounding the Pont del Petroli. The closest buoy to the pier is located at Puertos del Estado [30], located just outside the Barcelona harbor (Lat. 41.32 N, Long. 2.20 E), south of Badalona. However, the buoy stopped recording data during storm Gloria. The latest available data were recorded on 19 January 2020 at 21:54, Barcelona time: the maximum recorded wave height was 5.64 m. The most complete and available information to date on the characteristics of storm Gloria can be found in the readings by the buoy of Capo Begur (Lat. 41.90 N, Long. 3.66 E), several kilometers north-east of Badalona (Figure 4). At the same time that the Barcelona buoy stopped working, the maximum wave height recorded at by the Capo Begur buoy was 6.8 m, approximately half of the 13.8 storm peak occurred (and recorded) 1 day later. The significant wave height, H m , 0 , recorded at Capo Begur was higher than 6.0 m for 44 h, with a peak value of 7.8 m. The main wave and wind direction was east-northeast. Of all the recordings from the Capo Begur buoy in the period between 2001 and 2017, only a handful of them show wave heights close to or larger than 7.0 m, as the values recorded during storm Gloria: H m , 0 = 7.4 m from the north in 2003, H m , 0 = 7.2 m from north-east in 2010 and H m , 0 = 6.9 m from north-east in 2016. These values notwithstanding, there is no trace of extreme data similar to that of storm Gloria, especially in terms of the duration of the storm peak and the strong winds (greater than 70 km/h).
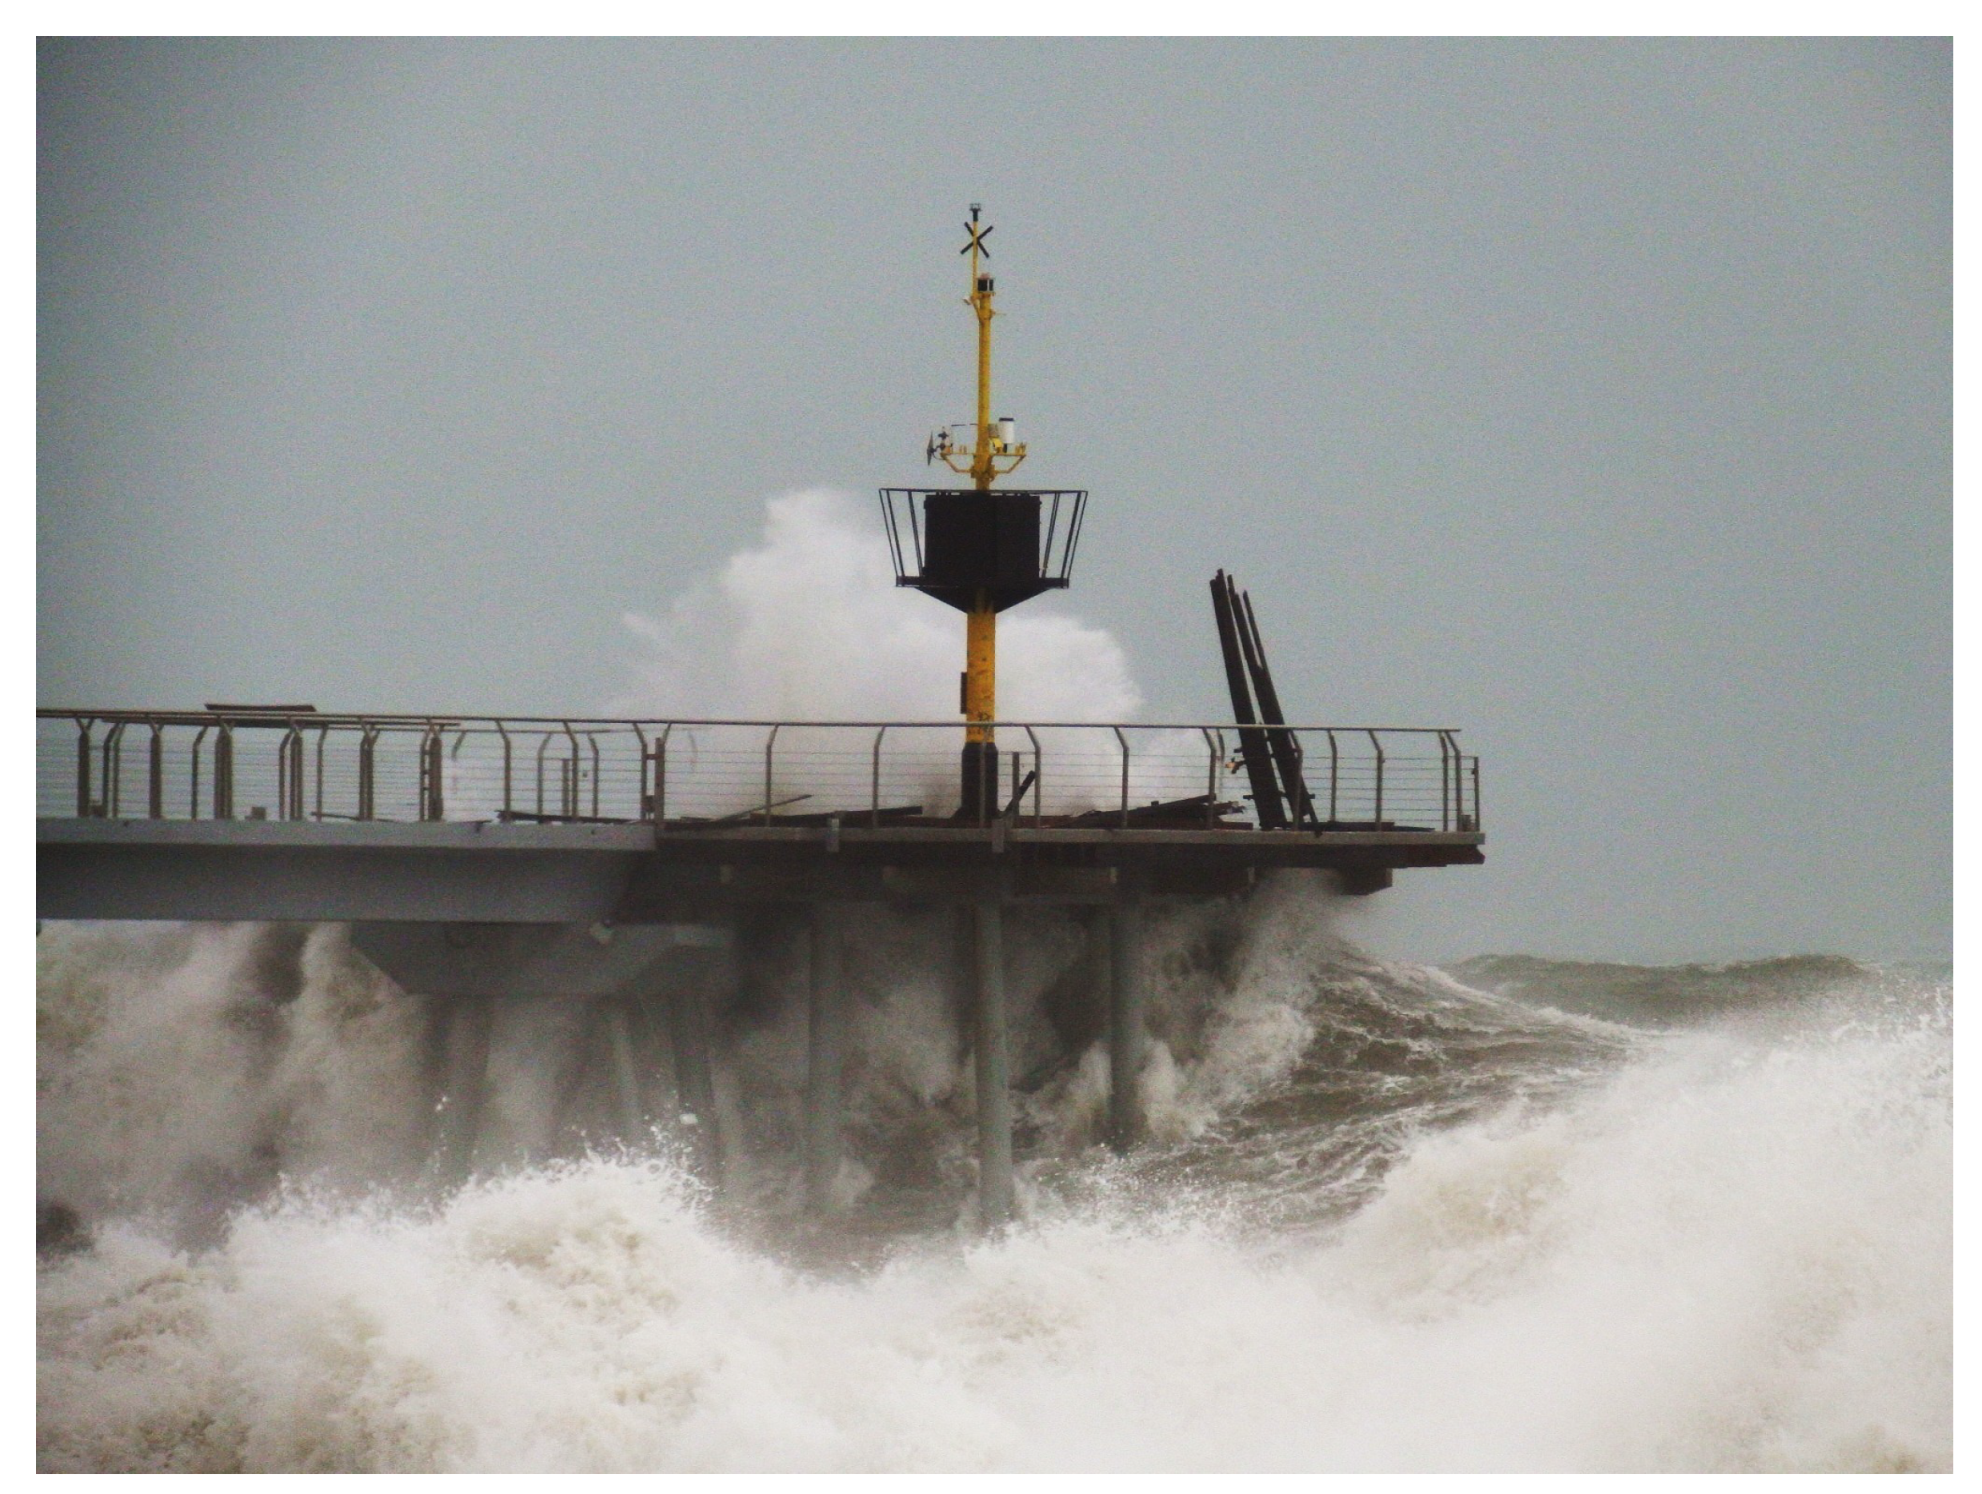
The intensity of the sea storm Gloria caused damage to the measurement station installed by LIM/UPC at Pont del Petroli. Hence, there is almost no direct recorded information of the wave climate close to the pier in that occurrence. Due to the lack of local data, LIM/UPC carried out a study where the wave propagation was simulated by means of the numerical model SWAN [31] for several stretches of the Catalan coast between Barcelona and the town of Blanes, in Costa Brava. The results from the wave propagation model were used to characterize the wave climate at a water depth between 20 and 25 m; values that will be employed for the wave generation in the planned experimental campaign. The results showed values of H m , 0 ranging between 5.5 and 6.5 m. A visual representation of waves during the storm Gloria was made possible by pictures and videos from the media, press release and photo amateurs, suggesting that waves as large as 7 m and higher reached and hit the Pont del Petroli during the storm, see for example Figure 5.

3. Numerical Model

3.1. The DualSPHysics Code

DualSPHysics [26] is an open-source code based on Smoothed Particle Hydrodynamics (SPH) that has been developed to study real engineering problems. Its high computational efficiency is mixed with its ability to be executed on both CPU and GPU with powerful parallel computing capabilities. The underlying rationale behind SPH is to discretize the fluid with a set of particles, whose physical quantities (position, velocity, density and pressure) are obtained via interpolations of the same quantities evaluated at the surrounding particles [17]. The weighted contribution of these neighbor particles is accounted for using a kernel function, W, with an area of influence that is defined using a characteristic smoothing length, h. In DualSPHysics, the quintic Wendland kernel [32] is used and defined to vanish beyond 2 h . Particles are initially separated by a uniform particle distance, dp, which is also used as a reference value to define the (constant) smoothing length. In this work, h / dp = 2 , so that 2 h = 4 dp, giving an idea of the number of neighbors per particle, at least during the initial time step.
The Navier–Stokes equations can be written in a discrete SPH formalism using W a , b as the kernel function, which depends on the normalized distance between particle a and the neighboring particles b = 1 , , N a :
d r a d t = v a
d v a d t = b = 1 N a m b p b + p a ρ b ρ a a W a , b Π a , b + g
d ρ a d t = b = 1 N a m l v a b · a W a , b + 2 δ h c a b = 1 N a m b 1 ρ a ρ b r a , b · a W a , b | r k , l | 2
Here t is time, r is the position vector, v is the velocity vector, p is the pressure, ρ is the density, m is the mass, c a is the speed of sound at particle a and g is the acceleration of gravity. For the term Π a , b , the artificial viscosity proposed in [13] is used. Specifically, the constants suggested in [33,34] are chosen to guarantee a correct wave propagation. Moreover, the density diffusion term described in [35] is chosen, with a value δ = 0.1 as recommended therein. The fluid is treated as weakly compressible, with an equation of state employed to calculate the pressure of the fluid as a function of its density. Hence the system in Equations (1) to (3) is closed by using:
p a = c a 2 ρ 0 γ ρ a ρ 0 γ 1
where γ = 7 is the polytropic exponent and ρ 0 is the fluid reference density. The speed of sound was set to be ten times the maximum fluid velocity, keeping density variations within 1% of ρ 0 and therefore preventing the introduction of major deviations from an incompressible approach. The calculated speed of sound at the start of the simulation was approximately 110 m/s, with an average 5 steps per second of simulation (about 242,000 steps total) and a runtime per physical second equal to 1600 s on average. The symplectic position Verlet time integrator scheme [36], which is second-order accurate in time, was used here to perform time integration of flow quantities. A variable time step was calculated according to the procedure in [37], involving the Courant–Friedrich–Lewy (CFL) condition, the force terms and the viscous diffusion term.
The solid boundary conditions, needed for idealizing the seabed and the coastal structures, are discretized by a set of boundary particles that differ from the fluid particles. The Dynamic Boundary Particles (DBPs) [38] are boundary particles that satisfy the same equations as fluid particles, however, they do not move according to the forces exerted on them. Instead, they remain either fixed in predefined position or move according to an imposed/assigned motion function (i.e., for moving objects like wave-makers). When a fluid particle approaches a boundary particle, and thus the distance between the two becomes smaller than the interaction distance, the density of the affected boundary particles increases, resulting in a pressure increase. This, in turn, results in a repulsive force being exerted on the fluid particle due to the pressure term in the momentum equation. DBPs have been successfully used for marine and coastal engineering problems [33,39,40,41] due their capability of discretizing complex 3-D geometries without the need of implementing cumbersome mirroring techniques [42] or complex semi-analytical wall boundary conditions [43].
One option to achieve wave generation in SPH would see the employment of a moving boundary that mimics the displacement of a wavemaker in experimental wave tanks. This approach has been used extensively in the literature [34,44,45,46]. Although the generation of waves with a wavemaker-like moving boundary is robust and often accurate, a computational domain size of at least 3 to 4 wavelengths is needed to accurately resolve the physics [47]. Combining this requirement with the need for an adequate level of resolution to properly capture the free surface deformation leads to limitations on the physical time that can be simulated, mainly due to the extremely large number of particles that occur. In light of these considerations, a technique based on open boundary conditions was herein adopted for the generation of waves, specifically by enforcement of user-defined inlet conditions. This novel approach has first been introduced in DualSPHysics in [29] and has proven successful in reducing the computational domain size down to only one wavelength. The interested reader can find detailed information on the SPH inlet/outlet algorithm in [42] and its application to wave generation in [29,46].

3.2. Validation

As described in previous sections, experimental testing on the Pont del Petroli pier is scheduled to follow the numerical modeling phase described in this work. No previous attempts at simulating the case proposed herein could be found in the literature, therefore it is imperative to assess the capability of DualSPHysics to tackle this problem by means of other similar research published in the literature, with a special focus on wave–structure interaction. In all the references listed in this section, the numerical results obtained with DualSPHysics are compared with reference solutions such as experimental data, analytical solutions and other model solutions, proving that the implemented SPH model is accurate when predicting wave loads, wave run-up, etc. The model setup for the numerical work carried out herein employed default or similar parameter settings to those reported in [33,39,48].
The work in [44] is one of the first examples where wave–structure interaction was studied with a forerunner of DualSPHysics, i.e., SPHysics [49,50] including proper validation with experimental data. Therein, numerical results were compared with field measurements of the movement of a caisson breakwater under the forcing of periodic waves. Promising agreement with experimental data was obtained for the displacement and the horizontal forces on the caisson. Modeling of wave loading on coastal structures was also presented in several other works [39,51,52,53]. The impact of tsunami waves was studied in [54,55] using DualSPHysics, showing a good agreement between numerical data and physical tests. Moreover, different theories for the generation of solitary waves have been tested in [51], with satisfactory agreement obtained between numerical surface elevations and wave loads with respect to experimental data. The authors of [56] present the first successful application not only of DualSPHysics but, more generally, of a SPH-based 3-D model for studying wave run-up on a real coastal defense and resolving fluid trajectories in between the breakwater armor blocks. Later, DualSPHysics was employed in the analysis of wave run-up for the design of coastal defenses. The authors of [57] first validate run-up time series with experiments using a porous breakwater for which an exact geometry was used. The authors of [58] employed the same model to deepen the knowledge of the influence of the curvature in a dike line on wave run-up, after proper validation against 3-D physical model tests from a wave basin facility. Finally, the interaction between waves and floating objects was studied in detail by [22], where the numerical results of nonlinear waves interacting with freely and moored floating objects are compared with experimental data. Good agreement was obtained for the motions of the floating body (heave, surge and pitch) and the mooring tensions.

3.3. Model Set-Up

The numerical model was conceived of to prepare the experimental testing that will be carried out at LIM/UPC. Therefore, the design of the different simulations was done in a way to accurately mimic the experimental facility where the physical testing will be carried out. The experimental campaign will be executed in the large-scale wave flume CIEM at LIM/UPC. The flume is 100 m long and 3 m wide, and equipped with a wedge-type wavemaker. Tests will be carried out with an initial water depth of 2.6 m, measured close to the wavemaker location. The water depth was chosen as a compromise between the technical capabilities of the wavemaker and the model scale. The model of the Pont del Petroli pier will be reproduced at a geometrical scale of 1:10, based on the Froude similitude. A beach with 1:15 slope extends between x = 27.80 m and x = 60.13 m, x = 0 being the position of the wavemaker at rest. The pier model will be placed starting from x = 54.00 m, being this the location of the front platform. At this location, the local water depth is 0.84 m, corresponding to 8.4 m in the prototype, similar to the post-Gloria survey. The rear part of the foreshore consists of a 1:25 slope up to the back of flume. A sketch of the model layout is depicted in Figure 6. The pier will be built with all the original details, from the platform to the third beam that forms the footbridge, being this the part of the structure that was exposed to the waves impact. The piles will not be modeled to follow a conservative approach where the loading on the platform, footbridge and pile cap will be maximized, skipping the partial sheltering effect of the piles. The main focus of the numerical analysis is to measure the water load on the platform, the first pile cap and the first footbridge beam. These are the most seaward elements that experienced heavy damage during storm Gloria. The pier model will be equipped with load cells and pressure sensors during the experimental campaign. The numerical model will thus provide important and necessary information for the measurement design and setup of the instrumentation.
Prior to tackling the full 3-D problem, a 2-D model of the CIEM flume and Pont del Petroli pier was realized with DualSPHysics. The scope of this first analysis is twofold. On the one hand, it provides preliminary information on the expected loads on each pier element. On the other hand, it allows for studying the wave transformation and breaking process on the 1:15 beach slope for different wave conditions and initial water depths. The water surface elevation and velocity field that are needed as a forcing boundary condition in the full 3-D case are thus extracted from the 2-D cases. Waves are generated in the 2-D study mimicking the experimental wedge-type wavemaker. The whole flume length is therefore reproduced. An initial interparticle distance of dp = 0.02 m is employed. Such a resolution is chosen as a result of a sensitivity analysis where the dp parameter varies between 0.01 and 0.04 m. Simulations were run on a NVIDIA GeForce RTX 2080 (2944 CUDA cores, 1.80 GHz maximum clock rate). The total number of SPH particles was equal to 304,805. The runtime per physical second was approximately 71 s. To reduce computational time and thus avoid simulating very long irregular wave trains (usually equal to 1000 waves), only regular waves were modeled. Irregular waves will be simulated during the experimental campaign. Due to the lack of local data against which validating the wave propagation model, a range of wave conditions have been considered, i.e., wave height H varying between 6.1 and 9.0 m and wave period T varying between 9.6 and 12.7 s (these values are expressed in prototype scale). When modeling the entire flume length in 3-D, a particle resolution equal to 2 cm would lead to an excessive number of SPH fluid particles, approximately 150 times the number of particles in the 2-D case. This would imply a very expensive and time consuming computation despite the availability of powerful hardware. Therefore, an inlet boundary condition is employed to tackle the 3-D analysis. As seen in Figure 6, the inlet is located at x = 50 m, right before the breaking zone for the tested conditions, and only 4 m (40 m in real scale) from the pier head. At the inlet buffer, the water surface elevation and velocity have been enforced. The initial number of SPH fluid particles is equal to 1,729,260, with this number varying slightly during the simulation. About 831,000 new particles are generated during the execution. A physical time of 20 s was simulated, corresponding to 2–3 generated wave impacts on the structure. The runtime per physical second is about 26.7 min, varying slightly in each simulated test. For the 3-D model, a NVIDIA GeForce RTX 2080 Ti has been employed (4635 CUDA cores, 1.63 GHz maximum clock rate).
The water surface elevation to be imposed at the inlet has been measured from the 2-D model. Initially, the velocity has been calculated based on the linear shallow water theory:
u ( t ) = η ( t ) g d
where η ( t ) is the water surface elevation, g is gravity and d is the initial water depth at the inlet position. Equation (5) returns a uniform velocity profile along the whole water depth. The value of the water depth at the inlet is equal to 1.16 m, expressed in model scale. The orbital velocity has been sampled in the 2-D model via 10 measurement points along the water depth, from the bottom to the free surface. These sampled velocities have been compared with the ones calculated via Equation (5), with lower peaks obtained for the SPH velocities. Therefore, Equation (5) has been corrected. The final equation for the velocity is as follows:
u ( t ) = η ( t ) g η ( t ) + d
Using findings from the 2-D simulations, two different wave conditions were selected as the worst case scenario for the case with a 8 m water depth at the platform toe. Values of wave height and period are reported in Table 2. Case A has a wave height of 0.65 m and period of 3.80 s in model scale, corresponding to real scale values of 6.5 m and 12.0 s respectively. For Case B, H = 0.82 m and T = 4.00 s, corresponding to H = 8.2 m and T = 12.7 s in real scale values, respectively. To investigate the variability of the forces exerted by the waves in a wider range of wave velocities, three different test cases were defined for each wave condition. Specifically, for each test the velocity calculated from Equation (6) was multiplied by a scaling factor, see Table 2.

4. Results and Discussion

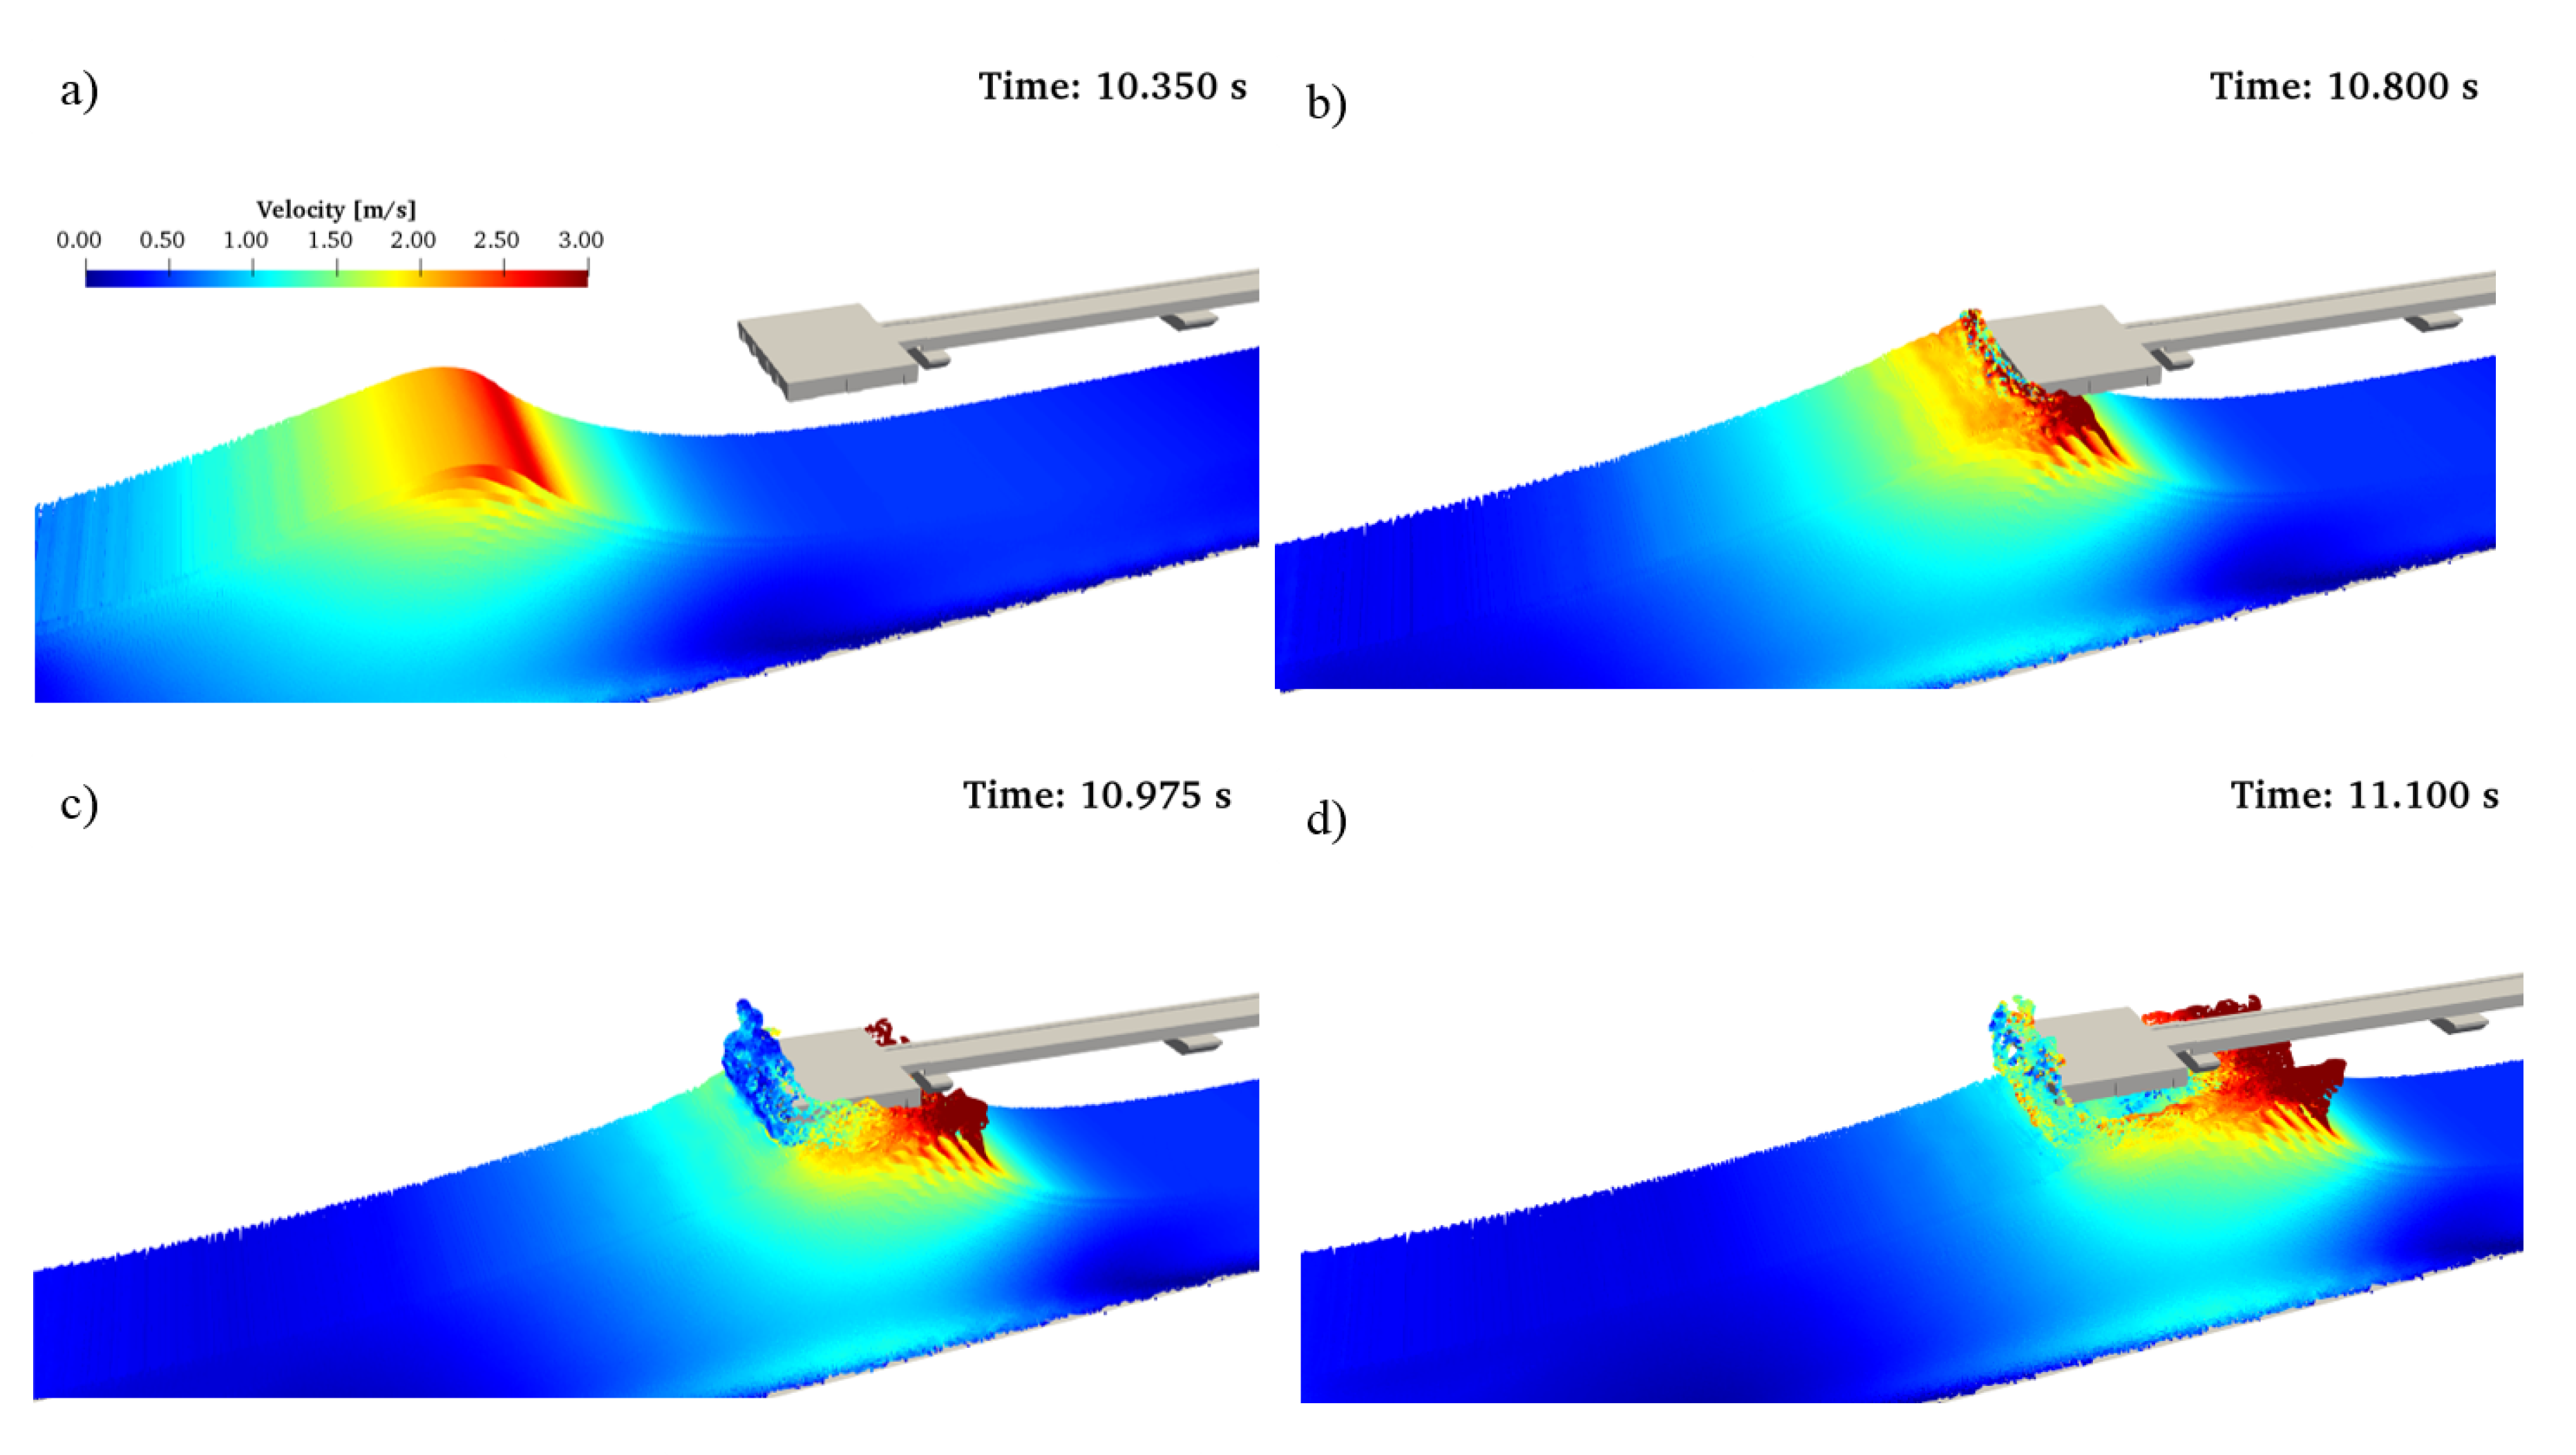
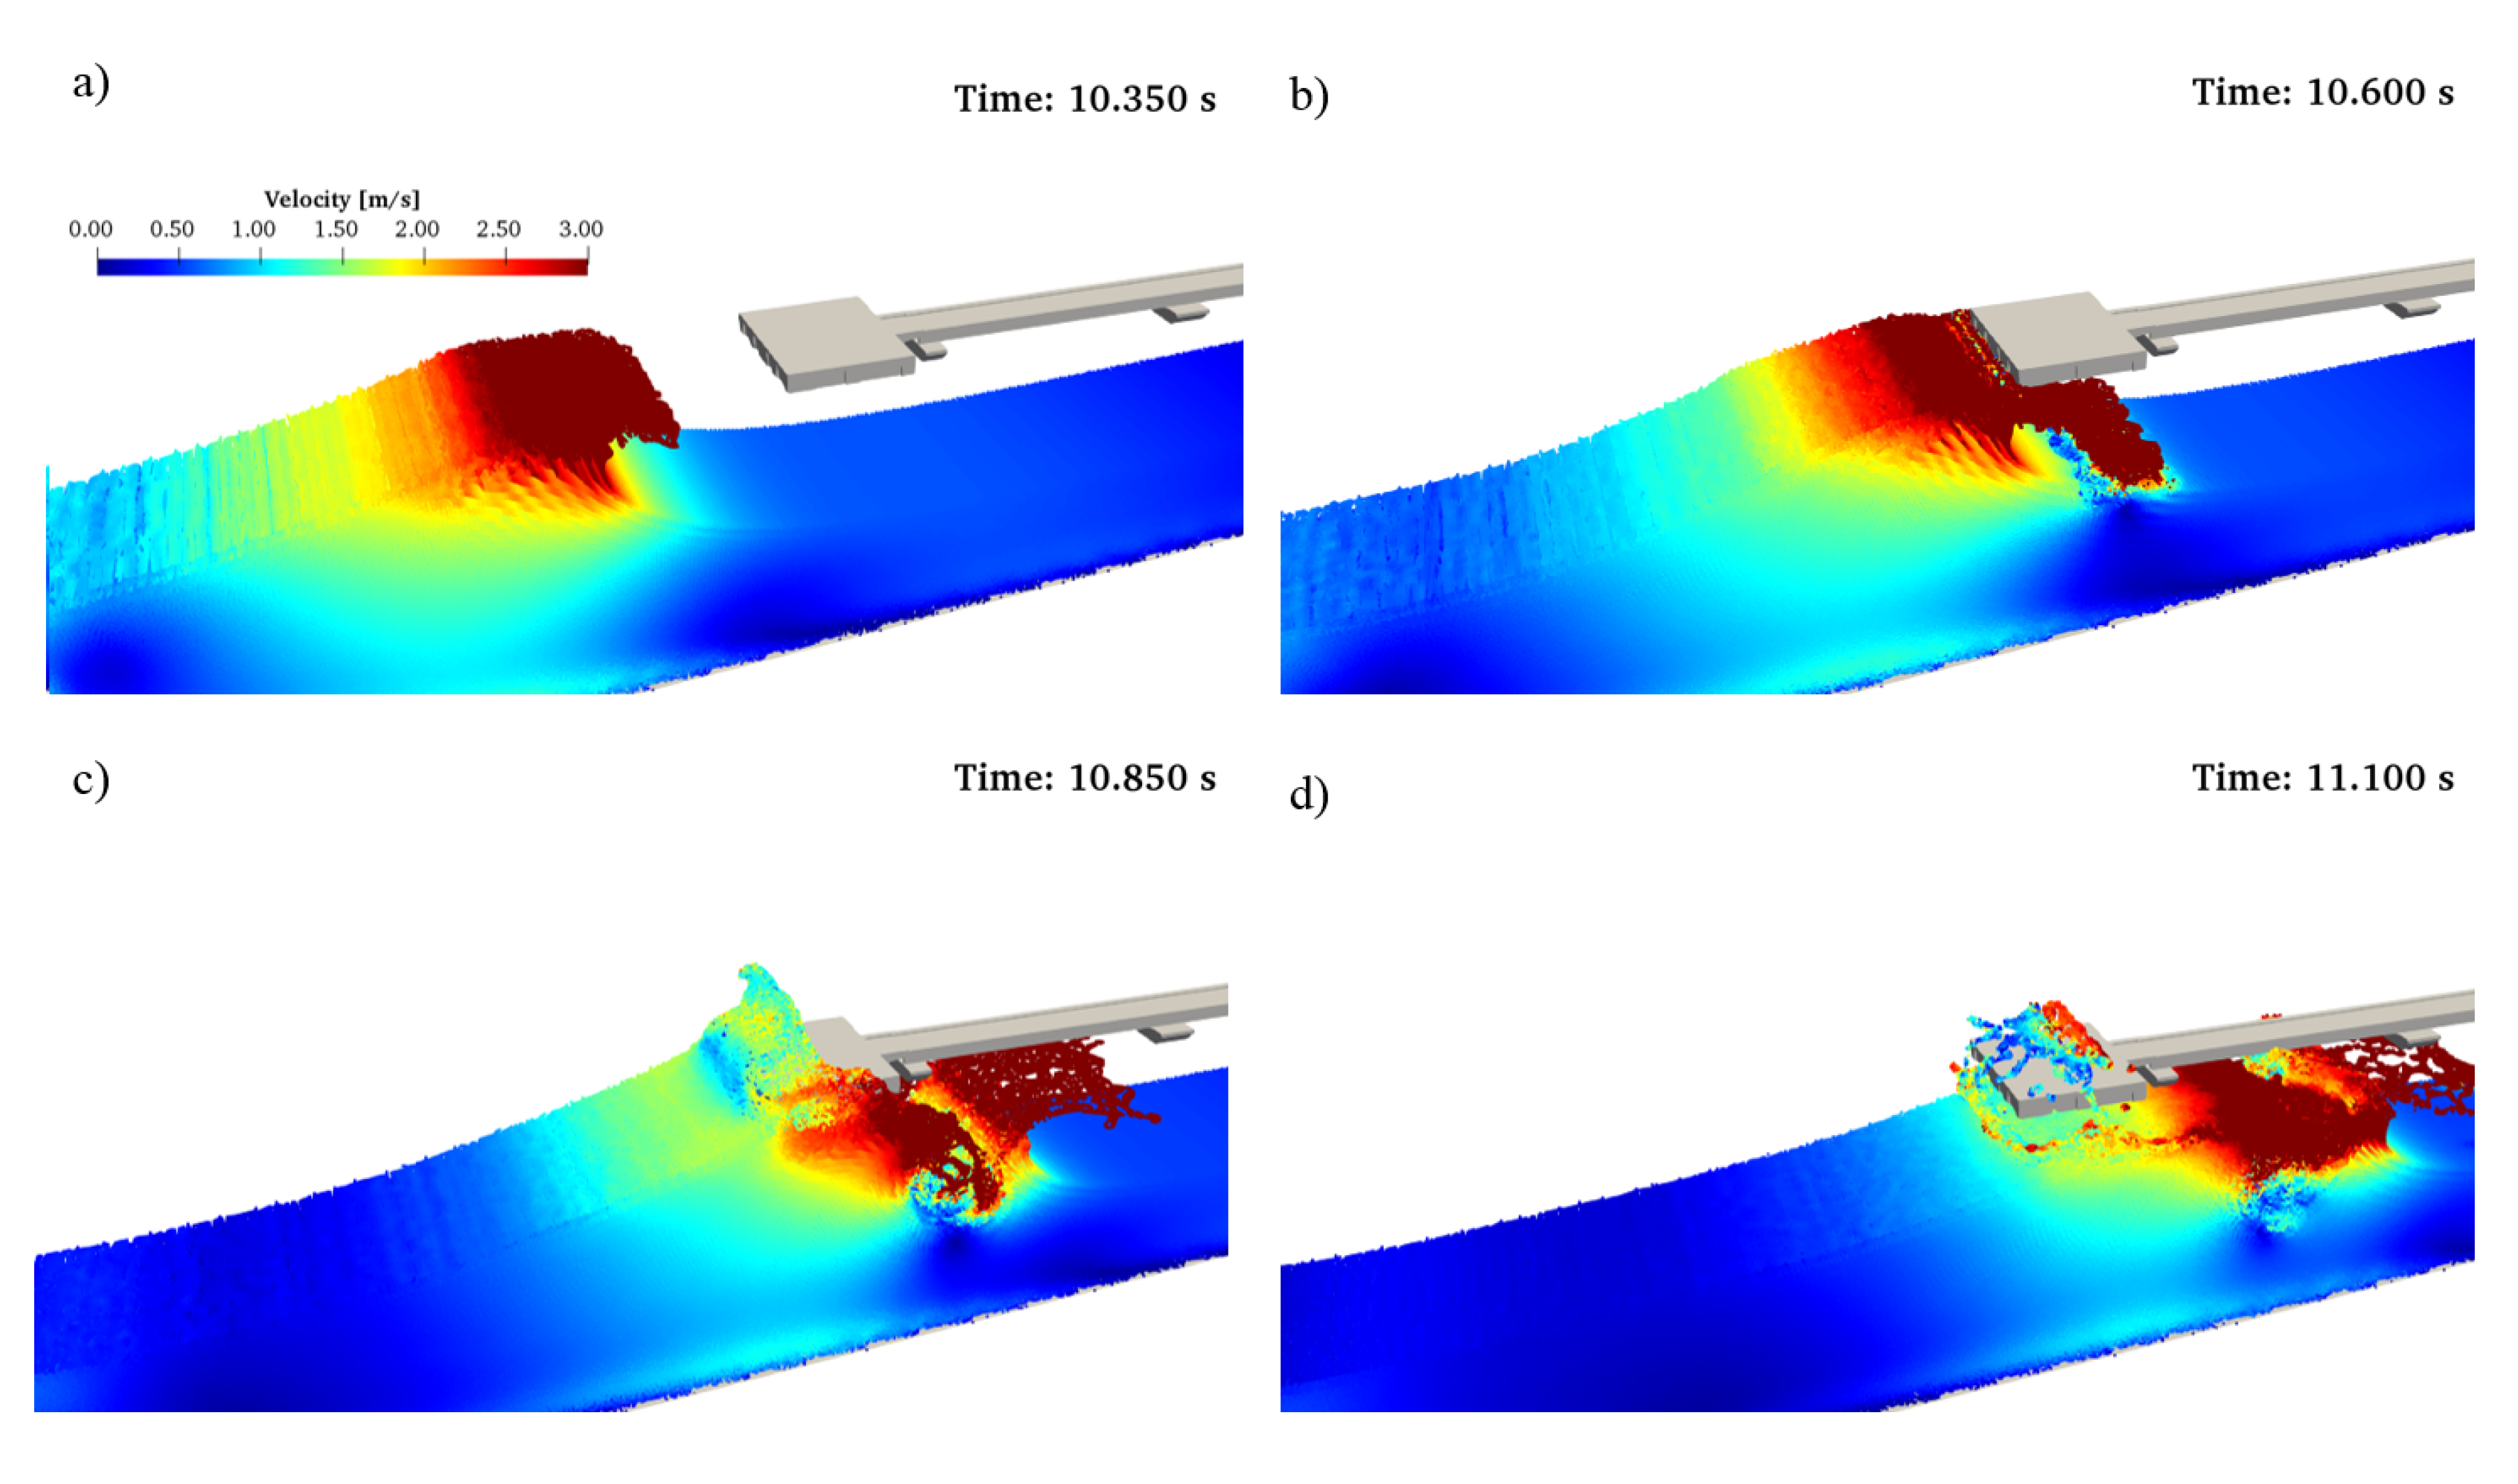
Four snapshots of the results from the simulation of test cases A1 and B1 are depicted in Figure 7 and Figure 8, respectively, corresponding to the impact of the first simulated wave on the pier. The colors represent the magnitude of horizontal velocity. The two test cases differ in the wave breaking process. In A1, the wave is still shoaling on the 1:15 (Figure 7a) when it bumps into the pier platform (Figure 7b). In B1, the wave starts to break before the structure. A characteristic plunging breaker profile can be identified in Figure 8a: the wave crest, characterized by very high velocities, is curling over and dropping onto the wave trough. During this process, the plunger encounters the pier platform where it is transferring most of its momentum (Figure 8b). Large splashes are produced as seen in Figure 8c, and part of the wave energy is finally transferred above the platform deck for wave overtopping (Figure 8d). The waves overtopping the platform are then falling onto the platform, exerting a downwards force on the platform deck. Wave overtopping can also be noted for case A1 (Figure 7c), though volumes are smaller than those in case B1.
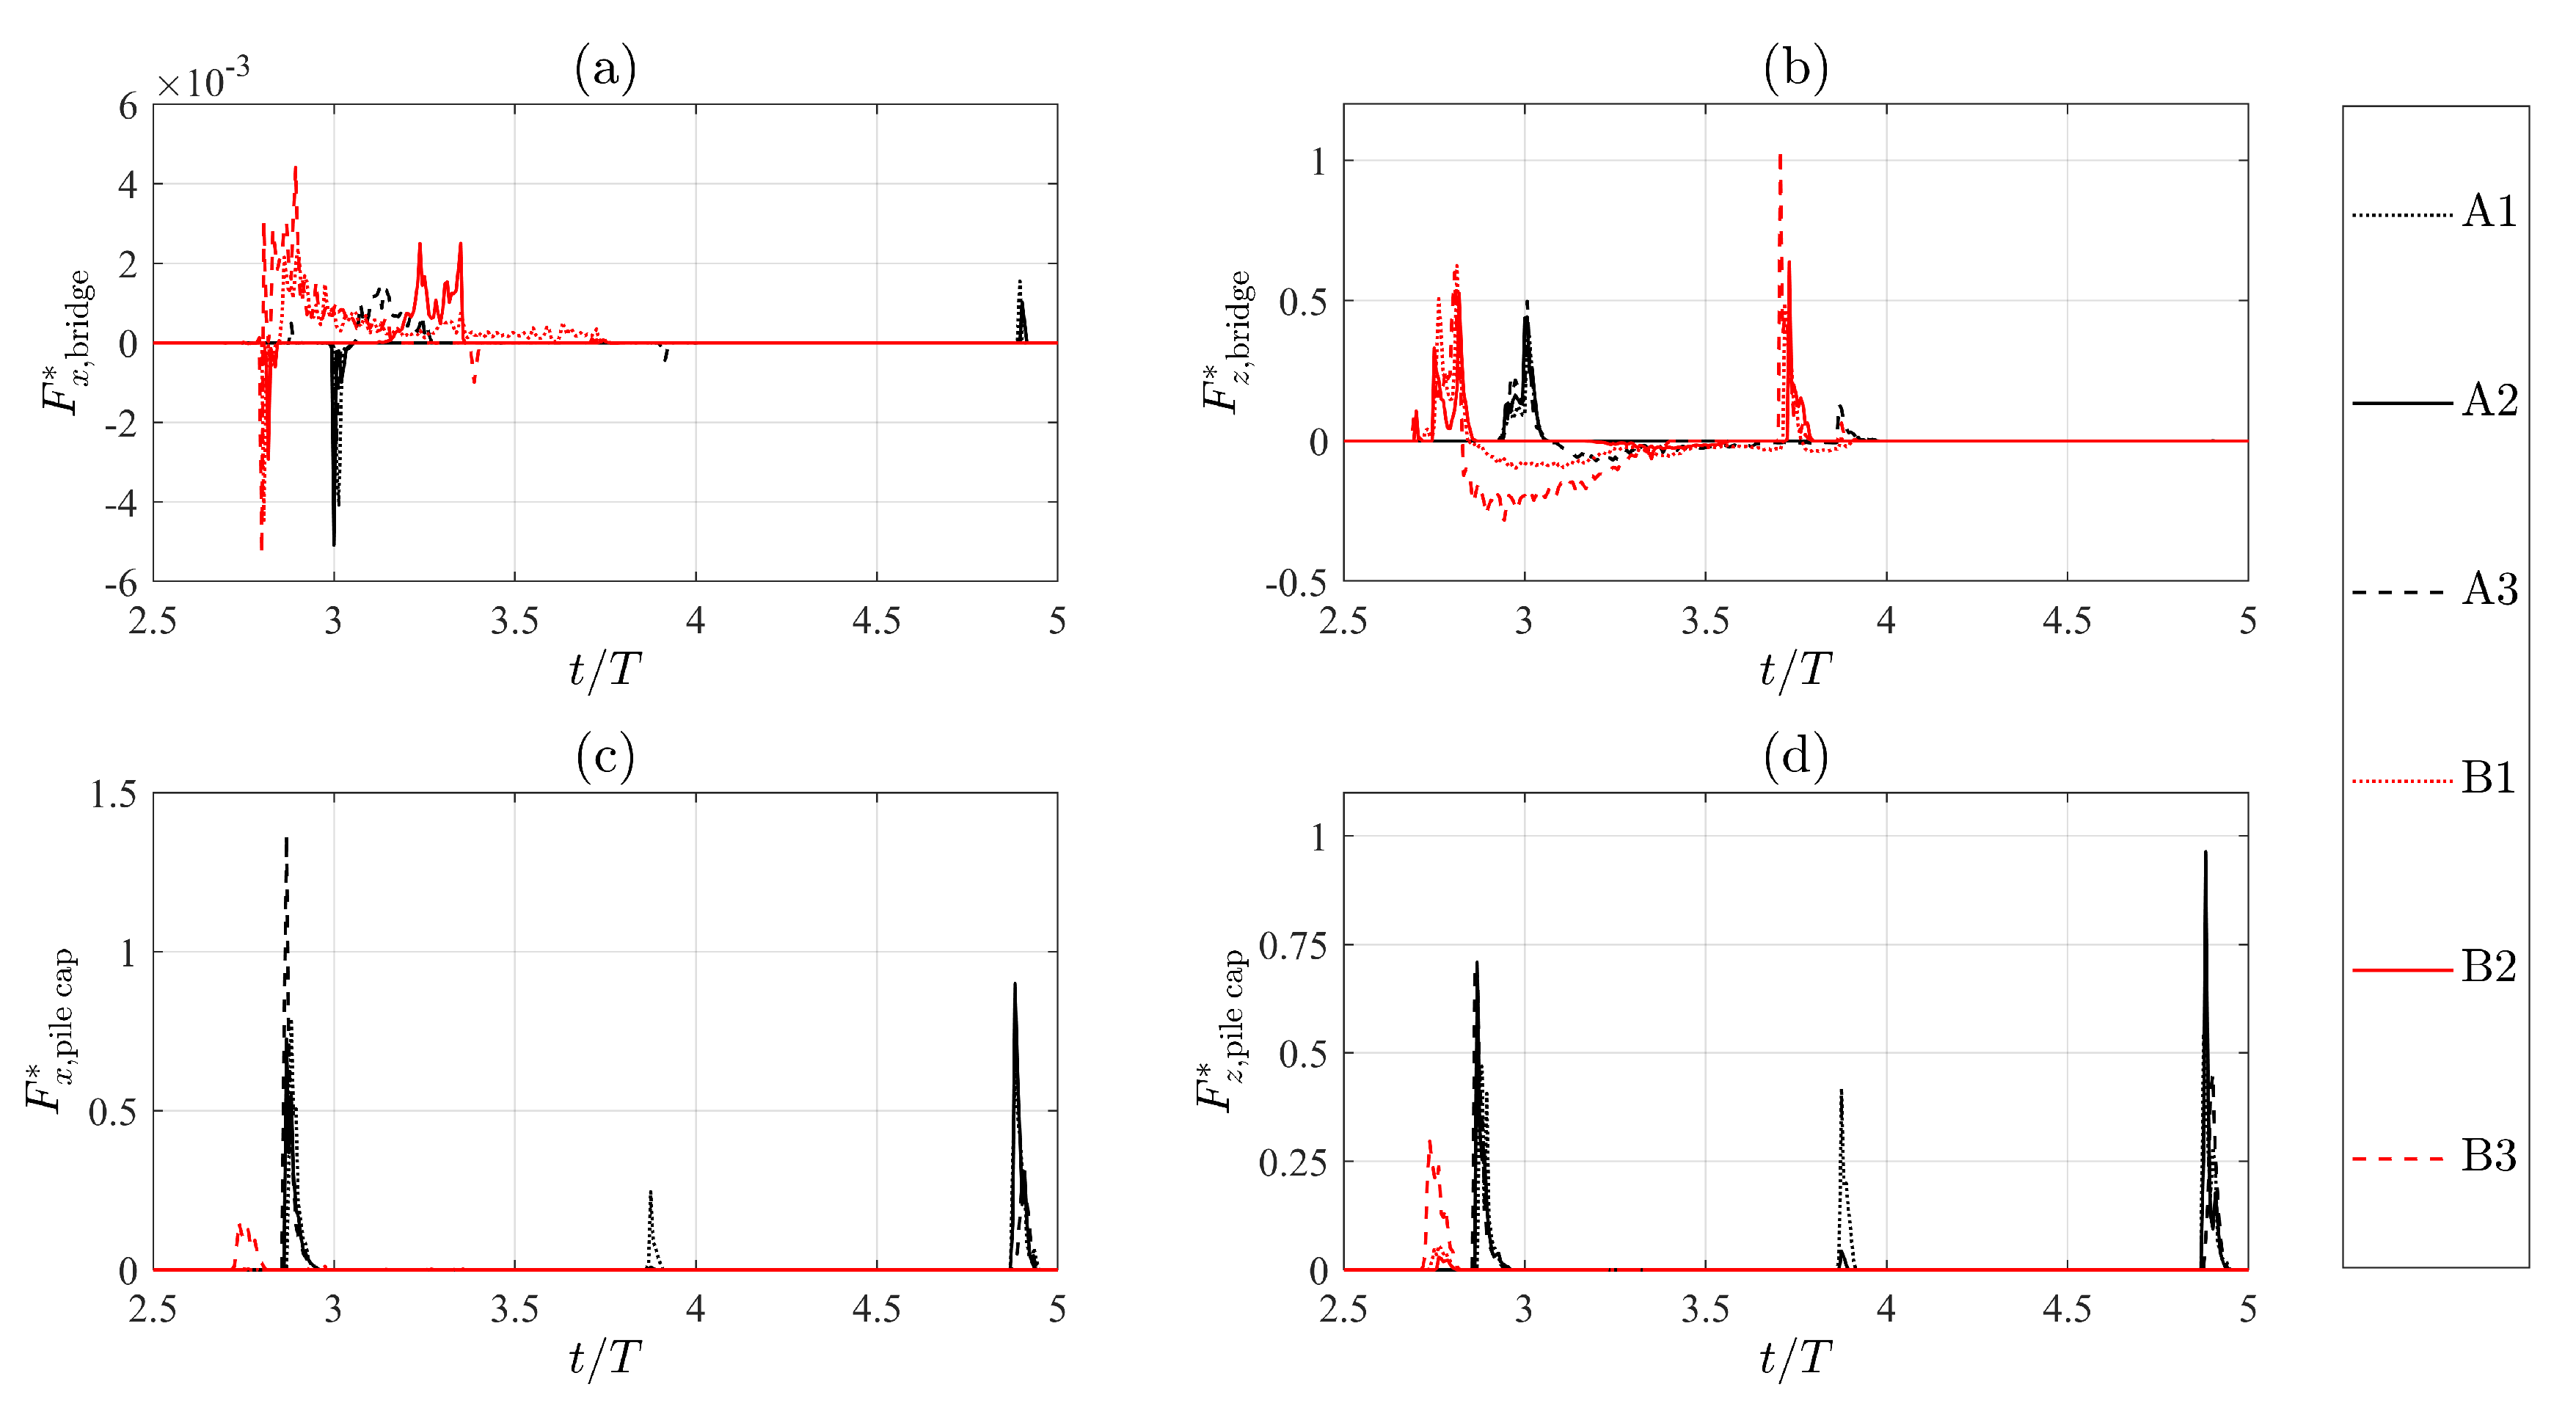
Horizontal and vertical forces were measured on the platform: the first pile cap and the first footbridge beam. The beam was washed away during storm Gloria. The SPH model results will help understanding the mechanism that led to the failure. The Badalona City Council has commissioned a survey right after the storm to check the status of the pier, also including those elements that fell into the sea, namely the first pile cap (including the two piles) and the first footbridge beam. From the damage report, it appears that the whole system was composed of two piles and the pile cap failed most probably because the bearing capacity of the soil was exceeded by the action exerted by the waves on the piles and the pile cap. The survey revealed that the pile cap is still connected to the piles and that the whole system hit the base of the second group of piles after them, and is currently lying on the sea bottom. The bending of the system composed by the two piles and the pile cap towards the beach freed the footbridge beam that moved “sliding” towards the base of the platform, bumping onto the two piles supporting the platform and damaging them. The footbridge beam does not show any damage and is lying on the sea bottom. This fact confirms its failure due to rigid body displacement. It is very likely that the sliding of the beam was also eased by the vertical uplifting force exerted by the waves under the beam, which reduced its effective weight, and hence the friction between the beam and the pile cap. Despite the aforementioned considerations, the damage report does not present any calculation supporting the hypothesis of a bearing failure and consequent sliding of the beam into the sea.
Forces measured by DualSPHysics are initially normalized by the total vertical load used for the design of each pier element, including self-weight and accidental load, as reported in Table 1. Horizontal and vertical forces on the platform are shown in Figure 9 for all test cases. The time is normalized by the wave period T on the x-axis. For the vertical forces, the normalized value is lower or very close to 1, the worst case corresponding to case B3. The forces exerted by the waves are therefore lower than the ones used for the platform design. The horizontal forces are very high, up to 2.5 times the vertical force. The horizontal force is mainly exerted on the front concrete beam located below the platform deck and will be partly transferred to the pile cap right after the platform. The platform front beam did not show heavy damage, therefore it can be argued that the platform was stiff enough to withstand a similar load. The vertical force on the first footbridge beam is depicted in Figure 10, normalized by the design total load. The measured vertical force is lower or equal to the design load, while the horizontal force is negligible. Nevertheless, the first beam was actually washed away during storm Gloria. The load exerted on the pile cap are also plotted in Figure 10. Contrarily to the observations made for the pier platform, it can be seen that test cases A1–A3 led to the maximum loads on the pile caps. As argued before, it is possible that the failure of the beam is likely a consequence of the failure of the first pile cap. Based on the results of the damage report from the Badalona City Council, it is highly probable that the failure of the pile cap was a consequence of the bearing failure at the foundation of the two piles beneath it. Therefore, instead of using the deign vertical loads to normalize the forces exerted on the pile cap, a different procedure was followed.

Derived Pile Axial Loads and Soil Bearing Capacity

The vertical and horizontal forces exerted by the waves on the pile cap will eventually generate new stresses on the piles and pile foundation. Even though the piles are not modeled numerically, it is always possible to calculate the forces and moments induced by the waves on the pile base and foundation. The value of the pile tolerable load is reported in the pier design report: specifically, the tolerable normal load calculated at the Ultimate Limit State ( N U ) is equal to 81.80 metric tons. The bearing capacity of the soil foundation is calculated in terms of the maximum axial load. This load is evaluated considering the total vertical load coming from the pile cap and the footbridge beams on each pile, and the wind action. The latter is the only horizontal action considered during the design and acts perpendicularly to the footbridge, hence perpendicularly to the considered wave action. The wind generates a moment that is transferred from the pile cap to the piles (and to their foundation) as a pair of axial forces. The pile driving into the soil is equal to 6 m, as reported from the design. The method proposed by [59] is employed to calculate the bearing capacity at each pile, Q f . This amounts to 107 metric tons.
In the design report, the wave action was neglected, most likely due to considerations that the piles are very slender and, consequently, the inertia or drag forces were assumed to be negligible. Furthermore, the action of the waves on the pile caps was not foreseen. When the design and remodel had been performed, the water depth below the platform and footbridge was actually larger than the one surveyed after storm Gloria. The deeper water and the unforeseen conditions generated by storms like Gloria might justify the choice to neglect any action on the pile caps, which are located 6 m above the mean water level. Having neglected the action of waves on the pile cap, the lateral resistance to the piles is not assessed. Waves acting on the pile cap generate a moment that is transferred from the piles to the soil. This bending actions should be balanced by the lateral soil resistance, calculated for cohesionless soils like sand. Here, a simple method proposed by [60] is employed for a characterization of the lateral resistance. This is evaluated in terms of ultimate horizontal load that the piles driven in the sand can bear. The expression for the ultimate horizontal load, H U , is:
H U = D L 3 K p γ 2 ( e + L )
where L is the embedded pile length into the sand, e is the eccentricity of the horizontal load, D is the pile diameter, γ is the effective soil weight and K p is the passive earth pressure coefficient. The values of γ and K p are assessed based on the standard penetration test (SPT) N value, as included in the design report, resulting in γ = 1750 kg/m 3 and K p = 4.40 . The value of L is 6 m and the eccentricity happens to correspond to the level arm, i.e., the distance between the pile head and base, equal to 12 m in the present case. The calculated value of H U is 32.82 metric tons (for a 2 pile cap system).
The normal load at the pile base can be derived from the forces on the pile cap as follows:
N waves = 1 2 V pile cap W pile cap 1 2 W beam cos 7 . 5
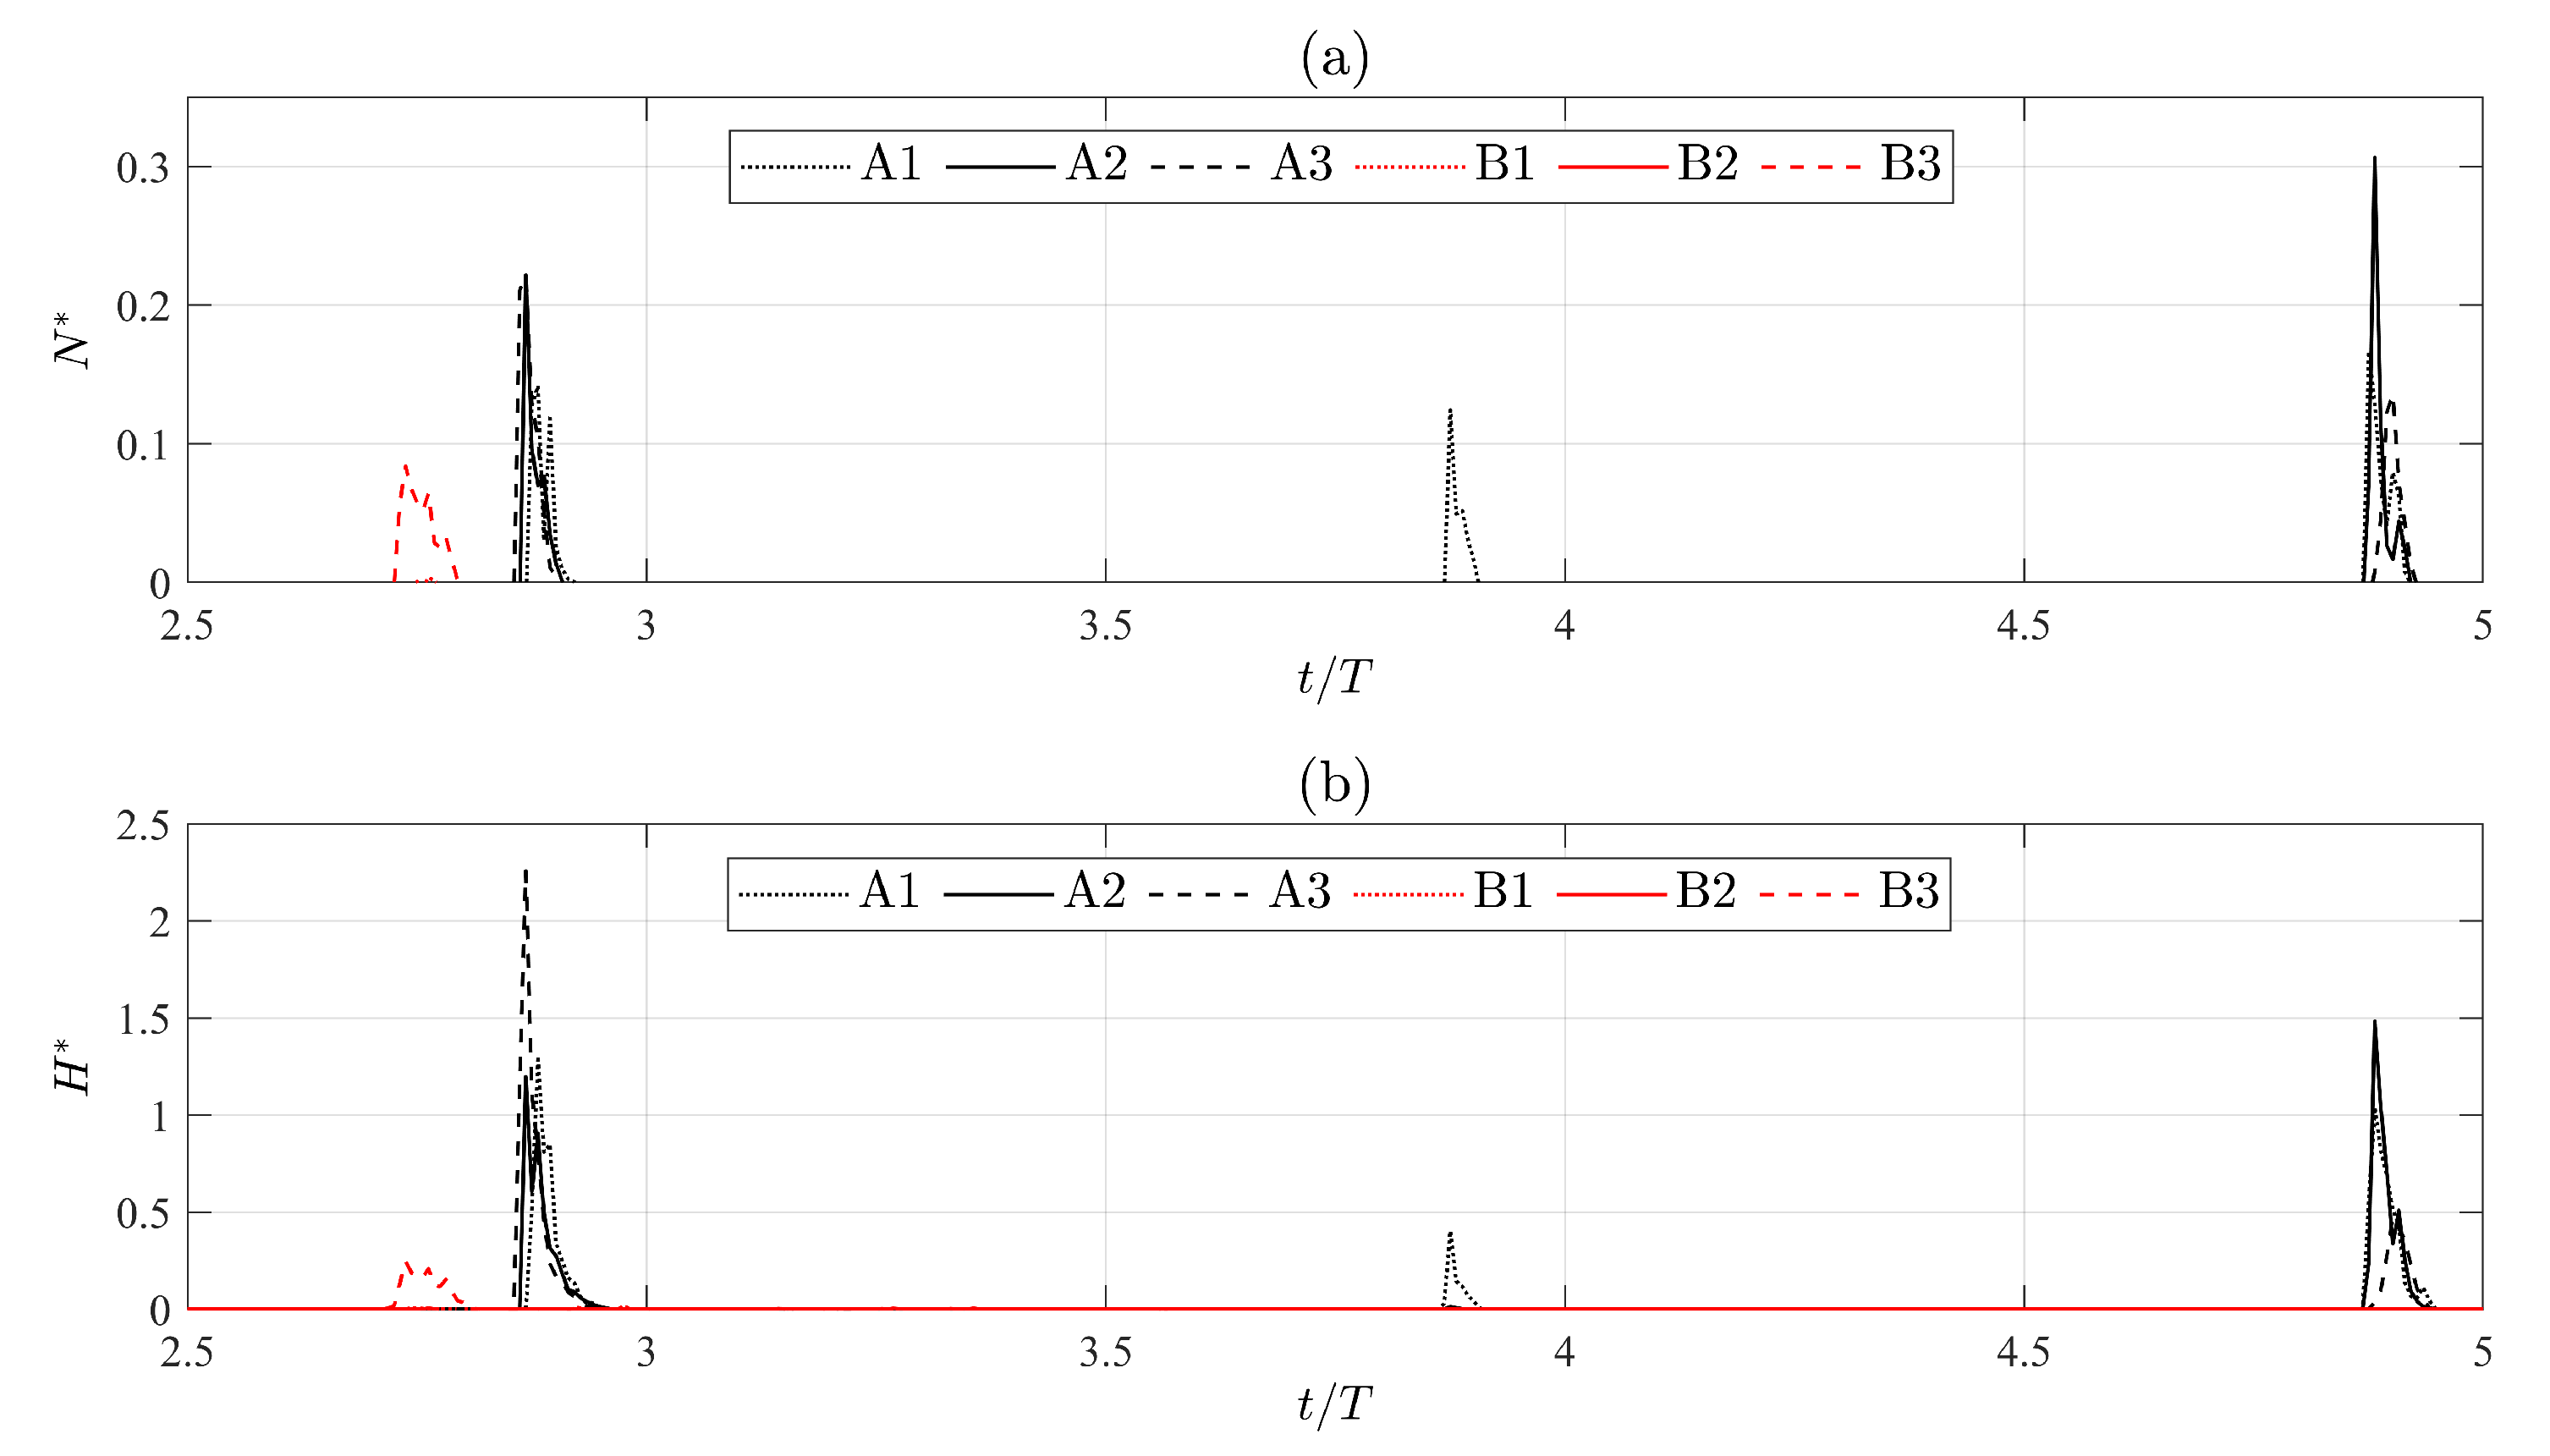
where V pile cap is the vertical force measured on the pile cap and exerted by the wave action, W pile cap is the weight of the pile cap and W beam is the footbridge beam weight. The vertical load exerted by the waves is actually directed upwards, similarly to an uplifting force, whereas the weight of the structure is acting downwards, against the wave action. Finally, the action on the pile cap is expressed in terms of the normalized variables N * = N waves / N U and H * = 0.5 H pile cap / H U , where H pile cap is the horizontal force measured on the pile cap. Results are reported in Figure 11: the maximum value of N * is smaller than 0.3 for test case A2, whereas larger values with a maximum of H * = 2.2 are seen for test case A3. These results show that the ultimate lateral resistance is exceeded before the axial pile resistance. For test cases B1–B3, both N * and H * results lower than 1, in stead. Although the piles are not modeled directly in DualSPHysics, the action exerted by the waves on the piles was assessed. To this end, the modified Morison’s equation was employed [61], to take into account the slamming force due to the breaking waves:
F w , pile = F D + F I + F S
where F D and F I are the drag and inertia forces based on Morison’s equation, respectively. The inertia component can be neglected, being the Keulegan–Carpenter number for the present cases larger than 150. From [62,63], the expression for the maximum drag force for breaking wave conditions can be derived:
F D = C D ρ g D H b 2 ( 1 λ ) 2 K D
being C D the drag coefficient (equal to 1 for the present case), H b the breaking wave height, λ the curling factor, K D a non-dimensional factor for the maximum drag force, ρ the water density, and D the pile diameter. The maximum slamming force can be expressed as:
F S = 0.5 C S ρ D C b 2 λ η b
where C S = π is the slamming coefficient, C b is the breaking wave celerity equal to [ g ( d b + η b ) ] 0.5 , d b and η b are the water depth and wave crest height at breaking [64], respectively. Equations (9) to (11) have been applied to the six text cases reported in the present work. The total force calculated by Morison’s equation has been normalized by the ultimate horizontal load, leading to values of F w , pile / H u = 0.6 0.8 . Hence, for the final pile stability assessment, the drag and slamming forces must be taken into account. In fact, for test cases A1–A3 drag and slamming forces result in the same order of magnitude of those transmitted from the pile caps. For test cases B1–B3, if drag and slamming forces are added to the calculated values of the horizontal force measured on the pile cap, then the total horizontal force on each pile will exceed the lateral soil resistance, leading once again to pile instability. The aforementioned results suggest to carry out future analyses on the on the wave forces exerted on the piles, which is outside the scope of the present work.
From all aforementioned results and discussions, it can be argued that the first failure mechanism that led to the failure of the whole system (pile cap, piles and beam) is the foundation failure, corroborating the hypotheses in the damage report from the Badalona City Council.

5. Conclusions

The SPH-based open source code DualSPHysics is applied to model the interaction between sea waves and the Pont del Petroli pier, in Badalona (Spain). The pier experienced severe damage after the sea storm named Gloria struck the coast of Spain in January 2020. One beam forming the pier footbridge was washed away together with one pile cap. Moreover, several piles show large damaged areas. The numerical model employed herein allows us to: (a) characterize the wave loads exerted on the pier and help with the design and setup of the upcoming experimental campaign in the large-scale wave flume at LIM/UPC; (b) provide preliminary information regarding the main failure mechanisms that led to the observed damage. The numerical model was employed to simulate conditions similar to the ones caused by storm Gloria. Due to the lack of information on local wave conditions during the storm in the Badalona area, a preliminary wave propagation study was carried out with the SWAN model. Visual observations at Pont del Petroli showed waves as high as 7–8 m, overtopping the pier platform and footbridge. The bathymetric survey carried out after the storm revealed a drastic modification of the sea bottom below the pier with sand accretion that led to a reduction of the water depth by 1–2 m on average.
Initially, a 2-D analysis was performed for different wave conditions and water depths, with the wave height varying between 6.1 and 9.0 m and the wave period ranging between 9.6 and 12.7 s. Initial water depths at the pier toe between 8 and 10 m were considered. The 2-D model results were reported in terms of the exerted loads and wave breaking patterns. The latter ones were compared with visual observations during the storm Gloria. Then, two wave conditions were selected for further 3-D simulations, i.e., wave height values of 6.5 and 8.0 m, corresponding to wave periods of 12.0 and 12.7 s, respectively. The water depth at the pier toe for the 3-D simulations corresponds to the post-Gloria survey, i.e., about 8 m in prototype. While the 2-D discretization is made to closely mimic the layout of the wave flume at LIM/UPC and employed the same wave generation system (i.e., a wedge-type wavemaker), an inlet boundary condition is chosen for the 3-D simulations. Free surface elevation and velocity for the inlet area have been extrapolated from the 2-D results. This way, the 3-D model is more efficient, since the inlet is placed in the vicinity of the pier and the wave breaking point, allowing to optimize the computational effort while retaining a high accuracy.
Horizontal and vertical forces have been measured on three elements: the pier head platform, the first pile cap and the first seawards π -shaped beam forming the footbridge. Existing formulas for wave loads on exposed jetties [65,66] could not be directly applied since they were derived for jetties on the horizontal bottom. In the present work, the piles are not modeled numerically, however the forces exerted on the pile cap were used to calculate the expected loads at the pile base and foundation. The direct action exerted by the waves on the piles was computed by means of Morison’s formula for slamming loads and breaking waves [62]. The forces measured on the platform and the footbridge beam were compared with the design loads, including self weight and accidental loads. The measured vertical forces are comparable or lower than the design ones. Larger forces are measured horizontally, especially for the most extreme wave conditions ( H = 8.0 m, T = 12.7 s). The obtained values were employed to specify the required features of load cells and pressure sensors to be used during the experimental campaign at LIM/UPC: nominal force/pressure, breaking load, sensitivity, accuracy and measuring ranges. Snapshots of the SPH results show that for such large waves, the breaking process starts before the platform. The wave, already a plunger, is thus impacting the platform on its front, transferring a big portion of its momentum to the structure. Part of the energy is transmitted via overtopping on the platform deck and the footbridge, leading to vertical forces directed downwards. For the case with H = 6 m and T = 12 s, the waves reach the platform with no apparent breaking. The loads on the platform are smaller than the ones of the larger wave conditions, however the pile cap shows larger impacts. The forces exerted on the pile cap were used to calculate the axial load that the pile cap would transfer to the two piles below it. The horizontal force on the pile cap was compared with the ultimate lateral resistance of the soil for the embedded pile length and eccentricity. For the comparison the contribution of drag and slamming forces on the piles due to the wave action was considered, too. The results prove that the exerted horizontal force is far larger than the later soil resistance, while the axial pile loads are smaller than their tolerable loads.
The numerical results from this SPH simulation campaign suggest that the exceeded lateral soil resistance might be the cause of the heavy damage observed after storm Gloria, supporting the hypothesis in the damage report by the Badalona City Council. The lateral soil resistance was exceeded by the wave force exerted on the piles and the pile cap, leading to the overturn of the system piles + pile cap. As a consequence, the footbridge beam lost its support and slid into the sea.
To the best of the authors’ knowledge, this work represents the first known application where a SPH inlet boundary condition is employed to model a real-world engineering test case. Findings in this manuscript will provide the basis for the proper design of an experimental campaign that will be carried out at the Maritime Engineering Laboratory of Universitat Politècnica de Catalunya-BarcelonaTech (LIM/UPC) with the aim of upgrading the design of the Pont del Petroli.

Author Contributions

Conceptualization, X.G. and C.A.; methodology, C.A. and J.M.D.; software, J.M.D., A.T. and A.J.C.C.; validation, C.A. and A.J.C.C.; formal analysis, C.A.; investigation, C.A., X.G. and J.S.; resources, X.G.; data curation, C.A.; writing—original draft preparation, A.T., C.A. and J.S.; writing—review and editing, A.T.; visualization, A.J.C.C. and C.A.; supervision, X.G.; project administration, X.G.; funding acquisition, C.A. All authors have read and agreed to the published version of the manuscript.

Funding

This research was funded by European Union’s Horizon 2020 research and innovation programme under the Marie Sklodowska-Curie grant agreement No.: 792370.

Conflicts of Interest

The authors declare no conflict of interest. The funders had no role in the design of the study; in the collection, analyses, or interpretation of data; in the writing of the manuscript, or in the decision to publish the results.

References

  1. Amores, A.; Marcos, M.; Carrió, D.S.; Gómez-Pujol, L. Coastal impacts of storm Gloria (January 2020) over the north-western Mediterranean. Nat. Hazards Earth Syst. Sci. 2020, 20, 1955–1968. [Google Scholar] [CrossRef]
  2. Reed, H.L. Wave interactions in swept-wing flows. Phys. Fluids 1987, 30, 3419–3426. [Google Scholar] [CrossRef]
  3. Rainey, R.C.T. A new equation for calculating wave loads on offshore structures. J. Fluid Mech. 1989, 204, 295–324. [Google Scholar] [CrossRef]
  4. Ferrant, P. Runup On a Cylinder Due to Waves and Current: Potential Flow Solution With Fully Nonlinear Boundary Conditions. Int. Soc. Offshore Polar Eng. 2001, 11, 33–41. [Google Scholar]
  5. Chalikov, D.; Sheinin, D. Modeling extreme waves based on equations of potential flow with a free surface. J. Comput. Phys. 2005, 210, 247–273. [Google Scholar] [CrossRef]
  6. Garriga, O.S.; Falzarano, J.M. Water Wave Interaction on a Truncated Vertical Cylinder. J. Offshore Mech. Arct. Eng. 2008, 130, 031002. [Google Scholar] [CrossRef]
  7. Casadei, F.; Halleux, J.; Sala, A.; Chillè, F. Transient fluid—Structure interaction algorithms for large industrial applications. Comput. Methods Appl. Mech. Eng. 2001, 190, 3081–3110. [Google Scholar] [CrossRef]
  8. Wang, Q.; Goosen, J.; van Keulen, F. An efficient fluid—Structure interaction model for optimizing twistable flapping wings. J. Fluids Struct. 2017, 73, 82–99. [Google Scholar] [CrossRef]
  9. Martínez-Ferrer, P.J.; Qian, L.; Ma, Z.; Causon, D.M.; Mingham, C.G. An efficient finite-volume method to study the interaction of two-phase fluid flows with elastic structures. J. Fluids Struct. 2018, 83, 54–71. [Google Scholar] [CrossRef] [Green Version]
  10. Zhan, L.; Peng, C.; Zhang, B.; Wu, W. A stabilized TL—WC SPH approach with GPU acceleration for three-dimensional fluid—Structure interaction. J. Fluids Struct. 2019, 86, 329–353. [Google Scholar] [CrossRef]
  11. Liang, H.; Ouled Housseine, C.; Chen, X.; Shao, Y. Efficient methods free of irregular frequencies in wave and solid/porous structure interactions. J. Fluids Struct. 2020, 98, 103130. [Google Scholar] [CrossRef]
  12. Gingold, R.A.; Monaghan, J.J. Smoothed particle hydrodynamics: Theory and application to non-spherical stars. Mon. Not. R. Astron. Soc. 1977, 181, 375–389. [Google Scholar] [CrossRef]
  13. Monaghan, J.J. Smoothed particle hydrodynamics. Annu. Rev. Astron. Astr. 1992, 30, 543–574. [Google Scholar] [CrossRef]
  14. Liu, G.R.; Liu, M.B. Smoothed Particle Hydrodynamics: A Meshfree Particle Method; World Scientific: Singapore, 2003. [Google Scholar]
  15. Violeau, D.; Rogers, B.D. Smoothed particle hydrodynamics (SPH) for free-surface flows: Past, present and future. J. Hydraul. Res. 2016, 54, 1–26. [Google Scholar] [CrossRef]
  16. Gotoh, H.; Khayyer, A. Current achievements and future perspectives for projection-based particle methods with applications in ocean engineering. J. Ocean Eng. Mar. Energy 2016, 2, 251–278. [Google Scholar] [CrossRef] [Green Version]
  17. Violeau, D. Fluid Mechanics and the SPH Method: Theory and Applications; Oxford University Press: Oxford, UK, 2012. [Google Scholar]
  18. Tafuni, A.; Sahin, I. Non-linear hydrodynamics of thin laminae undergoing large harmonic oscillations in a viscous fluid. J. Fluids Struct. 2015, 52, 101–117. [Google Scholar] [CrossRef]
  19. Shi, Y.; Li, S.; Chen, H.; He, M.; Shao, S. Improved SPH simulation of spilled oil contained by flexible floating boom under wave—Current coupling condition. J. Fluids Struct. 2018, 76, 272–300. [Google Scholar] [CrossRef]
  20. Pan, K.; IJzermans, R.H.A.; Jones, B.D.; Thyagarajan, A.; van Beest, B.W.H.; Williams, J.R. Application of the SPH method to solitary wave impact on an offshore platform. Comp. Part. Mech. 2016, 3, 155–166. [Google Scholar] [CrossRef] [Green Version]
  21. Yang, Y.; Li, J. SPH-FE-Based Numerical Simulation on Dynamic Characteristics of Structure under Water Waves. J. Mar. Sci. Eng. 2020, 8, 630. [Google Scholar] [CrossRef]
  22. Domínguez, J.M.; Crespo, A.J.; Hall, M.; Altomare, C.; Wu, M.; Stratigaki, V.; Troch, P.; Cappietti, L.; Gómez-Gesteira, M. SPH simulation of floating structures with moorings. Coast. Eng. 2019, 153, 103560. [Google Scholar] [CrossRef]
  23. Gong, K.; Shao, S.; Liu, H.; Wang, B.; Tan, S.K. Two-phase SPH simulation of fluid—Structure interactions. J. Fluids Struct. 2016, 65, 155–179. [Google Scholar] [CrossRef] [Green Version]
  24. Peng, C.; Xu, G.; Wu, W.; sui Yu, H.; Wang, C. Multiphase SPH modeling of free surface flow in porous media with variable porosity. Comput. Geotech. 2017, 81, 239–248. [Google Scholar] [CrossRef]
  25. Mokos, A.; Rogers, B.D.; Stansby, P.K. A multi-phase particle shifting algorithm for SPH simulations of violent hydrodynamics with a large number of particles. J. Hydraul. Res. 2017, 55, 143–162. [Google Scholar] [CrossRef] [Green Version]
  26. Crespo, A.; Domínguez, J.; Rogers, B.; Gómez-Gesteira, M.; Longshaw, S.; Canelas, R.; Vacondio, R.; Barreiro, A.; García-Feal, O. DualSPHysics: Open-source parallel CFD solver based on Smoothed Particle Hydrodynamics (SPH). Comput. Phys. Commun. 2015, 187, 204–216. [Google Scholar] [CrossRef]
  27. Altomare, C.; Tagliafierro, B.; Suzuki, T.; Domínguez, J.M.; Crespo, A.J.C.; Briganti, R. Relaxation zone method in SPH-based model applied to wave-structure interaction. In Proceedings of the International Ocean and Polar Engineering Conference, Sapporo, Japan, 10–15 June 2018; pp. 204–216. [Google Scholar]
  28. Altomare, C.; Viccione, G.; Tagliafierro, B.; Bovolin, V.; Domínguez, J.M.; Crespo, A.J.C. Computational Fluid Dynamics—Basic Instruments and Applications in Science; Chapter Free-Surface Flow Simulations with Smoothed Particle Hydrodynamics Method Using High-Performance Computing; IntechOpen: London, UK, 2017; pp. 73–100. [Google Scholar]
  29. Verbrugghe, T.; Domínguez, J.; Altomare, C.; Tafuni, A.; Vacondio, R.; Troch, P.; Kortenhaus, A. Non-linear wave generation and absorption using open boundaries within DualSPHysics. Comput. Phys. Commun. 2019, 240, 46–59. [Google Scholar] [CrossRef]
  30. Gómez Lahoz, M.; Carretero Albiach, J.C. Wave forecasting at the Spanish coasts. J. Atmos. Ocean Sci. 2005, 10, 389–405. [Google Scholar] [CrossRef]
  31. Booij, N.; Holthuijsen, L.; Ris, R. The “Swan” Wave Model for Shallow Water. In Proceedings of the 25th International Conference on Coastal Engineering, Orlando, FL, USA, 2–6 September 1996; pp. 668–676. [Google Scholar]
  32. Wendland, H. Piecewise polynomial, positive definite and compactly supported radial functions of minimal degree. Adv. Comput. Math. 1995, 4, 389–396. [Google Scholar] [CrossRef]
  33. Rota Roselli, R.A.; Vernengo, G.; Altomare, C.; Brizzolara, S.; Bonfiglio, L.; Guercio, R. Ensuring numerical stability of wave propagation by tuning model parameters using genetic algorithms and response surface methods. Environ. Model. Softw. 2018, 103, 62–73. [Google Scholar] [CrossRef]
  34. Altomare, C.; Domínguez, J.; Crespo, A.; González-Cao, J.; Suzuki, T.; Gómez-Gesteira, M.; Troch, P. Long-crested wave generation and absorption for SPH-based DualSPHysics model. Coast. Eng. 2017, 127, 37–54. [Google Scholar] [CrossRef]
  35. Fourtakas, G.; Dominguez, J.M.; Vacondio, R.; Rogers, B.D. Local uniform stencil (LUST) boundary condition for arbitrary 3-D boundaries in parallel smoothed particle hydrodynamics (SPH) models. Comput. Fluids 2019, 190, 346–361. [Google Scholar] [CrossRef]
  36. Leimkuhler, B.; Matthews, C. Molecular Dynamics; Springer International Publishing: Cham, Switzerland, 2016. [Google Scholar]
  37. Monaghan, J.J.; Cas, R.; Kos, A.; Hallworth, M. Gravity currents descending a ramp in a stratified tank. J. Fluid Mech. 1999, 379, 39–70. [Google Scholar] [CrossRef]
  38. Crespo, A.J.C.; Gomez-Gesteira, M.; Dalrymple, R.A. Boundary conditions generated by dynamic particles in SPH methods. Comput. Mater. Contin. 2007, 5, 173–184. [Google Scholar]
  39. Altomare, C.; Crespo, A.; Domínguez, J.M.; Gómez-Gesteira, M.; Suzuki, T.; Verwaest, T. Applicability of Smoothed Particle Hydrodynamics for estimation of sea wave impact on coastal structures. Coast. Eng. 2015, 96, 1–12. [Google Scholar] [CrossRef]
  40. Tafuni, A.; Sahin, I. Hydrodynamic Loads on Vibrating Cantilevers Under a Free Surface in Viscous Fluids With SPH. In ASME International Mechanical Engineering Congress and Exposition; Volume 7B: Fluids Engineering Systems and Technologies; American Society of Mechanical Engineers: New York, NY, USA, 2013. [Google Scholar]
  41. Mogan, S.C.; Chen, D.; Hartwig, J.; Sahin, I.; Tafuni, A. Hydrodynamic analysis and optimization of the Titan submarine via the SPH and Finite—Volume methods. Comput. Fluids 2018, 174, 271–282. [Google Scholar] [CrossRef]
  42. Tafuni, A.; Domínguez, J.M.; Vacondio, R.; Crespo, A.J.C. A versatile algorithm for the treatment of open boundary conditions in Smoothed particle hydrodynamics GPU models. Comput. Methods Appl. Mech. Eng. 2018, 342, 604–624. [Google Scholar] [CrossRef]
  43. Ferrand, M.; Laurence, D.R.; Rogers, B.D.; Violeau, D.; Kassiotis, C. Unified semi-analytical wall boundary conditions for inviscid, laminar or turbulent flows in the meshless SPH method. Int. J. Numer. Methods Fluids 2013, 71, 446–472. [Google Scholar] [CrossRef] [Green Version]
  44. Rogers, B.D.; Dalrymple, R.A.; Stansby, P.K. Simulation of caisson breakwater movement using 2-D SPH. J. Hydraul. Res. 2010, 48, 135–141. [Google Scholar] [CrossRef]
  45. Antuono, M.; Colagrossi, A.; Marrone, S.; Lugni, C. Propagation of gravity waves through an SPH scheme with numerical diffusive terms. Comput. Phys. Commun. 2011, 182, 866–877. [Google Scholar] [CrossRef]
  46. Verbrugghe, T.; Domínguez, J.M.; Altomare, C.; Tafuni, A.; Troch, P.; Kortenhaus, A. Application of open boundaries within a two-way coupled SPH model to simulate non-linear wave-structure interactions. Coast. Eng. Proc. 2018, 1, 14. [Google Scholar] [CrossRef] [Green Version]
  47. Altomare, C.; Domínguez, J.M.; Crespo, A.J.C.; Suzuki, T.; Caceres, I.; Gómez-Gesteira, M. Hybridization of the Wave Propagation Model SWASH and the Meshfree Particle Method SPH for Real Coastal Applications. Coast. Eng. J. 2015, 57, 1550024-1–1550024-34. [Google Scholar] [CrossRef]
  48. Lowe, R.; Buckley, M.; Altomare, C.; Rijnsdorp, D.; Yao, Y.; Suzuki, T.; Bricker, J. Numerical simulations of surf zone wave dynamics using Smoothed Particle Hydrodynamics. Ocean Model. 2019, 144, 101481. [Google Scholar] [CrossRef] [Green Version]
  49. Gomez-Gesteira, M.; Rogers, B.; Crespo, A.; Dalrymple, R.; Narayanaswamy, M.; Dominguez, J. SPHysics—Development of a free-surface fluid solver—Part 1: Theory and formulations. Comput. Geosci. 2012, 48, 289–299. [Google Scholar] [CrossRef]
  50. Gomez-Gesteira, M.; Crespo, A.; Rogers, B.; Dalrymple, R.; Dominguez, J.; Barreiro, A. SPHysics—Development of a free-surface fluid solver—Part 2: Efficiency and test cases. Comput. Geosci. 2012, 48, 300–307. [Google Scholar] [CrossRef]
  51. Domínguez, J.M.; Altomare, C.; Gonzalez-Cao, J.; Lomonaco, P. Towards a more complete tool for coastal engineering: Solitary wave generation, propagation and breaking in an SPH-based model. Coast. Eng. J. 2019, 61, 15–40. [Google Scholar] [CrossRef]
  52. González-Cao, J.; Altomare, C.; Crespo, A.; Domínguez, J.; Gómez-Gesteira, M.; Kisacik, D. On the accuracy of DualSPHysics to assess violent collisions with coastal structures. Comput. Fluids 2019, 179, 604–612. [Google Scholar] [CrossRef]
  53. St-Germain, P.; Nistor, I.; Townsend, R.; Shibayama, T. Smoothed-Particle Hydrodynamics Numerical Modeling of Structures Impacted by Tsunami Bores. J. Waterw. Port Coast. Ocean Eng. 2014, 140, 66–81. [Google Scholar] [CrossRef]
  54. Cunningham, L.S.; Rogers, B.D.; Pringgana, G. Tsunami wave and structure interaction: An investigation with Smoothed-particle hydrodynamics. Proc. Inst. Civ. Eng.—Eng. Comput. Mech. 2014, 167, 126–138. [Google Scholar] [CrossRef] [Green Version]
  55. Pringgana, G.; Cunningham, L.S.; Rogers, B.D. Modelling of tsunami-induced bore and structure interaction. Proc. Inst. Civ. Eng.—Eng. Comput. Mech. 2016, 169, 109–125. [Google Scholar] [CrossRef] [Green Version]
  56. Altomare, C.; Crespo, A.; Rogers, B.; Dominguez, J.; Gironella, X.; Gómez-Gesteira, M. Numerical modelling of armour block sea breakwater with Smoothed particle hydrodynamics. Comput. Struct. 2014, 130, 34–45. [Google Scholar] [CrossRef]
  57. Zhang, F.; Crespo, A.; Altomare, C.; Domínguez, J.; Marzeddu, A.; ping Shang, S.; Gómez-Gesteira, M. A numerical tool to simulate real breakwaters. J. Hydrodyn. 2018, 30, 95–105. [Google Scholar] [CrossRef]
  58. Subramaniam, S.; Scheres, B.; Schilling, M.; Liebisch, S.; Kerpen, N.; Schlurmann, T.; Altomare, C.; Schüttrumpf, H. Influence of Convex and Concave Curvatures in a Coastal Dike Line on Wave Run-up. Water 2019, 11, 1333. [Google Scholar] [CrossRef] [Green Version]
  59. Meyerhof, G.G. Closure of “Compaction of Sands and Bearing Capacity of Piles”. J. S. Mech. Fdtn. Div. ASCE 1959, 85, 1–29. [Google Scholar]
  60. Broms, B. Lateral Resistance of Piles in Cohesionless Soils. J. Soil Mech. Found. Div. 1964, 90, 123–156. [Google Scholar]
  61. Goda, Y.; Haranaka, S.; Kitahata, M. Study of impulsive breaking wave forces on piles. Rep. Port Harb. Res. Inst. Jpn. 1966, 5, 1–30. [Google Scholar]
  62. Goda, Y. Wave Forces on a Vertical Circular Cylinder: Experiments and a Proposed Method of Wave Force Computation. Rep. Port Harb. Res. Inst. Jpn. 1964, 8, 1–74. [Google Scholar]
  63. Departmet of the Army, US Army Corps of Engineers. Shore Protection Manual; CERC: Washington, DC, USA, 1984; Volume 1. [Google Scholar]
  64. Tanimoto, K.; Takahashi, S.; Kaneko, T.; Shiota, K. Impulsive breaking wave forces on an inclined pile exerted by random waves. In Proceedings of the 20th International Conference on Coastal Engineering, Taipei, Taiwan, 9–14 November 1986; pp. 2288–2302. [Google Scholar]
  65. Cuomo, G.; Tirindelli, M.; Allsop, W. Wave-in-deck loads on exposed jetties. Coast. Eng. 2007, 54, 657–679. [Google Scholar] [CrossRef]
  66. Liu, Q.; Sun, T.; Wang, D.; Wei, Z. Wave uplift force on horizontal panels: A laboratory study. J. Oceanol. Limnol. 2019, 37, 1899–1911. [Google Scholar] [CrossRef]
Figure 1. 1980s (left) and 2017 (right) aerial photos of the Pont del Petroli. Originally constructed for industrial purposes, the pier is now open to the public. (Sources: Concepció Riba).
Jmse 08 00826 g001
Figure 2. Geometrical details and top view of the platform, beam and pile cap forming the Pont del Petroli pier. The sketches are extracted from the first design report and provided by the Maritime Engineering Laboratory of Universitat Politècnica de Catalunya-BarcelonaTech (LIM/UPC) for the present manuscript. The sketches belong to the original project deposited in the 1965 archive "Colegio de Ingenieros de Caminos, Canales y Puertos de Madrid", PN 9280/65, under José Entrecanales Ibarra.
Jmse 08 00826 g002
Figure 3. Beach profiles at Pont del Petroli. The original beach profile from the design report is indicated by a blue line. In red, the two profiles surveyed by LIM/UPC before and after storm Gloria.
Jmse 08 00826 g003
Figure 4. View of the Catalan coast between Barcelona and Capo Begur. (Map Data: Google Earth, SIO, NOAA, U.S. Navy, NGA, GEBCO).
Jmse 08 00826 g004
Figure 5. A large wave hitting the platform of the Pont del Petroli during storm Gloria. (Source: Badalona City Council).
Jmse 08 00826 g005
Figure 6. Sketch of the experimental layout. The 2-D numerical model mimics this layout to a great extent. Conversely, the 3-D model has an open boundary for wave generation at the inlet, i.e., at x = 50 m.
Jmse 08 00826 g006
Figure 7. Snapshots of the SPH horizontal velocity contours for the test case A1. (a) Time: 10.350 s; (b) Time: 10.800 s; (c) Time: 10.975 s; (d) Time: 11.100 s.
Jmse 08 00826 g007
Figure 8. Snapshots of the SPH horizontal velocity contours for the test case B1. (a) Time: 10.350 s; (b) Time: 10.600 s; (c) Time: 10.850 s; (d) Time: 11.100 s.
Jmse 08 00826 g008
Figure 9. Time history of the normalized (a) horizontal and (b) vertical forces on the pier platform for different tested wave conditions.
Jmse 08 00826 g009
Figure 10. Time history of the normalized forces on the beam and pile cap for different tested wave conditions: (a) horizontal force on the pier beam, (b) vertical force on the pier beam, (c) horizontal force on the pile cap and (d) vertical force on the pile cap.
Jmse 08 00826 g010
Figure 11. Time history of the normalized pile axial load (a) and lateral soil resistance (b).
Jmse 08 00826 g011
Table 1. Main characteristics of the Pont del Petroli pier elements.
ElementMain Exposed Area (Volume)Self-WeightDistributed Vertical Load (Self-Weight + Accidental Load)Final Design Vertical Load
Platform9.75 m × 6.75 m32.90 tons2.00 tons/m 2 131.62 tons
π -shaped beam15.00 m × 3.20 m29.25 tons3.60 tons/m 2 54.00 tons
Pile cap (2 piles)4.40 m × 0.8 (×1.2) m9.12 tons12.30 tons/m 2 54.12 tons
Pile cap (4 piles)4.40 m × 0.8 (×2.0) m15.20 tons15.80 tons/m 2 60.20 tons
Table 2. 3-D test cases chosen for the Smoothed Particle Hydrodynamics (SPH) model.
Test CaseWave Conditions at Generation in 2-D (in Prototype Scale)Scaling Factor for u ( t ) from Equation (6)
A1 H = 6.5 m, T = 12.0 s1.00
A21.05
A31.10
B1 H = 8.2 m, T = 12.7 s1.00
B20.95
B31.05
Publisher’s Note: MDPI stays neutral with regard to jurisdictional claims in published maps and institutional affiliations.