Article

An Analytical Model for Rock Cutting with a Chisel Pick of the Cutter Suction Dredger

1
State Key Laboratory of Ocean Engineering, Shanghai Jiao Tong University, Shanghai 200240, China
2
Collaborative Innovation Center for Advanced Ship and Deep-Sea Exploration, Shanghai Jiao Tong University, Shanghai 200240, China
3
School of Naval Architecture, Ocean and Civil Engineering, Shanghai Jiao Tong University, Shanghai 200240, China
4
Shanghai Jiao Tong University Underwater Engineering Institute Co. Ltd., Shanghai 200231, China
*
Author to whom correspondence should be addressed.
J. Mar. Sci. Eng. 2020, 8(10), 806; https://doi.org/10.3390/jmse8100806
Submission received: 21 September 2020 / Revised: 12 October 2020 / Accepted: 15 October 2020 / Published: 16 October 2020
(This article belongs to the Section Coastal Engineering)

Abstract

:
Cutter suction dredgers are important pieces of rock excavation equipment in port and waterway construction. It is valuable but difficult to properly estimate the cutting force on the chisel pick of the cutter suction dredger. In this paper, an analytical model, called the crushed zone expansion induced tensile failure model (CEIT model), is proposed for rock cutting with a chisel pick in order to predict the peak cutting force (Fc) more accurately. First, a review of the existing models for rock cutting with a chisel pick is presented. Next, based on the tensile breakage theory, cavity expansion theory and some hypotheses, the mathematical formula of the CEIT model is obtained. Different from that in the previous models, the effect of the rock on both sides of the chisel pick on Fc, defined as the sidewall effect is considered in the CEIT model. Then, the predicted Fc by the CEIT model is compared with the predicted Fc by existing theoretical models and experimental results to check the validity of the CEIT model. The results show that the CEIT model can well capture the relationships of Fc to the cutting parameters, including cutting width, cutting depth, and rake angle, and can predict the experimental results much better than the existing models. Finally, the sidewall effect and its influence factors according to the CEIT model are discussed.

Graphical Abstract

1. Introduction

Rock excavation with tools is widely used for mining, tunneling, drilling, and dredging engineering. The rock excavation devices, such as the polycrystalline diamond compact cutter (PDC cutter) and the cutter head of the cutter suction dredger (CSD), break the rock mainly through the cutting action. The cutter head of the CSD and the rock cutting with a chisel pick (tooth of the cutter head) are shown in Figure 1. With the development of the CSDs, they are widely adopted for rock excavation in port and waterway construction. From a large-scale perspective, rock excavation is the interaction between the rock masses and the excavation devices. However, in practical applications, the interaction zone between every single chisel pick and the rock masses is very small, and the chisel pick is frequently required to break the intact rock, rather than just separate the rock masses along the discontinuities, especially when the rock masses contain very few discontinuities. Considering the fact that the strength of the intact rock is larger than strength of the rock masses, cutting the intact rock requires a larger cutting force. Thus, rock cutting usually refers to the interactions between the cutters and the intact rock rather than the rock masses, and the rock strength adopted in rock cutting refers to the strength of the intact rock.
In order to enhance cutting performance and machine life, it is very important to reveal the fracture mechanism of rocks and estimate the cutting force in the rock cutting process. The mechanism of rock cutting with PDC cutters has been investigated in numerous pieces of scientific literature [1,2,3,4,5,6,7,8,9,10,11]. Since the cutting depth is shallow, typically less than 1 mm for a medium strength sandstone [12], and the rake angle is negative (or the back rake angle is positive), the ductile fracture regime usually happens in rock cutting with PDC cutters [12,13,14]. In the ductile fracture regime, the cutting force is proportional to the sectional area of the groove [6,12,13,15]. The ratio of the cutting force to the sectional area of the groove is the intrinsic energy, which is found well correlated with the uniaxial compressive strength (UCS) [4,12,16]. Therefore, the cutting force can be estimated by multiplying the sectional area of the groove and the UCS of the rock. However, this method is not suitable for predicting the cutting force on the teeth (chisel picks or conical picks) mounted on the cutter head of the CSD. For rock cutting with the CSD, positive rake angles and large cutting depths, mostly larger than 10 mm to obtain high dredging production, are used [17], as presented in Figure 1b. In this situation, the rock will fracture in the brittle regime rather than the ductile regime [14,18,19]. In the brittle fracture regime, the cutting force is affected by the rake angle, the cutting depth, the shape of the cutter, and the rock strength [20,21,22,23,24,25,26,27]. Evans [20,21,22] believed that rock cutting with a large positive rake angle is governed by tensile failure and the cutting force is related to the tensile strength of the rock. While Nishimatsu [26] believed that rock cutting in the brittle fracture regime is governed by shear failure and the cutting force is related to the shear strength of the rock. Both Evans and Nishimatsu developed theoretical models for rock cutting problems. Their models are widely cited for comparisons [28,29,30,31,32,33,34] and for developing new models [23,24,25,35].
However, Evans’ model [20] and Nishimatsu’s model [26] for rock cutting with a chisel pick are developed by two-dimensional analysis. They are only suitable for practical rock cutting in shallow cutting depths (the ratio of the cutting width to cutting depth is very large). When the cutting depth is close to or larger than the cutting width, the rock on both sides of the chisel pick has a great effect on the cutting force, as studied in [15,36,37]. This effect is defined as the sidewall effect in this work. The cutting force may increase in a parabolic form rather than a linear form with the increasing cutting depth because of the sidewall effect, both in the ductile and brittle fracture regimes, according to the experimental results, when the ratio of the cutting width to cutting depth is small enough [15,27,36,38]. Therefore, the sidewall effect cannot be ignored during estimating the cutting force on the chisel pick of the CSD because the cutting depth is usually larger than the cutting width.
Even though dredging operations with a CSD are performed under water pressure, a limited water depth does not cause hyperbaric conditions [39]. In addition, the results in [40,41] show that even in deep water conditions, the water pressure has a very small effect on the cutting force in the steady stage of the dredging operation. Therefore, it is acceptable to ignore the effect of the water pressure on the cutting force during rock dredging with a CSD. Then, the cutting action of the chisel pick or conical pick mounted on the CSD is similar to the cutting actions with a continuous miner [38] and a road-header [42]. The rock cutting process with a chisel pick or conical pick of the CSD can be characterized by an increase in the cutting force as the picks penetrate into the rock. At the same time, a crushed zone is generated in front of the pick tip [31,43,44,45,46]. When the cutting force reaches a critical value, a rock chip is produced with an instantaneous reduction in cutting force. As the pick cuts forward, it will penetrate into the rock again and repeat the chip formation process. The shape of the diagram of the cutting force versus cutting distance is zigzag [31,38,47,48,49,50,51]. The crushed zone generated near the pick tip, as shown in Figure 1b, is similar to the core region and plastic region of the cavity expansion model [52,53,54,55,56,57]. Therefore, the cavity expansion theory was used for analyzing the fracture mechanism of rock indentation by tools in [53,54,57]. As the pick penetrates into the rock, the size of the crushed zone increases, which will lead to the initiation and propagation of tensile cracks and finally the rock fragmentation in rock indentation. Rock cutting with picks at a positive rake angle is actually a series of indentations on the rock edge. In this situation, the tensile cracks, initiating near the elasto–plastic interface, can easier propagate to the free surface of the rock because the rock edge is unconfined. Macro tensile cracks can be visualized in the rock edge indentation tests when the cutting depth is large [58]. A few models were proposed for predicting the peak cutting force on the picks based on tensile breakage theory [20,22,59,60]. The first indentation cycle of the rock cutting process was considered to obtain these analytical models. As the shape of the chip produced in the first indentation cycle is relatively regular, the chips produced at different cutting depths are similar [58,61].
Based on the above context, an analytical model is proposed in this paper for estimating the peak cutting force on the chisel pick in cutting the intact rock. The new proposed model is based on the tensile breakage theory, similar to Evans’ model and the assumption that the tensile failure is induced by the expansion of the crushed zone. The new model is called crushed zone expansion induced tensile failure model (CEIT model). The CEIT model will also count the sidewall effect to improve its accuracy in predicting the cutting force in rock cutting with a smaller ratio of the cutting width to cutting depth. First, a brief review of the existing models for rock cutting with a chisel pick is presented. Next, the mechanical model and mathematical formula of the CEIT model are developed based on the tensile fracture theory and cavity expansion theory. Then, the CEIT model is compared with the existing theoretical models and is verified by published experimental data. Finally, some discussions and conclusions are presented about the CEIT model.

2. A Brief Review of the Models for Rock Cutting with Chisel Picks

In this paper, we focus on predicting models for rock cutting with chisel picks under the brittle fracture regime. Since Evans [20] introduced the theory of plowing of coal by a sharp wedge into rock cutting, the theory for rock cutting with chisel picks has been developed by many researchers. Numerous models for estimating the cutting forces on a chisel pick have also been proposed, including the theoretical models [20,21,26], semi-empirical models [23,33], and regression models [32,62]. In this section, some of these models are presented and discussed.

2.1. Evans’ Tensile Breakage Model

Evans [20] assumed that the rock fails along a circular arc due to tensile fracture when a symmetrical chisel pick penetrates normally into the rock edge, as shown in Figure 2a. Then, the tensile force, T, on the tensile failure path is calculated as follows:
T = σ t w R c ψ ψ cos ψ d ψ = 2 σ t w R c sin ψ
where σ t is the tensile strength of the intact rock, w is the cutting width, Rc is the radius of the arcuate failure path, and ψ is the breakout angle. Evans also assumed that the size of the interaction zone between the chisel pick and rock is very small when the rock chip is raptured from the rock mass compared with the cutting depth, and there is a concentrated interaction force, S, between the rock chip and rock mass. Then, the relationship between P and T can be obtained by taking moments about point B, as shown in Figure 2a.
T = 2 P cos ( θ + ψ )
where P is the force acting on the rock chip by the chisel pick, as shown in Figure 2a. Considering the geometric relationship in Figure 2a, Rc can be expressed by the cutting depth (d) as: R c = 0.5 d / sin 2 ψ . Thus, the peak cutting force, Fc, can be calculated as follows:
F c = 2 P sin θ = σ t w d sin θ cos ( θ + ψ ) sin ψ
The value of ψ can be obtained with the minimum work hypothesis. In the mathematical expression, it is obtained by solving equation F c / ψ = 0 . Finally, the peak cutting force on the chisel pick penetrating normally into the rock is calculated as
F c = 2 σ t w d sin θ 1 - sin θ
If the friction between the chisel pick and rock is considered, Fc is calculated as
F c = 2 σ t w d sin ( θ + ϕ ) 1 - sin ( θ + ϕ )
where ϕ is the friction angle between the chisel pick and rock.
In practical applications, continuous rock cutting is more universal than rock indentation. For rock indentation, the clearance angle, β , should be positive, as shown in Figure 2b. In this situation, the cutting action is asymmetrical. Thus, another form of Equation (5) for rock indentation is used for predicting the peak cutting force in continuous rock cutting. The modified form is as follows [63]:
F c = 2 σ t w d sin [ ( π / 2 α ) / 2 + ϕ ] 1 - sin [ ( π / 2 α ) / 2 + ϕ ]
where α is the rake angle in rock cutting.

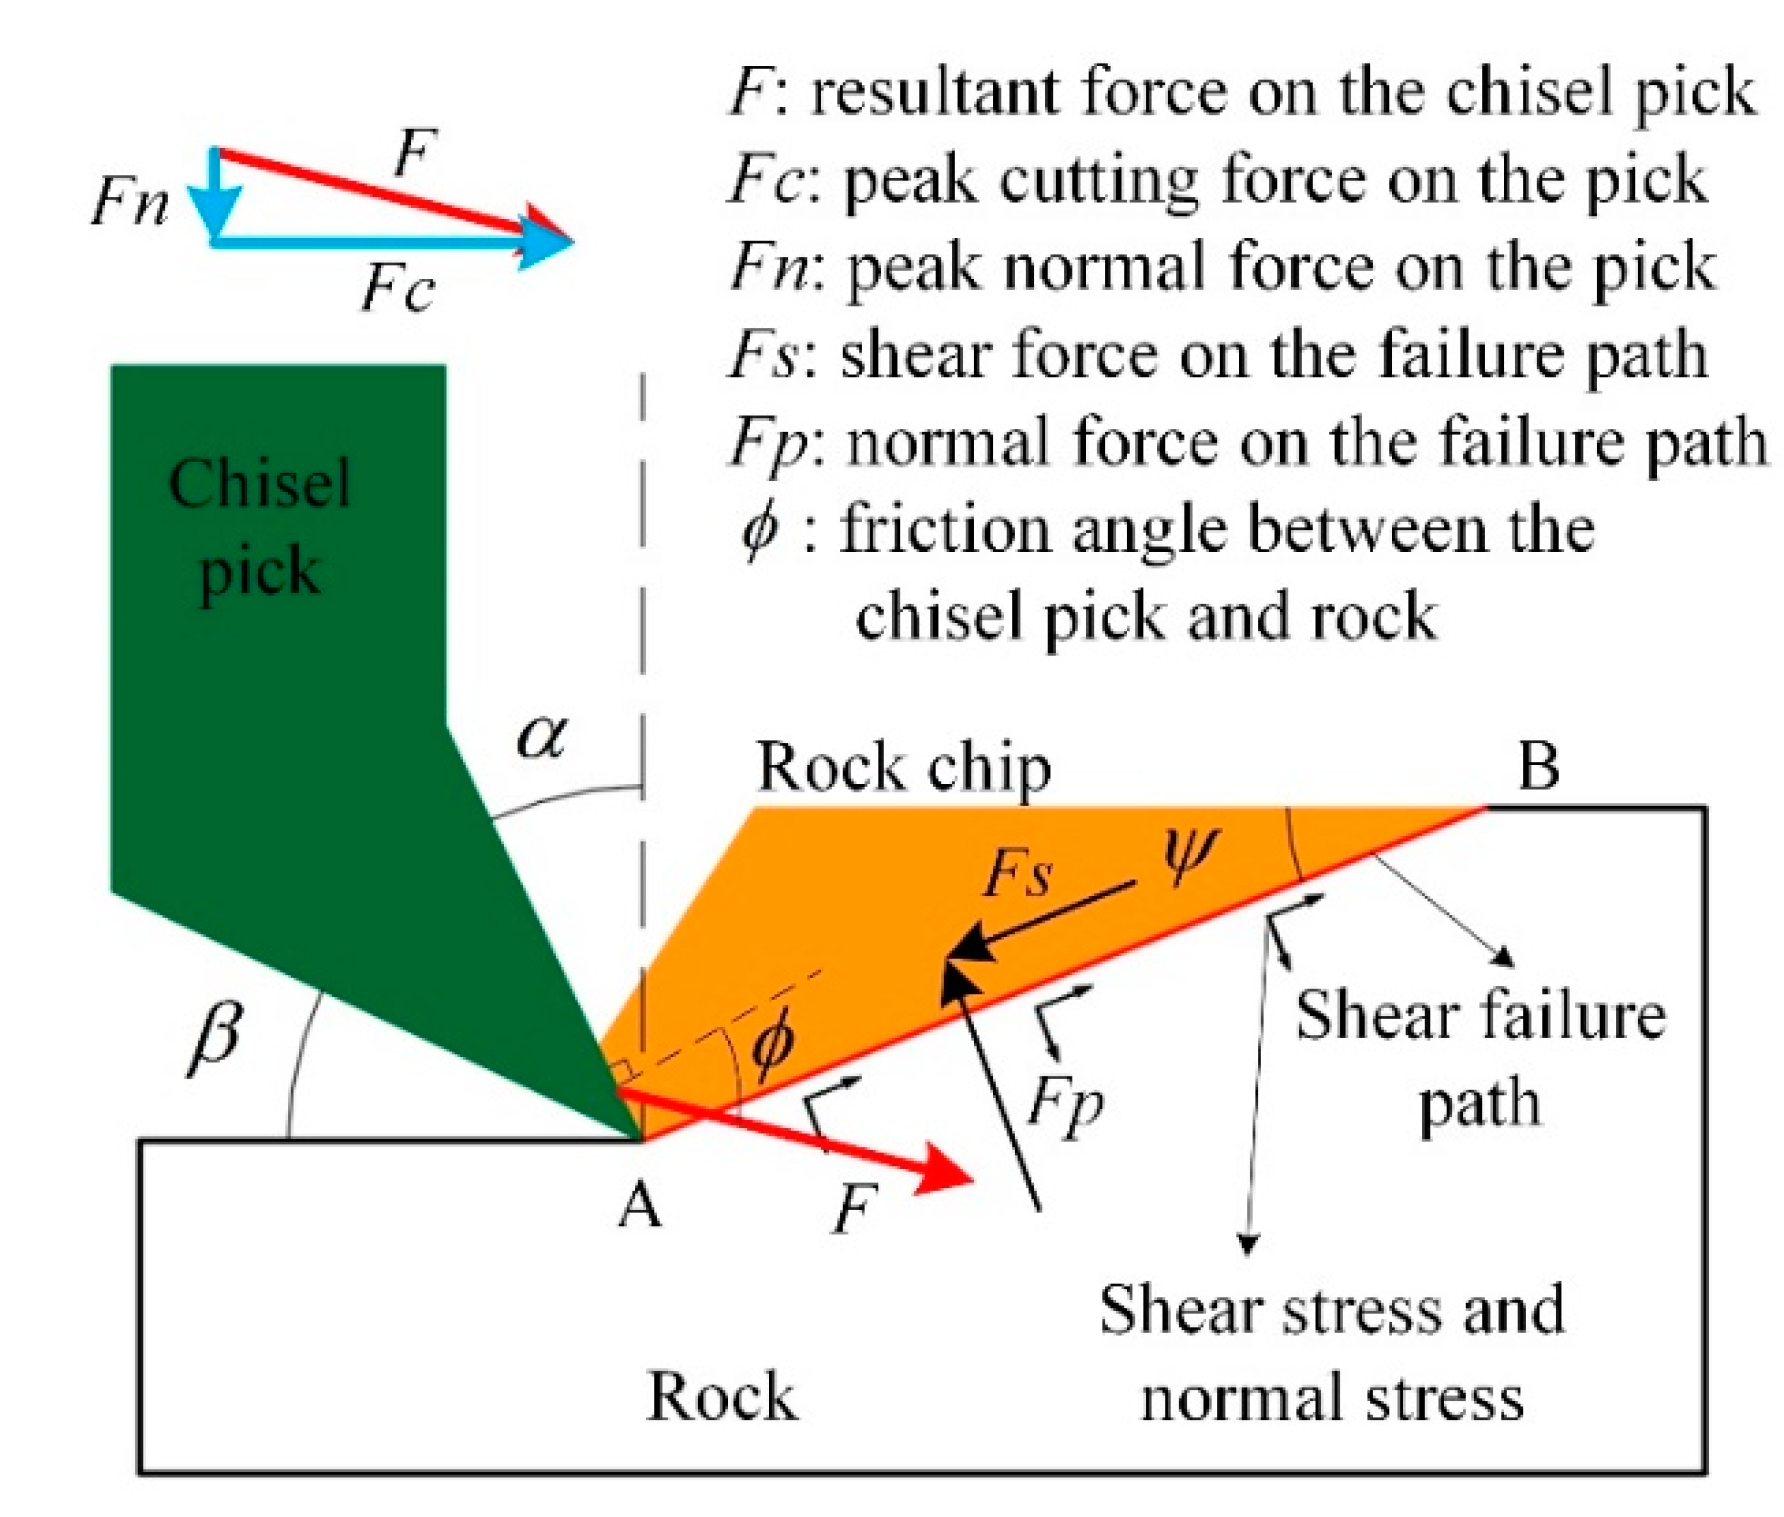
2.2. Nishimatsu’s Shear Breakage Model

Some researchers believe the rock fails due to shear breakage rather than tensile breakage in rock cutting. Based on the shear fracture theory, Nishimatsu [26] proposed a theoretical model for estimating the cutting force on the chisel pick. Nishimatsu assumed that the shear failure path during rock cutting is a straight line (or a plane), as shown in Figure 3, and that the shear stress ( τ ) and normal stress ( σ ) on the shear failure path distribute as follows:
τ = τ A ( 1 λ sin ψ d ) n   and   σ = σ A ( 1 λ sin ψ d ) n
where τ A and σ A are the shear stress and normal stress on the shear failure path near point A in Figure 3, λ is the distance between the calculated point and point A along the AB, n is the stress distribution factor. Then, the resultant shear force (Fs) and resultant normal force (Fp) acting on the rock chip by the rock mass can be obtained by integrating τ and σ from point A to B.
F s = w 0 d / sin ψ τ d λ = w d τ A ( n + 1 ) sin ψ
F p = w 0 d / sin ψ σ d λ = w d σ A ( n + 1 ) sin ψ
where w is the cutting width and d is the cutting depth in rock cutting.
On the other hand, the relationships of Fs and Fp to the resultant force on the chisel pick, F, can be obtained according to the forces equilibrium equations.
F s = F cos ( ϕ + ψ α )   and   F p = F sin ( ϕ + ψ α )
In addition, Nishimatsu assumed that rock failure takes place when the maximum stresses on line AB in Figure 3 satisfy the Mohr-Coulomb failure criterion.
τ = τ 0 + σ tan φ
where τ 0 is the shear strength of rock and φ is the internal friction angle. Combining Equations (9) to (11), and the minimum work hypothesis, the peak cutting force on the chisel pick, Fc, can be obtained.
F c = 2 τ 0 w d cos φ cos ( ϕ α ) ( n + 1 ) [ 1 sin ( ϕ α + φ ) ]
where n = 11.3 − 0.18 α and the unit of the rake angle α is degree.

2.3. Semi-Empirical Models

Both Evans’ model and Nishimatsu’s model are developed based on a single failure type, tensile failure or shear failure. Thus, the predicted peak cutting force is only affected by the tensile strength or shear strength of rock. However, Goktan [23] believed that the cutting force is affected by both the tensile strength and compressive strength of the rock. He developed a semi-empirical model based on the experimental results of the rock cutting tests of Bilgin [28].
F c = [ 0.80 0.01 ( σ c / σ t ) ] σ c w d sin ( π / 2 α ) + cos ( π / 2 α )
where σ c is the uniaxial compressive strength of the rock. This model is only valid for cutting rock with the value of σ c between 80 and 180 MPa, and the value of the rake angle α between −20 degrees to 10 degrees.
Ouyang [33] believed that the influence of the rock strength on rock cutting changes with increasing the rake angle. He claimed that the tensile strength plays a dominant role in the cutting force when the rake angle is very large and that the influence of the compressive strength on the cutting force will increase with decreasing the rake angle. A semi-empirical model was developed in [33] based on these hypotheses and the experimental results in [28].
F c = σ c ( 2.16 w d + 19.6 d 2 ) ( σ t / σ c ) g ( α , ϕ ) ( 2.50 / d ) 0.7
where g ( α , ϕ ) = 0.32 + 0.075 ln ( α ϕ + 1.05 ) . The unit of the cutting depth d is millimeter in Equation (14). Both Goktan’s model, Equation (13), and Ouyang’s model, Equation (14), can well predict the experimental results of rock cutting with a chisel pick in [28], as discussed in [33]. However, their validity for other rock cutting cases needs further verification.
Comparisons of the models mentioned above for estimating the peak cutting force in rock cutting with a chisel pick are listed in Table 1.
In conclusion, the theoretical models mentioned above were developed through two-dimensional analysis and ignored the sidewall effect. Thus, they usually underestimate the peak cutting force on the chisel pick in practical applications. The semi-empirical models are suitable only for quite limited cutting conditions and they are not suitable for rock cutting with the chisel pick of the CSD. In rock cutting with the CSD, the cutting depth is usually larger than 10 mm, and the rake angle is larger than 20 degrees, and the uniaxial compressive strength of excavating rock is usually less than 80 MPa. Therefore, it is of great value to develop a model to predict properly the cutting force on the chisel pick of the CSD.

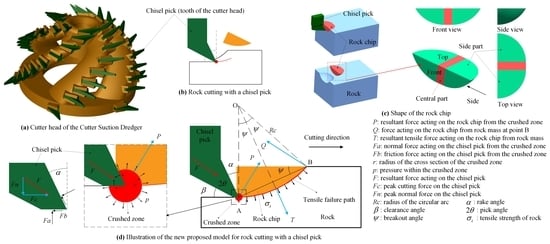
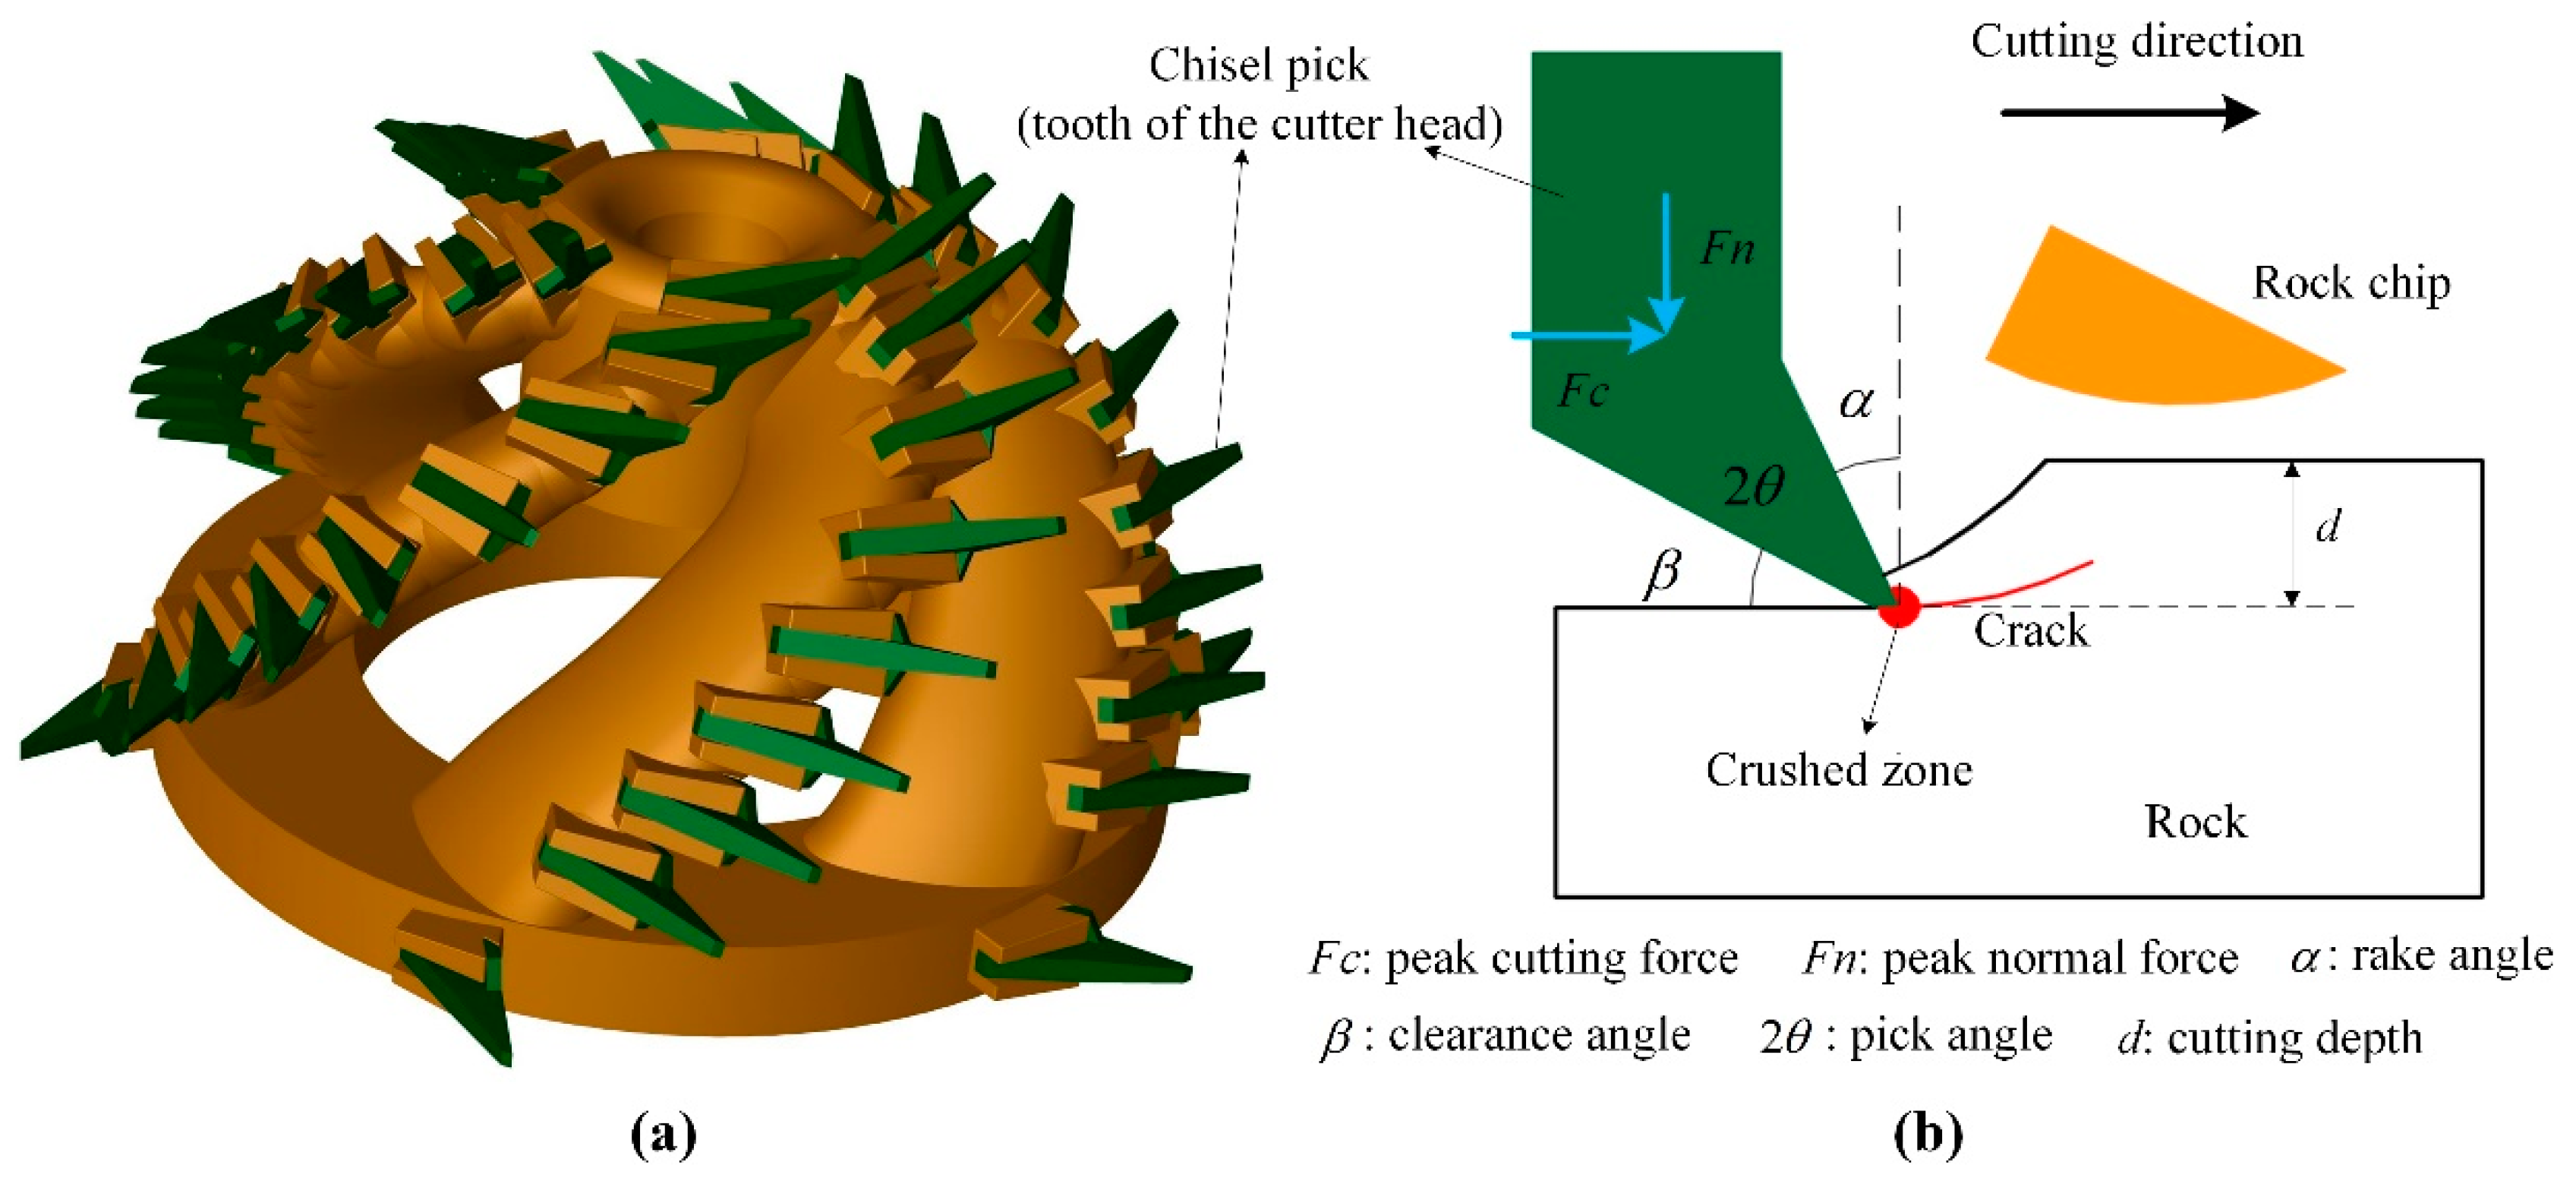
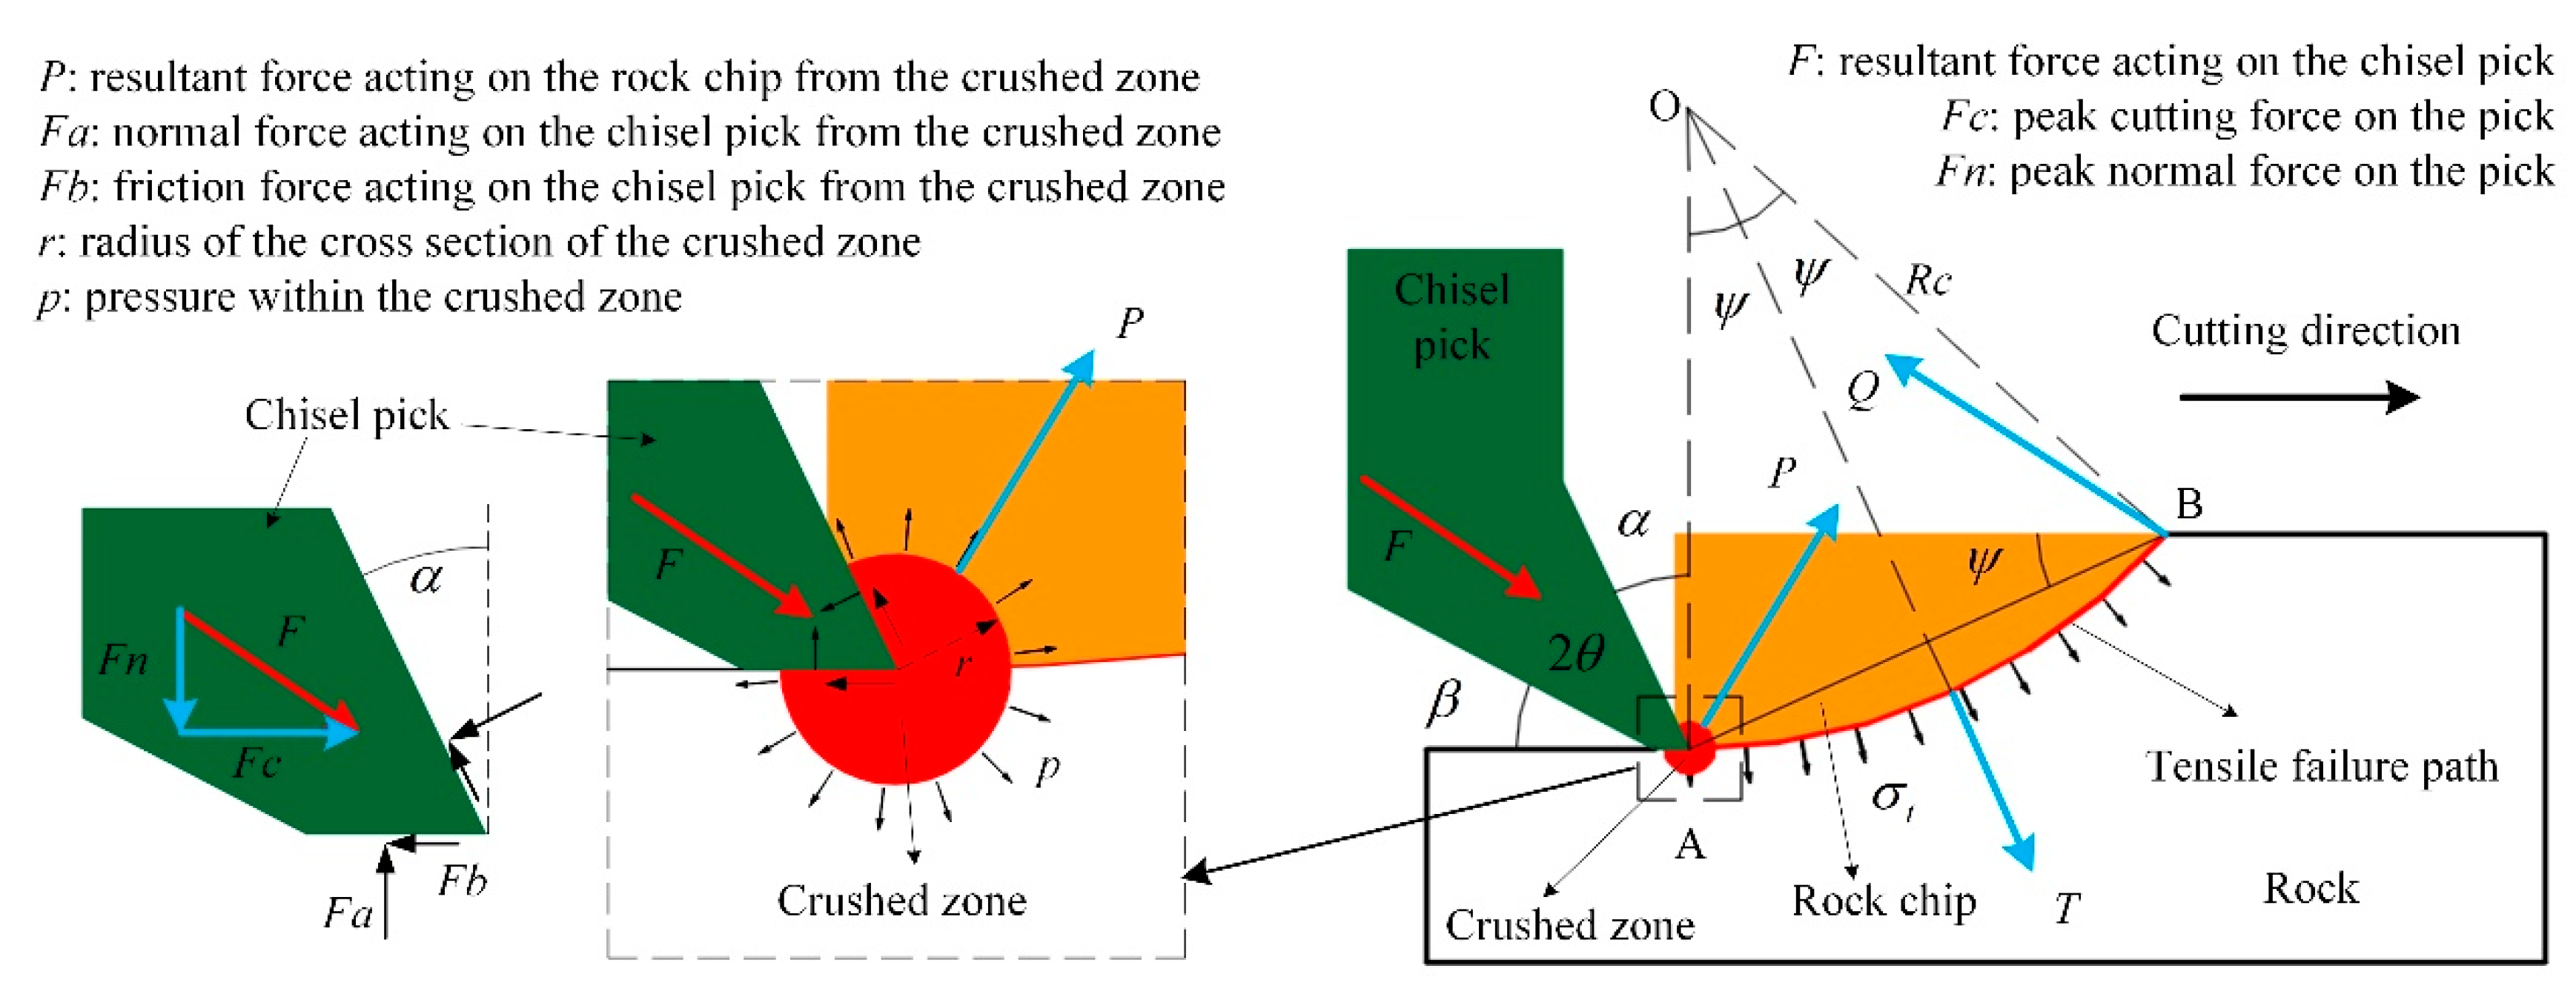
3. Establishment of the CEIT Model

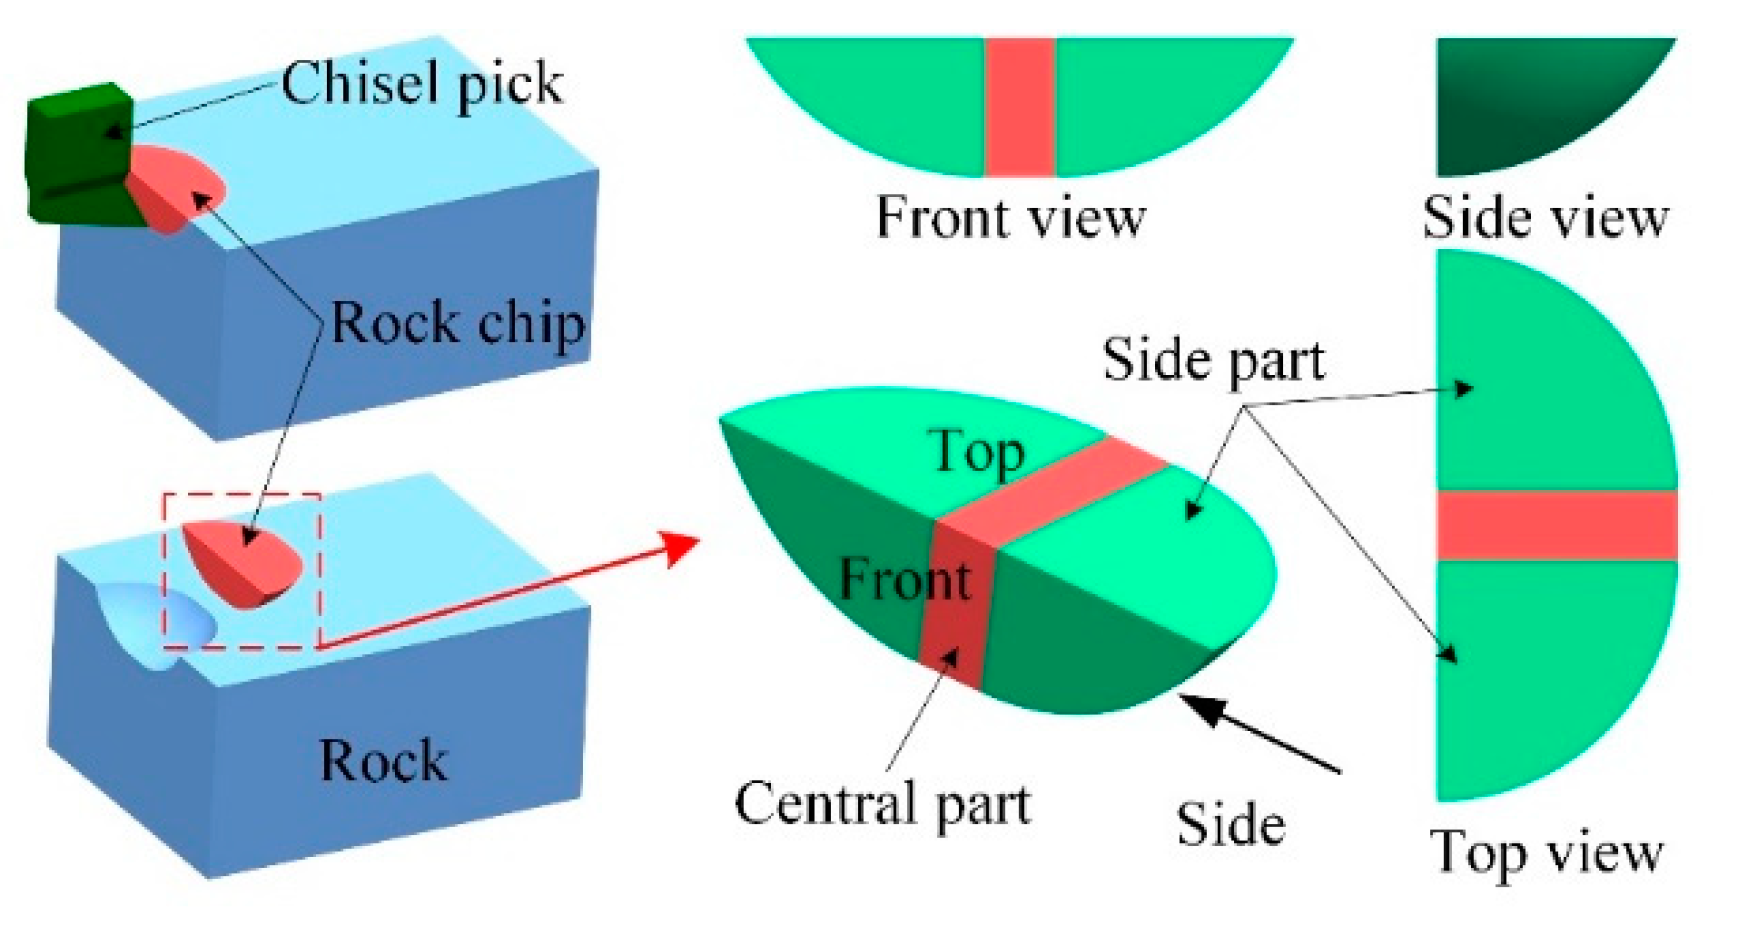
3.1. Conception of the CEIT Model

Many studies show that the contact zone between the pick and rock is very small, compared with the size of the rock chip produced, in rock cutting under the brittle fracture regime [20,22,58,61]. It is widely accepted that the small contact zone will lead to plastic failure of rock near the tip of the pick and form a crushed zone. The pressure within the crushed zone increases as the pick cuts forward and causes the initiation of the cracks on the boundary of the crushed zone similar to that in cavity expansion theory [52,53,54,55,56,57]. Thus, we propose an analytical model based on Evans’ tensile breakage model.
As illustrated in Figure 4, we first make the following assumptions, similar to those in Evans’ model. (1) The rock chip fails along a circular arc on the vertical symmetrical plane of the chisel pick due to tensile fracture. (2) The tensile failure path has a horizontal tangent at point A. (3) The rock chip is in the moment equilibrium condition about point B at the time when it is cut from the rock mass. In addition, a few assumptions are made in our CEIT model, listed as follows: (a) a crushed zone appears near the tip of the chisel pick and its size increases gradually as the chisel pick penetrates into the rock and reaches a maximum value when a rock chip fails. (b) The crushed zone has a fanlike cross-section with a radius of r, which is very small compared with the cutting depth and the cutting width (or the width of the chisel pick), and a center on the tip of the chisel pick. (c) The cutting action of the chisel pick is transmitted to the rock chip by the crushed zone where the rock material is fully crushed and the pressure is uniform. (d) The rock chip is torn off the rock mass by the resultant force acting on it from the crushed zone. (e) The rock chip formed in the first indentation cycle is composed of three parts, as shown in Figure 5. The central part is part of a cylinder and the two side parts are a part of a ball. (f) The chisel pick has a wear flat that is very small compared with the cutting depth but larger than the radius of the cross-section of the crushed zone, as shown in Figure 4. (g) The resultant force on the chisel pick, F, is the sum of the normal force, Fa and friction force Fb generated by the crushed zone, as shown in Figure 4, where F b = F a tan ϕ , and ϕ is the friction angle between the chisel pick and rock.
The CEIT model is different from Evans’ tensile fracture model in the following two aspects: the CEIT model considers the sidewall effect and is a model for three-dimensional rock cutting, the force acting on the chisel pick is from a crushed zone rather than directly from the rock chip. The rock chip in the CEIT has a more complex shape, which makes it more difficult to obtain an analytical solution to the cutting force. In addition, the chisel pick has a wear flat in the CEIT model. This is actually closer to reality because the severe wear of the tip will produce a wear flat on the chisel pick even though the original chisel pick is ideally sharp.

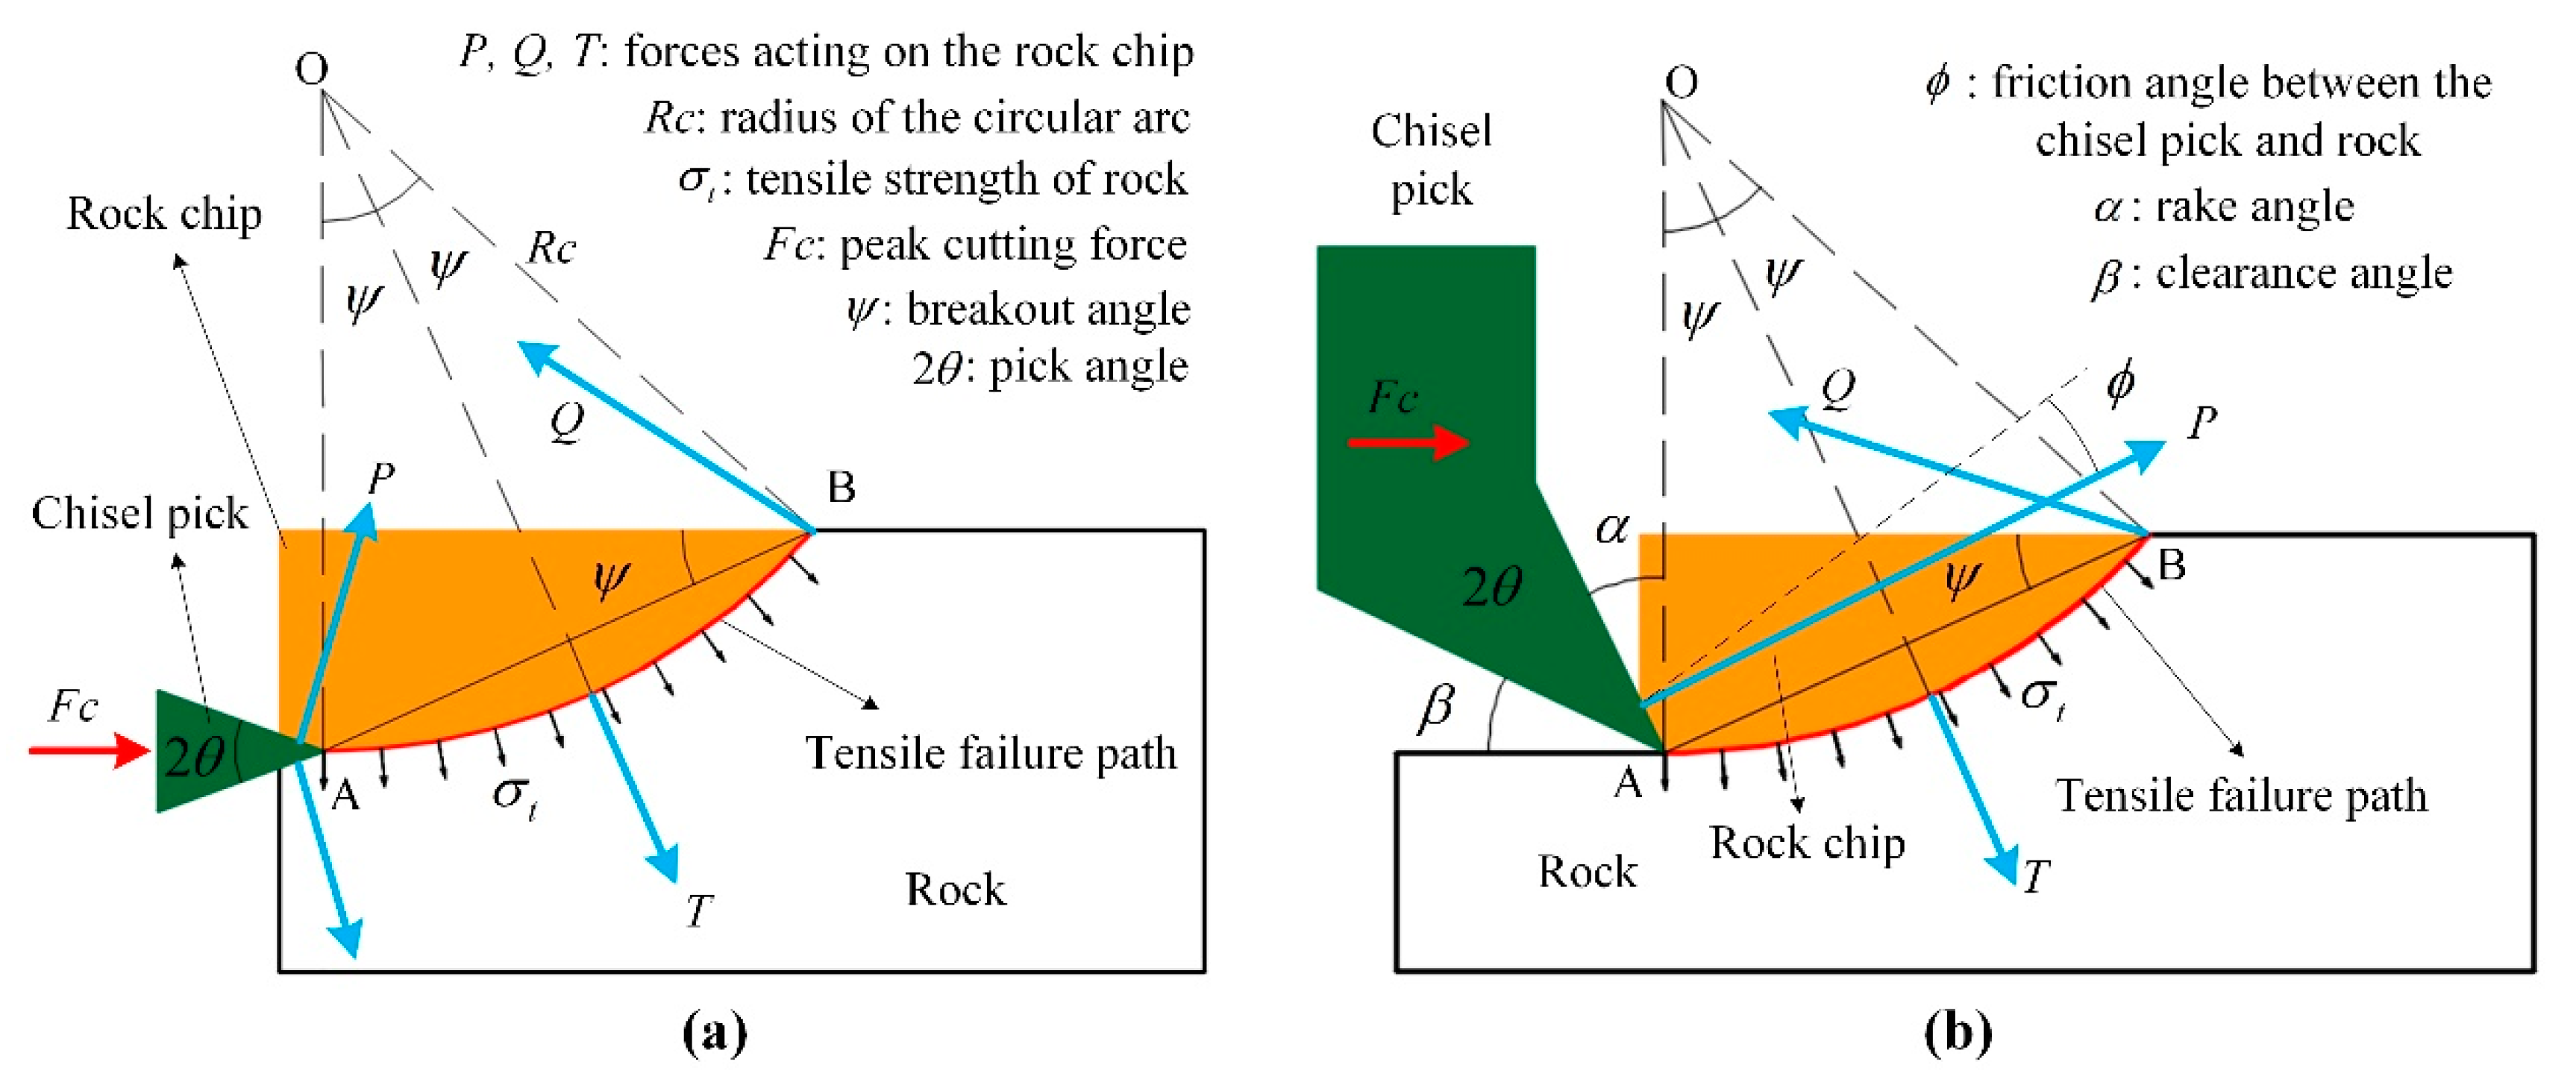
3.2. Mechanical Model and Mathematical Formula of the CEIT Model

The indentation force on an indenter is obtained by integrating the pressure acting on the contact surface between the cavity and the indenter [53,54]. This method is adopted to calculate the resultant force, F, acting on the chisel pick from the crushed zone. In addition, the friction between the chisel pick and rock particles in the crushed zone is considered. This friction will hinder the chisel pick from cutting forward. Thus, in the CEIT model, both the normal force, Fa, and friction force, Fb, will act on the chisel pick from the crushed zone, as shown in Figure 4. The radius of the cross-section of the crushed zone is very small compared with the cutting depth and cutting width. Thus, both ends of the crushed zone have negligible effects on the chisel pick compared with the middle part. Therefore, Fa and Fb can be estimated as:
F a = p w r   and   F b = p w r tan ϕ
where p is the pressure in the crushed zone, w is the cutting width (or the width of the chisel pick), r is the radius of the crushed zone, ϕ is the friction angle between the chisel pick and rock. The peak cutting force, Fc, and the peak normal force, Fn, on the chisel pick, can be estimated as follows:
F c = F b + F a cos α + sgn ( α ) F b sin α = p w r [ cos α + tan ϕ + sgn ( α ) sin α tan ϕ ]
F n = F a F a sin α + sgn ( α ) F b cos α = p w r [ 1 sin α + sgn ( α ) cos α tan ϕ ]
where α is the rake angle, and sgn is the signum function, which is introduced here to change the direction of the friction force along the front face of the chisel pick.
In Equations (16) and (17), p and r need to be determined. Essentially, we only need to know the product of p and r. The value of pr can be obtained by analyzing the fracture of the rock chip. As presented in Figure 4, the resultant force, P, acting on the rock chip from the crushed zone is:
P = 2 p w r sin [ ( π / 2 + α ) / 2 ]
As mentioned above, we assume that at the time when the rock chip fails, the moment generated by all forces acting on the rock chip about axis B is equilibrium, similar to that described in Evans’ model [20]. Axis B is defined as the axis through point B in Figure 4 and perpendicular to the side view of the rock chip in Figure 5. Based on the assumption that the tensile failure path has a horizontal tangent at point A in Figure 4, the radius of the circular arc, Rc, can be expressed as
R c = d 2 sin 2 ψ
where d is the cutting depth and ψ is the breakout angle. Therefore, the moment about axis B generated by P, M 1 is calculated as follows:
M 1 = 2 p w r d sin [ ( π / 2 + α ) / 2 ] sin [ ( π / 2 + α ) / 2 ψ ] sin ψ
In addition, based on the assumption that the rock chip fails due to tensile fracture and only normal stress with a magnitude equal to the tensile strength of rock σ t acts on the fracture surface, the moment about axis B generated by the force T acting on the rock chip from the rock mass, M 2 can be calculated as follows:
M 2 = σ t S n × r b d S
where S is the fracture surface of a rock chip, n is a unit normal vector of the fracture surface at the calculated point, r is the vector pointing to the calculated point from point B, and b is a unit vector of axis B. Based on the simplified shape of the rock chip, M 2 can be obtained
M 2 = σ t w d 2 2 sin 2 ψ [ 1 + f ( ψ ) × d w ]
where f ( ψ ) = [ sin ( 4 ψ ) cos ( 2 ψ ) 4 ψ cos ( 2 ψ ) + π sin 3 ( 2 ψ ) ] / ( 8 sin 4 ψ ) . As the rock chip is in moment equilibrium at the time it starts to fail, taking moment about point B, we can get
M 1 = M 2
where the effect of gravity is ignored because it is very small.
Combining Equations (16), (17), (20), (22), and (23), the analytical solutions of Fc and Fn on the chisel pick are obtained.
F c = σ t w d [ cos α + tan ϕ + sgn ( α ) sin α tan ϕ ] 4 sin ψ sin [ ( π / 2 + α ) / 2 ] sin [ ( π / 2 + α ) / 2 ψ ] [ 1 + f ( ψ ) × d w ]
F n = σ t w d [ 1 sin α + sgn ( α ) cos α tan ϕ ] 4 sin ψ sin [ ( π / 2 + α ) / 2 ] sin [ ( π / 2 + α ) / 2 ψ ] [ 1 + f ( ψ ) × d w ]
The value of ψ can be obtained with the minimum work hypothesis, similar to that in [20,26], i.e., the value of ψ is obtained by solving the equation
F c ψ = 0

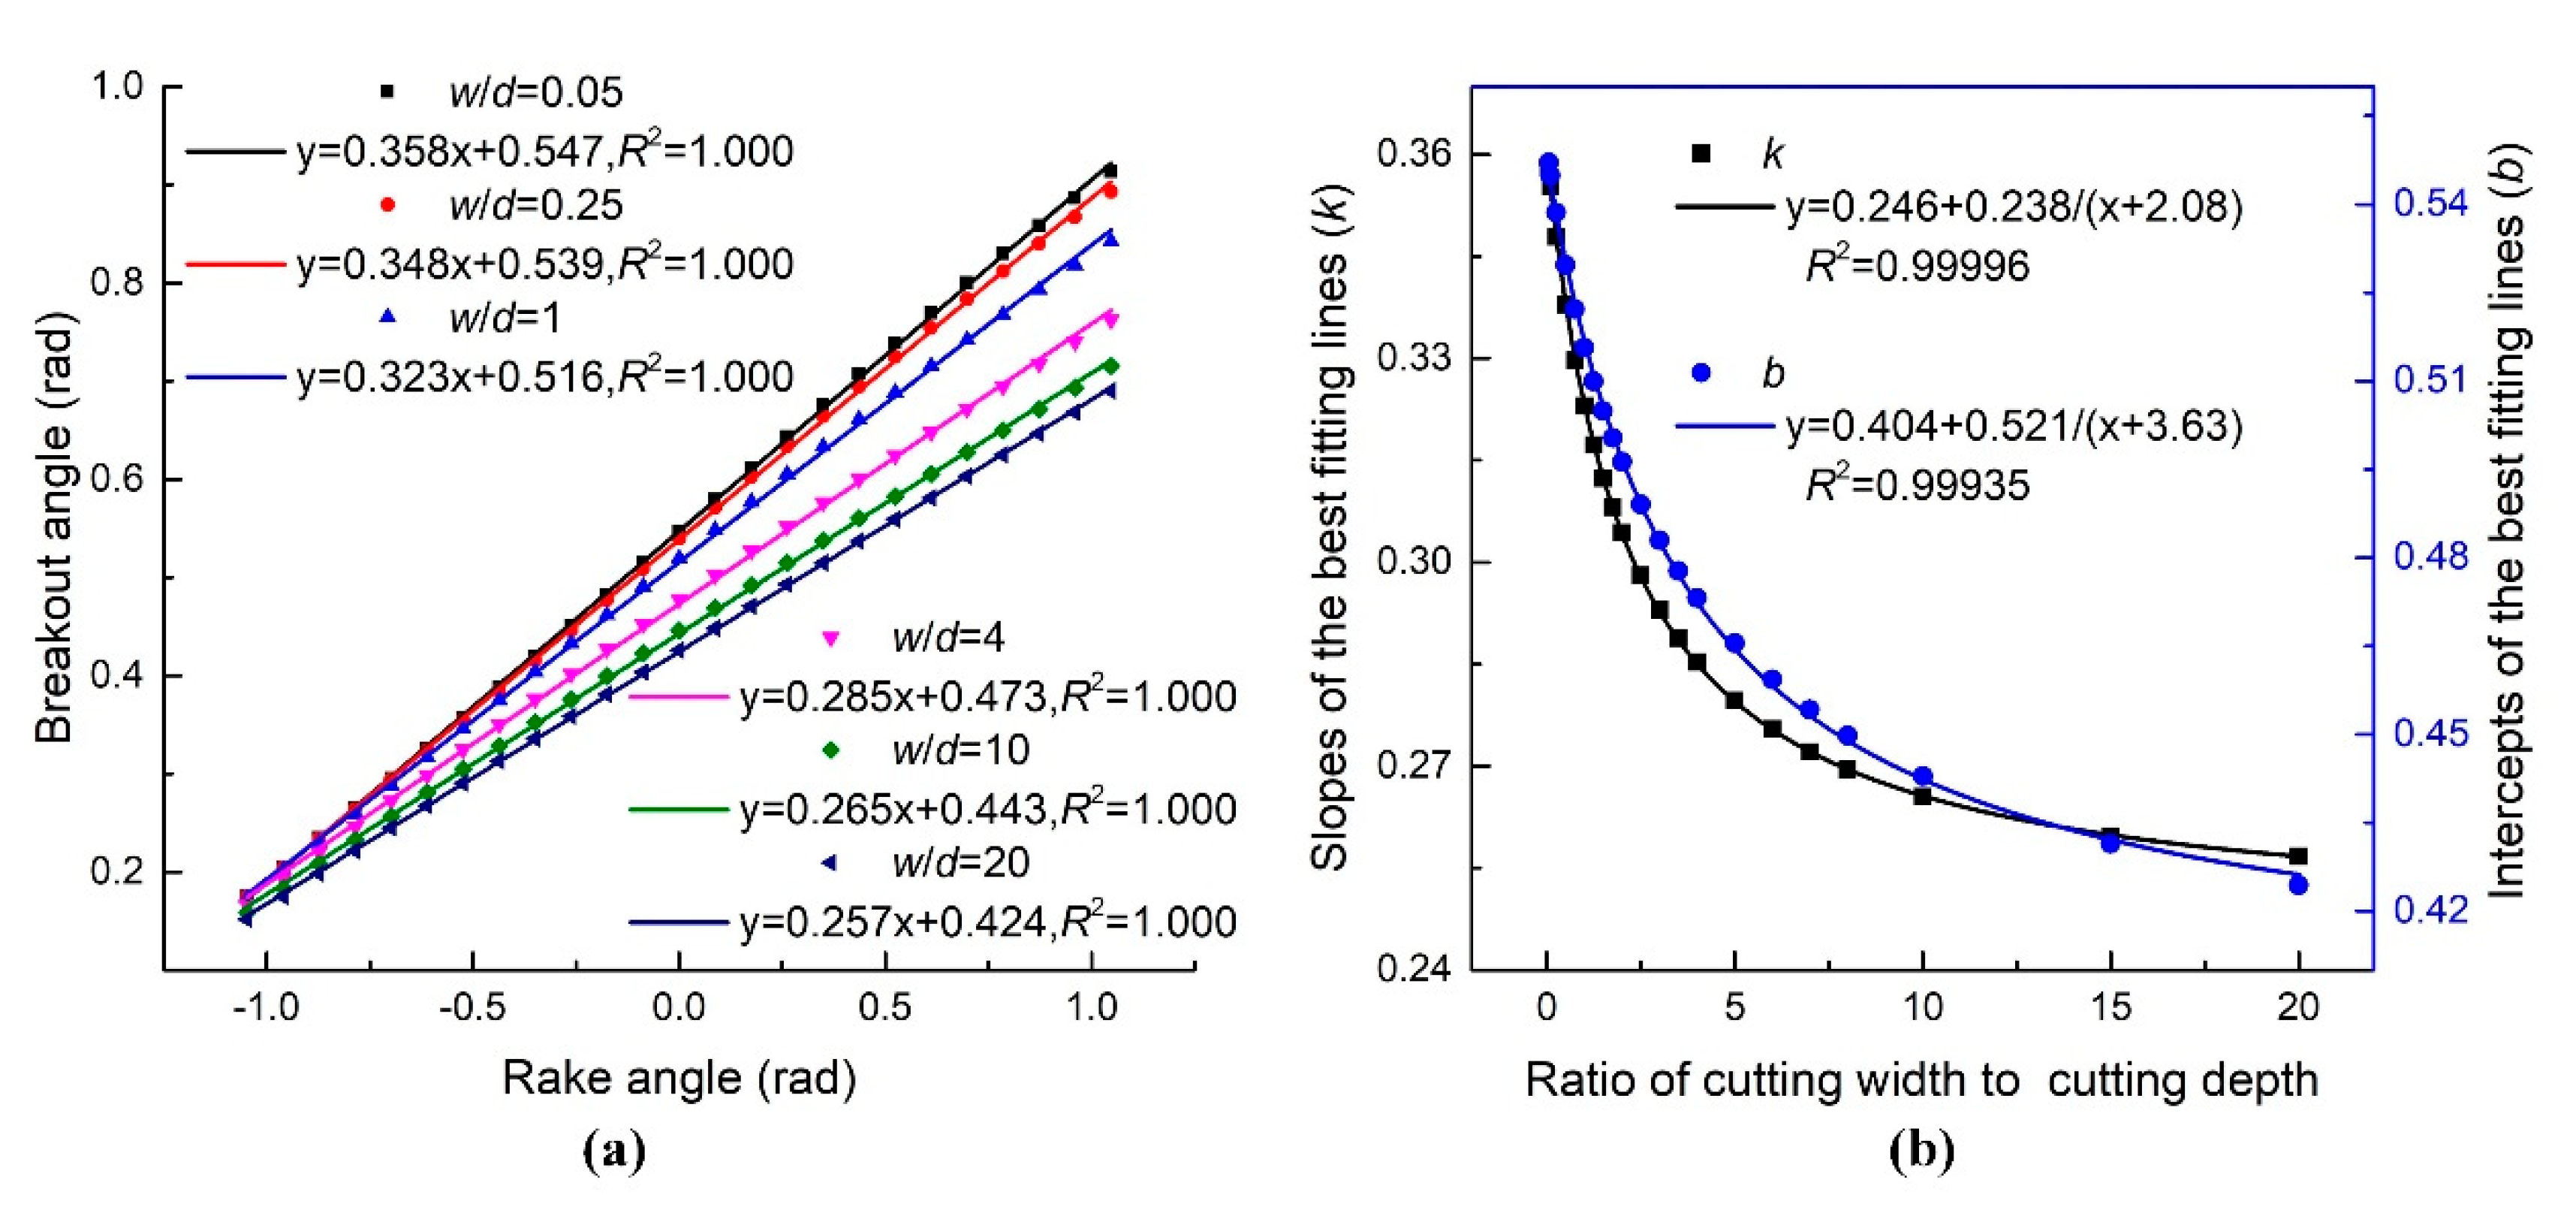
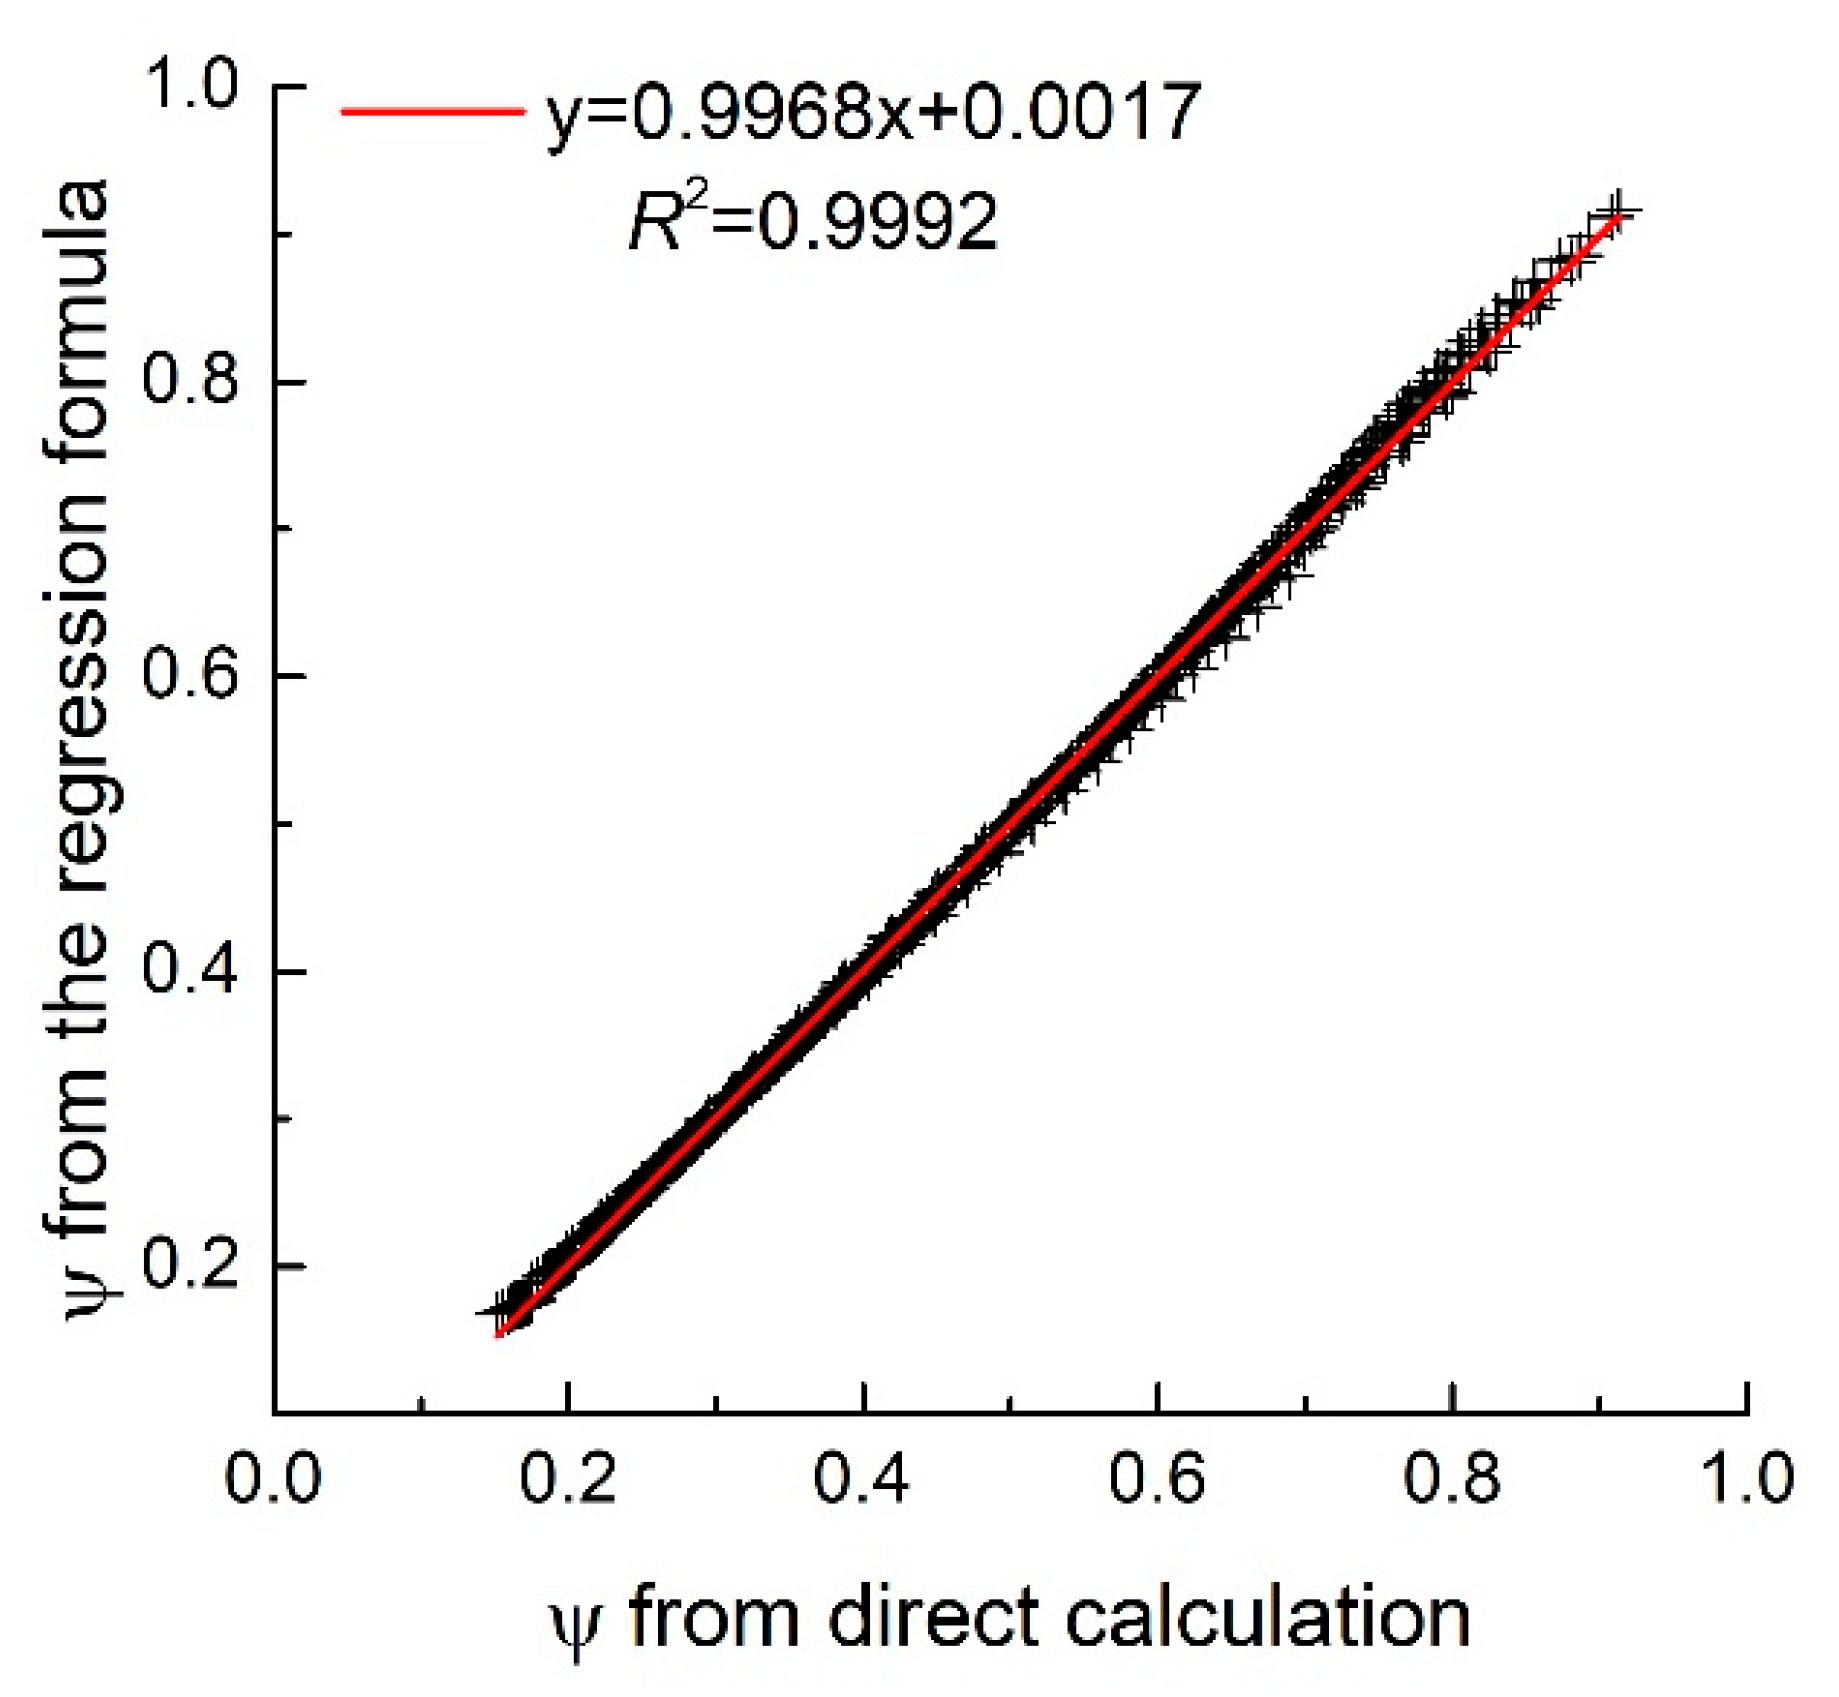
3.3. An Approximate Value of the Breakout Angle in the CEIT Model

When the ratio of the cutting width to the cutting depth w/d tends to infinity (d/w tends to zero), Equation (26) can easily be solved, and the breakout angle ψ can be obtained by ψ = ( π / 2 + α ) / 4 . Otherwise, it is difficult, even impossible, to find an analytical solution to the breakout angle due to the complexity of the expression of the peak cutting force Fc, Equation (24), and the peak normal force Fn, Equation (25). In this situation, an approximate solution to ψ is required to facilitate the application of the CEIT model. It is easy to figure out from Equations (24) and (26) that the value of ψ is only affected by the value of the rake angle α and the ratio of the cutting width to the cutting depth (w/d). By solving Equation (26) at a series of values of w/d and α , a series of numerical solutions of ψ are obtained. The relationship between ψ and α at different values of w/d is presented in Figure 6a, where R2 is the adjusted coefficient of determination.
The results, presented in Figure 6a, indicate that there is a strong linear relationship between the breakout angle and the rake angle when w/d is a constant value between 0.05 and 20. The slopes (k) and intercepts (b) of the best fitting lines in Figure 6a between ψ and α depend only on the values of w/d. The relationships of k and b to w/d may be approximated by hyperbolas, as presented in Figure 6b. Hence, an approximate value of ψ can be obtained by using a regression formula as follows:
ψ = ( 0.246 + 0.238 w / d + 2.08 ) α + ( 0.404 + 0.521 w / d + 3.63 )
where the unit of ψ and α is radian. The relationship between the values of ψ is obtained by directly solving Equation (26) and those calculated by the regression formula, Equation (27), are shown in Figure 7, where α is between −1 rad and 1 rad, and w/d is between 0.05 and 20. The results in Figure 7 indicate that the values of ψ calculated by Equation (27) agree well with that obtained by solving Equation (26). In addition, the ranges of α and w/d used during the above analysis are large enough for practical applications. When the value of w/d tends to infinity, Equation (27) tends to ψ = 0.246 α + 0.404 , which is very close to the analytical solution of Equation (26), ψ = ( π / 2 + α ) / 4 . Thus, Equation (27) can be regarded as an approximate solution to Equation (26), and used for estimating the value of the breakout angle ψ in practical applications.
Substituting the value of the breakout angle estimated by Equation (27) into Equations (24) and (25), the peak cutting force and the peak normal force in rock cutting with a chisel pick can be obtained. The values of cutting width w, cutting depth d, rake angle α , tensile strength of rock σ t and friction angle between the chisel pick and rock ϕ are required for predicting the peak cutting forces in the CEIT model, similar to that in Evans’ model.

4. Validation of the CEIT Model

As the CEIT model is established for rock cutting under the brittle fracture regime, very few experimental results are available and suitable for validating the CEIT model, even though numerous rock cutting experiments have been performed in the past few decades. In this paper, the rock cutting experiments performed in unrelieved conditions by Bilgin [28] and Allington [27] with chisel picks are used for validation. In addition, the CEIT model is compared with the existing theoretical models, including Evans’ tensile breakage model and Nishimatsu’s shear breakage model, to examine its performance in predicting the peak cutting forces on the chisel pick. Evans’ model, Equation (6), Nishimatsu’s model, Equation (12), the CEIT model, and Equations (24) and (27), are used for calculating the peak cutting force. As the CEIT model is an analytical model, the semi-empirical models and regression models, proposed based on a certain set of rock cutting experiments, are not used for comparison in this paper. The mechanical properties of the rock samples are presented in Table 2. The contact area between the chisel pick and rock has been assumed to be quite small in the CEIT model. Therefore, the friction angle between the tungsten carbide and rock, ϕ c , is used as ϕ in the CEIT model. While, in Nishimatsu’s model, the friction angle between the hardened steel and rock, ϕ s , is used as ϕ because the contact area between the chisel pick and rock is larger. Since the friction angle between the chisel pick and rock samples were not tested in [27], the corresponding friction angle in [28] with the same rock type is used in the calculation, as presented in Table 2.

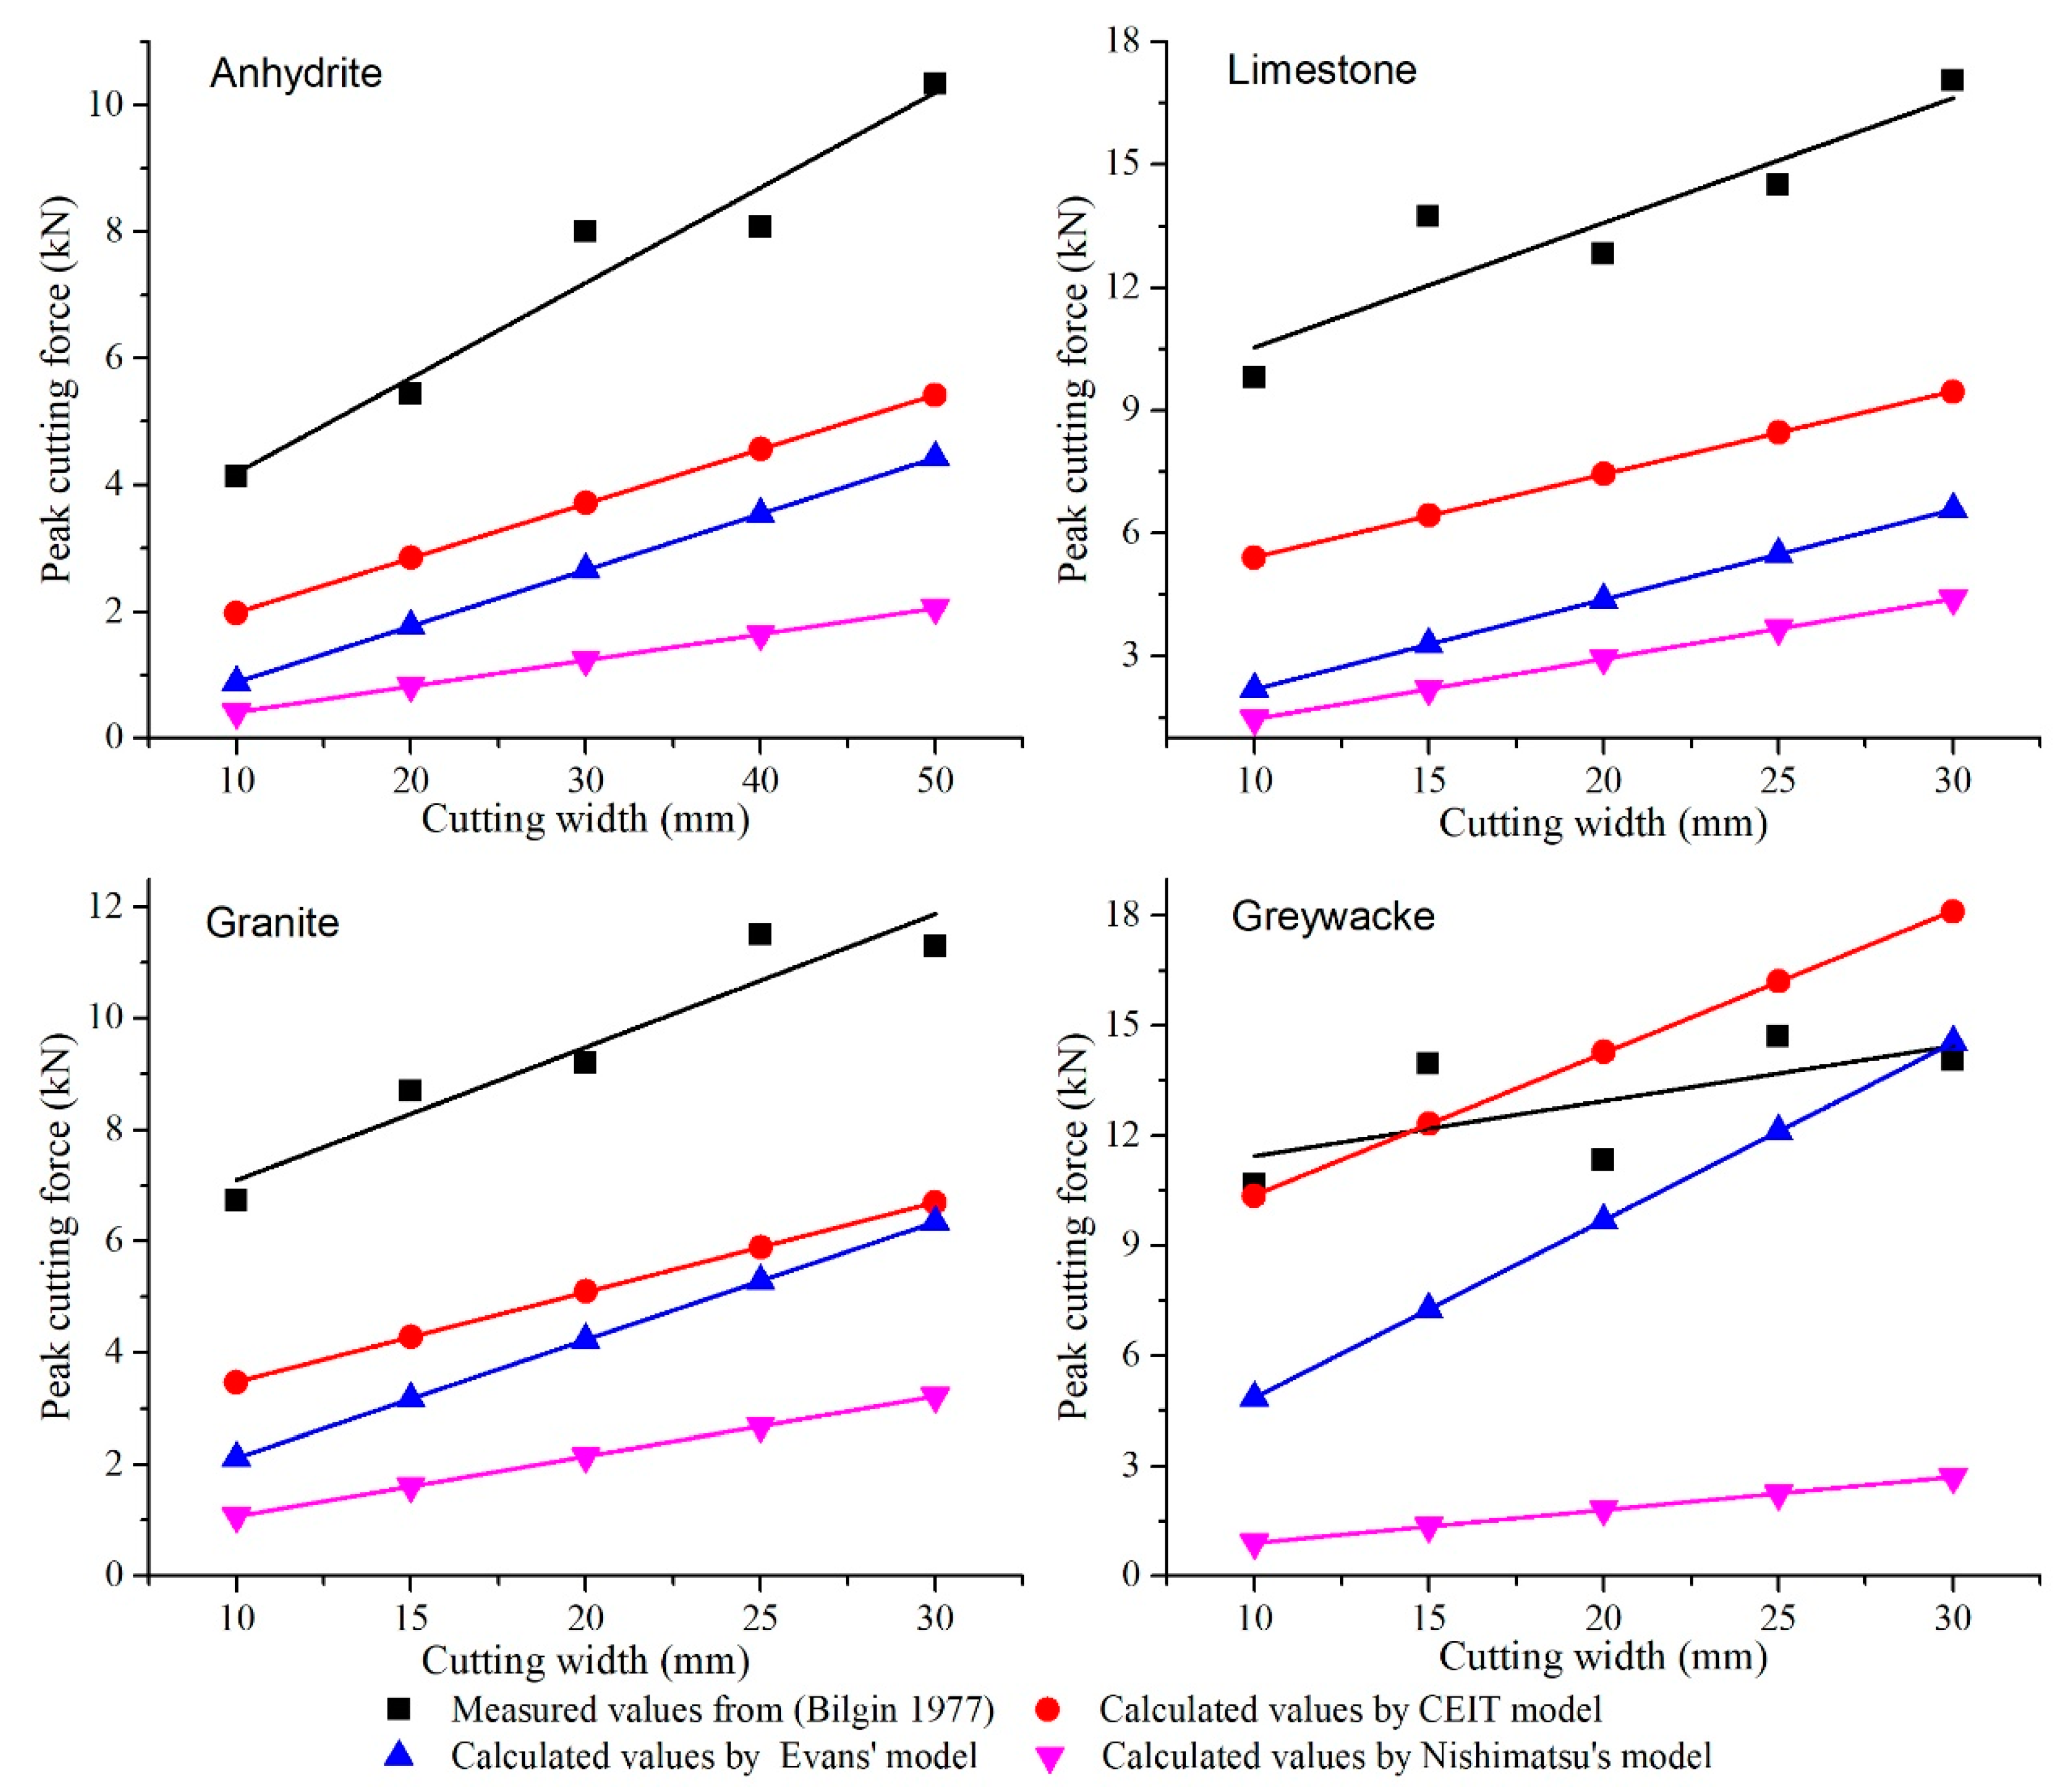
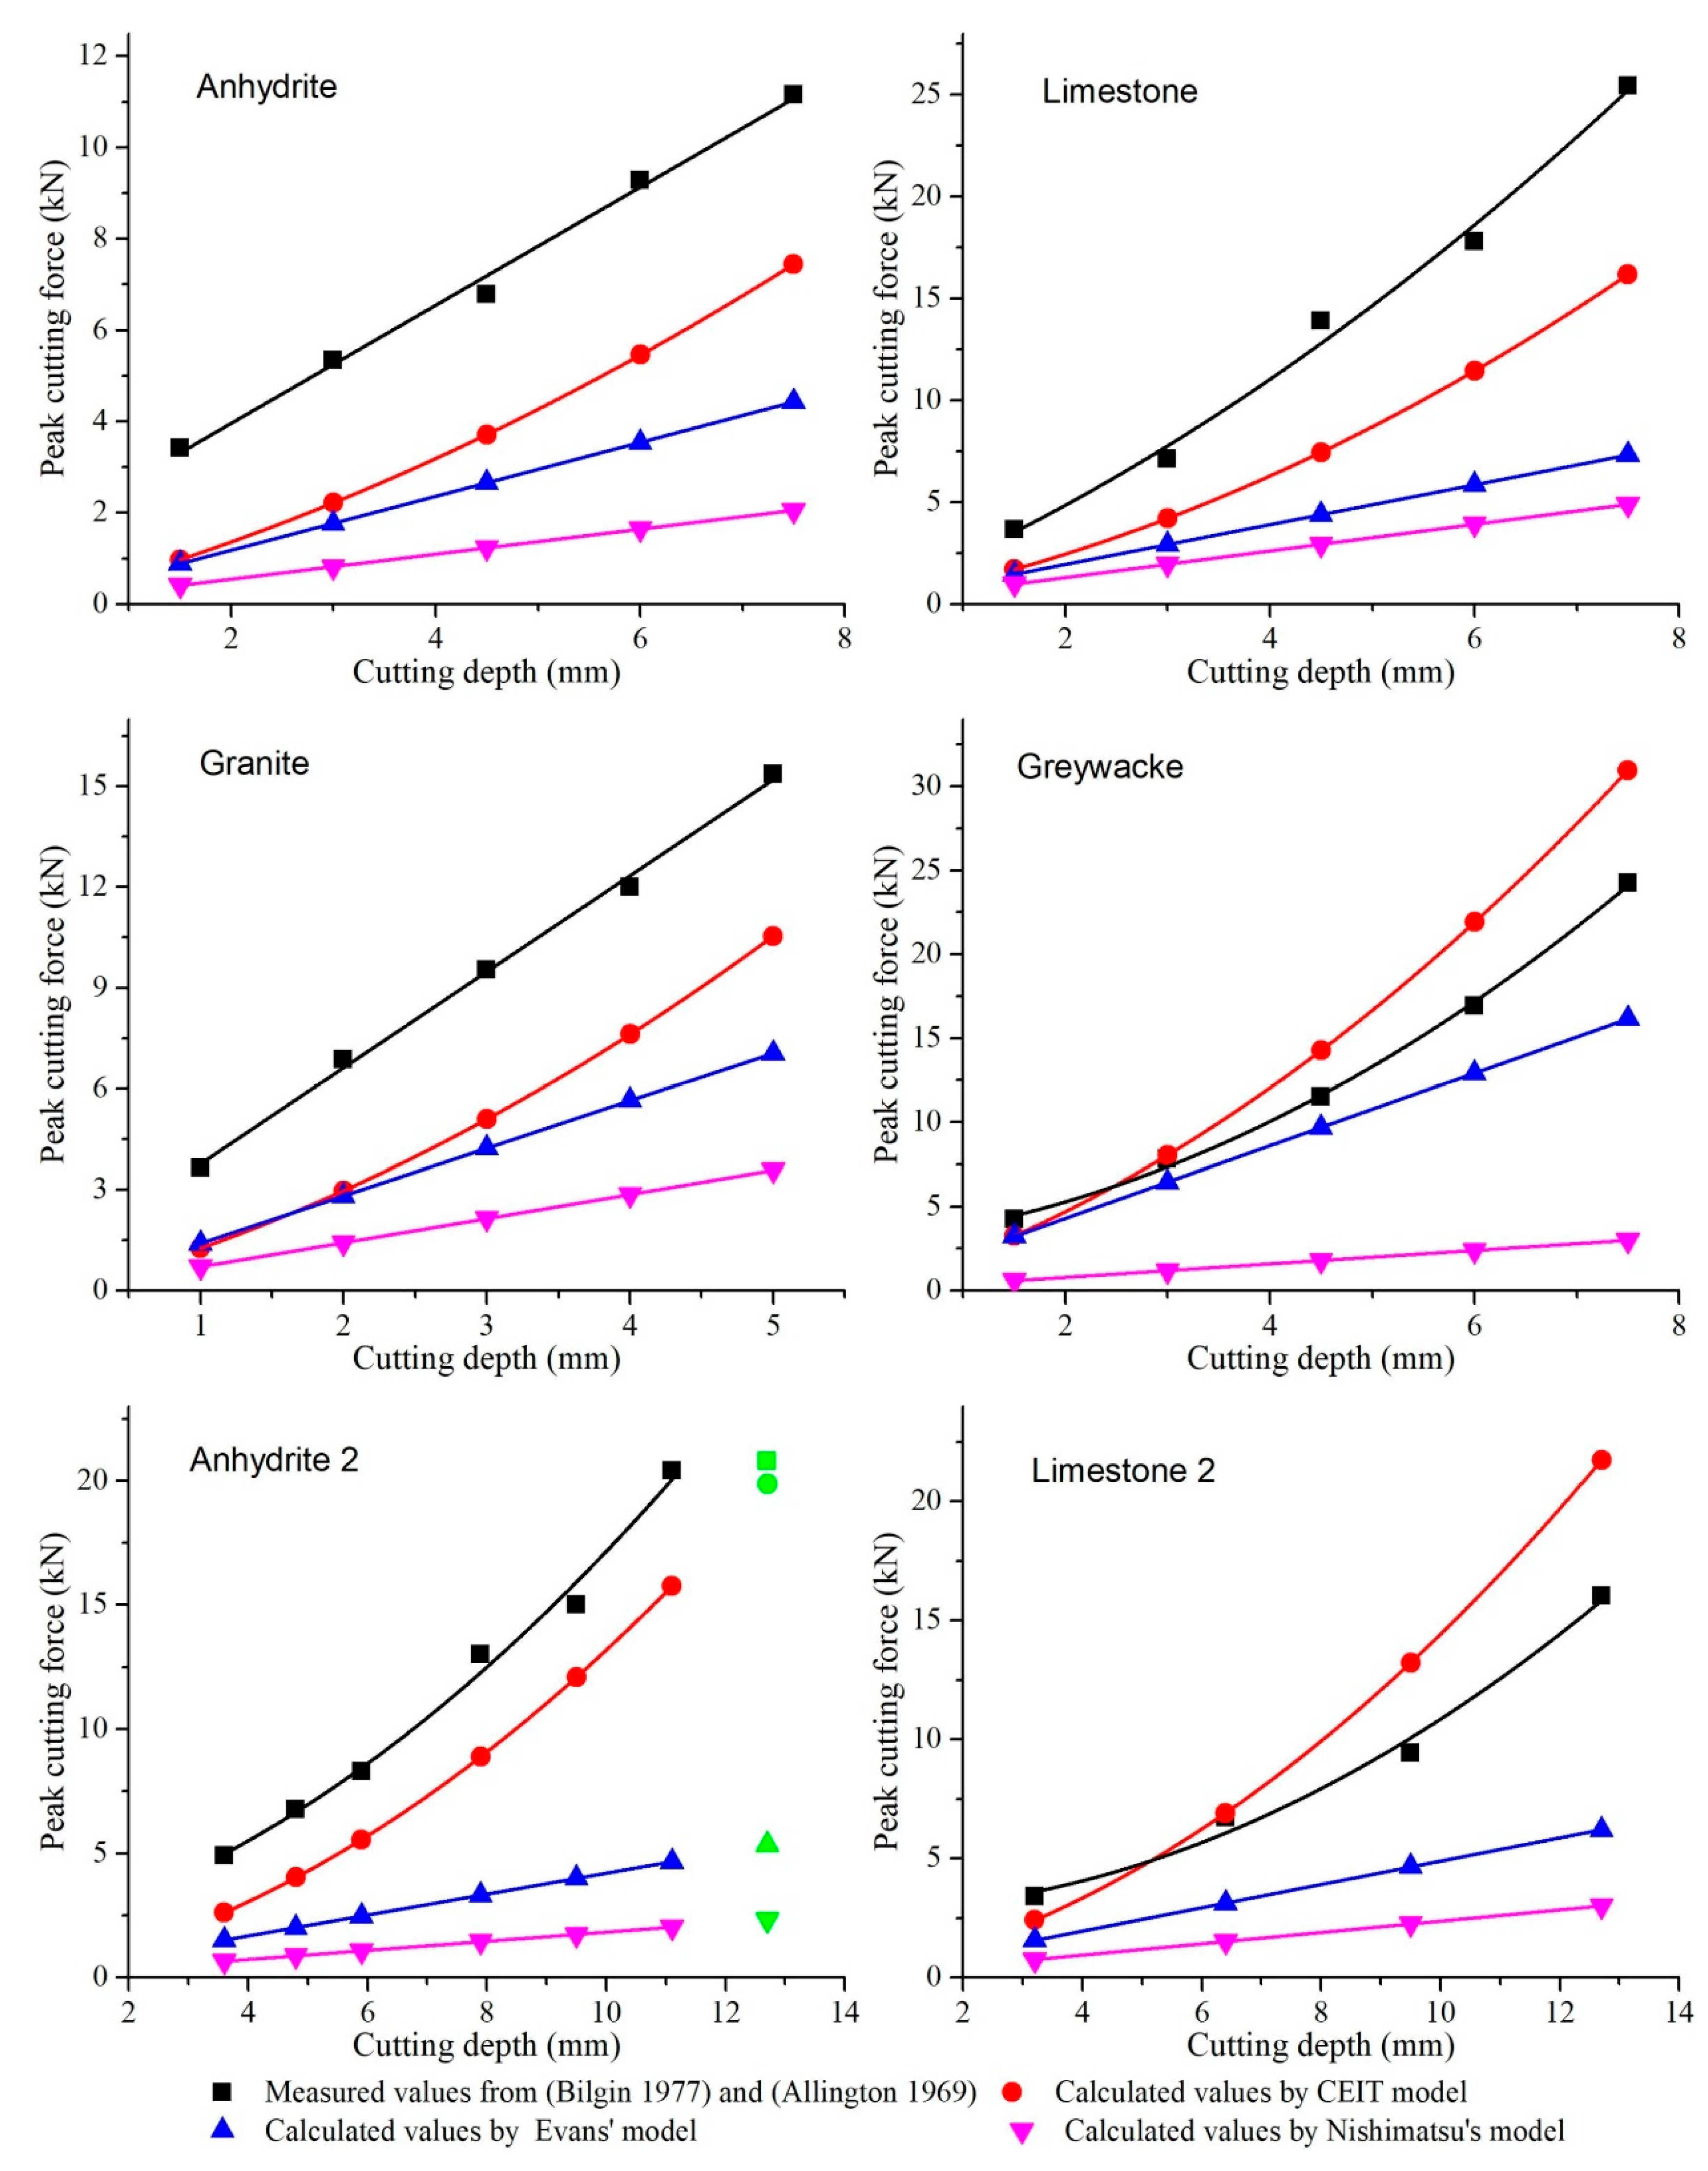
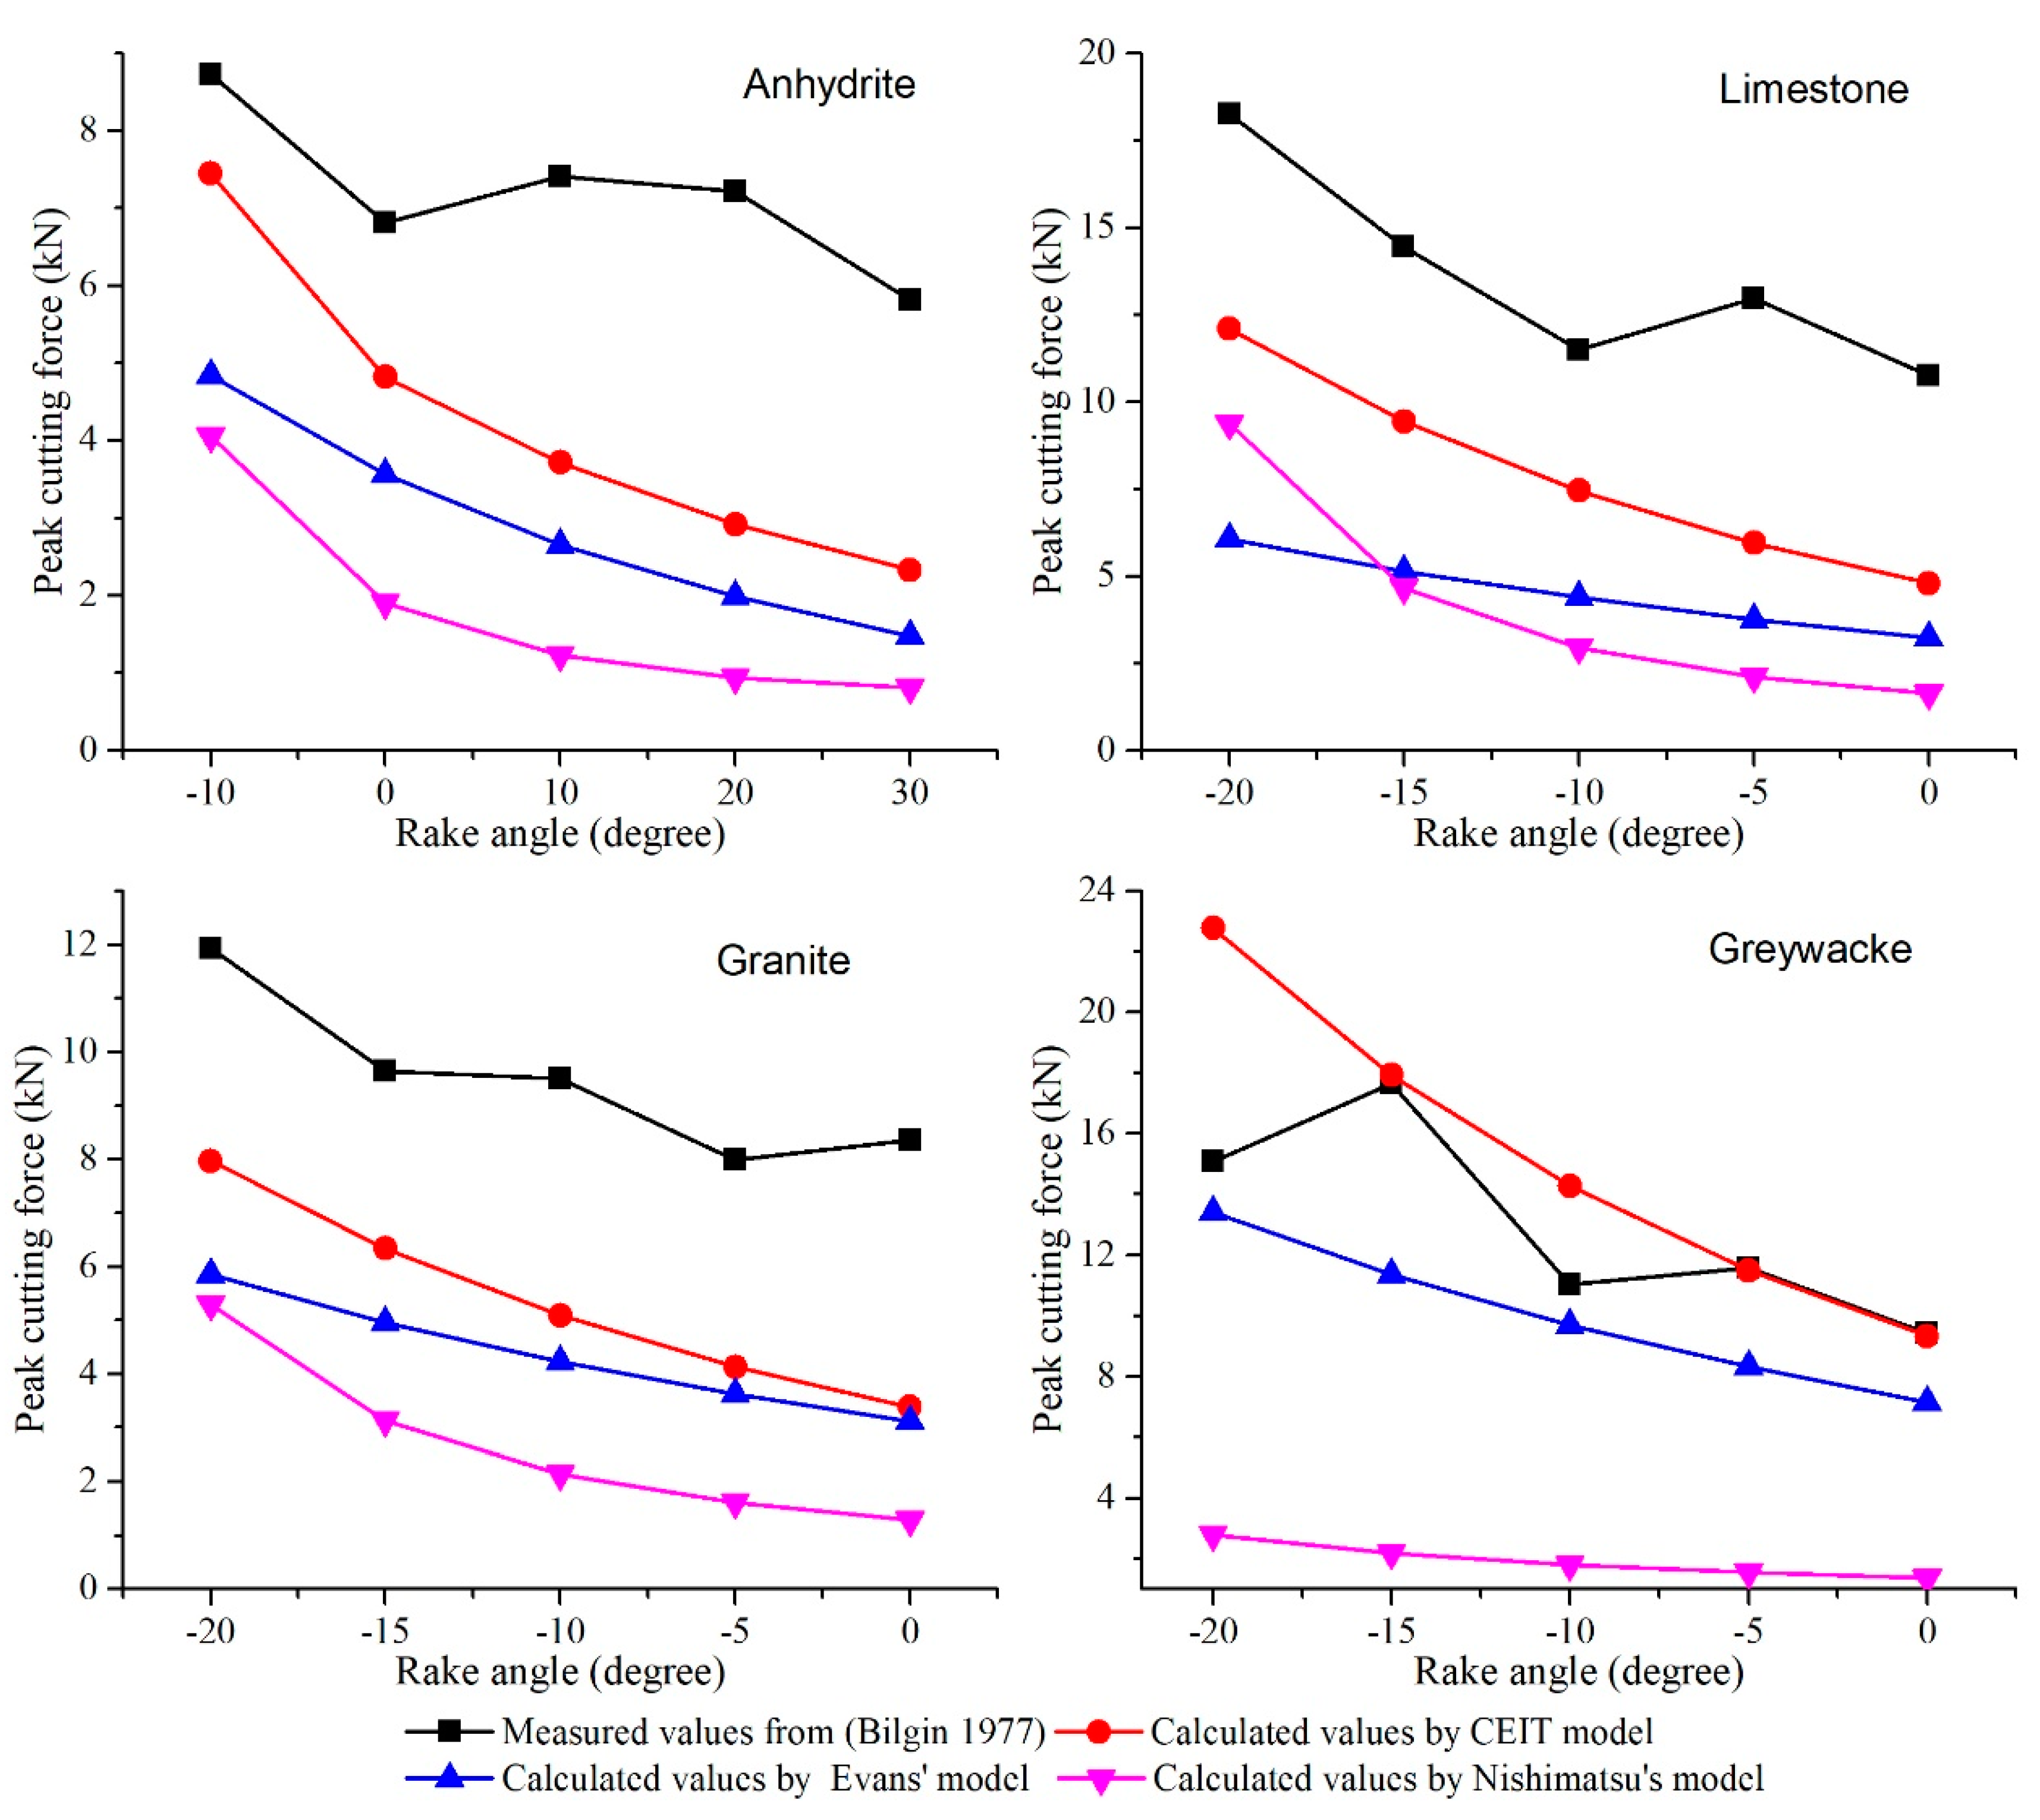
4.1. Validity of the CEIT Model in Capturing the Effects of the Cutting Parameters

In this part, the peak cutting force Fc at different values of the cutting parameters, including cutting width w, cutting depth d, and rake angle α , are predicted with the CEIT model. Then, the predicted Fc is compared with Fc calculated by Evans’ model and Nishimatsu’s model, and Fc measured from experiments. The values of Fc measured in [28] and calculated by the three models at different cutting widths are presented in Figure 8, where the values of α and d remain unchanged for each rock type. The results show that the values of Fc calculated by all the models show a linear relationship with w for all the rock types used in the rock cutting experiments. This agrees with the experimental results. In addition, it is obvious that the values of Fc calculated by the CEIT model are closer to the experimental results at different cutting widths.
It can be noticed that the best fitting lines of the experimental data in Figure 8 have positive intercepts for all the tested rock types. This indicates that when w tends to zero, Fc will not tend to zero, but tends to a positive value. This phenomenon is caused by the sidewall effect. The best-fitting lines for w and Fc predicted by the CEIT model also have positive intercepts, because the CEIT model has counted the sidewall effect during predicting Fc. From the phenomenological perspective, the side parts of the rock chip presented in Figure 5 causes the sidewall effect. From the mathematical perspective, the term f ( ψ ) d / w is used for considering the sidewall effect. However, neither Evans’ model nor Nishimatsu’s model has considered the sidewall effect. Thus, Fc calculated by both of them is proportional to w and is usually smaller than Fc measured from experiments.
The values of Fc measured in [27,28] and calculated by the three models at different cutting depths are presented in Figure 9, where the values of α and w remain unchanged for each rock type. The results show that Fc, measured from the experiments in cutting anhydrite, limestone, and granite, increases linear with increasing d, while in cutting greywacke, anhydrite 2 and limestone 2, Fc increases almost in a parabolic form with increasing d. These phenomena are perfectly represented by the CEIT model, as shown in Figure 9. However, Fc calculated by both Evans’ model and Nishimatsu’s model is proportional to d for all the tested rock types. It should be noticed that when the ratio of w to d is very small, the sidewall effect will influence the rock cutting greatly. Since the sidewall effect is proportional to the square of d [15,36,37], there will be a parabolic relationship between Fc and d. This is well captured by the CEIT model with Equation (24). In addition, the results in Figure 9 also indicate that the CEIT model is better than Evan’s model and Nishimatsu’s model in predicting Fc of the related experiments because the values of Fc predicted by the CEIT model are much closer to the measured values than those calculated by the other two theoretical models.
The values of the peak cutting force Fc measured in [28] and calculated by the three models at different rake angles are presented in Figure 10, where the values of the cutting width w and the cutting depth d remain unchanged for each rock type. The experimental results show that the values of Fc decrease with the increasing rake angle α in most of the cutting situations. Similar to Evans’ model and Nishimatsu’s model, the CEIT model can represent a decreasing trend of Fc with increasing α . As shown in Figure 10, the values of Fc calculated by the CEIT model show almost the same decrease trend as that of Fc measured from experiments with increasing α . It is obvious that the values of Fc, calculated by the CEIT model, are much closer to the measured Fc than those of Fc calculated by Evans’ model and Nishimatsu’s model.
In conclusion, the results in Figure 8, Figure 9 and Figure 10 indicate that the CEIT model can well capture the relationships of Fc to w, d, and α , and the CEIT model can predict Fc on the chisel pick better than Evans’ model and Nishimatsu’s model.

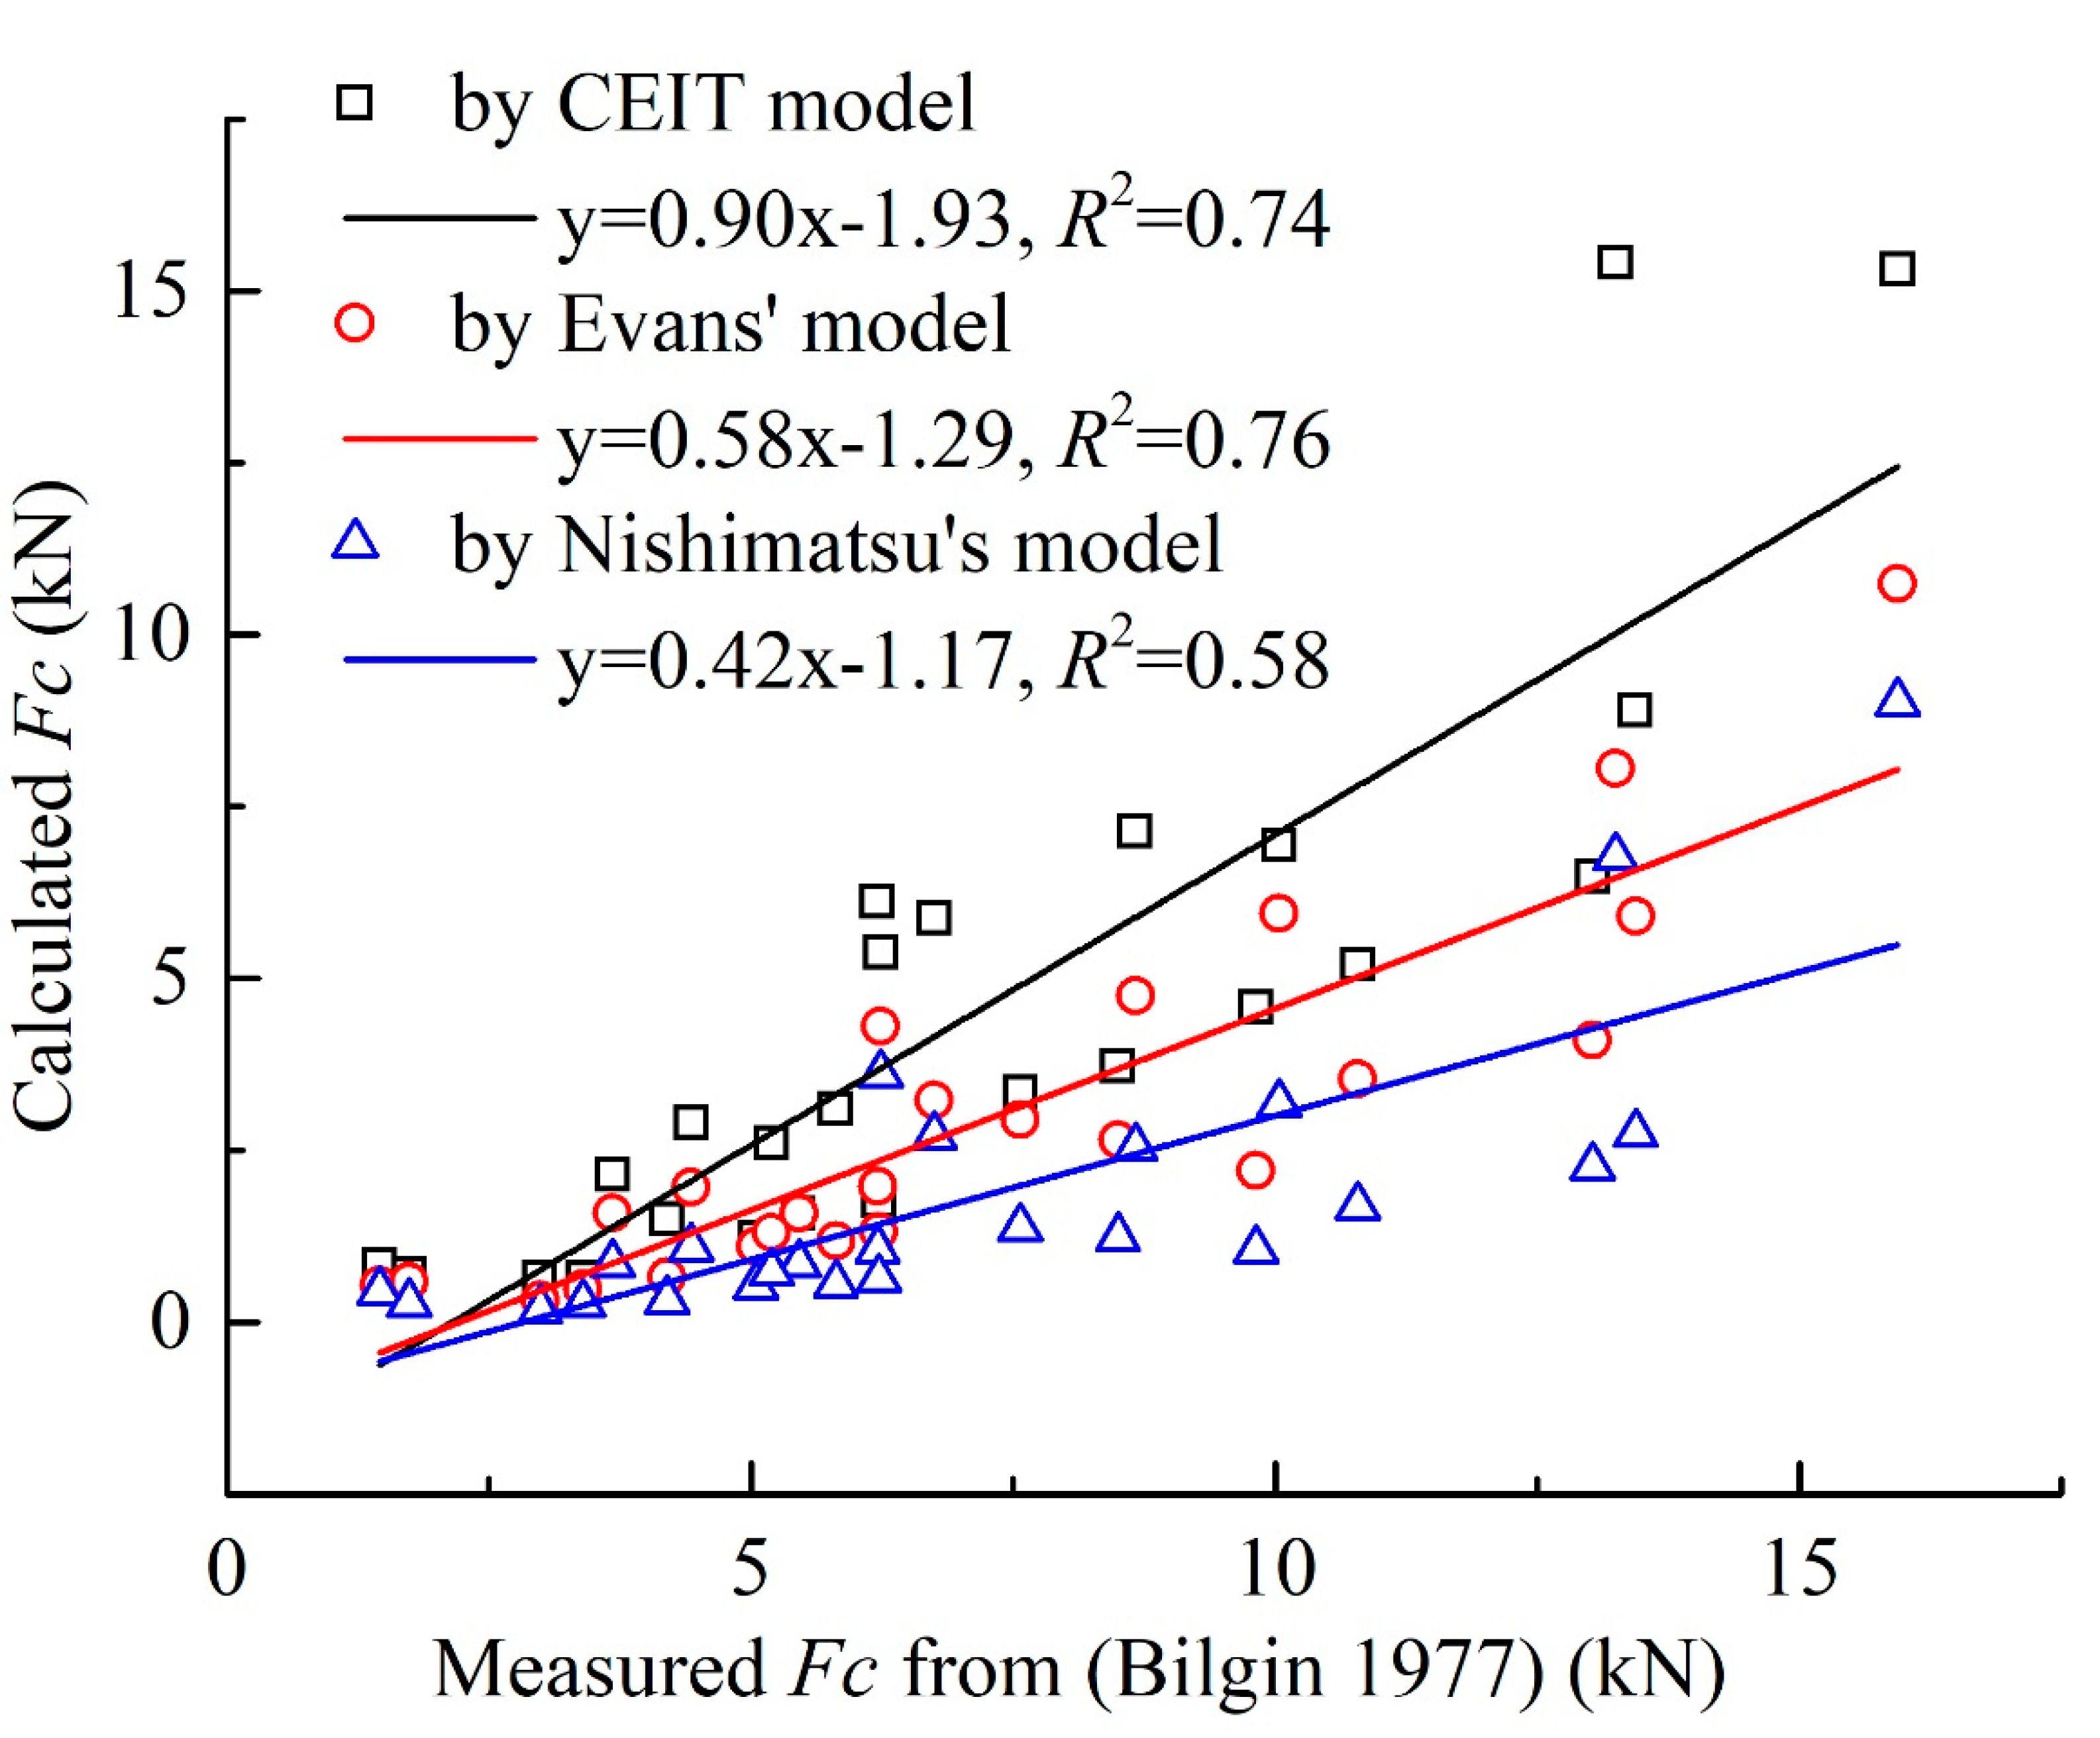
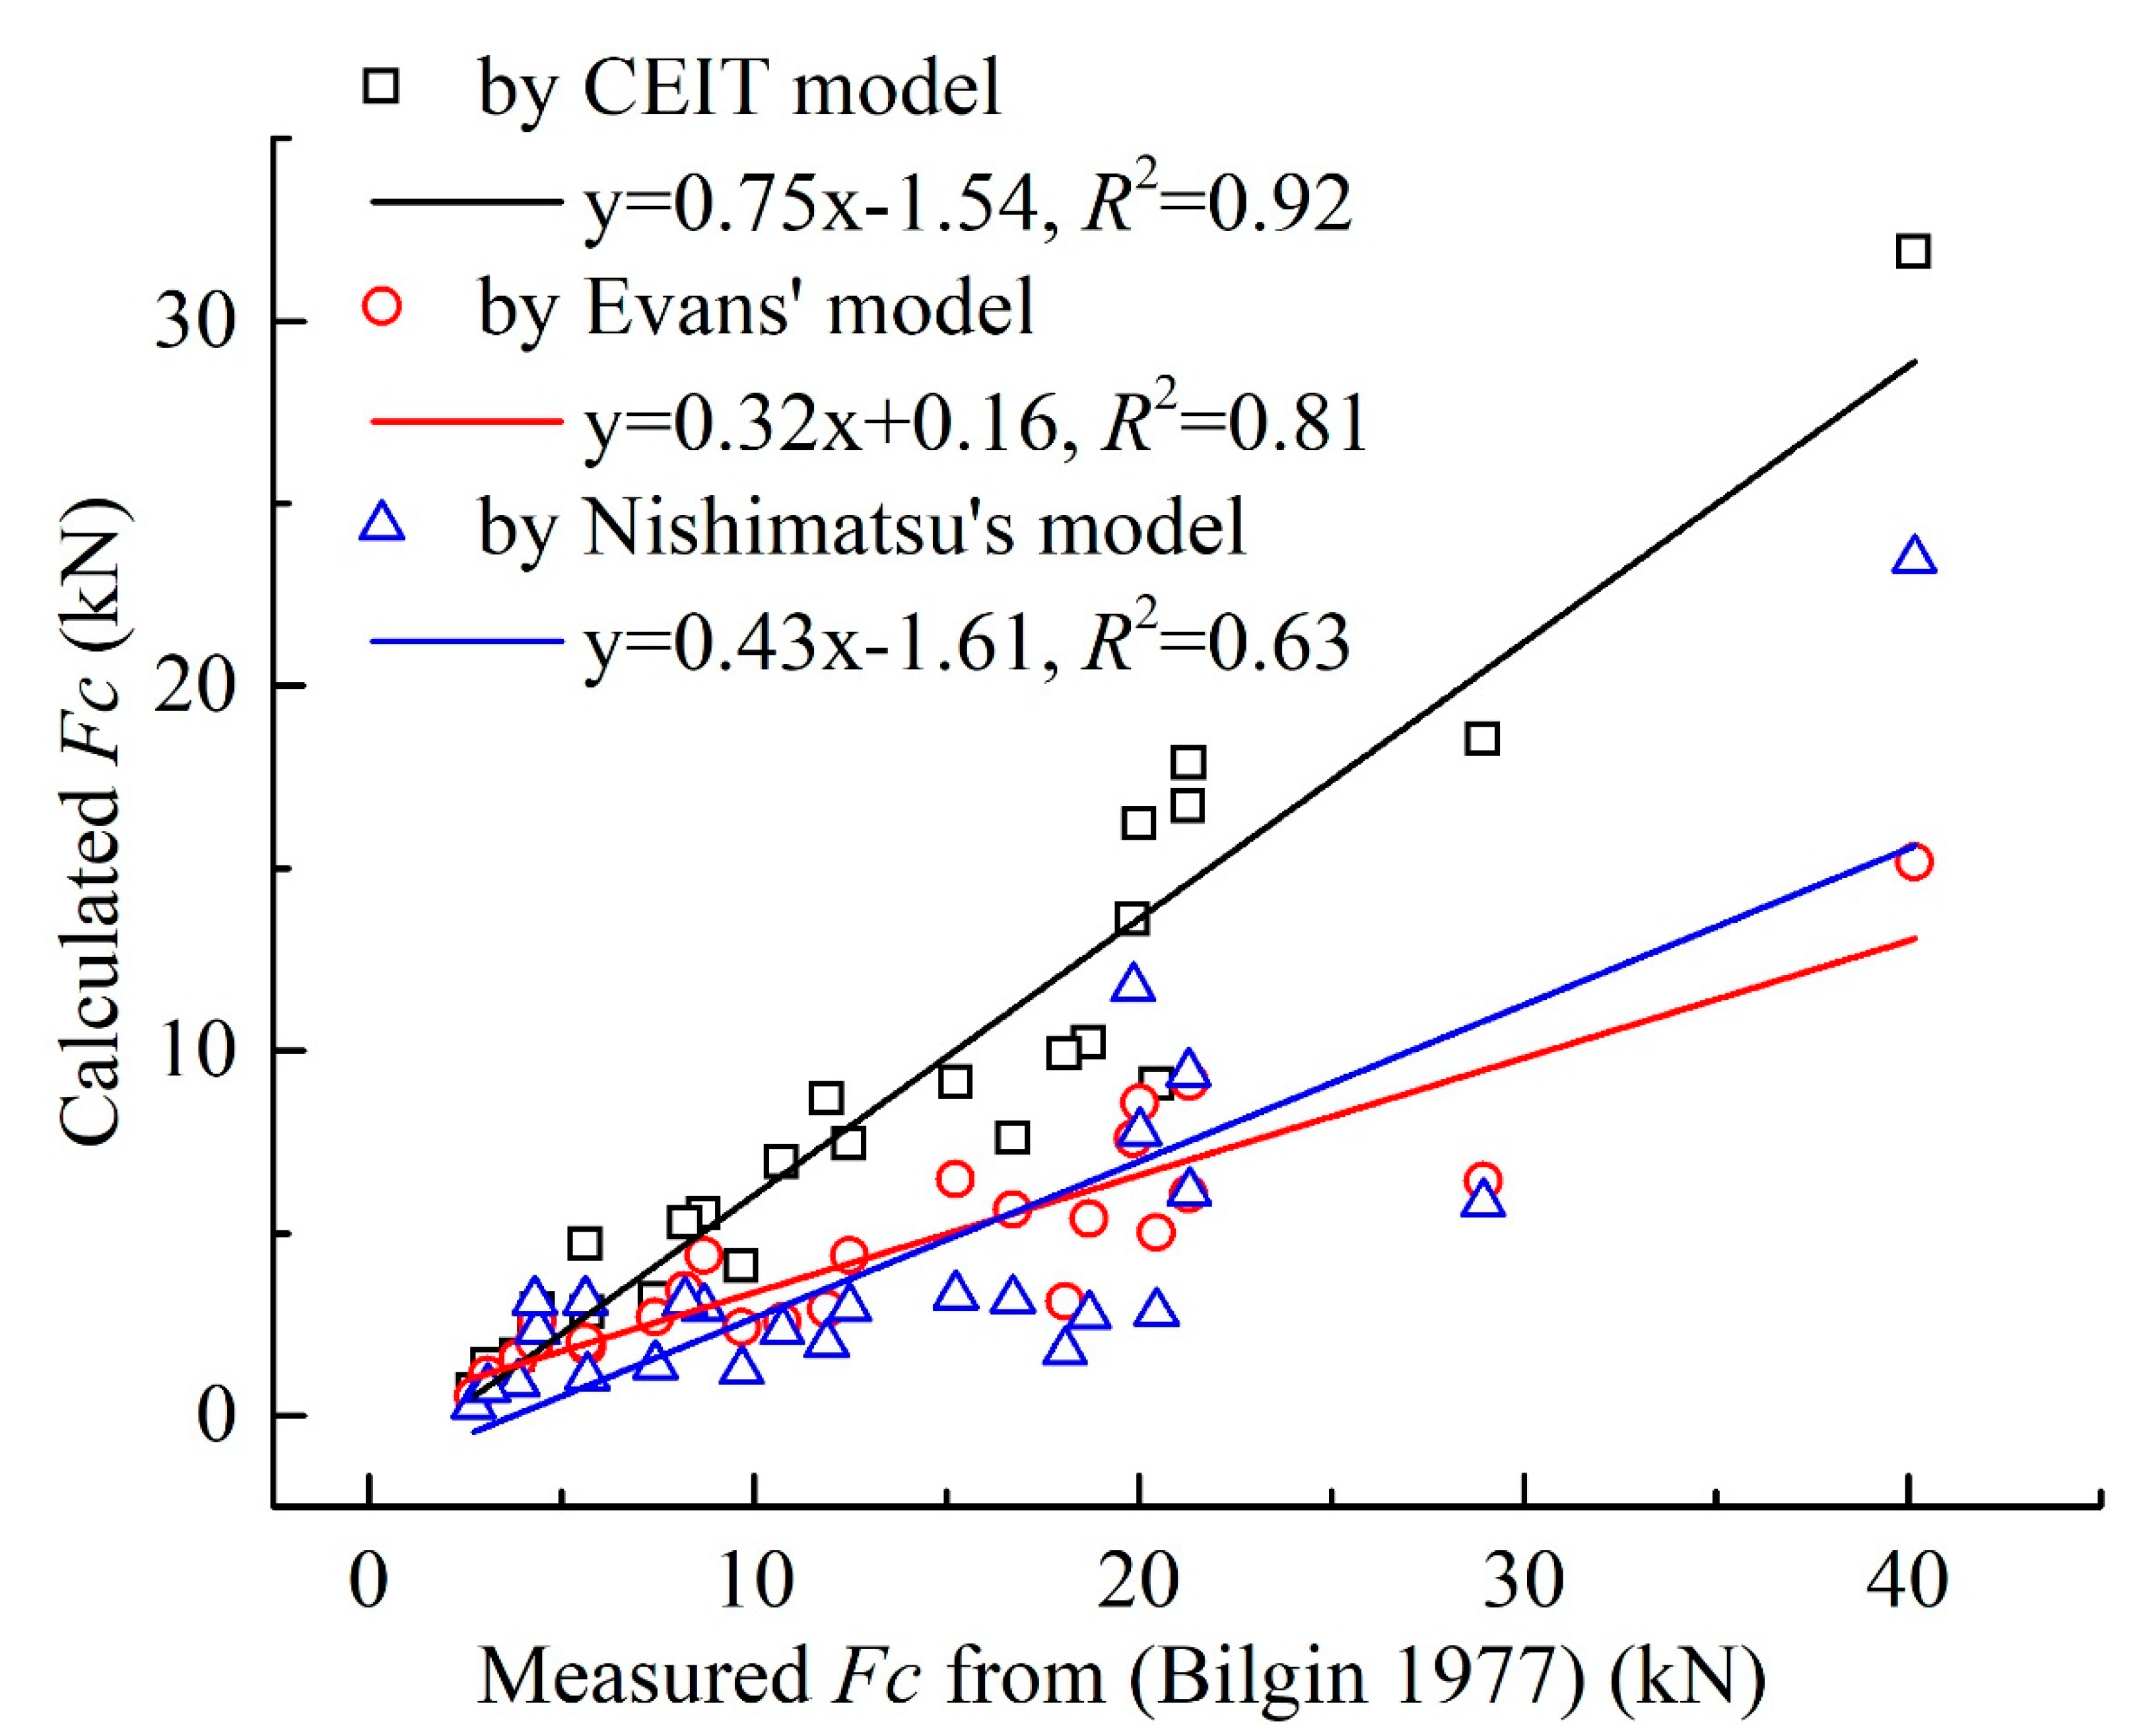
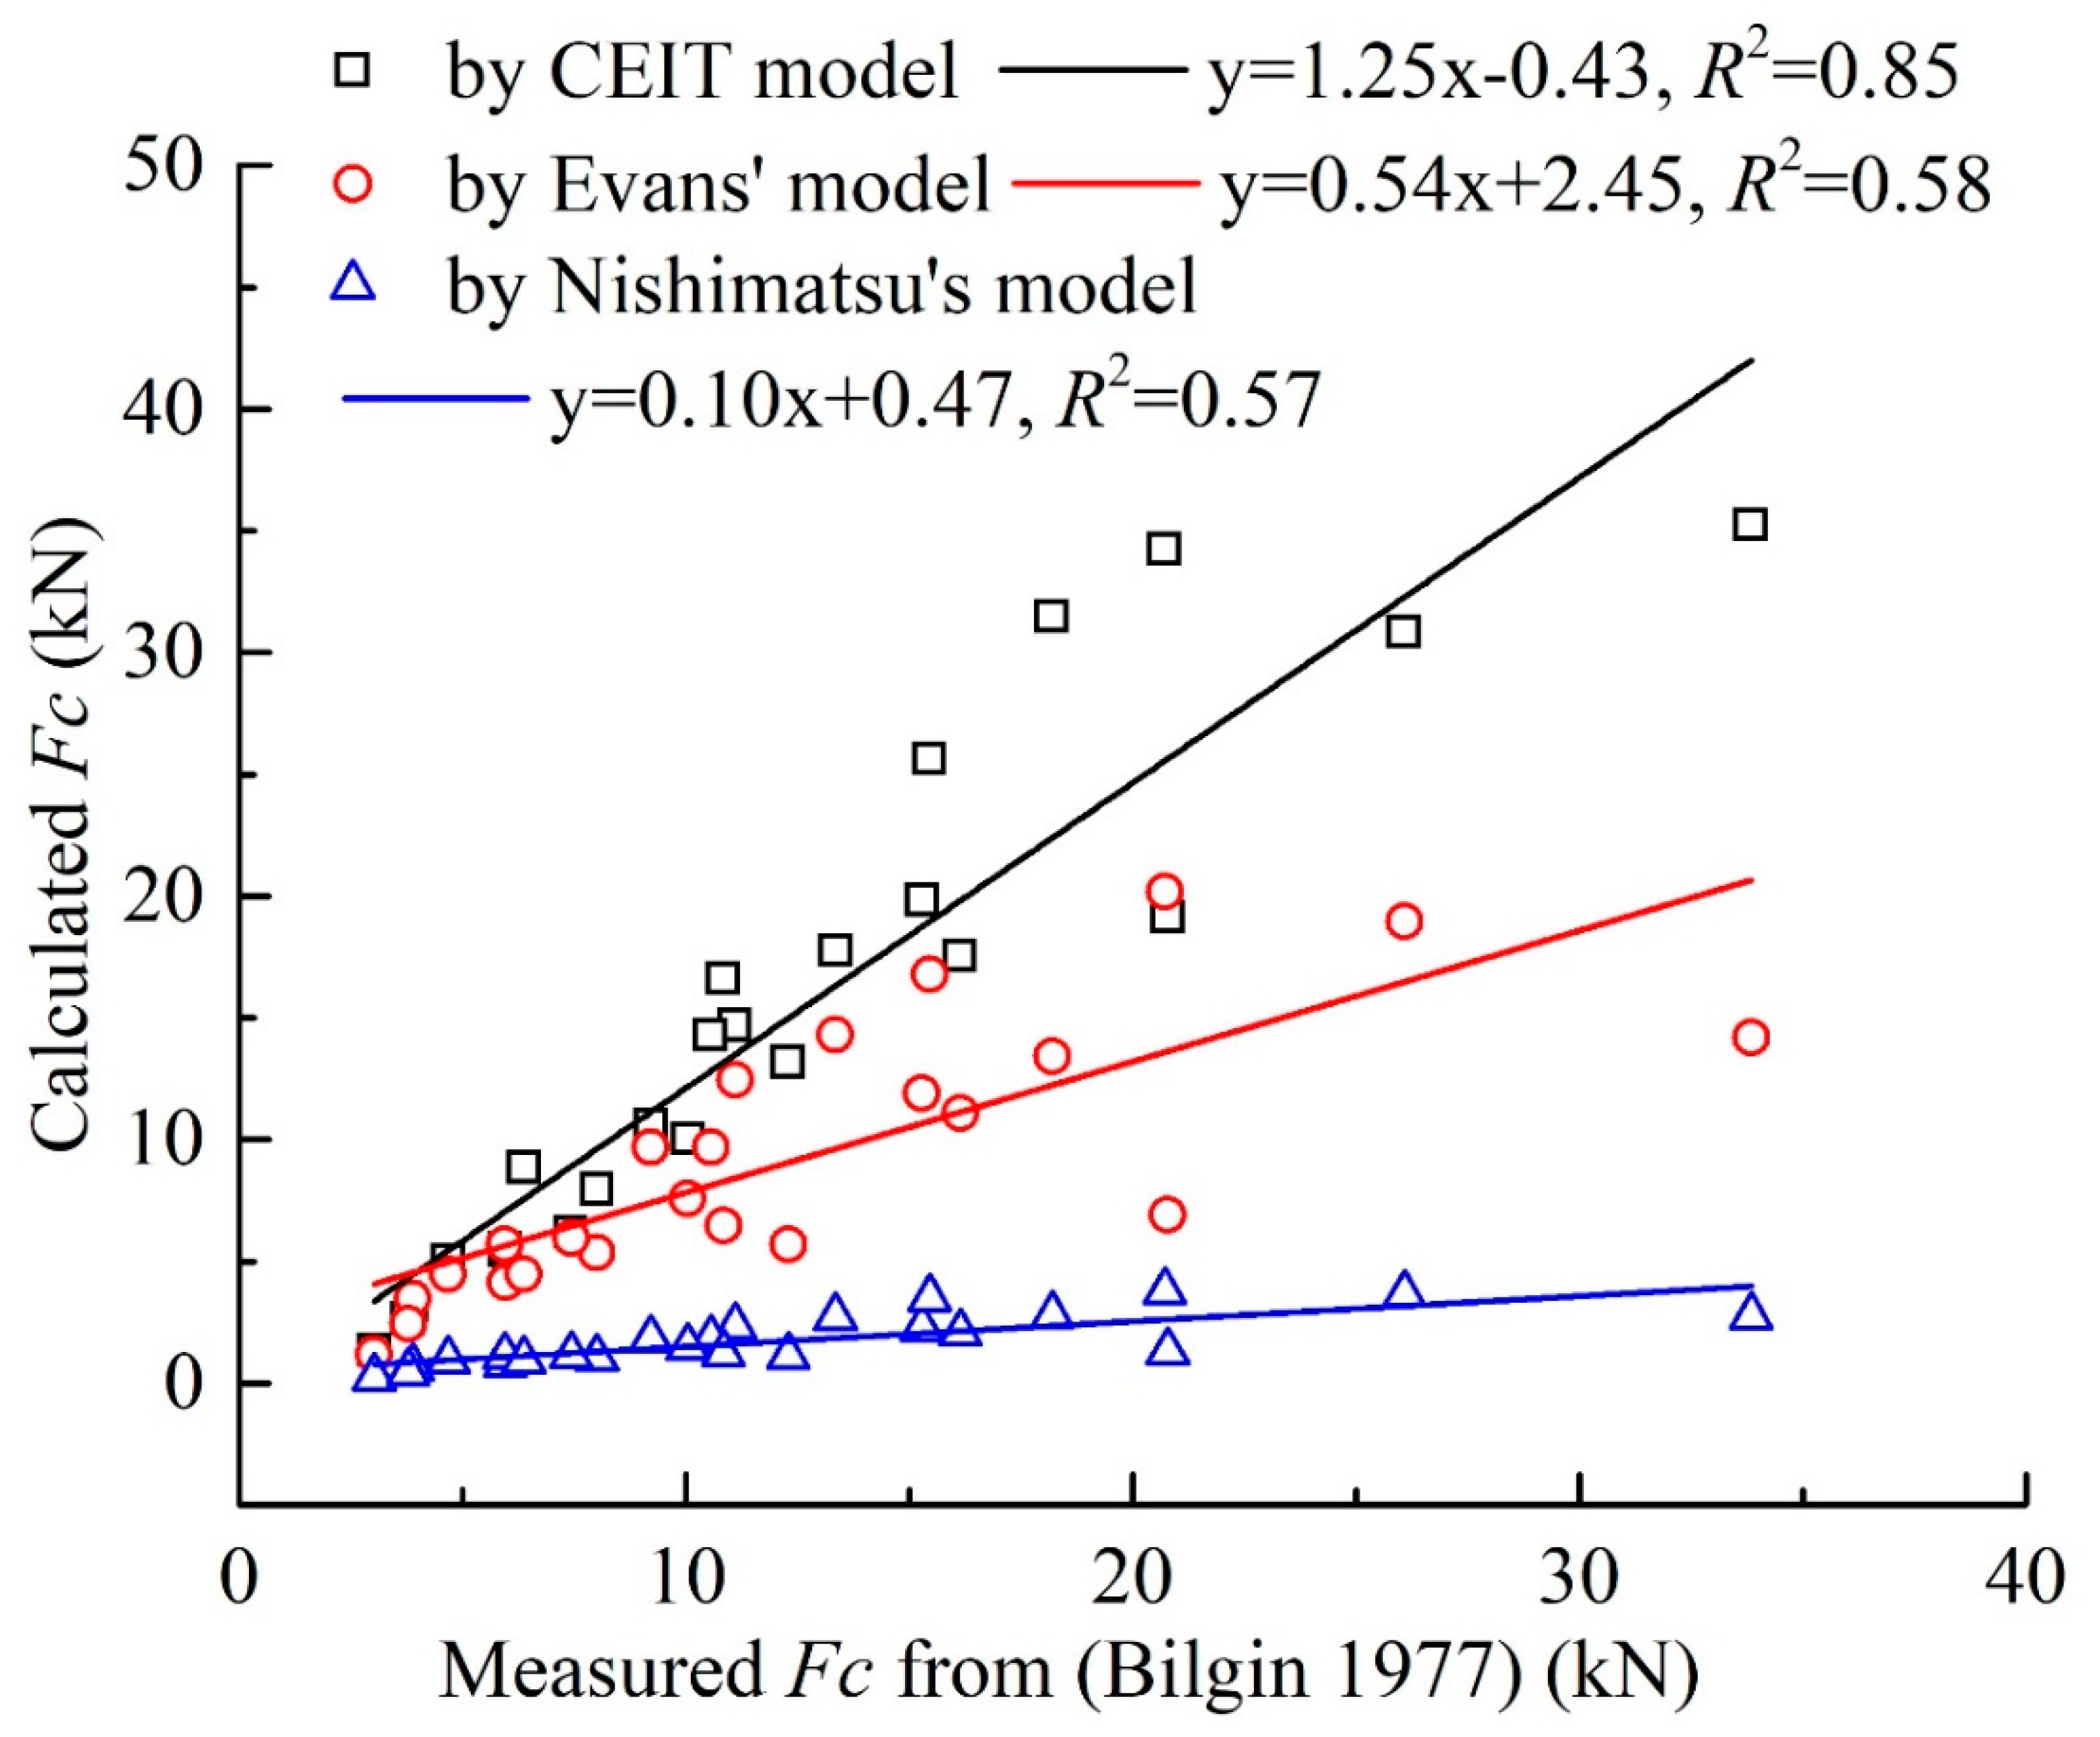
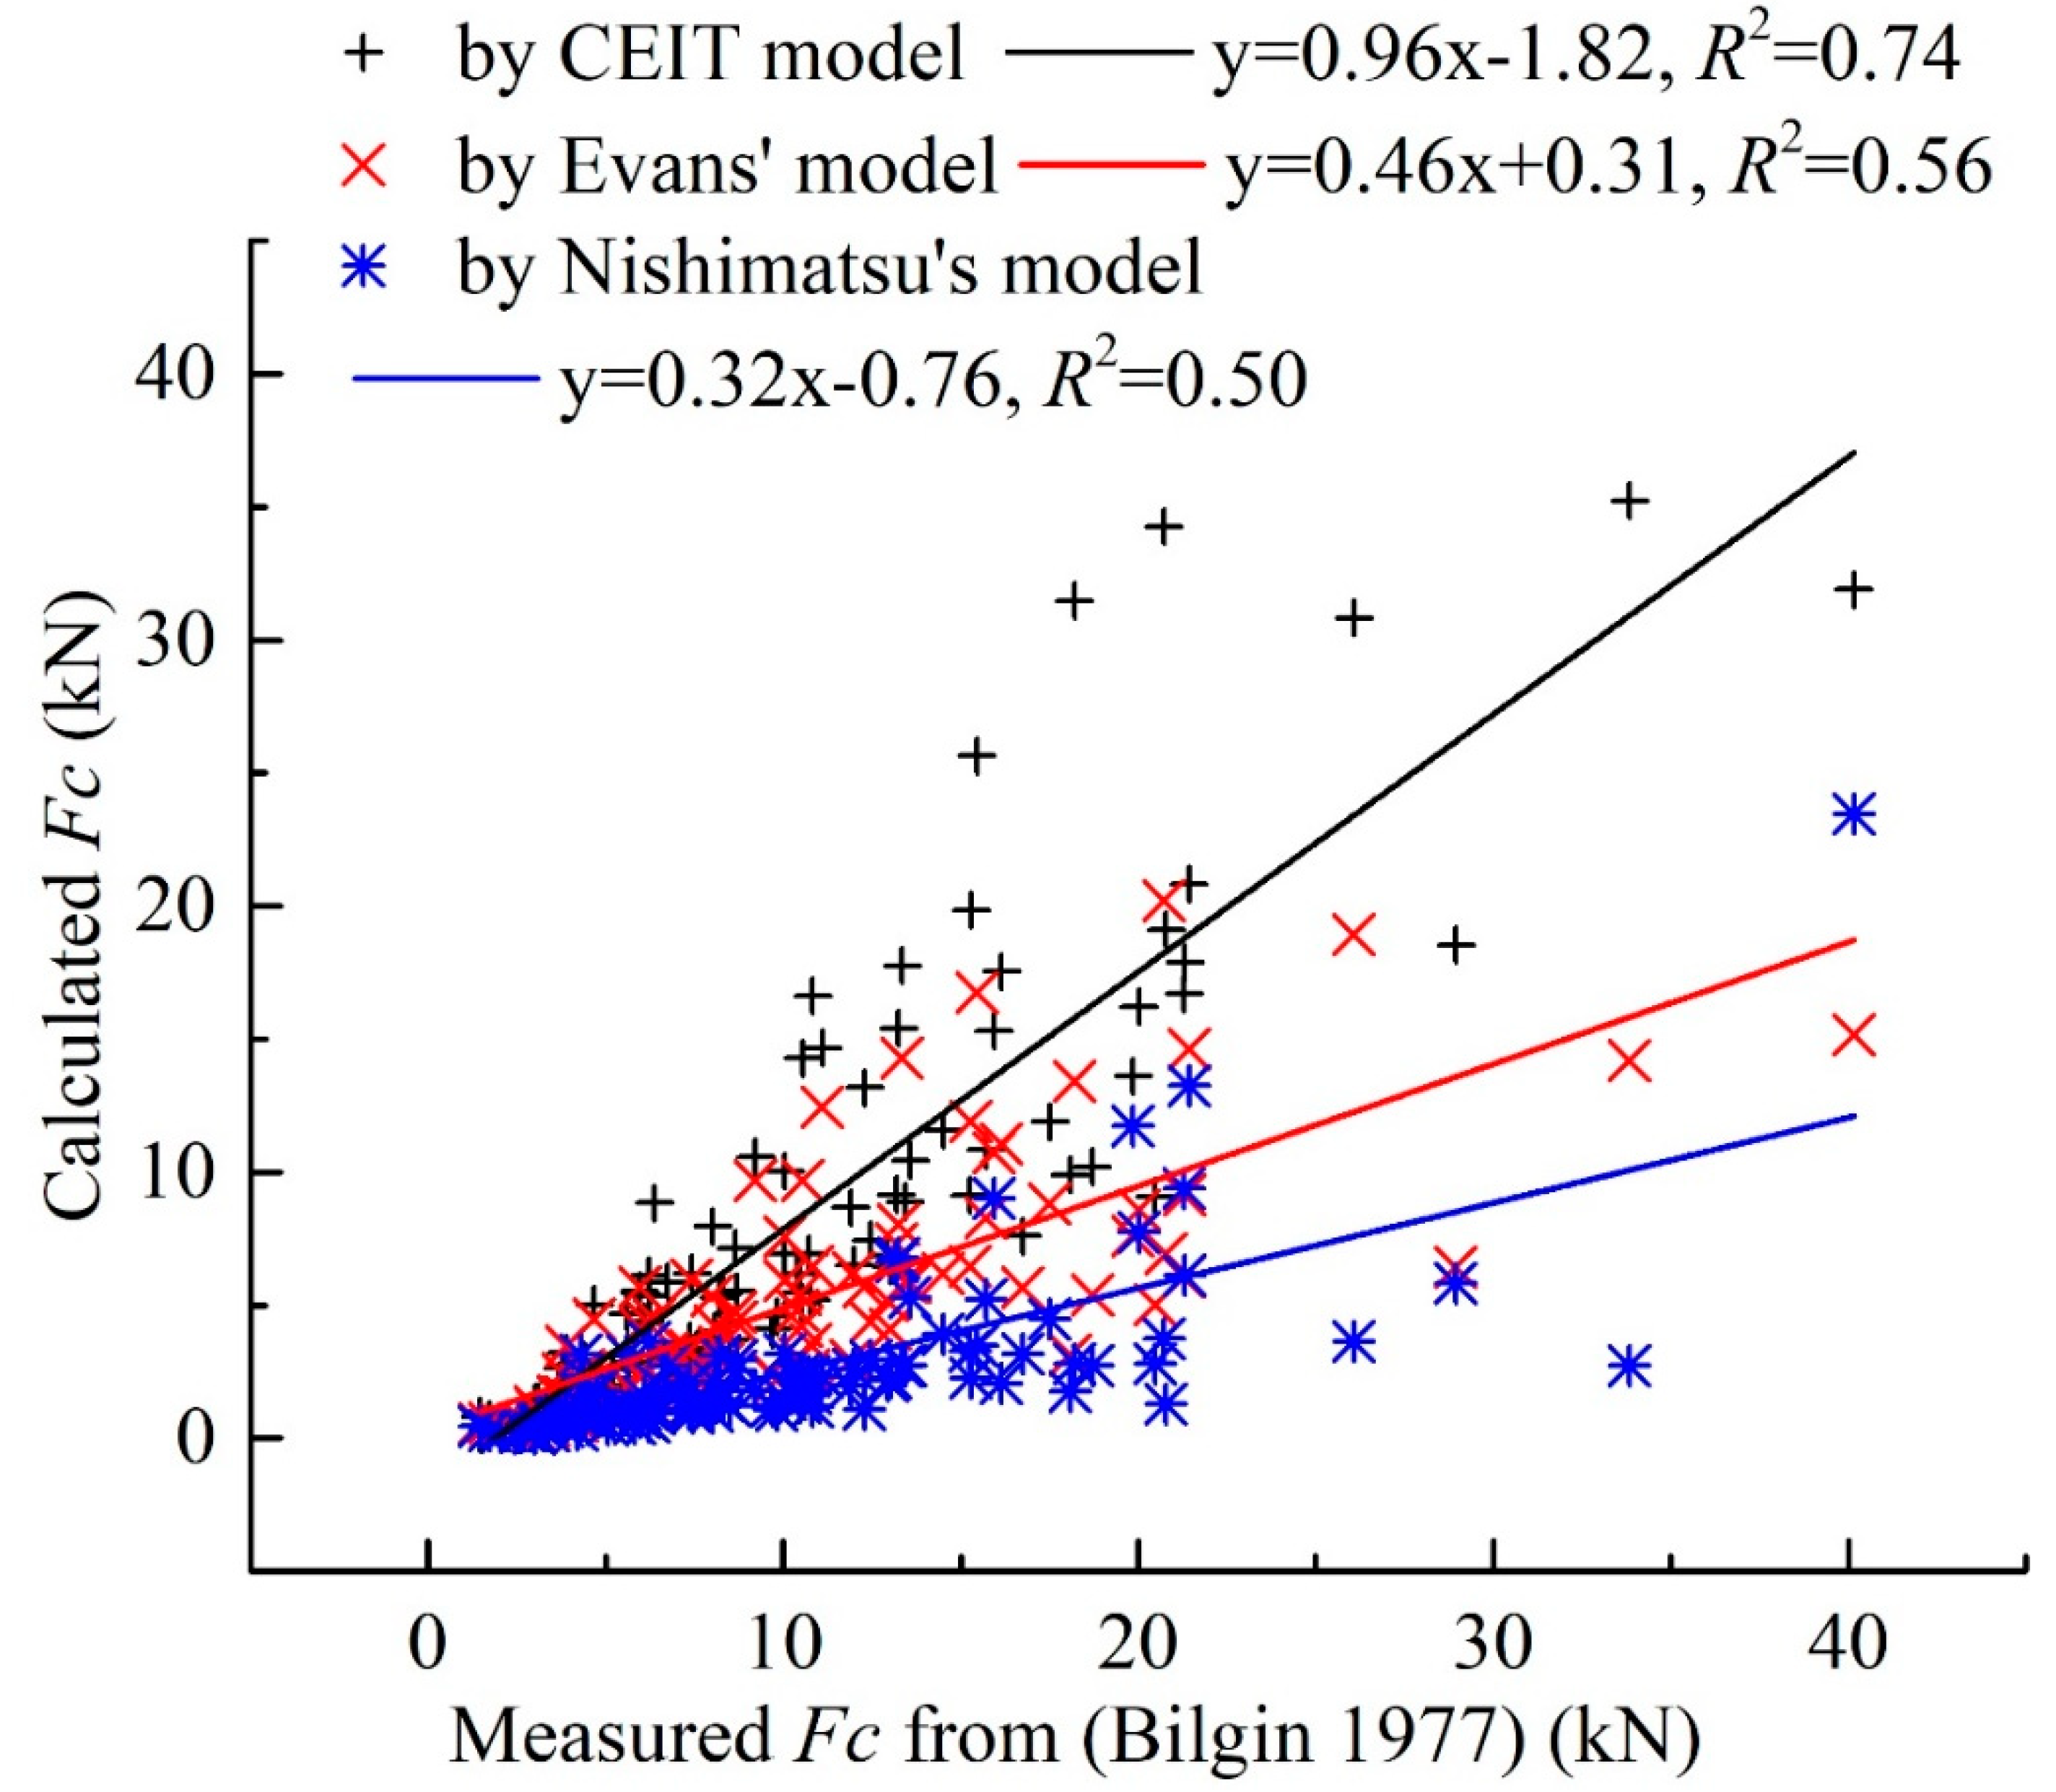
4.2. Comparison of the CEIT Model and the Existing Theoretical Models

In this part, the CEIT model and the existing theoretical models, including Evans’ model and Nishimatsu’s model, are used to predict the values of the peak cutting force Fc on the chisel pick of the orthogonal experiments presented in [28]. The predicted results are compared with the experimental results to examine the validity of the CEIT model.
The comparisons of Fc calculated by formulas with that measured from rock cutting experiments are presented in Figure 11, Figure 12, Figure 13 and Figure 14, respectively, for cutting anhydrite, limestone, granite, and greywacke. The best-fitting lines between the predicted Fc and measured Fc are also presented in these figures. Observing Figure 11, Figure 12, Figure 13 and Figure 14, it is obvious that the values of Fc predicted by the CEIT model agree much better with the measured values than those predicted by Evans’ model and Nishimatsu’s model.
Figure 15 demonstrates the relationships between the measured Fc and the calculated Fc by the CEIT model, Evans’ model, and Nishimatsu’s model for all the tested rock types. To quantify the discrepancies between the predicted results and the measured results, root mean square error (RMSE), Equation (28), and bias, Equation (29), are introduced here.
R M S E = 1 N i = 1 N ( F c i p F c i m ) 2
B i a s = 1 N i = 1 N ( F c i p F c i m )
where F c i m is the i th measured Fc, F c i p is the i th predicted Fc, and N is the number of the measured Fc. The RMSE provides a quantitative measure of the prediction model. A smaller value of the RMSE indicates the better performance of the prediction model. The bias indicates the correspondence between the mean values of predicted Fc and measured Fc. The closer to zero the bias is, the better the prediction model performs. The values of the RMSE, bias, and R2 for each model in predicting the experimental results in [28] are listed in Table 3. The results in Table 3 indicate that the CEIT model is much better than Evans’ model and Nishimatsu’s model in predicting the values of Fc on the chisel pick in rock cutting. To conclude, the CEIT model is quite suitable for predicting the value of Fc in rock cutting with a chisel pick under the brittle fracture regime.

5. Discussions

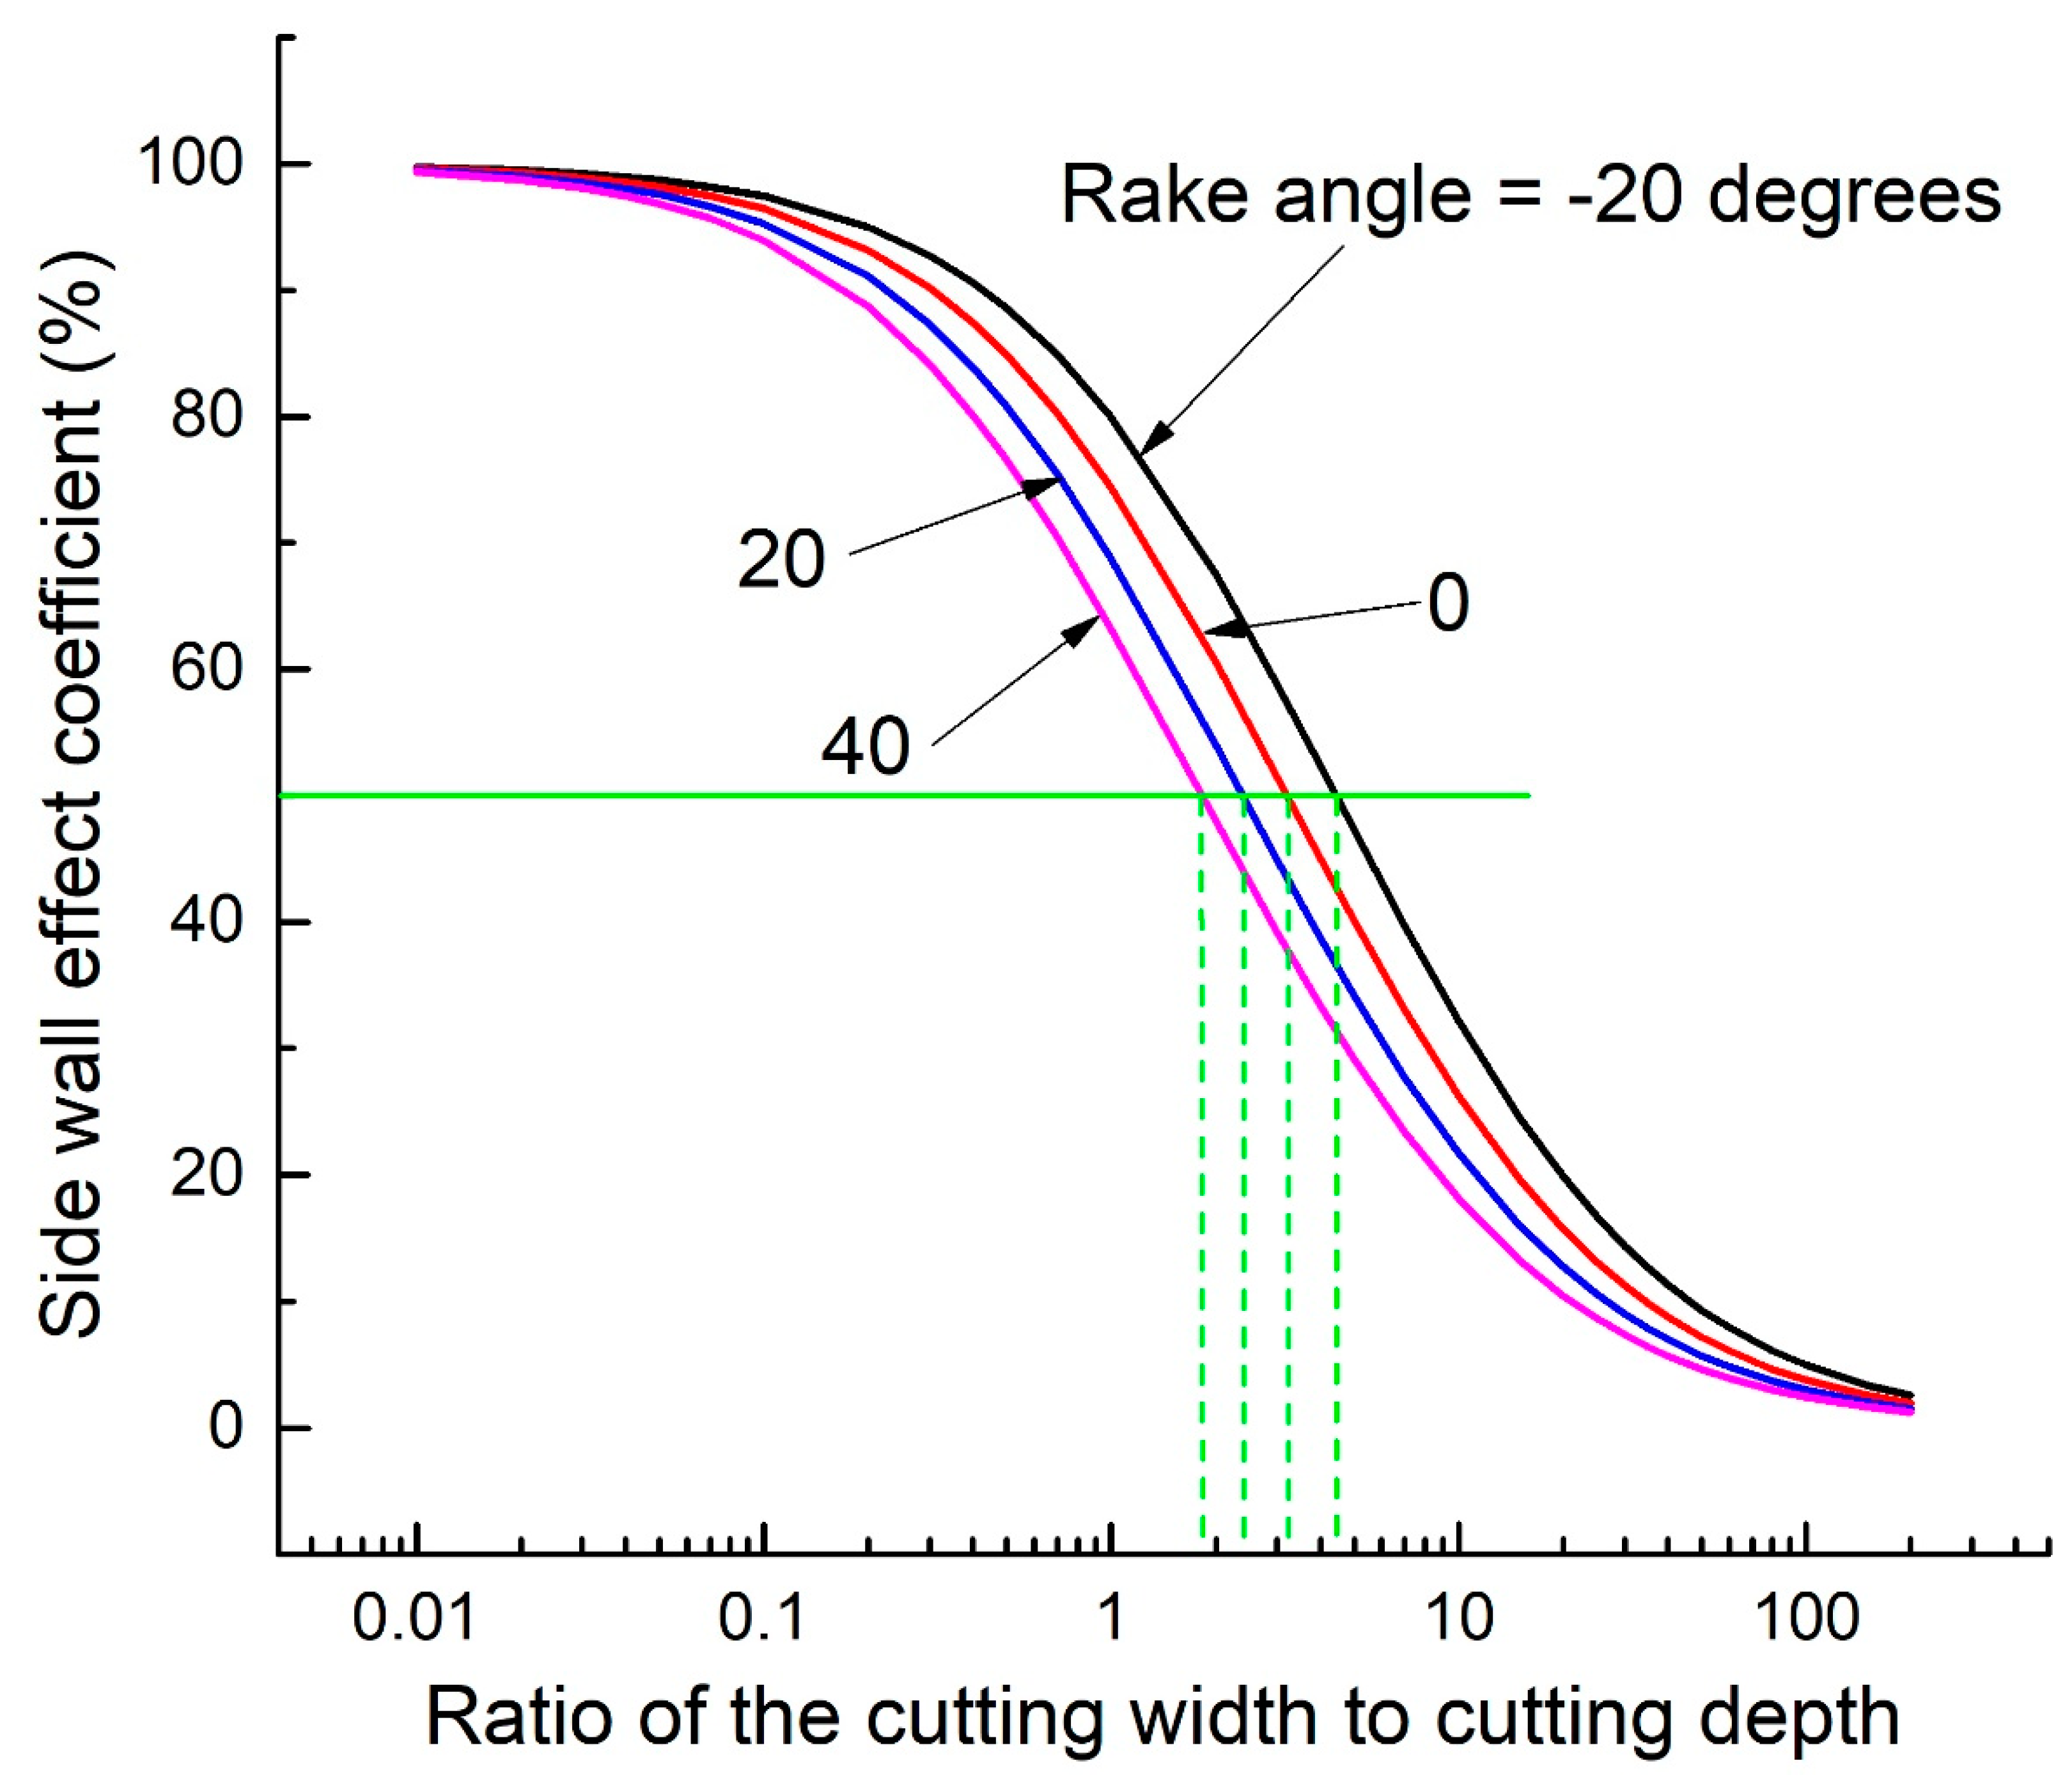
5.1. Sidewall Effect in the CEIT Model

One of the great differences between the CEIT model and the existing theoretical models is that the CEIT model considers the sidewall effect and is a three-dimensional model, as illustrated in Figure 5. The sidewall effect on the peak cutting force is counted by using the term f ( ψ ) d / w in Equation (24), where f ( ψ ) is a non-dimensional function of the breakout angle ψ , d is the cutting depth, w is the cutting width. When the ratio of w to d tends to infinity, as is the case in shallow cutting or two-dimensional rock cutting, the sidewall effect will tend to zero. In this situation, by assuming f ( ψ ) d / w = 0 and considering the minimum work hypothesis, Equation (24) can be simplified to the following equation:
F c = σ t w d [ cos α + tan ϕ + sgn ( α ) sin α tan ϕ ] 2 sin [ ( π / 2 + α ) / 2 ] { 1 cos [ ( π / 2 + α ) / 2 ] }
where the peak cutting force Fc is proportional to w and d, same with that in Evan’s model and Nishimatsu’s model. On the contrary, when the ratio of w to d tends to zero, Fc is totally caused by the sidewall effect. In this situation, Equation (24) can be rearranged into the following form:
F c = σ t d 2 [ cos α + tan ϕ + sgn ( α ) sin α tan ϕ ] f ( ψ ) 32 sin 5 ψ sin [ ( π / 2 + α ) / 2 ] sin [ ( π / 2 + α ) / 2 ψ ]
where Fc is proportional to the square of d and proportional to the tensile strength of rock σ t . Equation (31) indicates that the influence of the sidewall effect on Fc is proportional to the square of d, and is independent of w, which agrees with the findings in [36,37]. Equation (31) is quite similar to the theoretical model proposed by Evans [22] for predicting Fc on the conical pick. The prediction performance of Equation (31) for Fc on the conical pick is not discussed in this paper.
In fact, since the influence of the sidewall effect on Fc is independent of w, it can be calculated by Equation (31) at any value of w/d. To quantify the sidewall effect, the sidewall effect coefficient ( η ) is introduced here. The value of η represents the proportion of the cutting force caused by the sidewall effect to the total cutting force. As presented in Equation (27), the value of ψ is only affected by the rake angle α and the ratio of w to d. In addition, f ( ψ ) only depends on ψ . Therefore, the value of η depends on the value of α and the ratio of w to d. For the CEIT model, η is calculated as follows:
η = [ f ( ψ ) × d w ] / [ 1 + f ( ψ ) × d w ] = f ( ψ ) w / d + f ( ψ ) × 100 %
The relationship between η and w/d predicted by the CEIT model at different values of α is presented in Figure 16. The results show that the value of η decreases with the increasing value of w/d when α remains unchanged. The value of η tends to 100% when the value of w/d tends to zero. The value of η tends to zero when the value of w/d tends to infinity. This indicates that ignoring the sidewall effect has great influence on the models’ predicting accuracy when the w/d ratio is very small. Thus, the CEIT model is more suitable for predicting the peak cutting force on the chisel pick than other existing theoretical models particularly when the value of w/d is very small. The value of w/d needed to obtain η = 50 % decreases with the increasing value of α . In addition, the value of η will decrease with the increasing value of α and with w/d remaining unchanged. The validity of Equation (32) in calculating the value of η is not discussed in this paper due to the lack of suitable experimental data.

5.2. Advantages and Limitations of the CEIT Model

As the sidewall effect is considered in the CEIT model, the physical model adopted in this paper in deriving the formula for predicting the peak cutting force is more similar to the reality than the physical models adopted in Evans’ model and Nishimatsu’s model. Therefore, the CEIT model is a strict three-dimensional model. By counting the sidewall effect, the CEIT model can capture the parabolic relationship between the peak cutting and the cutting depth obtained from some rock cutting experiments. This relationship cannot be explained by existing theoretical models, including Evans’ model and Nishimatsu’s model. Additionally, the CEIT model can capture the relationships of the peak cutting force to the cutting width and the rake angle very well, same as the existing models. In fact, the validation of the CEIT model and comparisons of the CEIT model and other theoretical models show that the CEIT model can predict the peak cutting force of the discussed experiments much better than Evans’ model and Nishimatsu’s model. In addition, the CEIT model is convenient for practical application because only two mechanical parameters of rocks are needed to predict the peak cutting force, same with Evans’ model. However, the available experimental results for verifying the CEIT model are inadequate, and further validations are still required through new experimental results and simulation results.
Based on the assumptions made in this paper, the CEIT model has some limitations during application. First, the CEIT model is intended for rock cutting under the brittle fracture regime. It is not suitable for rock cutting under the ductile fracture regime. Next, in the CEIT model, the symmetry plane of the chisel pick is vertical and is parallel to the cutting direction. The effects of the inclination and deflection of this symmetry plane are not considered. In addition, the size of the wear flat is assumed to be much smaller than the cutting depth and cutting width. For a badly worn chisel pick, the CEIT model needs improvement because the friction between the chisel pick and rock will increase with the increasing size of the wear flat [28,64]. Finally, the current form of the CEIT model is intended for unrelieved cutting conditions and is not suitable for relieved cutting conditions. In relieved cutting conditions, the influence of the neighboring picks is complicated, which depends on the ratio of cutting depth to picks spacing and rock properties. Therefore, many works are still required to improve the CEIT model to make it suitable for relieved cutting conditions.

6. Conclusions

This paper aims to deepen the understanding of rock cutting with the chisel pick of a cutter suction dredger during rock excavation. An analytical model, the CEIT model, was proposed for rock cutting with a chisel pick under the brittle fracture regime in order to predict the peak cutting force more accurately. The CEIT model is developed based on the tensile breakage theory and cavity expansion theory. Different from the existing theoretical models for a chisel pick, the sidewall effect is taken into account in this three-dimensional CEIT model. After the deduction of the mathematical formula of the CEIT model, the relationships of the breakout angle to the rake angle and the ratio of cutting width to cutting depth were investigated, and a simplified CEIT model was established for the calculation in practical applications.
Validation was made by comparing the predicted results with the available experimental data and the existing theoretical results. The results show that the CEIT model can well reproduce some phenomena observed from experimental studies on rock cutting with a chisel pick, which are as follows: (1) the peak cutting force increases linearly with the increasing cutting width, and decreases with the increasing rake angle; (2) the peak cutting force increases in a parabolic form with the increasing cutting depth when the ratio of cutting width to cutting depth is very small; (3) the peak cutting force is larger than zero when the cutting width tends to zero, which cannot been reproduced by existing theoretical models. In addition, the CEIT model can predict the peak cutting force on the chisel pick more accurately then the existing theoretical models, particularly for rock cutting at a small ratio of cutting width to cutting depth.
Finally, according to the CEIT model in this paper, it was found that the influence of the sidewall effect on the peak cutting force depends on the cutting depth and rake angle but is independent of the cutting width. To quantify this influence, the sidewall effect coefficient was defined, which decreases with the increasing cutting width to cutting depth ratio and the rake angle.

Author Contributions

Conceptualization, Y.O.; project administration, Q.Y.; supervision, Q.Y. and Y.X.; validation, X.C.; visualization, X.C.; writing—original draft, Y.O.; writing—review and editing, Q.Y. and Y.X. All authors have read and agreed to the published version of the manuscript.

Funding

This work was supported by the National Natural Science Foundation of China [grant number 51179104] and the Key Project of National Nature Science Foundation of China [grant number 41630633].

Acknowledgments

Thank Zhengshun Cheng and Jinlong Duan for their help in the process of writing this paper.

Conflicts of Interest

We declare that we do not have any commercial or associative interest that represents a conflict of interest in connection with the work submitted.

References

  1. Ab Adzis, A.H.; Abdul-Rani, A.M.; Yi, K.Y.; Maulianda, B.T.; Rao, T.V.V.L.N. Effect of back rake angle and shape on wear rate of pdc cutter in hard formation. In Proceedings of the 6th International Conference on Production, Energy and Reliability 2018: World Engineering Science & Technology Congress, Kuala Lumpur, Malaysia, 13–14 August 2018; Volume 2035. [Google Scholar]
  2. Rostamsowlat, I.; Akbari, B.; Evans, B. Analysis of rock cutting process with a blunt pdc cutter under different wear flat inclination angles. J. Pet. Sci. Eng. 2018, 171, 771–783. [Google Scholar] [CrossRef]
  3. Akbari, B.; Miska, S. The effects of chamfer and back rake angle on pdc cutters friction. J. Nat. Gas Sci. Eng. 2016, 35, 347–353. [Google Scholar] [CrossRef]
  4. Rostamsowlat, I.; Richard, T.; Evans, B. An experimental study of the effect of back rake angle in rock cutting. Int. J. Rock Mech. Min. Sci. 2018, 107, 224–232. [Google Scholar] [CrossRef] [Green Version]
  5. Rostamsowlat, I.; Richard, T.; Evans, B. Experimental investigation on the effect of wear flat inclination on the cutting response of a blunt tool in rock cutting. Acta Geotech. 2019, 14, 519–534. [Google Scholar] [CrossRef]
  6. Doshvarpassand, S.; Richard, T.; Mostofi, M. Effect of groove geometry and cutting edge in rock cutting. J. Pet. Sci. Eng. 2017, 151, 1–12. [Google Scholar] [CrossRef]
  7. Che, D.; Han, P.; Guo, P.; Ehmann, K. Issues in polycrystalline diamond compact cutter-rock interaction from a metal machining point of view-part I: Temperature, stresses, and forces. J. Manuf. Sci. Eng. Trans. ASME 2012, 134, 064001. [Google Scholar] [CrossRef]
  8. Che, D.; Han, P.; Guo, P.; Ehmann, K. Issues in polycrystalline diamond compact cutter-rock interaction from a metal machining point of view-part II: Bit performance and rock cutting mechanics. J. Manuf. Sci. Eng. Trans. ASME 2012, 134, 064002. [Google Scholar] [CrossRef]
  9. Detournay, E.; Richard, T.; Shepherd, M. Drilling response of drag bits: Theory and experiment. Int. J. Rock Mech. Min. Sci. 2008, 45, 1347–1360. [Google Scholar] [CrossRef]
  10. Li, X.B.; Summers, D.A.; Rupert, G.; Santi, P. Experimental investigation on the breakage of hard rock by the pdc cutters with combined action modes. Tunn. Undergr. Space Technol. 2001, 16, 107–114. [Google Scholar] [CrossRef]
  11. Menezes, P.L.; Lovell, M.R.; Avdeev, I.V.; Higgs, C.F., III. Studies on the formation of discontinuous rock fragments during cutting operation. Int. J. Rock Mech. Min. Sci. 2014, 71, 131–142. [Google Scholar] [CrossRef] [Green Version]
  12. Richard, T.; Dagrain, F.; Poyol, E.; Detournay, E. Rock strength determination from scratch tests. Eng. Geol. 2012, 147, 91–100. [Google Scholar] [CrossRef]
  13. Detournay, E.; Defourny, P. A phenomenological model for the drilling action of drag bits. Int. J. Rock Mech. Min. Sci. Geomech. Abstr. 1992, 29, 13–23. [Google Scholar] [CrossRef]
  14. Liu, W.; Zhu, X.; Jing, J. The analysis of ductile-brittle failure mode transition in rock cutting. J. Pet. Sci. Eng. 2018, 163, 311–319. [Google Scholar] [CrossRef]
  15. Richard, T.; Coudyzer, C.; Desmette, S. Influence of groove geometry and cutter inclination in rock cutting. In Proceedings of the 44th US Rock Mechanics Symposium—5th US/Canada Rock Mechanics Symposium, Salt Lake City, UT, USA, 27–30 June 2010. [Google Scholar]
  16. Richard, T.; Detournay, E.; Drescher, A.; Nicodeme, P.; Fourmaintraux, D. The scratch test as a means to measure strength of sedimentary rocks. In SPE/ISRM Rock Mechanics in Petroleum Engineering; Society of Petroleum Engineers: Trondheim, Norway, 1998; pp. 1–8. [Google Scholar]
  17. Miedema, S. The Delft Sand, Clay & Rock Cutting Model, 3rd ed.; IOS Press: Amsterdam, The Netherlands, 2019. [Google Scholar]
  18. Zhou, Y.; Lin, J.-S. On the critical failure mode transition depth for rock cutting. Int. J. Rock Mech. Min. Sci. 2013, 62, 131–137. [Google Scholar] [CrossRef]
  19. He, X.; Xu, C.; Peng, K.; Huang, G. On the critical failure mode transition depth for rock cutting with different back rake angles. Tunn. Undergr. Space Technol. 2017, 63, 95–105. [Google Scholar] [CrossRef]
  20. Evans, I. A theory on the basic mechanics of coal ploughing. In Mining Research; Clark, G.B., Ed.; Elsevier: Amsterdam, The Netherlands, 1962; pp. 761–798. [Google Scholar]
  21. Evans, I. The force required to cut coal with blunt wedges. Int. J. Rock Mech. Min. Sci. 1965, 2, 1–2. [Google Scholar] [CrossRef]
  22. Evans, I. A theory of the cutting force for point attack-picks. Int. J. Min. Eng. 1984, 2, 9. [Google Scholar] [CrossRef]
  23. Goktan, R. Prediction of Drag Bit Cutting Force in Hard Rocks. In Proceedings of the 3rd International Symposium on Mine Mechanization and Automation, Golden, Colorado, 1 June 1995; pp. 10–31. [Google Scholar]
  24. Goktan, R.M. A Suggested Improvement on Evans’ Cutting Theory for Conical Bits. In Proceedings of the 4th International Symposium on Mine Mechanization and Automation, Brisbane, Australia, 1 July 1997. [Google Scholar]
  25. Goktan, R.M.; Gunes, N. A semi-empirical approach to cutting force prediction for point-attack picks. J. S. Afr. Inst. Min. Metall. 2005, 105, 257–263. [Google Scholar]
  26. Nishimatsu, Y. The mechanics of rock cutting. Int. J. Rock Mech. Min. Sci. Geomech. Abstr. 1972, 9, 261–270. [Google Scholar] [CrossRef]
  27. Allington, A.V. The Machining of Rock Materials; University of Newcastle upon Tyne: Newcastle, UK, 1969. [Google Scholar]
  28. Bilgin, N. Investigations into the Mechanical Cutting Characteristics of Some Medium and High Strength Rocks; University of Newcastle Upon Tyne: Newcastle, UK, 1977. [Google Scholar]
  29. Spagnoli, G.; Bosco, C.; Oreste, P. The influence of the rake angle on the excavation energy in a sandstone. Géotechnique Lett. 2017, 7, 30–35. [Google Scholar] [CrossRef]
  30. Bilgin, N.; Demircin, M.A.; Copur, H.; Balci, C.; Tuncdemir, H.; Akcin, N. Dominant rock properties affecting the performance of conical picks and the comparison of some experimental and theoretical results. Int. J. Rock Mech. Min. Sci. 2006, 43, 139–156. [Google Scholar] [CrossRef]
  31. Yasar, S.; Yilmaz, A. Drag pick cutting tests: A comparison between experimental and theoretical results. J. Rock Mech. Geotech. Eng. 2018, 10, 893–906. [Google Scholar] [CrossRef]
  32. Yilmaz, N.G.; Yurdakul, M.; Goktan, R.M. Prediction of radial bit cutting force in high-strength rocks using multiple linear regression analysis. Int. J. Rock Mech. Min. Sci. 2007, 44, 962–970. [Google Scholar] [CrossRef]
  33. Ouyang, Y. Studies on Cutting Mechanism of Pick Cutters for Rock Dredging; Shanghai Jiao Tong University: Shanghai, China, 2013. [Google Scholar]
  34. Su, O. Numerical modeling of cuttability and shear behavior of chisel picks. Rock Mech. Rock Eng. 2019, 52, 1803–1817. [Google Scholar] [CrossRef]
  35. Yasar, S. A general semi-theoretical model for conical picks. Rock Mech. Rock Eng. 2020, 53, 2557–2579. [Google Scholar] [CrossRef]
  36. Dagrain, F.; Detournay, E.; Richard, T. Influence of the Cutter Geometry in Rock Cutting: An Experimental Approach; University of Minnesota: Minneapolis, MN, USA, 2001. [Google Scholar]
  37. Ghoshouni, M.; Richard, T. Effect of the back rake angle and groove geometry in rock cutting. In ISRM International Symposium—5th Asian Rock Mechanics Symposium; International Society for Rock Mechanics and Rock Engineering: Tehran, Iran, 2008; p. 10. [Google Scholar]
  38. Roxborough, F.F.; King, P.; Pedroncelli, E.J. Tests on the cutting performance of a continuous miner. J. S. Afr. Inst. Min. Metall. 1981, 81, 9–25. [Google Scholar]
  39. Rutten, T.; Chen, X.; Liu, G.; Hong, G.; Miedema, S. Experimental study on rock cutting with a pickpoint. In Proceedings of the CEDA Dredging Days 2019, Rotterdam, The Netherlands, 8 November 2019. [Google Scholar]
  40. Chen, X.; Miedema, S.; van Rhee, C. Numerical methods for modeling the rock cutting process in deep sea mining. In Proceedings of the International Conference on Offshore Mechanics and Arctic Engineering, San Francisco, CA, USA, 8–13 June 2014. [Google Scholar]
  41. Chen, X.; Miedema, S.A.; van Rhee, C. Numerical modeling of excavation process in dredging engineering. Procedia Eng. 2015, 102, 804–814. [Google Scholar] [CrossRef] [Green Version]
  42. Liu, X.H.; Liu, S.Y.; Tang, P. Coal fragment size model in cutting process. Powder Technol. 2015, 272, 282–289. [Google Scholar] [CrossRef]
  43. Shao, W.; Li, X.; Sun, Y.; Huang, H.; Tang, J. An experimental study of temperature at the tip of point-attack pick during rock cutting process. Int. J. Rock Mech. Min. Sci. 2018, 107, 39–47. [Google Scholar] [CrossRef]
  44. Mishnaevsky, L.L. Investigation of the cutting of brittle materials. Int. J. Mach. Tools Manuf. 1994, 34, 499–505. [Google Scholar] [CrossRef]
  45. Xue, J.; Xia, Y.; Ji, Z.; Zhou, X. Soft rock cutting mechanics model of tbm cutter and experimental research. In International Conference on Intelligent Robotics and Applications; Xie, M., Xiong, Y., Xiong, C., Liu, H., Hu, Z., Eds.; Springer: Berlin/Heidelberg, Germany, 2009; Volume 5928, pp. 383–391. [Google Scholar]
  46. Menezes, P.L. Influence of friction and rake angle on the formation of built-up edge during the rock cutting process. Int. J. Rock Mech. Min. Sci. 2016, 88, 175–182. [Google Scholar] [CrossRef]
  47. Yasar, S.; Yilmaz, A.O. Rock cutting tests with a simple-shaped chisel pick to provide some useful data. Rock Mech. Rock Eng. 2017, 50, 3261–3269. [Google Scholar] [CrossRef]
  48. Ouyang, Y.; Yang, Q.; Ma, J.; Qiu, Y. Effects of rake angle on linear rock cutting with chisel picks. J. Shanghai Jiaotong Univ. 2018, 52, 1422–1428. [Google Scholar]
  49. Copur, H.; Bilgin, N.; Tuncdemir, H.; Balci, C. A set of indices based on indentation tests for assessment of rock cutting performance and rock properties. J. S. Afr. Inst. Min. Metall. 2003, 103, 589–599. [Google Scholar]
  50. Kim, E.; Rostami, J.; Swope, C. Full scale linear cutting experiment to examine conical bit rotation. J. Min. Sci. 2012, 48, 882–895. [Google Scholar] [CrossRef]
  51. Wang, X.; Su, O.; Wang, Q.-F.; Liang, Y.-P. Effect of cutting depth and line spacing on the cuttability behavior of sandstones by conical picks. Arab. J. Geosci. 2017, 10, 525. [Google Scholar] [CrossRef]
  52. Gharsallaoui, H.; Jafari, M.; Holeyman, A. Cavity expansion in rock masses obeying the “hoek-brown” failure criterion. Rock Mech. Rock Eng. 2020, 53, 927–941. [Google Scholar] [CrossRef]
  53. Alehossein, H.; Detournay, E.; Huang, H. An analytical model for the indentation of rocks by blunt tools. Rock Mech. Rock Eng. 2000, 33, 267–284. [Google Scholar] [CrossRef]
  54. Huang, H.; Damjanac, B.; Detournay, E. Normal wedge indentation in rocks with lateral confinement. Rock Mech. Rock Eng. 1998, 31, 81–94. [Google Scholar] [CrossRef]
  55. Forrestal, M.J.; Tzou, D.Y. A spherical cavity-expansion penetration model for concrete targets. Int. J. Solids Struct. 1997, 34, 4127–4146. [Google Scholar] [CrossRef]
  56. Luk, V.K.; Forrestal, M.J.; Amos, D.E. Dynamic spherical cavity expansion of strain-hardening materials. Trans. ASME J. Appl. Mech. 1991, 58, 1–6. [Google Scholar] [CrossRef]
  57. Chen, L.H.; Labuz, J.F. Indentation of rock by wedge-shaped tools. Int. J. Rock Mech. Min. Sci. 2006, 43, 1023–1033. [Google Scholar] [CrossRef]
  58. Wang, X.; Su, O. Specific energy analysis of rock cutting based on fracture mechanics: A case study using a conical pick on sandstone. Eng. Fract. Mech. 2019, 213, 197–205. [Google Scholar] [CrossRef]
  59. Li, X.; Wang, S.; Ge, S.; Malekian, R.; Li, Z. A theoretical model for estimating the peak cutting force of conical picks. Exp. Mech. 2018, 58, 709–720. [Google Scholar] [CrossRef]
  60. Gao, K.; Du, C.; Jiang, H.; Liu, S. A theoretical model for predicting the peak cutting force of conical picks. Frat. Integrita Strutt. 2014, 8, 43–52. [Google Scholar]
  61. Bao, R.; Zhang, L.; Yao, Q.; Lunn, J. Estimating the peak indentation force of the edge chipping of rocks using single point-attack pick. Rock Mech. Rock Eng. 2011, 44, 339–347. [Google Scholar] [CrossRef]
  62. Ouyang, Y.; Yang, Q. Numerical simulation of rock cutting in 3d with sph method and estimation of cutting force. J. Shanghai Jiaotong Univ. 2016, 50, 84–90. [Google Scholar]
  63. Roxborough, F. Cutting rock with picks. Min. Eng. 1973, 132, 445–455. [Google Scholar]
  64. Dogruoz, C.; Bolukbasi, N.; Rostami, J.; Acar, C. An experimental study of cutting performances of worn picks. Rock Mech. Rock Eng. 2016, 49, 213–224. [Google Scholar] [CrossRef]
Figure 1. (a) Cutter head of the cutter suction dredger, and (b) parameters and forces in rock cutting.
Jmse 08 00806 g001
Figure 2. Illustration of Evans’ model for chisel picks: (a) rock indentation, and (b) rock cutting.
Jmse 08 00806 g002
Figure 3. Illustration of Nishimatsu’s model for rock cutting with a chisel pick.
Jmse 08 00806 g003
Figure 4. Illustration of the crushed zone expansion induced tensile failure (CEIT) model for rock cutting with a chisel pick.
Jmse 08 00806 g004
Figure 5. Idealized shape of the rock chip in the CEIT model.
Jmse 08 00806 g005
Figure 6. (a) Relationship between breakout angle and rake angle at different ratios of cutting width to cutting depth; and (b) relationship of the slopes and intercepts to the ratio of the cutting width to cutting depth.
Jmse 08 00806 g006
Figure 7. Relationship between the values of breakout angle estimated by the regression formula and those by direct calculation.
Jmse 08 00806 g007
Figure 8. Comparison of the calculated and measured peak cutting forces at different cutting widths.
Jmse 08 00806 g008
Figure 9. Comparison of the calculated and measured peak cutting forces at different cutting depths.
Jmse 08 00806 g009
Figure 10. Comparison of the calculated and measured peak cutting forces at different rake angles.
Jmse 08 00806 g010
Figure 11. Comparison of the performance of different models in estimating the peak cutting forces in cutting anhydrite.
Jmse 08 00806 g011
Figure 12. Comparison of the performance of different models in estimating the peak cutting forces in cutting limestone.
Jmse 08 00806 g012
Figure 13. Comparison of the performance of different models in estimating the peak cutting forces in cutting granite.
Jmse 08 00806 g013
Figure 14. Comparison of the performance of different models in estimating the peak cutting forces in cutting greywacke.
Jmse 08 00806 g014
Figure 15. Comparisons of the performance of different models in estimating the peak cutting forces in cutting hard rocks.
Jmse 08 00806 g015
Figure 16. Relationship between sidewall effect coefficient and the ratio of cutting width to cutting depth at different rake angles.
Jmse 08 00806 g016
Table 1. Comparison of existing models for rock cutting with chisel picks.
ModelsEstablishmentsParametersAdvantagesDisadvantages
Evanstheoretical model in 2D based on tensile fracture σ t , ϕ , w, d, α strong adaptability and theoretical basis, very easy to apply,underestimate cutting force, 2D model
Nishimatsutheoretical model in 2D based on shear fracture τ 0 , φ , n, w, d, α strong adaptability and theoretical basis, moderate easy to applyprediction accuracy depends on α and n, 2D model
Goktan & Ouyangempirical model in 3D based on experimental results σ c , σ t , w, d, α , ϕ accurate estimation for some kinds of hard rockslack of theoretical support, uncertain adaptability
where: σ t is the tensile strength of rock, ϕ is the friction angle between the chisel pick and rock, w is the cutting width, d is the cutting depth, α is the rake angle, τ 0 is the shear strength of rock, φ is the internal friction angle, n is the stress distribution factor, σ c is the uniaxial compressive strength of rock.
Table 2. Mechanical properties of rock samples.
Rock Samples σ c σ t τ 0 φ ϕ c ϕ s
/MPa/MPa/MPa/deg./deg./deg.
Anhydrite a112.915.4712.54336.421.4
Limestone a127.257.45203732.323.4
Granite a179.1010.77304221.514.9
Greywacke a183.8616.45343323.611.3
Anhydrite 2 b1006.712.54336.421.4
Limestone 2 b2007.8203732.323.4
a from [28], b from [27].
Table 3. Values of root mean square error (RMSE), bias, and R2 for each model in predicting the experimental results in [28].
ModelsFormulasRMSEBiasR2
EvansFormula (6)7.19−5.430.56
NishimatsuFormula (12)9.53−7.970.50
CEITFormula (24)4.56−2.160.74
Publisher’s Note: MDPI stays neutral with regard to jurisdictional claims in published maps and institutional affiliations.

