You are currently viewing a new version of our website. To view the old version click .
Journal of Marine Science and Engineering
  • Article
  • Open Access

10 January 2020

Reliability Analysis of Different Configurations of Master and Back-Up Systems Used in Maritime Navigation

and
1
Department of Mathematics, Faculty of Navigation, Gdynia Maritime University, 81-87 Morska St., 81-225 Gdynia, Poland
2
Department of Navigation, Faculty of Navigation, Gdynia Maritime University, 3 Al. Jana Pawła II St., 81-225 Gdynia, Poland
*
Author to whom correspondence should be addressed.
This article belongs to the Special Issue Maritime Traffic Engineering and International Symposium Information on Ships Conference MTE-ISIS 2019

Abstract

This paper presents a comparison of the reliability of various configurations of electronic navigation appliances, from a single system not duplicated (without back-up) to complex systems built of a master system and different numbers of reserve (back-up) systems. For reliability analysis, we created a model of an electronic navigation system reflecting the influence of the number of reserve systems on the entire system reliability. Navigation systems were analyzed as multistate systems. Assuming that they degrade from the state of full reliability to entire failure, their basic reliability characteristics were determined. We also conducted a comparison of system lifetimes in certain reliability state subsets, for different system configurations depending on the number of back-up systems. Additionally, the relationship between the costs associated with setting up a system with a certain configuration and its mean lifetime in reliability state subsets is shown. We also propose procedures for determining the moment of exceeding the allowed limit of system safety, with the use of reliability functions determined for different configurations of the system. One of the major conclusions arising from the reliability analysis is that setting a navigation system with a certain number of back-up solutions is of key importance to improve the system’s reliability in the initial period of operation, while the number of back-up systems has a minor influence on the overall system lifetime.

1. Introduction

Several types of electronic appliances are used on the navigational bridges of merchant ships. The usage of certain devices and their numbers are derived from International Maritime Organization (IMO) requirements, specified in the 1974 SOLAS Convention. According to the Convention [1], all ships 3000 gross tons or more should be equipped, inter alia, with a receiver for a global navigation satellite system to establish and update the ship’s position by automatic means; a 9 GHz radar to determine and display the range and bearing of other surface craft, obstructions, shorelines, navigational marks, etc.; an electronic plotting aid or other means to electronically plot the range and bearing of targets to determine collision risk; an automatic identification system (AIS); and an electronic chart display and information system (ECDIS) to plan and display the ship’s route for the intended voyage and to plot and monitor positions throughout the voyage.
Certain devices, according to SOLAS [1], are to be duplicated or equipped with a reserve (back-up) system. The following outfit requirements of Regulation 19 of the SOLAS Convention for radar, electronic plotting aid, and ECDIS are an example: a 3 GHz radar or, where considered appropriate by the administration, a second 9 GHz radar to determine and display the range and bearing of other surface craft, obstructions, shorelines, navigational marks, etc.; a second automatic tracking aid or other means to automatically plot the range and bearing of other targets to determine collision risk; and ECDIS back-up arrangements to ensure safe navigation in case of an ECDIS failure for safe navigation of the remaining part of the voyage [2,3].
Back-up (reserve) systems make it possible to ensure reliable and continuous functioning of electronic appliances aboard ships, and consequently to guarantee the appropriate safety of operations conducted. The systems are usually connected in parallel to take over operations processed by the main system in case of failure. It can also be observed that a significant number of shipowners even equip their vessels above applicable requirements, installing more reserve and back-up systems than indicated in the respective regulations. This is done, on the one hand, for ergonomic reasons, to ease access to appliances from different locations in large navigational bridges on big vessels, and, on the other hand, to improve their reliability by ensuring that their performance continues in case of failure.
The above statements, however, result in an obvious question: whether adding a certain number of reserve systems corresponds to a respective increase of system reliability. Therefore, it was considered useful to undertake research to investigate how the number of reserve (back-up) systems (and the associated investment) impacts system reliability. In essence, the paper and the reliability analysis were based on this question. Results in this paper were obtained with use of a general model that was created to match all electronic systems that are supported by reserve (back-up) solutions. The methodology of the reliability analysis can be then applied to any electronic device that is used to support navigation on merchant ships.
The paper is organized as follows. Section 2 includes a review of the literature concerning the reliability analysis of electronic navigation systems. Assumptions made for the multistate approach to reliability are specified in Section 3. The basic reliability characteristics of the single (not duplicated) system are indicated in Section 4. Section 5 describes the reliability analysis of a system consisting of a number of back-up (reserve) systems. A discussion regarding how adding successive reserve systems corresponds to a respective increase in system reliability is covered in Section 6. The paper ends with conclusions in Section 7.

3. Assumptions Made for Reliability Analysis

To conduct a reliability analysis of various configurations of an electronic navigation system, it is assumed that the system consists of four independently operating subsystems forming a series structure: data collection system S1, data processing system S2, data presentation system S3, and user interface S4 (Figure 1) [10].
Figure 1. Reliability structure scheme of an electronic navigation system.
Furthermore, four reliability states of the system and its subsystems were distinguished [11]:
-
State 3, full reliability, meaning the system is fully functional and all of its components are working properly without any disturbances.
-
State 2, partial reliability, representing the situation where some disruptions in system functioning appear, but exploitation parameters are within allowed limits (e.g., position accuracy decreases, but still satisfies respective standards).
-
State 1, task-limited reliability, occurring when disruptions of system functioning cause its exploitation parameters to fall below allowed limits.
-
State 0, entire unreliability, indicating system failure that stops its operation.
In addition, subsystems S1, S2, S3, and S4 have exponential reliability functions [12]. According to Specht [5], typical realizations of the operating time of a navigational system are characterized by exponential distributions. Thus, the exponential reliability function can be applied to express the system lifetime, which can refer to the lifetime of the system in reliability state subsets in case of multistate systems. Similarly, Jiang et al. [9] assumed that some components of failure distribution follow an exponential distribution. The reliability functions of multistate subsystem Si, i = 1, 2, 3, 4, are then given by the vector:
R i ( t , ) = [ 1 , R i ( t , 1 ) , R i ( t , 2 ) , R i ( t , 3 ) ] ,   t 0 ,   i = 1 , 2 , 3 , 4 .
with its coordinates:
R i ( t , u ) = exp [ λ i ( u ) t ] ,   u = 1 , 2 , 3 ,   i = 1 , 2 , 3 , 4 .
Parameters λi (u), u = 1, 2, 3 and i = 1, 2, 3, 4 in Equation (2) represent intensity of departure from subsets of reliability states not worse than the state of u, i.e., {u, u + 1, …, 3}. In a special case where u = 1, λi (1) means failure intensity of subsystems Si, i = 1, 2, 3, 4. Approximate values of intensities λi (u), u = 1, 2, 3, and i = 1, 2, 3, 4 are estimated based on the mean value E [Ti (u)] of lifetimes Ti (u), u = 1, 2, 3 and i = 1, 2, 3, 4 of subsystems in reliability state subsets {u, u + 1, …, 3}, expressed in years. Subsequently, the reliability functions of systems S1 and S4 are:
R i ( t , ) = [ 1 , R i ( t , 1 ) , R i ( t , 2 ) , R i ( t , 3 ) ] , t 0 , i = 1 , 4 .
where
R i ( t , 1 ) = exp [ 0.125 t ] , R i ( t , 2 ) = exp [ 0.167 t ] , R i ( t , 3 ) = exp [ 0.5 t ] ,   i = 1 , 4 .
and the reliability functions of systems S2 and S3 are given by
R i ( t , ) = [ 1 , R i ( t , 1 ) , R i ( t , 2 ) , R i ( t , 3 ) ] ,   t 0 ,   i = 2 , 3 .
where
R i ( t , 1 ) = exp [ 0.1 t ] , R i ( t , 2 ) = exp [ 0.125 t ] , R i ( t , 3 ) = exp [ 0.25 t ] ,   i = 2 , 3 .
Based on the above assumptions (reliability structure of the system, reliability functions of subsystems S1 to S4) the reliability function of the whole system can be determined, and its basic characteristics, mean times and their standard deviations of system stay in designated subsets of reliability states, and mean times of the system stay in particular reliability states. By adopting a certain permissible (limited) value of reliability, it is possible to identify the moment of exceeding a specified limit of system reliability, or, more precisely, to determine the moment at which the probability of the system staying in a state above the permissible one exceeds the adopted level.

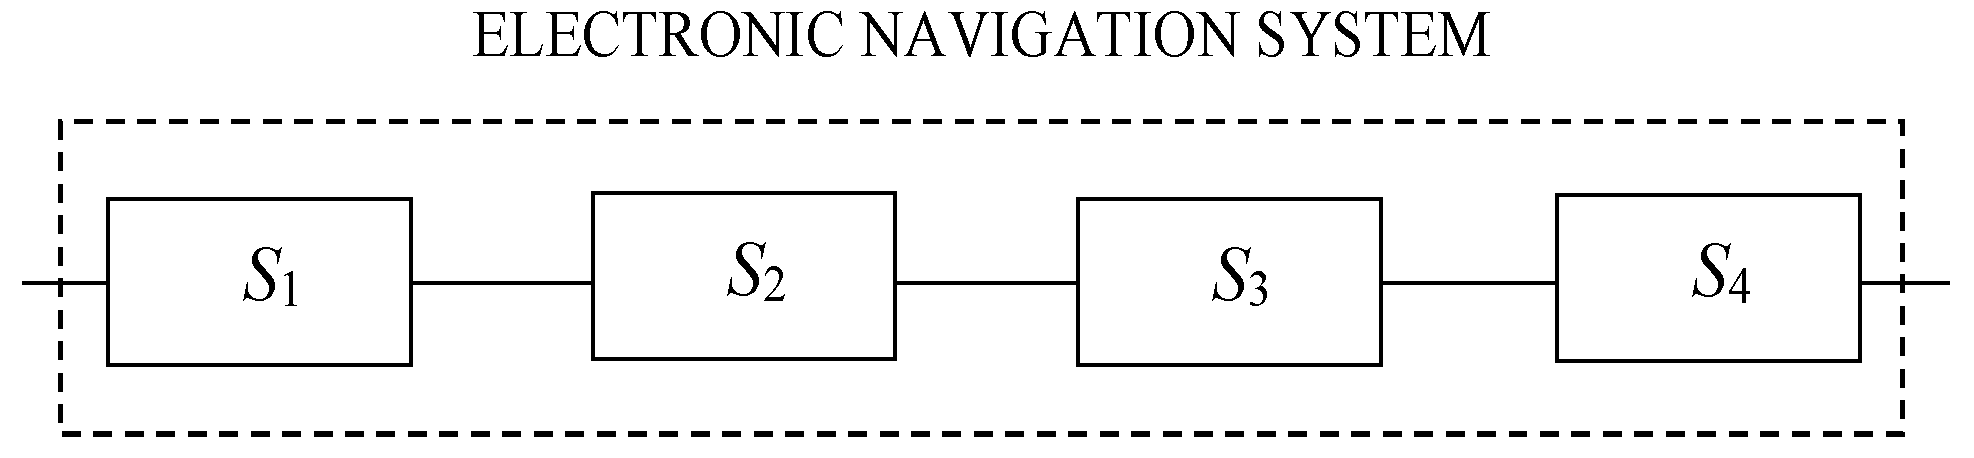
4. Reliability Analysis of Single Electronic Navigation System

Assuming that the navigation system is a multistate series system and S1, S2, S3, S4 have exponential reliability functions (3)–(6), the reliability function of the single master navigation system is [10]:
R S M ( t , ) = [ 1 , R S M ( t , 1 ) , R S M ( t , 2 ) , R S M ( t , 3 ) ] ,   t 0 ,
where
R S M ( t , 1 ) = exp [ 0.45 t ] , R S M ( t , 2 ) = exp [ 0.58 t ] , R S M ( t , 3 ) = exp [ 1.5 t ] .
From Equation (8) we conclude that the intensities of the system departure from reliability state subsets {1, 2, 3}, {2, 3}, {3} are respectively given by:
λ S M ( 1 ) = 0.45     h 1 ,   λ S M ( 2 ) = 0.58     h 1 ,   λ S M ( 3 ) = 1.5     h 1 .
The intensity values specified by Equation (9) will be used in further analysis of the navigation system with a number of backup systems.
The mean lifetimes and standard deviations of a single master navigation system in reliability state subsets {1, 2, 3}, {2, 3}, {3} with use of formulas given in [13,14], counted in years, are:
μ S M ( 1 ) 2.22 ,   σ S M ( 1 ) 2.22 ,   μ S M ( 2 ) 1.71 ,   σ S M ( 2 ) 1.71 ,   μ S M ( 3 ) 0.67 ,   σ S M ( 3 ) 0.67 ,
and their mean values in reliability states 1, 2, 3 calculated using Equation (10), in years, are, respectively:
μ ¯ S M ( 1 ) = μ S M ( 1 ) μ S M ( 2 ) 0.51 ,   μ ¯ S M ( 2 ) = μ S M ( 2 ) μ S M ( 3 ) 1.04 ,   μ ¯ S M ( 3 ) = μ S M ( 3 ) 0.67 .
The mean lifetime µSM (1) of a system in reliability state subset {1, 2, 3} means the time system stays in either reliability state 1, 2, or 3 (full or partial reliability), and thus is equal to the time to system failure in the case of a two-state approach to system analysis. The mean lifetime µSM (2) of the system in reliability state subset {2, 3} means the time the system is in reliability state 2 or 3. The mean lifetime µSM (3) of the system in state 3 means the time the system is in full reliability state (before transitioning to partial reliability).

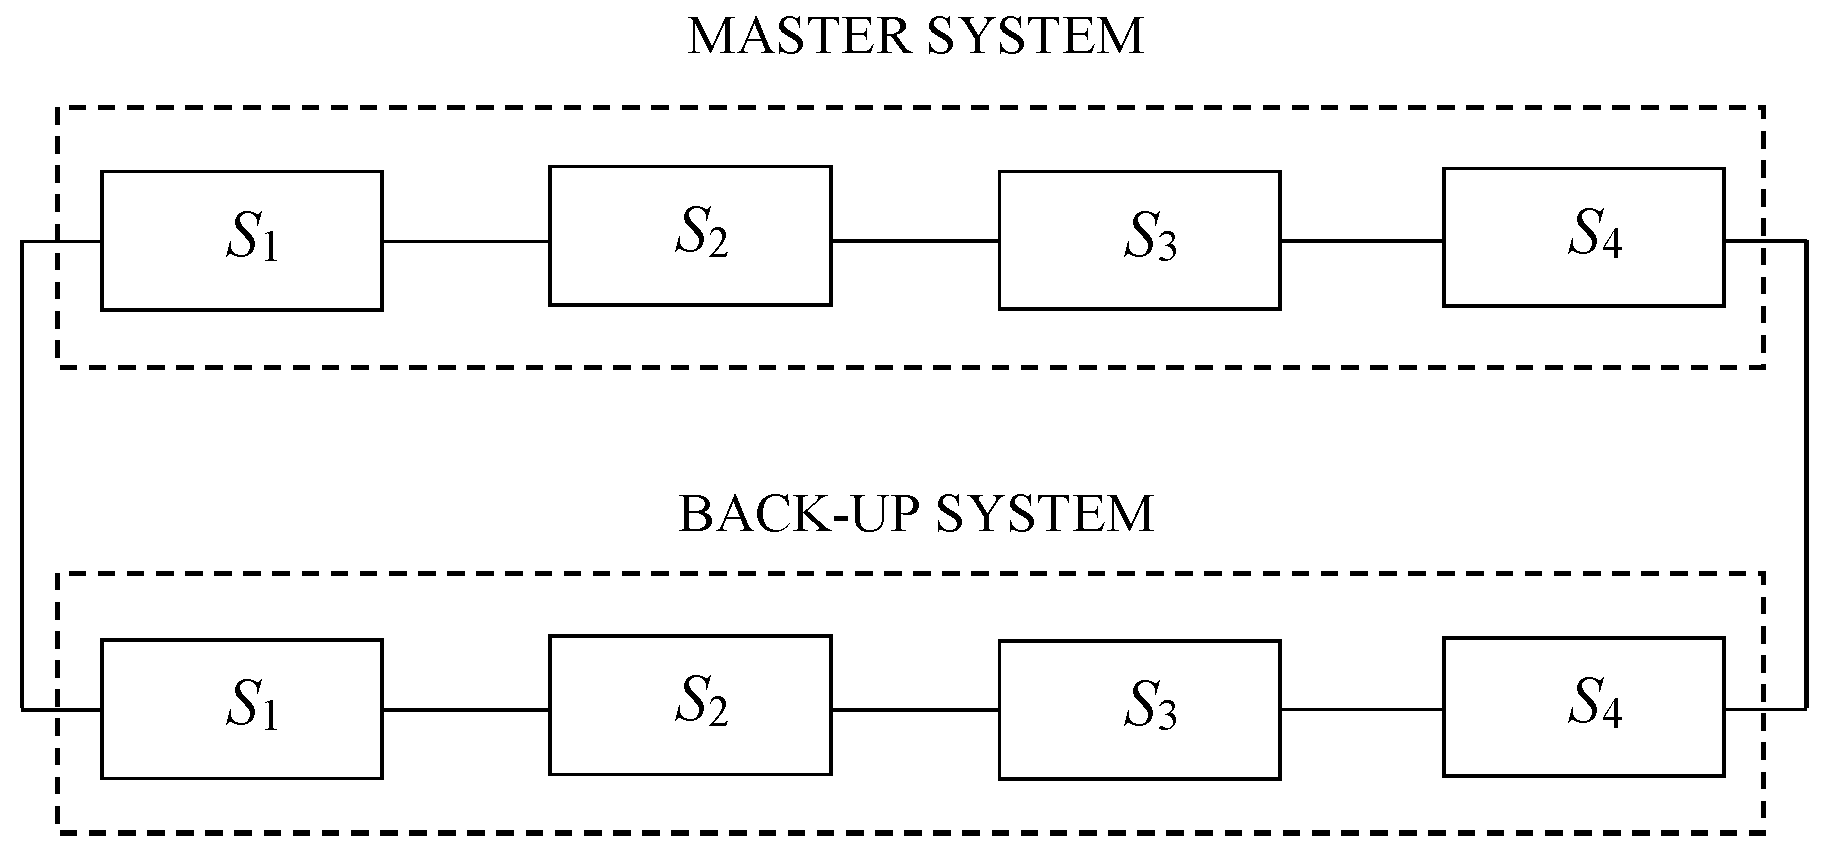
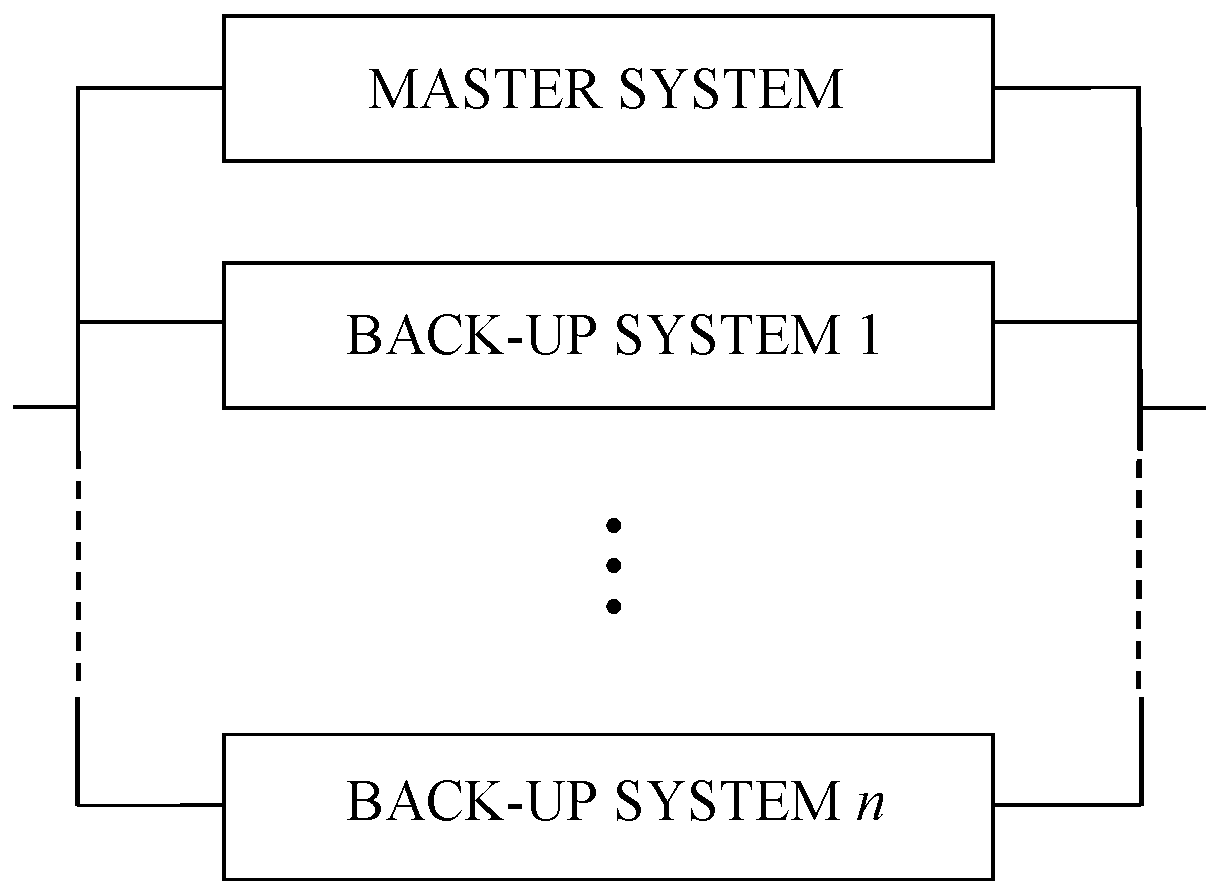
5. Reliability Analysis of a System Duplicated with a Number of Back-Up Systems
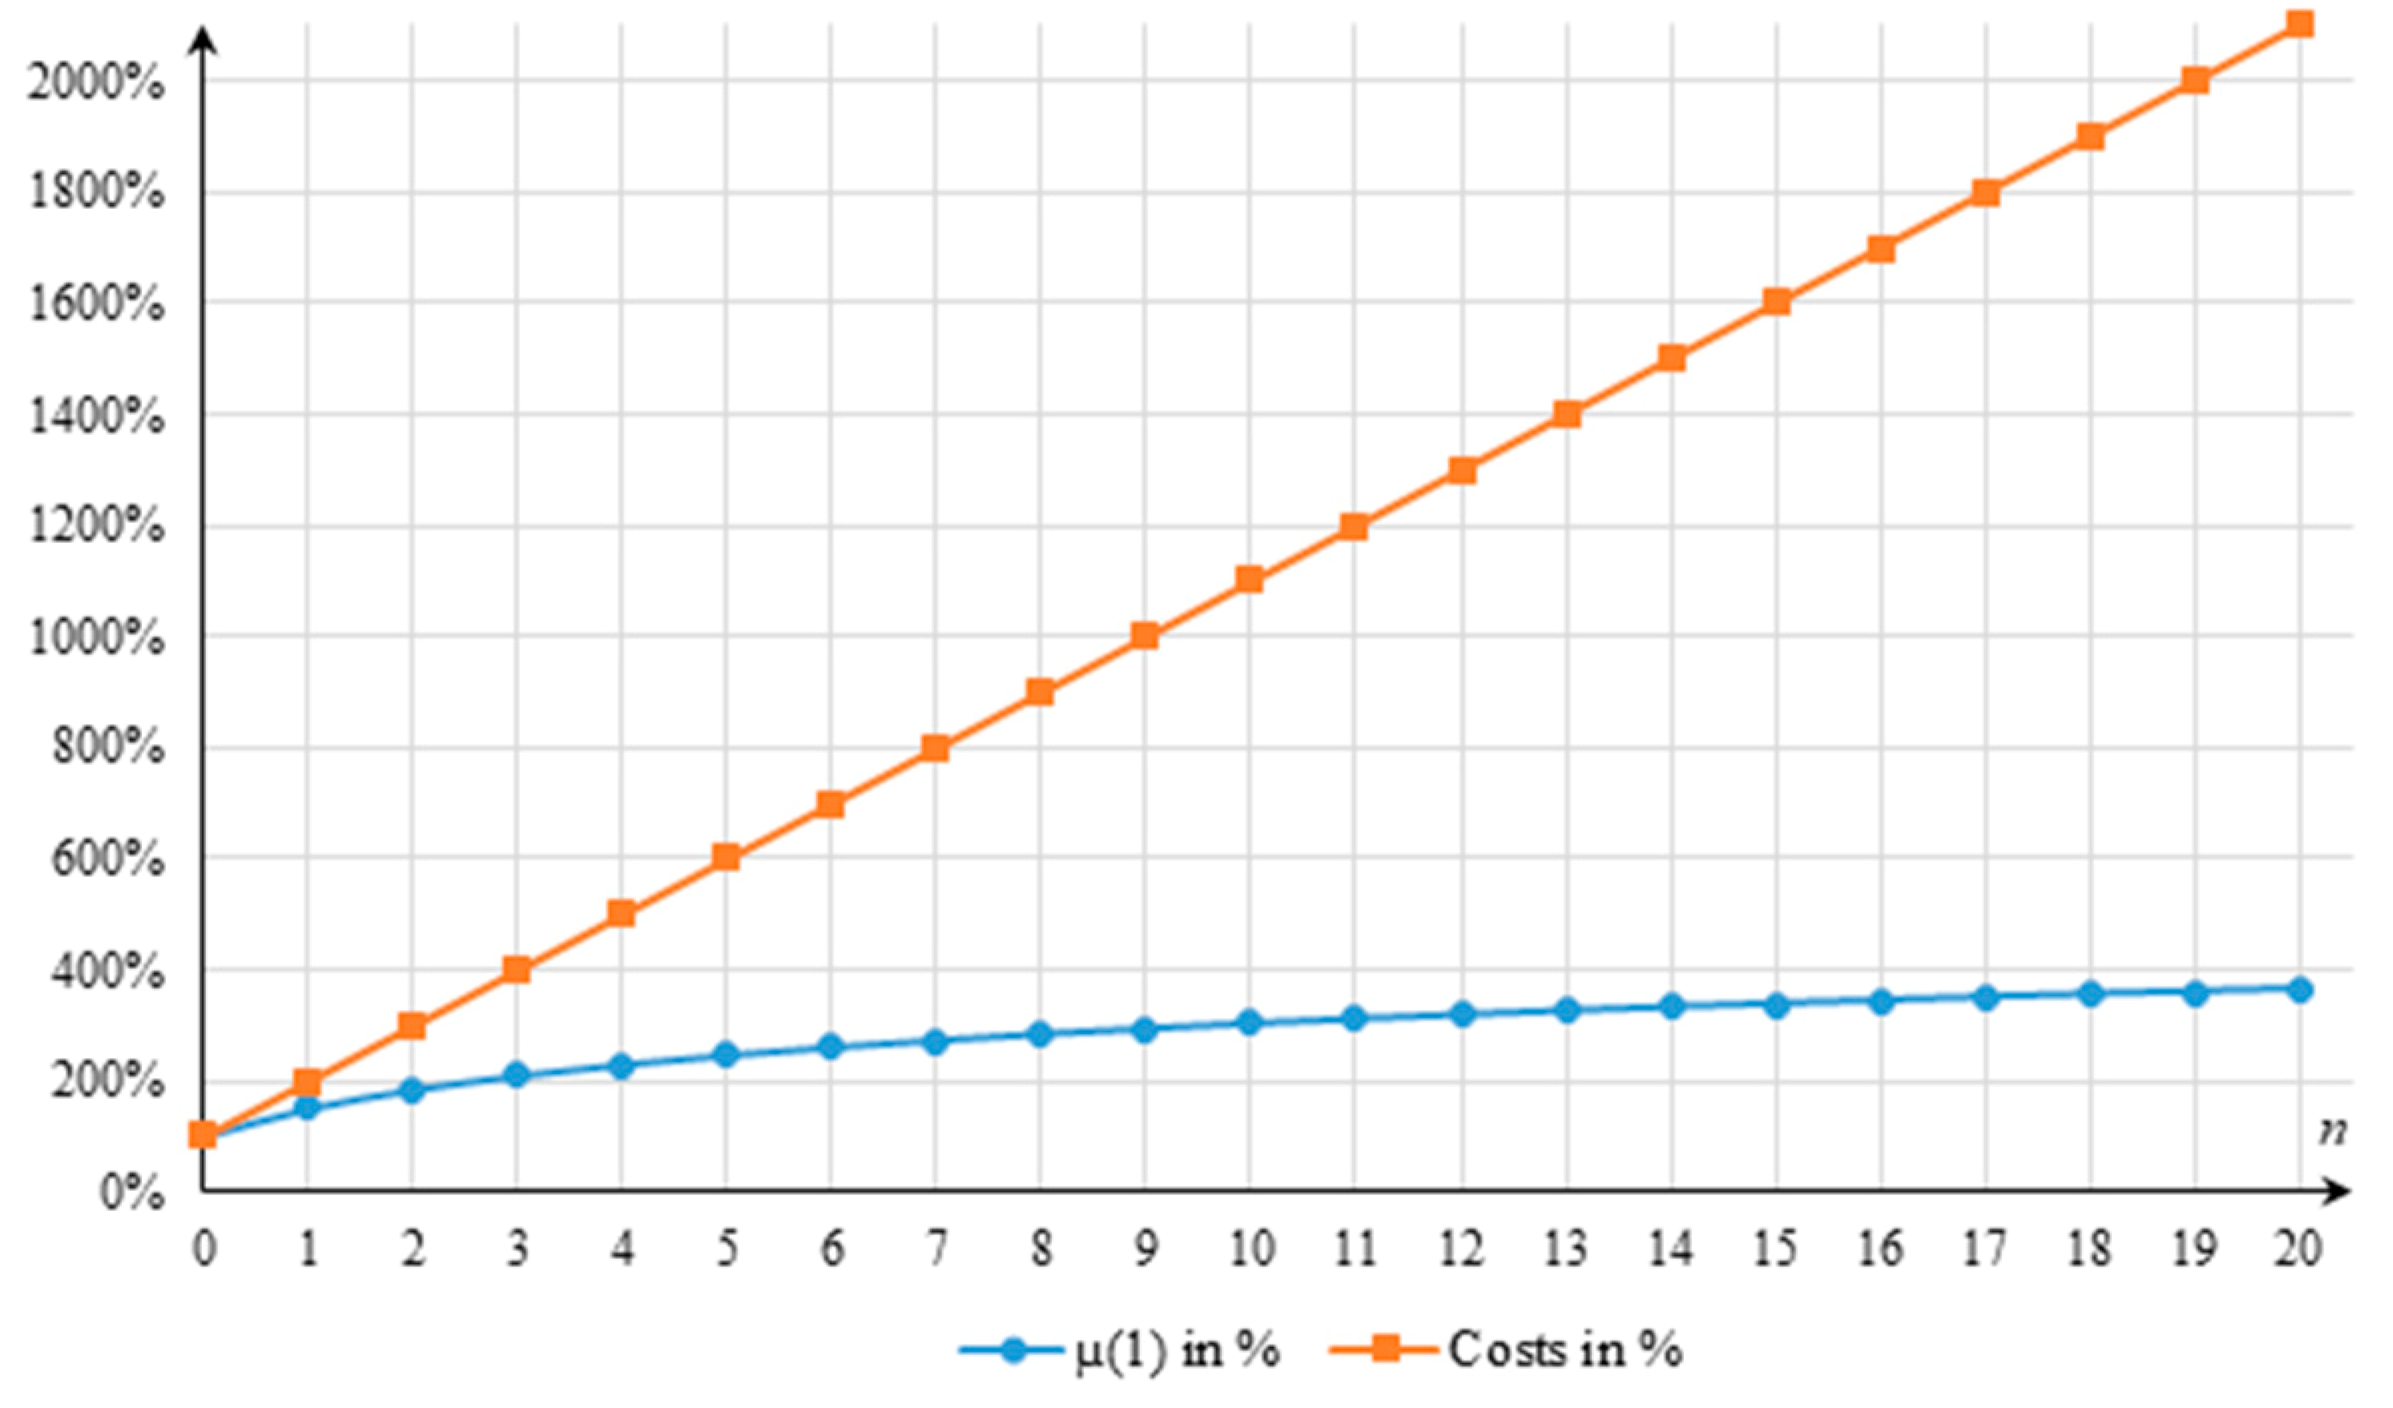
The reliability structure of an electronic navigation system duplicated with one identical back-up system connected in parallel is shown in Figure 2. The reliability of an electronic navigation system composed of two individual independent ECDIS systems was also analyzed in [15].
Figure 2. Reliability structure scheme of navigation system with one back-up system.
The reliability function of a master system with a single back-up is given by:
R S B 1 ( t , ) = [ 1 , R S B 1 ( t , 1 ) , R S B 1 ( t , 2 ) , R S B 1 ( t , 3 ) ] ,   t 0 ,
with the coordinates given by:
R S B 1 ( t , u ) = 1 [ 1 exp [ λ S M ( u ) t ] ] 2 ,   t 0 , u = 1 , 2 , 3 ,
where values of intensity λSM (u), u = 1, 2, 3 are determined by Equation (9). Substituting these values into Equation (13), we get
R S B 1 ( t , 1 ) = 1 [ 1 exp [ 0.45 t ] ] 2 ,   R S B 1 ( t , 2 ) = 1 [ 1 exp [ 0.58 t ] ] 2 ,   R S B 1 ( t , 3 ) = 1 [ 1 exp [ 1.5 t ] ] 2 ,   t 0 .
Next, based on formulas from [13,14] and using the coordinates of a reliability function given by Equation (14), the mean lifetimes of the navigation system in subsets {1, 2, 3}, {2, 3}, {3} are, respectively:
μ S B 1 ( 1 ) = 0 R S B 1 ( t , 1 ) d t = 0 1 [ 1 exp [ 0.45 t ] ] 2 d t 3.33   y e a r s ,
μ S B 1 ( 2 ) = 0 R S B 1 ( t , 2 ) d t = 0 1 [ 1 exp [ 0.58 t ] ] 2 d t 2.59   y e a r s ,
μ S B 1 ( 3 ) = 0 R S B 1 ( t , 3 ) d t = 0 1 [ 1 exp [ 1.5 t ] ] 2 d t 0.74   y e a r .
Similarly, we determine the standard deviations of the navigation system in subsets {1, 2, 3}, {2, 3}, {3} by using the coordinates of the reliability function given by Equation (14) and values of mean lifetimes in Equations (15)–(17) according to the following formulas:
  σ S B 1 ( 1 ) = 2 0 t R S B 1 ( t , 1 ) d t [ μ S B 1 ( 1 ) ] 2 = 2 0 t t [ 1 exp [ 0.45 t ] ] 2 d t [ μ S B 1 ( 1 ) ] 2 2.48   y e a r s ,
σ S B 1 ( 2 ) = 2 0 t R S B 1 ( t , 2 ) d t [ μ S B 1 ( 2 ) ] 2 = 2 0 t t [ 1 exp [ 0.58 t ] ] 2 d t [ μ S B 1 ( 2 ) ] 2 1.91   y e a r s ,
σ S B 1 ( 3 ) = 2 0 t R S B 1 ( t , 3 ) d t [ μ S B 1 ( 3 ) ] 2 = 2 0 t t [ 1 exp [ 1.5 t ] ] 2 d t [ μ S B 1 ( 3 ) ] 2 0.74   y e a r .
The mean values of system lifetime in reliability states 1, 2, 3, in years, by Equations (15)–(17), are respectively:
μ ¯ S B 1 ( 1 ) = μ S B 1 ( 1 ) μ S B 1 ( 2 ) 0.76 , μ ¯ S B 1 ( 2 ) = μ S B 1 ( 2 ) μ S B 1 ( 3 ) 1.57 ,   μ ¯ S B 1 ( 3 ) = μ S B 1 ( 3 ) 1.00 .
To analyze the reliability of the system duplicated with more than one back-up solution, we consider, in general, a system composed of a master system and n, n ≥ 1, (n = 1, 2, …) back-up systems (Figure 3).
Figure 3. Reliability structure scheme of navigation system with n back-up systems.
We assume n ≥ 1, because the navigation system with at least one back-up system is analyzed. In case of n = 0, the system consists of only a single navigation system, as described earlier.
The reliability function of a master system with n, n ≥ 1 backup systems linked in a parallel reliability structure (Figure 3) is given as follows:
R S B n ( t , ) = [ 1 , R S B n ( t , 1 ) , R S B n ( t , 2 ) , R S B n ( t , 3 ) ] , t 0 ,
with the coordinates determined by
R S B n ( t , u ) = 1 [ 1 exp [ λ S M ( u ) t ] ] n + 1 ,   t 0 , u = 1 , 2 , 3 ,
where values of intensity λSM (u), u = 1, 2, 3 are given by Equation (9). Equation (23), by substituting these values, takes following form:
R S B n ( t , 1 ) = 1 [ 1 exp [ 0.45 t ] ] n + 1 ,   R S B n ( t , 2 ) = 1 [ 1 exp [ 0.58 t ] ] n + 1 ,   R S B n ( t , 3 ) = 1 [ 1 exp [ 1.5 t ] ] n + 1 ,   t 0 .
The mean lifetimes in reliability state subsets of a navigation system with n, n ≥ 1 backup systems are determined according to the following formula [13]:
μ S B n ( u ) = 0 R S B n ( t , u ) d t ,   u = 1 , 2 , 3 ,
where the coordinates are given by Equation (23). By determining this integral we get
μ S B n ( u ) = 0 1 [ 1 exp [ λ S M ( u ) t ] ] n + 1 d t = 0 1 k = 0 n + 1 ( 1 ) k ( n + 1 k ) exp [ k λ S M ( u ) t ] d t = 0 1 1 k = 1 n + 1 ( 1 ) k ( n + 1 k ) exp [ k λ S M ( u ) t ] d t = k = 1 n + 1 ( 1 ) k 1 ( n + 1 k ) 0 exp [ k λ S M ( u ) t ] d t = k = 1 n + 1 ( 1 ) k 1 ( n + 1 k ) [ exp [ k λ S M ( u ) t ] k λ S M ( u ) ] 0 = k = 1 n + 1 ( 1 ) k 1 ( n + 1 k ) 1 k λ S M ( u ) ,   u = 1 , 2 , 3 .
For example, the mean lifetimes in subsets {1, 2, 3}, {2, 3}, {3} of a navigation system with one (n = 1) back-up system using Equation (26) are:
μ S B n ( 1 ) = 3 2 λ S M ( 1 ) ,   μ S B n ( 2 ) = 3 2 λ S M ( 2 ) ,   μ S B n ( 3 ) = 3 2 λ S M ( 3 ) ,
For values of intensity determined by Equation (9), we get the same result as in Equations (15)–(17).
Further, substituting values of intensity λSM (u), u = 1, 2, 3 given by Equation (9) into Equation (26), we get mean lifetimes in subsets {1, 2, 3}, {2, 3}, {3} of a navigation system with n, n ≥ 1 backup systems:
μ S B n ( 1 ) = k = 1 n + 1 ( 1 ) k 1 ( n + 1 k ) 1 0.45 k ,   μ S B n ( 2 ) = k = 1 n + 1 ( 1 ) k 1 ( n + 1 k ) 1 0.58 k ,   μ S B n ( 3 ) = k = 1 n + 1 ( 1 ) k 1 ( n + 1 k ) 1 1.5 k ,   n 1 .
Table 1 shows values determined for n ranging from 0 to 10 backup systems of mean lifetimes for µ (1) in subset {1, 2, 3}, µ (2) in subset {2, 3}, and µ (3) in subset {3} of the system reliability states, and their percentage increases.
Table 1. Comparison of lifetimes for different system configurations depending on number of backup systems.

6. Discussion

Assuming the cost of the master system and each back-up system is equivalent, we can compare the differences in the cost of various configurations of the navigation system to the differences in their mean lifetime in reliability state subsets of the configurations and, in particular, to the differences in mean time to failure. Figure 4 presents this comparison for back-up systems increasing from 1 to 20.
Figure 4. Increased time to system failure µ (1) related to increased cost associated with enlarging the system with more back-up systems.
The reliability function coordinate R (t, 1) for a navigation system in various configurations, i.e., single master system and master system with one, two, and three back-up systems, is illustrated in Figure 5.
Figure 5. Graph of reliability function coordinate R (t, 1) for a navigation system in various configurations.
The values of coordinate R (t, 1) of the reliability function determine the probability of the system staying at subset {1, 2, 3} of the reliability states at moment t, under the assumption that it was at full reliability state (state 3) at t = 0. Thus, assuming a certain limit value of the coordinate, meaning the probability that the system stays at full or partial reliability state {1, 2, 3}, the moment at which the probability limit value is exceeded can be determined [13,16]. For example, for a limit of 80%, meaning the coordinate of the reliability function level R (t, 1) = 0.8, the moment when the limit is exceeded is as follows:
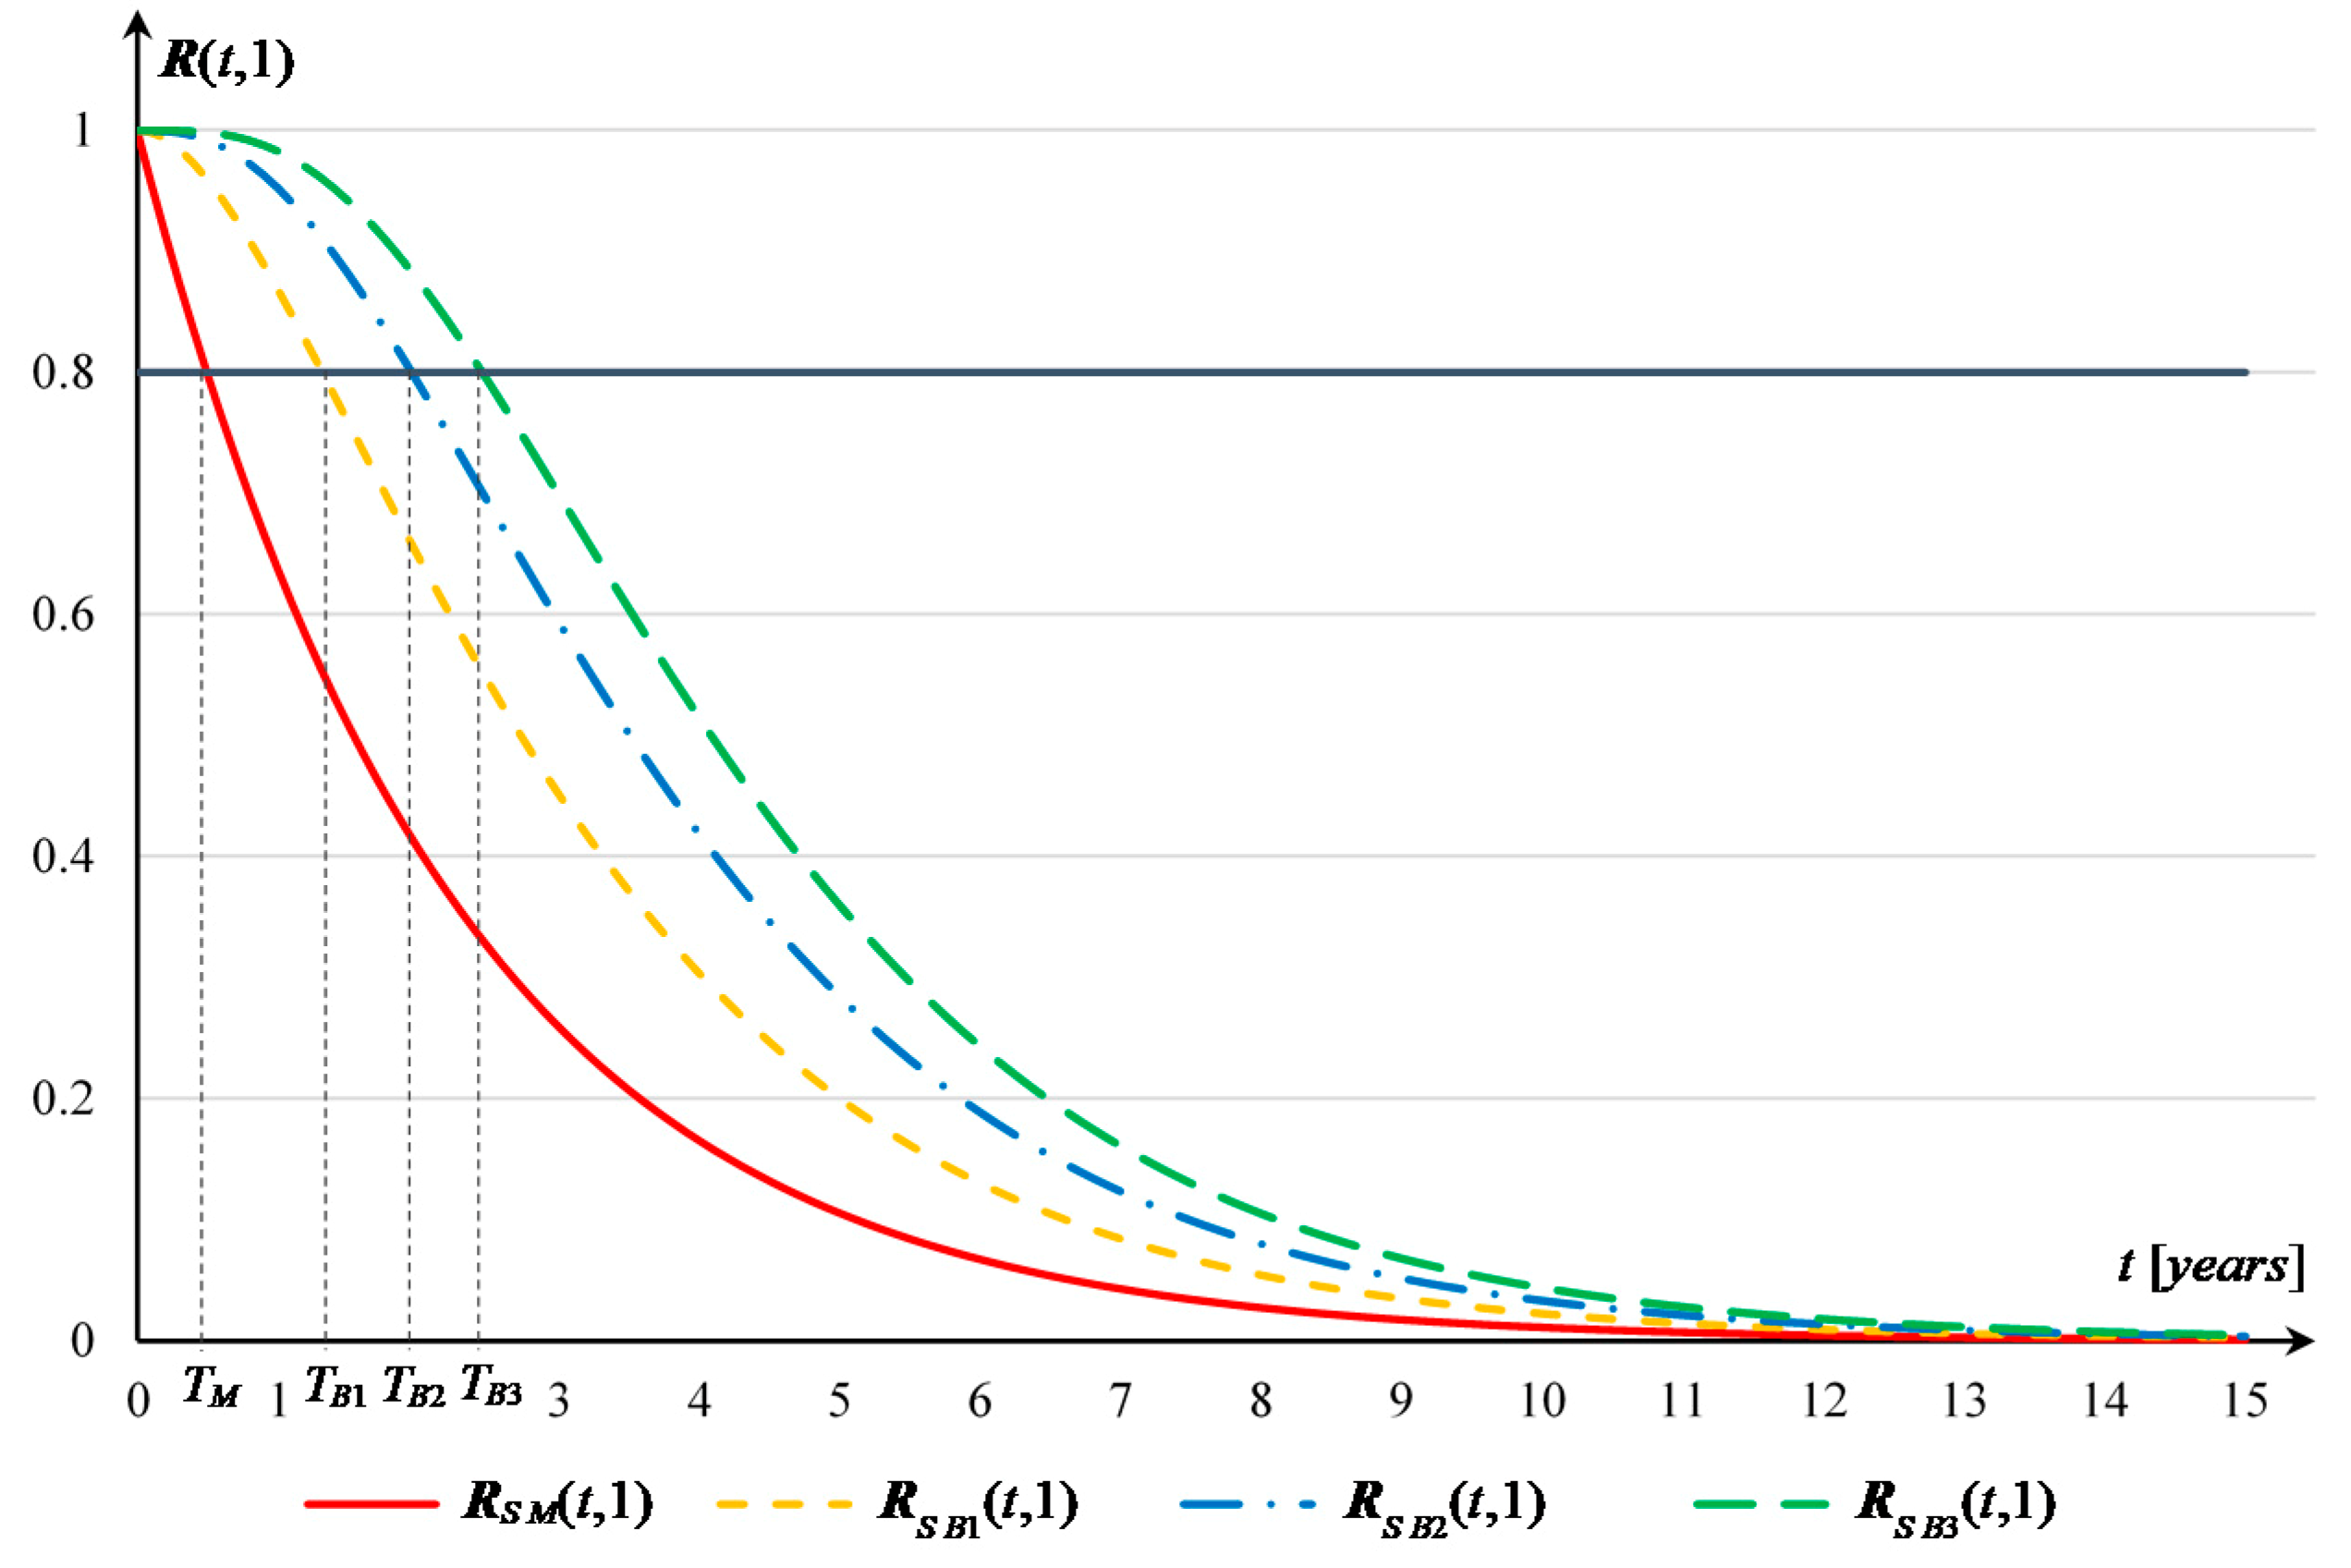
  • For the single electronic navigation system TM (1) = 0.5 years
  • For the system duplicated with one backup system TB1 (1) = 1.32 years
  • For the system with two backup systems TB2 (1) = 1.96 years
  • For the system with three backup systems TB3 (1) = 2.46 years
Figure 5 shows a graph of the above values.
It can be concluded, based on the results given in Table 1, Table 2 and Table 3, how the number of back-up systems influences the reliability of the entire navigation system. One of the major outcomes is that each additional back-up system significantly improves the system’s reliability at the initial stage of operation. For example, the reliability function coordinate R (t, 1) of a navigation system with one back-up exceeds the 95% threshold after a period around five times longer than that of a single system. The difference decreases over time, however; the moment of exceeding the 85% threshold by the reliability function coordinate R (t, 1) for a system with one back-up is still three times longer compared to a single system. For the 60% threshold, it is exceeded by coordinate R (t, 1) at 2.23 years for a system with one back-up, about twice as long as that of a single system, which is 1.14 years. Similarly, a significant improvement in reliability at the initial stage of system operation is provided by adding further back-up systems, and this difference decreases over time, as can be seen in the results presented in Table 2. By comparing these results to the mean lifetimes of the system staying in subsets of reliability states, for different configurations of the navigation system shown in Table 1, it can be seen that the differences are much less significant. Hence, we can conclude that configuring the navigation system with a certain number of back-up systems is important if the system’s reliability for a short period or the overall system lifetime is required.
Table 2. Comparison of moments of exceeding the level of reliability function coordinate R (t, 1) for different system configurations depending on the number of back-up systems.
Table 3. Comparison of moments of exceeding the level of reliability function coordinate R (t, 3) for different system configurations depending on the number of back-up systems.
Similarly, by means of coordinate R (t, 3) of the reliability function determining the probability of the system staying at the state of full reliability at moment t, the moment when the probability goes below 80% can be denoted. Thus, it can be determined that for the single electronic navigation system TM (3) = 0.15 year, for the system duplicated with one back-up TB1 (3) = 0.4 year, for the system with two back-up systems TB2 (3) = 0.59 year, and for the system with three backup systems TB3 (3) = 0.74 year. Table 3 presents a comparison of moments when the reliability function coordinate R (t, 3) exceeds thresholds ranging from 95% to 60%.

7. Conclusions

The results of studies performed with different configurations of electronic navigation systems (various numbers of backup systems) reviewed in this paper allow us to evaluate relationships between whole system reliability and costs incurred to build systems with specified configurations. More particularly, mean time to failure and mean time of system staying at particular subsets of reliability states were compared to the costs incurred for setting up the system including different numbers of back-up subsystems. Computations allow us to point to certain findings. It is easy to distinguish that increased reliability (i.e., time to system failure) with the use of more than two back-up systems has a disproportionately low relationship (Figure 4) with costs associated with building a system with a particular number of back-up subsystems. Table 1 indicates that mean time of the system staying at a subset of reliability states obtained with the use of three back-up systems is double that of a single system, while the time triples with the use of 10 back-up systems.
It can then be concluded that excessive development of the system with more back-up subsystems is not an appropriate direction, as it does not result in a respective increase of reliability parameters. It seems more useful to concentrate on improving the reliability of particular subsystems, rather than adding more back-up subsystems with lower reliability. The use of a so-called cold reserve system could be considered, as proposed by Sumic et al. [8].
In addition, it was pointed out that each additional backup system significantly improves the system’s reliability at the initial stage of its operation, and has less impact on its operation over the long term. A detailed comparison in this regard is presented in Section 6.
Studies reviewed in this paper do not take into account renovations of the system or its subsystems, meaning eventual repairs taking place in case of failure or services improving system reliability during its use. The renovations, depending on implemented procedures, can be performed at scheduled times, or upon exceeding certain levels of system reliability. An analysis of system availability taking into account such renovation activities will be the subject of further research.

Author Contributions

Conceptualization, P.D.; methodology, A.B.; formal analysis, A.B.; investigation, P.D.; writing—original draft preparation, A.B. and P.D.; writing—review and editing, A.B. and P.D. All authors have read and agreed to the published version of the manuscript.

Funding

This research received no external funding.

Conflicts of Interest

The authors declare no conflict of interest.

References

  1. IMO. International Convention for the Safety of Life at Sea, 1974; International Maritime Organisation: London, UK, 2014.
  2. Čolak, M.; Toman, I.; Bielić, T. Current Electronic Chart Display and Information Systems (ECDIS) in Use. In Proceedings of the 7th International Maritime Science Conference, Sorlin, Croatia, 20–21 April 2017; pp. 474–480. [Google Scholar]
  3. Weintrit, A. The Electronic Chart Display and Information System (ECDIS): An Operational Handbook, 1st ed.; CRC Press: Boca Raton, FL, USA; Taylor & Francis Group: London, UK, 2009. [Google Scholar]
  4. IALA. Guide to the Availability and Reliability of Aids to Navigation; International Association of Lighthouse and Aids to Navigation Authorities: Saint-Germain-en-Laye, France, 1989. [Google Scholar]
  5. Specht, C. Availability, Reliability and Continuity Model of Differential GPS Transmission. Annu. Navig. 2003, 5, 85. [Google Scholar]
  6. Jaskólski, K. Application of Markov Chains to Analyse the AIS Availability. Annu. Navig. 2011, 18, 5–16. [Google Scholar]
  7. Paś, J.; Rosiński, A. Selected issues regarding the reliability-operational assessment of electronic transport systems with regard to electromagnetic interference. Eksploat. Niezawodn. Maint. Reliab. 2017, 19, 375–381. [Google Scholar] [CrossRef]
  8. Sumic, D.; Perakovic, D.; Jurcevic, M. Contribution to ECDIS reliability using Markov Model. Trans. Marit. Sci. 2014, 3, 149–157. [Google Scholar] [CrossRef]
  9. Jiang, X.; Duan, F.; Tian, H.; Wei, X. Optimization of reliability centred predictive maintenance scheme for inertial navigation system. Reliab. Eng. Syst. Safe 2015, 140, 208–217. [Google Scholar] [CrossRef]
  10. Blokus-Roszkowska, A. Availability Analysis of Transport Navigation System under Imperfect Repair. In Contemporary Complex Systems and Their Dependability, Proceedings of the Thirteenth International Conference on Dependability and Complex Systems DepCoS-RELCOMEX 2018; Advances in Intelligent Systems and Computing Volume 761; Zamojski, W., Mazurkiewicz, J., Sugier, J., Walkowiak, T., Kacprzyk, J., Eds.; Springer: Cham, Switzerland, 2019; pp. 35–45. [Google Scholar]
  11. Weintrit, A.; Dziula, P.; Siergiejczyk, M.; Rosiński, A. Reliability and Exploitation Analysis of Navigational System Consisting of ECDIS and ECDIS Back-up Systems. In Activities in Navigation. Marine Navigation and Safety of Sea Transportation; Weintrit, A., Ed.; CRC Press/Balkema: Leiden, The Netherlands, 2015; pp. 109–115. [Google Scholar]
  12. Dziula, P.; Kołowrocki, K. Modelling the operation process of Global Baltic Network of Critical Infrastructure Networks. In Safety and Reliability, Theory and Applications: ESREL 2017; Cepin, M., Bris, R., Eds.; CRC Press/Balkema: London, UK, 2017; pp. 2445–2451. [Google Scholar]
  13. Kołowrocki, K. Reliability of Large and Complex Systems, 2nd ed.; Elsevier: London, UK, 2014. [Google Scholar]
  14. Kołowrocki, K.; Soszyńska-Budny, J. Reliability and Safety of Complex Technical Systems and Processes: Modeling—Identification—Prediction—Optimization, 1st ed.; Springer: London, UK, 2011. [Google Scholar]
  15. Bakalar, G.; Baggini, M.B. Bridge officers’ operational experiences with electronic chart display and information systems on ships. Pomor. Zb. 2016, 52, 49–61. [Google Scholar] [CrossRef]
  16. Blokus-Roszkowska, A.; Kołowrocki, K. Reliability analysis of ship-rope transporter with dependent components. In Safety and Reliability: Methodology and Applications, Proceedings of the European Safety and Reliability Conference, ESREL 2014, Wroclaw, Poland, 14–18 September 2014; Nowakowski, T., Młyńczak, M., Jodejko-Pietruczuk, A., Werbińska-Wojciechowska, S., Eds.; Taylor & Francis Group: London, UK, 2015; pp. 255–263. [Google Scholar]

Article Metrics

Citations

Article Access Statistics

Multiple requests from the same IP address are counted as one view.