1. Introduction
Despite considerable technological advances and great practical experience gained in recent years in the wave energy conversion field, the numerical modeling task is still a topic of debate, with different opinions and approaches. This is certified, for example, by the increasing interest in extensive collaborative projects, comparing a vast variety of modeling approaches, as in [
1,
2]. The selection of a given model greatly depends on the device working principle and the objective the model purports to achieve. Among oscillating bodies, the most common and promising wave energy converter (WEC) concepts are pitching bodies [
3,
4,
5,
6,
7] and axisymmetric buoys [
8,
9,
10]. A necessary condition for a WEC success is economic competitiveness and industrial sustainability, which are goals tightly linked to the ability to predict, with opportune accuracy, motion response and structural loads [
11,
12,
13]. Therefore, appropriate mathematical models must be identified to assist with both design and development stages.
Different WEC concepts require different modeling approaches: Conversely to pitching platforms, which are usually dominated by diffraction forces, small axisymmetric devices are mainly excited by Froude–Krylov (FK) forces [
14]. Therefore, for such devices the inclusion of nonlinear Froude–Krylov (NLFK) forces is particularly beneficial, with significant impact on motion prediction, power production assessment [
15] and effectiveness of active control strategies [
16]. The NLFK modeling approach has been widely validated in the literature, showing an improved accuracy with respect to linear models when compared to experimental data [
17,
18,
19]. The computation of NLFK forces, which is the integration of the incident pressure field onto the time-varying instantaneous wetted surface of the floater, generally requires a mesh-based approach, which adds a high computational burden [
17,
20]. However, the symmetry about an axis of revolution can be exploited to define a much faster meshless approach [
21].
In the NLFK modeling approach, diffraction and radiation effects are assumed to be small and linear, based on the assumption that the characteristic dimension of the device is significantly smaller than the wavelength. In fact, including such non-linearities would require weakly nonlinear potential flow models, such as [
22,
23], or fully nonlinear potential flow models, such as [
24,
25], which would produce a significant increase in complexity and computational burden with little improvement in accuracy. Consequently, such models realize a pair of accuracy-computational times not suitable for the parametric studies object of this paper. Similarly, fully nonlinear models based on Navier–Stokes equations [
26], although virtually achieving the highest accuracy, cannot be used for extensive design studies due to their prohibitive computational time, but are best for verification of the final design.
Models used for the design and control of WECs usually consider long-crested unidirectional waves, which excite the floater only in the vertical plane parallel to the direction of propagation. Consequently, up to 3-degrees of freedom (DoF) models are commonly employed, namely describing the motion in surge, heave, and pitch. However, under certain conditions, particularly when the wave frequency is about twice the natural frequency of the pitch or roll modes, the phenomenon of parametric resonance can be triggered. This phenomenon introduces a nonlinear coupling between heave and pitch/roll DoF, effectively diverting part of the incoming energy away from the externally-excited 3 DoF [
27]. Furthermore, when roll is excited, sway is also affected due to the coupling between these modes. Finally, nonlinear kinematics and eventual mooring systems can couple the combined pitch and roll motion with yaw. Therefore, the consequent motion affects all modes, and only a 6-DoF model is able to describe such a complex dynamics. Moreover, since parametric excitation depends on time-varying parameters of the system, it can be appreciated by NLFK models [
28]. Note that the occurrence of parametric resonance can be established a priori with some degree of approximation, since it can be defined as a Mathieu-type instability problem [
29]. However, such an approach does not determine the severity of the parametric response, so it cannot be used to estimate the induced loads and effects on the performance of the converter.
Parametric resonance is detrimental for power production and it can potentially induce higher mooring loads that can hinder the survivability of the device [
28,
30,
31]. A correct prediction of the response of the device is fundamental for an appropriate estimate of mooring loads, which defines the physical properties of the mooring lines and, ultimately, their cost. Note that the mooring system represents a significant part of the overall capital expenditure, so a parsimonious design is essential for achieving economic viability [
32]. Conversely, failures of the mooring system could potentially require long production halts for maintenance or, in extreme cases, cause device damage or even loss. In fact, the mooring problem for wave energy converters is a central part of the WetFeet project [
33], recognized as crucial for successful development. In particular, Ref. [
34] considers different configurations of non-rigid inter-moored devices, taking the spar-buoy as the case study, and demonstrates that sharing components (in order to reduce costs) has important implications on survivability, performance, environment, and sea-state utilization.
Since parametric resonance and mooring loads are mutually influencing, the mooring system can be effectively exploited as an additional degree of freedom for the WEC developer: The configuration of the mooring lines can be optimized to limit the effect of parametric instability, while being compliant with the main power production objective [
35]. For example, [
28,
36] show how the magnitude of the parametric response is affected by the stiffness of the system, which can be modified by appropriate mooring design. Note that the stiffness could also be modified by active tuning of some of the system parameters or by control strategies.
Finally, it is clear that a nonlinear model able to articulate parametric resonance is essential for verification of mooring loads and power extraction. However, only a fast model can also be used as a tool for design and optimization of the mooring system. The nonlinear model proposed in this paper implements a computationally efficient NLFK approach which is able to compute almost in real time and assess parametric resonance. The ability to detect parametric instability at a higher computational speed is the main novelty of the proposed meshless model, compared to other mesh-based NLFK models, such as [
17,
20,
28]. Thanks to such a computational advantage, it is possible to perform a refined and extensive study of the sensitivity to significant parameters and explore a vast design space. This model is therefore used to investigate different mooring configurations for a floating oscillating water column (OWC), the spar-buoy OWC device [
10], which is renowned to be prone to parametric resonance.
The reminder of the paper is organized as follows:
Section 2 provides full details about the device configuration and mathematical modeling, focusing on the nonlinear kinematics in the equation of motion (
Section 2.1), on the NLFK model (
Section 2.2), on the integral formulation of drag forces due to viscous effects (
Section 2.3), and on a quasi-static model for the mooring system (
Section 2.4).
Section 3 shows detailed results for one mooring configuration and the effect on performance due to changes of design parameters of the mooring system. Finally,
Section 4 presents a final discussion and conclusions.
2. Device and Mathematical Model
The WEC under consideration in this paper is based on the floating OWC concept called spar-buoy OWC [
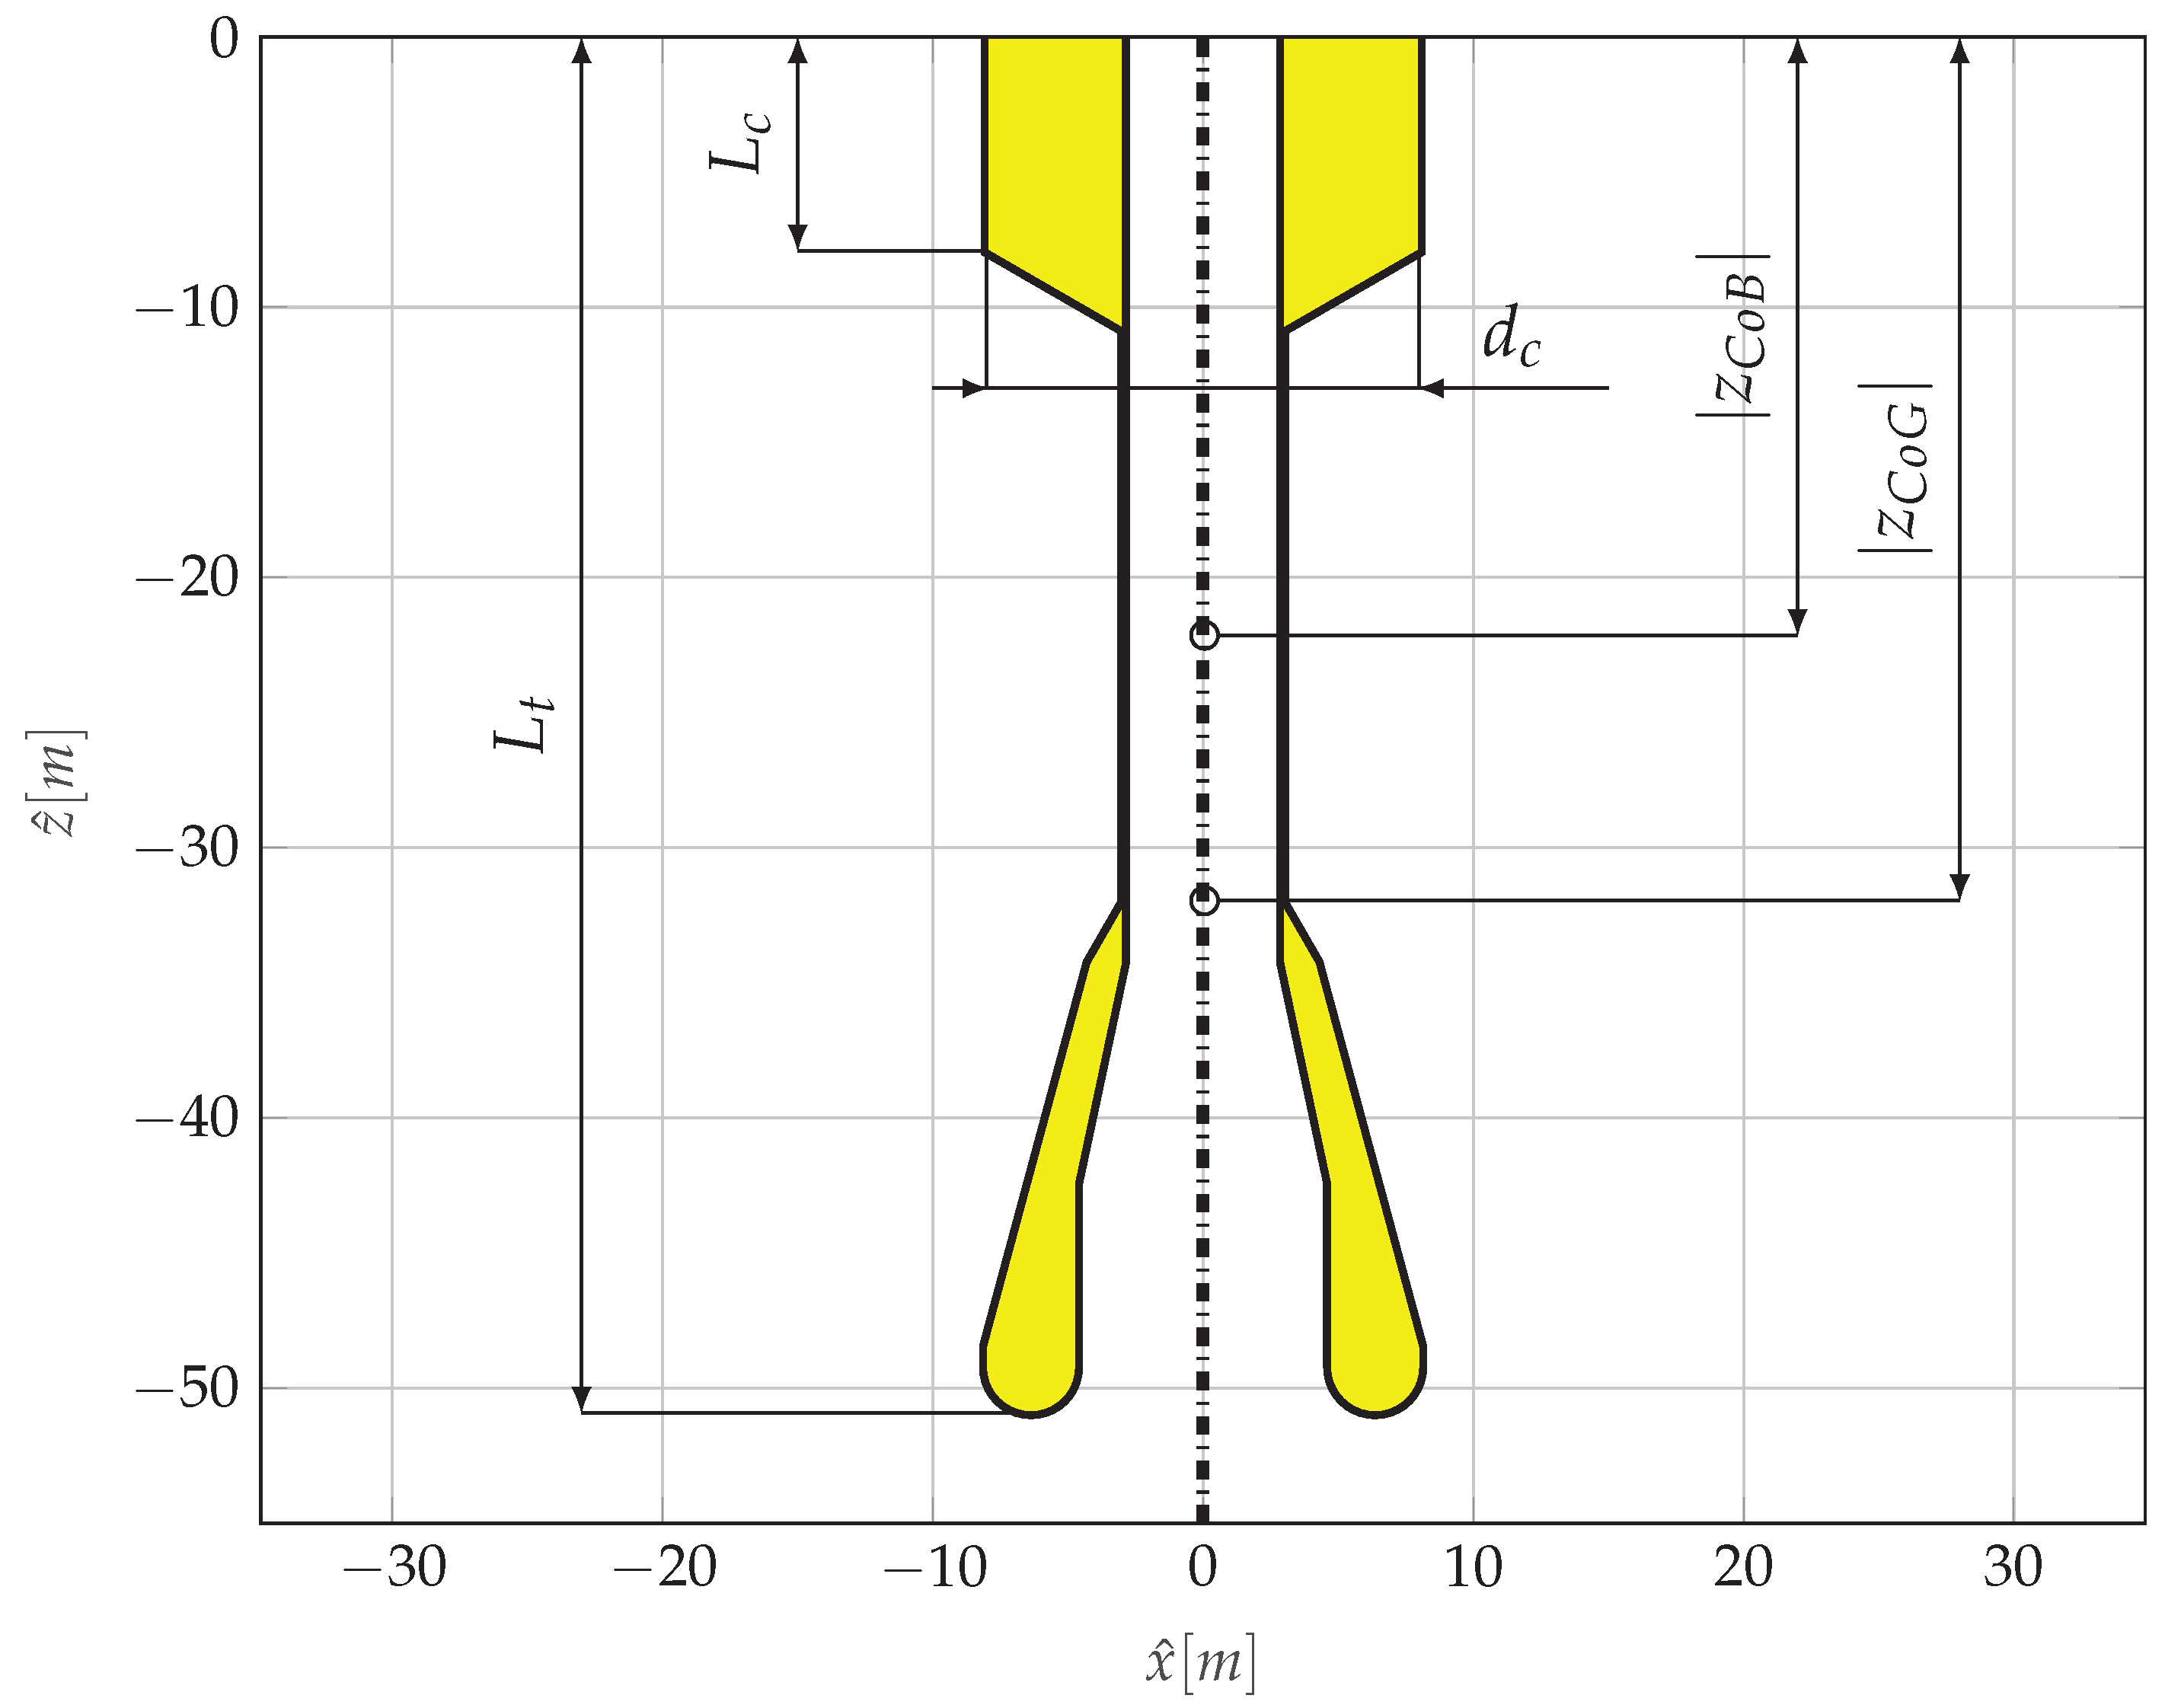
10]. The energy extraction is performed by a turbine that is actioned by the air flow generated by the relative motion between the floater and the water column confined within. The geometry, shown in full-scale dimensions in
Figure 1, is the result of an optimization based on maximizing the performance of the device for a location off the western coast of Portugal [
10].
It is worth highlighting that the best performance is obtained when the response is only in heave, since any pitch motion would reduce the amount of energy available to the turbine. It follows that, in order to increase the pitch natural period (
) to wave periods (
) beyond the operational region, the optimal geometry has a long total draft, a large ballast at the bottom section and, consequently, a low center of gravity. However, having a large
makes the device prone to experience parametric resonance, since typical
will fall in the proximity of
, which is one of the triggering conditions for parametric instability [
29]. Experiments have confirmed this behavior, and its detrimental effects on power production [
31]. Note that, for the obvious reason of computational time requirements, the optimization strategy in [
10] used a fully linear model, and was hence unable to articulate a nonlinear phenomenon as a parametric resonance.
Consequently, it is crucial to define a more accurate nonlinear model that can be used to quantify the likelihood and severity of parametric instability, producing more reliable power conversion and load estimations. It is important to realize also that a low computational time (about real-time) is a requirement for applying the model to design purposes, such as the definition of the mooring system.
The characteristics of the device under study in this paper are based on the 1:32 scale experiments performed in the COAST laboratory ocean wave basin (Plymouth, UK) [
31]. Relevant physical properties and dimensions are tabulated, in full-scale, in
Table 1. The mooring system configuration is based on the one presented in [
31], but a sensitivity study is performed on some of its parameters. Further details are given in
Section 2.4. The damping effect of the turbine has been simulated using a calibrated orifice plate. The air compressibility effect inside the chamber has been neglected since, while it introduces a phase lag between the water column and the floater motion, affecting power conversion, it usually does not have a significant impact on the hydrodynamic response of the floater, especially in rotational DoF.
2.1. Equation of Motion
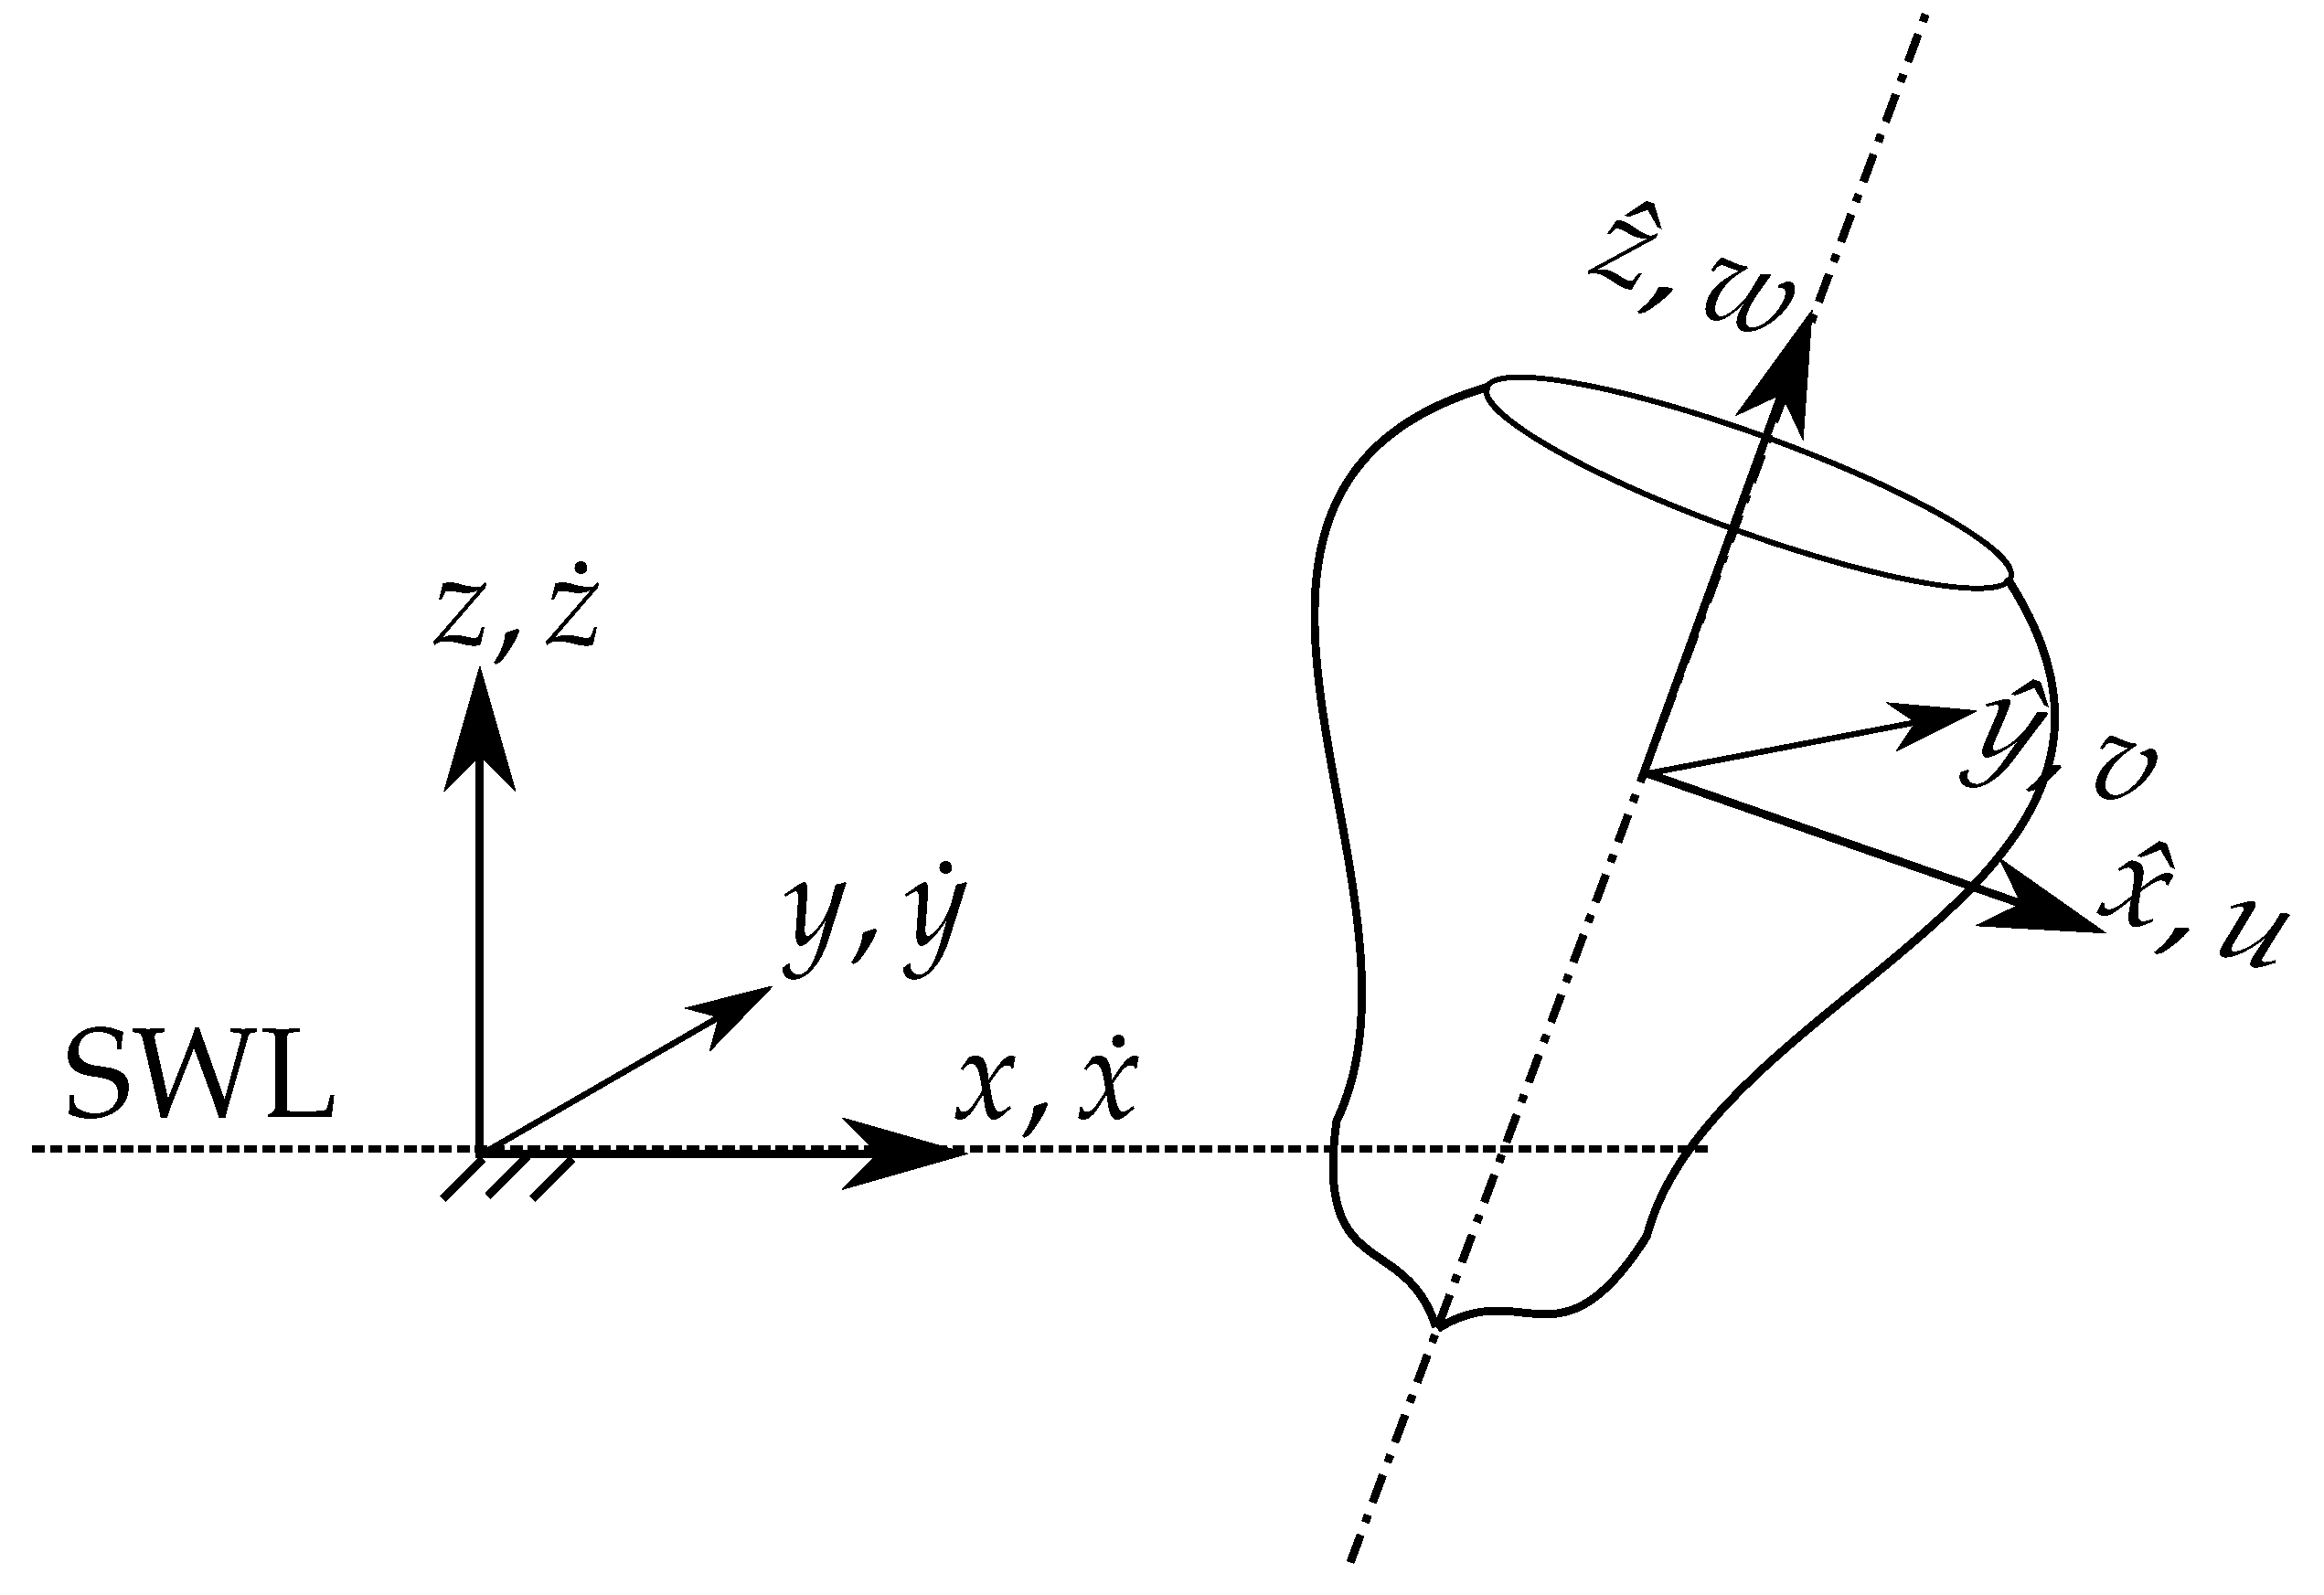
In order to represent the dynamics of the device, it is convenient to consider two right-handed frames of reference, as schematically shown in
Figure 2 for a generic axisymmetric device. The first one
is world-fixed, inertial, with the origin at the still water level (SWL) and on the center of the buoy at rest, with the
x-axis along and in the same positive direction of the wave propagation, and the
z-axis pointing upwards. The inertial frame is used to describe the body displacements (
), divided into translations (
) and rotations (
):
where
x is surge,
y is sway,
z is heave,
is roll,
is pitch, and
is yaw.
The second right-handed frame of reference is
, body-fixed, hence non-inertial, which is initially coincident with the world-frame when the buoy is at rest. This is used for writing the dynamic equation of the system, since the inertial matrix remains constant. Therefore, both forces and velocities are represented in the body-fixed frame, along the axis of the buoy. Velocities (
), divided into translation (
) and rotations (
), are defined as:
It is worth remarking that forces and velocities are along time-varying axes, while displacements are along fixed axes. In linear hydrodynamic models there is no difference between such axes, based on the assumption of small displacements. However, in a nonlinear approach, a mapping from body- to world-frame velocities should be applied, at each time step, in order to obtain the correct displacements. One possible mapping is the following:
where
is the rotation matrix, depending on the Euler angles
, defined according to the 3-2-1 convention as:
with
c and
s standing for
and
trigonometric operators, respectively.
is applied to translational velocities.
is applied to rotational ones, and is defined as follows:
where
t stands for the
trigonometric operator. Note that the singularity of
in
is usually not an issue in wave energy applications, since the amplitude of the pitch angle is, by design, always expected to be smaller than
.
Another consequence of using a body-fixed frame are Coriolis and centripetal forces, which are normally neglected under the assumption of small rotational velocities. Let us define, for convenience of notation, the skew-symmetric operator
as
It follows that
, and that the cross-product can be written as:
Using such a notation, it is possible to define Coriolis and centripetal forces as [
37]:
where
M is the mass of the body,
is the vector from the origin of the body-fixed frame (reference point) to the center of gravity, and
is the matrix of the moments of inertia with respect to the reference point.
Finally, the dynamical equation in 6 DoFs for the floater becomes:
where
is the inertial matrix and
comprises all external forces, namely diffraction, Froude–Krylov, radiation, drag, power take-off and mooring loads. Note that
is a generalized force, composed of a linear force vector
, and a torque vector
. While radiation and diffraction can be assumed as linear, a nonlinear representation of FK forces, viscous drag effects, and mooring loads is implemented and further explained in
Section 2.2 Section 2.3 Section 2.4, respectively.
For the particular application of the floating OWC, a 7th DoF must be included to account for the displacement of the water column and the consequent power extraction. This can be performed by considering a virtual water piston with a relative small thickness oscillating inside the moon-pool of the floater. Under normal operation, the interaction between the water piston and the floater occurs due to the pressure variations inside the air chamber, which in turns depend on the relative displacements and on the diameter of the orifice [
38]:
where
is the air density,
is the cross-sectional area of the air chamber,
is the discharge coefficient (
),
is the diameter of the orifice, and
is the velocity of the water column along the axis of the buoy. Note that
acts on both the buoy and the water column, but with opposite sign.
2.2. Nonlinear Froude–Krylov Force Model
Froude–Krylov forces are defined as the integral of the undisturbed pressure field (
P) over the wetted surface of the floater. In the linear approximation, it is assumed that the relative motion between the body and the free surface is small, so that FK forces are computed with respect to the mean wetted surface. On the contrary, nonlinear FK force calculations are performed with respect to the actual instantaneous wetted surface (
):
where
is the gravity force,
is the unity vector normal to the surface,
is the generic position vector, and
is the position vector of the center of gravity. The undisturbed incident pressure field of an uni-directional regular wave is defined as:
where
a,
, and
k are the wave amplitude, frequency, and number, respectively,
the water density,
g the acceleration of gravity,
h the water depth, and
the vertical coordinate modified according to Wheeler’s stretching [
39].
Solving the integrals in (10) requires, in general, computationally demanding mesh-based approaches. However, computationally efficient approaches are available for axisymmetric bodies [
40], exploiting cylindrical coordinates
to achieve an analytical representation of the wetted surface:
where
is a generic function of the vertical coordinate
, describing the profile of revolution of the axisymmetric body. Since it is convenient to define the FK integrals in the body-fixed frame of reference, the pressure field must be mapped from the global to the body-fixed frame. Therefore, after some manipulations [
40], the integral in (
10a), for example, becomes:
where
and
are the unity vector along
and
, respectively. Note that the transpose of rotation matrix is used to map the gravity force in the body-fixed frame. The integral in (
13) is solved numerically, using a 2D-quadrature scheme for trapezoidal integration.
An open source Matlab demonstration toolbox for definition and computation of nonlinear FK forces for axisymmetric floaters is available at [
41].
2.3. Viscous Drag Force Model
In un-damped systems, parametric resonance always arise when the frequency condition is met. Conversely, in real applications, parametric instability appears only if the internal parametric excitation exceeds the damping of the system. Furthermore, the severity of the parametric response is also related to dissipative effects. Therefore, an appropriate modeling of viscous effects is essential for studying parametric resonance.
In potential flow-based nonlinear models, viscous drag forces are commonly included by means of a Morison-like term, which suggests a quadratic dependence of the drag force on the relative velocity between the body and the fluid. Given a variable cross-sectional area and since the total length of spar-buoy OWC device is comparable to the decay rate of the fluid velocity with water depth, it is convenient to implement an integral approach to the Morison-like equation [
38]. In particular, the viscous force (
) is defined for an infinitesimal cross-sectional area of the buoy, perpendicular to
, and then integrated over the whole length. The cylindrical coordinates of the nonlinear Froude–Krylov framework can be used to compute such integrals, given that the fluid velocity is mapped from the world frame to the body-fixed frame.
For surge and sway DoF, drag forces result in:
where
is the drag coefficient around a circular cylinder,
and
are the horizontal relative velocities along
and
, respectively. Note that, as shown in (
12),
represents the function describing the buoy diameter with depth.
The infinitesimal viscous force contribution in (14) also generate a viscous torque, acting in roll and pith:
The drag torque in yaw is assumed to be dependent only on the buoys rotation (
) and is caused by friction with the surrounding fluid, quantified by the drag coefficient
. Considering the linear velocity of a point on the external surface equal to the rotational velocity times the distance from the axis, the yaw component of the viscous force becomes:
Finally, the drag forces in heave due to the interaction with the external wave field and the friction with the water column (
) are:
where
is the cross-sectional area of the water piston (
),
the drag coefficient in heave, and
is the relative heave velocity of the buoy with respect to the fluid. Note that
acts on the water column as a reaction force, hence with opposite sign. The drag coefficients used in this study are the following tabulated in
Table 2.
2.4. Mooring System Model
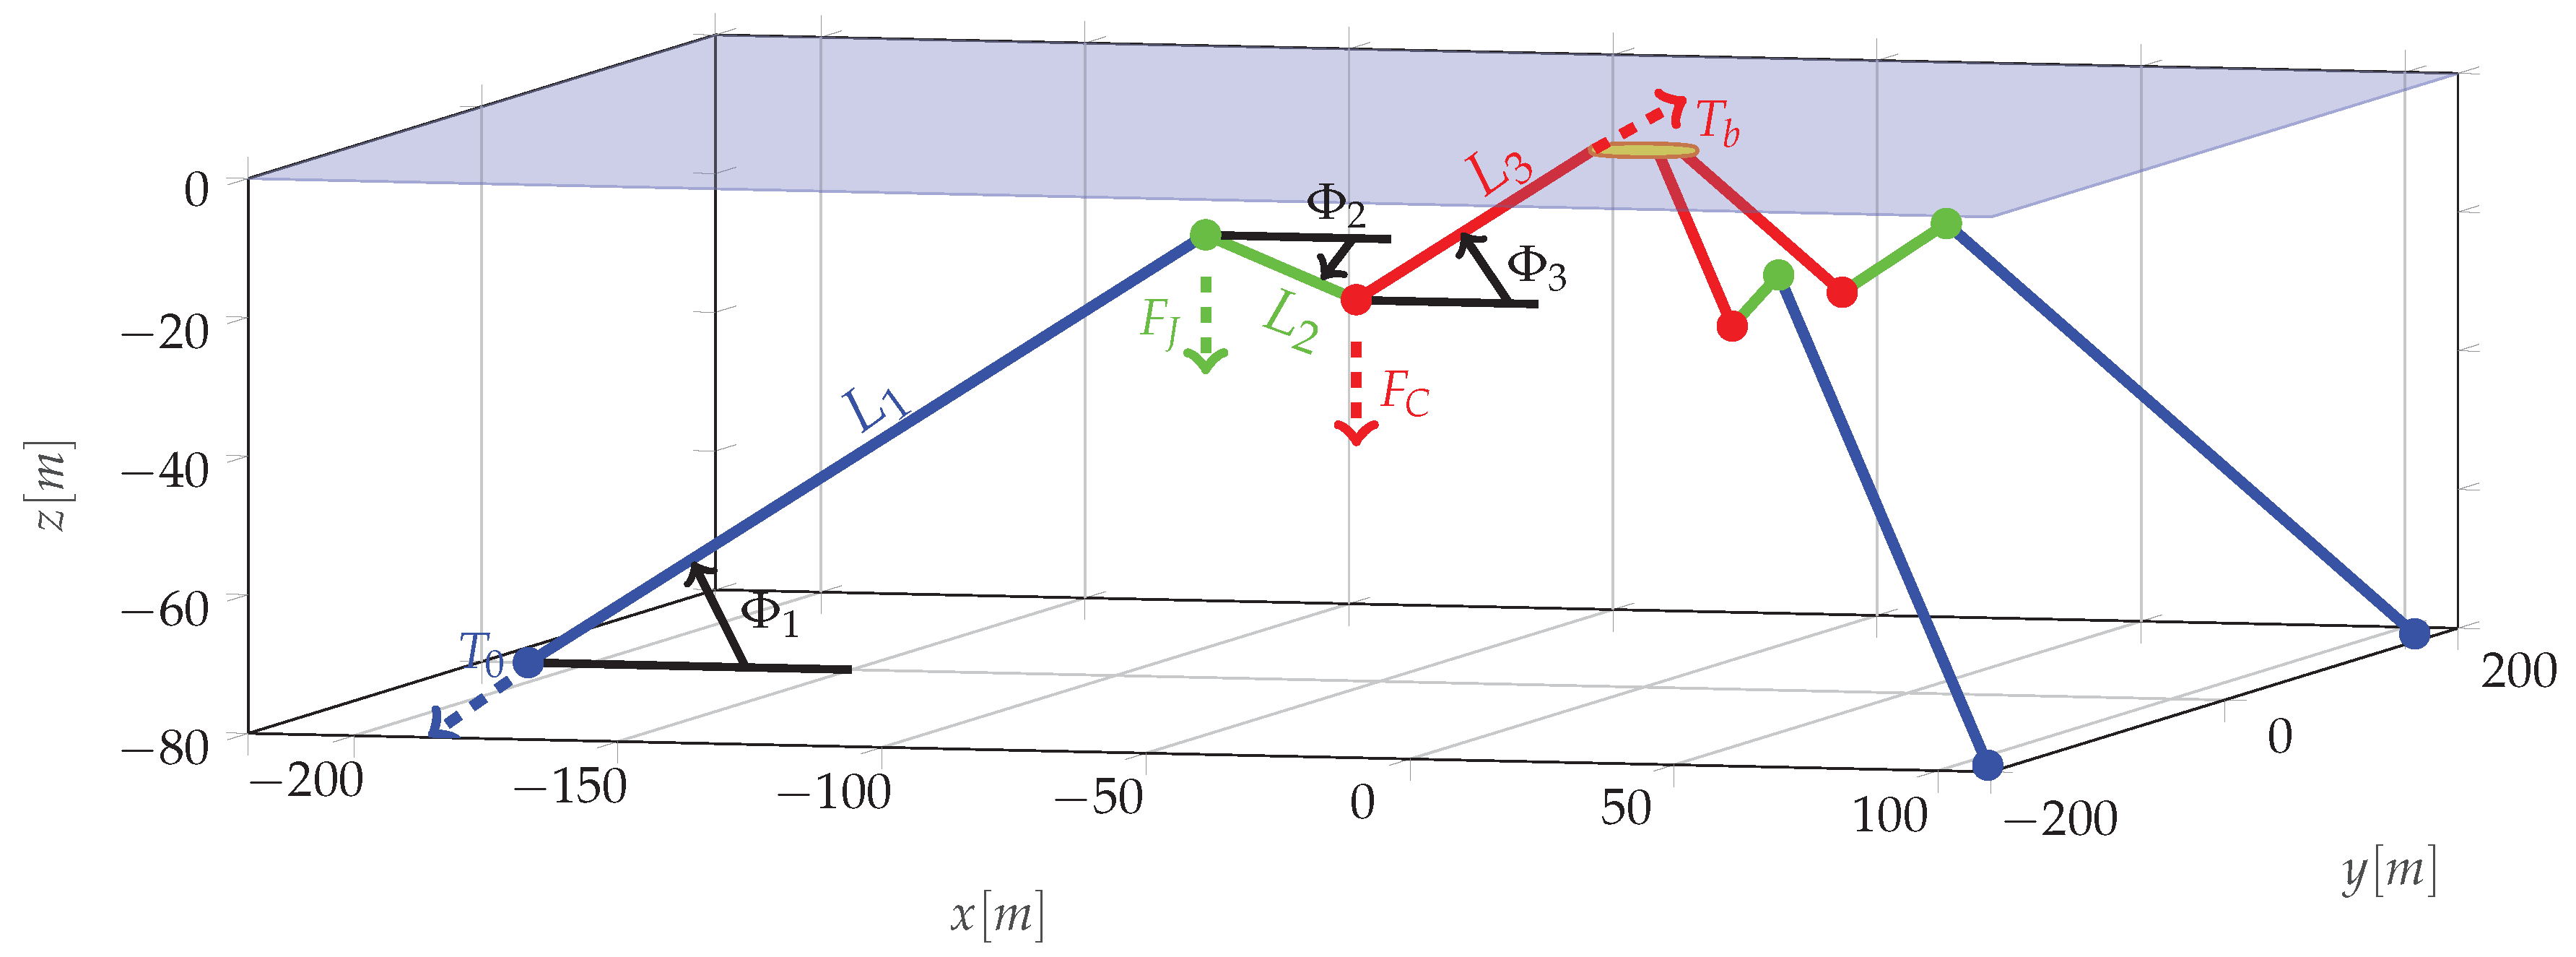
The mooring system, schematically shown in
Figure 3, is inspired by experimental tests performed in Plymouth, UK [
31]. It is composed of three lines equally spaced in the radial direction around vertical axis of the buoy at rest. Each line is divided in ulterior three segments, connecting the anchor to a jumper (line of length
), then to a clump weight (line of length
), and finally to the buoy (line of length
). Such a mooring concept is popular in wave energy applications, since it is able to keep the device in station while having little influence on the response in the DoF where energy is extracted [
42]. For this application, the mass and density of the jumper (or riser) and the clump weight were chosen to match the desired stiffness of the mooring system. Relevant parameters for the equivalent full-scale model of the mooring system are tabulated in
Table 3.
A quasi-static model is defined to compute the tension on each line depending on the 6-DoF displacements of the attachment points of the buoy and consequently obtain the total forces and torques acting on the floater, around the origin of the body-fixed frame and along its axes. Relying on the fact that for this system each line is always in tension and they have a relatively small mass, it is possible to treat each mooring line as always straight. Consequently, for each line, two equations are written for the vertical and horizontal force equilibrium, one for the torque equilibrium, and two for imposing geometrical constraints:
where
X and
Z are the horizontal and vertical distance from the anchor, respectively, while
and
are the net force of the clump weight and jumper, respectively, obtained as the balance between their weight and buoyancy. The horizontal distance of the midpoint of line
to the anchor is
, for
, while
and
are the horizontal distances of the jumper and clump weight from the anchor, respectively. Such parameters are simple linear combinations of the five unknowns of the system, which are: Tension at the buoy (
), tension at the anchor (
), and angles of each line to the horizontal direction
, as shown in
Figure 3. Knowing the tension and the angles of each line, it is possible to compute the total force and total torque acting on the buoy. Note that the nonlinear system of five equations in (
18) is solved numerically, since no explicit algebraic solution can be obtained.
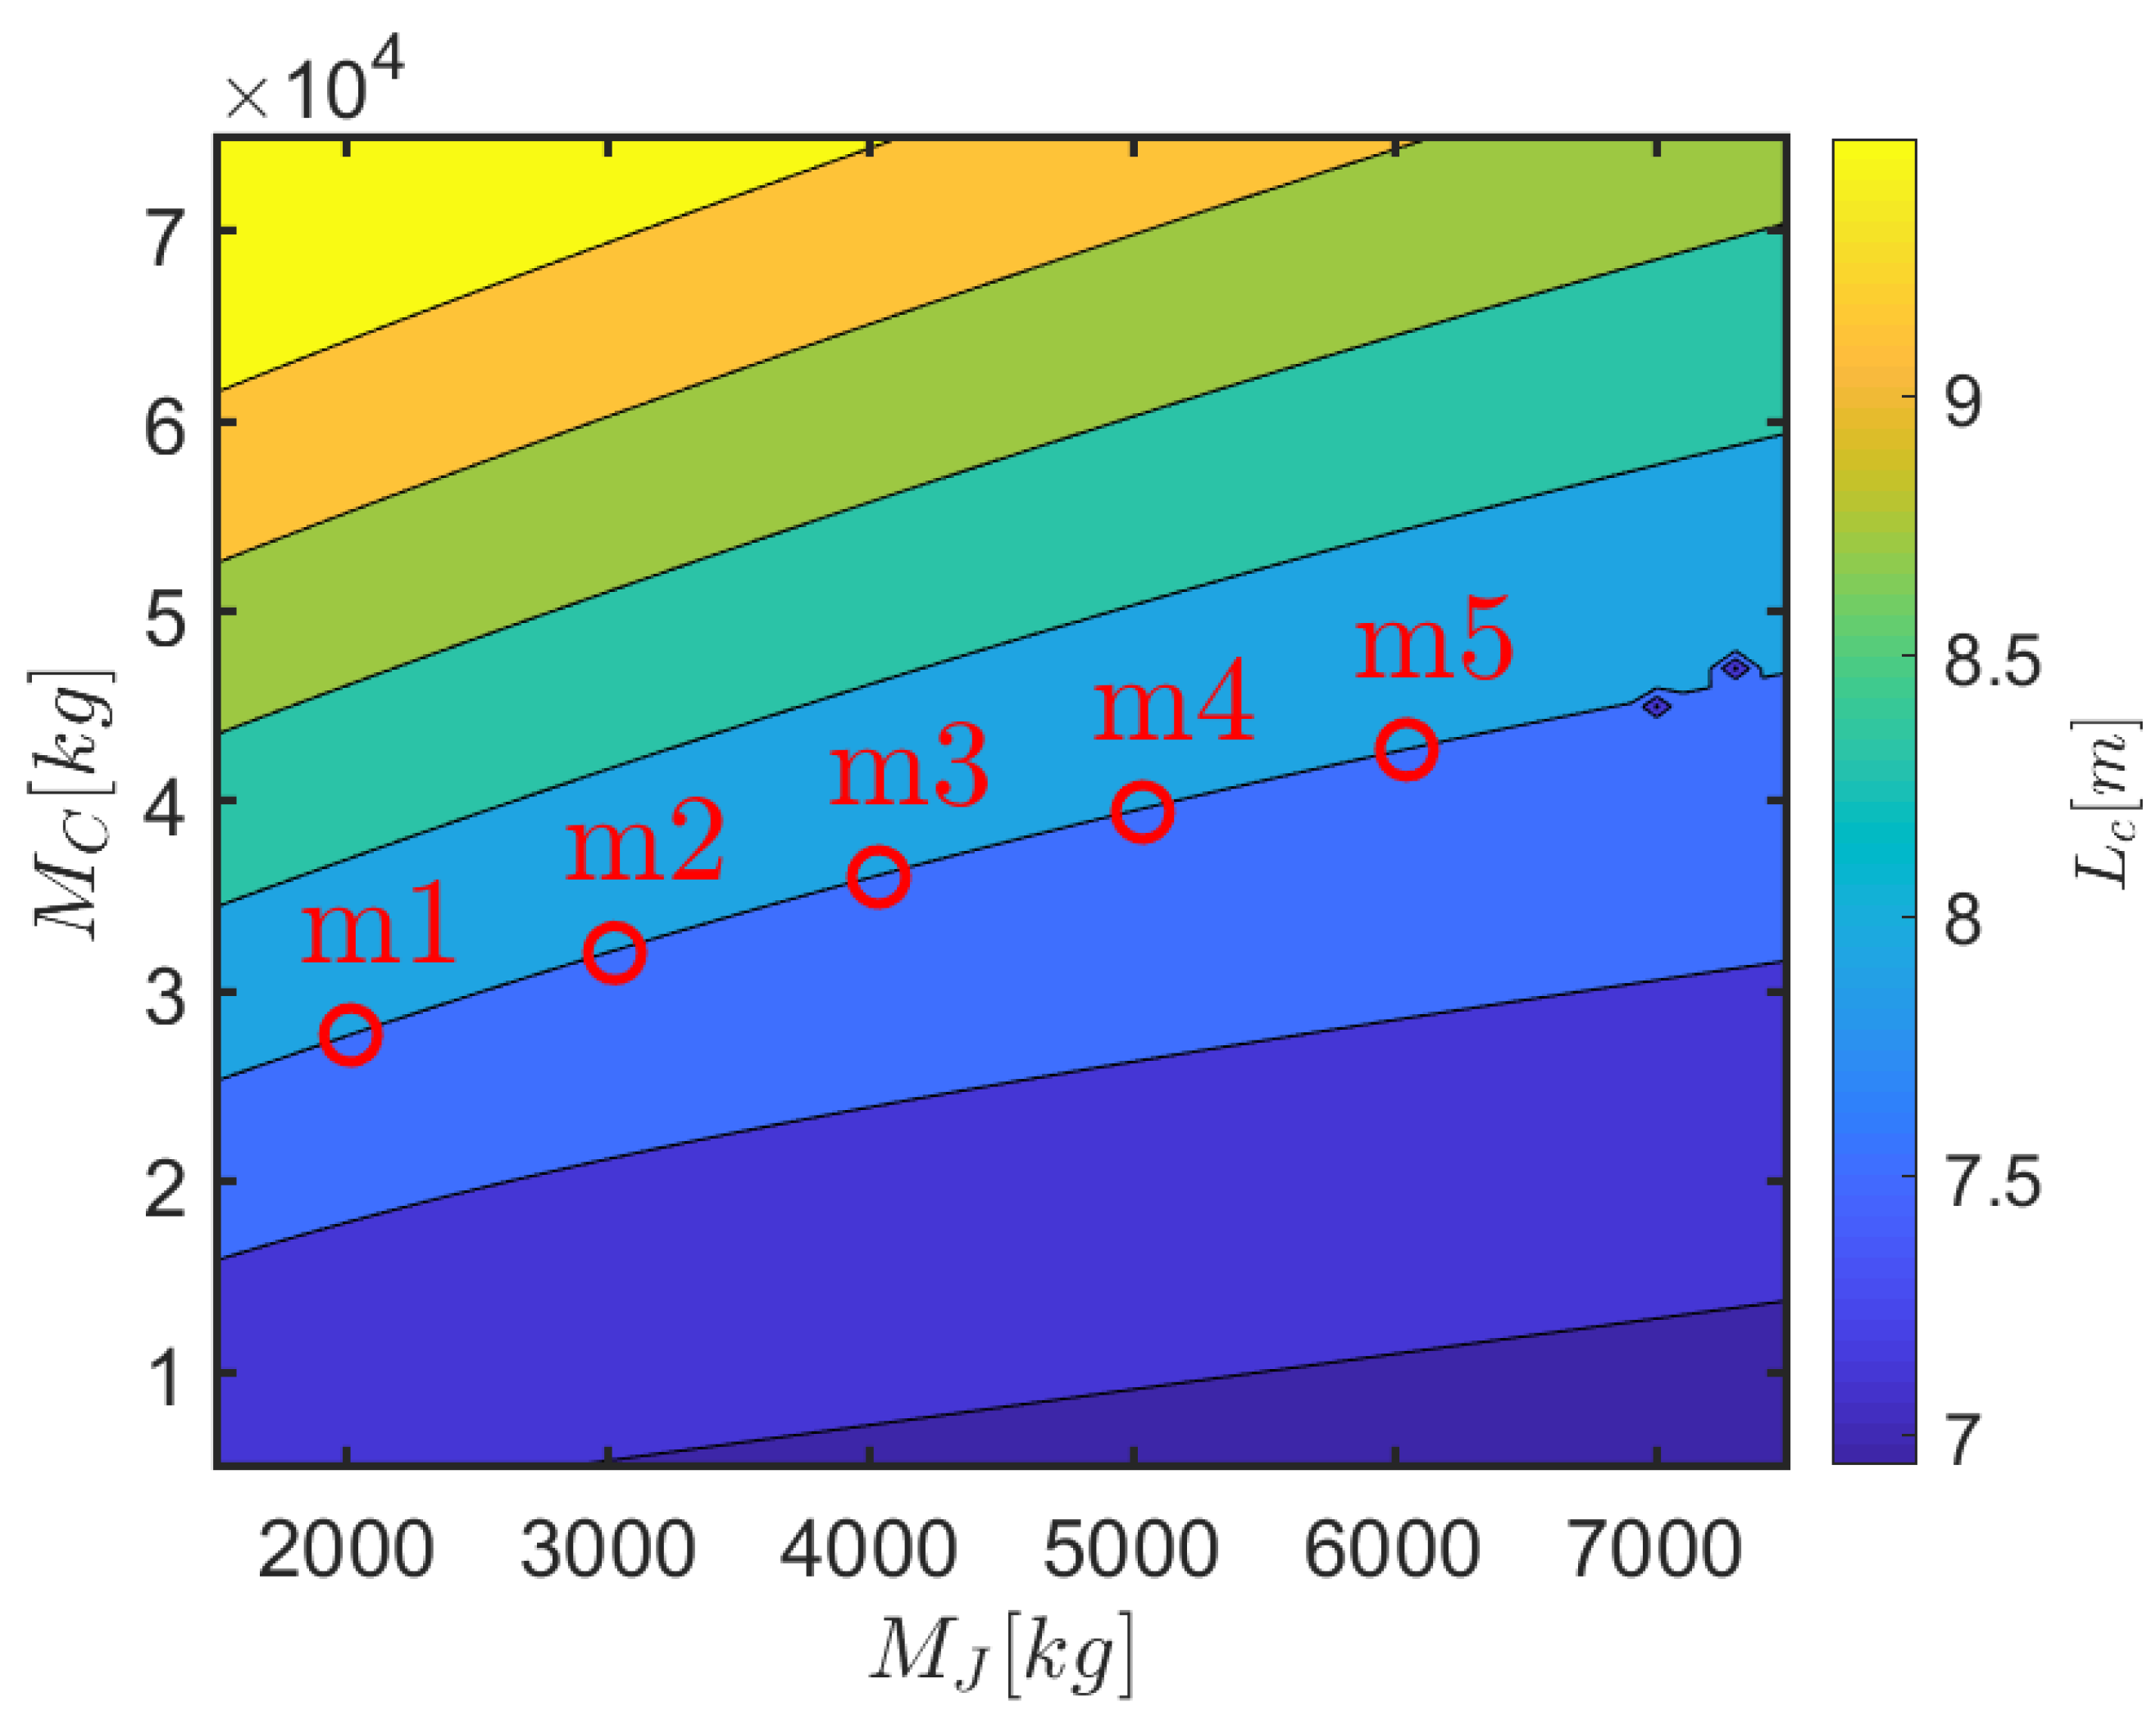
The mooring model is used to investigate how the mass of the clump-weight (
) and the jumper (
) affect the pre-tension and angles of the lines, hence the draft of the top cylindrical part of the floater (
), as shown in
Figure 4. Consequently, aiming at the same scaled-up draft of the experiments in [
31] (7.91 m), five different combinations of
and
are considered, as shown in
Figure 4 and tabulated in
Table 3, along with the consequent pretension. Note that configuration
corresponds to the one tested in the wave tank, while configurations
,
,
,
refer to 0.5, 0.75, 1.25, and 1.5 times the base value of
, respectively.
3. Results
Changing the mass of the jumper and clump weight mainly has a consequence on the pre-tension of the lines, with expected impact on peak loads and surge response mainly. This can be appreciated by considering the resulting natural periods in all DoF, tabulated in
Table 5, which are estimated by performing numerical free decay tests. The model described in
Section 2 is implemented in Matlab with a Runge–Kutta integration scheme with constant time step, equal to 0.1 s for the free decay tests.
Table 5 clearly shows that the different mooring configuration only significantly affects the surge and yaw natural periods, while other DoF are almost unaltered. In particular, the period that triggers parametric resonance (half the natural period of pitch/roll), remains approximately the same for the different configurations. Nevertheless, due to the nonlinear coupling between all DoF, the severity of the parametric response may be affected by the different pre-tensions and the distinct responses in surge and yaw.
Since parametric resonance is a phenomenon highly sensitive to the excitation frequency, a refined set of regular waves is considered to investigate the forced motion of the device: Wave periods () from 5 s to 20 s, with step 0.25 s, and wave heights () from 0.5 m to 5.5 m, with step 0.5 m. However, waves with steepness higher than 6% are excluded from the analysis, with steepness defined as the ratio between wave height and wave length. A quite small time step is chosen, equal to one 100th of the wave period, in order to assure an appropriate description of parametric instability, at the price of a higher computational time.
A sigmoidal smoothing function is applied to the wave elevation, wave pressure field and velocity field, with a smoothing period of five times the wave period. The computations are performed on single processors (2x Xeon E5-2680 v3 2.50 GHz (turbo 3.3 GHz)). The resulting computational time depends on the time step, on the absolute and relative tolerances of the numerical integration scheme for the solutions of the NLFK and drag forces integrals, as well as on the magnitude of the response and the hydrodynamic forces computed. However, on average, the relative computational time, defined as the ratio between the run time and the simulated time, is about 2.7. Therefore, although the model is not optimized for computational efficiency, it already performs almost in real-time.
Finally, note that in the eventuality of a fully stretched mooring line, the simulation is halted, since such extreme conditions are undesirable and would lead to switching to survivability mode.
In
Section 3.1, a detailed analysis of the results for configuration
is first provided. Then, in
Section 3.2, a comparison of the different mooring configurations is presented.
3.1. Configuration
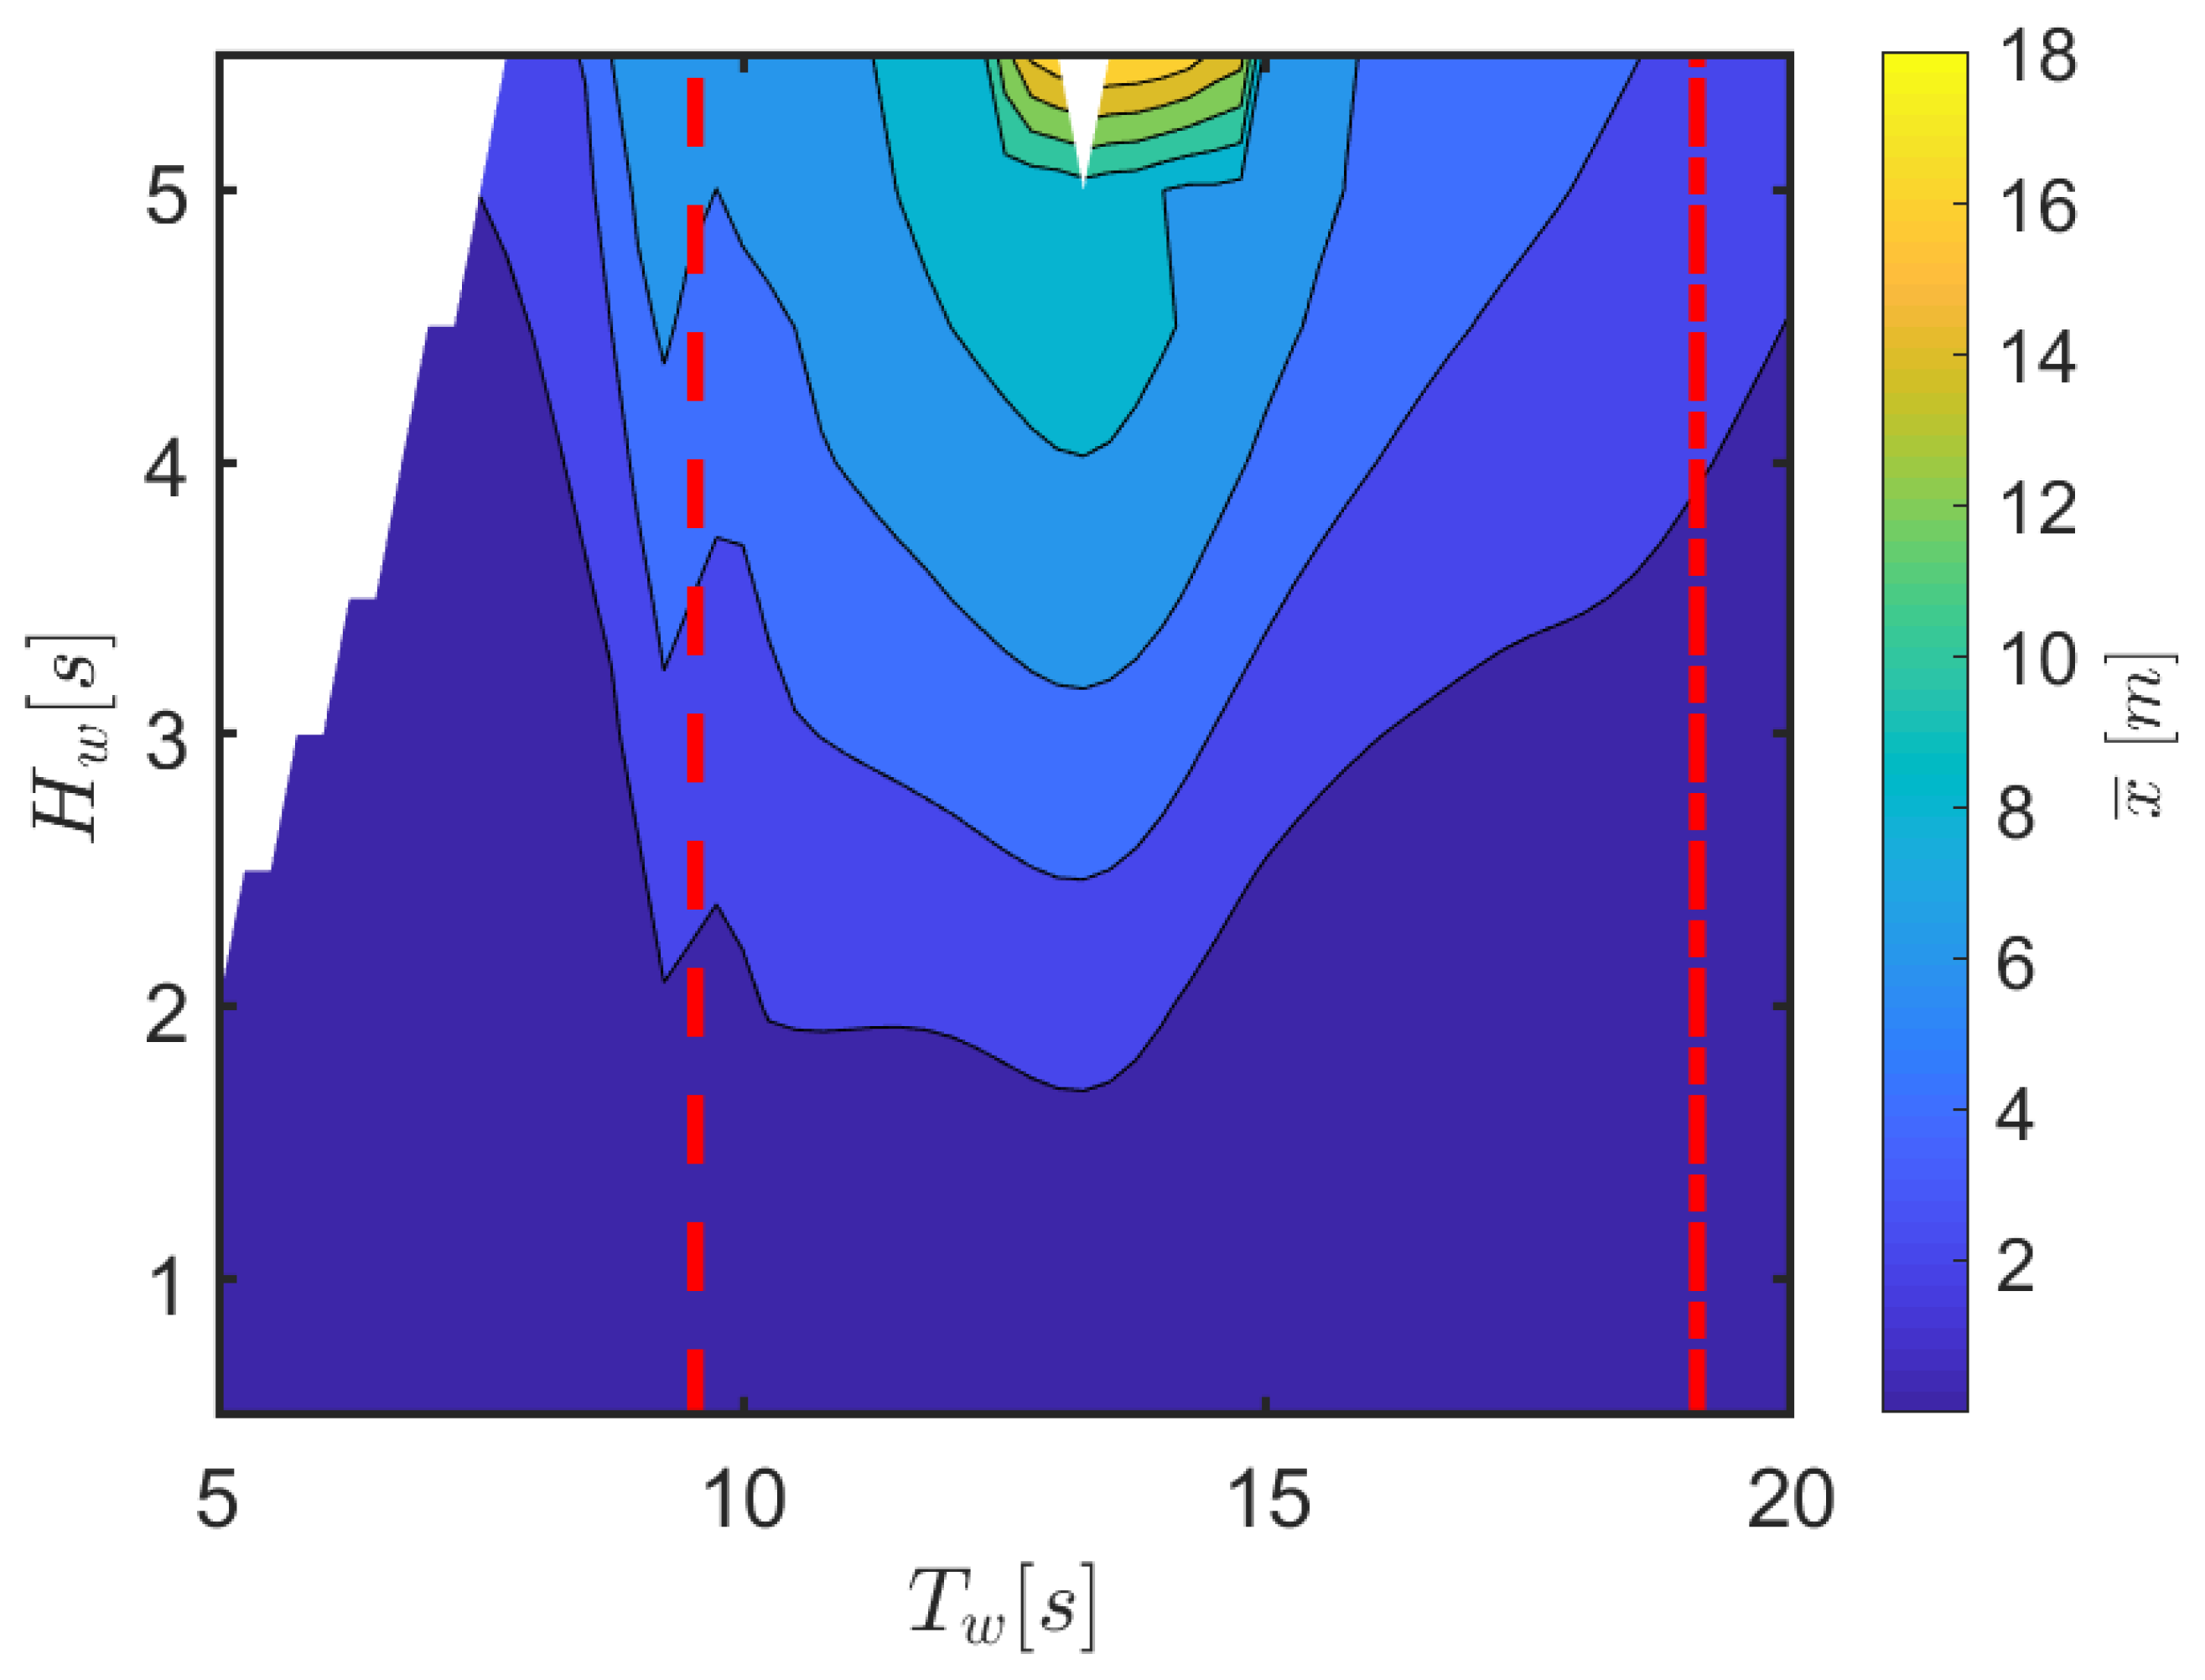
The mooring system has the main objective of keeping the floater on the station due to the action of wave drift. While linear hydrodynamic models neglect second-order effects as the mean force in surge, the NLFK model is able to reproduce mean drift as a by-product of the integration of the pressure field on the instantaneous wetted surface. In fact, since mean drift forces are due to the pressure field acting on a time-varying wetted surface of a floater [
43], drift effects are inherently taken into account in the computation of NLFK integrals (which are the integral of the incident pressure field onto the instantaneous wetted surface of the device, as discussed in
Section 2.2).
Figure 5 shows how mean drift increase with
, with a peak around
s.
Note that in
Figure 5, as well as in all following contour plot figures, the top left corner presents no data, since those points realize a combination of
and
with a steepness higher than the 6% threshold. The larger mean drift in surge is found for a range of
between 10 s and 15 s, in a region where large heave amplitudes occur.
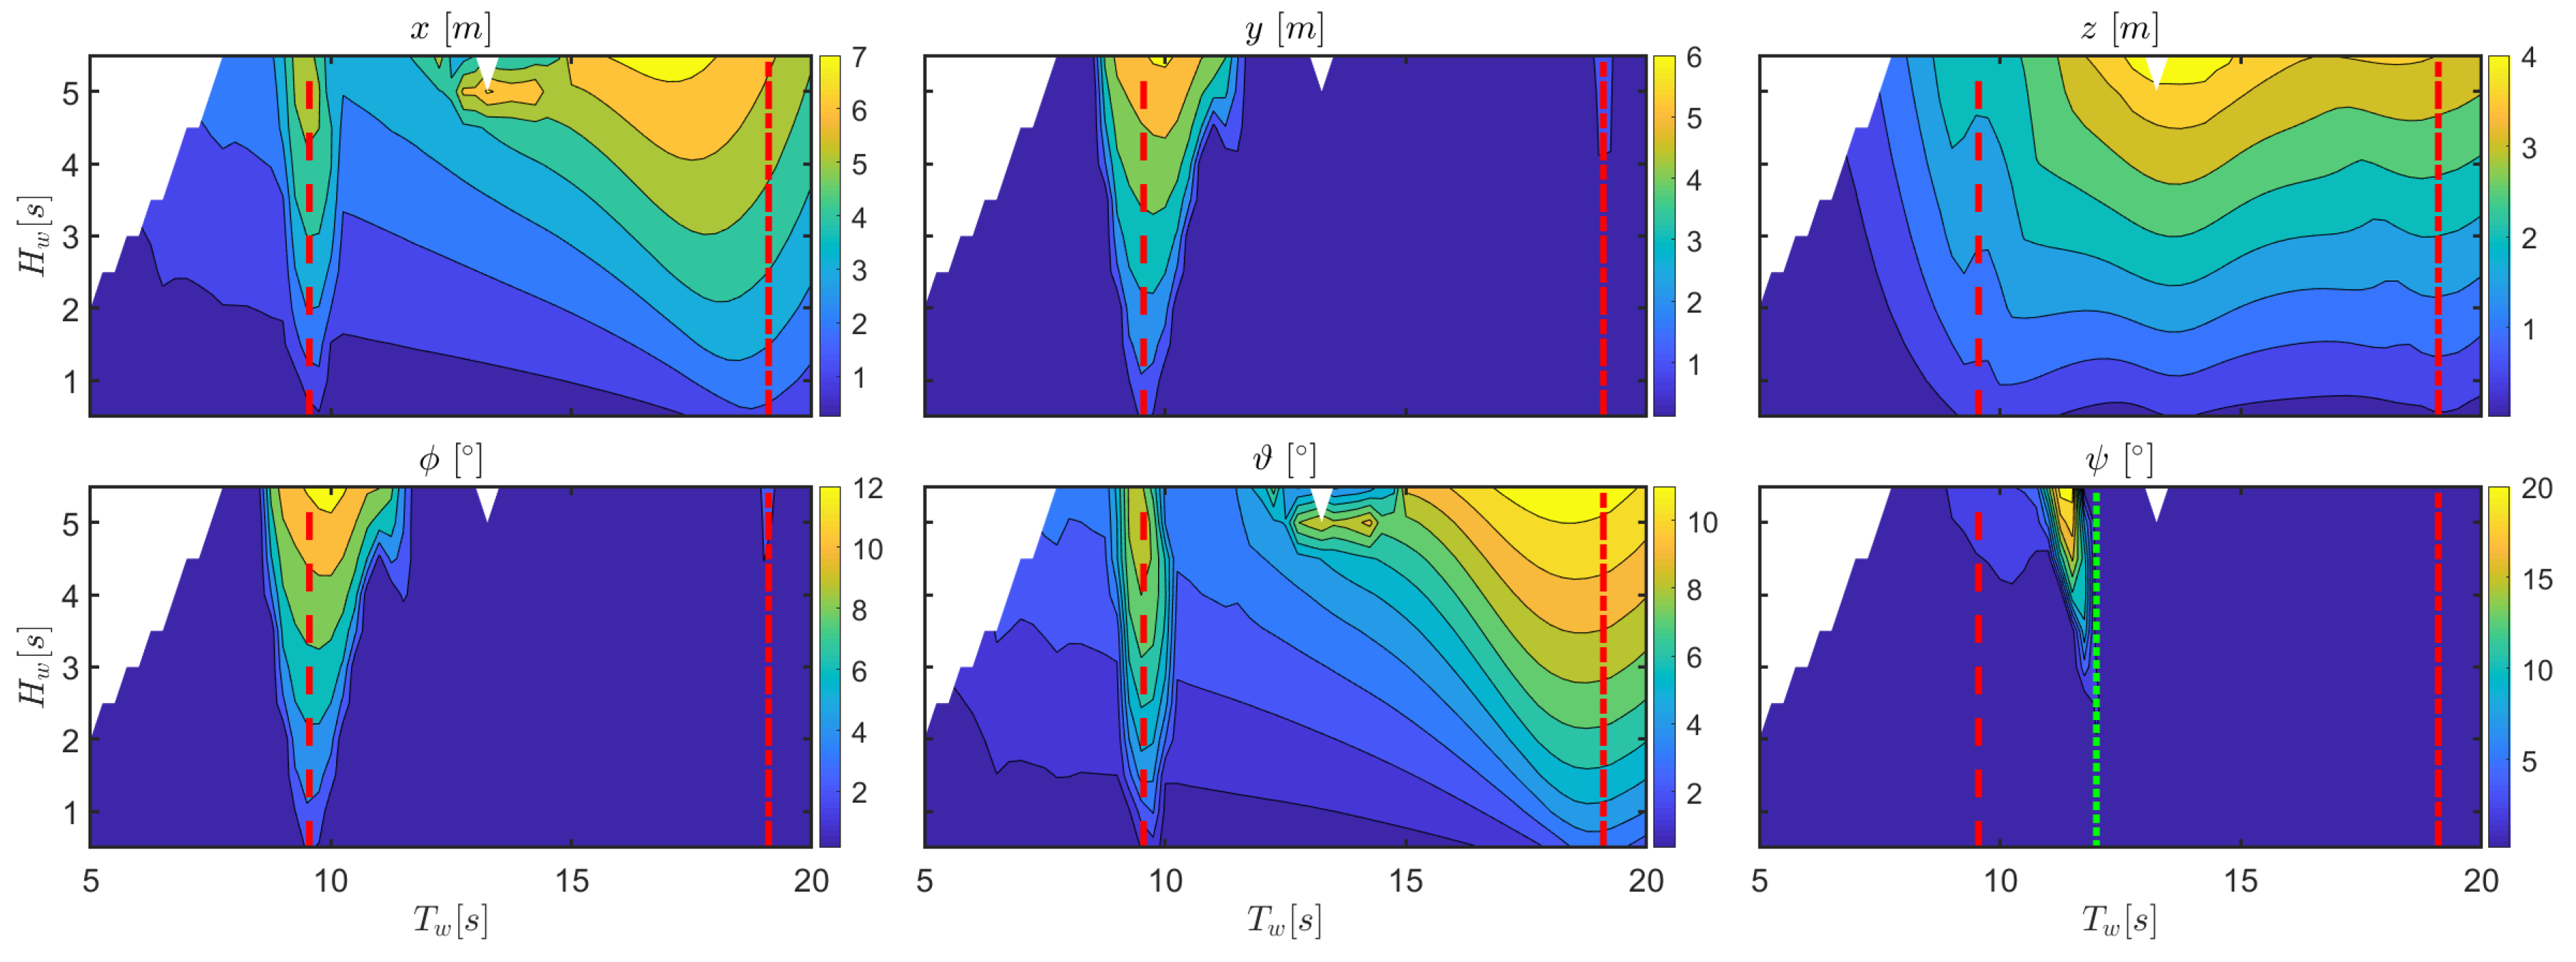
Figure 6 shows the amplitude of the response for configuration
, also highlighting where the wave period is
and
. The most remarkable result is the evident parametric resonance happening, as expected, at
around
. Simulations show that the range of wave periods where the roll is internally excited widens as the wave height increases, since greater incoming energy overcomes the internal damping more effectively. Since sway is coupled with roll, there is also a clear peak of the sway amplitude response across the same range of periods. Furthermore, note that also pitch engages into parametric resonance, since they have the same natural period due to the axisymmetric shape of the floater. Unlike roll, the range of wave periods in the pitch response with large amplitudes does not widens with the increase of
. It is likely that the external excitation of pitch due to wave action limits the level of energy capable of being absorbed by this mode, and in this case, the energy surplus is transferred to roll. Although the impact on the heave response is less evident, it can be noted that, when parametric resonance occurs, there is a drop in the heave amplitude, which is ultimately detrimental for power extraction. Finally, an isolated peak of yaw response can be found near
, suggesting that yaw can also be subject to a parametric-resonance-type effect.
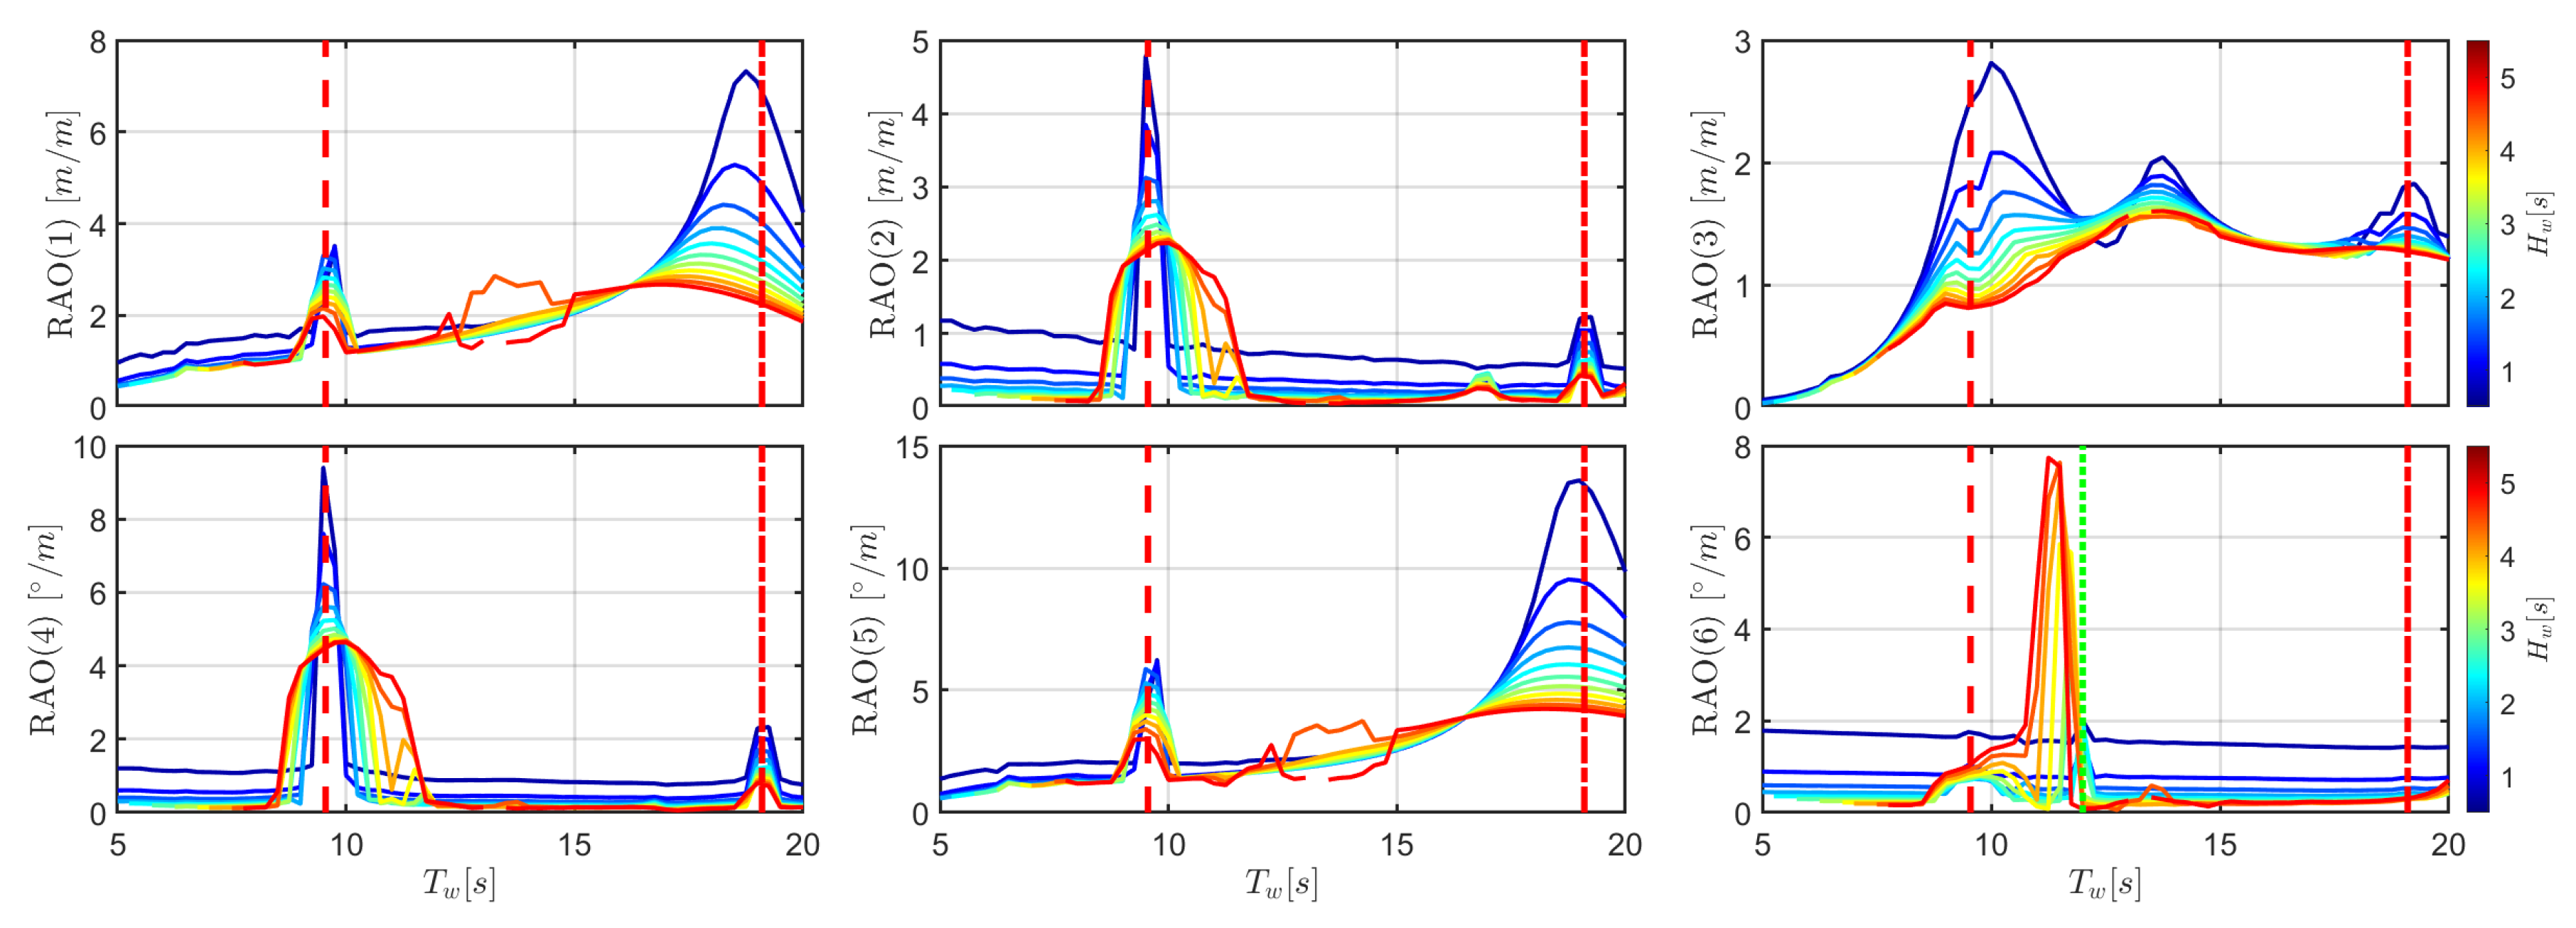
In order to highlight the effect of nonlinearities, it is also interesting to consider the response amplitude operator (RAO), defined as the amplitude of the response over the incoming wave amplitude, as shown in
Figure 7. Note that the RAO would be insensitive to the wave height only for a fully-linear system. The widening effect of parametric roll response is particularly evident in the RAO curves of roll and, consequently, sway. The decrease of the RAO roll peak with increasing
indicates an increasing importance of drag due to viscous effects in the limitation of that motion. The heave RAO presents two peaks near the buoy and OWC natural periods.
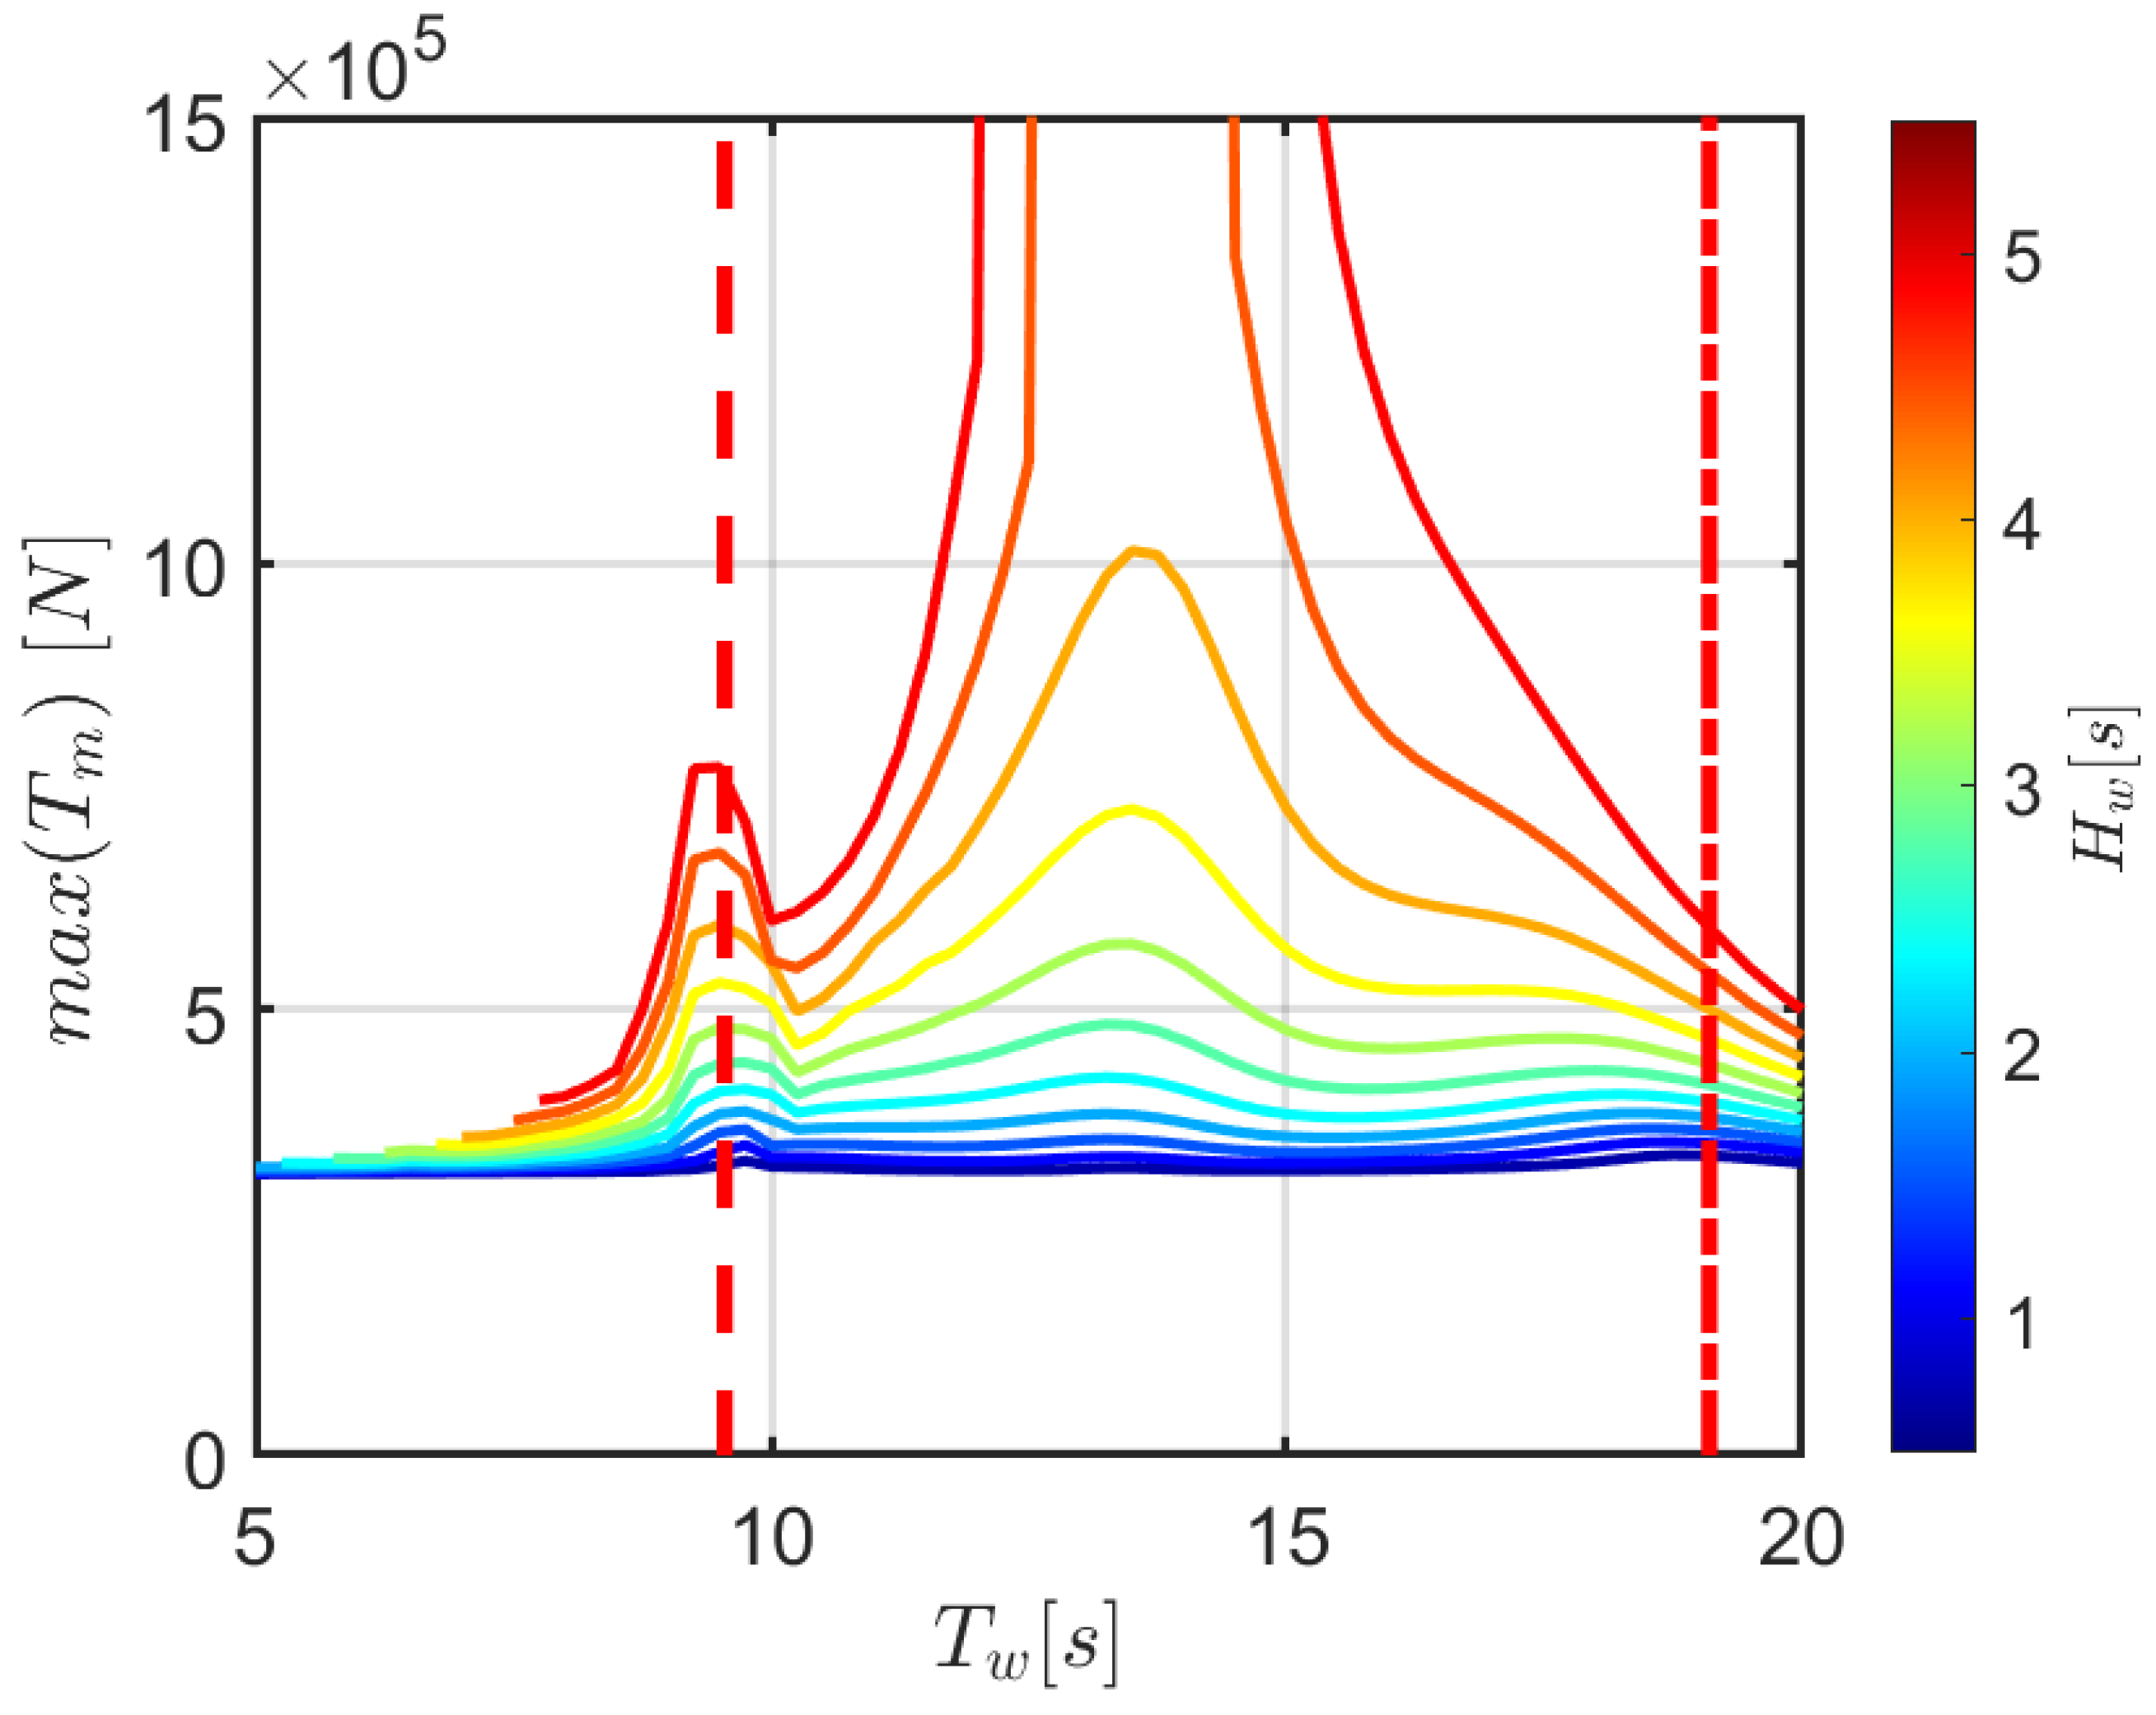
Finally,
Figure 8 shows the peak tension of the front line at the fairlead, which is the one with the highest load. The mooring load depends on the total displacement of the fairlead, which is a combination of the mean and amplitude of the oscillating motion in all DoF. On the one hand, the maximum peak appears in the region with larger mean drift, as presented in
Figure 5. On the other hand, it can be noticed that, when parametric instability occurs, there is an evident increase of mooring load, which is mainly due to the coupling with surge.
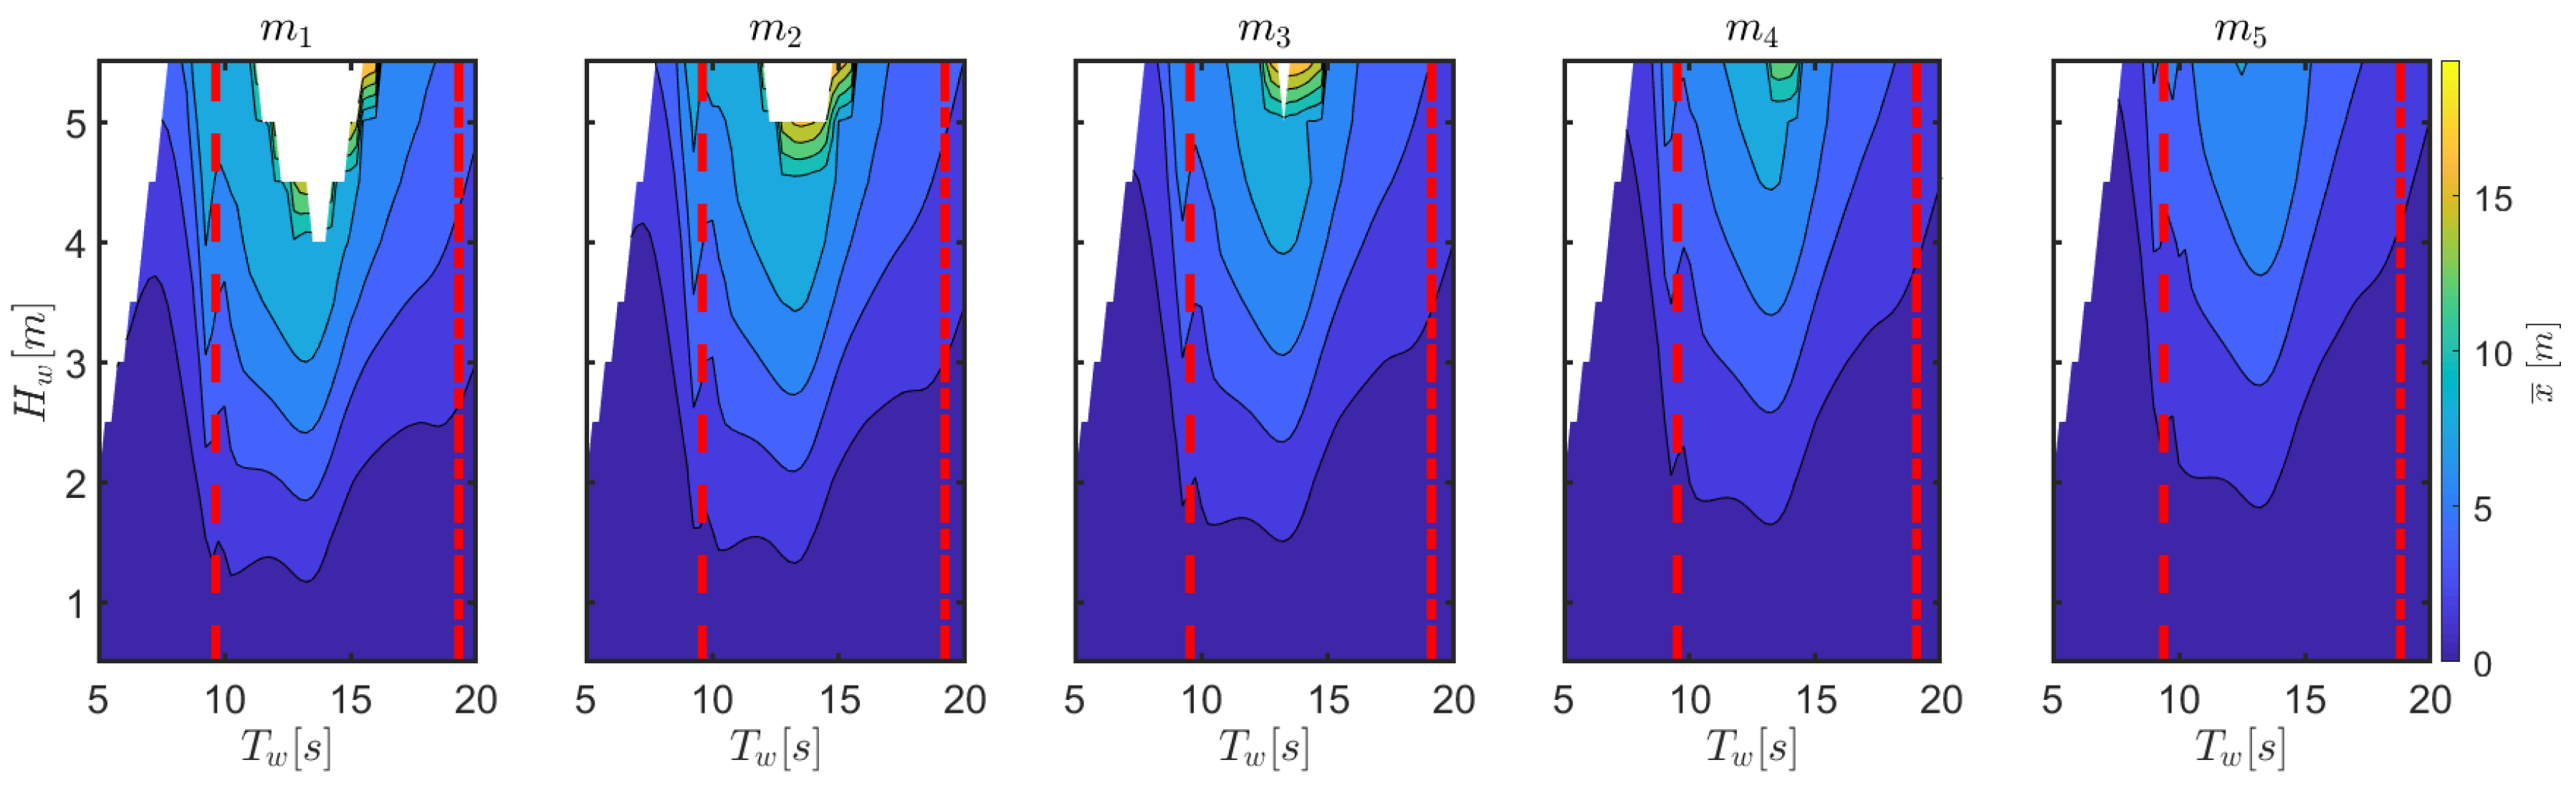
3.2. Analysis of Mooring Configurations
In this section, a thorough comparison of the sensitivity of the response to changes of mooring parameters is presented.
Figure 9 shows how the mean drift increases from
to
. Furthermore, for large-amplitude waves at a periods around 14 s, the mean displacement in surge due to drift effects increases to such an extent that the front line may become fully stretched, meeting the survivability conditions for configurations
,
, and
, as shown by the central area without data in
Figure 9. This area is larger for configurations with low pre-tension (
and
), and absent for configurations at higher pretension (
and
).
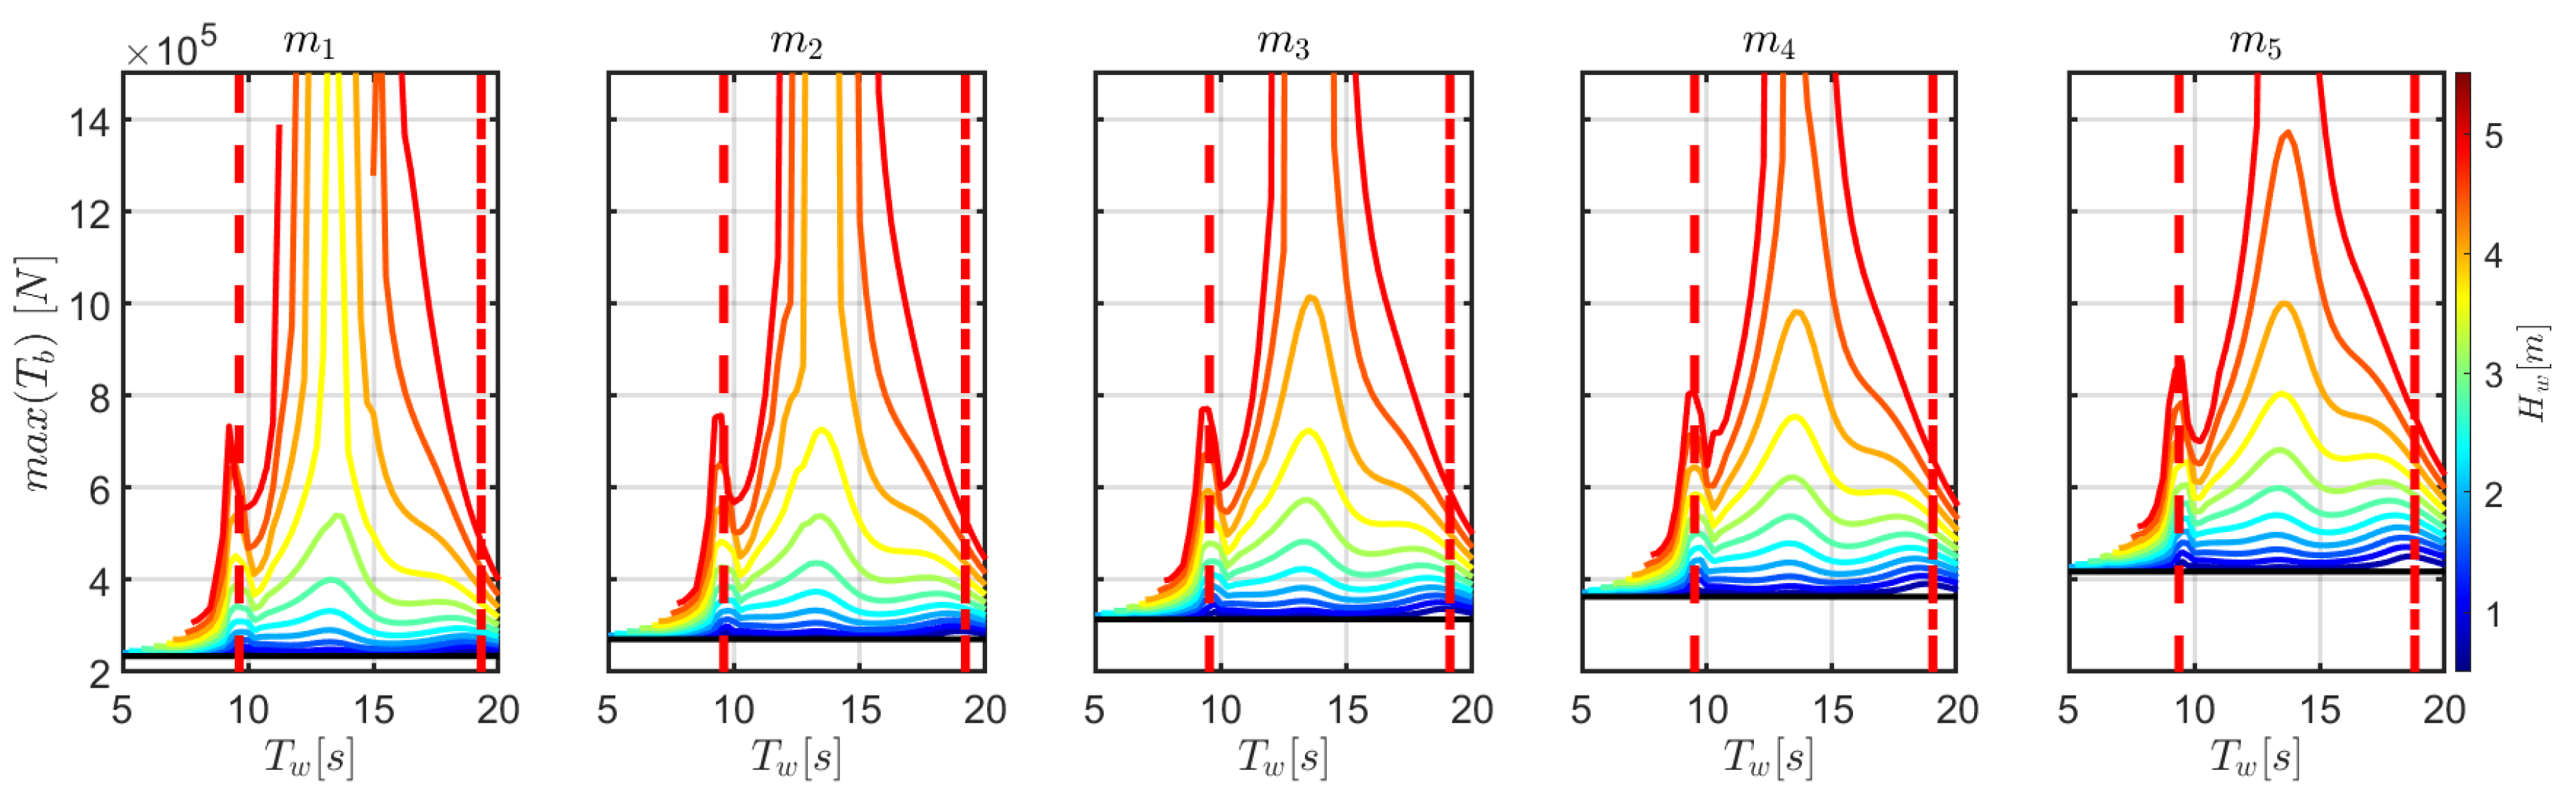
Figure 10 shows the peak load on the front line at the fairlead. While the color bar represents different wave heights, the bottom black line represents the line pre-tension. Similar trends to
Figure 8 are found, with a local maximum at the period where parametric resonance occurs and another peak at about 14 s, where the mean surge displacement is significant. Although the pre-tension increases from
to
, the peak loads remain approximately unchanged, meaning that tension oscillations on the line are reduced, which is favorable for fatigue resistance. However, as survivability conditions draw closer, higher loads arise for configurations with a lower pre-tension.
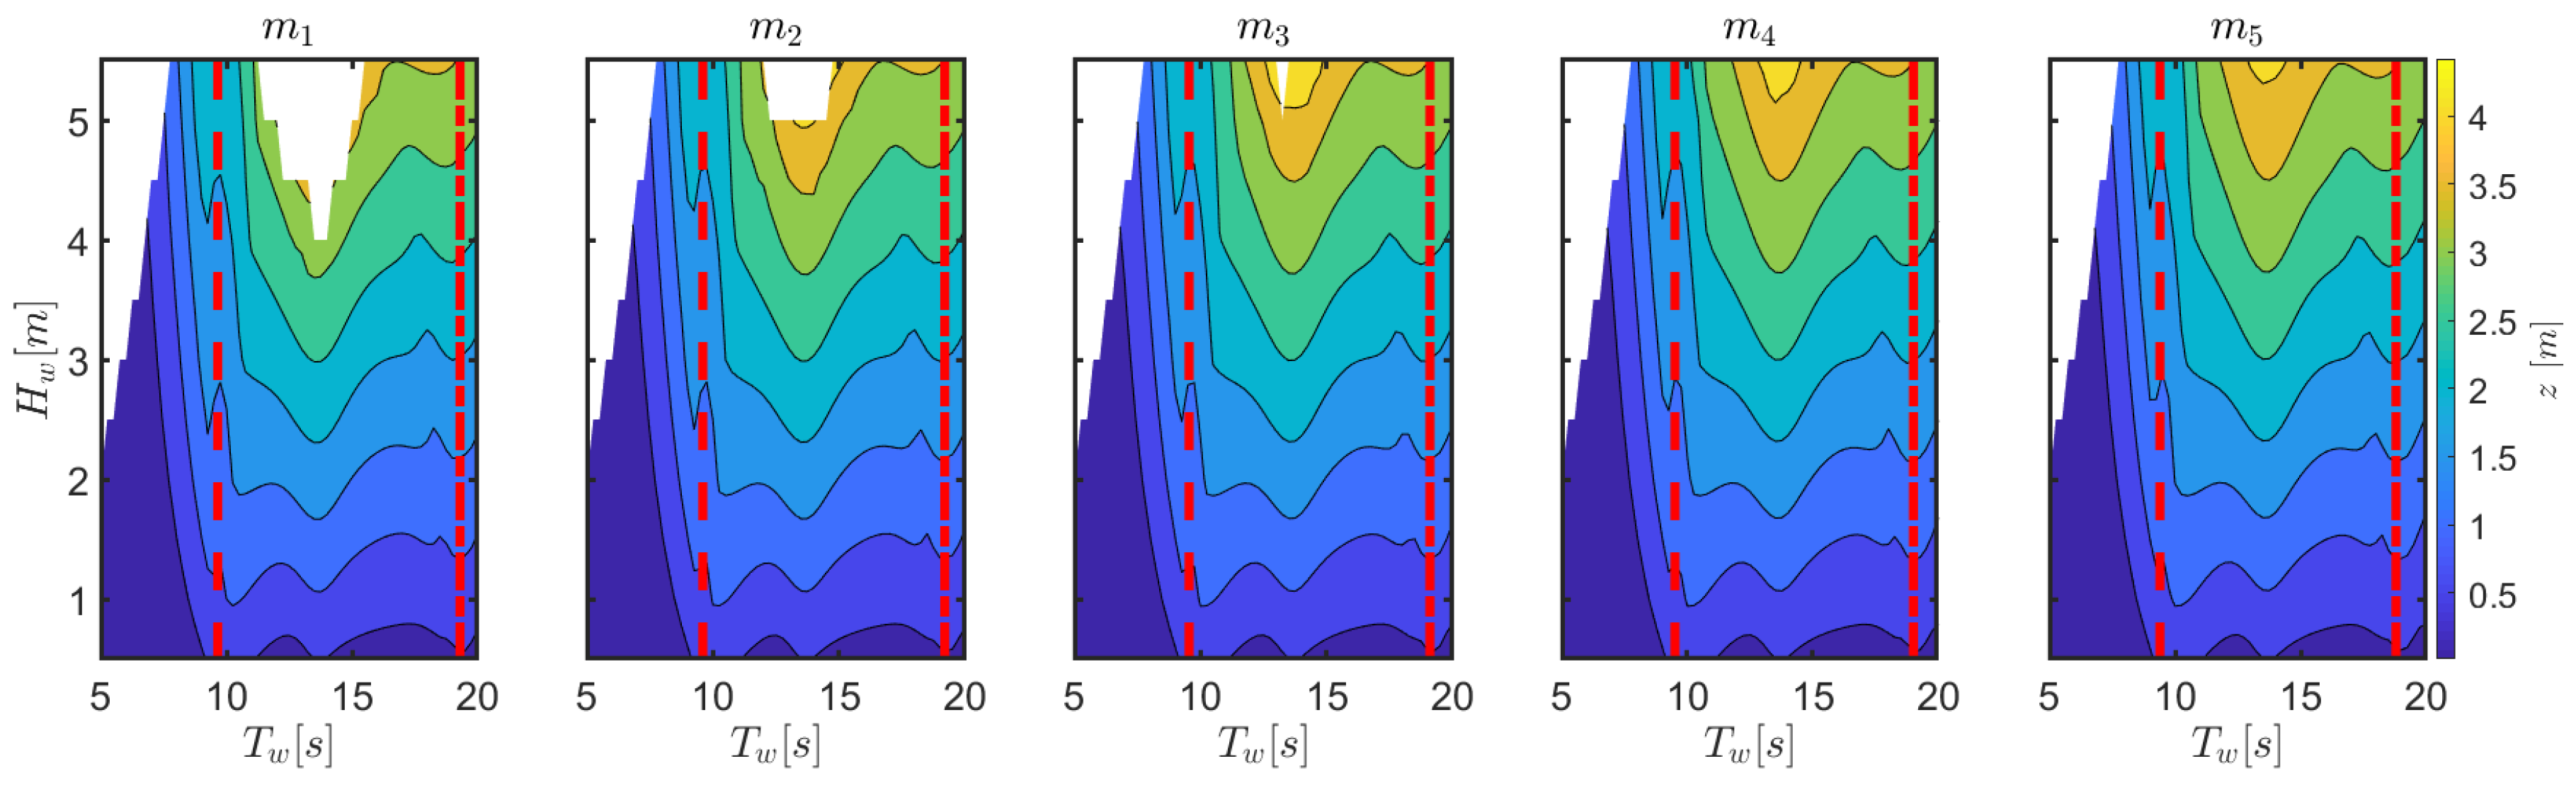
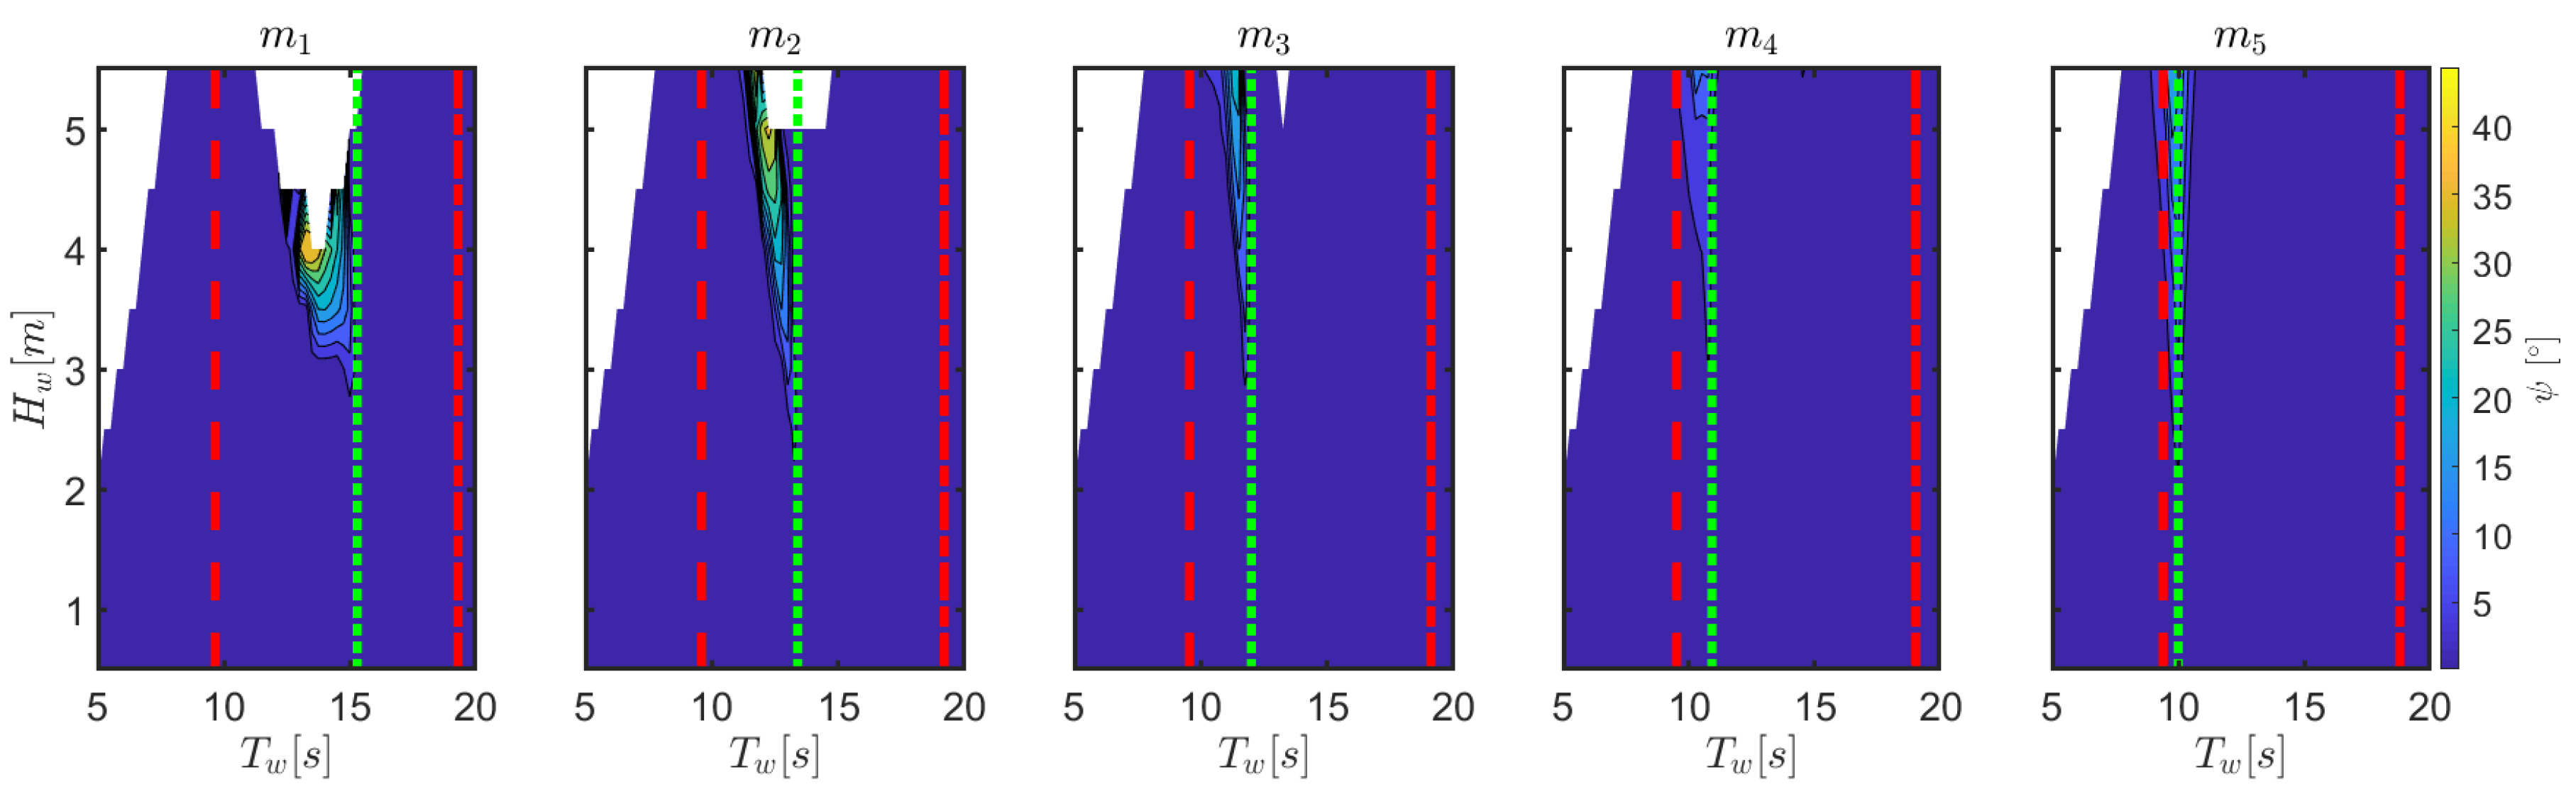
Figure 11 shows that the heave response is significantly independent of the changes of the considered mooring parameters, therefore the power conversion abilities of the device are unaffected. In fact,
Figure 12 shows that both the wave period range and the severity of parametric resonance is almost unaltered across different mooring configurations, although it is slightly lower with higher pre-tension. This is consistent with the natural periods tabulated in
Table 5, since
remains significantly constant.
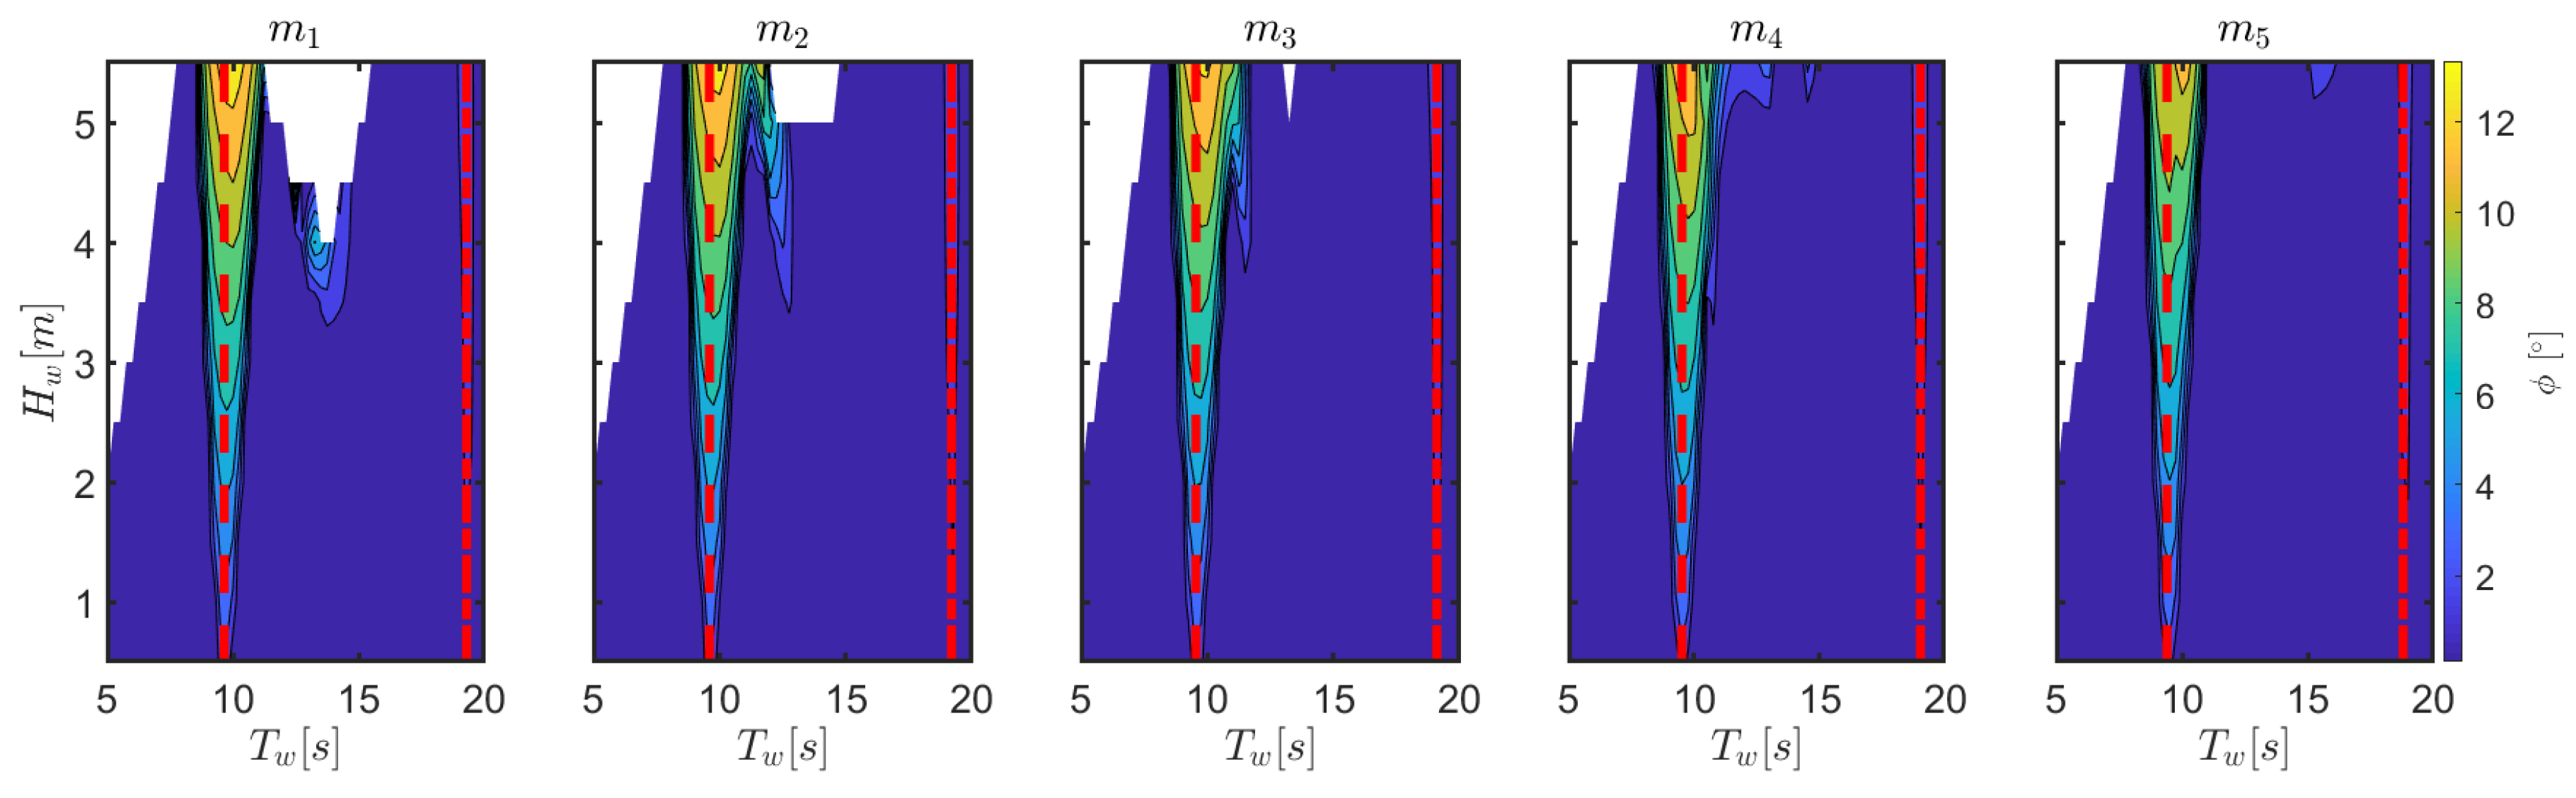
Finally, it is interesting to study the variations of yaw response, since
Figure 6 suggested the occurrence of a parametric resonance effect for yaw at
equal to half
. This hypothesis is confirmed in
Figure 13, where the peak of the yaw response shift is in agreement with half the natural period of yaw, as tabulated in
Table 5.
4. Conclusions
Nonlinear models are essential tools for the effective and trustworthy design of wave energy converters. As the development progresses from proof of concept to full scale deployment, the complexity of the system increases, as well as the difficulties to attain an accurate representation of the whole behavior. Moreover, fidelity requirements represent a discriminating role of the eventual success of the device, since they have a great impact on power conversion ability, design and cost of components, and survivability.
This paper tackles the modeling challenges of the spar-buoy OWC device, considering a realistic mooring system and the effects of changing some of its design parameters. Several recent experiments have highlighted the occurrence of parametric instability in this device, and this paper provides a mathematical model able to articulate such a nonlinear phenomenon, thanks to the inclusion of nonlinear Froude–Krylov forces, while still being able to compute in about real-time. Moreover, nonlinear kinematics and a 6-DoF integral formulation of drag forces due to viscous effects are included. Finally, a fast quasi-static model for the mooring system is produced and used as a design tool for investigating the sensitivity of the response and the mooring line tension, depending on changes to the jumper and clump-weight masses.
As expected, when the excitation period is half the natural period in pitch and roll, the model is able to predict parametric resonance, with coupled effects on surge and sway and with a detrimental impact on heave response and, consequently, useful energy extraction. Furthermore, due to the mooring system, a parametric response in yaw is also obtained.
The heave response in the power production region, hence the power conversion performance, is found to be significantly insensitive to the considered changes in mooring parameters. Moreover, also the parametric roll response, which is detrimental for power extraction, is found to have little dependence on different mooring configurations. Consequently, as far as the choice of clump-weight and jumper mass is concerned, it is possible to decouple the mooring design problem from the efficiency maximization problem for a given sea state. However, different mooring configurations can increase (decrease) the power production region while decreasing (increasing) the survivability region, effectively modifying the global power conversion capability of a device over a given scatter diagram of the installation site.
In fact, the mooring pre-tension is found to have a great impact on the mean displacement in surge due to wave drift effects and, ultimately, on the survivability conditions. In fact, as the front mooring line has a lower pre-tension, the likelihood of it becoming fully stretched line is higher, thus reducing the intended normal operational conditions of the device. Furthermore, oscillations of the mooring loads are smaller with higher pre-tensions, which is favorable in perspective of fatigue load design.
Nevertheless, in this study, only the jumper and clump-weight masses are changed. Mooring line lengths, position of the anchor and number of lines are further degrees of freedom that the WEC developer can use to mitigate undesirable effects, e.g., parametric resonance. This can be coupled with a techno-economic problem, since length determines cost, and a feasibility problem, since the area where mooring lines can be laid on is usually restricted, either by local policies or the cost of rented area (for full scale deployments) or wave tank dimensions (for experimental tests). However, for all these scenarios, the model proposed in this paper can be used to assist decision-making and design.


