Article

Trends in the Recent Evolution of Coastal Lagoons and Lakes in Galicia (NW Iberian Peninsula)

by
Pedro Fraga-Santiago
1,
Alejandro Gómez-Pazo
2,3,*,
Augusto Pérez-Alberti
3,
Pablo Montero
1 and
Xose Lois Otero Pérez
1
1
Departamento de Edafoloxía e Química Agrícola, Facultade de Bioloxía, Universidade de Santiago de Compostela, 15782 Santiago de Compostela, Spain
2
Departamento de Xeografía, Universidade de Santiago de Compostela, 15782 Santiago de Compostela, Spain
3
Cross-Research in Environmental Technologies (CRETUS), Universidade de Santiago de Compostela, 15782 Santiago de Compostela, Spain
*
Author to whom correspondence should be addressed.
J. Mar. Sci. Eng. 2019, 7(8), 272; https://doi.org/10.3390/jmse7080272
Submission received: 3 July 2019 / Revised: 8 August 2019 / Accepted: 12 August 2019 / Published: 14 August 2019
(This article belongs to the Special Issue Coastal Morphodynamics II)

Abstract

:
Coastal lagoons are habitats of great environmental value. However, they are currently subject to major threats, particularly due to increasing sea levels. This study aims to identify changes—both natural and induced by anthropic activity—and their impact on the recent evolution of three different types of coastal lagoons in Galicia (Louro, Vixán, and Xuño). The application of information obtained through laser imaging detection and ranging (LiDAR) techniques suggests that the outer limits of the three lagoon systems have not experienced any relevant changes in the last 60 years (i.e., no occupation of the lagoon area has been identified). However, the internal configuration of these wetland areas has experienced some alterations. A generalized increase in the area occupied by macrophytic communities (Phragmites australis, Scirpus maritimus, Juncus maritimus, etc.) has been observed. Image interpretation by geographic information systems (GIS) and field surveys suggest that the area currently occupied by macrophytes experienced a 7% to 63% increase at the expense of the free water body. This loss of flooded area is consistent with the increase in sedimentation rates associated with the convergence of several causes, such as the abandonment of traditional macrophyte biomass harvesting and agricultural activities around the lagoons, the expansion of riparian forests, and sediment contributions by erosion due to recurrent forest fires within the drainage basins of each lagoon. Finally, water and sediment composition suggest that, of the three studied lagoons, two of them (Louro and Vixán) are included within the definition of “coastal lagoons” (habitat code 1150) by the Habitats Directive (Directive 92/43/EEC), while the Xuño lagoon should be considered a “natural eutrophic lake” (habitat code 3150).

1. Introduction

Coastal wetlands are fragile and currently highly endangered ecosystems. For centuries, coastline anthropization has led to the alteration or destruction of many of these habitats. According to [1], around 50% of the world’s wetlands have been lost since 1900. Although the rate of wetland loss has decelerated in Europe and has been low in North America since the 1980s, it remains high in Asia due to the ongoing, fast-paced, large-scale transformation of natural coastal and inland wetlands. In Europe, the progressive destruction of wetlands can be traced back at least to Roman times [1,2], while it has been taking place since the 17th century in North America and southern Africa [3,4], and for at least 2000 years in China [5]. Additionally, global change, including the associated increase in sea level and eutrophication, represents another serious issue that threatens the conservation of these habitats [6].
The historical preference for coastal areas to build urban and industrial settlements is the main cause for major alteration of coastal habitats. Thirty seven percent of the world’s population lives less than 100 km away from the coast [7], and 10% of the population inhabits the most vulnerable areas [8]. In the case of the European Union, half the population of the member states lived within 50 km from the coastline in 2001.
Within the European context, the coast of Galicia (NW Spain) is located between the mouths of the rivers Miño, in the south, and Eo, in the northeast. It is a predominantly rocky, steep, low-altitude coast, with 86% of the coastline below 100 m high and only 0.76% reaching heights of 300 m [9]. In terms of lithology, granites and granodiorites dominate, appearing interspersed with sedimentary sections or with metamorphic rocks such as schists and slate in some areas.
Structural and lithological controls have led to the presence of a markedly tortuous coastline, with alternating inlets and land protrusions extending over a length of 2100 km [10]. At the regional scale, rias, peninsulas, and straight sections of coastline can be identified in Galicia. Conversely, as the scale increases, meso- and microforms evidence the differential evolution related to patterns at more local scales. Within the defined geodynamic units, it is worth highlighting coastal cliffs and shore platforms, marshlands, and beach-dune systems. Associated with the latter, coastal wetlands can be observed, occupying around 311 hectares (ha) in 2009 [10], and in which lagoons are found. Coastal lagoons are habitats of major environmental interest, considered priority habitats by the Habitat Directive, and they must be protected by European Union member states.
This study aims to characterize and identify changes, both natural and induced by anthropic activity, and their impact on the recent evolution of three different types of coastal lakes in Galicia (Louro, Vixán, and Xuño). The Louro lagoon constitutes a semi-open lagoon; the Vixán lagoon is a closed-type lagoon; and the Xuño lagoon is an example of a sand dune lagoon [11]. The secondary objective of this work is to establish the extent to which these three coastal lakes fit the definition of coastal lagoons habitats (habitat code 1150) as established by the Habitats Directive (Directive 92/43/EEC).
The selected coastal lagoons are located in the Atlantic coast of the A Coruña province (Galicia, NW Iberian Peninsula). The Louro lagoon (42°45′23″ N, 9°5′36″ W) is located in the northern bank of the ria of Muros and Noia. The Xuño lagoon (42°38′0″ N, 9°2′19″ W) is located behind the Areas Longas beach, in a section of the coast that is mainly exposed to swell with a NW component (Figure 1). The Vixán lagoon (42°32′29″ N, 9°1′27″ W) is located at the end of the Barbanza peninsula, within the Corrubedo Dune Complex and Carregal and Vixán Lagoons Natural Park.

2. Material and Methods

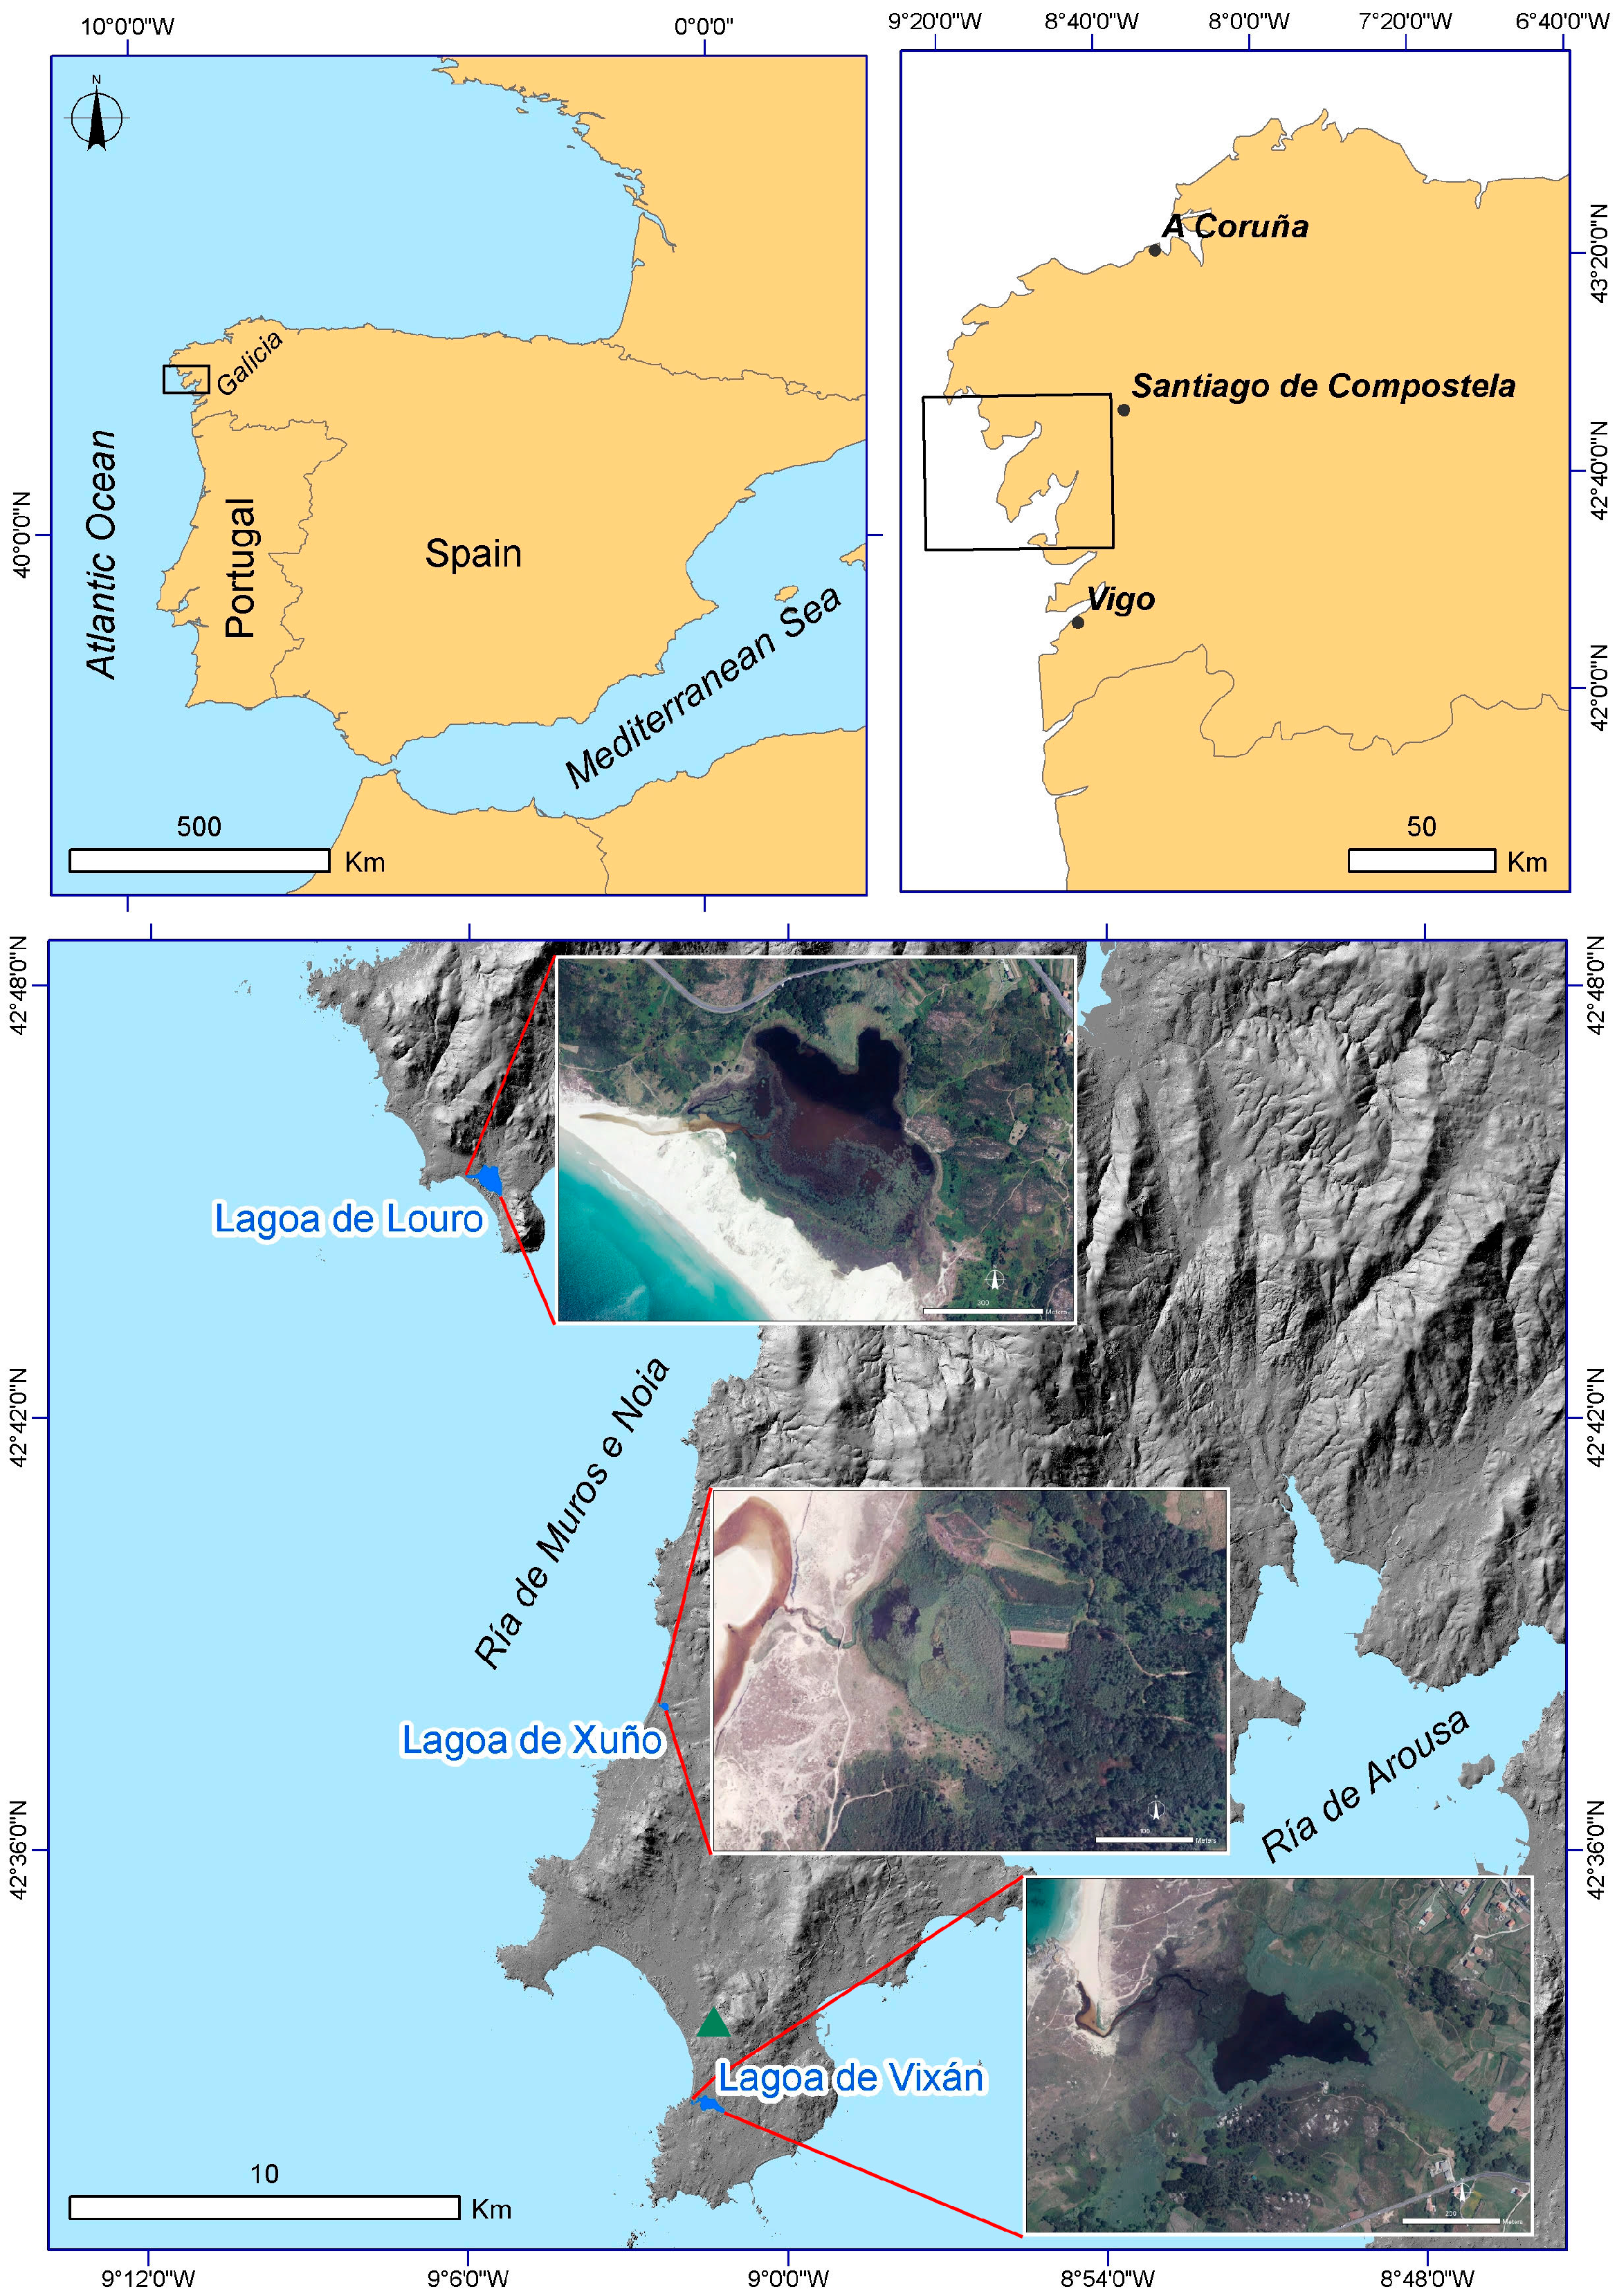
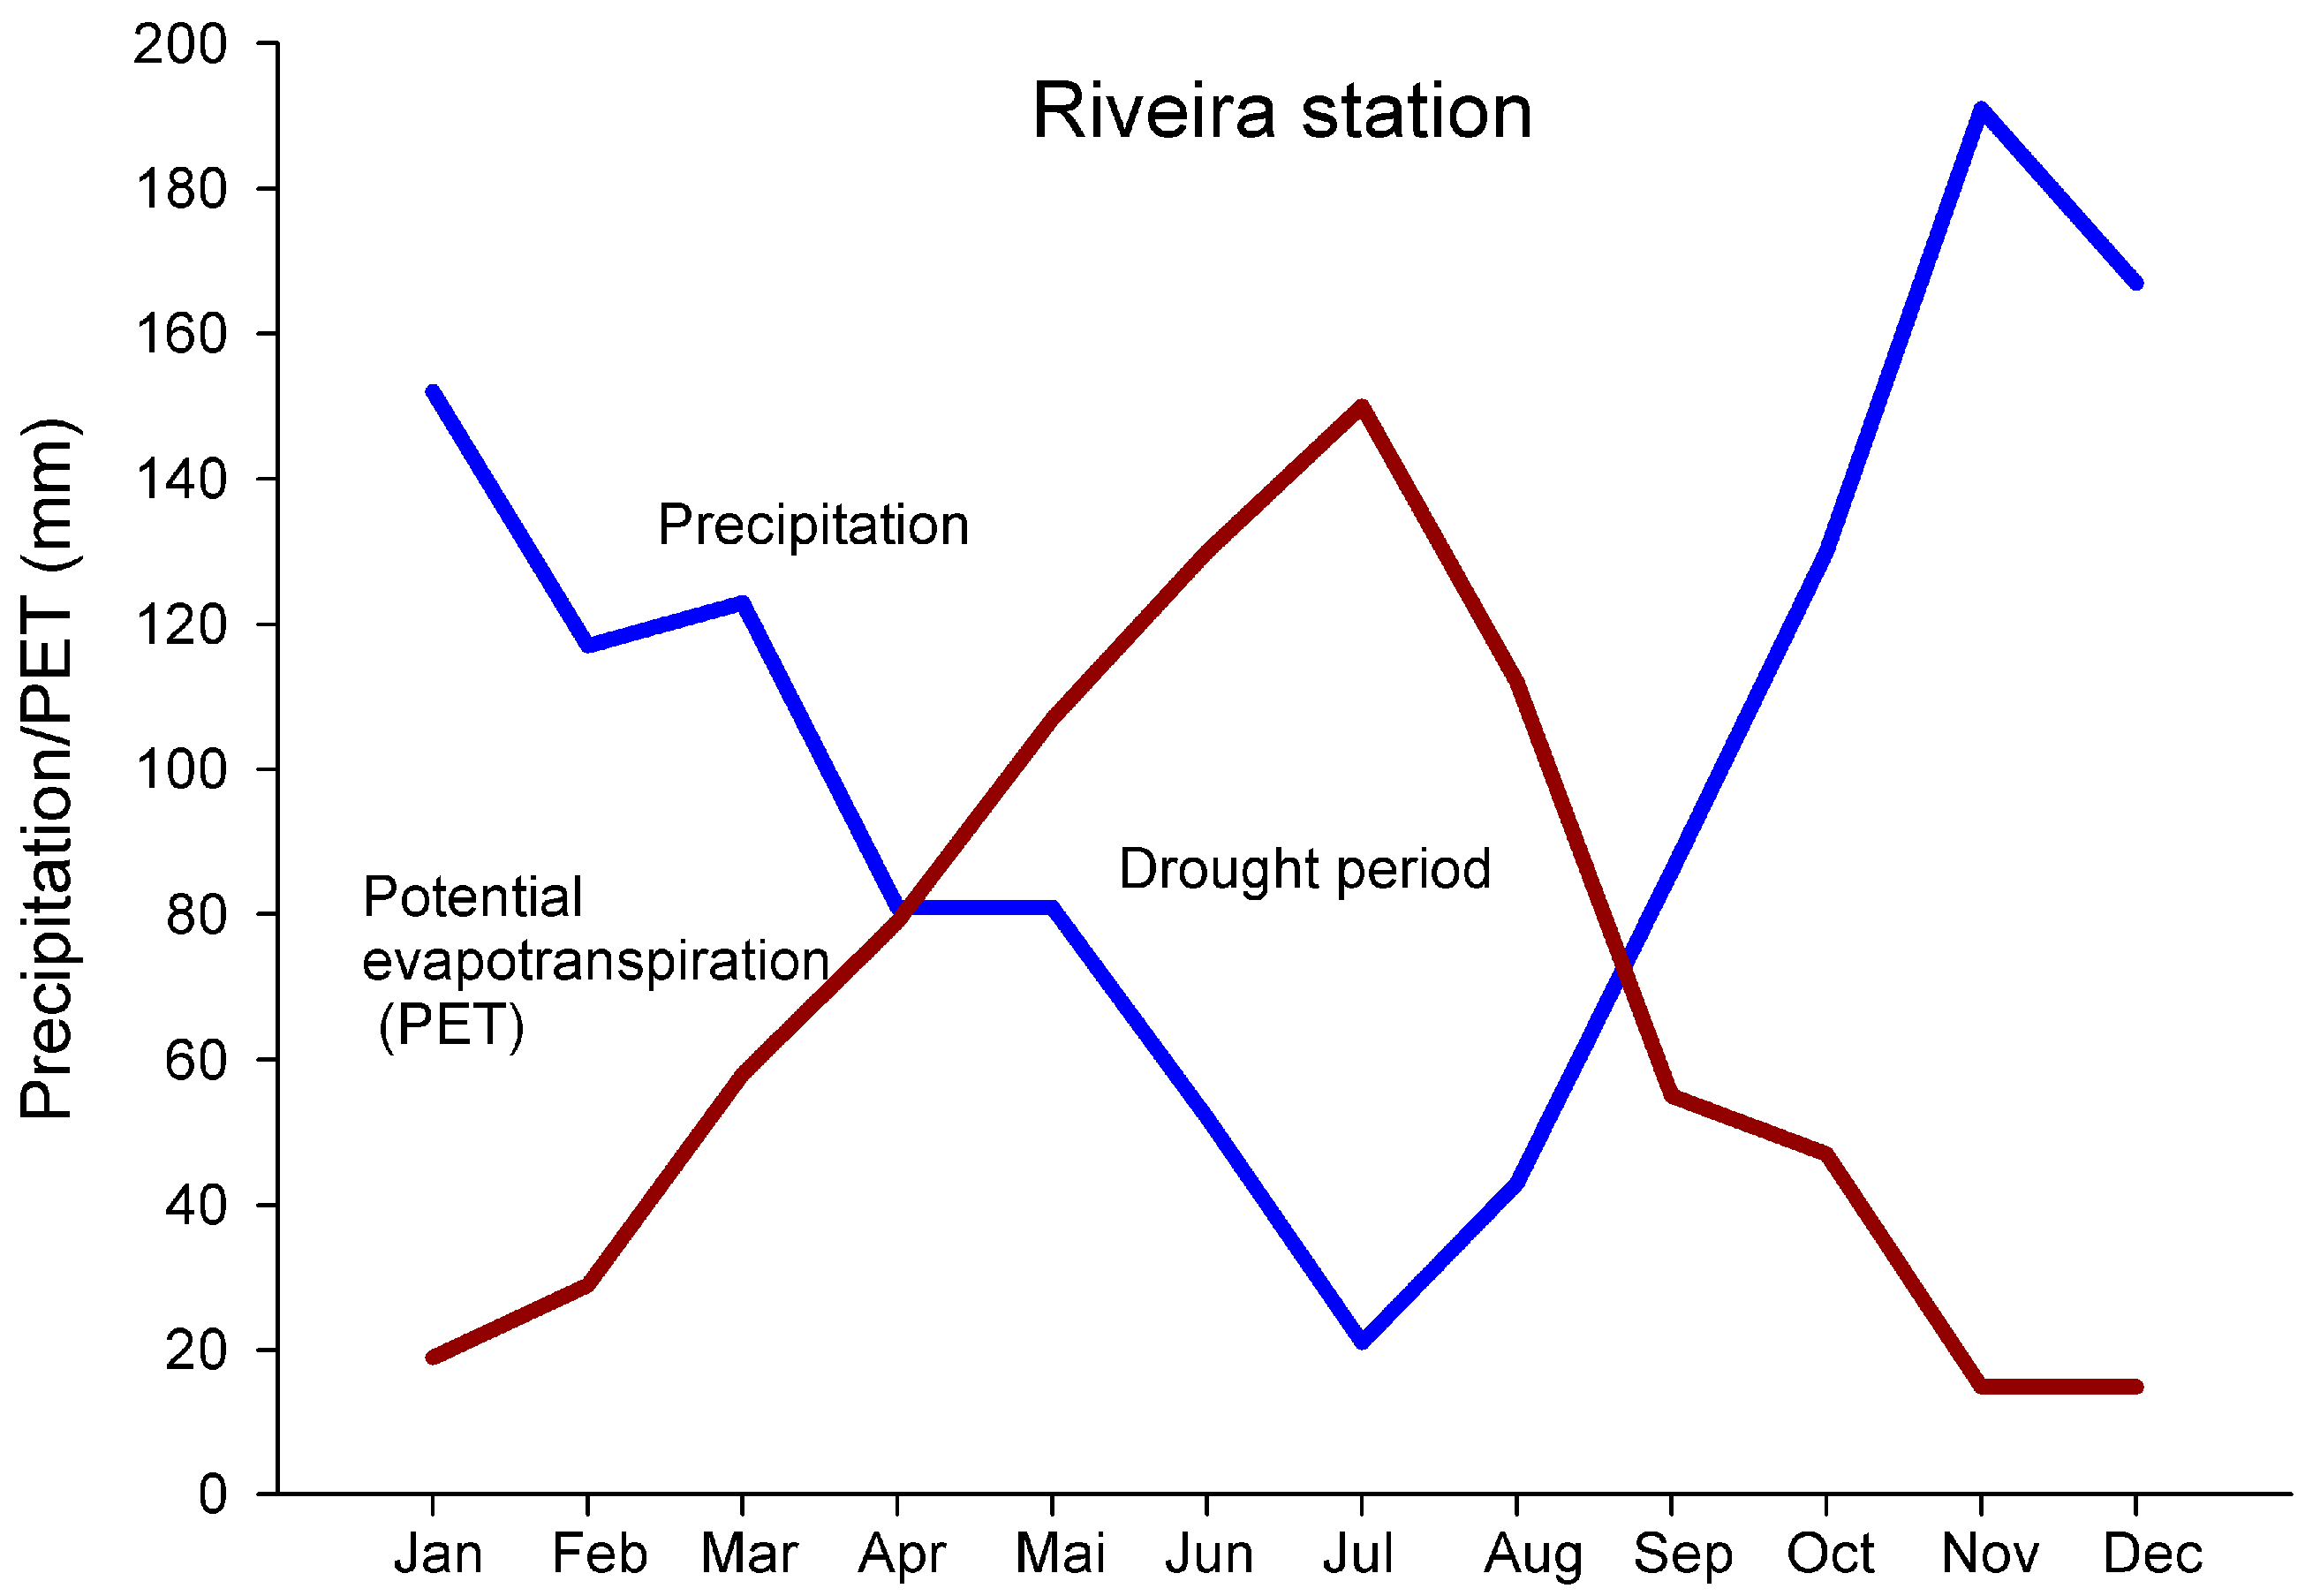
2.1. Environmental Setting

The three lagoons are located in the Atlantic coast of Galicia (NW Iberian Peninsula). This coastline features an important number of lagoons of great environmental interest, all of which are included in the Natura 2000 network. The geological substrate consists of granites and metamorphic rocks (mainly schist). This region has a maritime Mediterranean climate, annual average temperature is 14.6–16.2 °C, and average rainfall ranges from 1244 to 1828 mm/year (Figure A1). Seventy percent of this rainfall is concentrated in the period between October and March, while intense drought periods occur in the summer [12].
Topographically speaking, the Louro lagoon, with an average elevation of 1.84 m above sea level (masl) calculated using laser imaging detection and ranging (LiDAR) data, and the Vixán lagoon (3.14 masl) are located between two rocky protrusions connected by a sandbar closing the direct outlet of small freshwater tributaries to the sea (Figure 1). Both of them can be classified within the coastal lagoon typology, showing a triangular (∆) shape with its apex pointing landward and its base along the seaward shore, which corresponds to a sandbar forming a beach, a well-developed dune system, and a lagoon behind it that is separated from the sea by narrow barriers of land [13]. A variety of coastal water bodies exists, ranging from areas totally enclosed by land to areas primarily exposed to the sea. The enclosed features, which are primarily shielded from the sea, are called coastal ponds and lakes. Bodies of water with outlets to the sea are called coastal bays or lagoons, depending on their shapes. Oertel in [13,14] called these features “barrier lagoons” because of their association with coastal barriers. In general, coastal lakes and lagoons form secondary coastlines behind the main ocean coastline. The inner shores of these secondary coastlines are shielded from direct exposure to ocean waves, the connection between these lagoons and the sea occurs through a channel (Figure 1), and the main difference between them lies in its functioning. In the Louro lagoon, the channel is still active; therefore, in winter, concurrently with the period of maximum water availability in the system, water overflows to the ocean, while occasional overwash or tidal pumping can lead to ephemeral periods of seawater entrance. Conversely, the channel in the Vixán lagoon is permanently closed; only prior to 1992, when the Corrubedo Dune Complex and Carregal and Vixán Lagoons Natural Park was designated, locals used to open it to drain nearby croplands. Nowadays, this activity is completely prohibited.
The Xuño lagoon, with a 5.28 m elevation asl, is smaller in size and is located on the limit of the dune system associated with the Areas Longas beach (Porto do Son, A Coruña). It can be classified within the type known as cat’s eye ponds due to its small size and lenticular shape; alternatively, it could also be classified as a coastal back-barrier perched lake [15]. Its elevation is higher than in the case of the other lagoons and, therefore, seawater never reaches it. This lagoon has a small channel through which freshwater overflows into another channel connecting another coastal lagoon of larger size (San Pedro de Muro lagoon) with the sea.

2.2. Lagoon Delimitation and Zoning

The functional area of each lagoon was determined using information obtained using LiDAR (laser imaging detection and ranging) by the Spanish National Geographical Institute (Instituto Geográfico Nacional de España, IGN). These data allowed for the generation of a digital terrain model (DTM) with 1 m spatial resolution. From this file, the functional area of each lagoon was delimited, considering the elevation of these areas, as well as the slopes associated with their borders.
Zoning of each one was performed by photointerpretation of available aerial images and orthophotographs from the years 1956, 1984, 1989, 2001, 2004, 2008, 2010, 2014, and 2017, except for the Louro lagoon, for which the 2001 aerial image was not available. Photograms of the first two years consist of black and white images; images for the first year were obtained by the American flight, B series (1956–1957), while those for the second year were obtained from the national flight (1980–1986). Photograms for 1989 correspond to the coastal flight (1989–1991), while 2001 images come from the five-year flight (1999–2003). From 2004 onwards, color images were obtained from the National Aerial Orthophotography Program (Plan Nacional de Ortofotografía Aérea, PNOA) of the National Geographical Institute. The images used in this study represent the total available number of high-resolution images of the study areas for the analyzed period. In this case, we decided not to select satellite images because their spatial resolution would not allow for their correct comparison with aerial images and orthophotographs.
Each one of the units was delimited using ArcGIS 10.5 at 1:1000 scale for all the dates, using hectares (ha) as the measurement unit to analyze variations in area coverage. The delimitation process in aerial images was done manually using different remote sensing techniques, such as color, texture, and context. It is worth noting that uncertainty is greater for older dates, due to the lower resolution of the images and the greater complexity of black and white photointerpretation [16].
To determine the temporal changes that occurred in each lagoon, the following units were delimited:
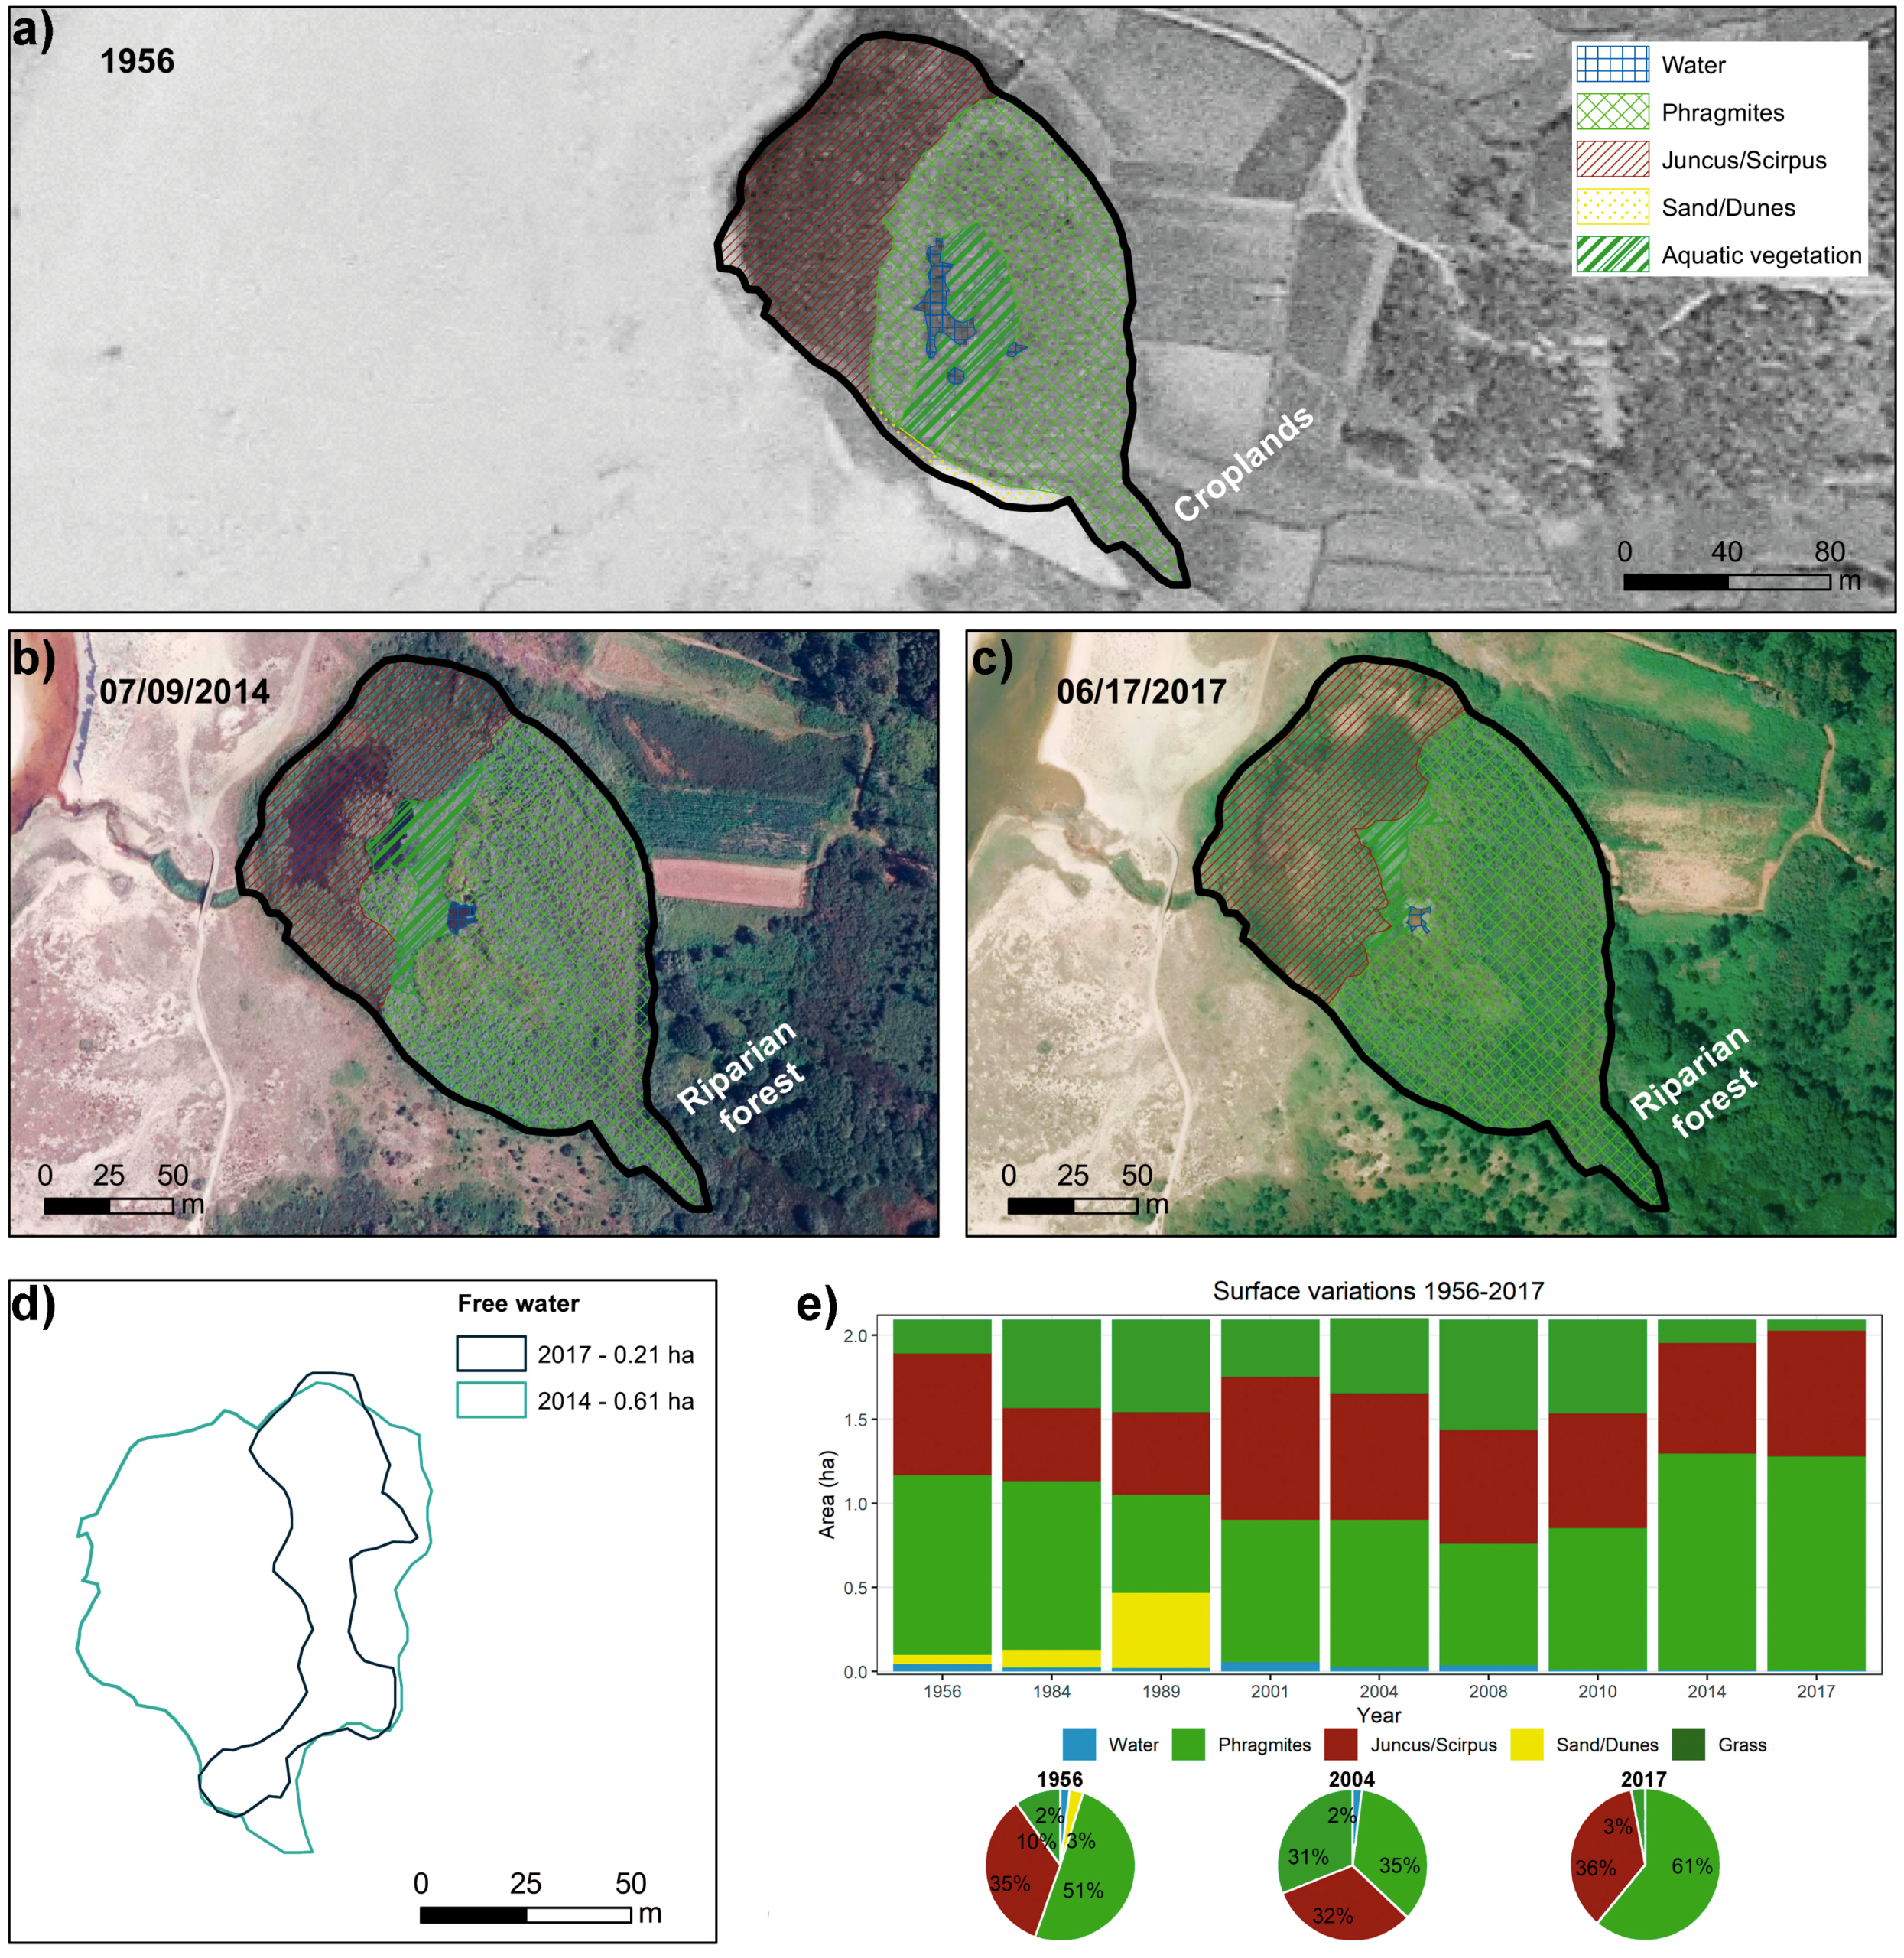
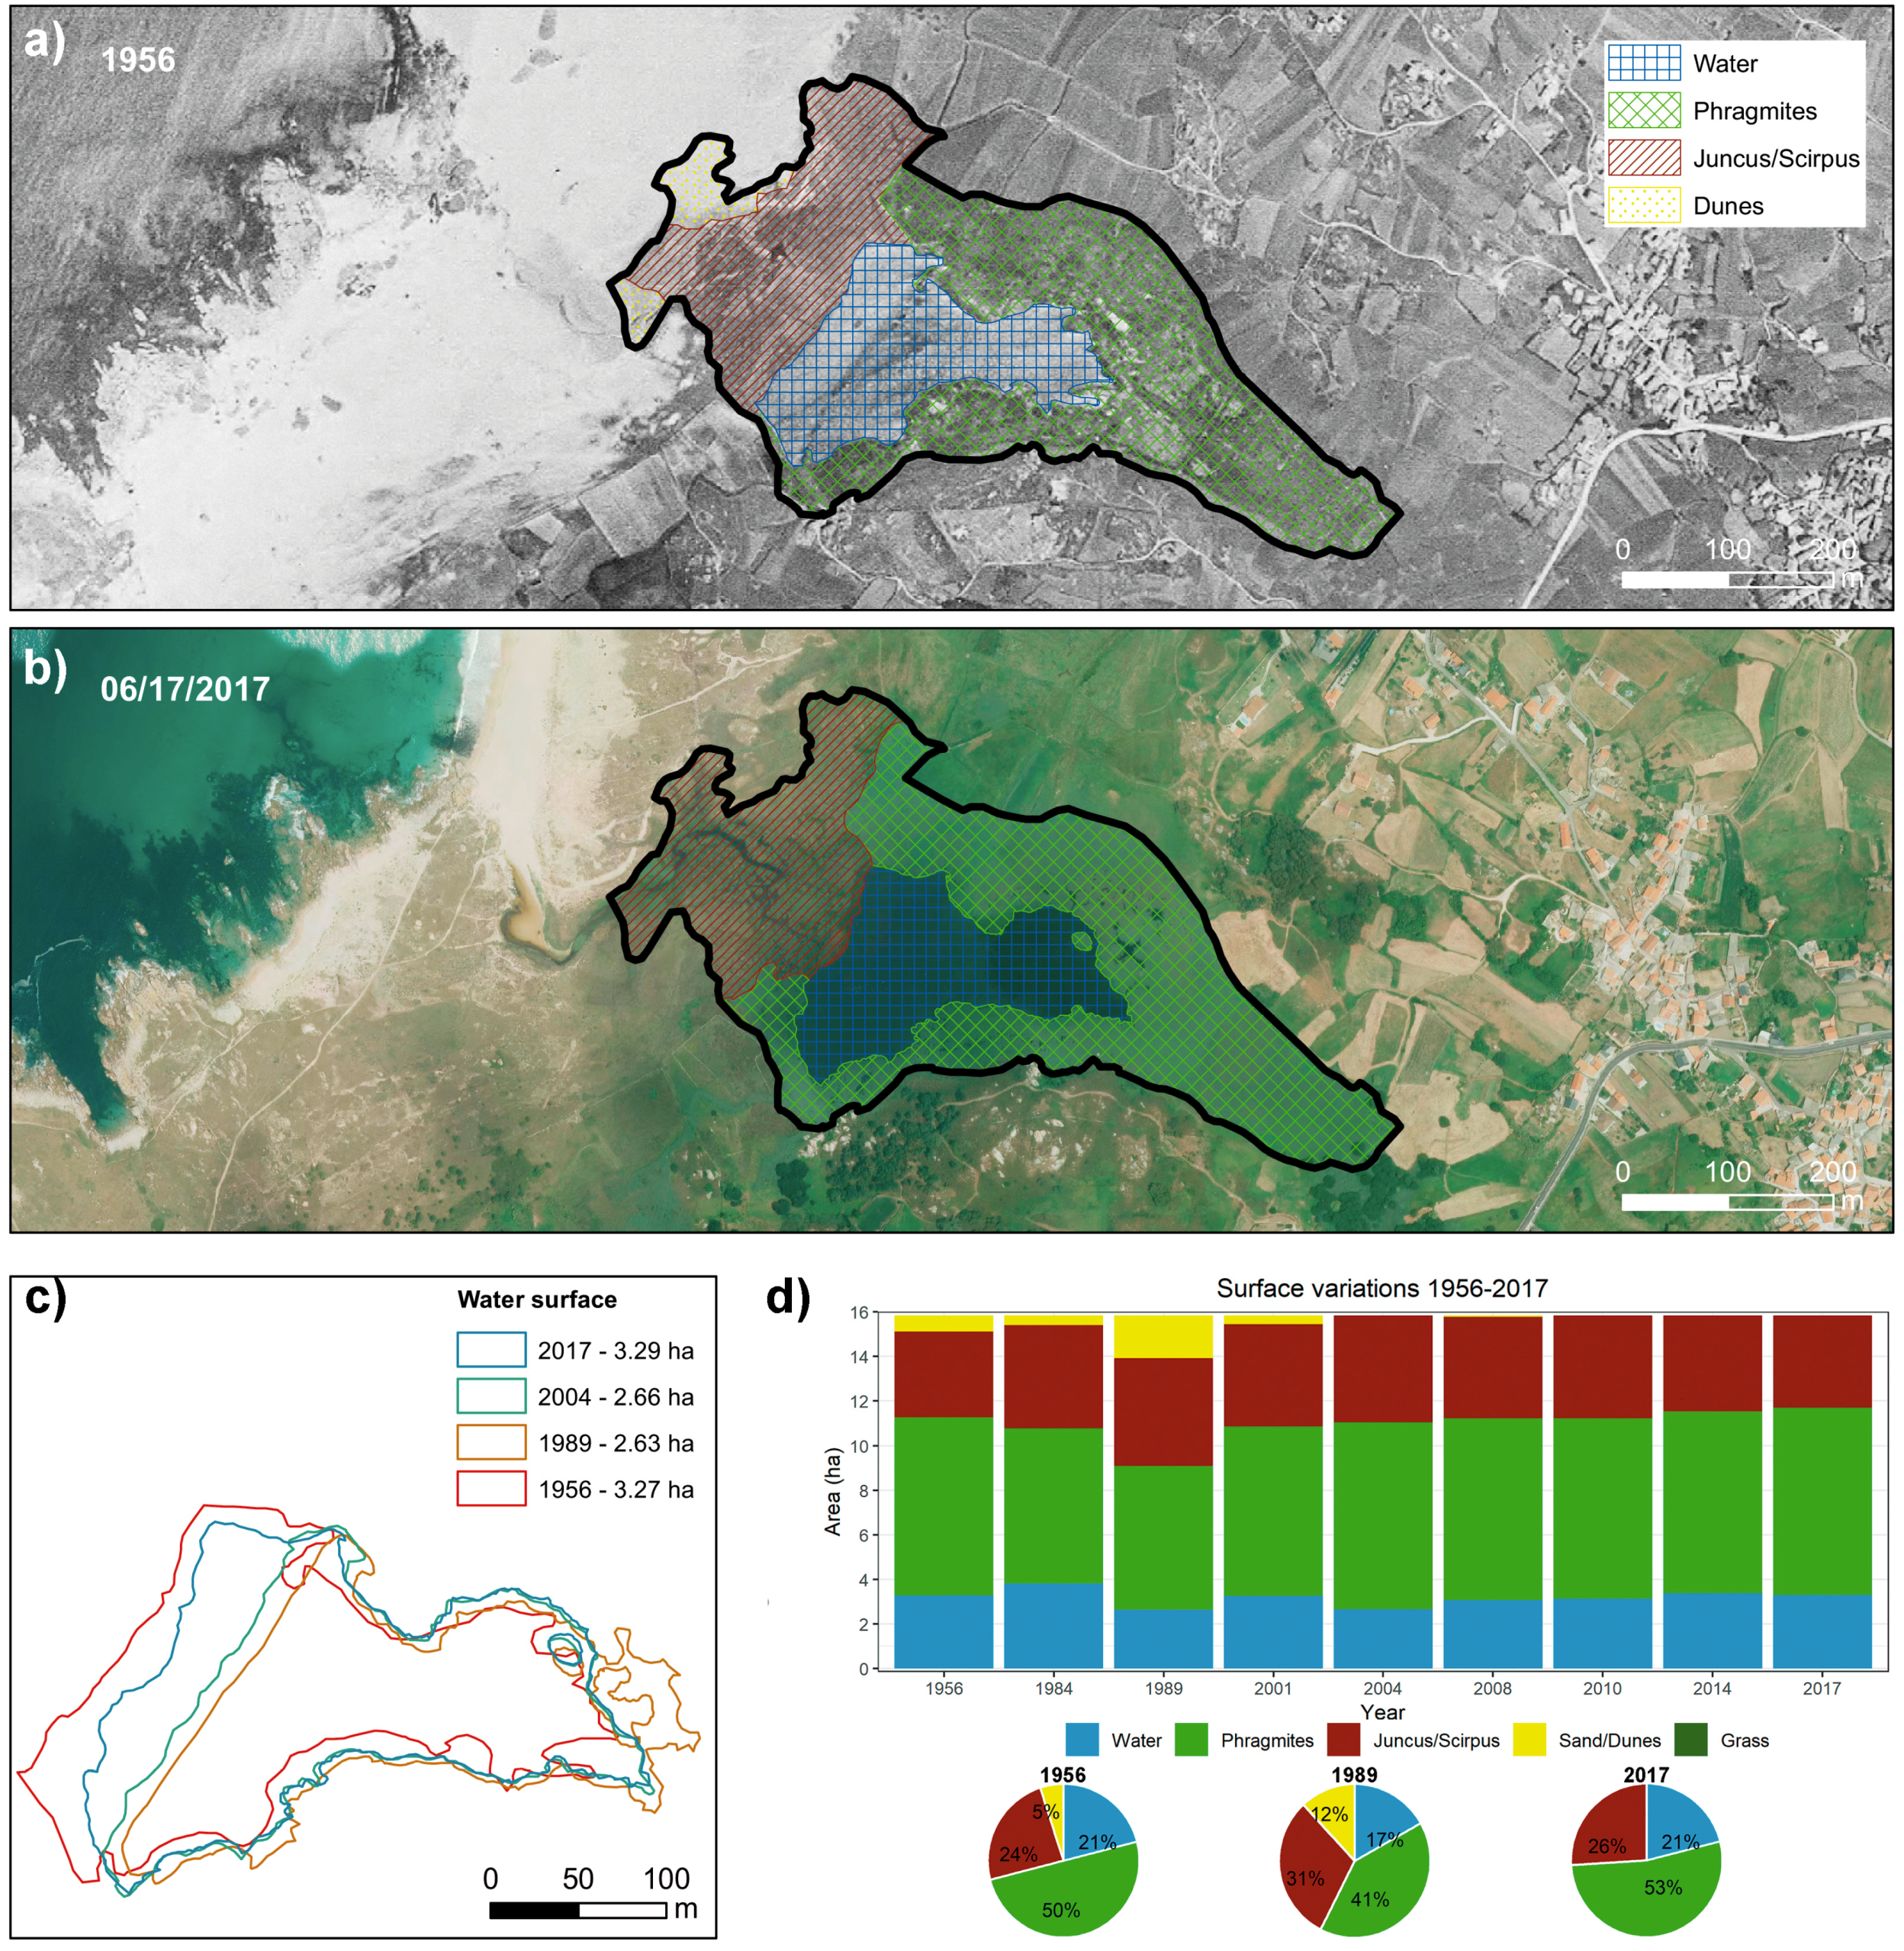
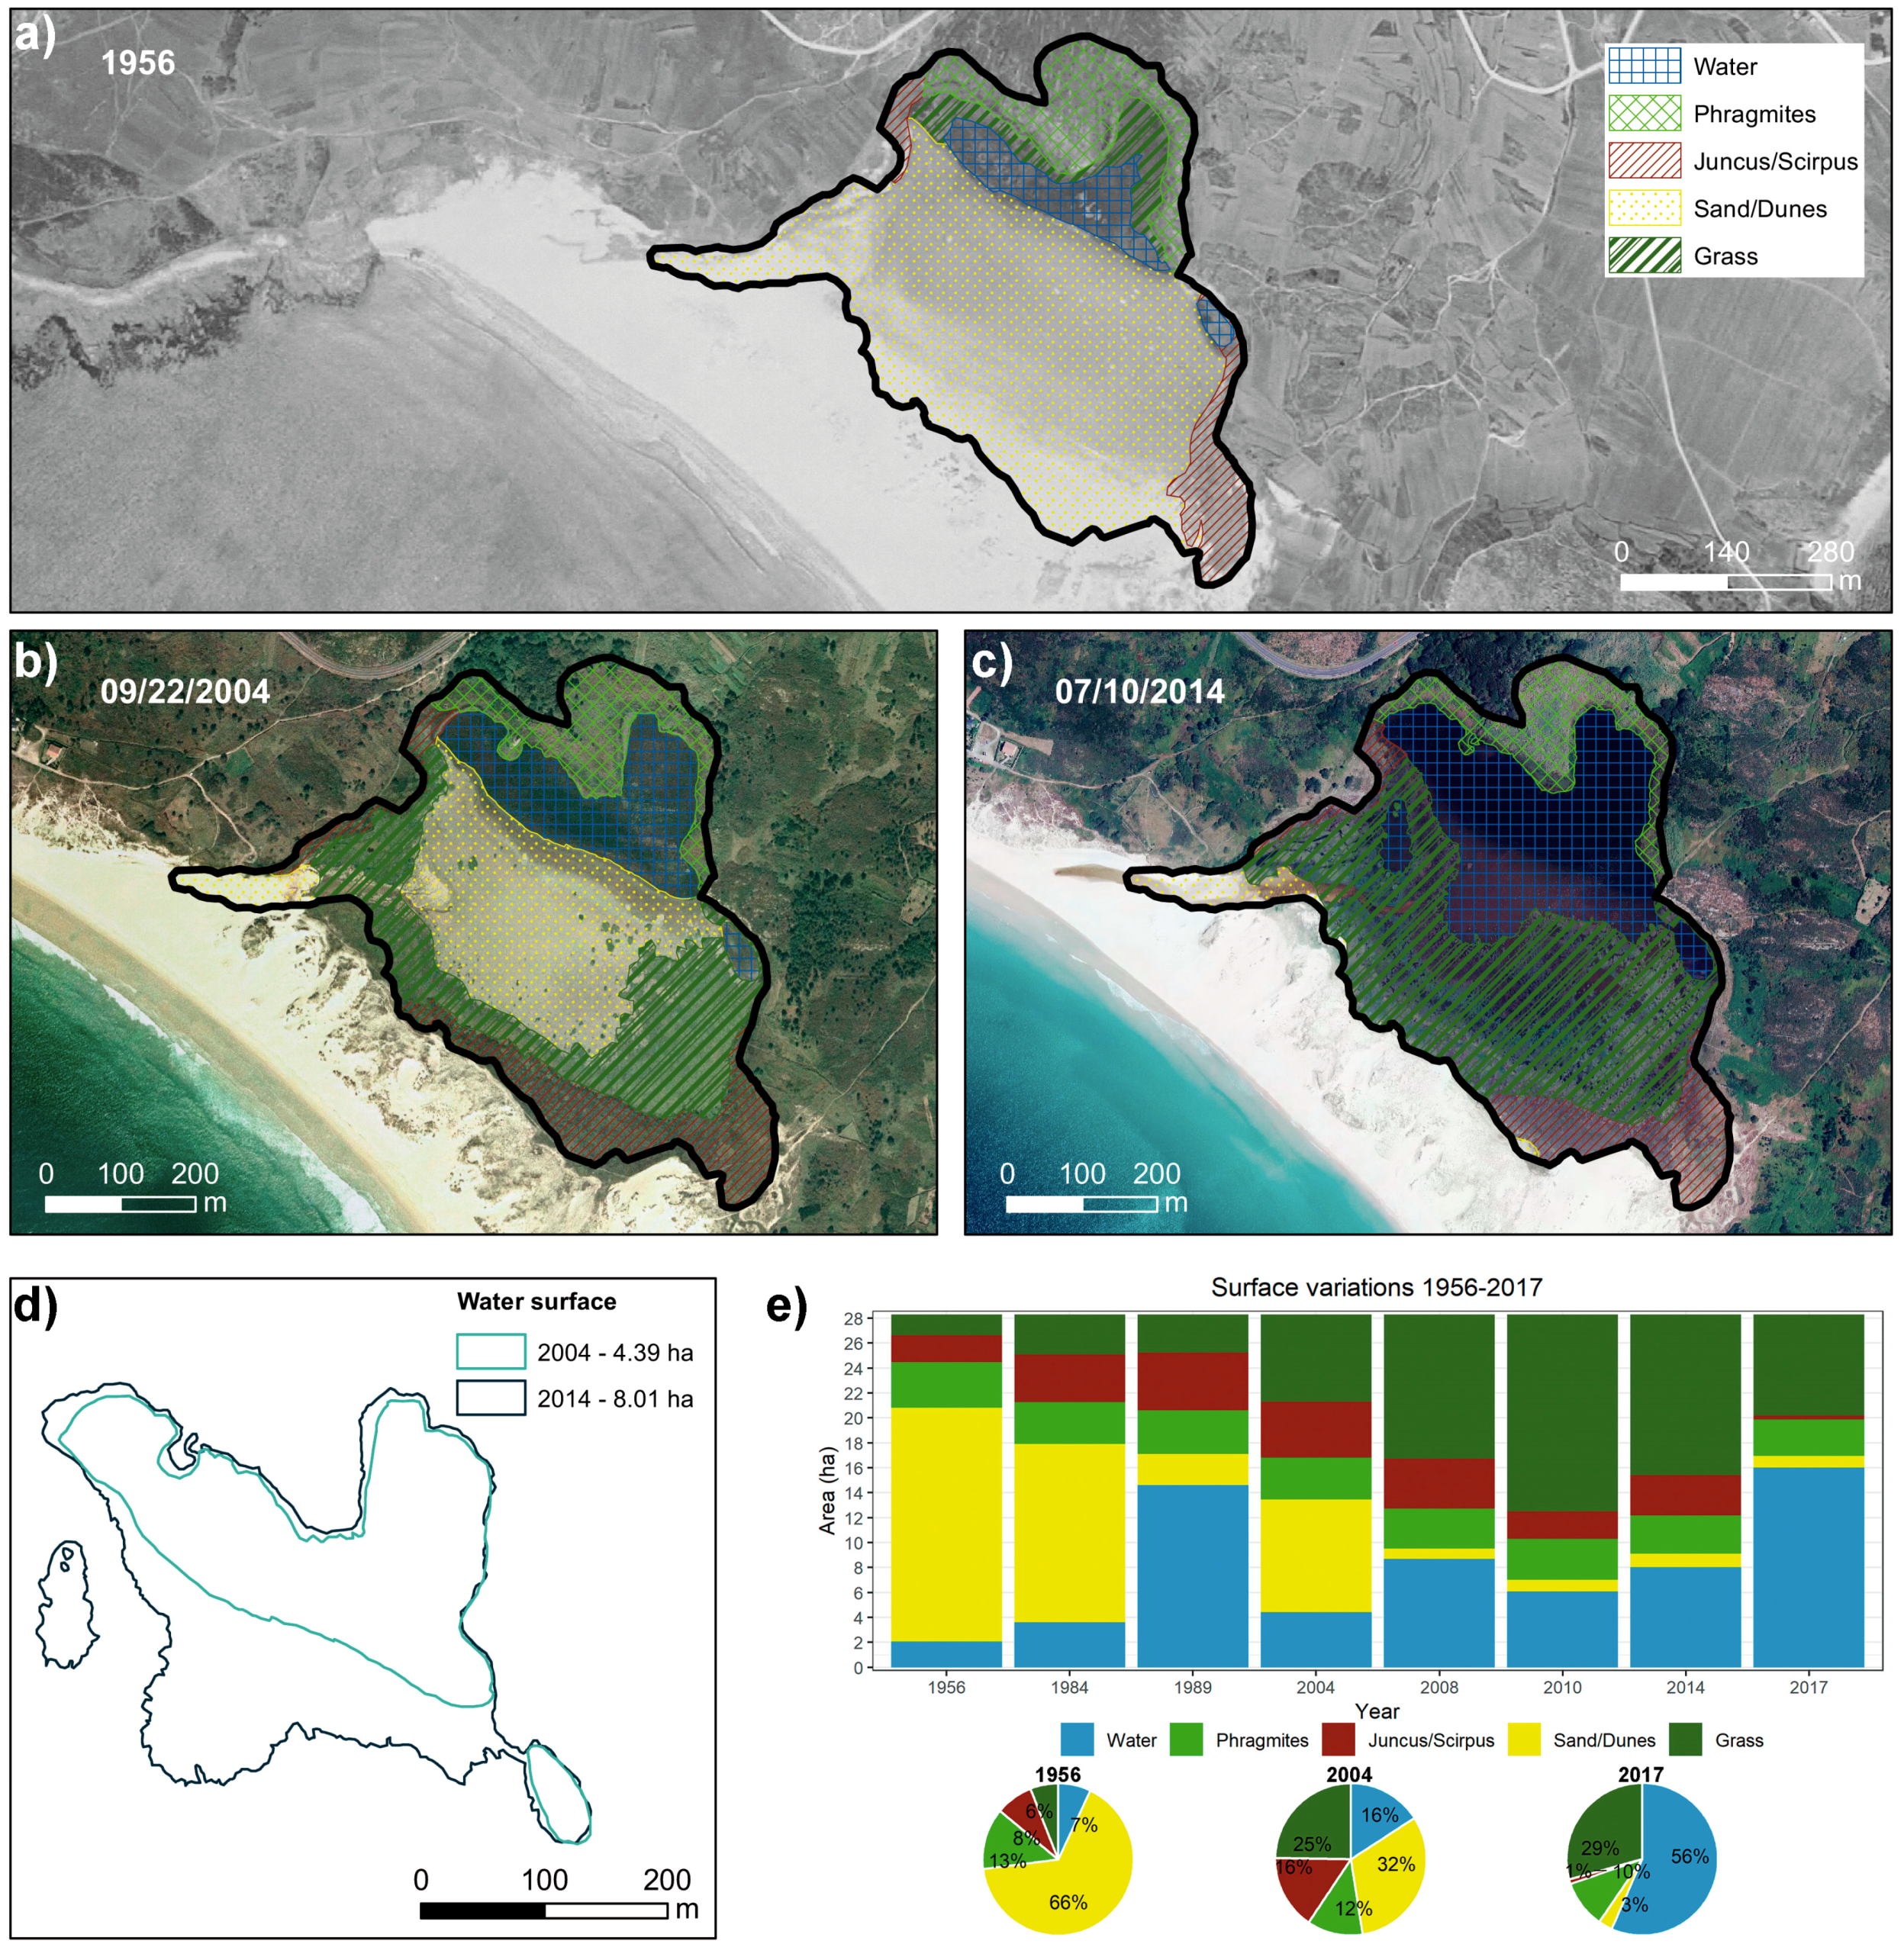
  • Free water: area permanently covered by a water sheet.
  • Phragmites: area colonized by the community defined by Phragmites australis reed beds, characterized by the highest freshwater influence.
  • Juncus/Scirpus: area with a higher seawater influence, occupied by Juncus maritimus, Juncus acutus, Scirpus maritimus, and S. lacustris, which often appear interspersed in the study areas.
  • Sand or dune area: sedimentary area, either forming dunes or intertidal flats.
  • Grass: herbaceous vegetation dominated by Paspalum vaginatum.
  • Aquatic vegetation: floating freshwater plants such as Nymphaea alba, Utricularia australis, Potamogeton trichoides, and Littorela uniflora.
The selection of the number of categories, as well as their definition, was based on the analysis of all the available images for each lagoon and the field surveys of the areas on different dates. However, this delimitation refers to the dominant species within each section and does not exclude the presence of other species sharing the same space. From this spatial information, the area and proportion covered by each category were estimated for each study year. These data allow for analyzing variations that have occurred over time and explanations as to their possible causes. Finally, seasonal variations were also analyzed by comparing images taken in late summer (September/October), corresponding to the period with lower water availability, with images taken in late spring (June).

2.3. Geochemical Analysis of Water and Sediments

Lagoon water and sediments were sampled on different months during the 2009–2011 period. Water samples were taken in Teflon jars that had been previously treated with HCl (5%) and then rinsed several times with Milli-Q water. In the laboratory, samples were filtered through a 0.45 μm pore size.
Redox potential, pH, and electrical conductivity were determined in situ using a multiparameter probe (Hanna instruments). Salinity was determined using a Hanna refractometer. Concentrations of nutrients (NH4+, NO3ˉ, and PO43−) and chlorides were determined by ion chromatography using a Dionex 4500i system (Dionex Inc., Sunnyvale, CA, USA).
Sediment samples were taken using 150 cm long PVC (polyvinyl chloride) tubes with 80 mm inner diameter. In the laboratory, sediment samples were cut in 3- to 5-cm thick segments. Sediment samples were used to determine the influence (both current and past) of seawater on each lagoon, using the degree of pyritization (concentration of pyritic S) in sediments relative to organic C content as proxy [17]. The organic C/pyritic S ratio is a proxy that allows distinguishing anoxic freshwater sediments (with low concentrations of pyrite, FeS2) from anoxic marine sediments (with high pyrite contents) [17,18,19].
Organic C content was determined using a Leco autoanalyzer (after removal of carbonates with HCl 1M), and pyritic S content was determined by sequential Fe extraction, which allows for extracting Fe associated with pyrite (FeS2) (see [20,21] for additional details). From pyritic Fe content, pyritic S content was determined stoichiometrically.

3. Results

3.1. Delimitation and Evolution of the Lagoons in the Last 60 Years

The evolution of the occupation of the different habitats identified within the Louro lagoon is shown in Figure 2. The Louro lagoon is divided into two subsystems. The first one is located in the distal section of the lagoon and constitutes the permanently flooded area. The construction of a dyke before the 1950s contributed to this flooding. The second subsystem is constituted by a sand flat behind the dunes, which remains flooded from early autumn, when it starts to fill with the first rains, until late July. In late September, the water-covered area of the Louro lagoon is at its minimum (Figure 2b).
More specifically, it is worth noting that no changes have been observed regarding the area and configuration of the lake basin; however, strong interannual oscillations have been observed in terms of area covered by free water. The photointerpretation analysis shows that the degree of flooding of the lagoon varies substantially depending on the season and the water availability. Thus, the minimum free water body was found in September 2004, with 4.4 ha, while the maximum was found in 2017, with 15.99 ha, representing a 40% variation relative to the total area of the lagoon. These variations can be clearly observed in Figure 2e, which represents free water bodies for 2004 and 2014, two years that diverged widely in terms of water availability.
The area covered by the different plant communities also showed important interannual variations. Progressive colonization is observed in the area behind the dunes and in the sand flat, which was reduced by 63% between 1956 and 2017. The area covered by Phragmites australis was virtually stable (10–13%), while the area occupied by the vegetation community dominated by Scirpus maritimus and Juncus maritimus experienced a marked increase since 1956, going from 2.19 ha to over 4 ha in the first decade of the 21st century.
Likewise, the area dominated by Paspalum vaginatum greatly increased from occupying 6% of the lagoon in 1956 to 56% in 2010.
In the Xuño lagoon, the permanently flooded area represented a minimum portion of the lagoon (1–3%) during the 1956–2008 period (Figure 3). From 2008 onwards, this area was reduced to less than 1%. This trend continued between 2014 and 2017, when the water sheet area decreased from 0.008 ha to 0.004 ha. These values clearly show the advanced siltation state of the lagoon. As for the area colonized by the Phragmites australis community, its distribution varies throughout the analyzed period, reaching its maximum extension (61%) in 2017 and its minimum extension (28%) in 1989. As in the case of the aforementioned formation, the vegetation community dominated by Juncus maritimus and Scirpus maritimus varied irregularly during the 1956–2017 period, reaching its maximum extension in 2001 (41%) and decreasing to its minimum in 2014 (31%).
Likewise, aquatic vegetation also followed an irregular pattern during this period. The maximum area covered by aquatic vegetation was 31% (0.66 ha) in 2008, while its minimum was 3% (0.07 ha) in 2017. Moreover, this lagoon showed strong seasonality in terms of degree of flooding, ranging from complete flooding of the lagoon basin in the winter to the lack of free water bodies by the end of the summer (Figure 3b).
In the Vixán lagoon, the free water body experienced a generalized decrease during the 1956–2017 period (Figure 4). In 1984, the estimated area covered by free water was 3.81 ha (24%), while in 2017 it was 3.30 ha (21%). This means a loss of more than 0.50 ha of free water body.
Like the aforementioned lagoons, the Vixán lagoon also experiences a marked seasonal variability, which can represent a 30–40% decrease in the free water body depending on the intensity of the summer drought, during which water remains only in the most distal area of the lagoon.
The dune and sand area also experience strong variations, going from a 12% occupation in 1989 to their almost complete disappearance in the last study years. The area covered by the dune environment was increasingly occupied by the community composed of Scirpus maritimus and several species in the genus Juncus, whose area increased from 24% in 1956 to 31% in 1989. From that year onwards, its proportion has remained stable at around 30%. Finally, an expansion of the Phragmites australis community has also been detected during the 2010–2017 period, reaching 53% of the total area, while in 1989 it represented only 41%.

3.2. Geochemical Characterization of Water and Sediment

3.2.1. Physicochemical Characterization and Composition of Water

Water pH ranged from slightly acidic values in the Xuño lagoon (6.1–7.3) to alkaline values in the Louro lagoon (7.8–9.8; Table 1). The extremely high values observed in the Louro lagoon are related to the increase in photosynthetic activity during the summer. Redox potential ranged between 213–485 mV, with both maximum and minimum values corresponding to the Xuño lagoon. The lowest values were found in late summer, when the free water volume is very small and organic load is high [22].
The main difference in water composition was observed for parameters related to ion concentration. Thus, salinity, electrical conductivity, and chlorides showed their highest values in the Louro lagoon, followed by Vixán and Xuño. The low salinity (<1‰), electrical conductivity (0.27–0.88 dS m−1), and chloride concentration (47–228 mg L−1) of water in the Xuño lagoon is evidence to its continental origin, while the high conductivity and salinity of the water in the Vixán and Louro lagoons are characteristic of brackish waters and indicate a clear marine influence.
Nutrient concentration in the water (NH4+, NO3, and PO43−) showed abnormally high values in the three lagoons (Table 1), but particularly in the Vixán and Xuño lagoons in late summer. Finally, it is worth highlighting the marked seasonality shown by all of them as a consequence of a major decrease in water volume at the end of the summer period.

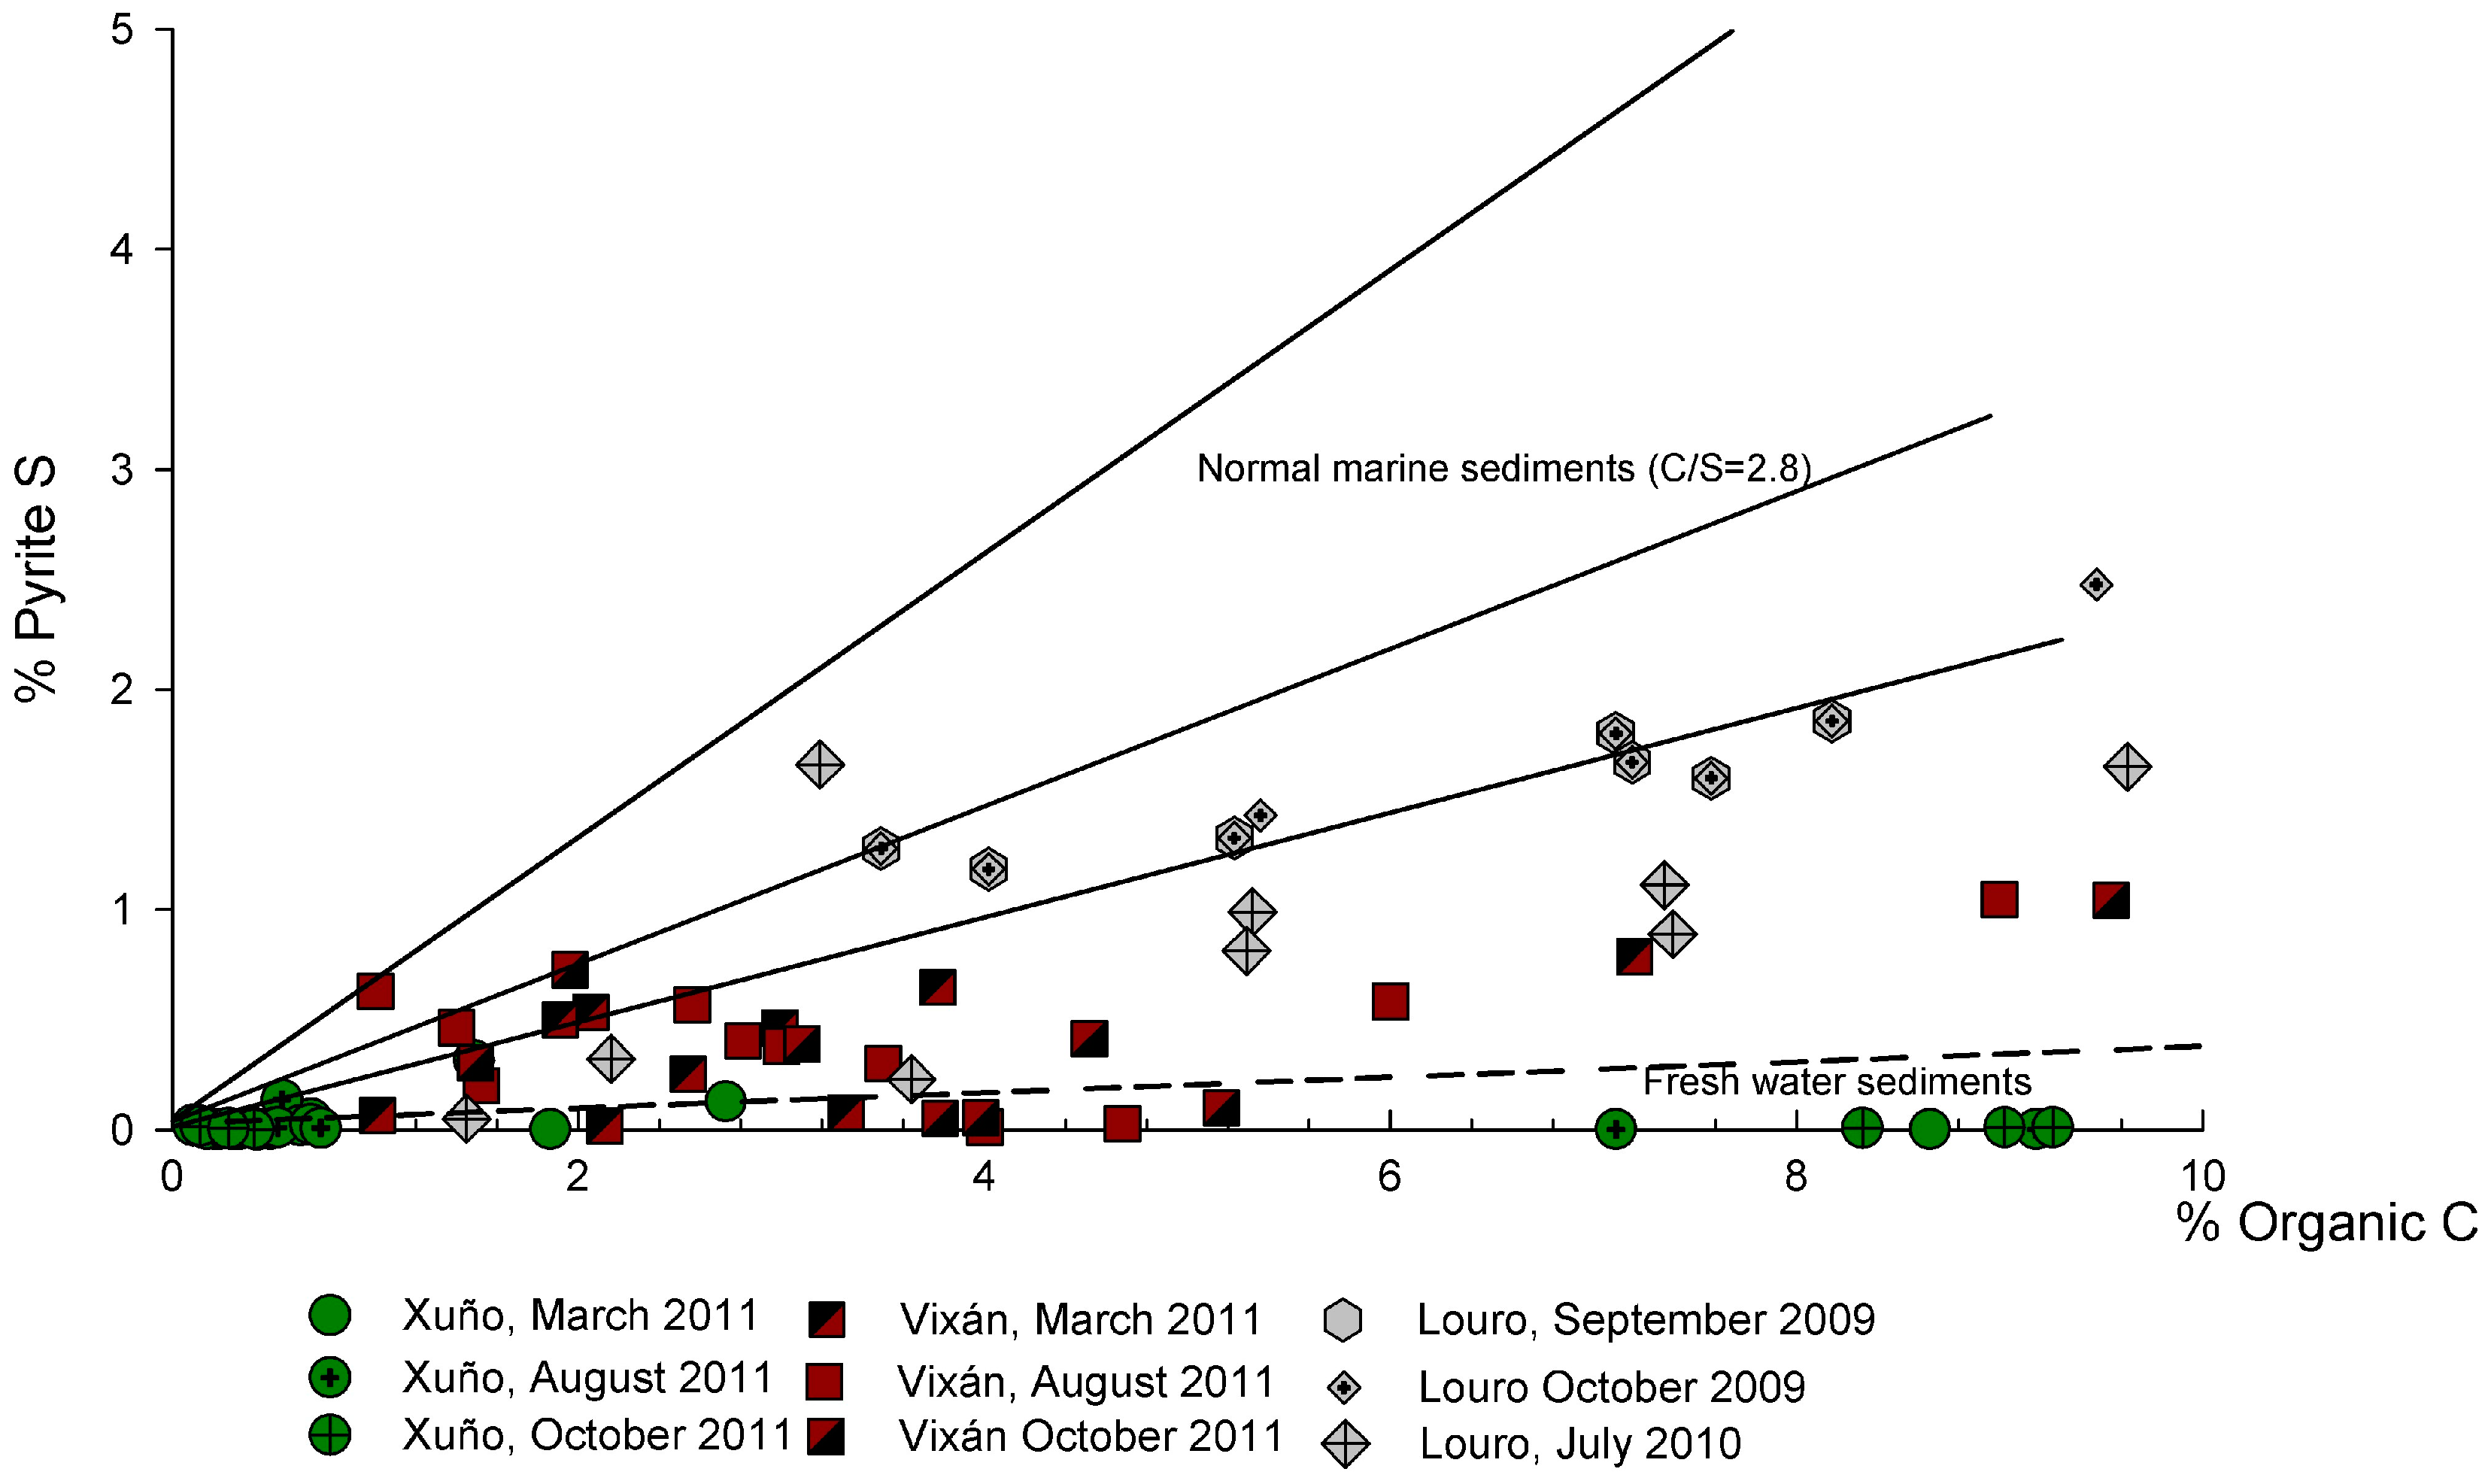
3.2.2. Organic C/Pyritic S Ratio in Sediments

Sediments from the three lagoons are characterized by pH values that are close to neutral (pH 6.0–7.5) and a redox potential that is characteristic of strongly reduced sedimentary environments (Eh <100 mV) (data not shown [22]).
Figure 5 shows the organic C/pyritic S ratio for surface and deep sediments (0–100 cm). The results show extremely low contents of pyritic S in sediments from the Xuño lagoon, which suggest that this lagoon system has always been a freshwater lagoon. Conversely, the high pyrite content observed in the Vixán and Louro lagoons suggest that they have been clearly receiving some marine influence since their formation.

4. Discussion

Despite the current environmental protection of lagoons and coastal lakes, these systems are progressing towards their collapse. The main observed cause is clogging, which leads to the disappearance of the free water body and to a progressive loss of biodiversity (mainly of aquatic birds [24]). Future actions must be taken in accordance with the origin and dynamic of each lagoon system in particular.
In relation to the possibility of improving these analyses, the images used in this paper were taken with irregular periodicity. Unfortunately, for this reason, variations in the area covered by the lagoons could not be analyzed in more detail. It would be useful to obtain images in different seasons to appropriately test seasonal variations. For this purpose, UAVs (unmanned aerial vehicles) could be a highly suitable tool.

4.1. Types of Lagoons According to Their Location and Geochemistry (Coastal Lagoons and Natural Eutrophic Lakes)

The Habitats Directive (more formally known as Council Directive 92/43/EEC on the conservation of natural habitats and of wild fauna and flora) establishes the types of habitats of community interest that must be protected by the European Union member states. Among them are coastal lagoons (habitat code 1150). According to the Interpretation Manual of European Union Habitats (2003), “lagoons are expanses of shallow coastal salt-water, of varying salinity and water volume, wholly or partially separated from the sea by sand banks or shingle, or, less frequently, by rocks. Salinity may vary from brackish water to hypersalinity depending on rainfall, evaporation and through the addition of fresh seawater from storms, temporary flooding of the sea in winter or tidal exchange”. The results regarding water and sediment composition in the three lagoons indicate that Louro and Vixán clearly fulfill the requirement of being a saline or brackish environment (Table 1; Figure 5). However, the so-called Xuño “lagoon” is, and has always been, a freshwater lake with no direct connection with the sea. Therefore, its current classification within habitat 1150 (“Coastal lagoons”) by the environmental authorities of the regional government (Xunta de Galicia) is incorrect, and it should be assigned to the category “Natural eutrophic lakes with Magnopotamion or Hydrocharition-type vegetation” (habitat code 3150). However, this is not an isolated case. Other lagoons in the Atlantic coast of the Iberian Peninsula, such as the Doniños and Traba lakes (both included in the Spanish Natura 2000 network), were also classified as coastal lagoons, but have recently been considered as coastal back-barrier perched lakes [15,24]. This typology is defined as freshwater bodies that are elevated over sea-level and are not directly subjected to the inflow of seawater, a definition that fits the characteristics of the Xuño lake.
Ultimately, lagoon classification is not always easy and clear, and neither is their categorization as listed in Annex I of the Habitats Directive, which mixed multidisciplinary information and used various environmental proxies in the majority of cases (see e.g., [15,24,25]).

4.2. Evolution and Environmental Implications of the Reduction in the Free Water Body and of Changes in the Areas Colonized by Vegetation

The studied lagoons and lake represent different scenarios in terms of hydrologic dynamics and vegetation-covered area. In all of them, an increase in macrophyte coverage at the expense of the free water body was observed. The three lagoons are experiencing a progressive siltation and eutrophication process, which alters their natural evolution, and which could eventually affect the natural values inherent to these lagoons. It is worth highlighting the loss of habitat quality to host stable populations of aquatic birds (e.g., diving Anatidae, Fulicula atra, Tachybaptus ruficollis) and marsh birds (especially Emberiza schoeniclus and Circus aeruginosus) inhabiting these lagoons.
Siltation and eutrophication are caused by several factors. The first one of them is the abandonment of traditional practices such as the annual harvesting of aerial biomass produced by macrophytes (mainly Pragmites australis, Scirpus maritimus, and Juncus maritimus) for cattle bedding. Systematic macrophyte harvesting reduced siltation and eutrophication of the lagoons [26]. These species are excellent nutrient extractors [27,28]. Other elements worth mentioning are changes in land use around the lagoons which have taken place in recent decades. During the 1960s and 1970s, areas surrounding the lagoons were consistently used for crop growing throughout the year (Figure 3). However, since the last decades of the 20th century, this activity was progressively abandoned, leading to the rapid regeneration of riparian forests composed mainly of common alder (Alnus glutinosa) and willow (Salix atrocinerea). The expansion of tree-covered areas around the lagoons led to a decrease in water availability due to the large water volume extracted from the ground by these species due to evapotranspiration [29]. Finally, siltation has also been compounded by sediment contributions due to recurrent forest fires within the drainage basin of the lagoons, particularly in the Louro and Vixán areas.
The evolution of coastal lagoons does not represent a problem in the Galician context. In recent years, numerous studies have analyzed variations and their implications in the characteristics of lagoons, focusing on issues such as eutrophication. Clear examples of study cases are the analyses performed in the south of Spain [30,31,32], although diverse authors have studied other areas in the Iberian Peninsula [33] and the United Kingdom [34].

5. Conclusions

The following main conclusions can be drawn from this study:
  • The three lagoons are experiencing a progressive siltation and eutrophication process, which decreases water quality and substantially deteriorates their environmental function. The progressively increasing coverage by macrophytic communities at the expense of the area covered by free water body and quality is compromising the lagoons’ capacity to host stable populations of aquatic and marsh bird species.
  • An adequate management of these spaces requires, first and foremost, a thorough understanding of their origin and dynamics. Knowledge of these aspects is currently incomplete, which has led to their incorrect classification in terms of habitat type, according to directive 92/43/CEE.
  • The allocation of lagoons and lakes to the categories listed in Annex I of the Habitats Directive is very complex and requires a multidisciplinary approach.

Author Contributions

Conceptualization, A.P.-A., P.M., X.L.O.P. and P.F.-S.; methodology, A.G.-P. and P.F.-S.; formal analysis, P.M., P.F.-S., A.G.-P. and X.L.O.P.; investigation, A.P.-A., P.F.-S., P.M. and X.L.O.P.; writing—original draft preparation, P.F.-S., X.L.O.P. and A.G.-P.; writing—review and editing, P.F.-S., A.G.-P., A.P.-A. and X.L.O.P.

Funding

This work is part of a research project entitled “Monitorización de los procesos biogeoquímicos en las lagunas litorales en relación con su calidad ambiental y respuesta al cambio climático” (Xunta de Galicia, PGIDIT08MDS036000PR), within the program for consolidation of competitive research groups (Xunta de Galicia-Consellería de Educación, Universidades e Formación Profesional, Plan Galego, ref. ED31C2018/12, Group ref. 2018-PG036) and Cross-Research in Environmental Technologies, CRETUS (Xunta de Galicia GRUP2015/02, ref. 2018-PG100). AGP is supported by an FPU predoctoral contract by the Spanish government (Ministerio de Educación, Cultura y Deporte). Grant Number: FPU16/03050.

Acknowledgments

We would like to thank María Santiso for her assistance with laboratory work and Christine Francis for providing language support.

Conflicts of Interest

The authors declare no conflicts of interest.

Appendix A

Figure A1. Diagram of precipitation/PET (mm) measured at the Riveira meteorological station, located near the study areas.
Jmse 07 00272 g0a1

References

  1. Davidson, N.C. How much wetland has the world lost? Long-term and recent trends in global wetland area. Mar. Freshw. Res. 2014, 65, 934–941. [Google Scholar] [CrossRef]
  2. Davidson, N.C.; Laffoley, D.; Doody, J.P.; Way, L.; Gordon, J.; Key, R.; Drake, C.M.; Pienkowski, M.; Mitchell, R.M.; Duff, K.L. Nature Conservation and Estuaries in Great Britain; Nature Conservancy Council: Peterborough, UK, 1991. [Google Scholar]
  3. Dahl, T.E. Wetlands Losses in the United States 1780’s to 1980’s; U.S. Department of the Interior: Washington, DC, USA; U.S. Fish and Wildlife Service: Washington, DC, USA, 1990.
  4. Kotze, D.C.; Breen, C.M.; Quinn, N. Wetland Losses in South Africa. In ‘Wetlands of South Africa’; Department of Environmental Affairs and Tourism: Pretoria, South Africa, 1995. [Google Scholar]
  5. An, S.; Li, H.; Guan, B.; Zhou, C.; Wang, Z.; Deng, Z.; Zhi, Y.; Liu, Y.; Xu, C.; Fang, S.; et al. China’s Natural Wetlands: Past Problems, Current Status, and Future Challenges. AMBIO J. Hum. Environ. 2007, 36, 335–342. [Google Scholar] [CrossRef]
  6. Kennish, M.J.; Paerl, H.W. Coastal Lagoons. Critical Habitats of Environmental Change; CRC Press: Boca Raton, FL, USA, 2010; ISBN 9781138111844. [Google Scholar]
  7. Cohen, J.E.; Small, C.; Mellinger, A.; Gallup, J.; Sachs, J. Estimates of Coastal Populations. Science 1997, 278, 1209–1213. [Google Scholar] [CrossRef]
  8. McGranahan, G.; Balk, D.; Anderson, B. The rising tide: Assessing the risks of climate change and human settlements in low elevation coastal zones. Environ. Urban. 2007, 19, 17–37. [Google Scholar] [CrossRef]
  9. Perez-Alberti, A.; Gomez-Pazo, A. The Rocky Coasts of Northwest Spain. In The Spanish Coastal Systems; Springer: Berlin, Germany, 2019; pp. 27–47. ISBN 9783319931692. [Google Scholar]
  10. POLGalicia. Plan de Ordenación do Litoral de Galicia; Consellaría de Medio Ambiente, Territorio e Infraestruturas: Santiago de Compostela, Spain, 2010. [Google Scholar]
  11. Schwartz, M.L. Encyclopedia of Coastal Science; Schwartz, M.L., Ed.; Springer: Dordrecht, The Netherlands, 2005; ISBN 978-1-4020-1903-6. [Google Scholar]
  12. Carballeira, A.; Devesa, C.; Retuerto, R.; Santillán, E.; Ucieda, F. Bioclimatología de Galicia; Fundación Pedro Barrié de la Maza, Conde de Fenosa: A Coruña, Spain, 1983; ISBN 84-85728-27. [Google Scholar]
  13. Oertel, G.F. Coastal Lakes and Lagoons. In Encyclopedia of Coastal Science; Schwartz, M.L., Ed.; Springer: Dordrecht, The Netherlands, 2005; pp. 263–266. ISBN 978-1-4020-3880-8. [Google Scholar]
  14. Oertel, G.F. The barrier island system. Mar. Geol. 1985, 63, 1–18. [Google Scholar] [CrossRef]
  15. Sáez, A.; Carballeira, R.; Pueyo, J.J.; Vázquez-Loureiro, D.; Leira, M.; Hernández, A.; Valero-Garcés, B.L.; Bao, R. Formation and evolution of back-barrier perched lakes in rocky coasts: An example of a Holocene system in north-west Spain. Sedimentology 2018, 65, 1891–1917. [Google Scholar] [CrossRef] [Green Version]
  16. Del Río, L.; Gracia, F.J. Error determination in the photogrammetric assessment of shoreline changes. Nat. Hazards 2013, 65, 2385–2397. [Google Scholar] [CrossRef]
  17. Leventhal, J.S. Carbon-sulfur plots to show diagenetic and epigenetic sulfidation in sediments. Geochim. Cosmochim. Acta 1995, 59, 1207–1211. [Google Scholar] [CrossRef]
  18. Berner, R.A. Burial of organic carbon and pyrite sulfur in the modem ocean: Its geochemical and environmental significance. Am. J. Sci. 1982, 282, 451–473. [Google Scholar] [CrossRef]
  19. Calvert, S.E.; Karlin, R.E. Relationships between sulphur, organic carbon, and iron in the modern sediments of the Black Sea. Geochim. Cosmochim. Acta 1991, 55, 2483–2490. [Google Scholar] [CrossRef]
  20. Huerta-Diaz, M.A.; Morse, J.W. A quantitative method for determination of trace metal concentrations in sedimentary pyrite. Mar. Chem. 1990, 29, 119–144. [Google Scholar] [CrossRef]
  21. Otero, X.L.; Ferreira, T.O.; Huerta-Díaz, M.A.; Partiti, C.S.M.; Souza, V.; Vidal-Torrado, P.; Macías, F. Geochemistry of iron and manganese in soils and sediments of a mangrove system, Island of Pai Matos (Cananeia—SP, Brazil). Geoderma 2009, 148, 318–335. [Google Scholar] [CrossRef]
  22. Otero Pérez, X.L. Monitorización de Los Procesos Biogeoquímicos en Las Lagunas Litorales en Relación Con su Calidad Ambiental y Respuesta al Cambio Climático; Scientific Report; Xunta de Galicia: Santiago de Compostela, Spain, 2011. [Google Scholar]
  23. Berner, R.A.; Raiswell, R. C/S method for distinguishing freshwater from marine sedimentary rocks. Geology 1984, 12, 365. [Google Scholar] [CrossRef]
  24. Bao, R.; Alonso, A.; Delgado, C.; Pagés, J.L. Identification of the main driving mechanisms in the evolution of a small coastal wetland (Traba, Galicia, NW Spain) since its origin 5700 cal yr BP. Palaeogeogr. Palaeoclimatol. Palaeoecol. 2007, 247, 296–312. [Google Scholar] [CrossRef] [Green Version]
  25. González-Villanueva, R.; Pérez-Arlucea, M.; Costas, S.; Bao, R.; Otero, X.L.; Goble, R. 8000 years of environmental evolution of barrier–lagoon systems emplaced in coastal embayments (NW Iberia). Holocene 2015, 25, 1786–1801. [Google Scholar] [CrossRef]
  26. Sutherland, W.J.; Hill, D.A. Managing Habitats for Conservation; Cambridge University Press: Cambridge, UK, 2000; ISBN 0521447763. [Google Scholar]
  27. Vymazal, J. Types of constructed wetlands for wastewater treatment: Their potential for nutrient removal. In Transformations of Nutrients in Natural and Constructed Wetlands; Backhuys: Leiden, The Netherlands, 2001. [Google Scholar]
  28. Vymazal, J. Constructed Wetlands for Wastewater Treatment: Five Decades of Experience. Environ. Sci. Technol. 2011, 45, 61–69. [Google Scholar] [CrossRef]
  29. Frédette, C.; Grebenshchykova, Z.; Comeau, Y.; Brisson, J. Evapotranspiration of a willow cultivar (Salix miyabeana SX67) grown in a full-scale treatment wetland. Ecol. Eng. 2019, 127, 254–262. [Google Scholar] [CrossRef]
  30. Álvarez-Rogel, J.; del Carmen Tercero, M.; Arce, M.I.; Delgado, M.J.; Conesa, H.M.; González-Alcaraz, M.N. Nitrate removal and potential soil N2O emissions in eutrophic salt marshes with and without Phragmites australis. Geoderma 2016, 282, 49–58. [Google Scholar] [CrossRef]
  31. García, G.; Muñoz-Vera, A. Characterization and evolution of the sediments of a Mediterranean coastal lagoon located next to a former mining area. Mar. Pollut. Bull. 2015, 100, 249–263. [Google Scholar] [CrossRef] [Green Version]
  32. Del Carmen Tercero, M.; Álvarez-Rogel, J.; Conesa, H.M.; Párraga-Aguado, I.; González-Alcaraz, M.N. Phosphorus retention and fractionation in an eutrophic wetland: A one-year mesocosms experiment under fluctuating flooding conditions. J. Environ. Manag. 2017, 190, 197–207. [Google Scholar] [CrossRef]
  33. Serrano, L.; Reina, M.; Quintana, X.D.; Romo, S.; Olmo, C.; Soria, J.M.; Blanco, S.; Fernández-Aláez, C.; Fernández-Aláez, M.; Caria, M.C.; et al. A new tool for the assessment of severe anthropogenic eutrophication in small shallow water bodies. Ecol. Indic. 2017, 76, 324–334. [Google Scholar] [CrossRef]
  34. Foley, B.; Jones, I.D.; Maberly, S.C.; Rippey, B. Long-term changes in oxygen depletion in a small temperate lake: Effects of climate change and eutrophication. Freshw. Biol. 2012, 57, 278–289. [Google Scholar] [CrossRef]
Figure 1. Study locations. The pictures show the three different lagoons: Louro, Xuño, and Vixán. The green triangle indicates the location of the Riveira meteorological station (Figure A1).
Jmse 07 00272 g001
Figure 2. Cartography and data of the Louro lagoon. (ac) represent the areas covered by each category in 1956, 2004, and 2014, based on the aerial images taken each year by the Spanish National Geographical Institute (Instituto Geográfico Nacional de España, IGN). (d) shows variations in the free water body between two different dates: 2004 and 2014, and (e) shows the area (in hectares, ha) covered by each category in the different dates, as well as the percentage they represented relative to the total area of the lagoon.
Jmse 07 00272 g002
Figure 3. Cartography and data of the Xuño lagoon. (ac) represent the areas covered by each category in 1956, 2004, 2014, and 2017, based on the aerial images taken each year (IGN). (d) shows variations in the water-covered area between 2014 and 2017, and (e) shows the area (in ha) covered by each category in the different dates, as well as the percentage they represented relative to the total area of the lagoon.
Jmse 07 00272 g003
Figure 4. Cartography and data of the Vixán lagoon. (a,b) represent the areas covered by each category in 1956 and 2017, based on the aerial images taken each year (IGN). (c) shows variations in the water-covered area in 1956, 1989, 2004 and 2017 (d) shows variations in the free water body throughout the study period, and (e) shows the area (in ha) covered by each category in the different dates, as well as the percentage they represented relative to the total area of the lagoon.
Jmse 07 00272 g004
Figure 5. Pyritic S to organic C ratio in sediments. Solid lines represent the typical organic C/pyritic S ratio for normal modern marine sediments (C/S ratio = 2.8 ± 0.8, data from [18,23]), and the dashed line represents the C/S ratio for freshwater sediments, data from [17].
Jmse 07 00272 g005
Table 1. Physicochemical characteristics and composition of water in the lagoons (na: not analyzed).
LagoonDatepHEhElec. Cond.SalinityNH4+NO3PO43−Cl
mVdS m−1--------------------mg L−1-----------------
LouroOct. 20098.824616.09<0.052.830.124764
Jan. 20107.939932.023<0.050.41<0.056412
Jun. 20107.84421.621<0.05<0.050.0611065
Oct. 20108.238834.0390.48<0.050.0819450
Jan. 20117.935910.7na0.23<0.050.069284
Sep. 20119.838321.315<0.05<0.05nana
VixánOct. 20098.827312.012<0.051.63<0.054061
Jan. 20108.13863.52<0.054.75<0.05746
Jun. 20108.13651.520.092.050.06424
Oct. 20107.839019.0190.060.070.099564
Jan. 20117.74142.81.5<0.055.550.07785
Sep. 20118.93807.03<0.0540.8<0.052507
XuñoOct. 20096.72490.60<10.370.11<0.05134
Jan. 20107.34050.27<1<0.054.65<0.0547
Jun. 20106.93620.28<1<0.051.000.4563
Oct. 20106.14880.35<1<0.050.060.0997
Jan. 2011na3350.44<10.32<0.050.14134
Sep. 2011na2130.88<1<0.050.70<0.05228

