1. Introduction
Offshore wind power is an important source of renewable energy. The conventional construction of offshore wind turbine structures has processes including installing the foundation, and hoisting the tower and wind turbine. The whole construction requires large lifting and hoisting equipment and large-scale transportation and installation vessels. The construction process requires a limited sea window and the cost of construction is high. Nowadays, a lot of wind power projects are being built massive. Europe is the world leader in offshore wind power construction using new technology of floating-to-site offshore bottom-fixed foundations to build the wind turbines. Some prototypes have already been installed at least in Europe, such as the Elican project led by Esteyco [
1] and a deep-water gravity foundation installed by Seatower [
2]. European wind farms are developing rapidly. Orsted built the world’s first offshore wind farm in Vindeby, Denmark in 1991. Compared to modern systems, Vindeby’s system is quite small: The hub is 35 m high and 35 m in diameter. In contrast, Borkum Riffgrund 2 [
3], which will be operational in 2019, is one of the largest in the world. Located 57 km off the coast of Lower Saxony, the project is the first offshore wind farm in Germany with 8 MW turbines and suction rigs. The rapid development of wind farms cannot be separated from the development of bucket foundations. Bucket foundations are widely used in many wind power projects, such as Deutsche Bucht Pilot [
4], Hywind Scotland and the Aberdeen Offshore Wind farm [
5]. However, few of the bucket foundations in Europe have internal structure inside the caisson.
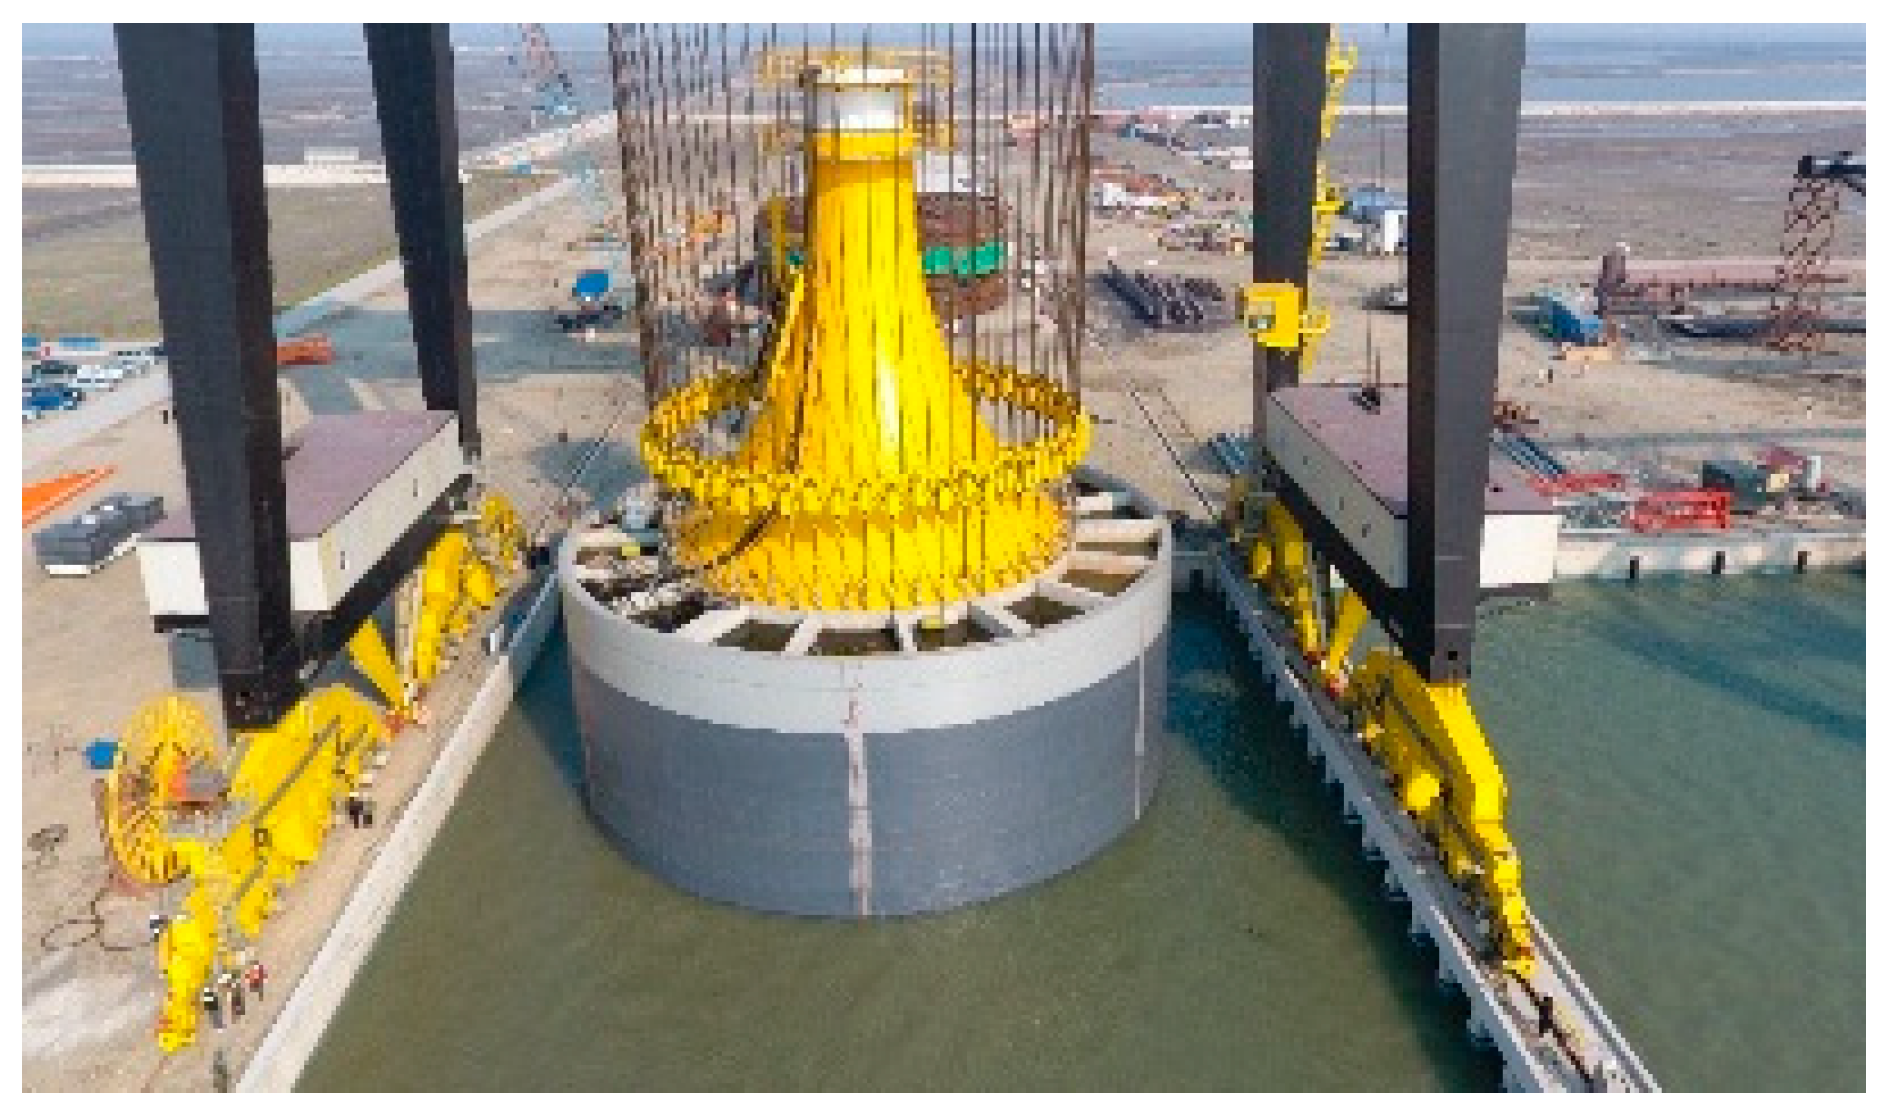
The research group at Tianjin University and Daoda Company has developed a new foundation, called a composite bucket foundation (CBF), since 2009. The CBF, which has a large diameter and a relatively small bucket height, can be used for offshore wind turbines. To ensure that the various loads from the upper tower structure are successfully transmitted into the foundation, an arc-transition structure between the tower structure and the top of the bucket foundation has been designed, and the whole structure is shown in
Figure 1. On 1 October 2010, the first 2.5 MW CBF was installed in Qidong City, China. Two CBFs with 3 MW wind turbines were installed at the Sanxia Xiangshui offshore wind farm in 2017, and 13 CBFs with 3.3 and 6.45 MW wind turbines have been under construction at the Sanxia Dafeng offshore wind farms since 2018. [
6,
7,
8,
9,
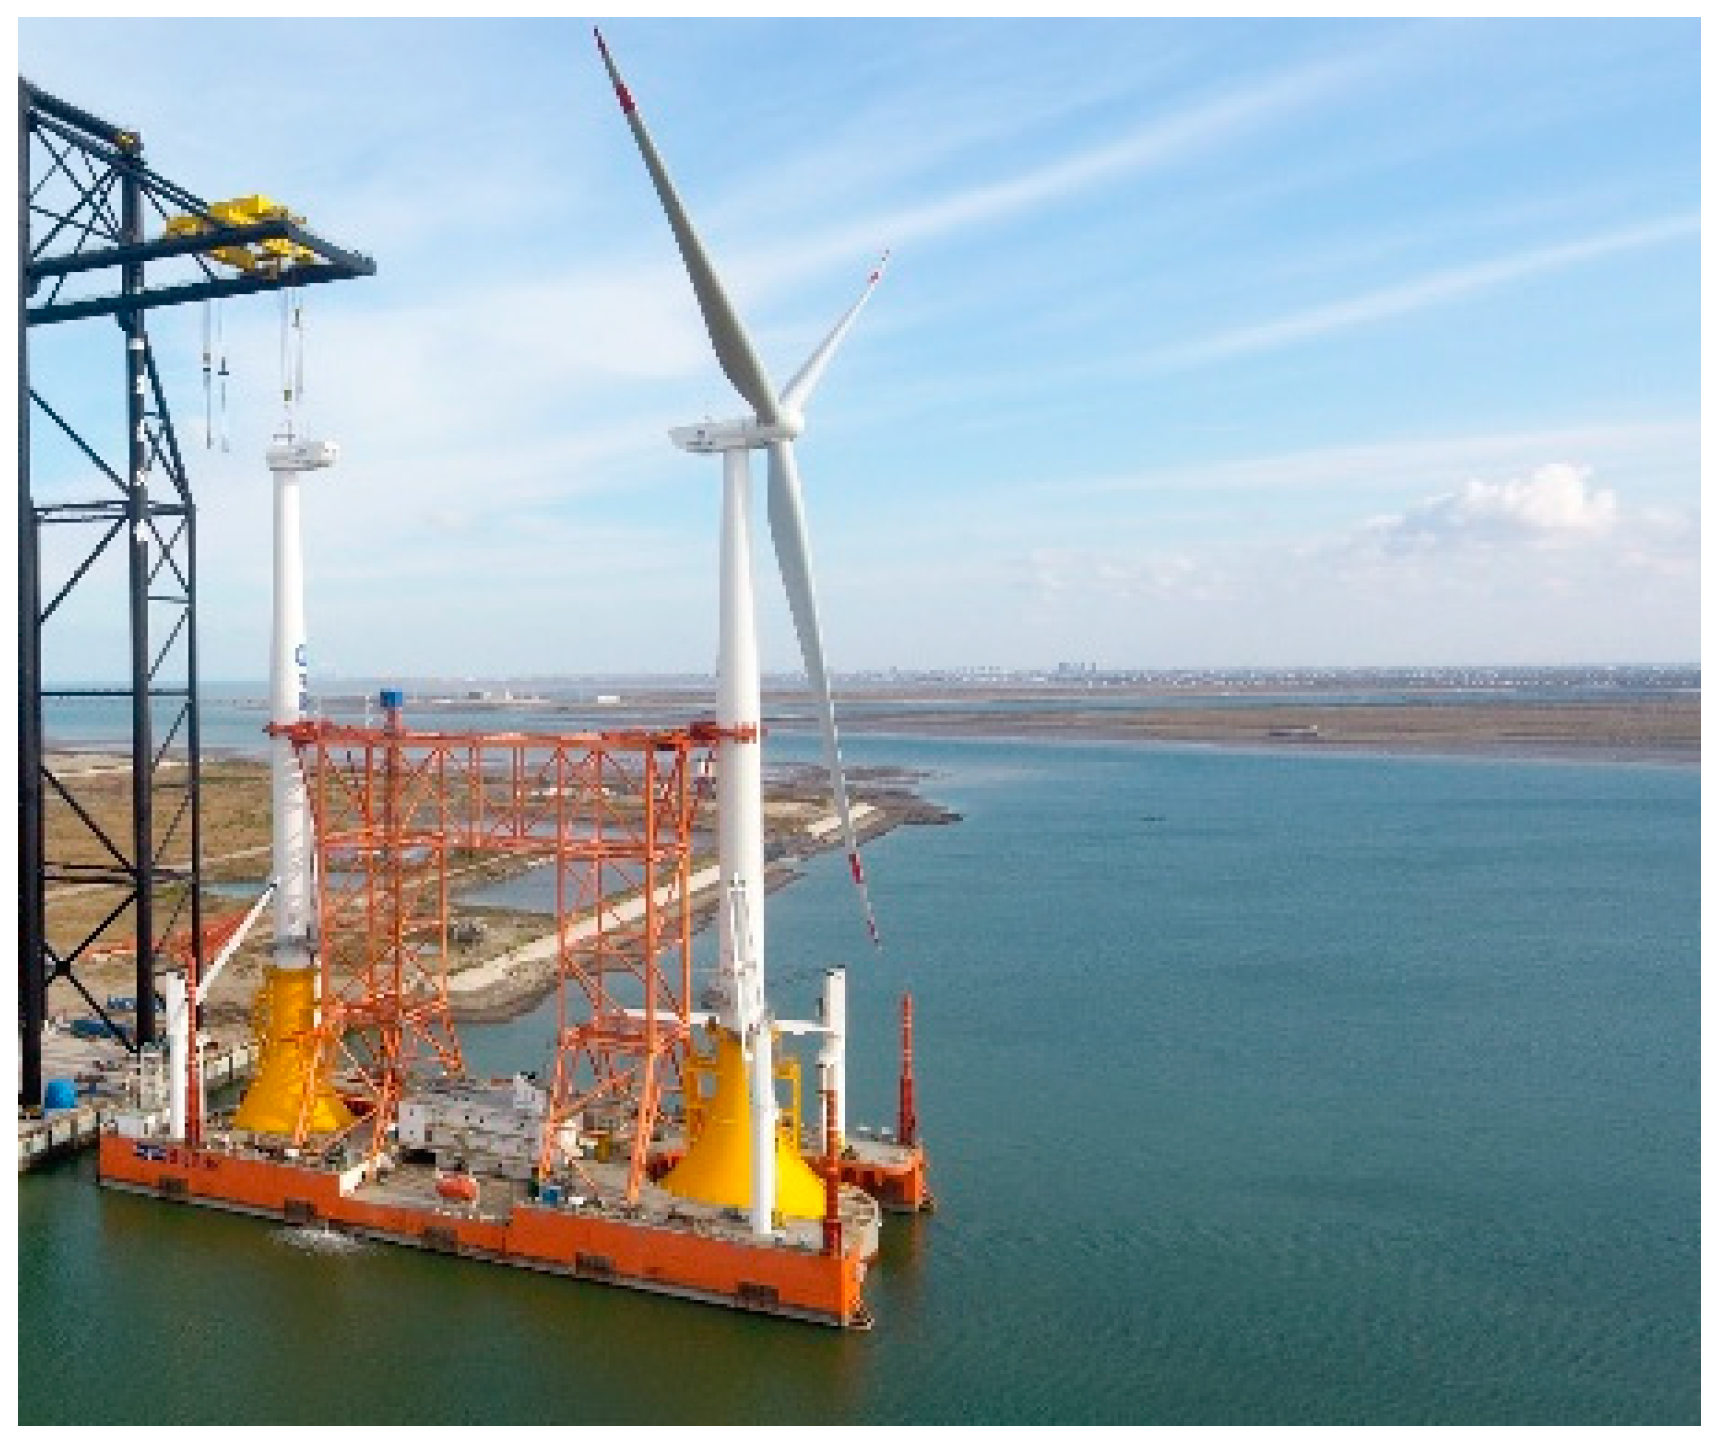
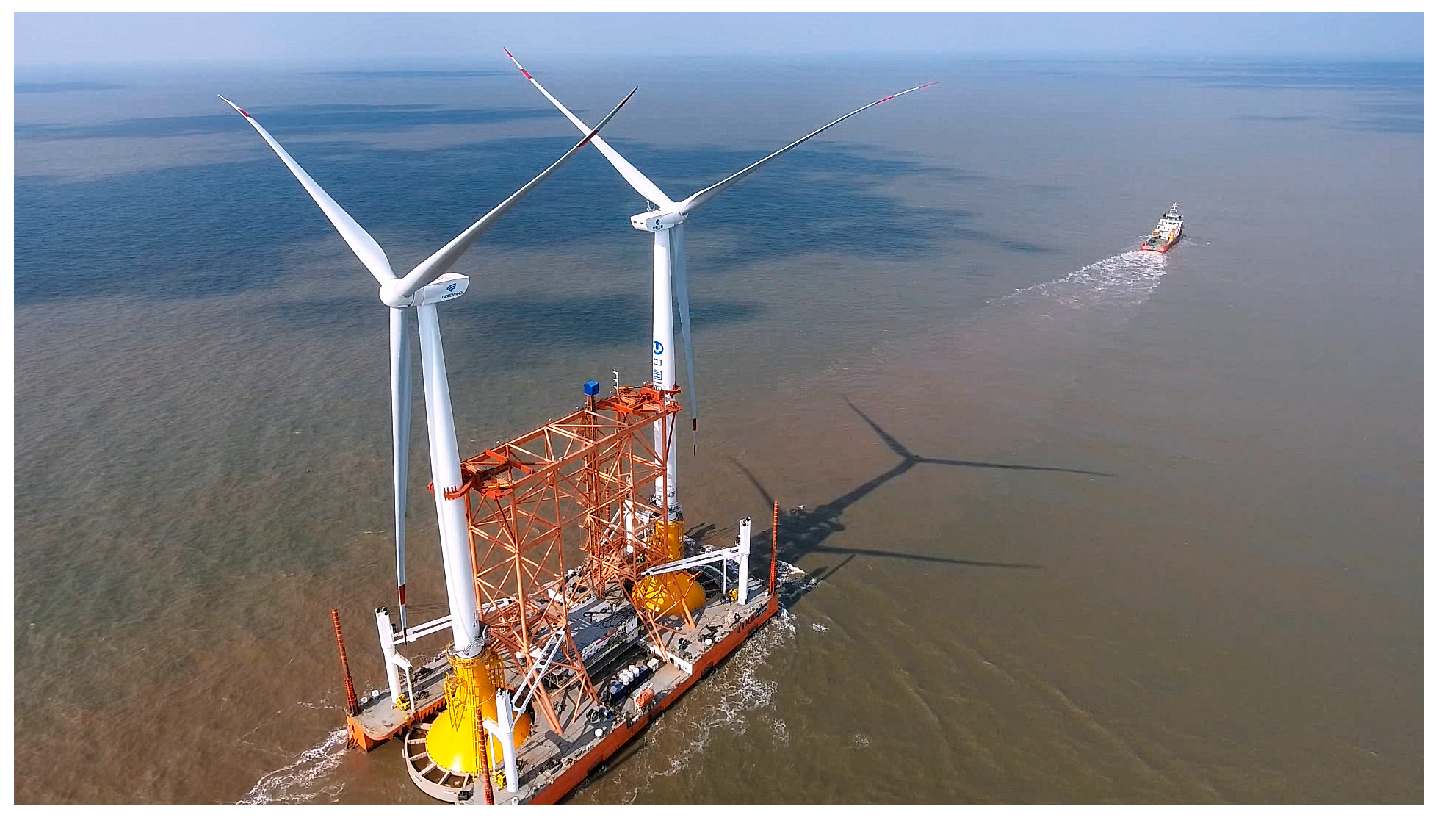
10] The CBF has reasonable motion characteristics and towing reliability to support the specialized vessel and offshore wind turbines for one-step transportation, as shown in
Figure 2.
The CBF is a structure that adopts an air cushion approach to towing in the sea. The floating air-cushion structure generates buoyancy by the action of internal air and water; however, the normal floating body provides buoyancy only by the difference in water pressure between the upper and lower surfaces. The study of floating air-cushion structures began in the 1980s. Seidl [
11] first proposed the air-cushion floating platform in 1980, and studied the influence of compressed air in the structure by introducing the airbag coefficient. At the same time, he conducted tests and theoretical analyses to find the relationship vessel between the inner liquid level, the shape of the floating body and the airbag coefficient. The idea of establishing a floating platform at sea was proposed and provided with a theoretical basis. In 1995, Chakrabati [
12] proposed the use of air-cushion floating structures to haul the gravity foundation and proved its achievability. Ikoma et al. [
13] proved that a floating structure with an air cushion can reduce the hydroelastic response, and used the integral equation to analyze the motion of the air-cushion floating structure under regular waves. Van Kessel [
14] studied large air-cushion floating structures. He put forward the idea that changing the pressure in the bucket can change the state of heave motion, and verified this through experiments.
The towing process has many factors, including the length of the towline; the stiffness, the location and form of the towline; the resistance and seakeeping of the tugboat, and the object being towed; and the motive power of the tug. The study of this technology began in 1950. Strandhagen et al. [
15] used linear theory to study the interaction between the tugboat and the object being towed, and analyzed the effects of various towing factors on the vessel’s heading. Considering the particularity of the wind turbine structure, towing a turbine is different from towing a vessel. The structure of the wind turbine is very complex; it has many parts and its center of gravity is high, and it can be easily damaged. The construction of the conventional offshore wind turbine requires sinking the foundation or piling first, then hoisting the tower and turbine, and finally connecting the parts together. This method requires large vessels and lifting equipment. If the vessel, equipment, or construction method is not appropriate, it will easily lead to overturning or damage of the wind turbine structure, increasing the construction difficulty. That may have an important impact on the construction period and cost of the whole project [
16,
17,
18].
The one-step integrated transportation and installation vessel can carry two complete wind turbine structures with CBFs. In order to ensure that the turbine and the specialized installation vessel will not be separated during transportation, there has to be a certain interaction force between them in order to restrain wind turbine. In practical engineering, the interaction force between a single wind turbine and the transportation and installation vessel is 500 t. First, high-pressure air is injected into the CBF through an air pump, discharging the water in the foundation to generate buoyancy. In addition to offsetting the weight of the whole turbine, the water body in the foundation is gradually discharged outside to generate buoyancy until the weight of the turbine is offset. The air pumping increases the freeboard height of the transportation and installation vessel and generates excess top-loading force, so that the turbine is closely integrated with the vessel. This paper aims at simulating the stability of the integrated unit by MOSES during the wet-towing process while considering the effects of draft, speed and wave height.
2. Establishment of a Wind Turbine Transportation Model
The main dimensions of the specialized one-step integrated transportation and installation vessel are shown in
Table 1. The complete unit consists of a CBF and an offshore wind turbine. The CBF is a 36 m bucket; the transition section is a curved body; and the wind turbine includes a blade, a nacelle and a tower. In this paper, the turbine with the CBF transported by the one-step integrated transportation and installation vessel is based on a 3 MW wind turbine, and the unit weight is 3000 t.
The wind turbine unit model was simulated by MOSES [
19] air cushion module, and was integrated with the one-step transport vessel model. MOSES uses three-dimensional potential flow theory in calculations with inviscid and irrotational flows. The potential wave is a liquid surface wave, satisfied the Laplace equation, which can be expressed in the Cartesian coordinate system as follows:
In order to solve the unique velocity potential, the sea area must meet certain boundary conditions.
(a) Submarine motion boundary conditions:
The seabed fluid particle does not penetrate the solid boundary and only moves along the tangential direction of the solid boundary. The following Formula (2) is satisfied.
(b) The boundary conditions of the free surface:
The fluid surface of the free surface should ensure that its normal velocity is the same as the normal velocity of the free surface itself. In wave motion, the free surface motion boundary can be expressed as the following Equation (3):
At this time, the motion boundary of the free surface satisfies the following, Formula (4):
(c) Dynamic boundary conditions of free surfaces:
The pressure on the free surface is the same as the atmospheric pressure, so the Bernoulli equation at the free surface satisfies the following, Equation (5):
According to the initial situation of the water surface fluctuation and the initial velocity distribution of the wave field, the initial conditions satisfy the following, Equations (6) and (7):
MOSES simulates sea conditions by the above governing equation. And for the one-step integrated transportation vessel, the motion is featured by the free surface boundary condition, which is nonlinear and makes the description of the body motion complex. Based on the potential theory, the dynamic responses of marine structures are widely studied [
20].
A velocity potential φ can be used to describe the fluid velocity vector
=
at time at the point
in a Cartesian coordinate system fixed in space [
21]. It is convenient to decompose the total velocity potential in the alternative forms [
22]:
where
is the velocity potential of the incident wave system;
is the scattered field due to the presence of the body; the diffraction problem can be solved by considering the
and the
together;
, is the contribution to the velocity potential from the
i-th mode of motion. Therefore the
is called the radiation potential.
In MOSES, the towing resistance is primarily influenced by the wind force and the viscous drag force. Generally, MOSES employs three hydrodynamic theories: Morison’s equation, strip theory, and 3D-diffraction theory. Morison’s Equation is used for the beam element and the viscous drag will be computed. For the panel model, the 3D-diffraction theory is applied.
The drag force on a cylinder in an unsteady viscous flow is determined by Morison’s Equation, which consists of a combination of an inertia term and a drag term:
where
dF is the force per unit length of a cylinder [N/m],
D is the diameter of cylinder [m],
ρ is the density of fluid [kg/m
3],
CM is the mass coefficient,
CD is the drag coefficient, and
V is the acceleration [m/s
2].
Drag force on submerged element consists mainly of friction resistance and pressure resistance.Friction resistance can be expressed as:
where
F is the friction resistance on object N and
V is the towing velocity m/s.
CF is the dimensionless friction coefficient depended on the Reynolds number.
S is the wet surface area of the object m
2.
The convergence of Moses model mainly depends on the size and number of mesh. It was found that the number of fine meshes in the model with reasonable convergence was 500–2000 [
23]. The total mesh number in this study was set as 1750 for the convergence of the Finite Element Model (FEM), in which those for the special vessel were 930 and those for the wind turbine were 410. When simulating the one-step integrated transportation and installation vessel, the hull was simplified when the model was built, regardless of the rounded corners and the vessel’s corners. The semicircular U-shaped groove semi-section of the hull was replaced by a right-angle U-shaped groove.
In order to monitor the interaction between the wind turbine unit and the vessel, and determine whether they are separated in the towing simulation, three springs were set upon the edge circumference of the top cover of the bucket foundation, evenly distributed at 120° intervals. This ensured that the springs were evenly distributed on the edge of the CBF top side. The corresponding positions of the U-shaped grooves were connected to the bucket foundation by these springs in the model. The resultant force of the three springs in the model represents the interaction between the unit turbine and the vessel. The spring force mentioned below is the resultant force of the three springs.
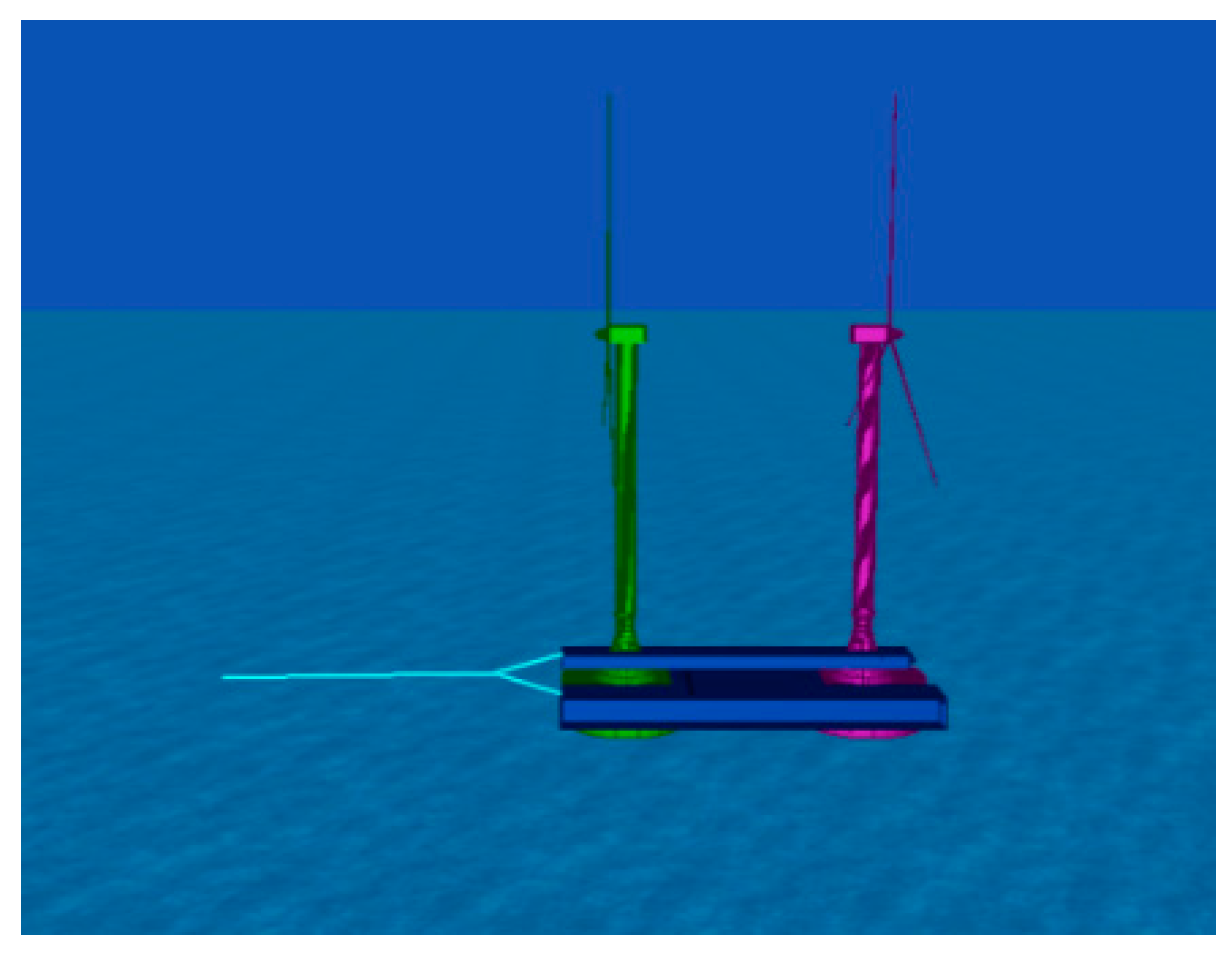
Towing a wind turbine with CBF is different from transporting a conventional wind power structure separately. The entire structure involves a coupling structure of multiple floating bodies and changing a parameter will affect the interaction of the entire model. In order to achieve the specified initial working conditions of the wind power transportation model, a manual ballast one-step integrated transportation and installation vessel model, and a manual adjustment of the air-water percentage of the CBF in the wind turbine unit model are combined. In this way, we can calculate two parameters: The manual ballast for the vessel model and the air-water percentage of the CBF. The manual ballast was 7452.7 t and the air-water percentage of the CBF was 60.6%. After that, we can establish an initial state of the wind turbine unit transport model with a force of 500 t under 5 m draft condition. If we need to change the draft of the wind turbine transport model, we can re-adjust those two parameters. The established wind power transportation prototype and model are shown in
Figure 3 and
Figure 4.
In a practical project, the wind turbine needs to be towed to the designated location for construction. Therefore, the stability of the wind turbine transportation model during towing is very important. It is necessary to establish a wind power vehicle towing model, analyze the stability of the transportation model during the towing process, and verify the feasibility of the offshore wind turbine floating technology. The Y-type towing bridle was set in the model, and the angle between the two-stage streamers connected to the one-step integrated transportation and installation vessel was 90°. The length was 30 m, and the length of the other end was 77.3 m. The height of the towed point connected to the vessel was 0.6 m from the top of the deck and the height of the towage point was 2 m from the water surface. This allowed the entire Y-type cable to be above the water surface, reducing the influence of factors, such as the wave current. The wave water flow is likely to change the force caused by the cable deviating from the original direction. The tow process requires a time domain analysis in MOSES. In that process, it is not possible to directly apply a certain current speed to the model as an external condition. Therefore, we used the principle of relative motion. The wind power transport model was fixed at a certain point by the cable, then a sea current with a magnitude equal to the speed and opposite direction was set to the model to simulate the situation of towing at a certain speed.
The established wind power vehicle towing prototype and model is shown in
Figure 5 and
Figure 6. The setting conditions are as follows: Draft 5 m, speed 4 knots, wave height 1.5 m, wave period 5 s, and 0° wave direction.
The towing force; the interaction force between the wind turbine unit and the transportation and installation vessel; the surging, heaving and pitching acceleration of the vessel; and the surging, heaving and pitching acceleration of the turbine were obtained by the MOSES model. In order to guarantee convergence in the time domain analysis, the calculation time step was set as 0.01 s. The Newmark method was used to integrate the equation of motion, in which Newmark’s beta and alpha coefficients were 0.4 and 0.8 respectively. The results are shown in
Figure 7,
Figure 8,
Figure 9,
Figure 10 and
Figure 11.
As can be seen from the
Figure 7,
Figure 8,
Figure 9,
Figure 10 and
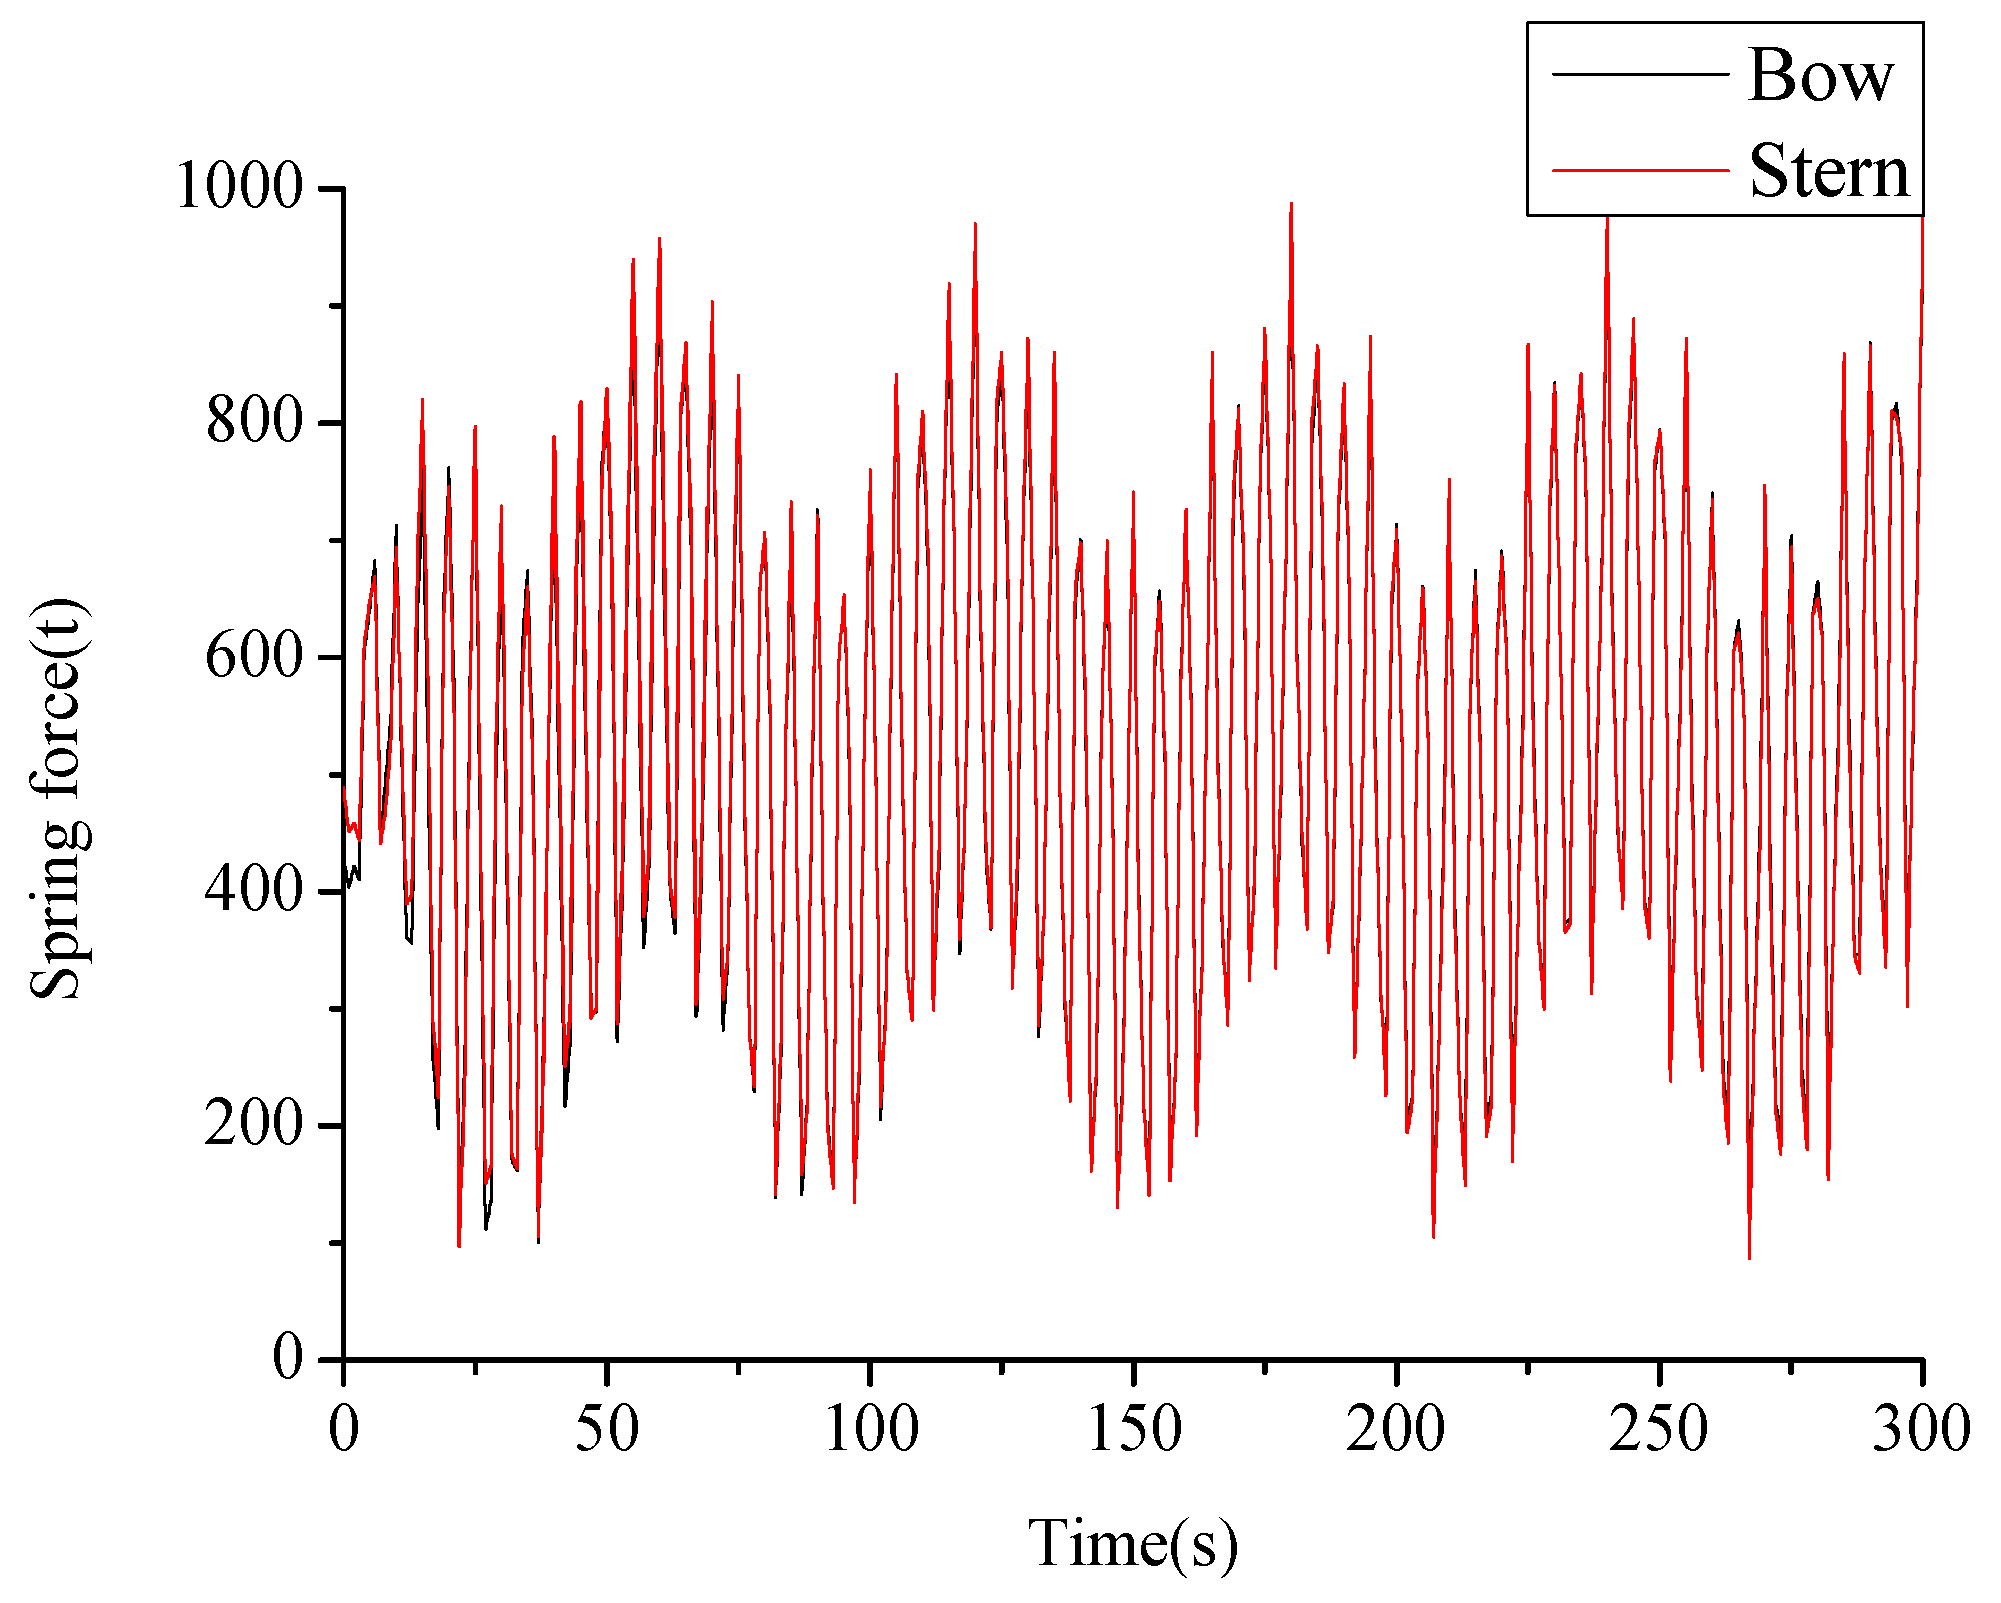
Figure 11, the towline force oscillated with the wave period. The oscillation was more severe at the beginning 0–50 s time course. The maximum value reached 300 t and the minimum value was 50 t, which led to the amplitude of 250 t. This was mainly because the unit model was applied for the working conditions at one time in the beginning of calculation. The model was suddenly subjected to the impact of water flow and wave, and the fluctuation phenomenon occurred as a start of towing. It took approximately 75–100 s to reach a relatively steady state for the unit model. After 100 s, the maximum towing force reached 250 t and the minimum value was 75 t. So the amplitude was 175 t and the mean value was 160 t. The spring force also oscillated with the wave period. The mean value of the spring force was about 500 t, which is consistent with the initial set value. The spring force oscillated around the initial set value with the maximum value of 900 t and the minimum of 100 t. The minimum value of the spring force was still always greater than zero, so the interaction between the wind turbine unit and the transportation and installation vessel was always pressure. The CBF and vessel were not separated from the movement. Under the working conditions, the wind turbine unit transportation model can work normally. The spring force time history curve of the turbine in the bow was almost the same as that in the stern; that is, the effect of the wave on the turbine in the bow and the stern was almost the same. The subsequent spring force is the resultant force of the three springs of the extracted bow as the basis for the analysis.
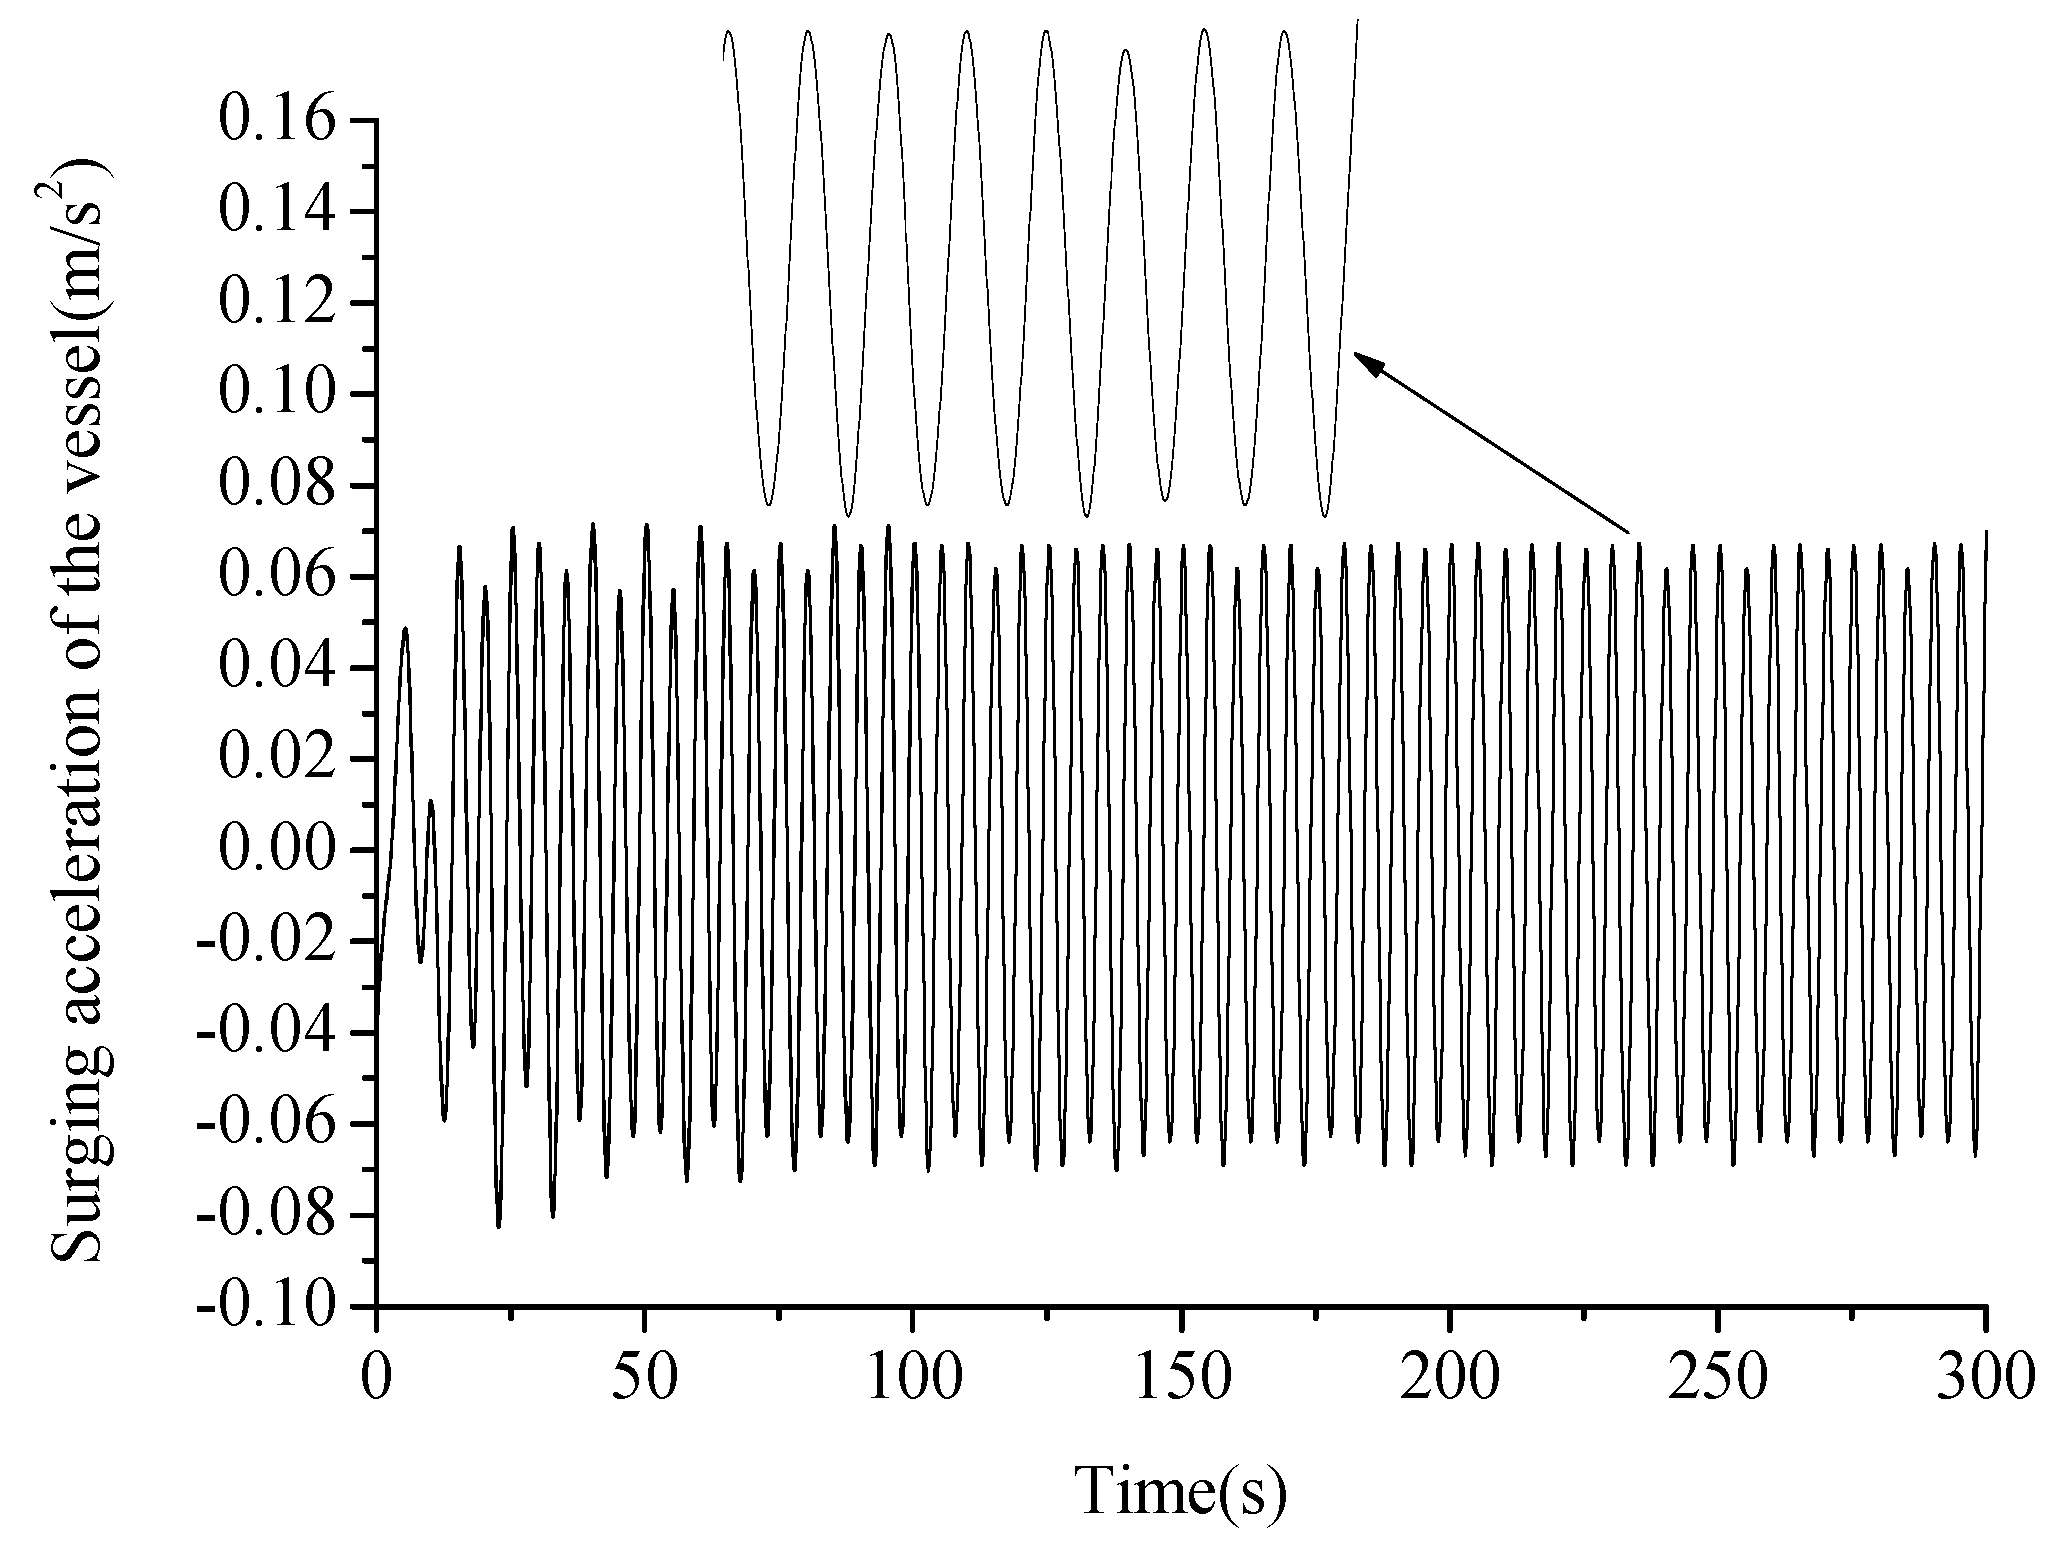
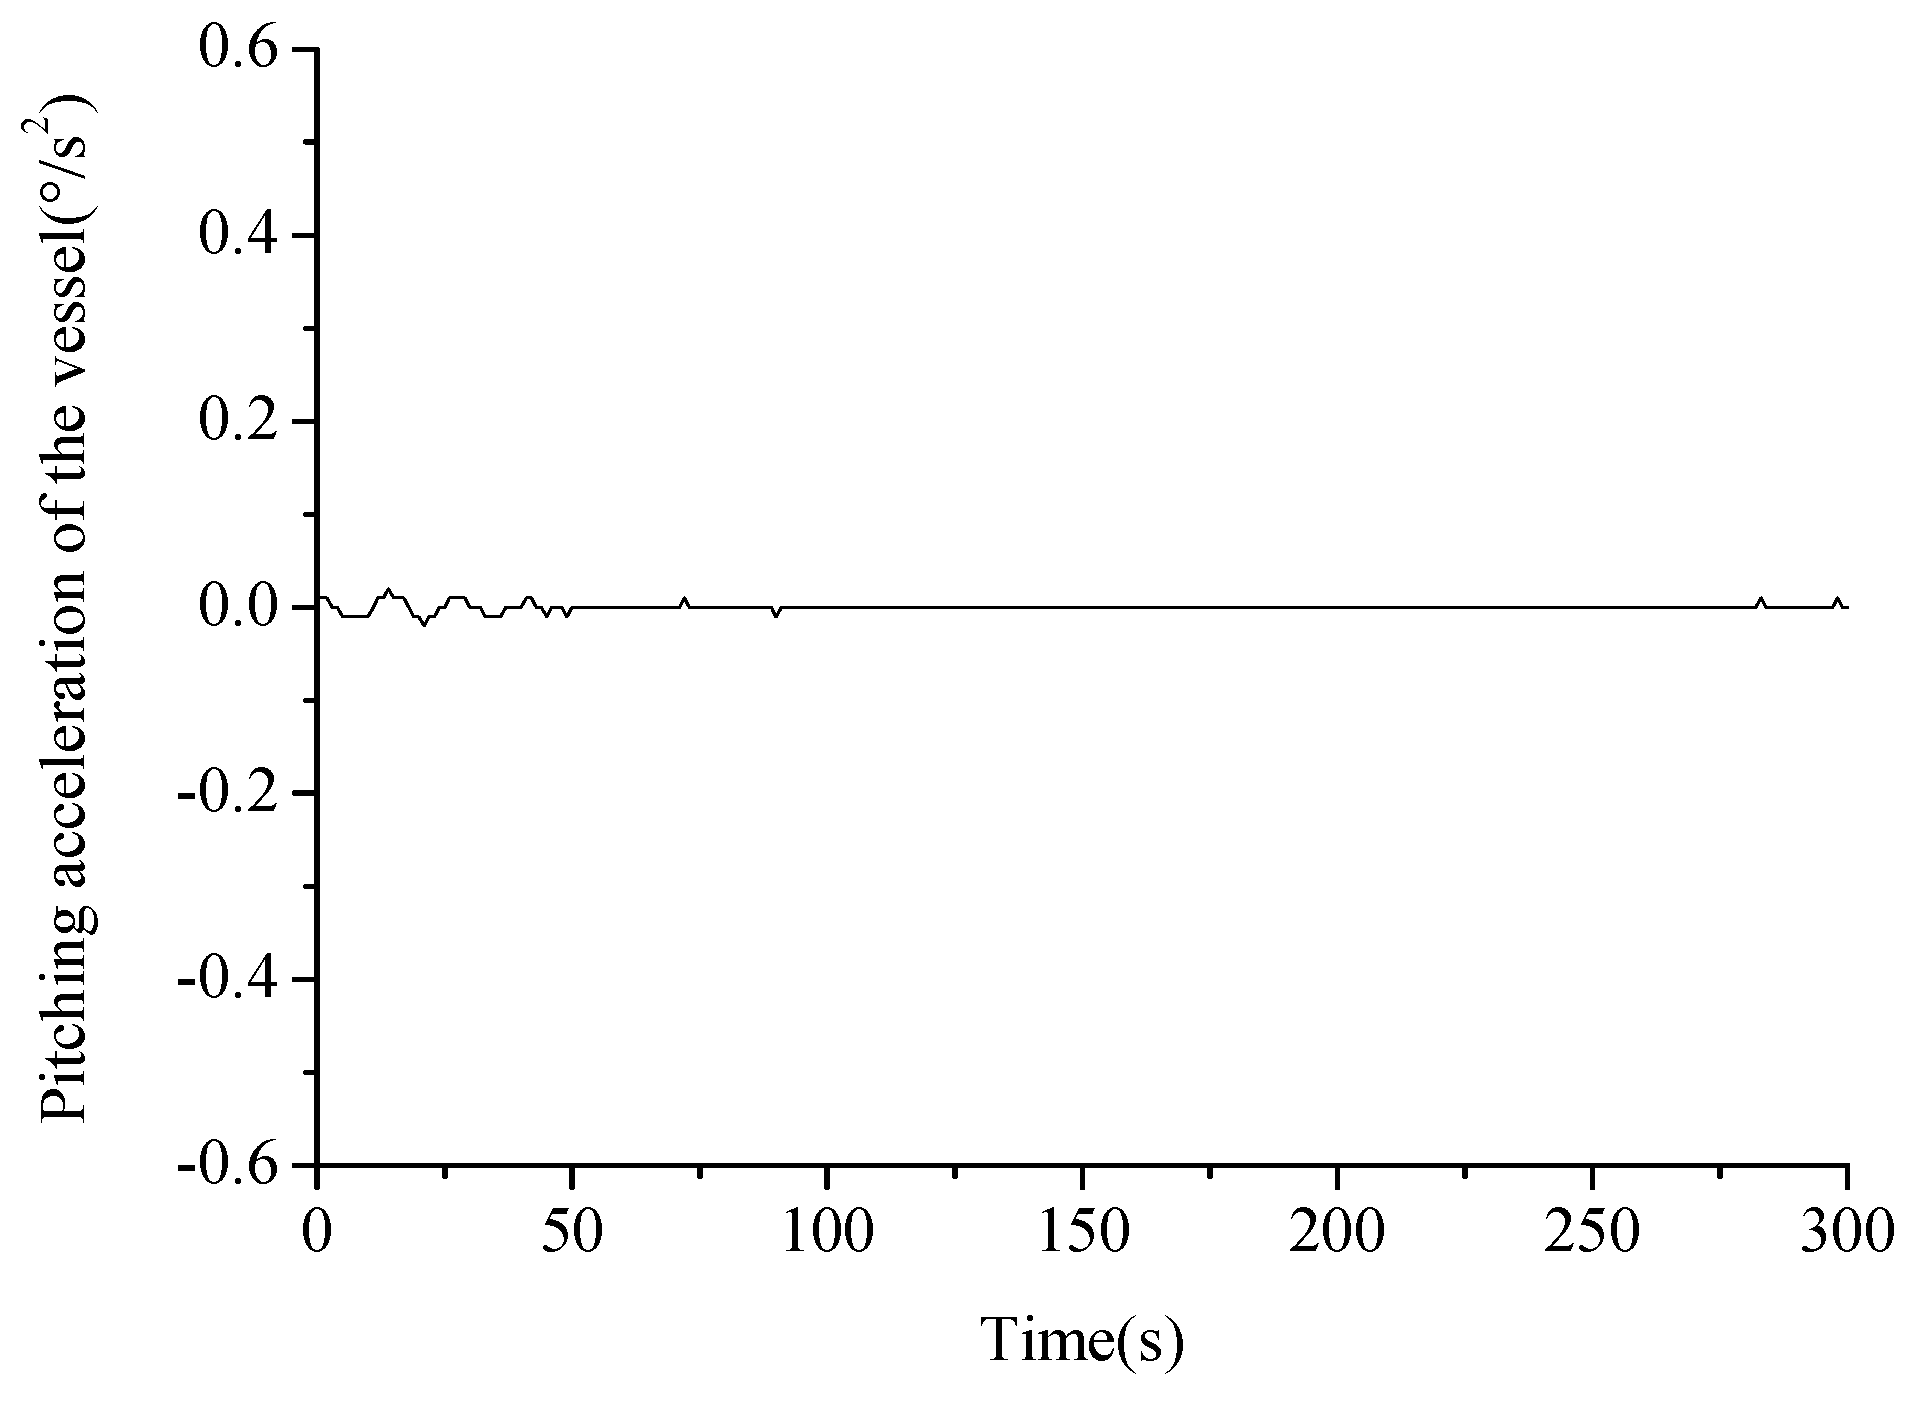
The peak of the heaving acceleration was the largest, about 0.4 m/s2; the second largest was the surging acceleration, which was about 0.08 m/s2. The pitching acceleration was not obvious, and it was zero in many time periods; the maximum value was only 0.02°/s2. It shows that the heaving oscillation movement of the vessel is dominant and the pitching motion is negligible.
3. Floating Conditions of the Wind Turbine Unit Floating Structure
3.1. Draft Effect
The draft of the vessel is an important part of the initial operation of the wind turbine. In the foregoing, it is mentioned that the draft of the one-step integrated transportation and installation vessel and the percentage of water in the CBF were controlled to control the draft of the entire structure. Also, the spring force between the vessel and the turbine was kept constant. In practical engineering, it is necessary to control the draft of the entire structure by the above method, and how the draft depth affects the floating stability of the wind turbine is the problem we were going to analyze.
In order to explore the influence of draft depth on the floating operation of turbine, three drafts of 4 m, 5 m, and 6 m were selected to analyze the wind power vehicle transportation model in the time domain. That model was a coupling structure of multiple floating bodies, and the transportation vessel and wind turbine unit were mutually restricted. At the same time, we changed the manual ballast and percentage of water in the CBF to ensure that the force between a single turbine and a vessel remained unchanged at 500 t. Other conditions for the given operating conditions were as follows: Wave height 1 m, period 5 s, speed 4 knots and 0° wave direction. The time domain analysis of the wind power transportation model under those three drafts was carried out by MOSES. A comparative analysis of towing cable force, spring resultant force, and surging and heaving acceleration under various working conditions was obtained. The conditions are shown in
Table 2.
3.2. Comparative Analysis of Model Towing Cable Force and Spring Force Under Different Drafts
Comparative analyses of the towing cable force and spring force of the model under different draft conditions are shown in
Figure 12 and
Figure 13.
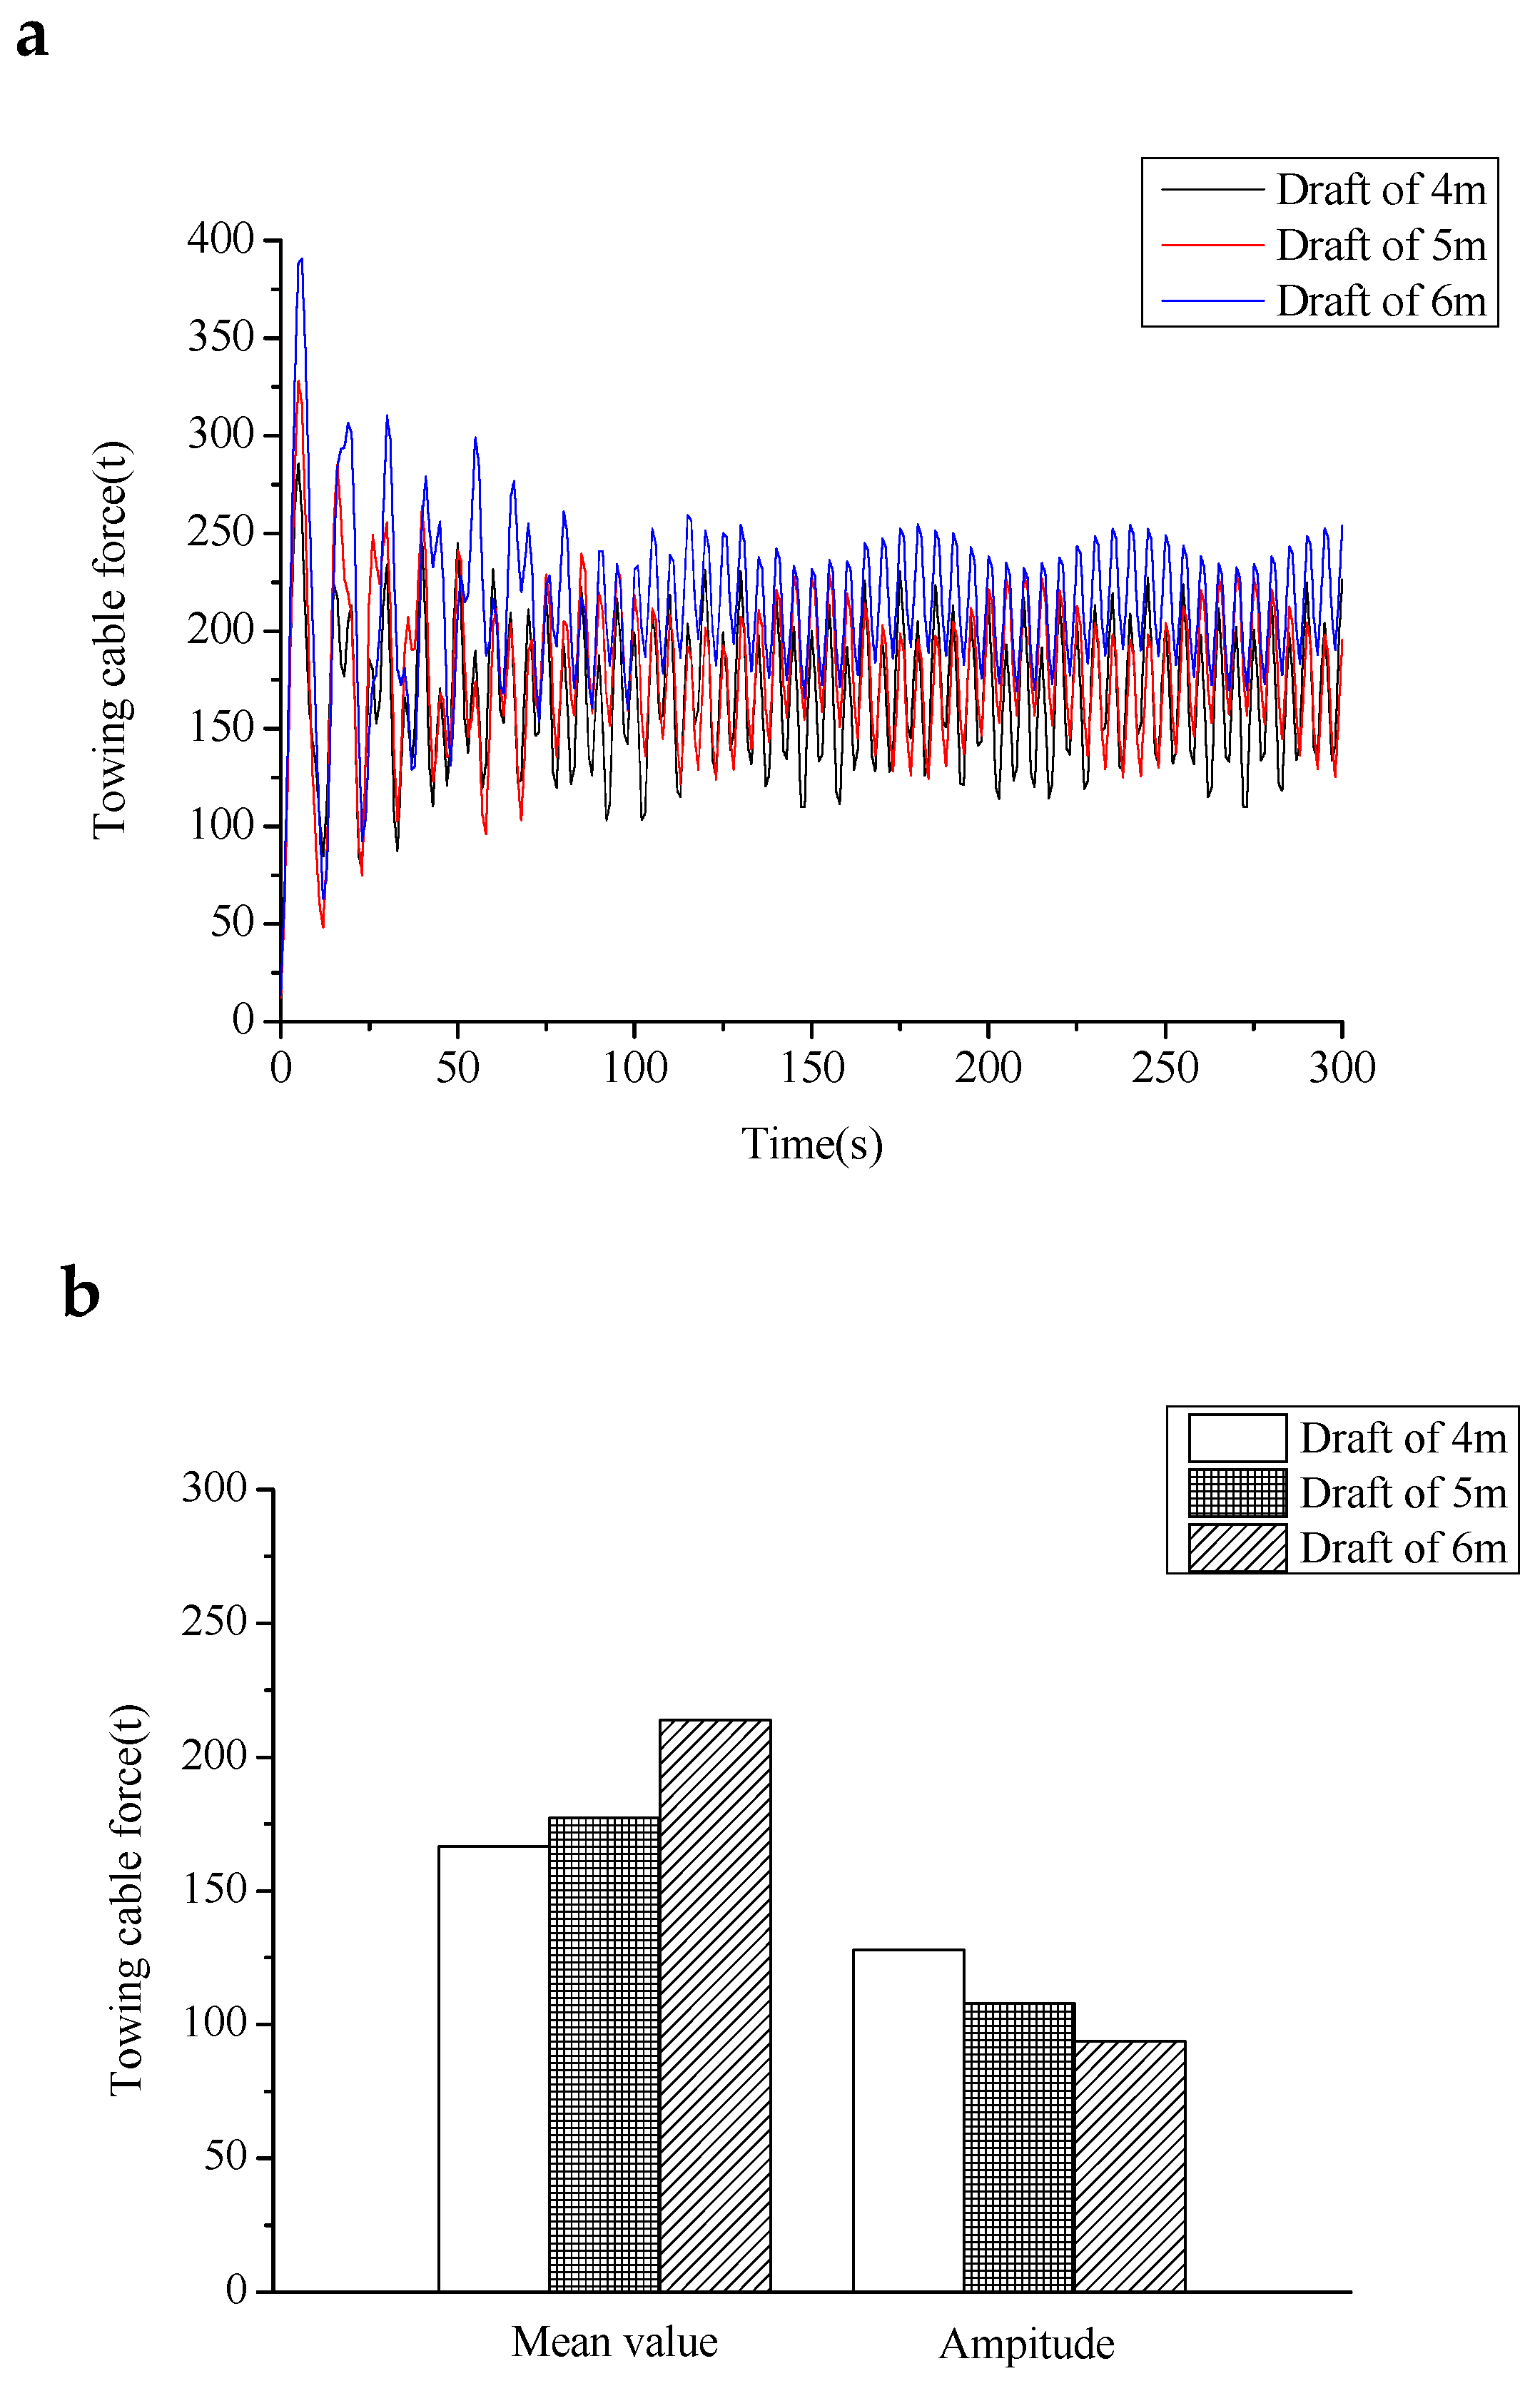
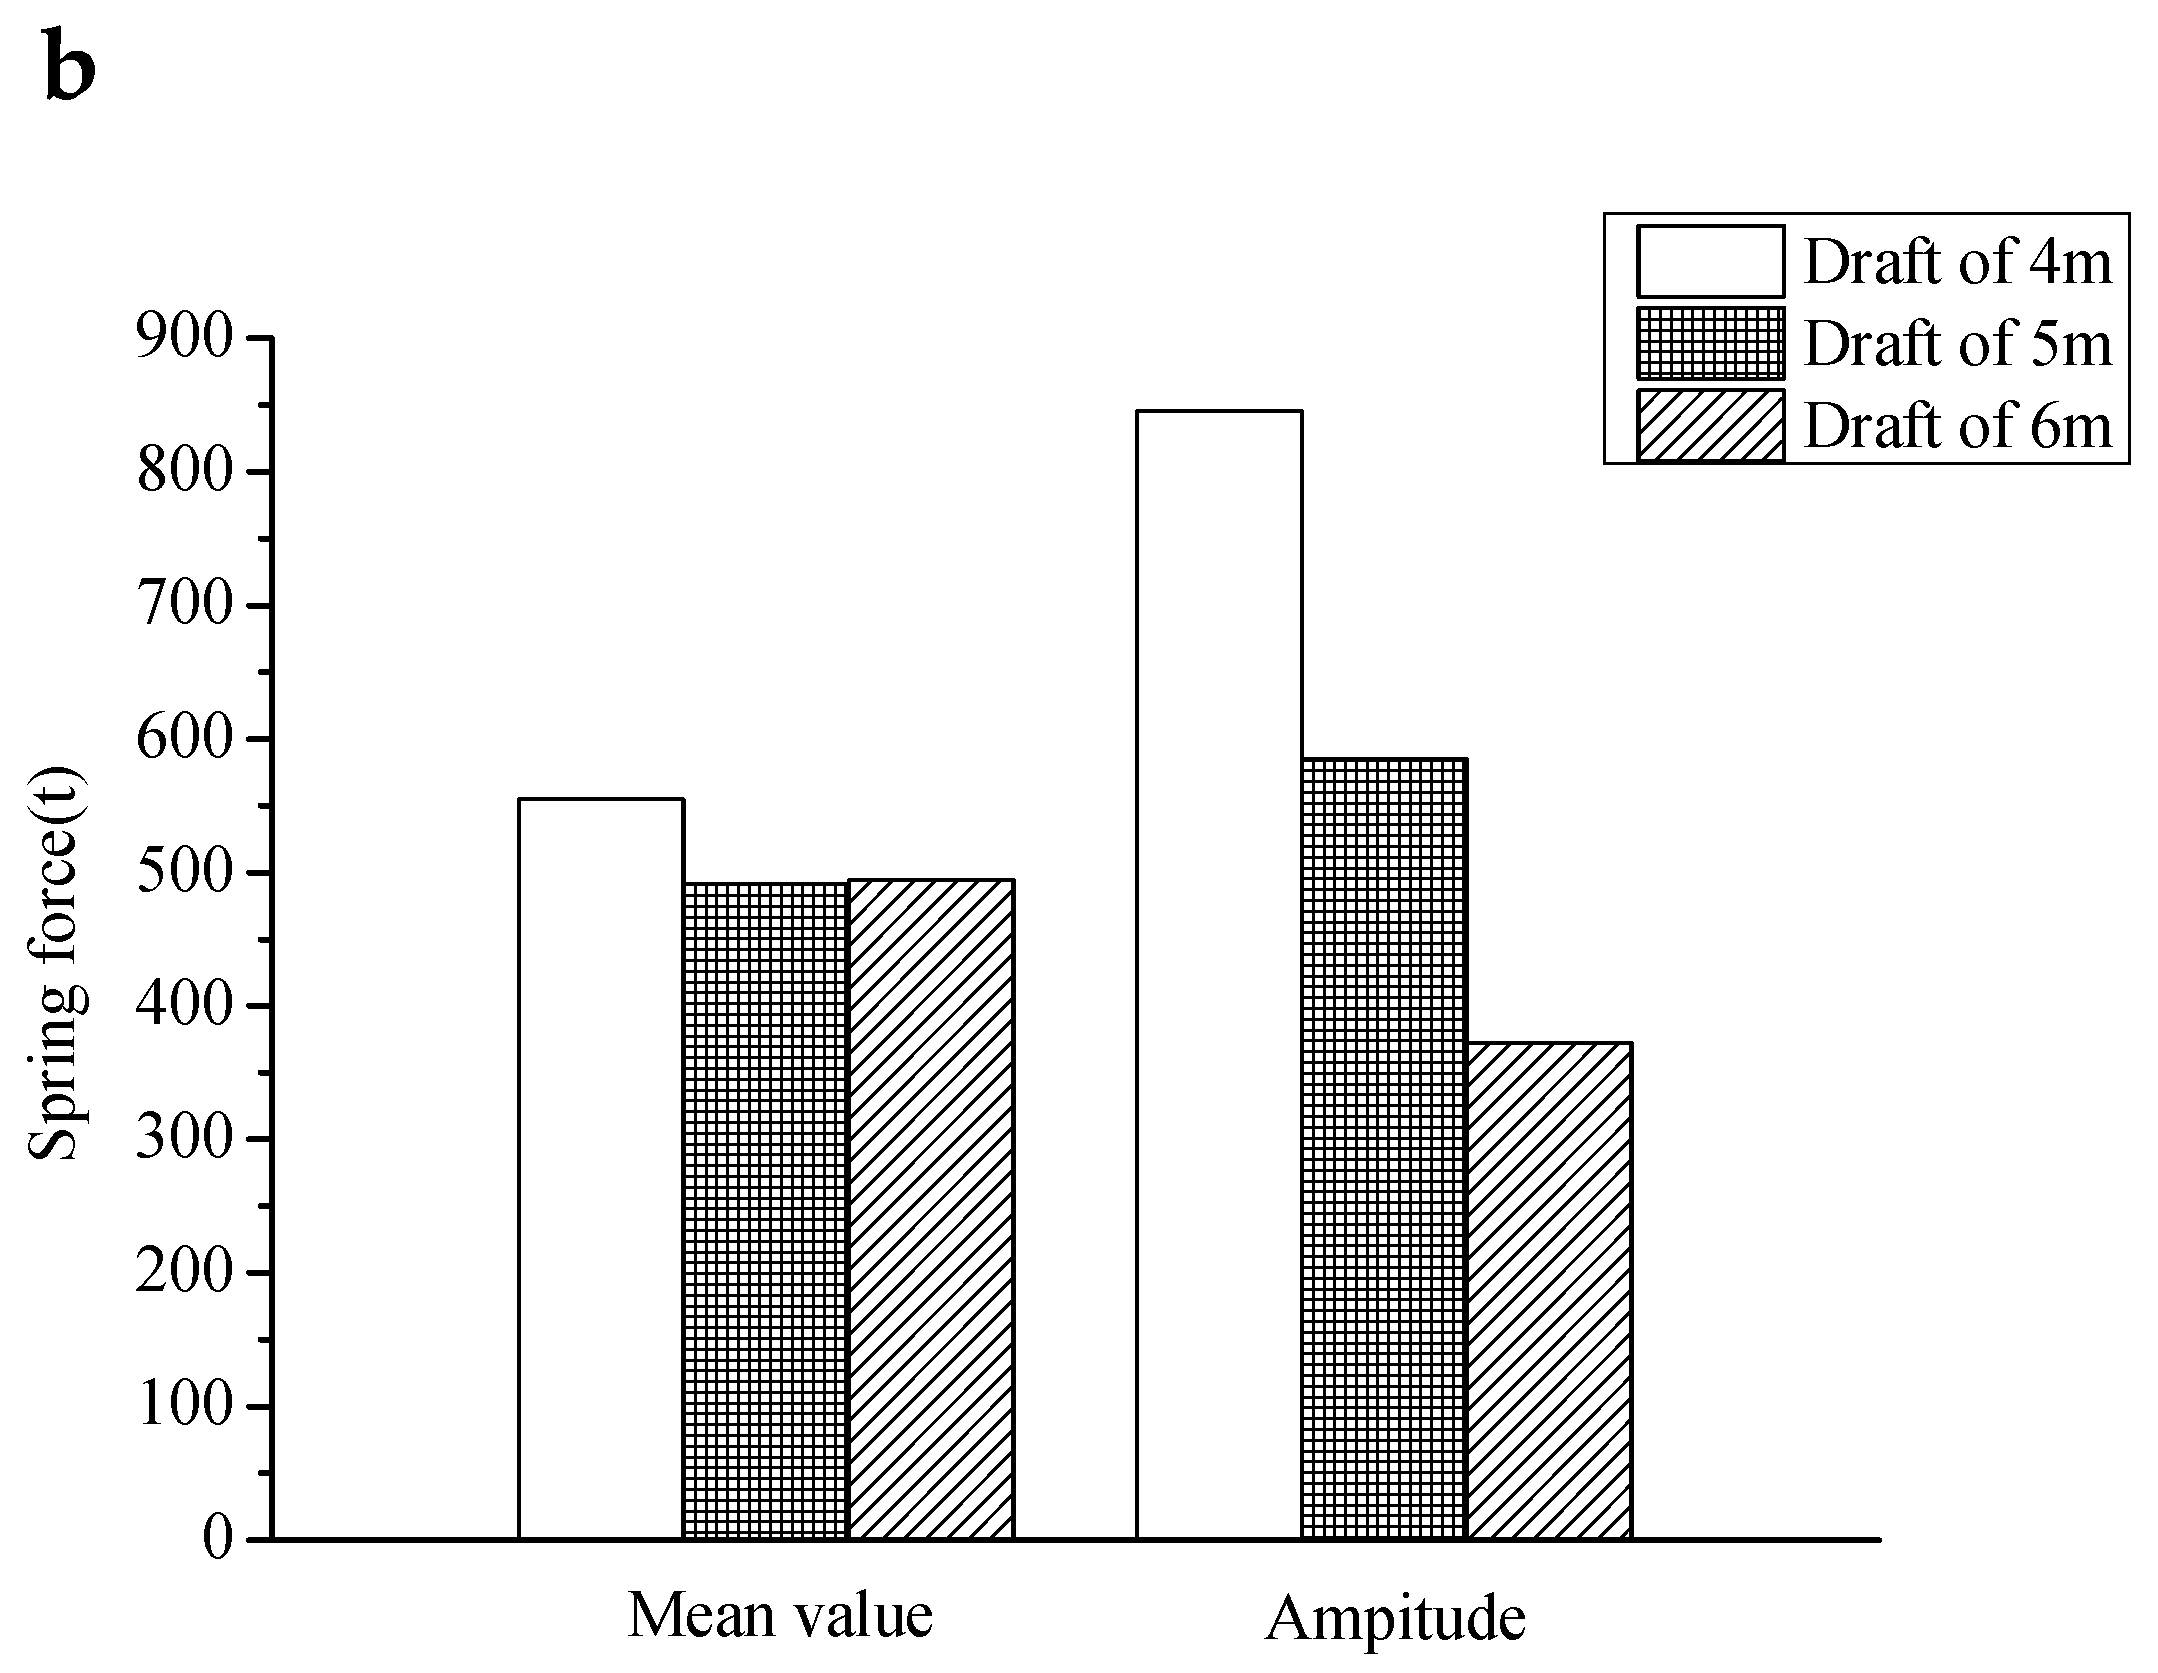
It can be seen that as the draft increased, the amplitude of the towing cable force oscillation during relatively steady motion decreased slightly, and the amplitude after relative stabilization was 100 t. The mean value of the towing cable force increased from 170 t for 4 m draft to 220 t for 6 m draft with an increase of about 30%. As the draft increased, the mean value of the spring force was almost constant, and it oscillated around 500 t, while the amplitude became significantly smaller from 850 t at 4 m draft to 350 t at 6 m draft with a decrease of about 59%. Under the conditions of each draft, the spring force was always greater than 0. It can be said that under those three conditions, the wind turbine and the one-step transport vessel were not separated in the time domain, ensuring integrated transportation.
3.3. Comparative Analysis of Vessel Acceleration of Model Under Different Drafts
Comparative analyses of the longitudinal and heaving acceleration of the transportation and installation vessel with different draft conditions are shown in
Figure 14.
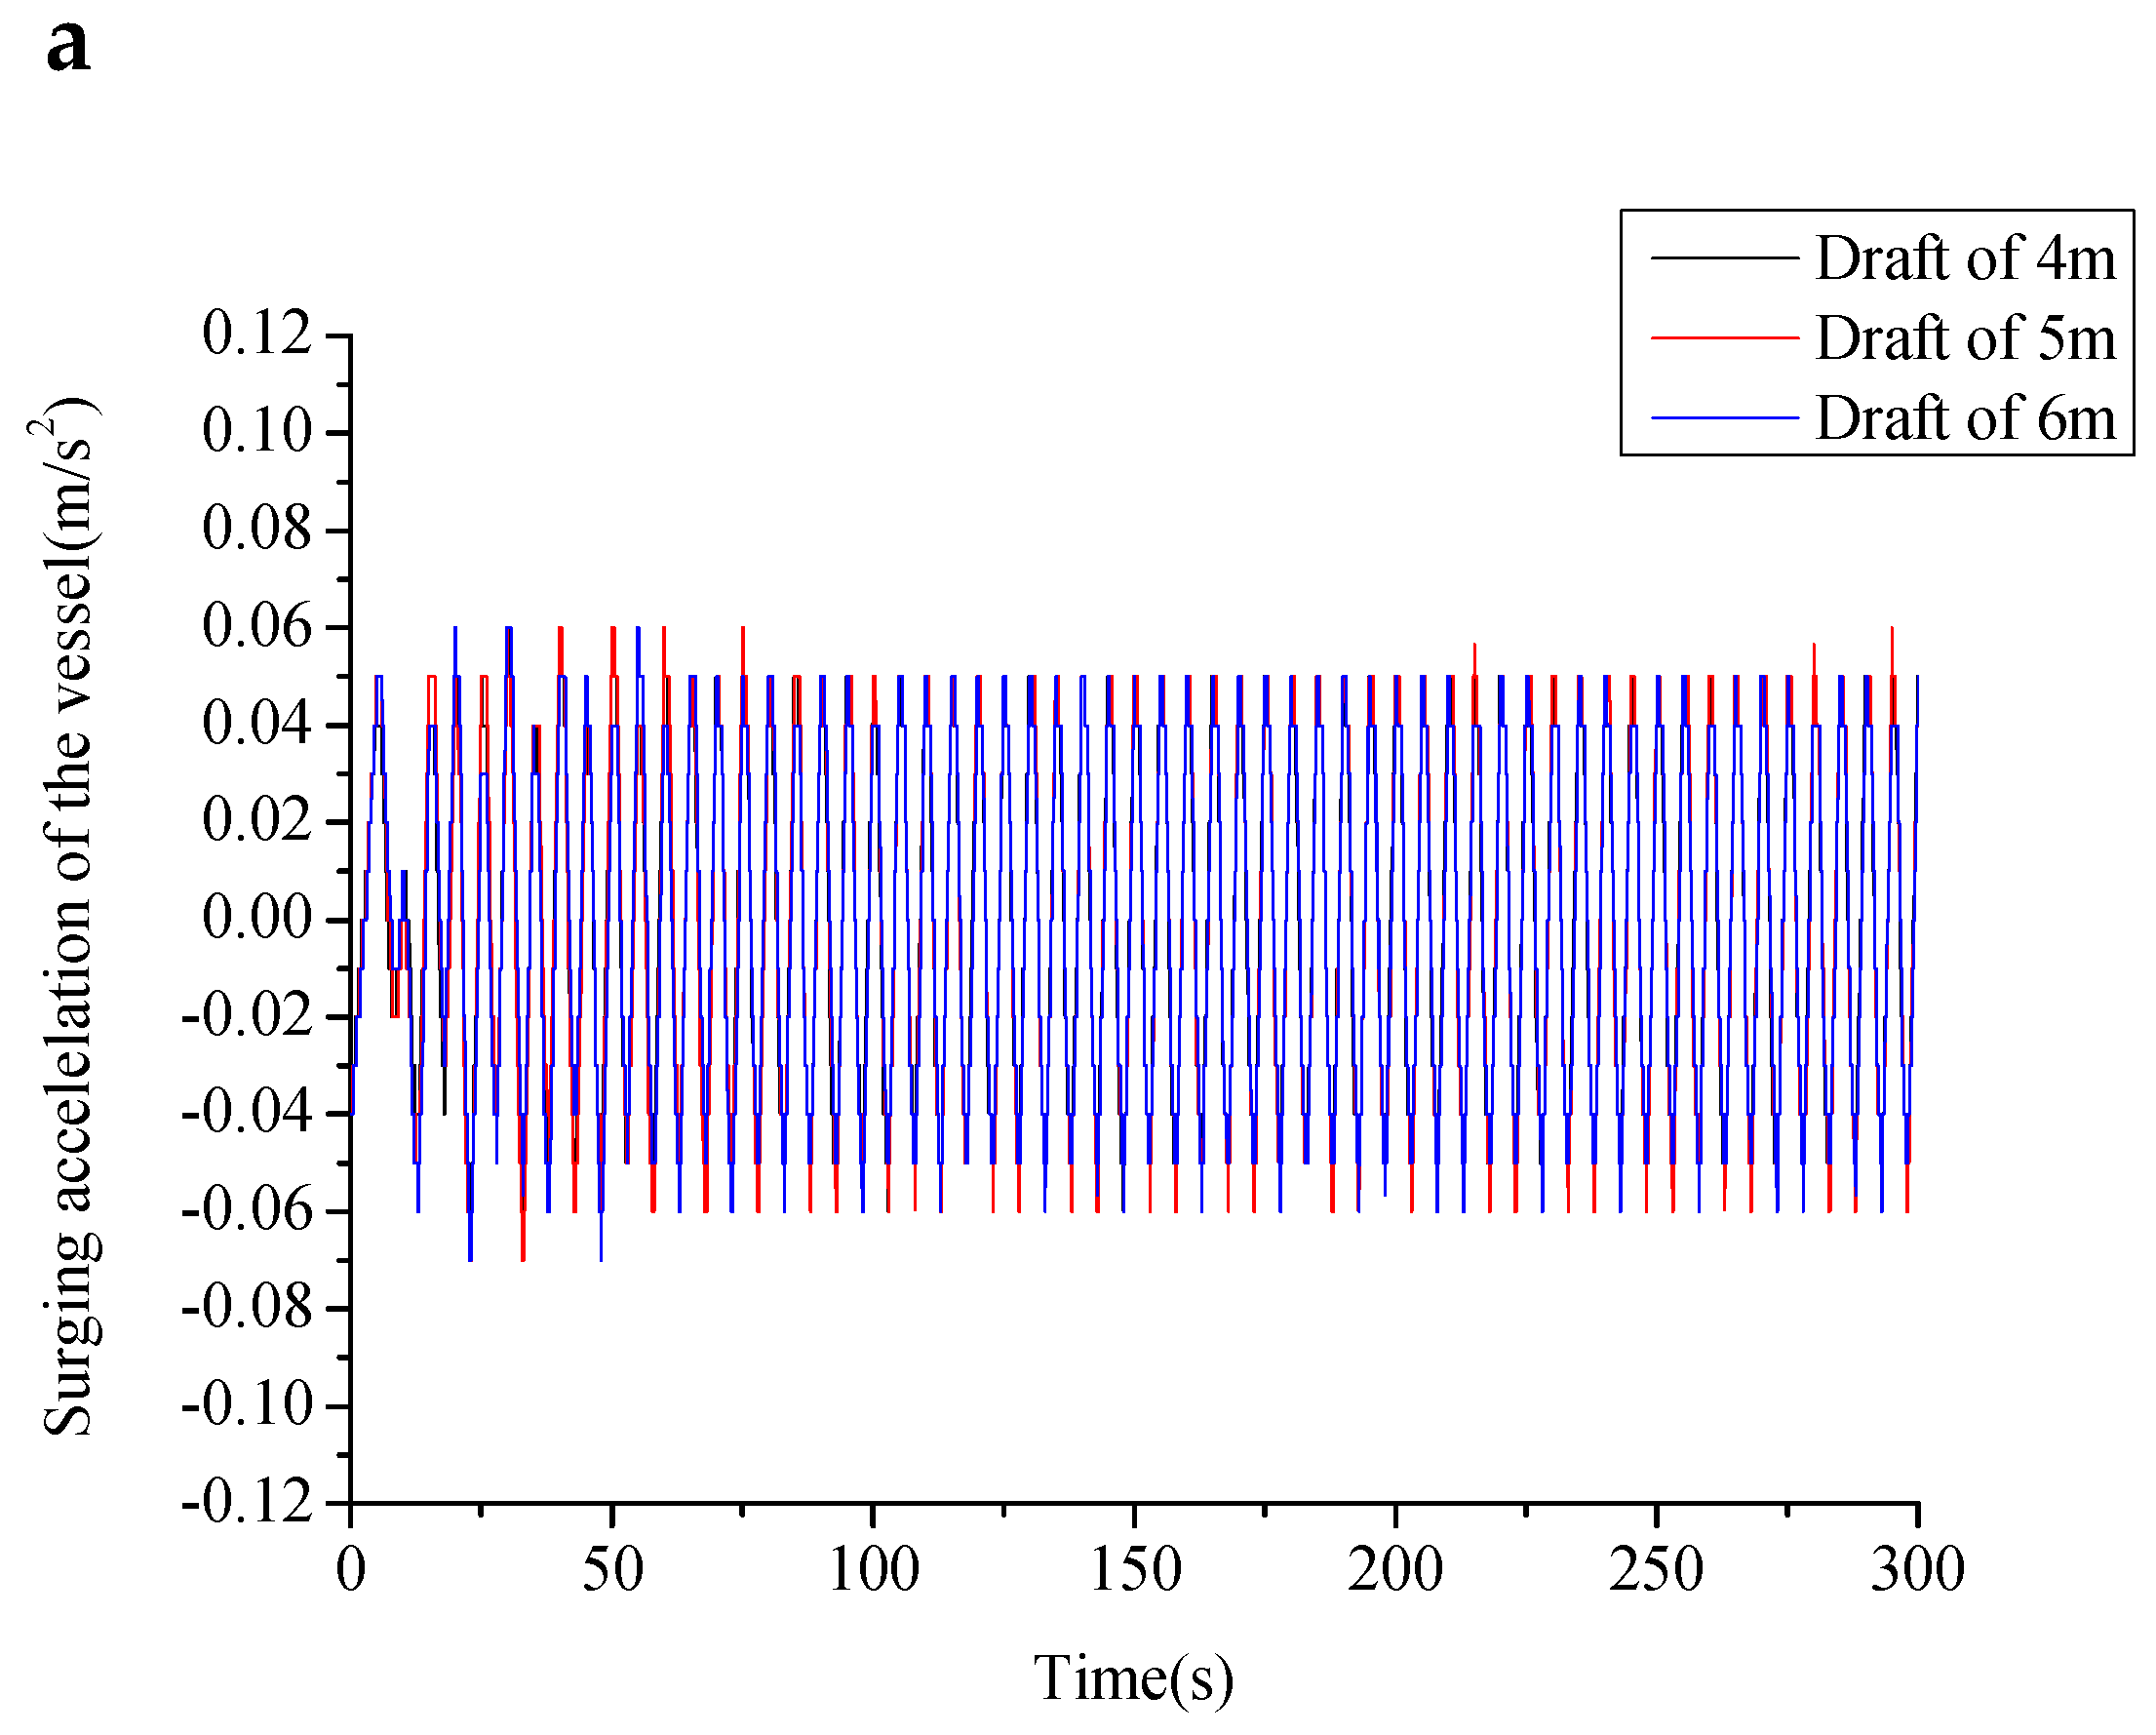
As the model draft increased, the amplitude of the surging acceleration was almost unchanged. The amplitude was 0.1 m/s2. The mean value of heaving acceleration of the 4 m and 5 m drafts was relatively close, while the heaving acceleration amplitude of the 6 m draft was significantly lower than the heaving acceleration of the 4 m and 5 m drafts, decreasing from 0.6 m/s2 to 0.2 m/s2, a reduction by two-thirds.
From the above analysis, it can be seen that as the draft increases, the magnitude of the towing cable force amplitude of the vessel has a slightly increased mean value. The amplitude of the spring force decreased significantly with the increased draft, and the heaving acceleration of the vessel was significantly reduced when the water is 6 m. Increasing the draft can significantly reduce the vertical oscillation of the vessel.
3.4. Towing Speed Effect
In actual engineering, it is necessary to pursue the towing process quickly and safely. Therefore, it is necessary to give an appropriate towing speed while ensuring structural stability. The impact of speed on the towing process was analyzed. In order to explore the influence of vessel speed on the floating of a wind turbine, three towing speeds, 2, 4 and 6 knots, were selected to analyze the wind turbine transport model in the time domain. Other conditions for the given operating conditions were as follows: Wave height 1 m, period 5 s, draft 6 m and 0° wave direction. The time domain analysis of the wind power transportation model under three sailing speeds was carried out by MOSES, and a comparative analysis of towing cable force, spring resultant force, hull sway and heaving acceleration under various working conditions was obtained. The conditions are shown in
Table 3.
3.5. Comparative Analysis of Model Towing Cable Force and Spring Force Under Different Towing Speed Conditions
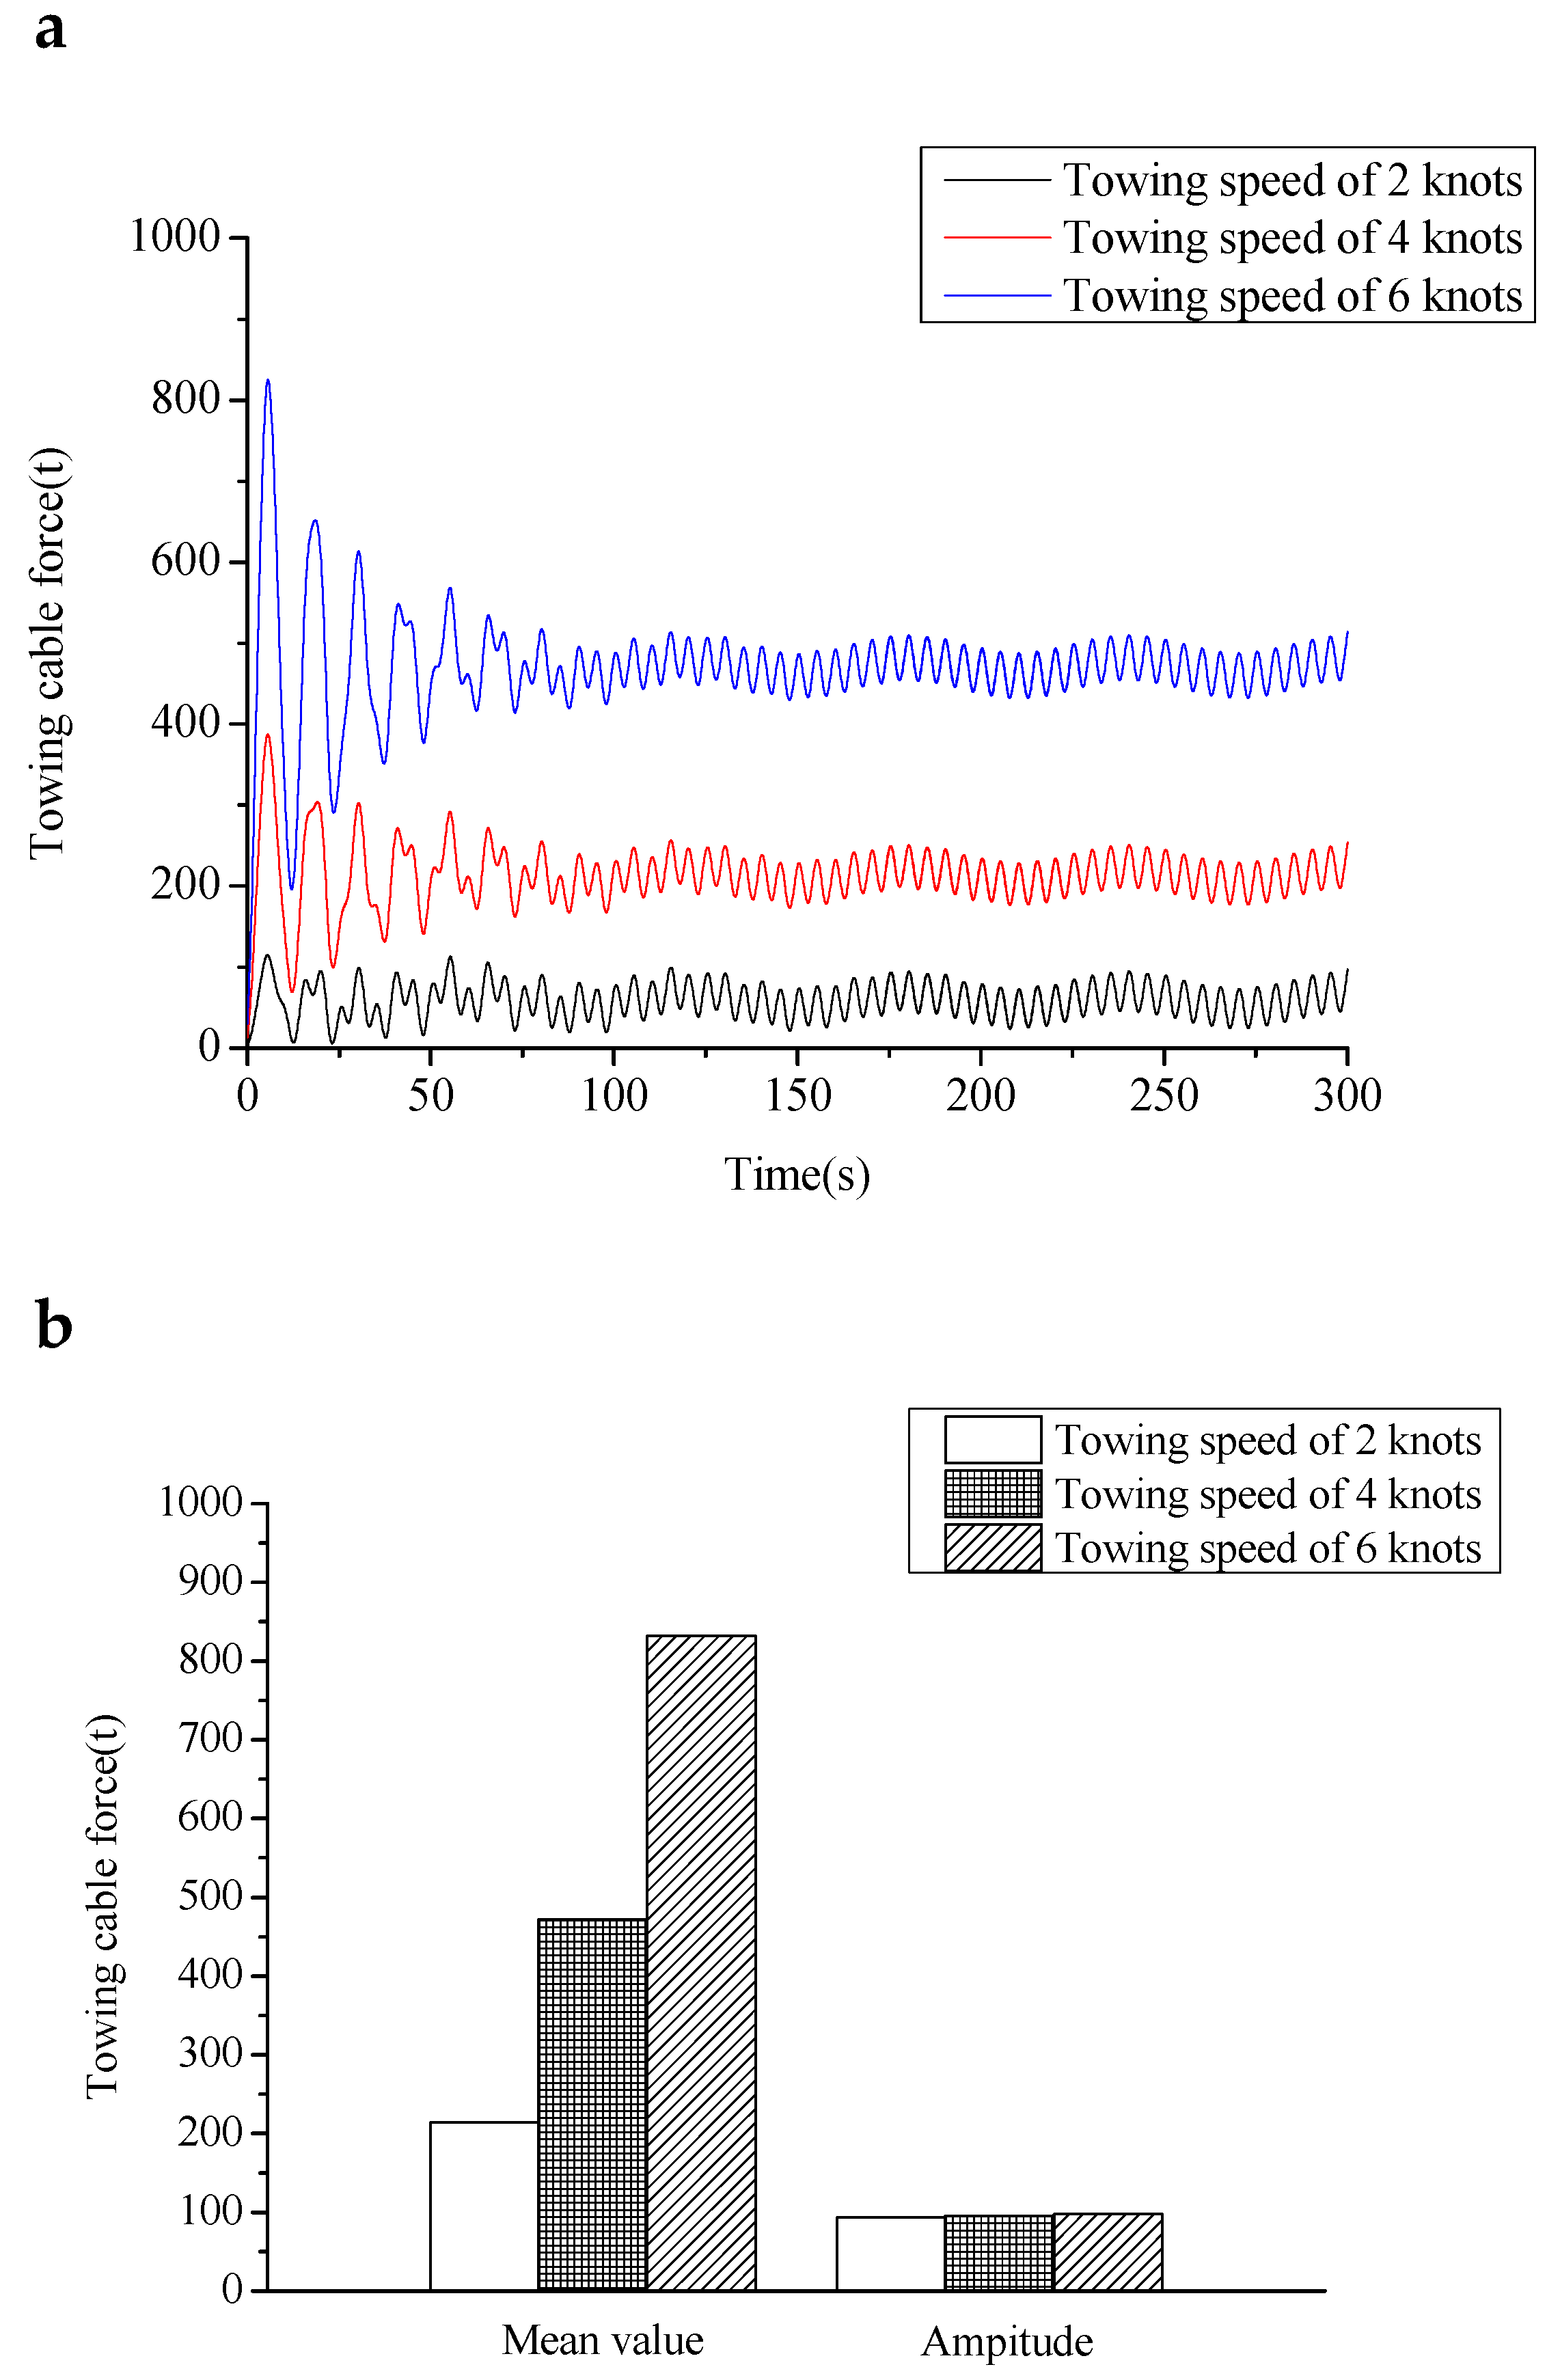
Comparative analyses of the model towing cable force and spring force under different towing speed conditions are shown in
Figure 15 and
Figure 16.
As the speed of the vessel increases, the mean value of the towing cable force increases significantly, from 50 t at a speed of 2 knots to 450 t at a speed of 6 knots, an increase of 800%, while the amplitude of the towline force oscillation is almost constant after stabilization at 75 t. The mean value of the towing cable increases in a square relationship with the towing speed of the vessel.
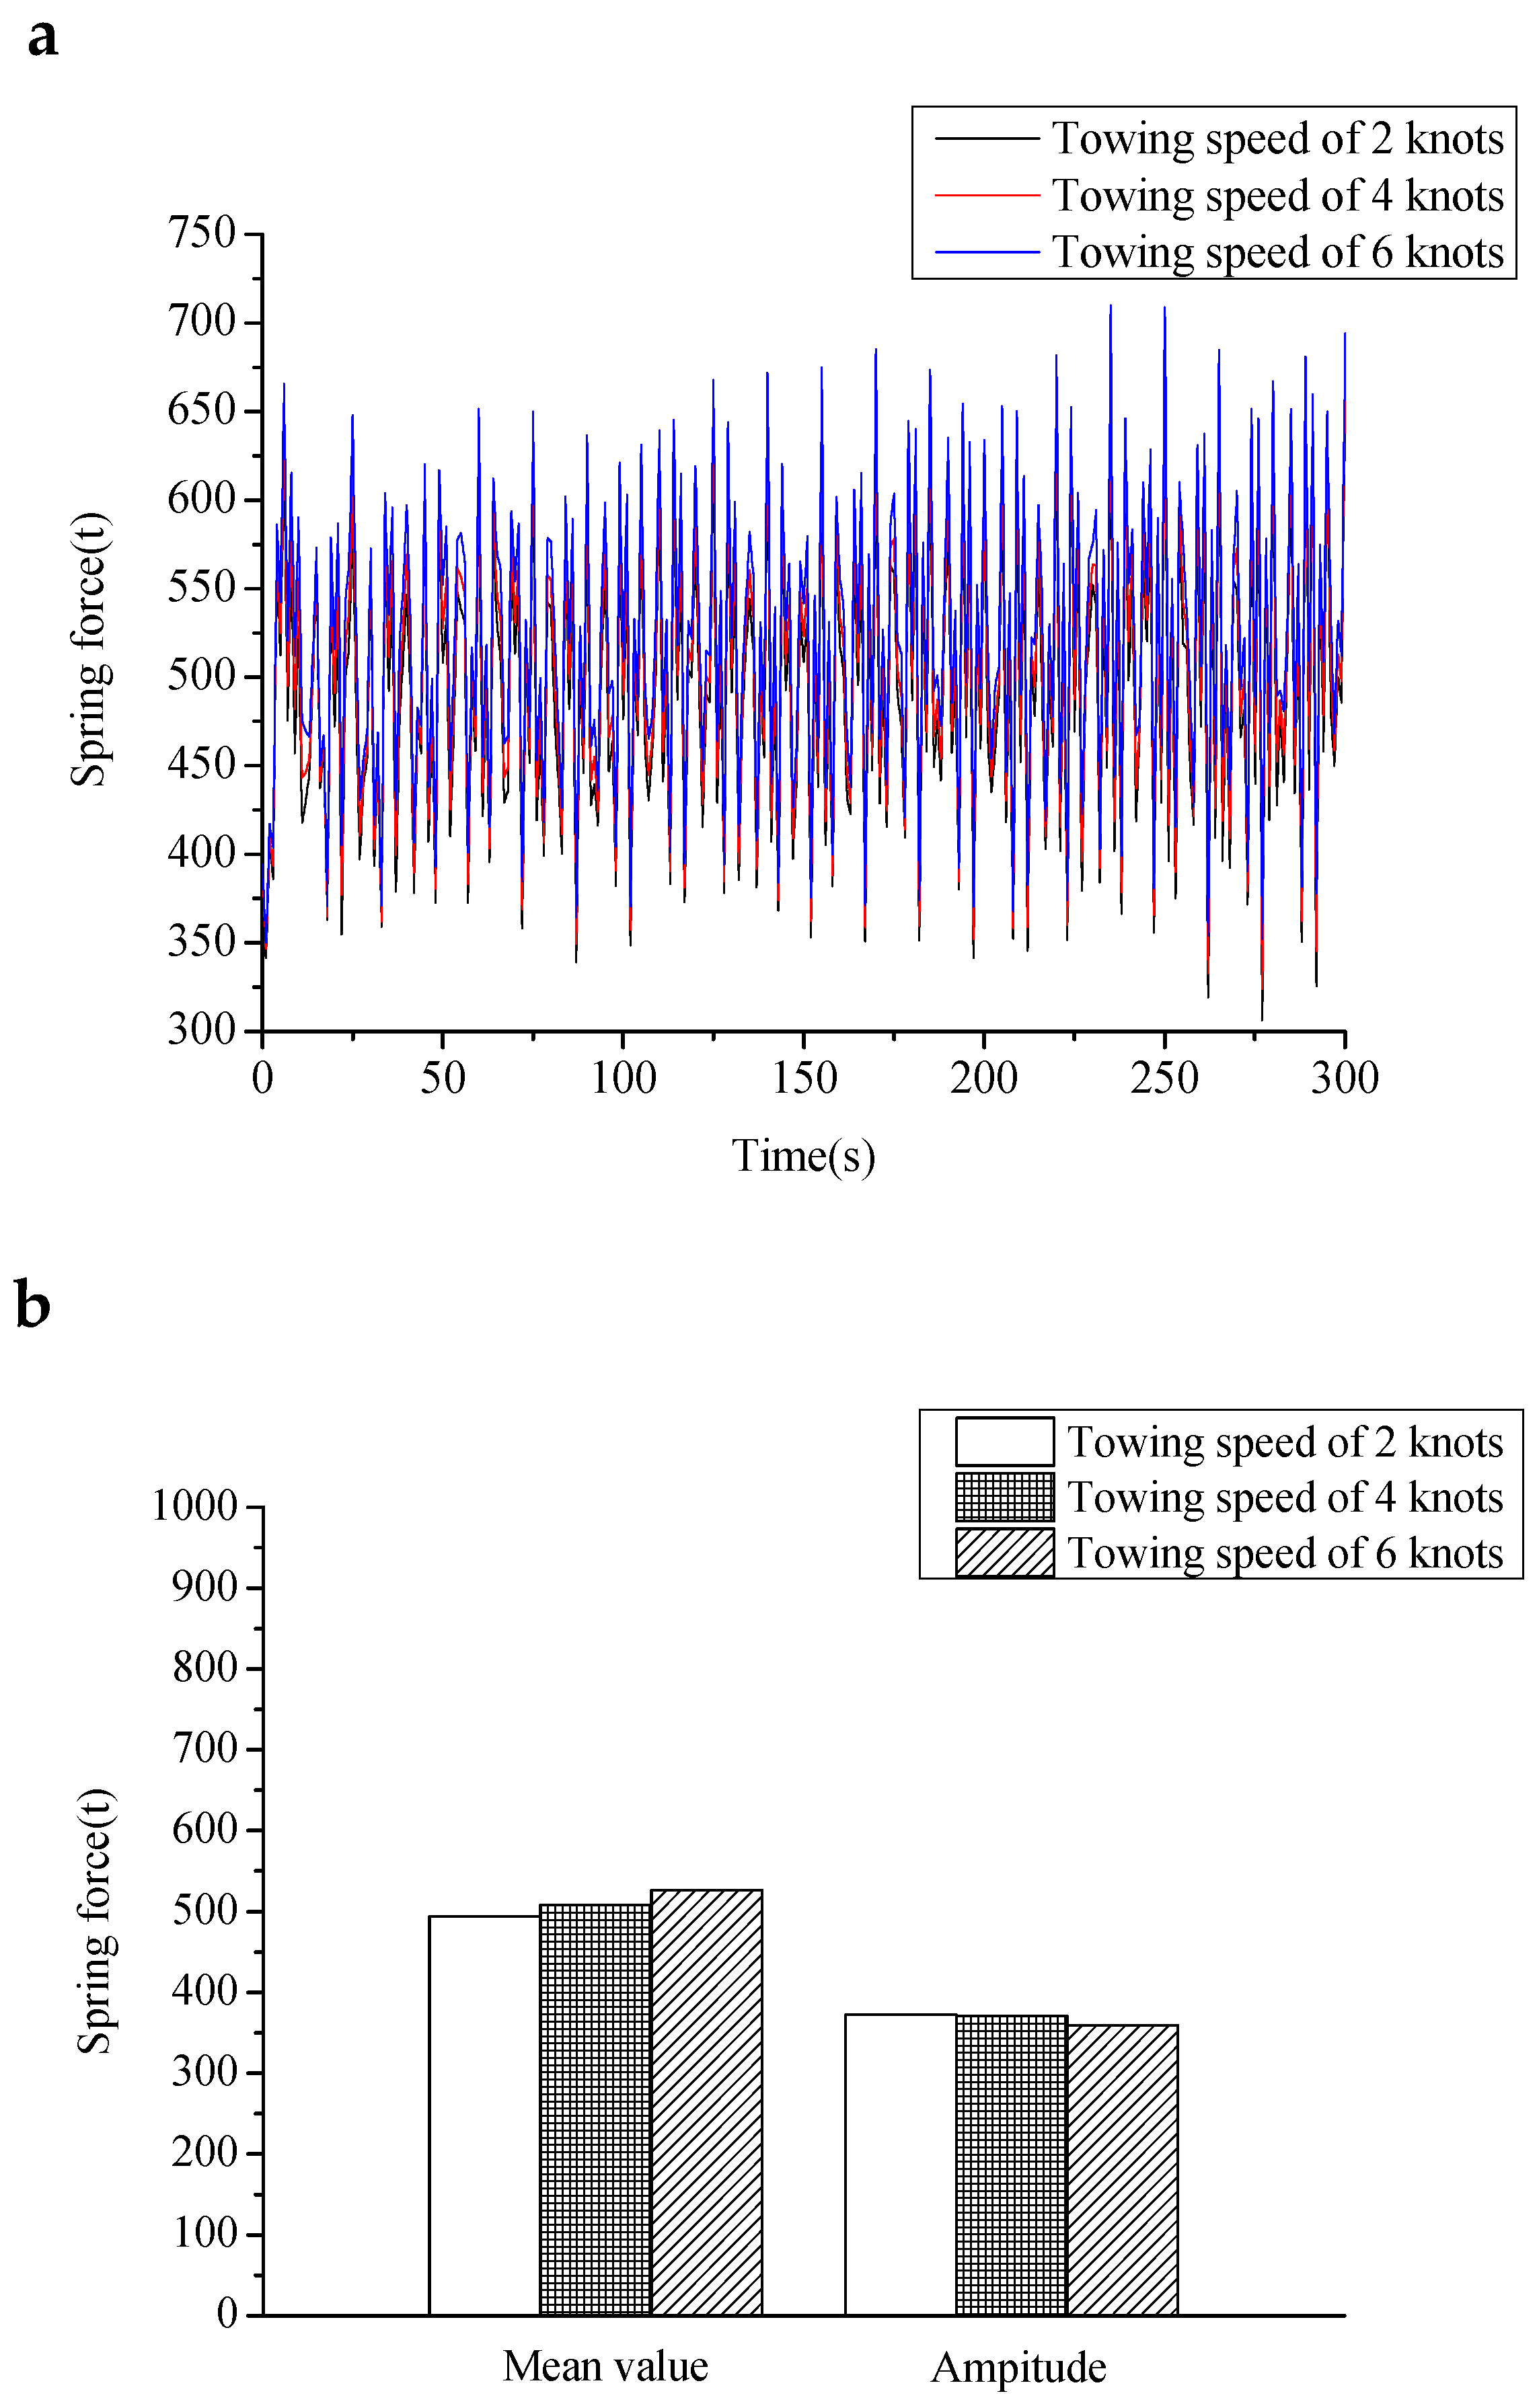
As the speed of the vessel increases, the mean value and the amplitude of the spring force is almost unchanged, and it oscillates around 500 t. The spring force was always greater than 0 under each draft condition. It can be said that under these three conditions, the wind turbine unit and the one-step integrated transportation and installation vessel were not separated in the whole time domain, ensuring integrated transportation.
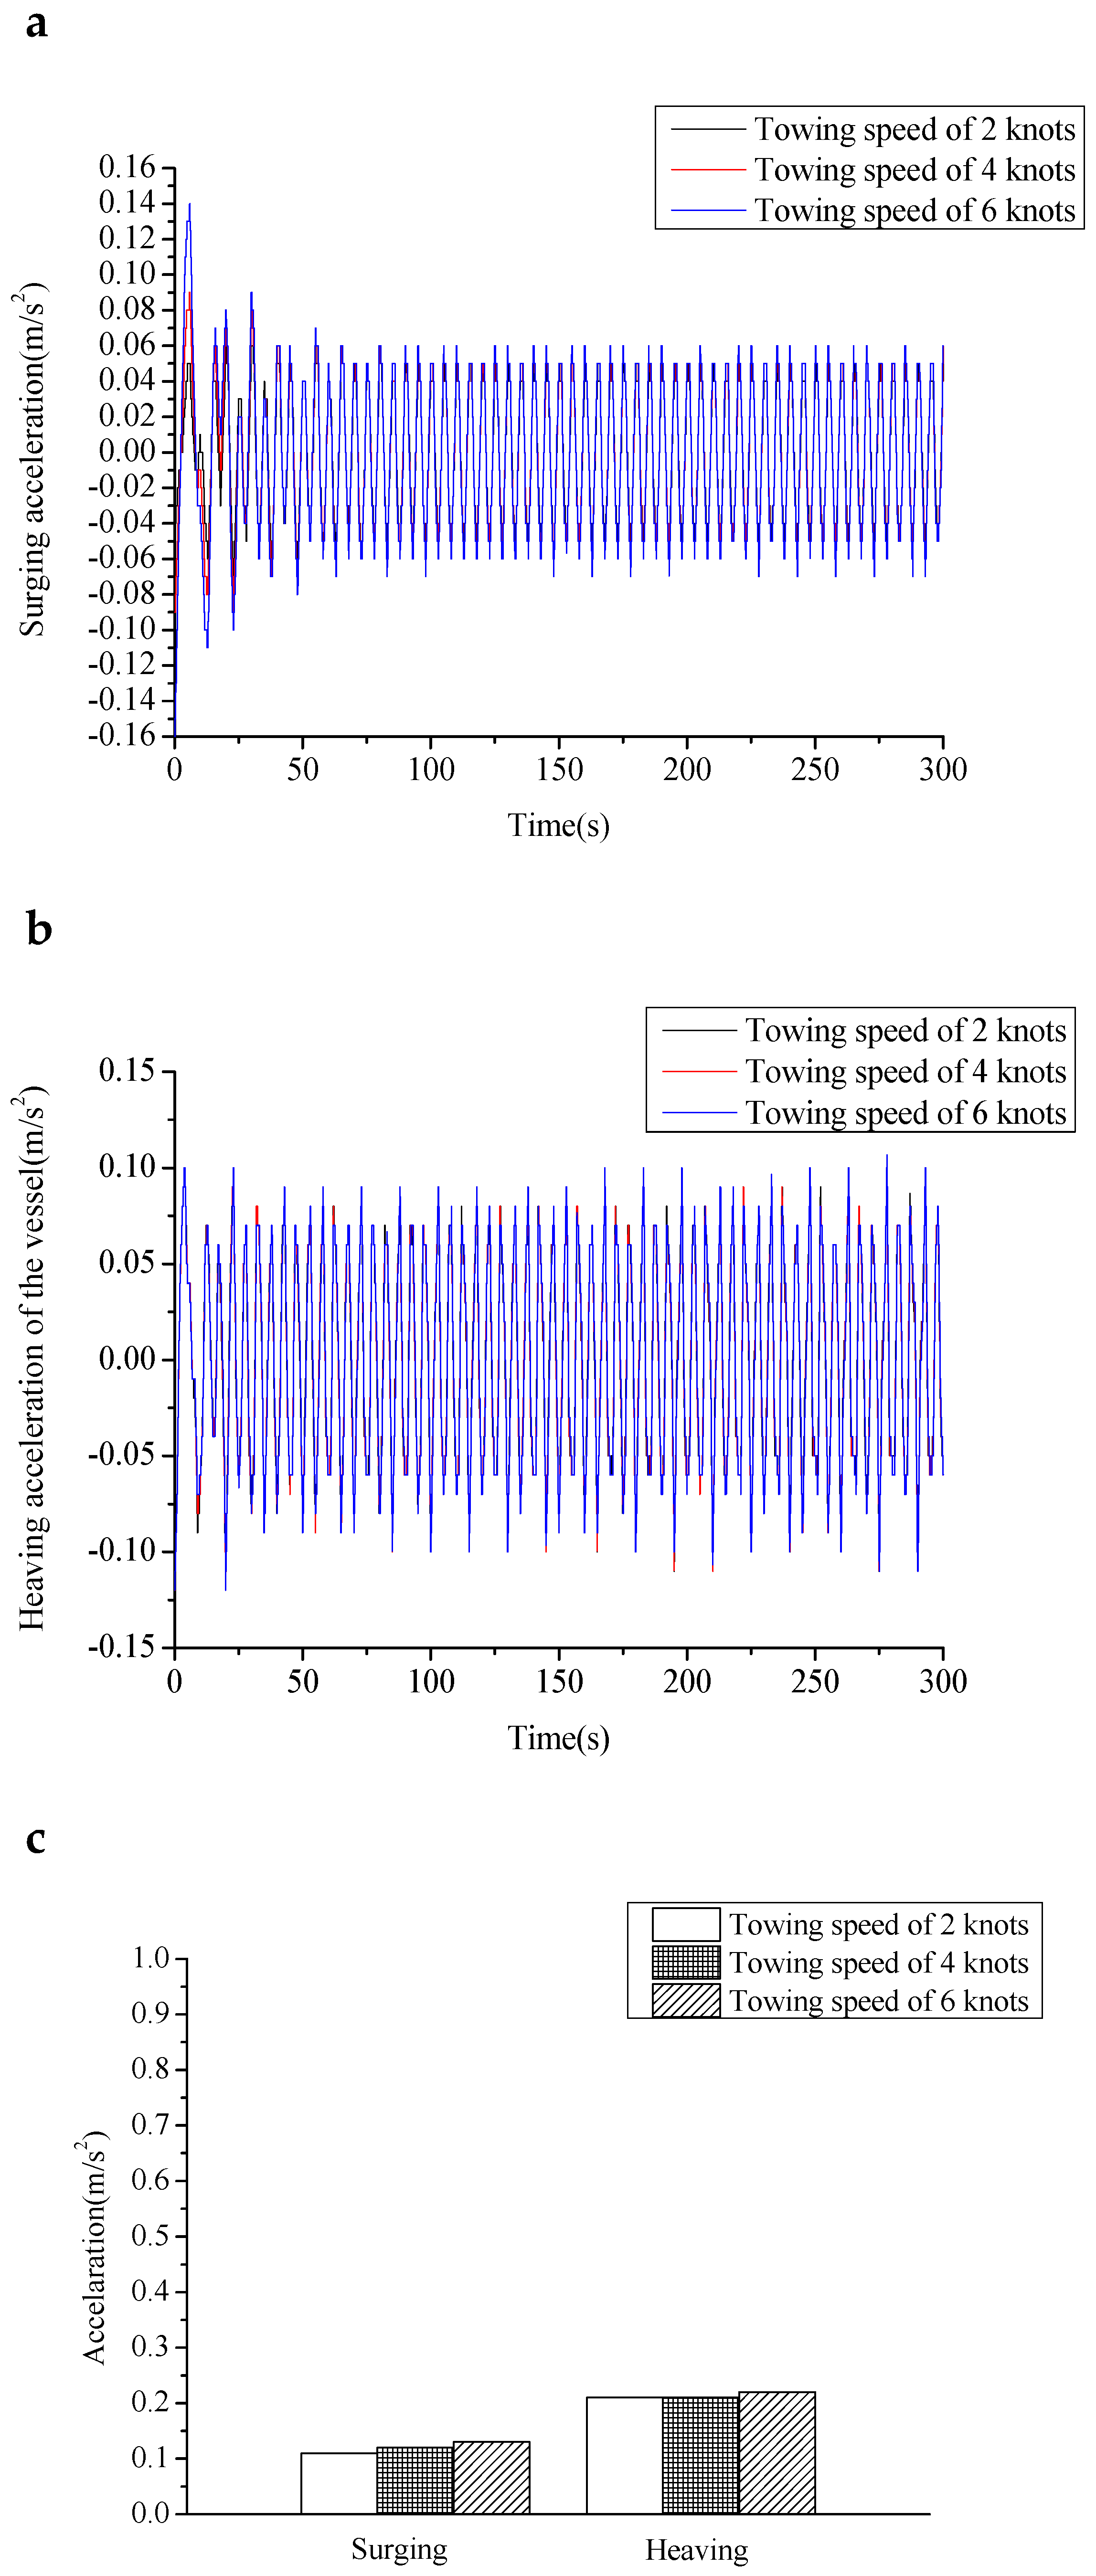
3.6. Comparative Analysis of Vessel Acceleration of Model Under Different Towing Speed Conditions
Comparative analyses of the surging and heaving acceleration of the one-step integrated transportation and installation vessel under different towing speed conditions are shown in
Figure 17.
The amplitude of the surging acceleration is 0.1 m/s2. The heaving acceleration oscillates around 0 and the amplitude is 0.2 m/s2. The speed of the vessel increases can hardly affect the amplitude of the surging acceleration and heaving acceleration. It can be seen from the above analysis that the towing speed only obviously affect the mean value of the towing cable force. The mean value of the towing cable increases in a square relationship with the towing speed of the vessel.
3.7. Wave Height Effect
The wind turbine unit is towed in shallow sea. The presence of waves is a very important environmental condition during the towing process. Height is one of the main properties of waves, which greatly affects their environmental conditions. The effect of wave height on the floating process is analyzed. During the process of towing a wind turbine unit, the wave conditions are not regular waves. In order to study the towing of the CBF under waves, it is also necessary to consider the irregularity of ocean waves [
24]. According to irregular wave theory, an irregular wave surface can be seen as a superposition of many regular wave units, which have different amplitudes, propagation directions, frequencies, and phases, and all conform to the theory of micro-amplitude.
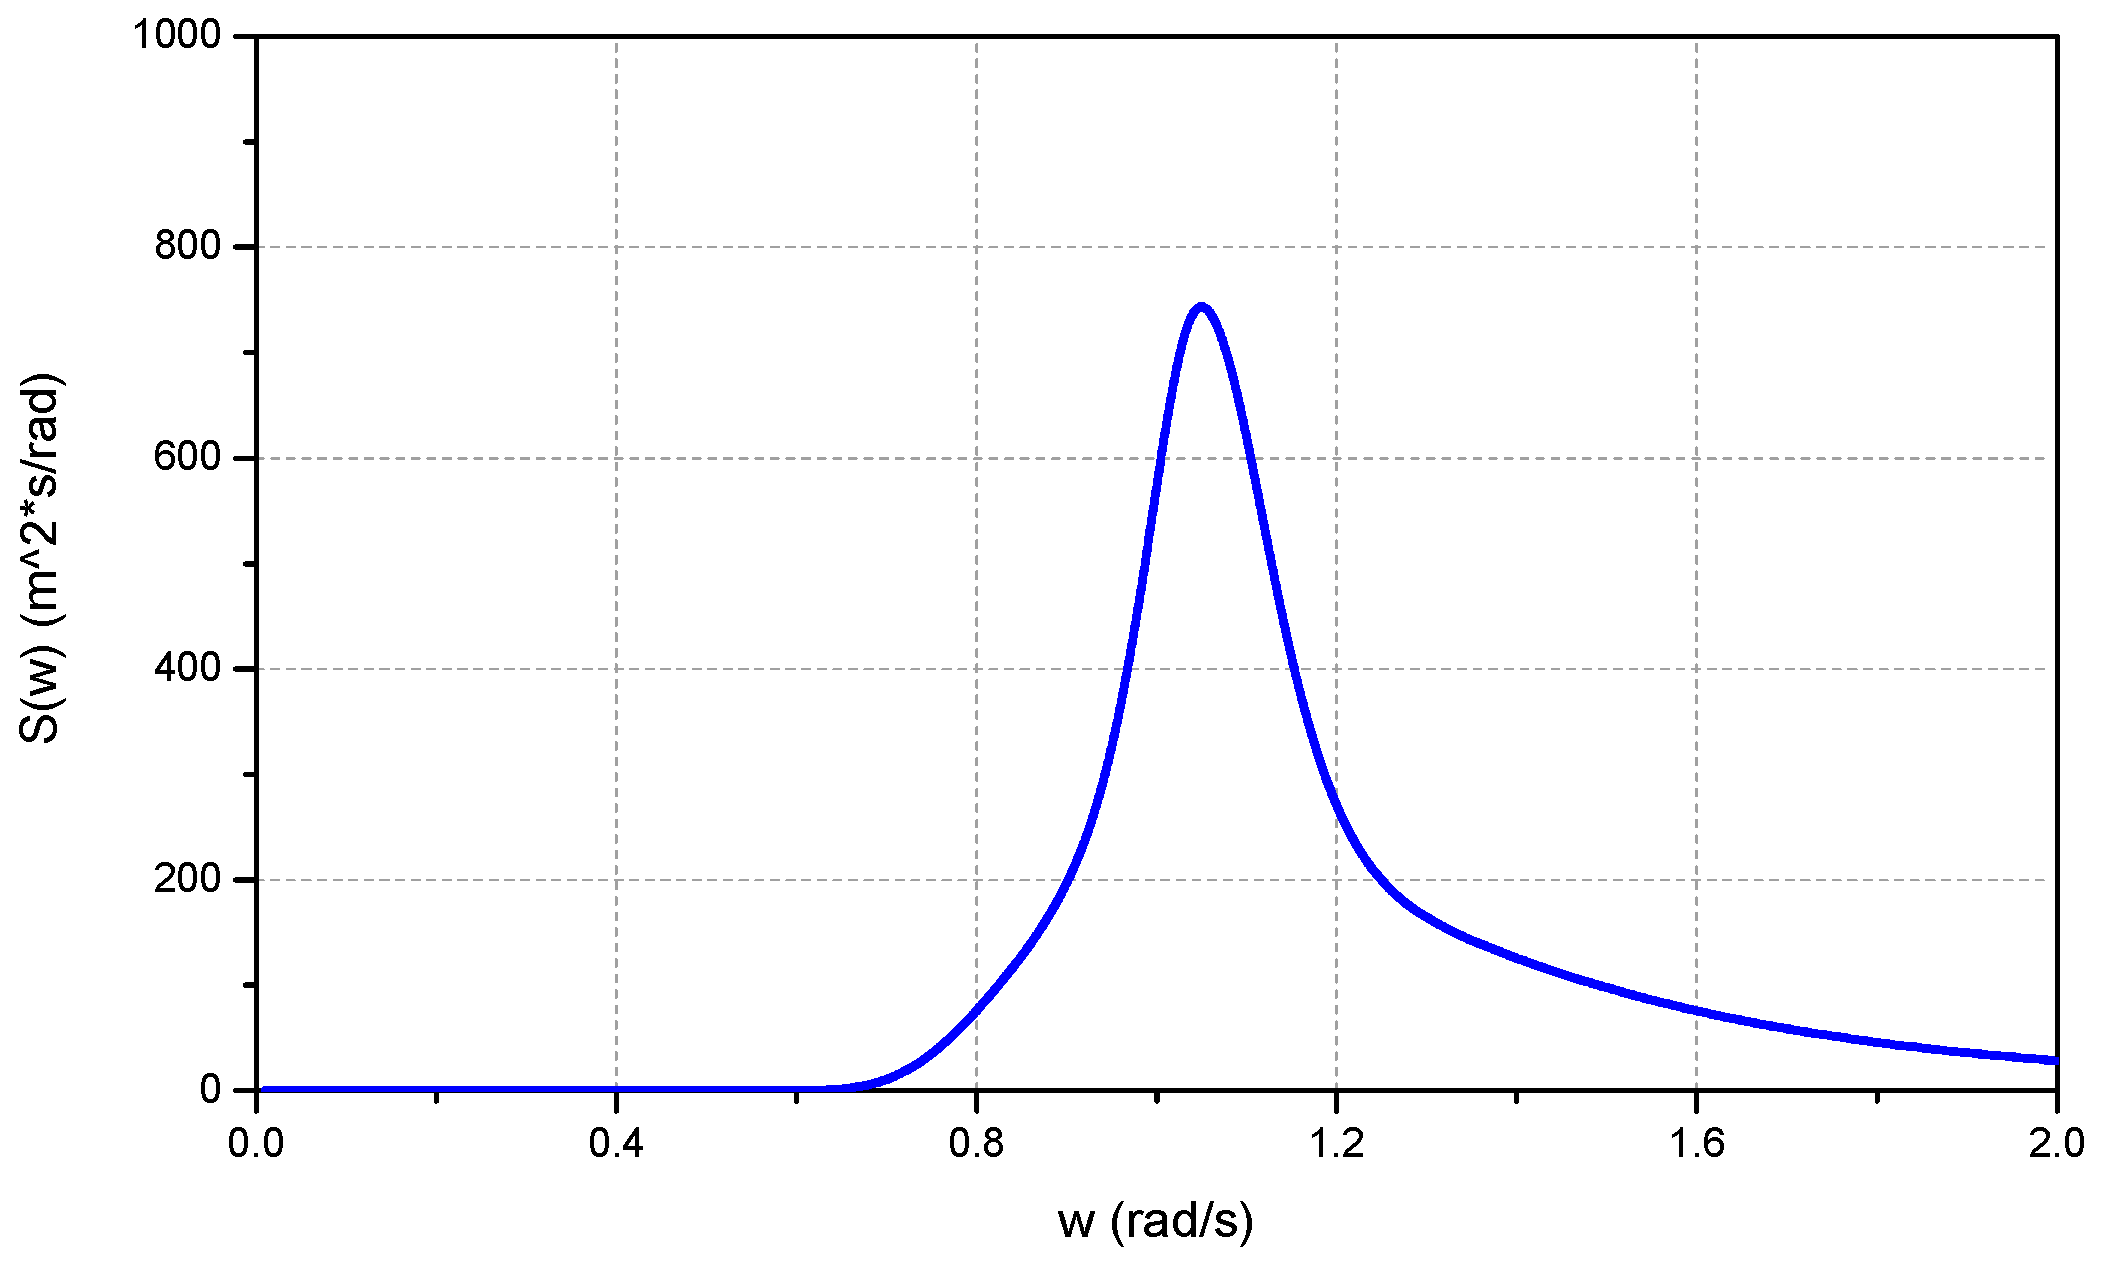
The Joint North Sea Wave Project (JONSWAP) spectrum [
25,
26] is based on the most systematic observation data obtained by British, Dutch, American, and German scientists jointly studying North Sea waves in 1968 and 1969. The application range of this spectral waves is wide because it is suitable for wind and waves at different stages of growth. The irregular waves selected in this section (see
Figure 18) are all JONSWAP spectral waves, and the spectral peak factor of 3.3 is selected.
In order to analyze the influence of wave height on wind turbine floating, for regular waves, three wave heights of 1 m, 2 m, and 3 m are selected to analyze the wind turbine transport model in the time domain. For random waves, three significant wave heights of 1 m, 2 m, and 3 m are selected to analyze the wind power transport model in the time domain. Other conditions for the given operating conditions are as follows: speed 4 knots, period 5 s, draft 6 m, 0° wave direction. The time domain analysis of the wind power transport model under three wave heights was carried out by Moses, and a comparative analysis of towing cable force, spring resultant force, and surging and heaving acceleration under various working conditions was obtained. The conditions are shown in
Table 4.
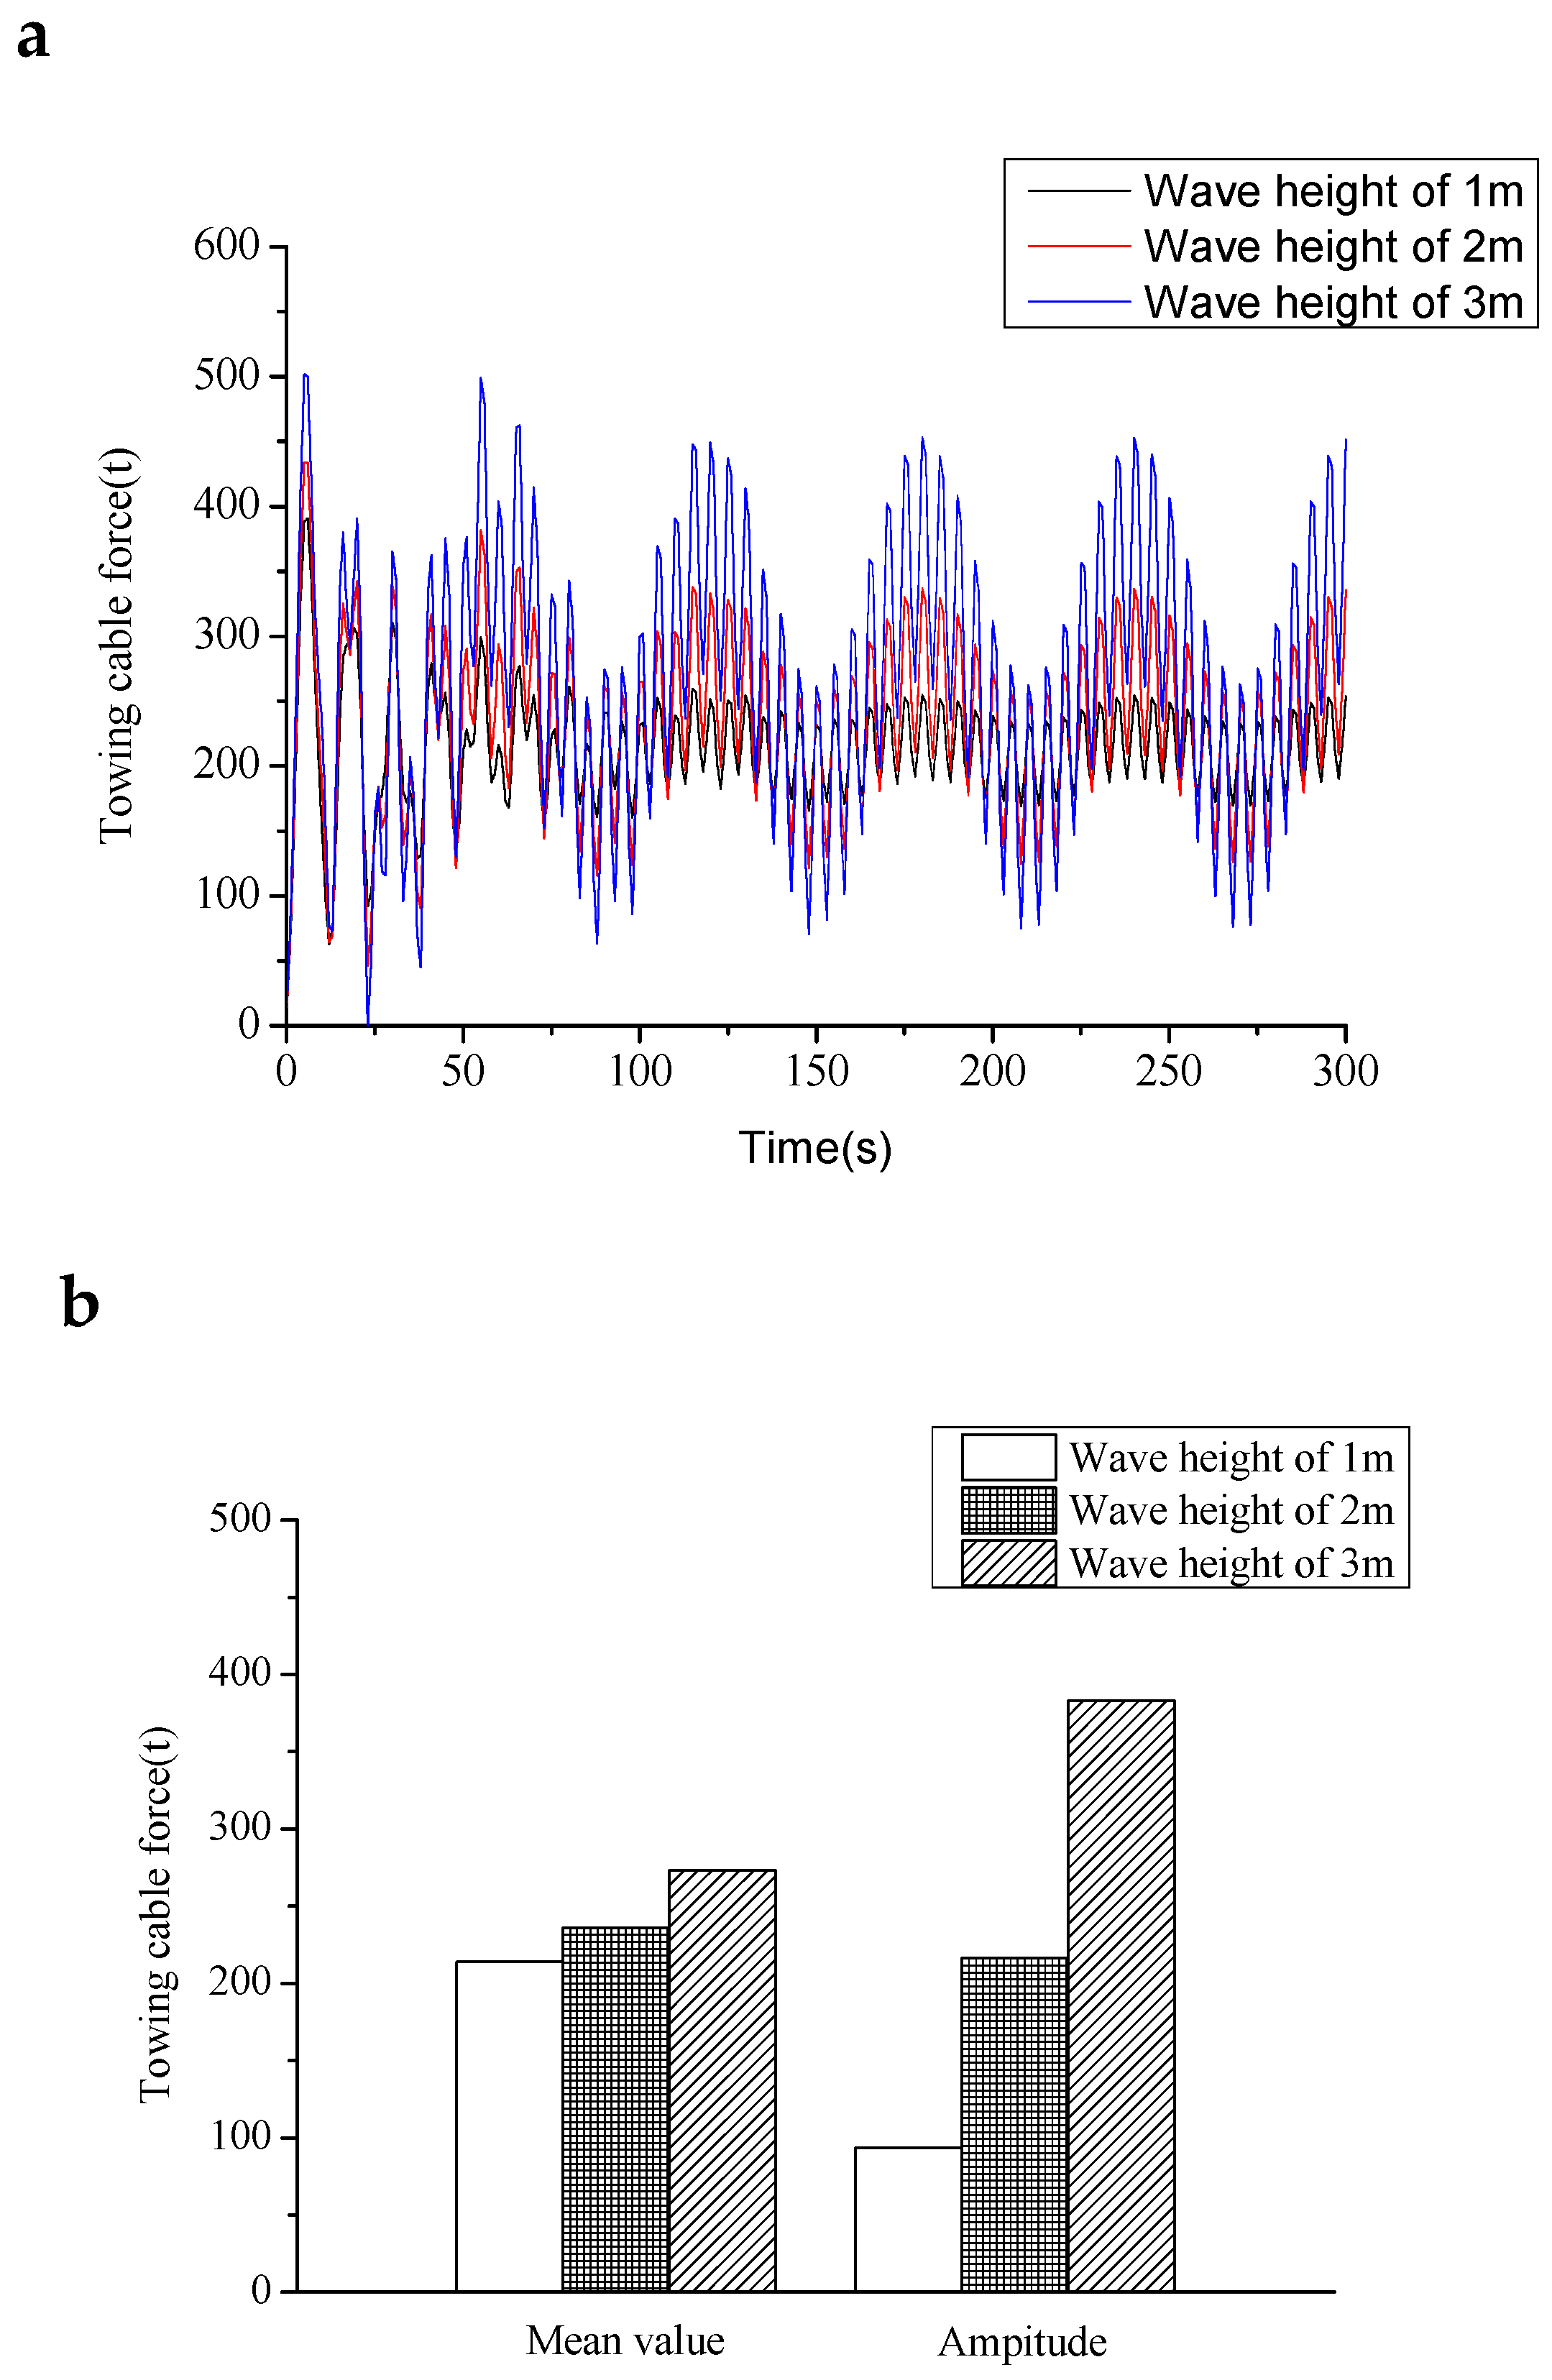
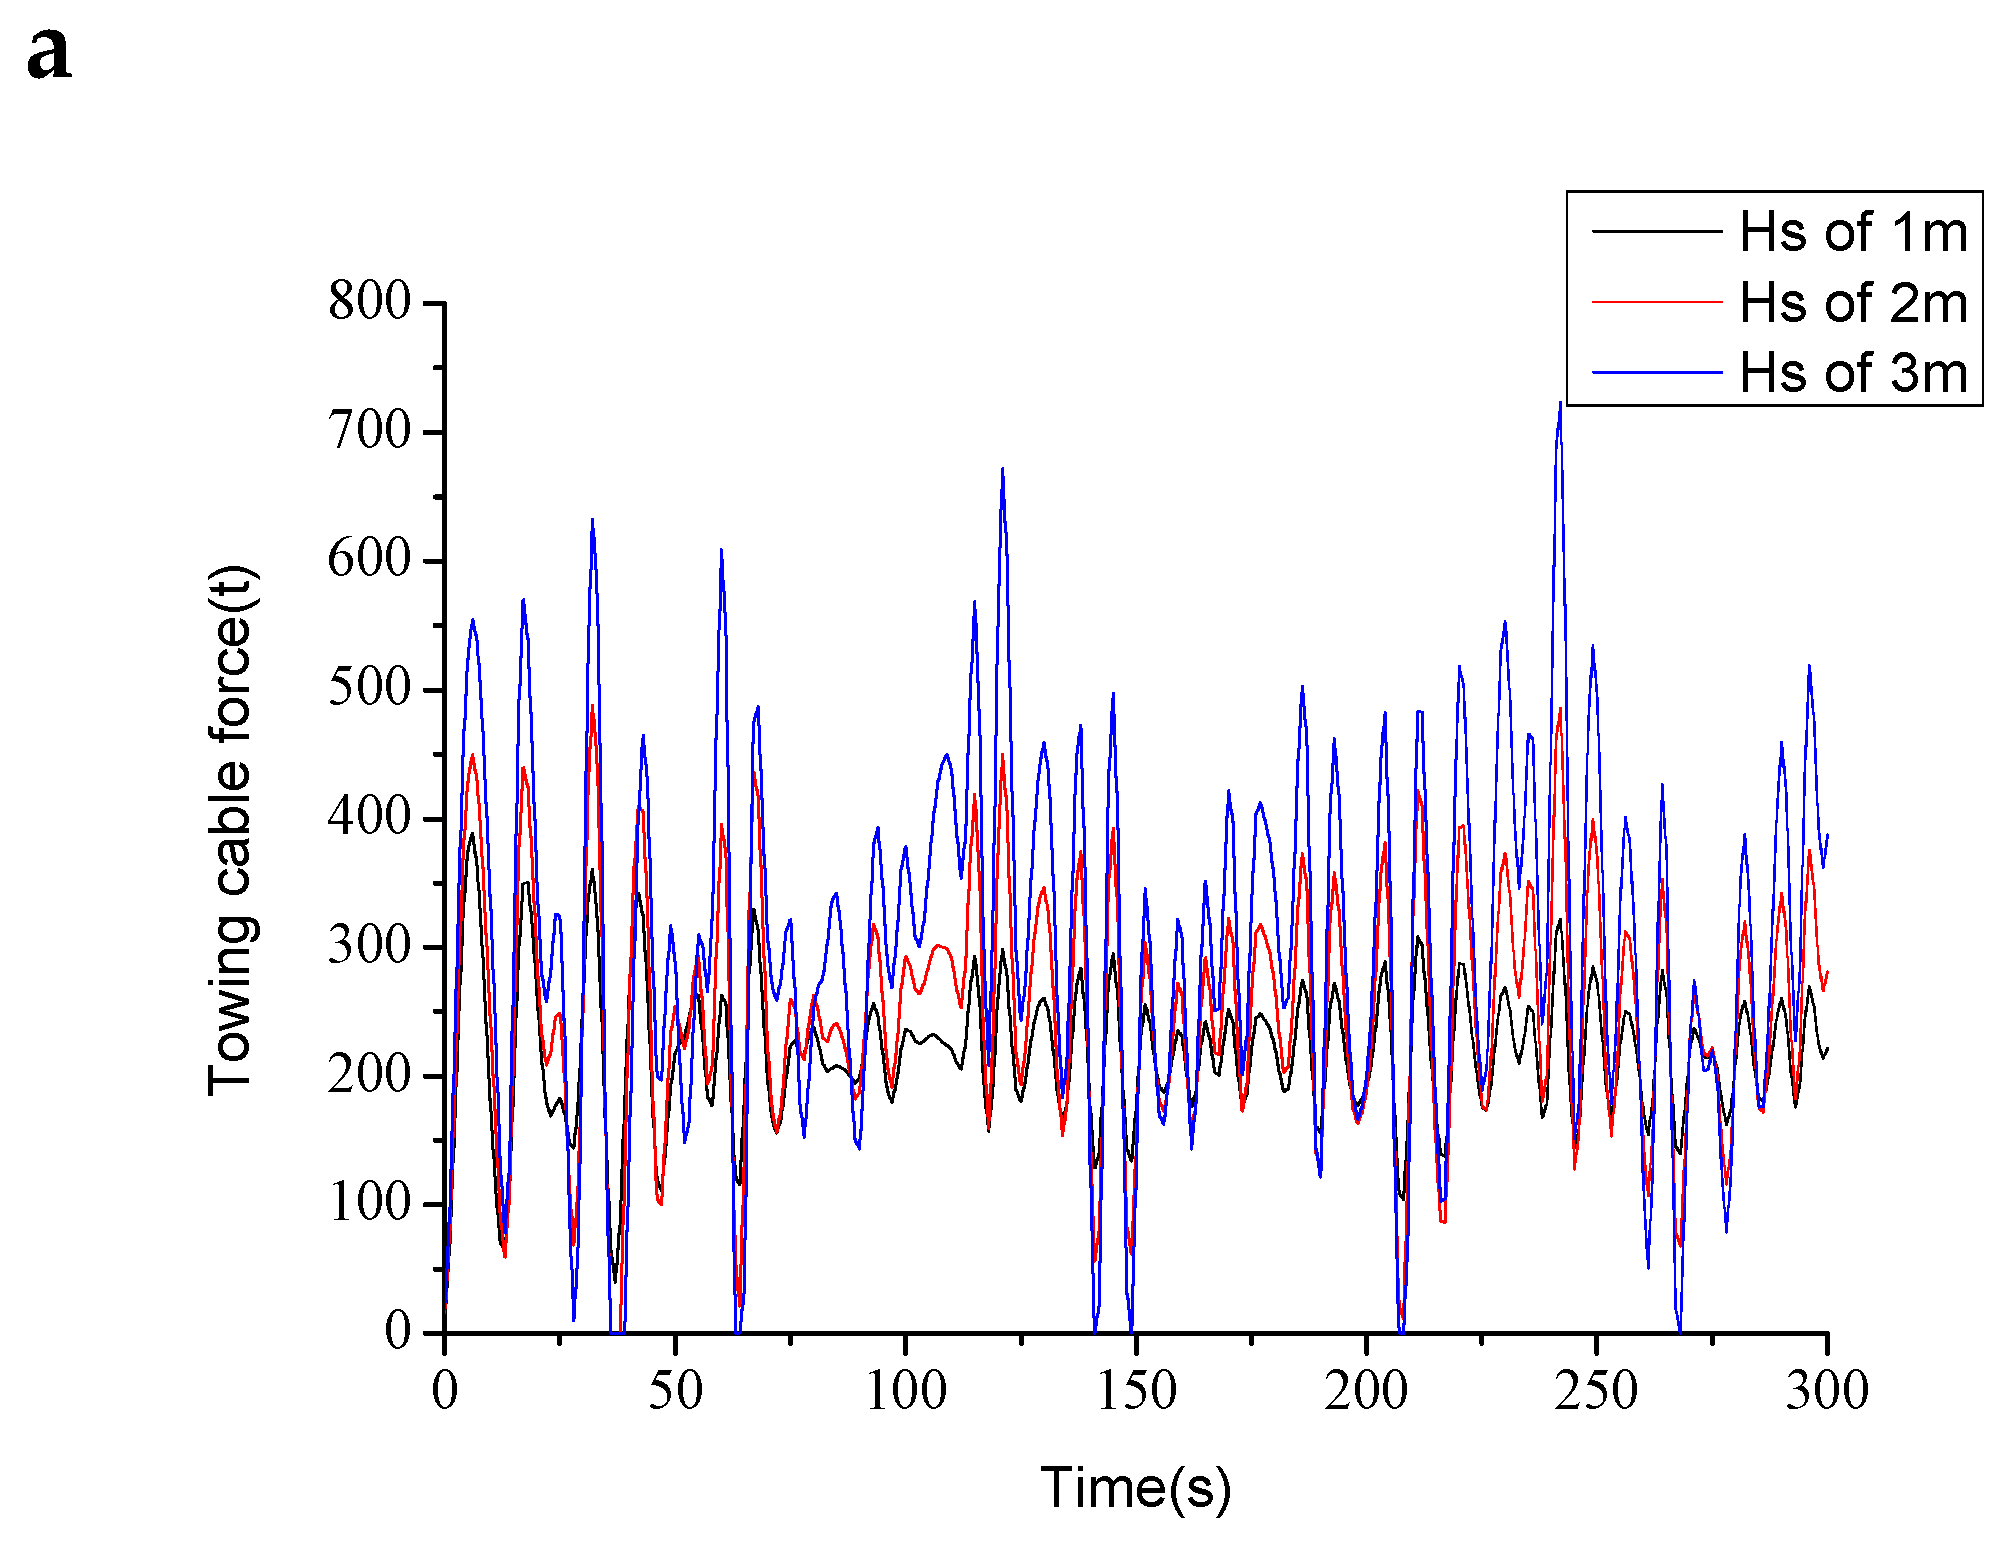
3.8. Comparative Analysis of Modeled Towing Cable Force and Spring Force Under Different Wave Height Conditions
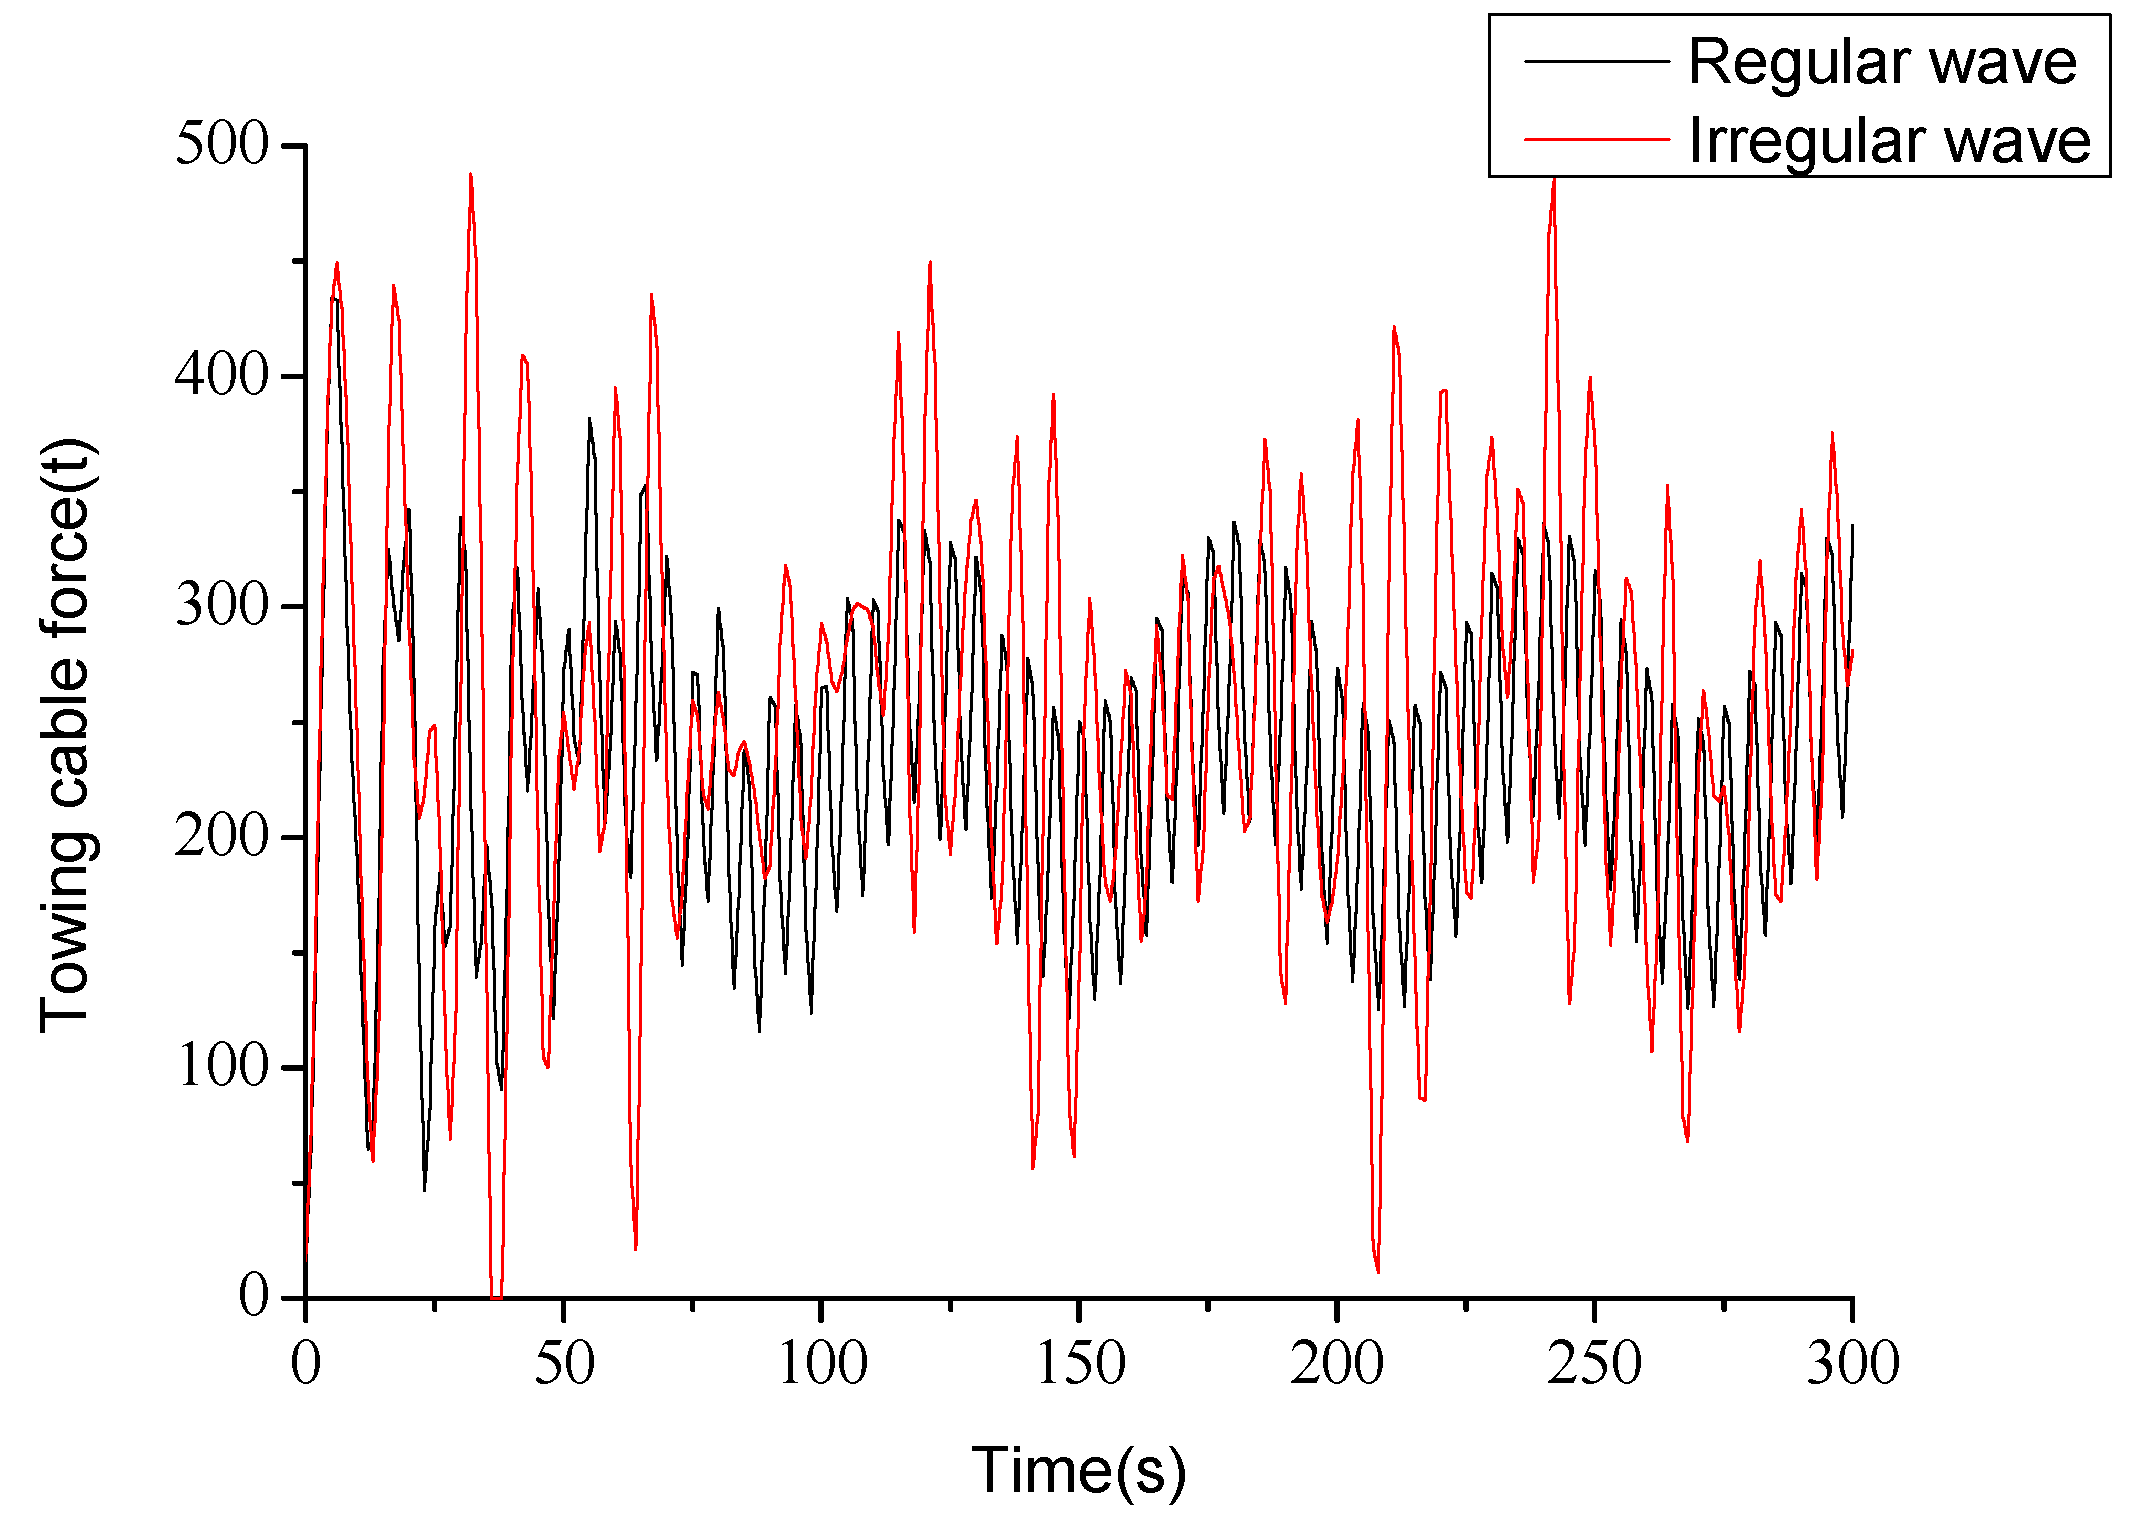
It can be seen that for regular and irregular waves, as the wave height increased, the mean value of the towing cable force increased slightly, while the amplitude of the towing cable force oscillation increased almost in multiples. For regular waves, the towing cable force increased from 130 t at 1 m wave height to 400 t at 3 m wave height, and for irregular waves from 250 t at 1 m wave height to 700 t at 3 m wave height, an increase of 200%. The towing cable force oscillated more irregularly with irregular waves at the same height. The mean value was almost constant and the amplitude of the oscillation was significantly larger.
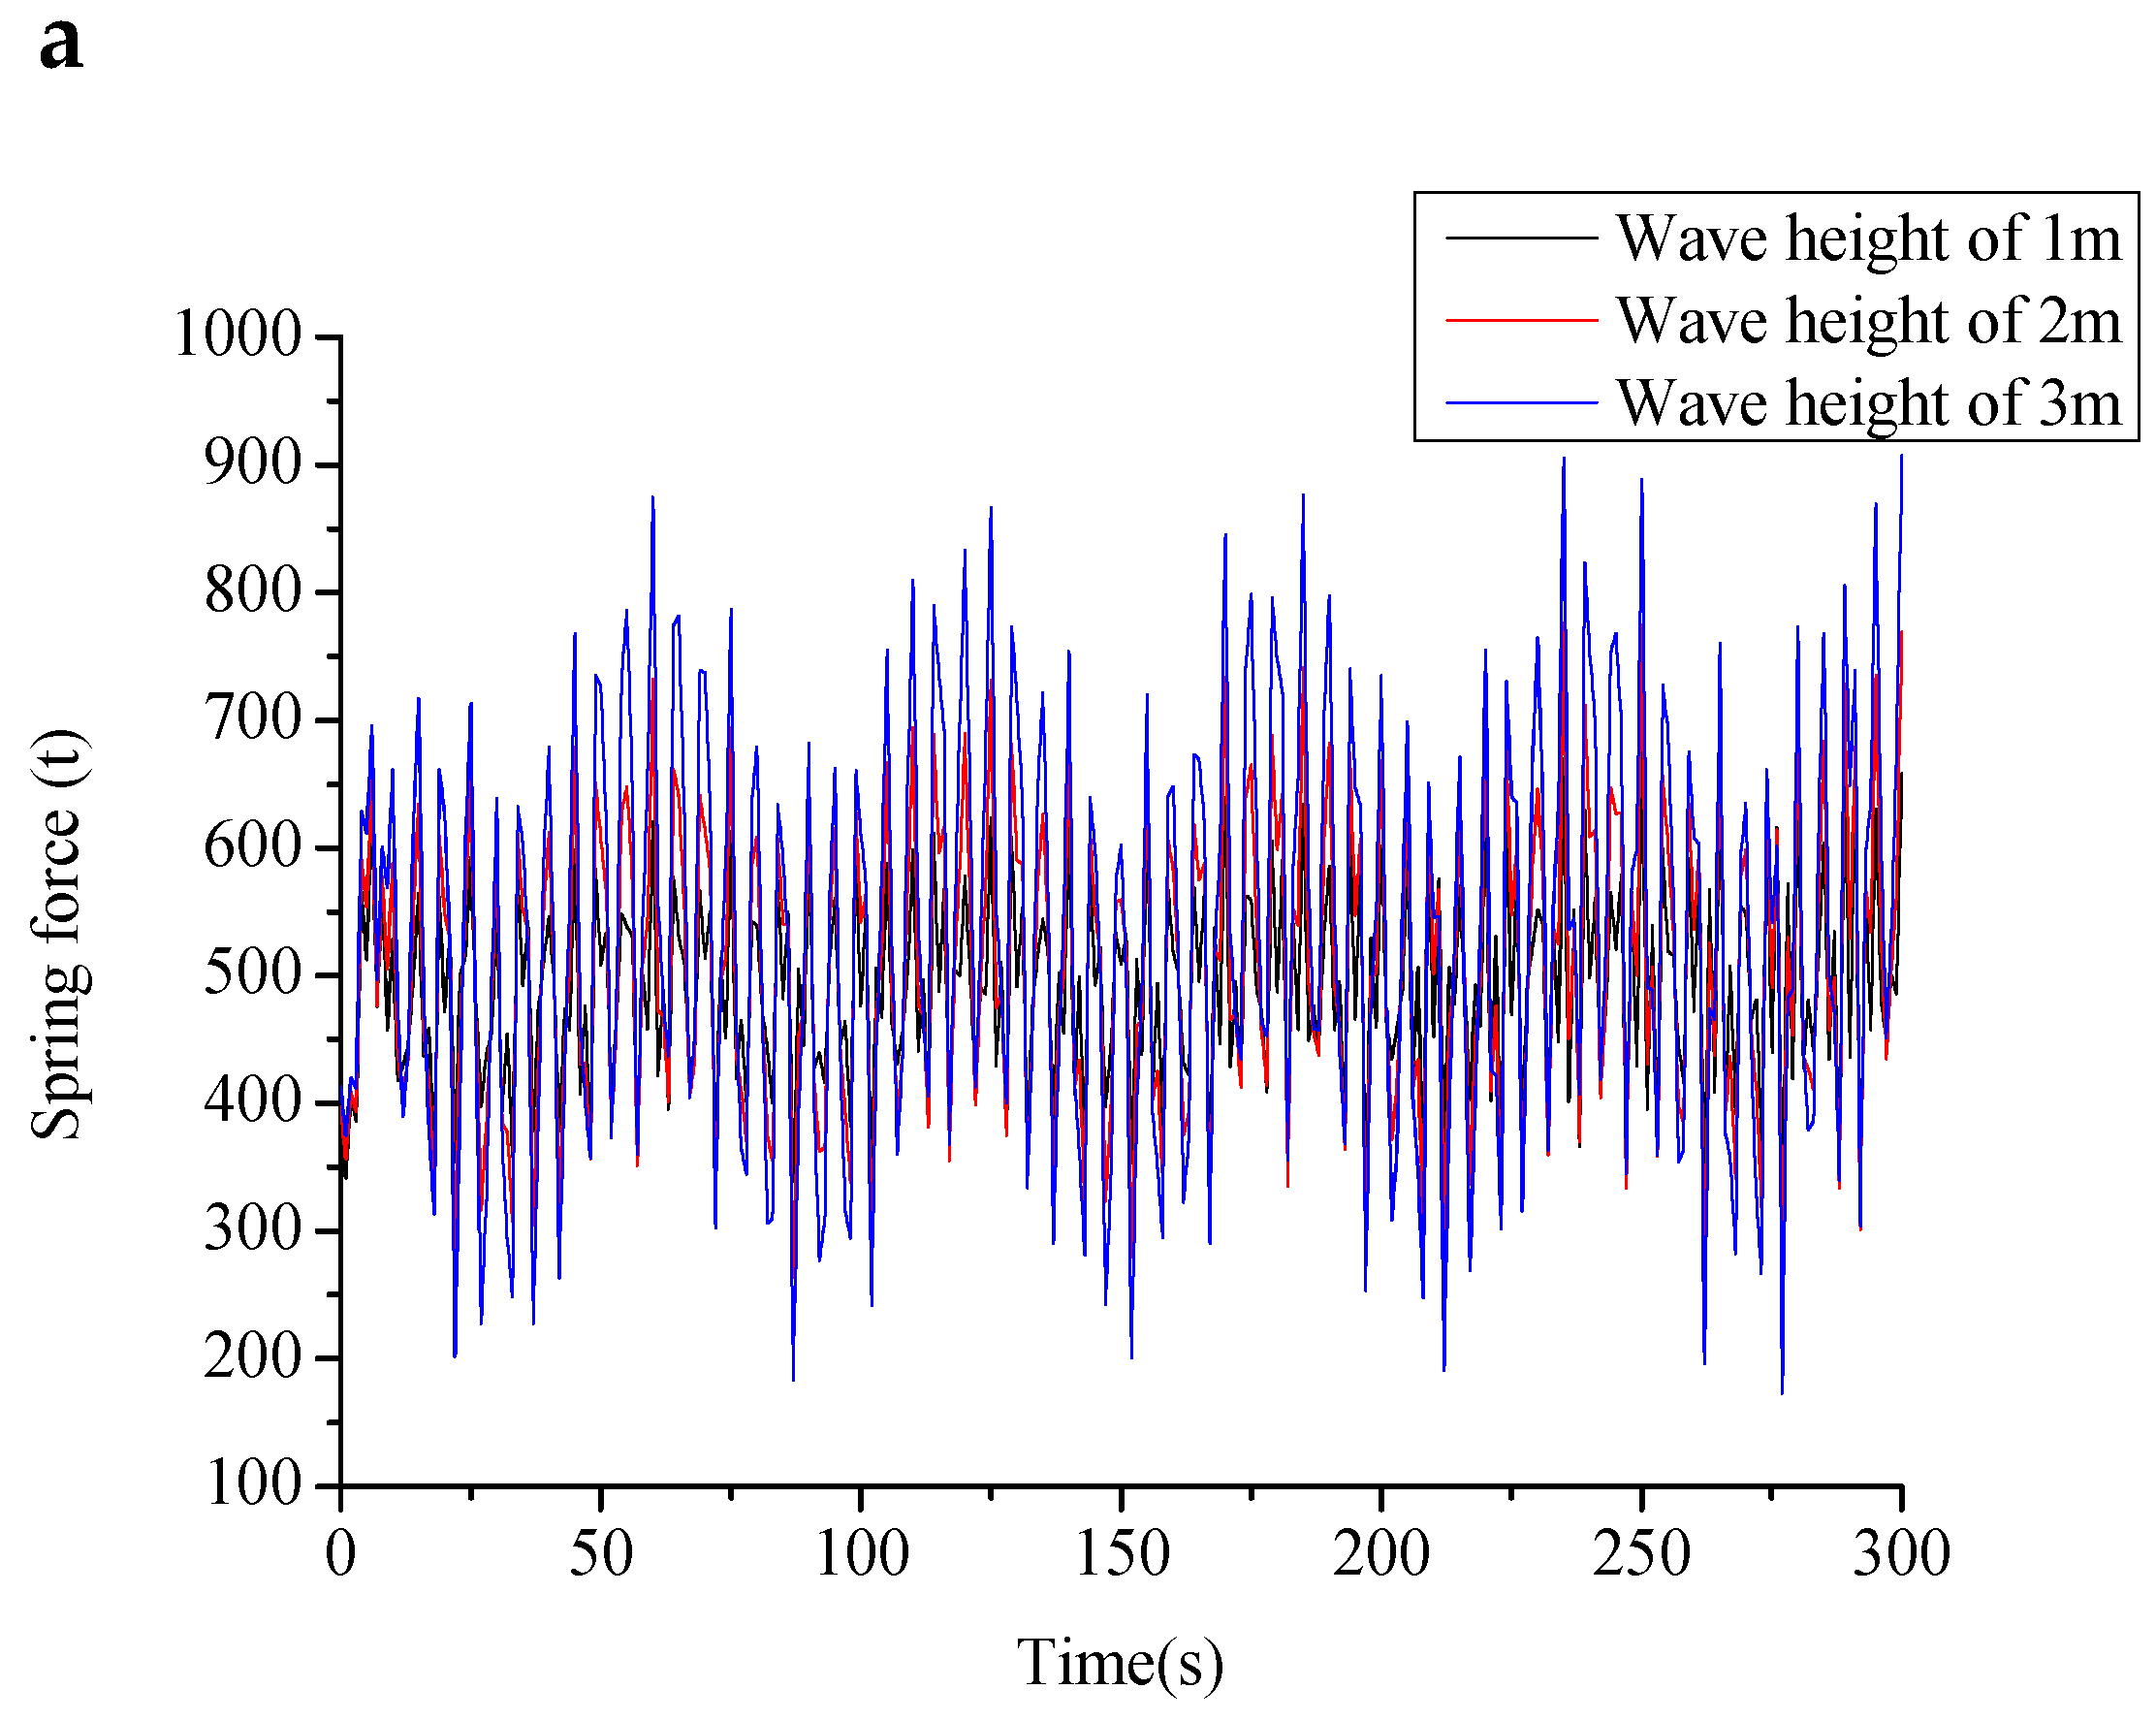
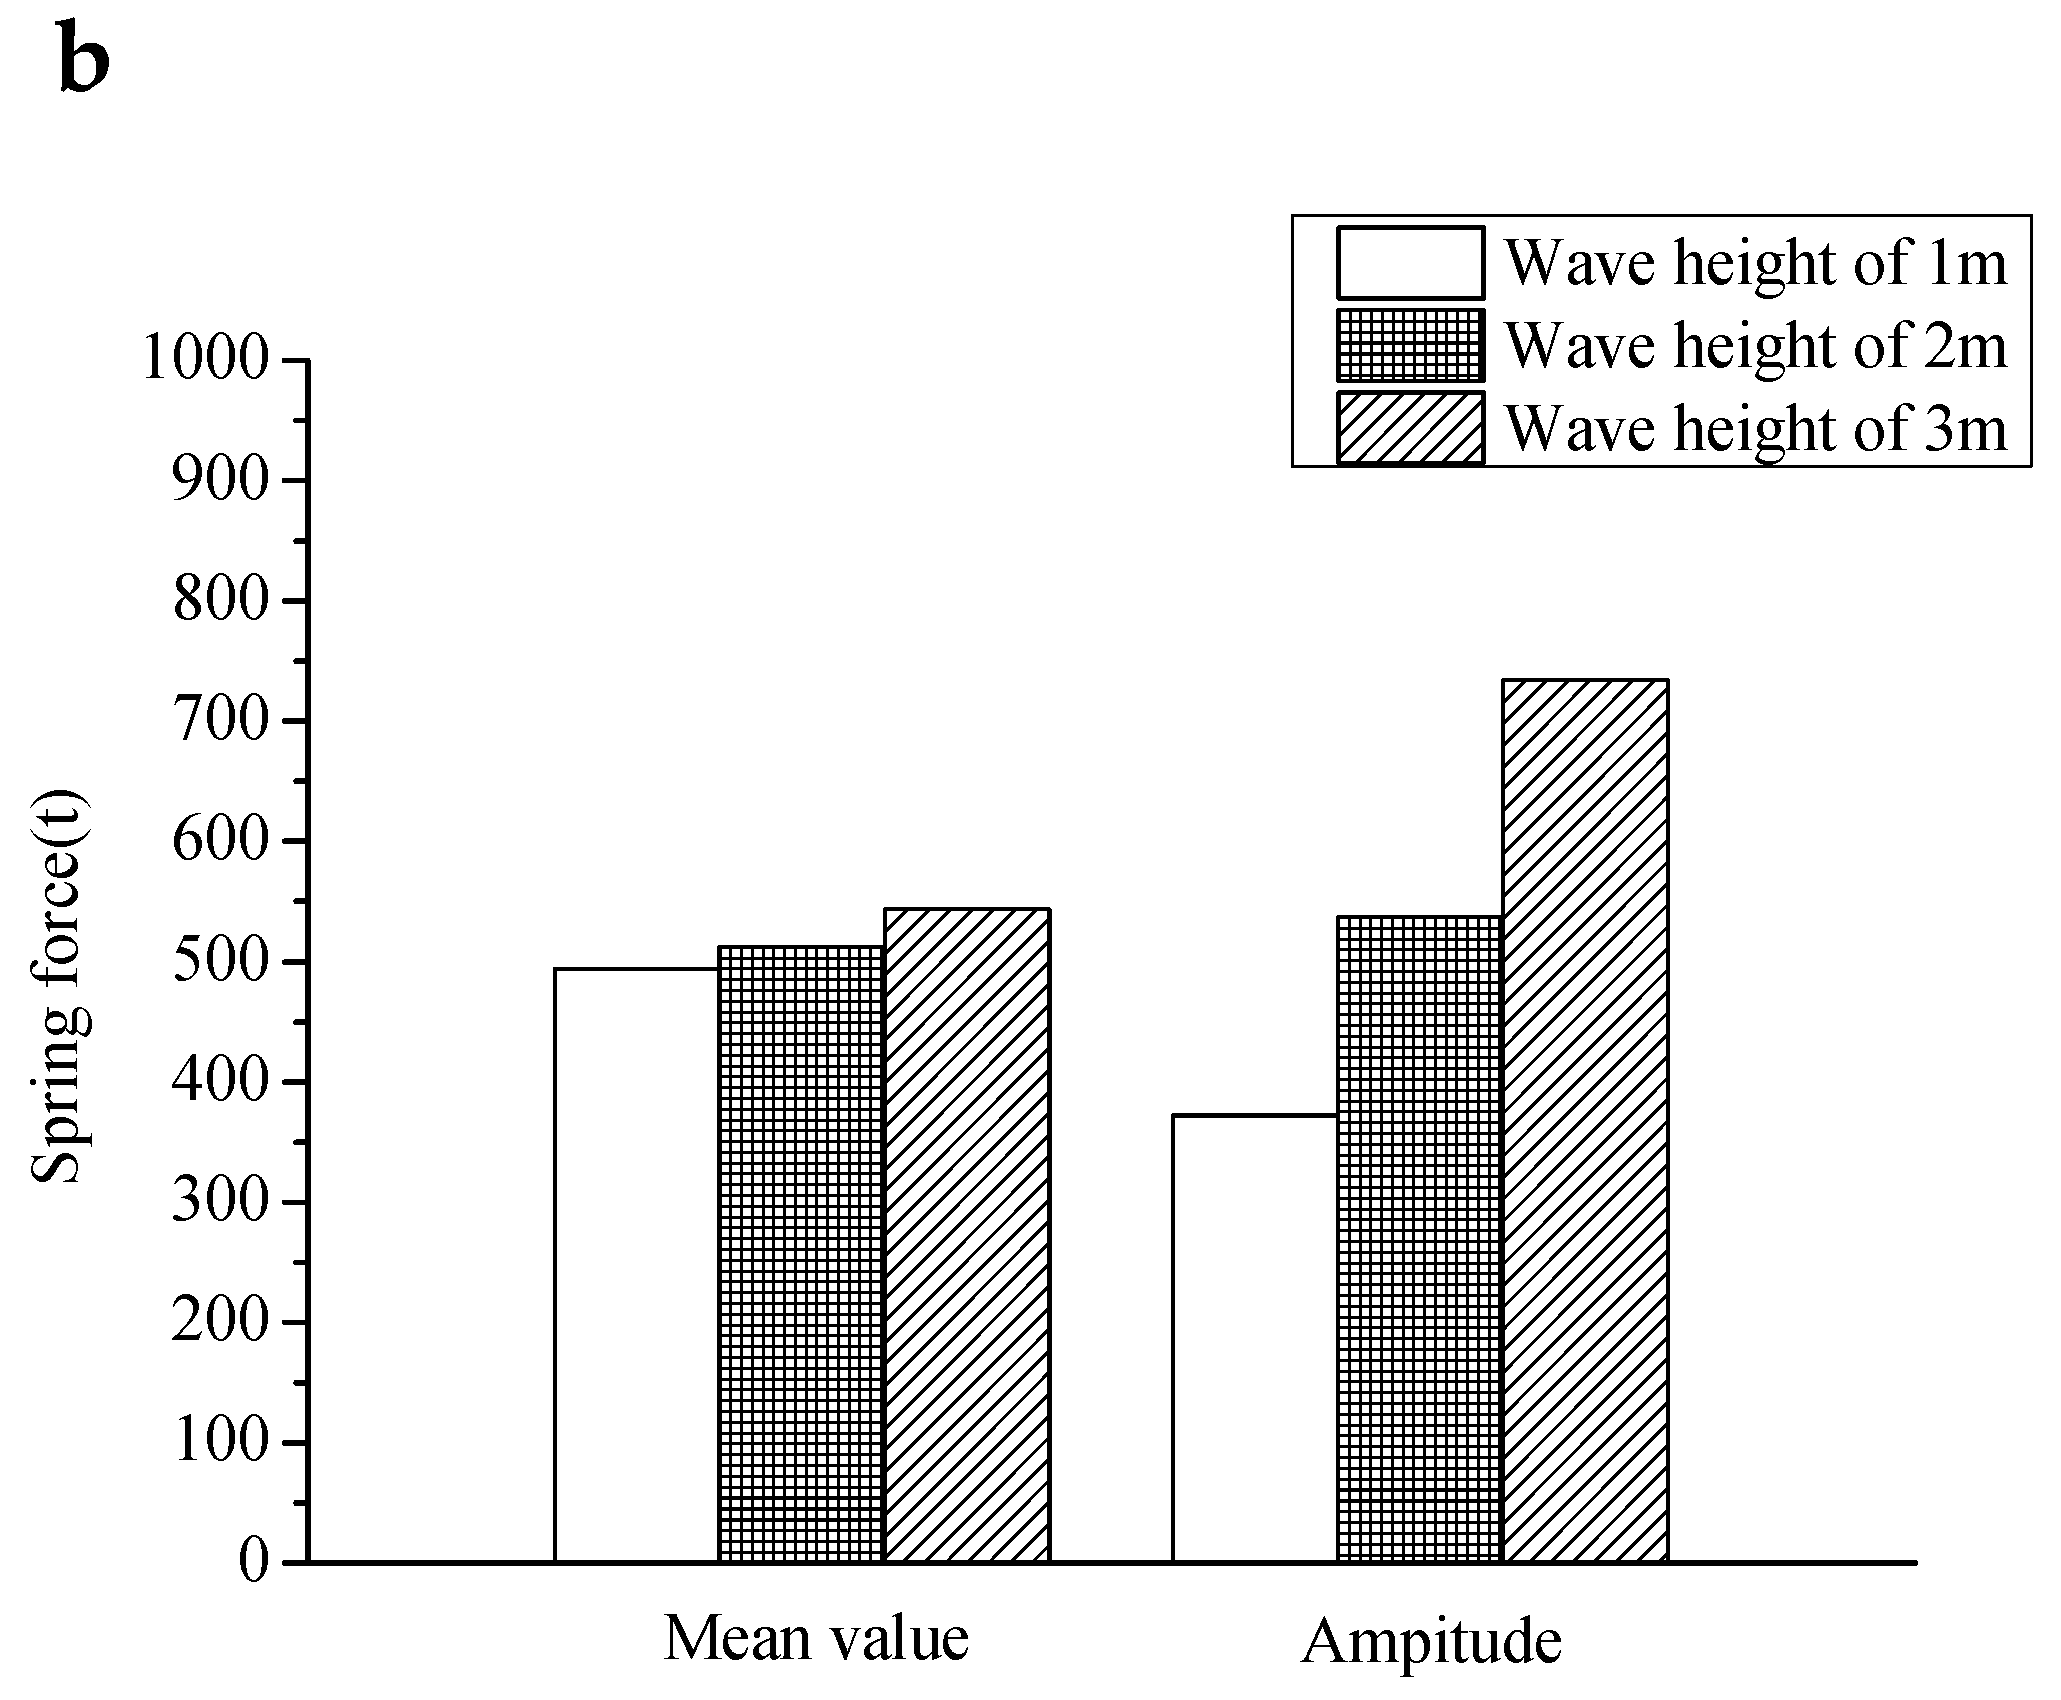
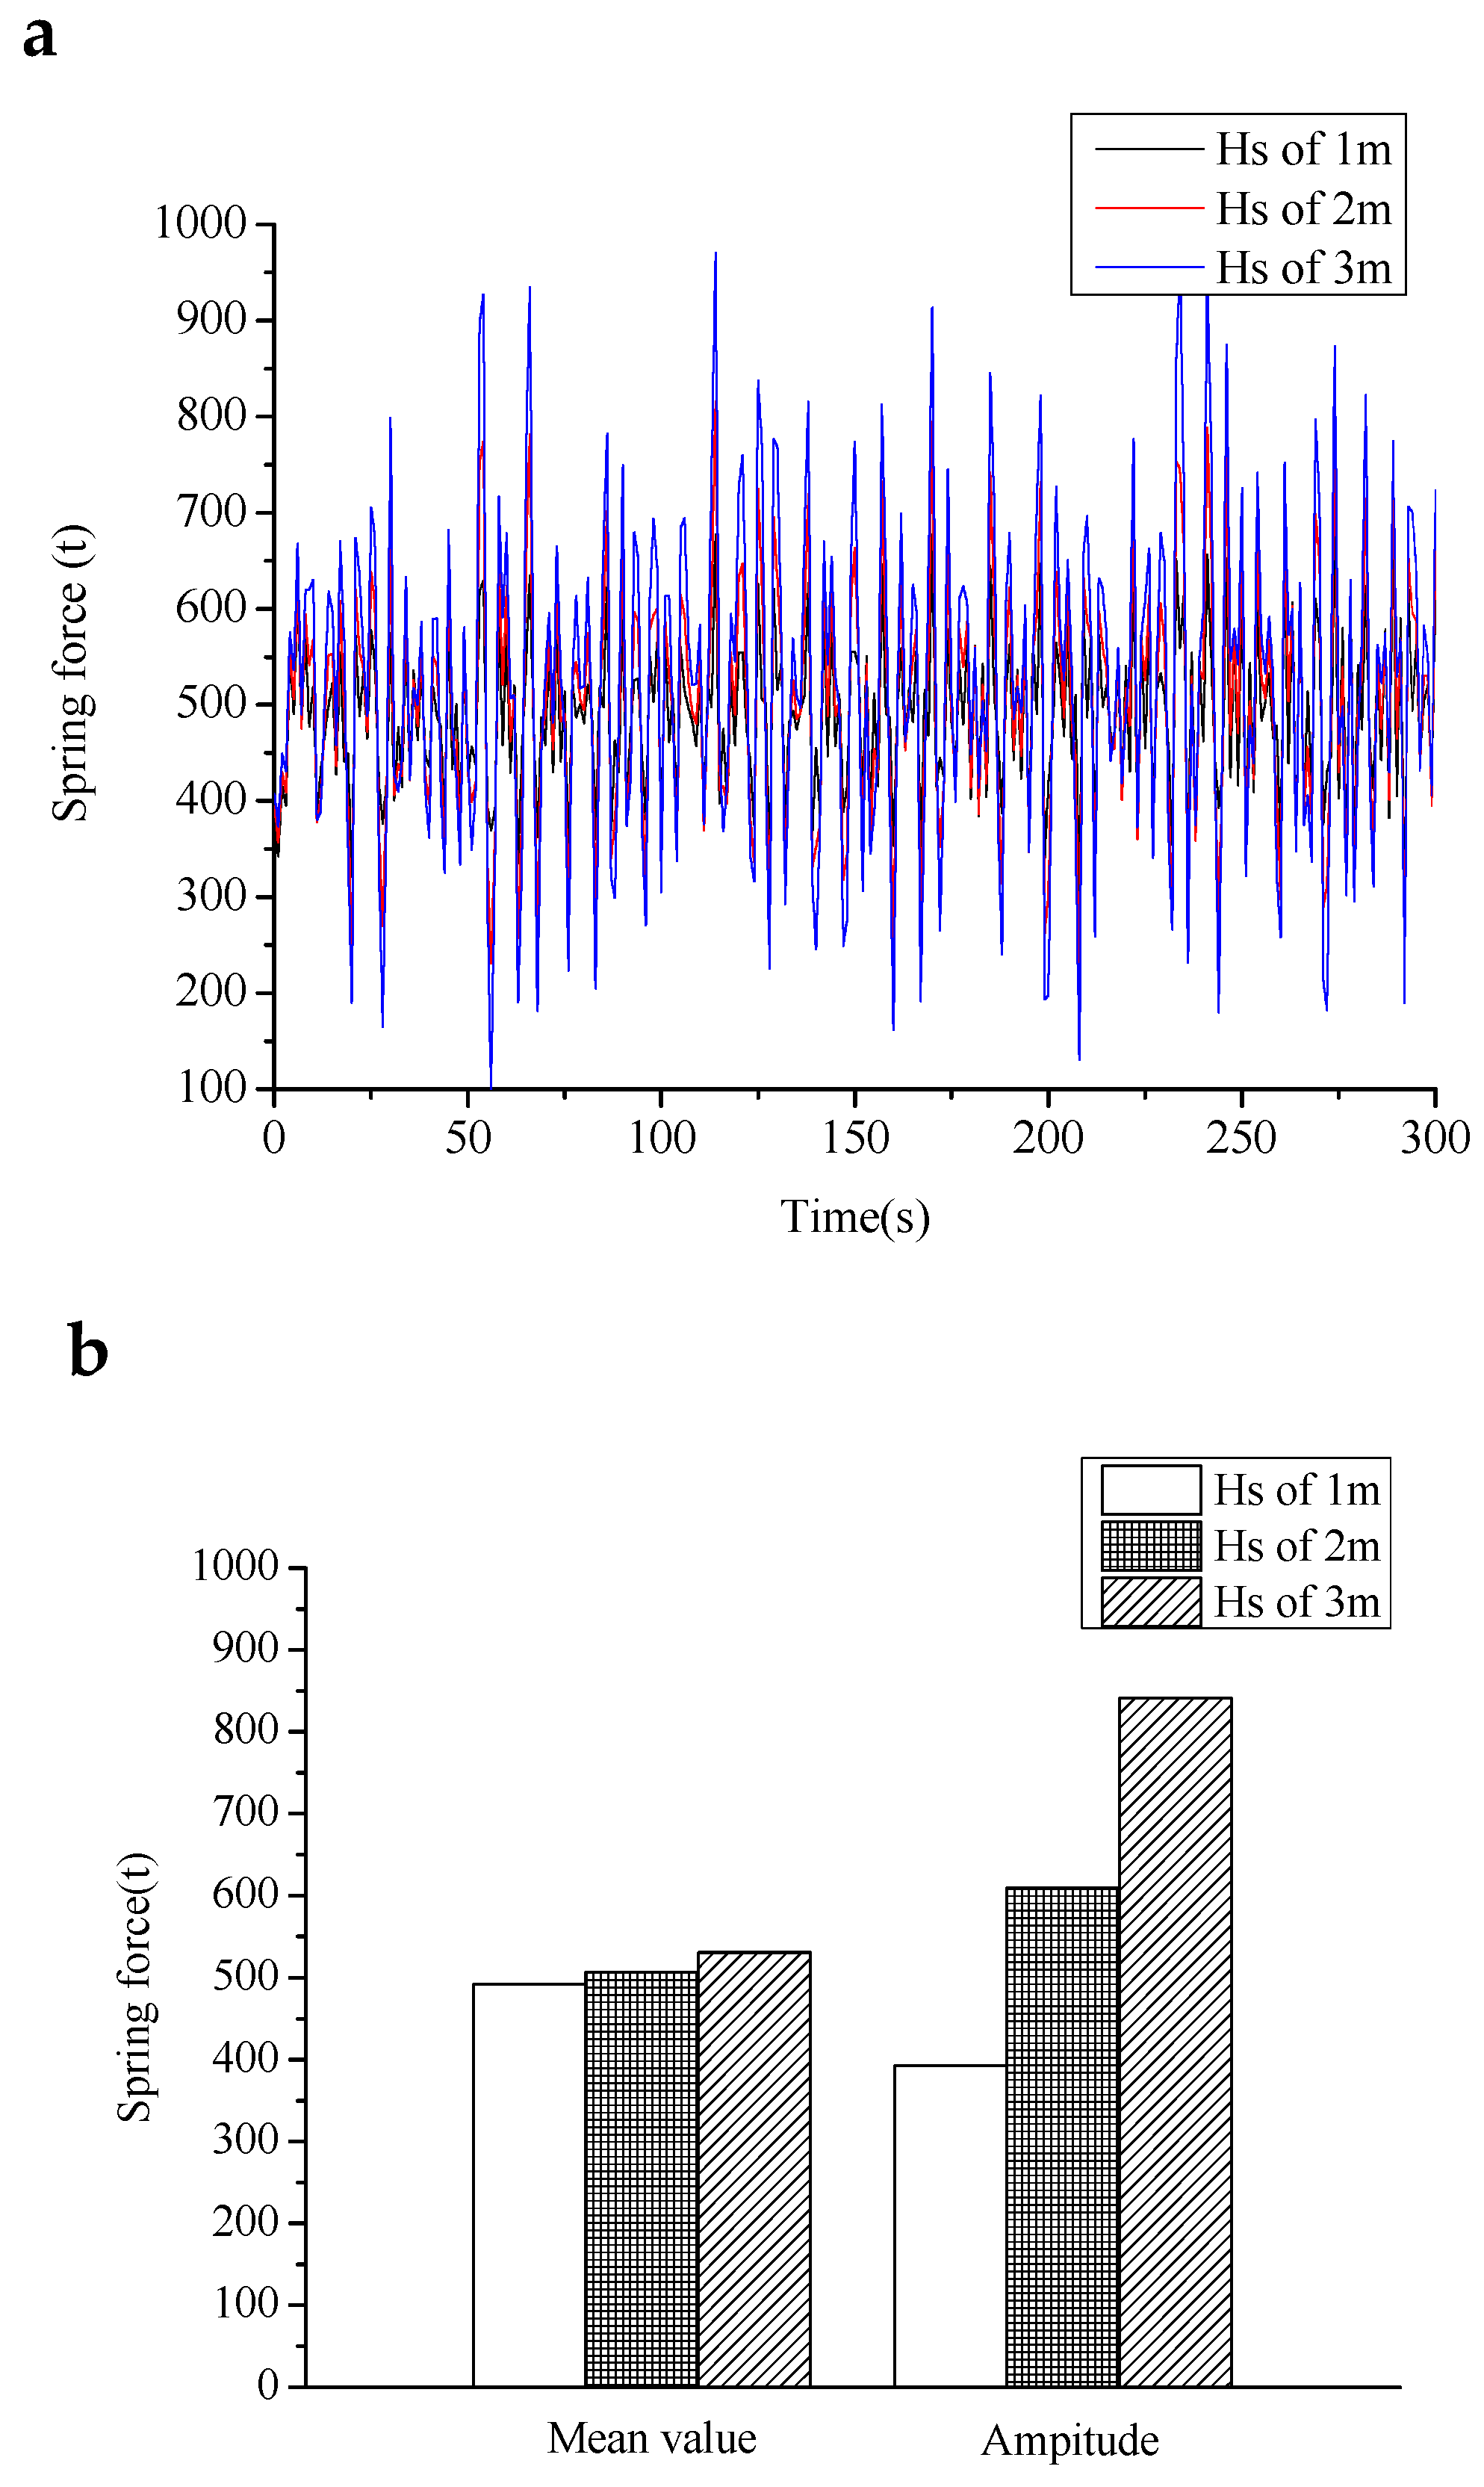
As the height of the wave increased, for both regular and irregular waves, the mean value of the spring force was almost constant and oscillated around 500 t. For regular waves, the amplitude of the spring force oscillation increased almost in multiples, increasing from 200 t at 1 m wave height to 400 t at 3 m wave height. For irregular waves, the amplitude of the spring force oscillation increased almost in multiples, increasing from 260 t at 1 m wave height to 800 t at 3 m wave height. The spring force was more irregular under irregular waves at the same height. The mean value was almost constant and the amplitude of the oscillation was significantly larger. Under those three working conditions, the wind turbine unit and the one-step integrated transportation and installation vessel were not separated in the time domain, ensuring integrated transportation.
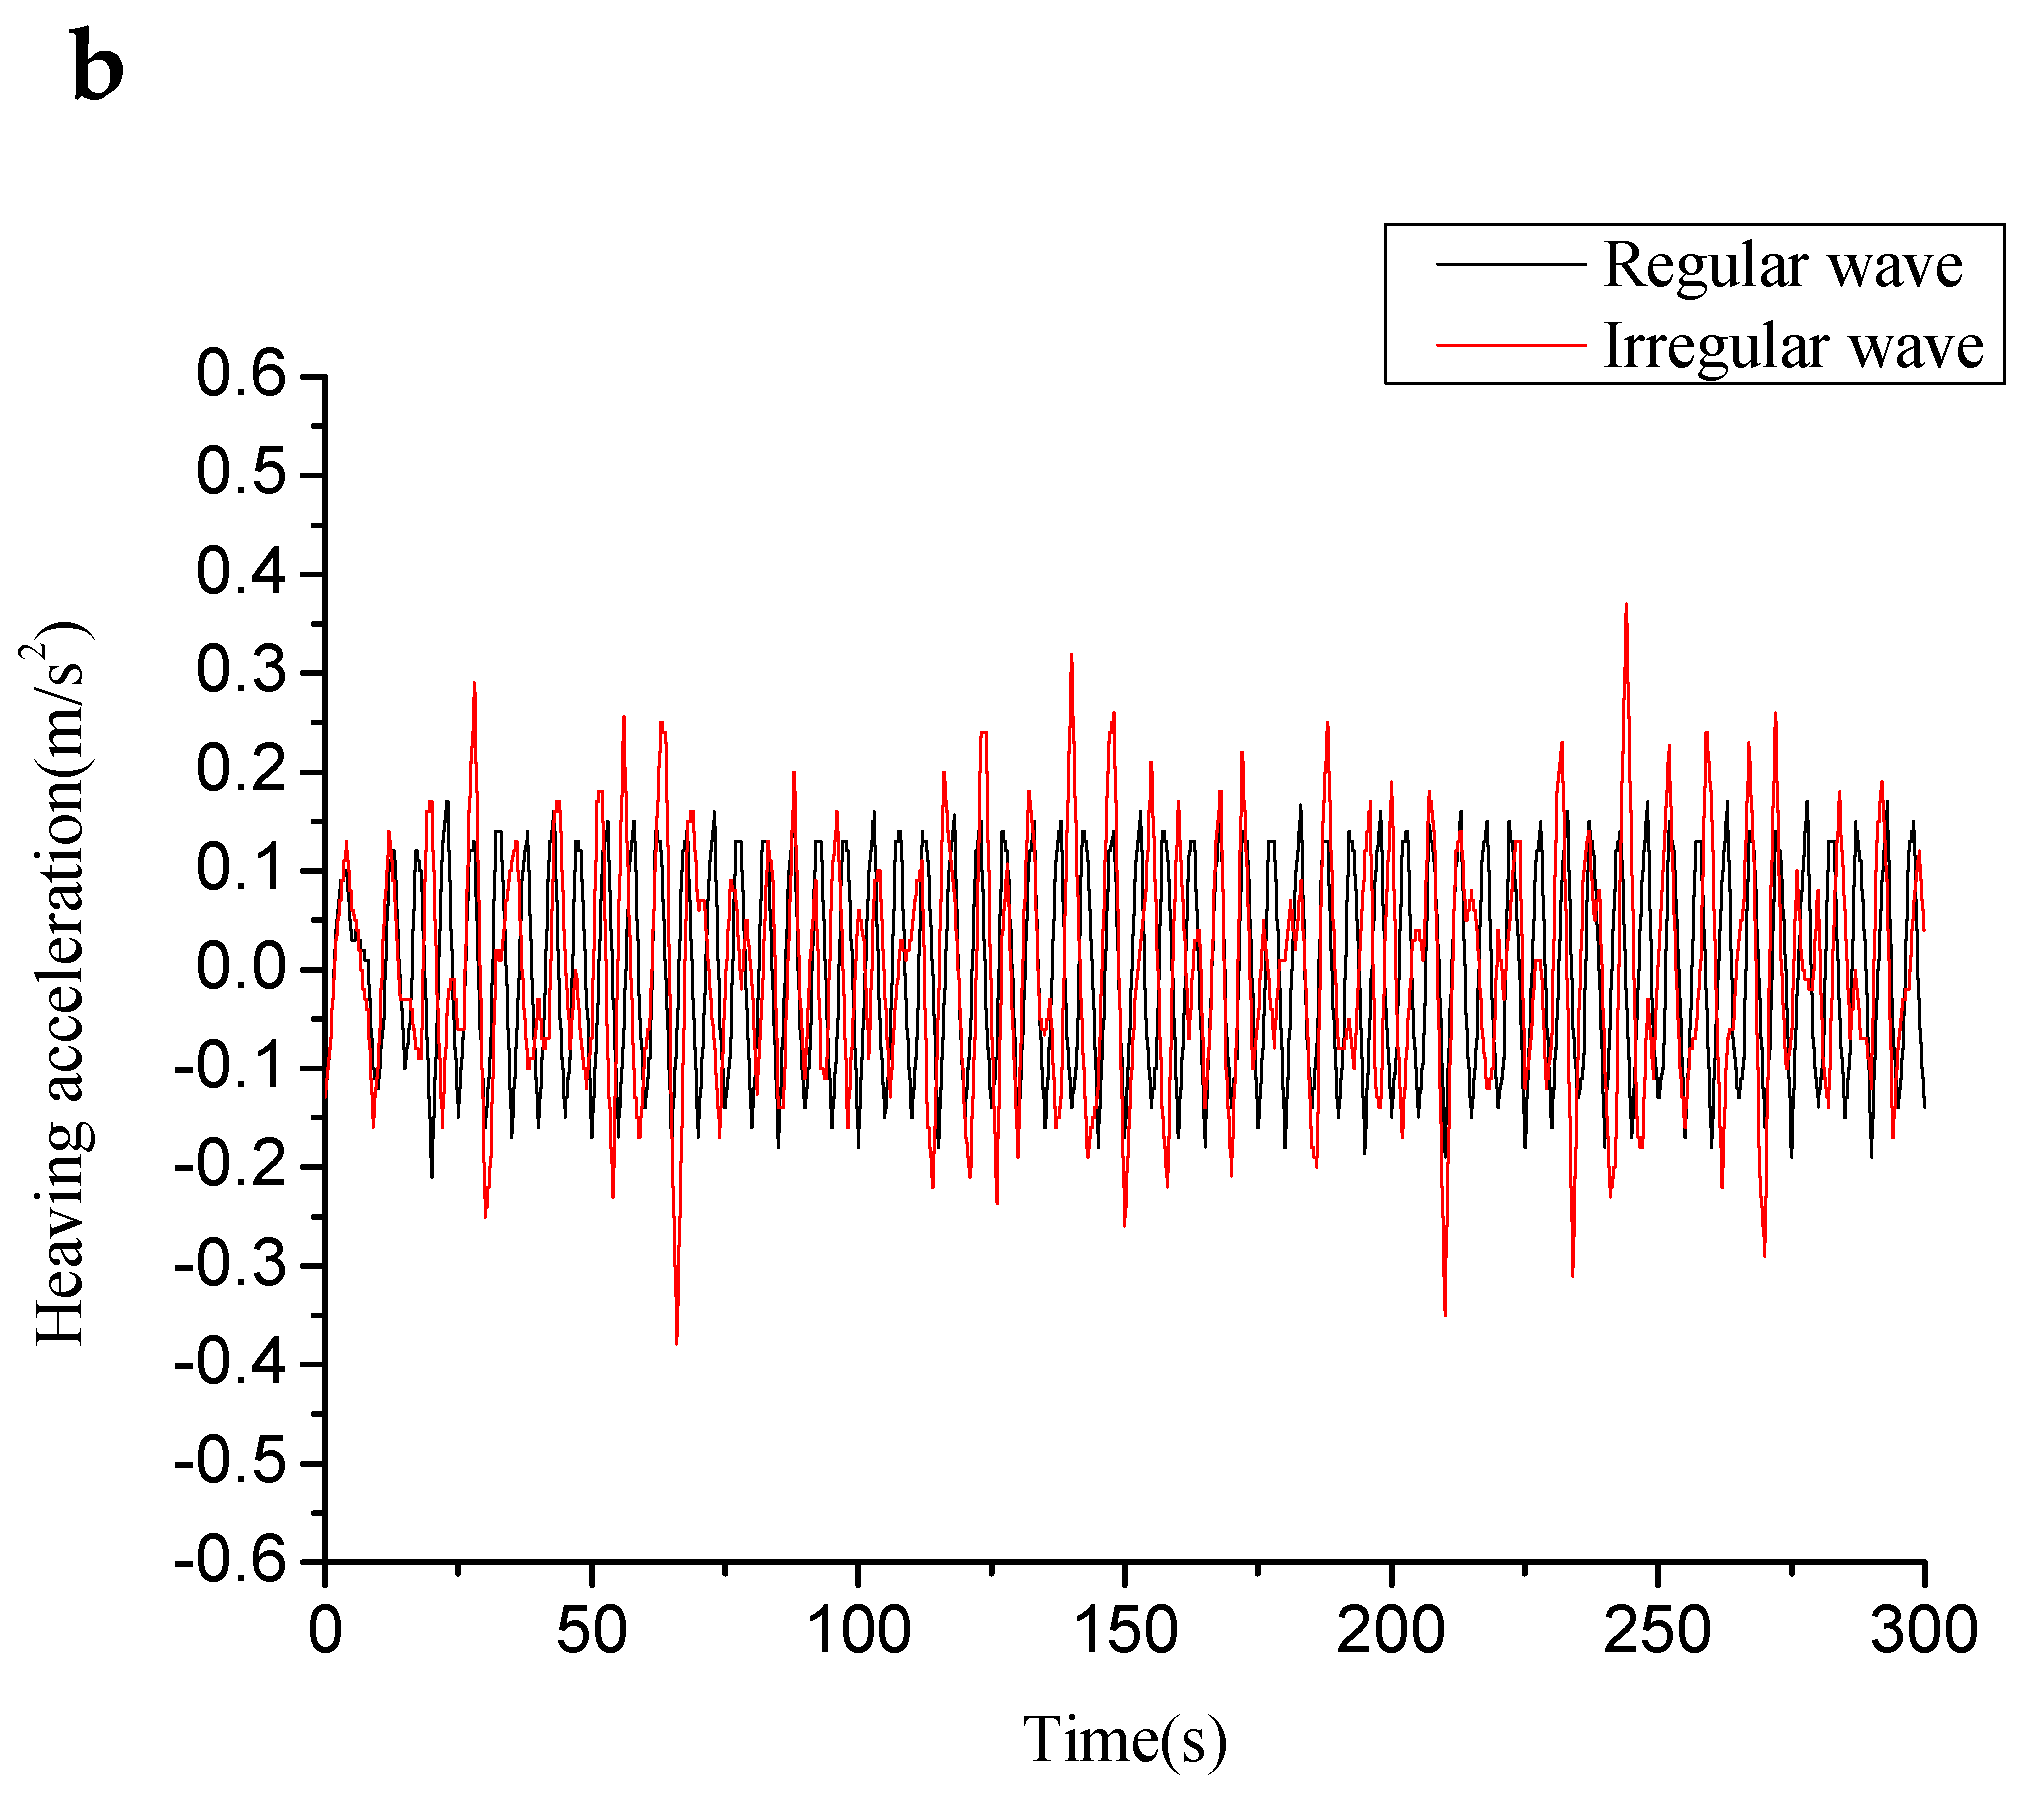
3.9. Comparative Analysis of Vessel Acceleration of Model Under Different Wave Height Conditions
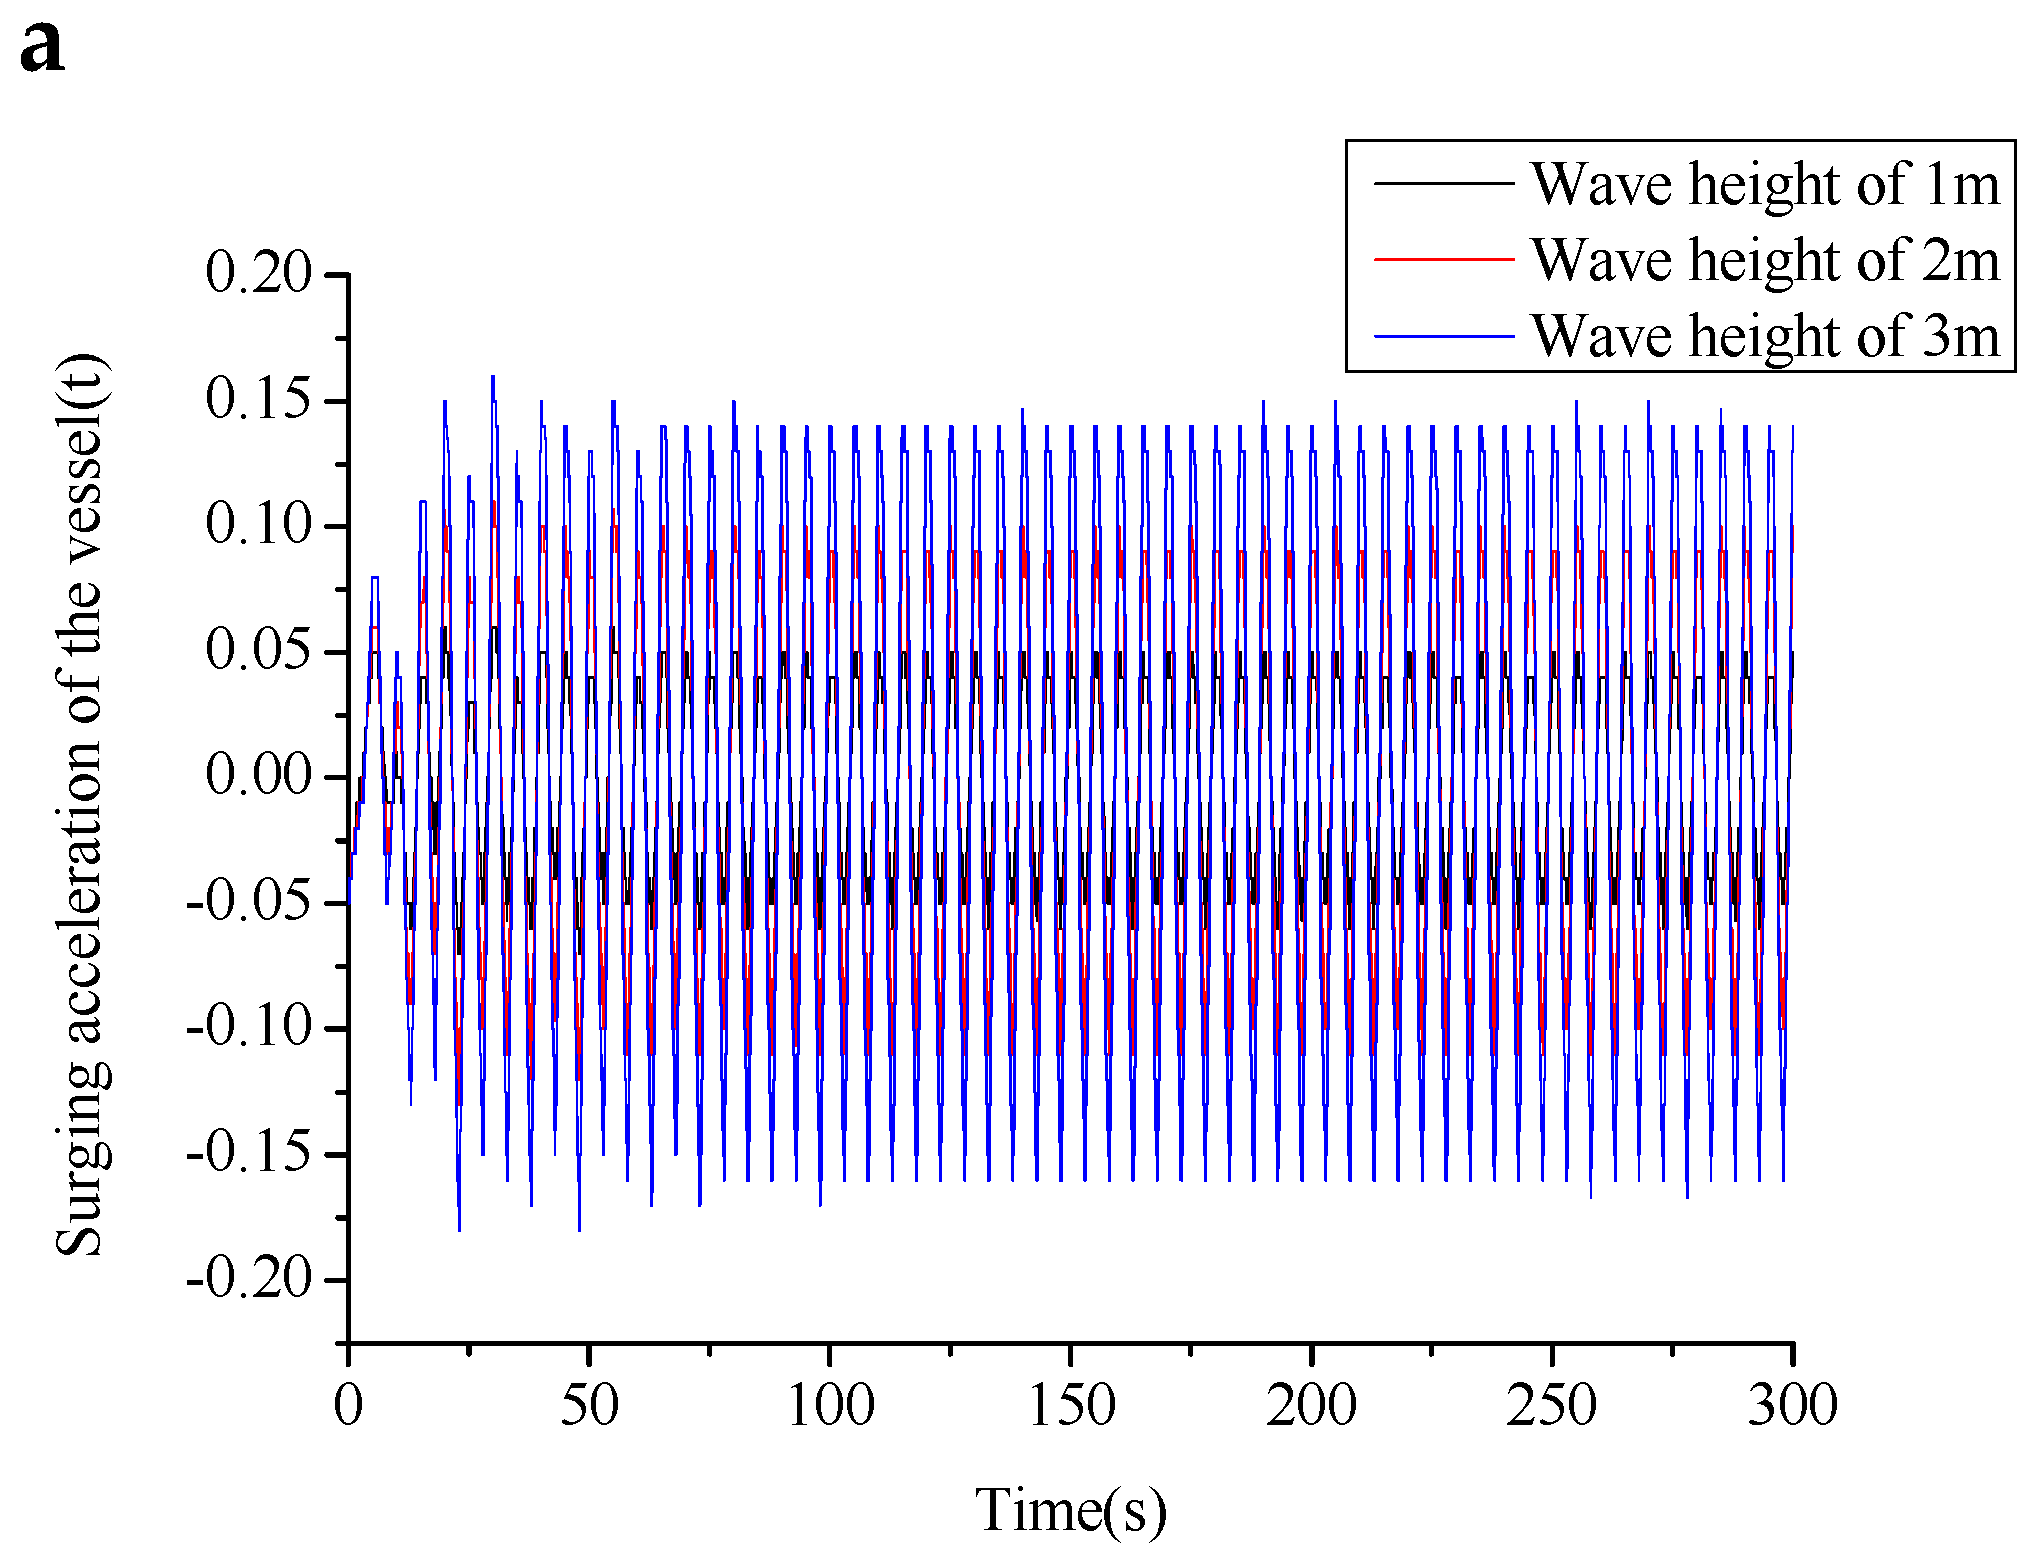
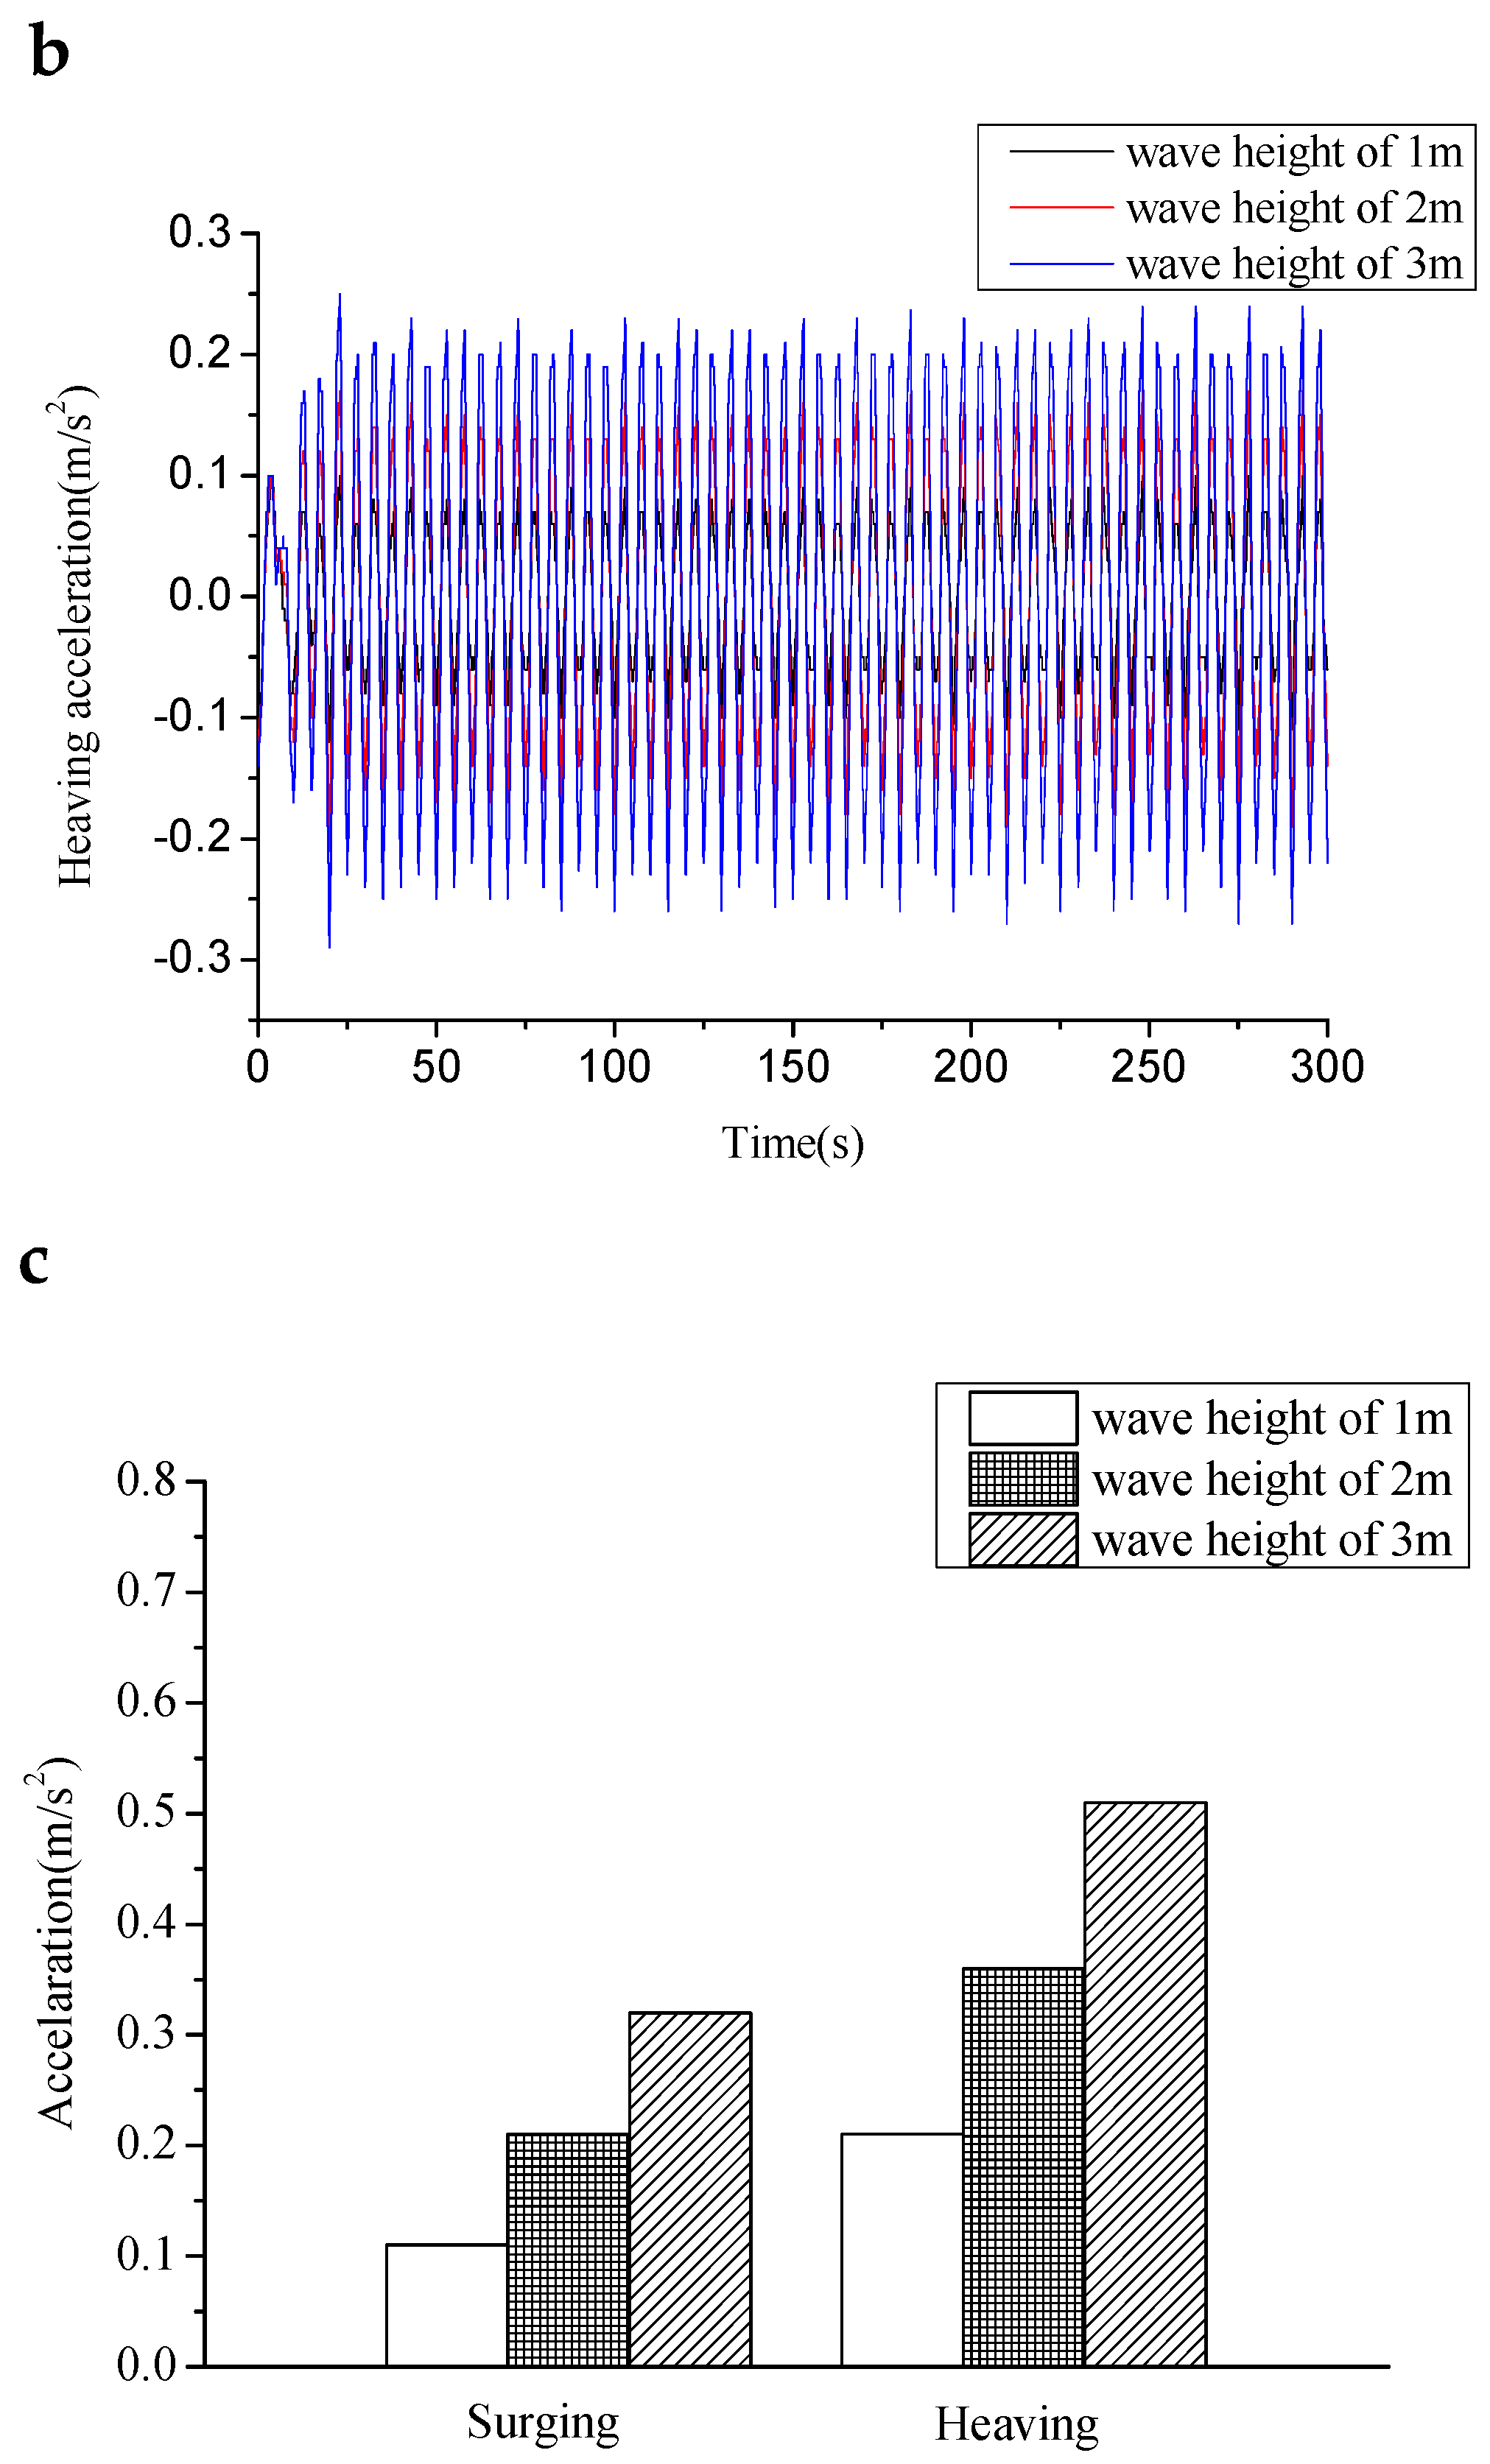
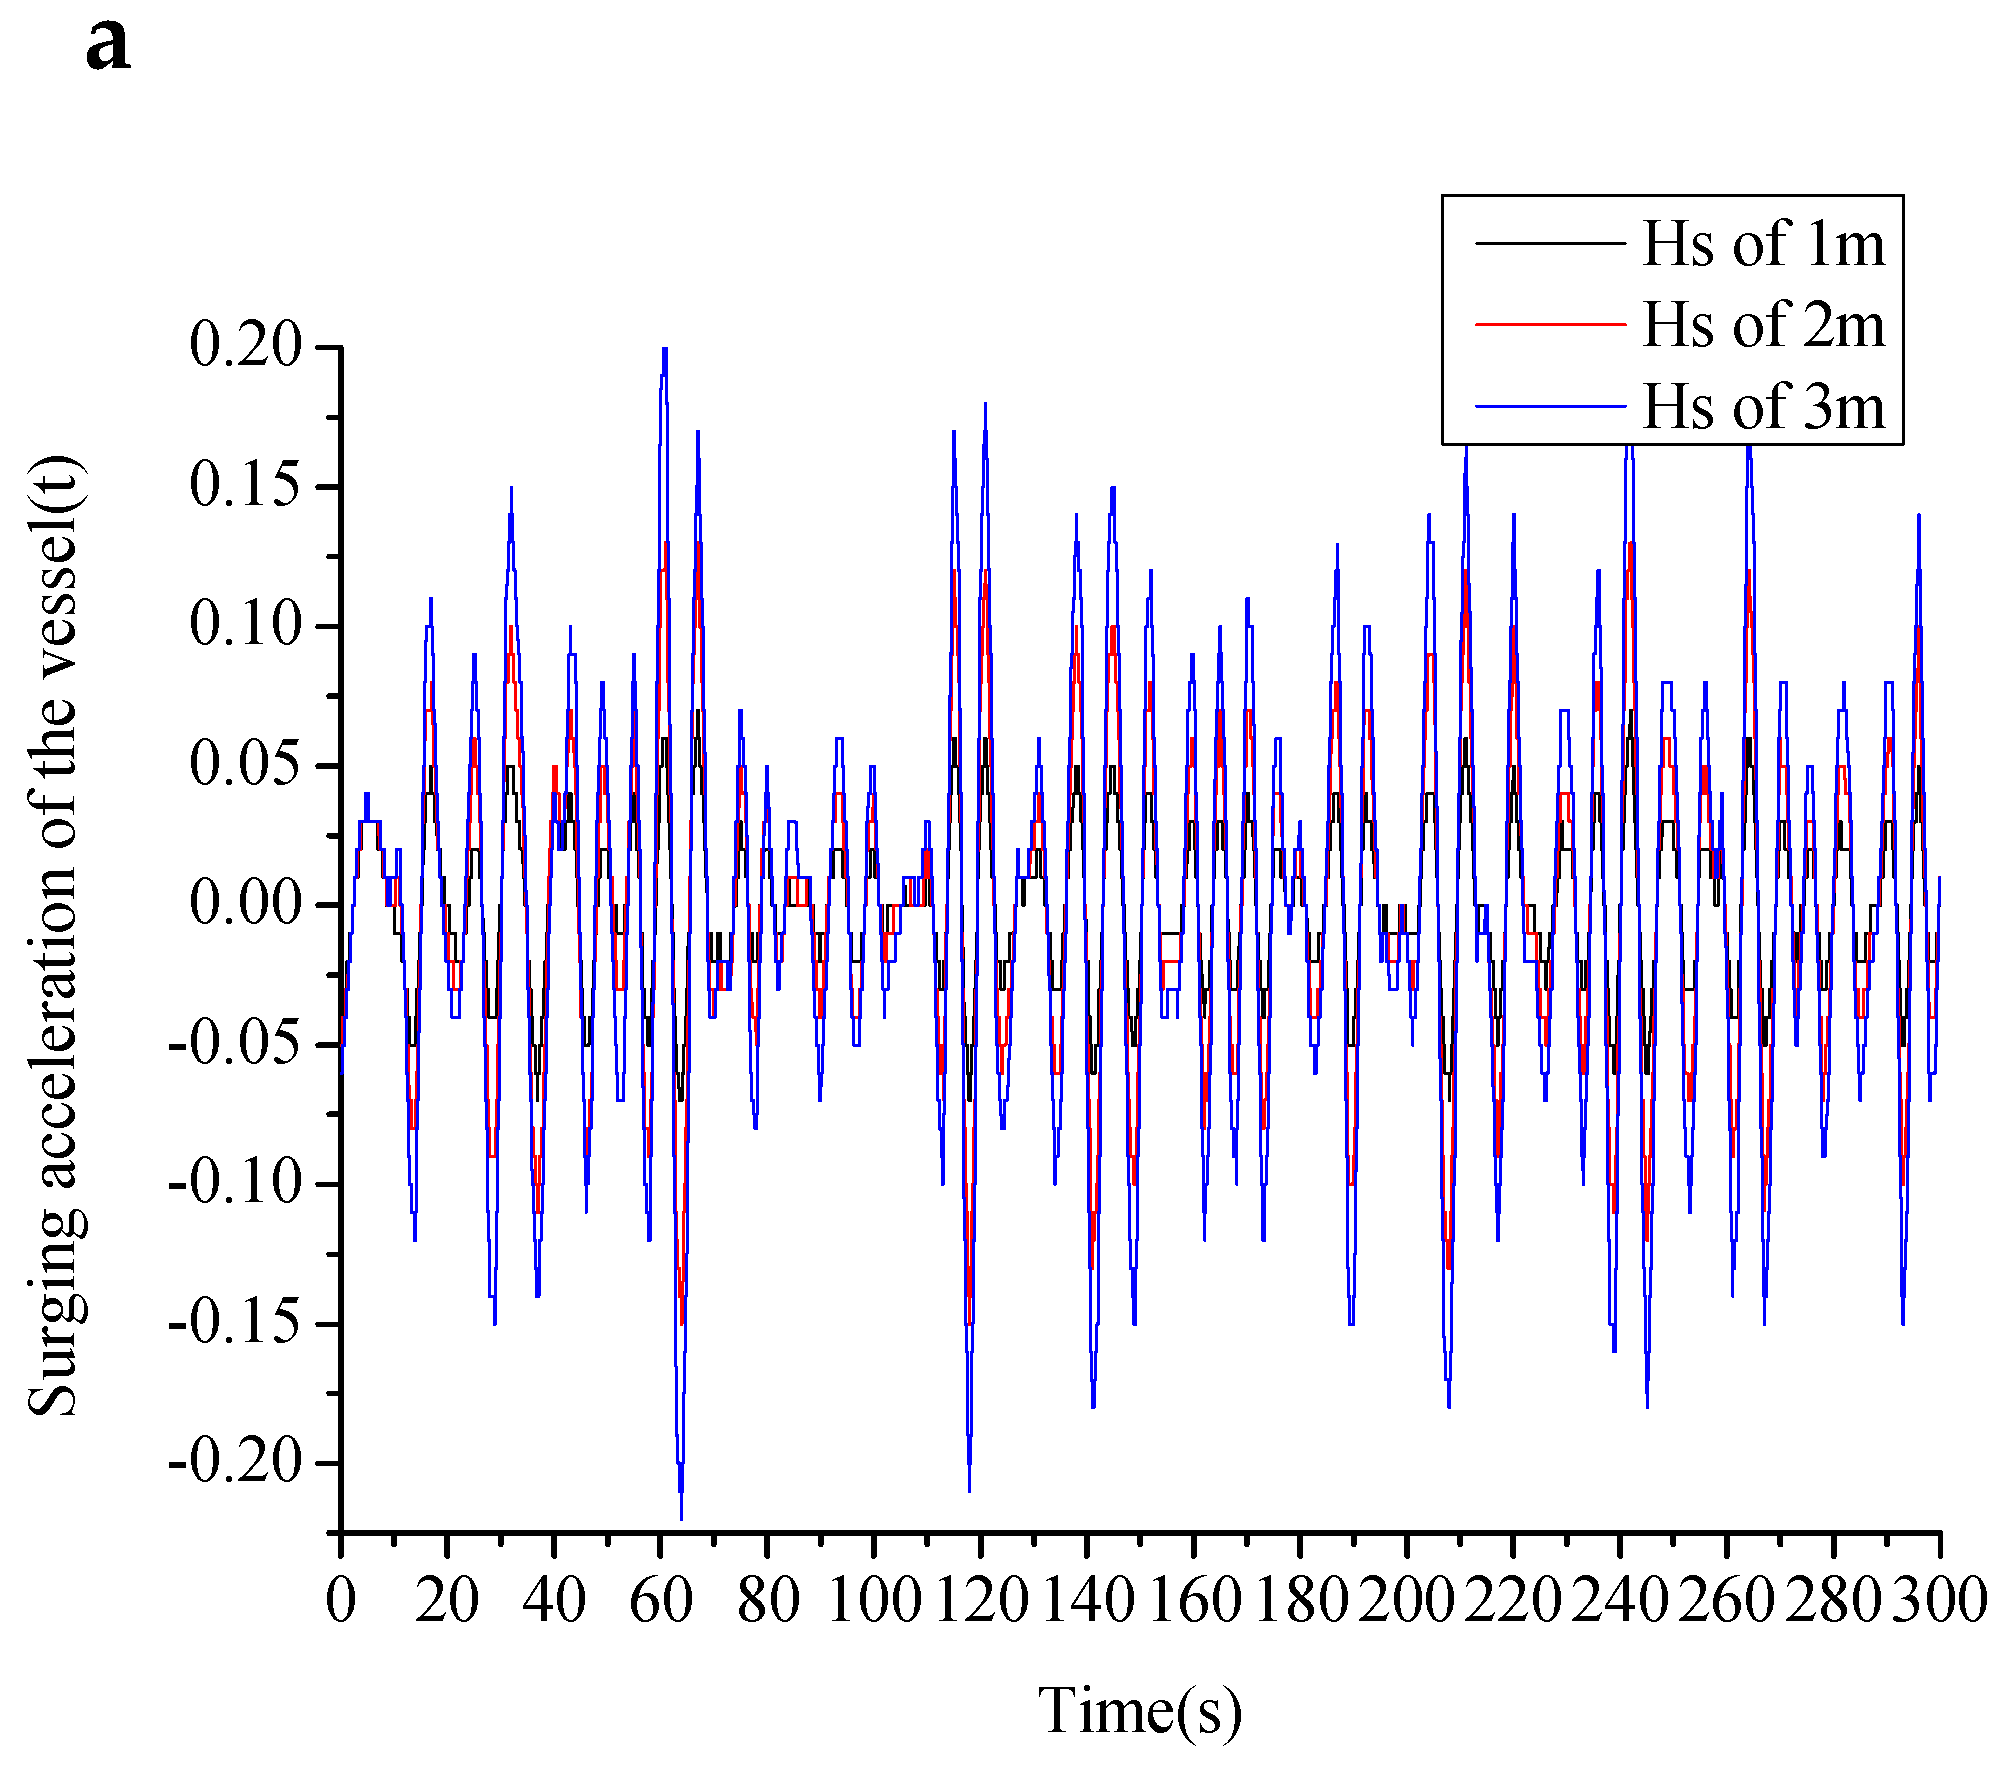
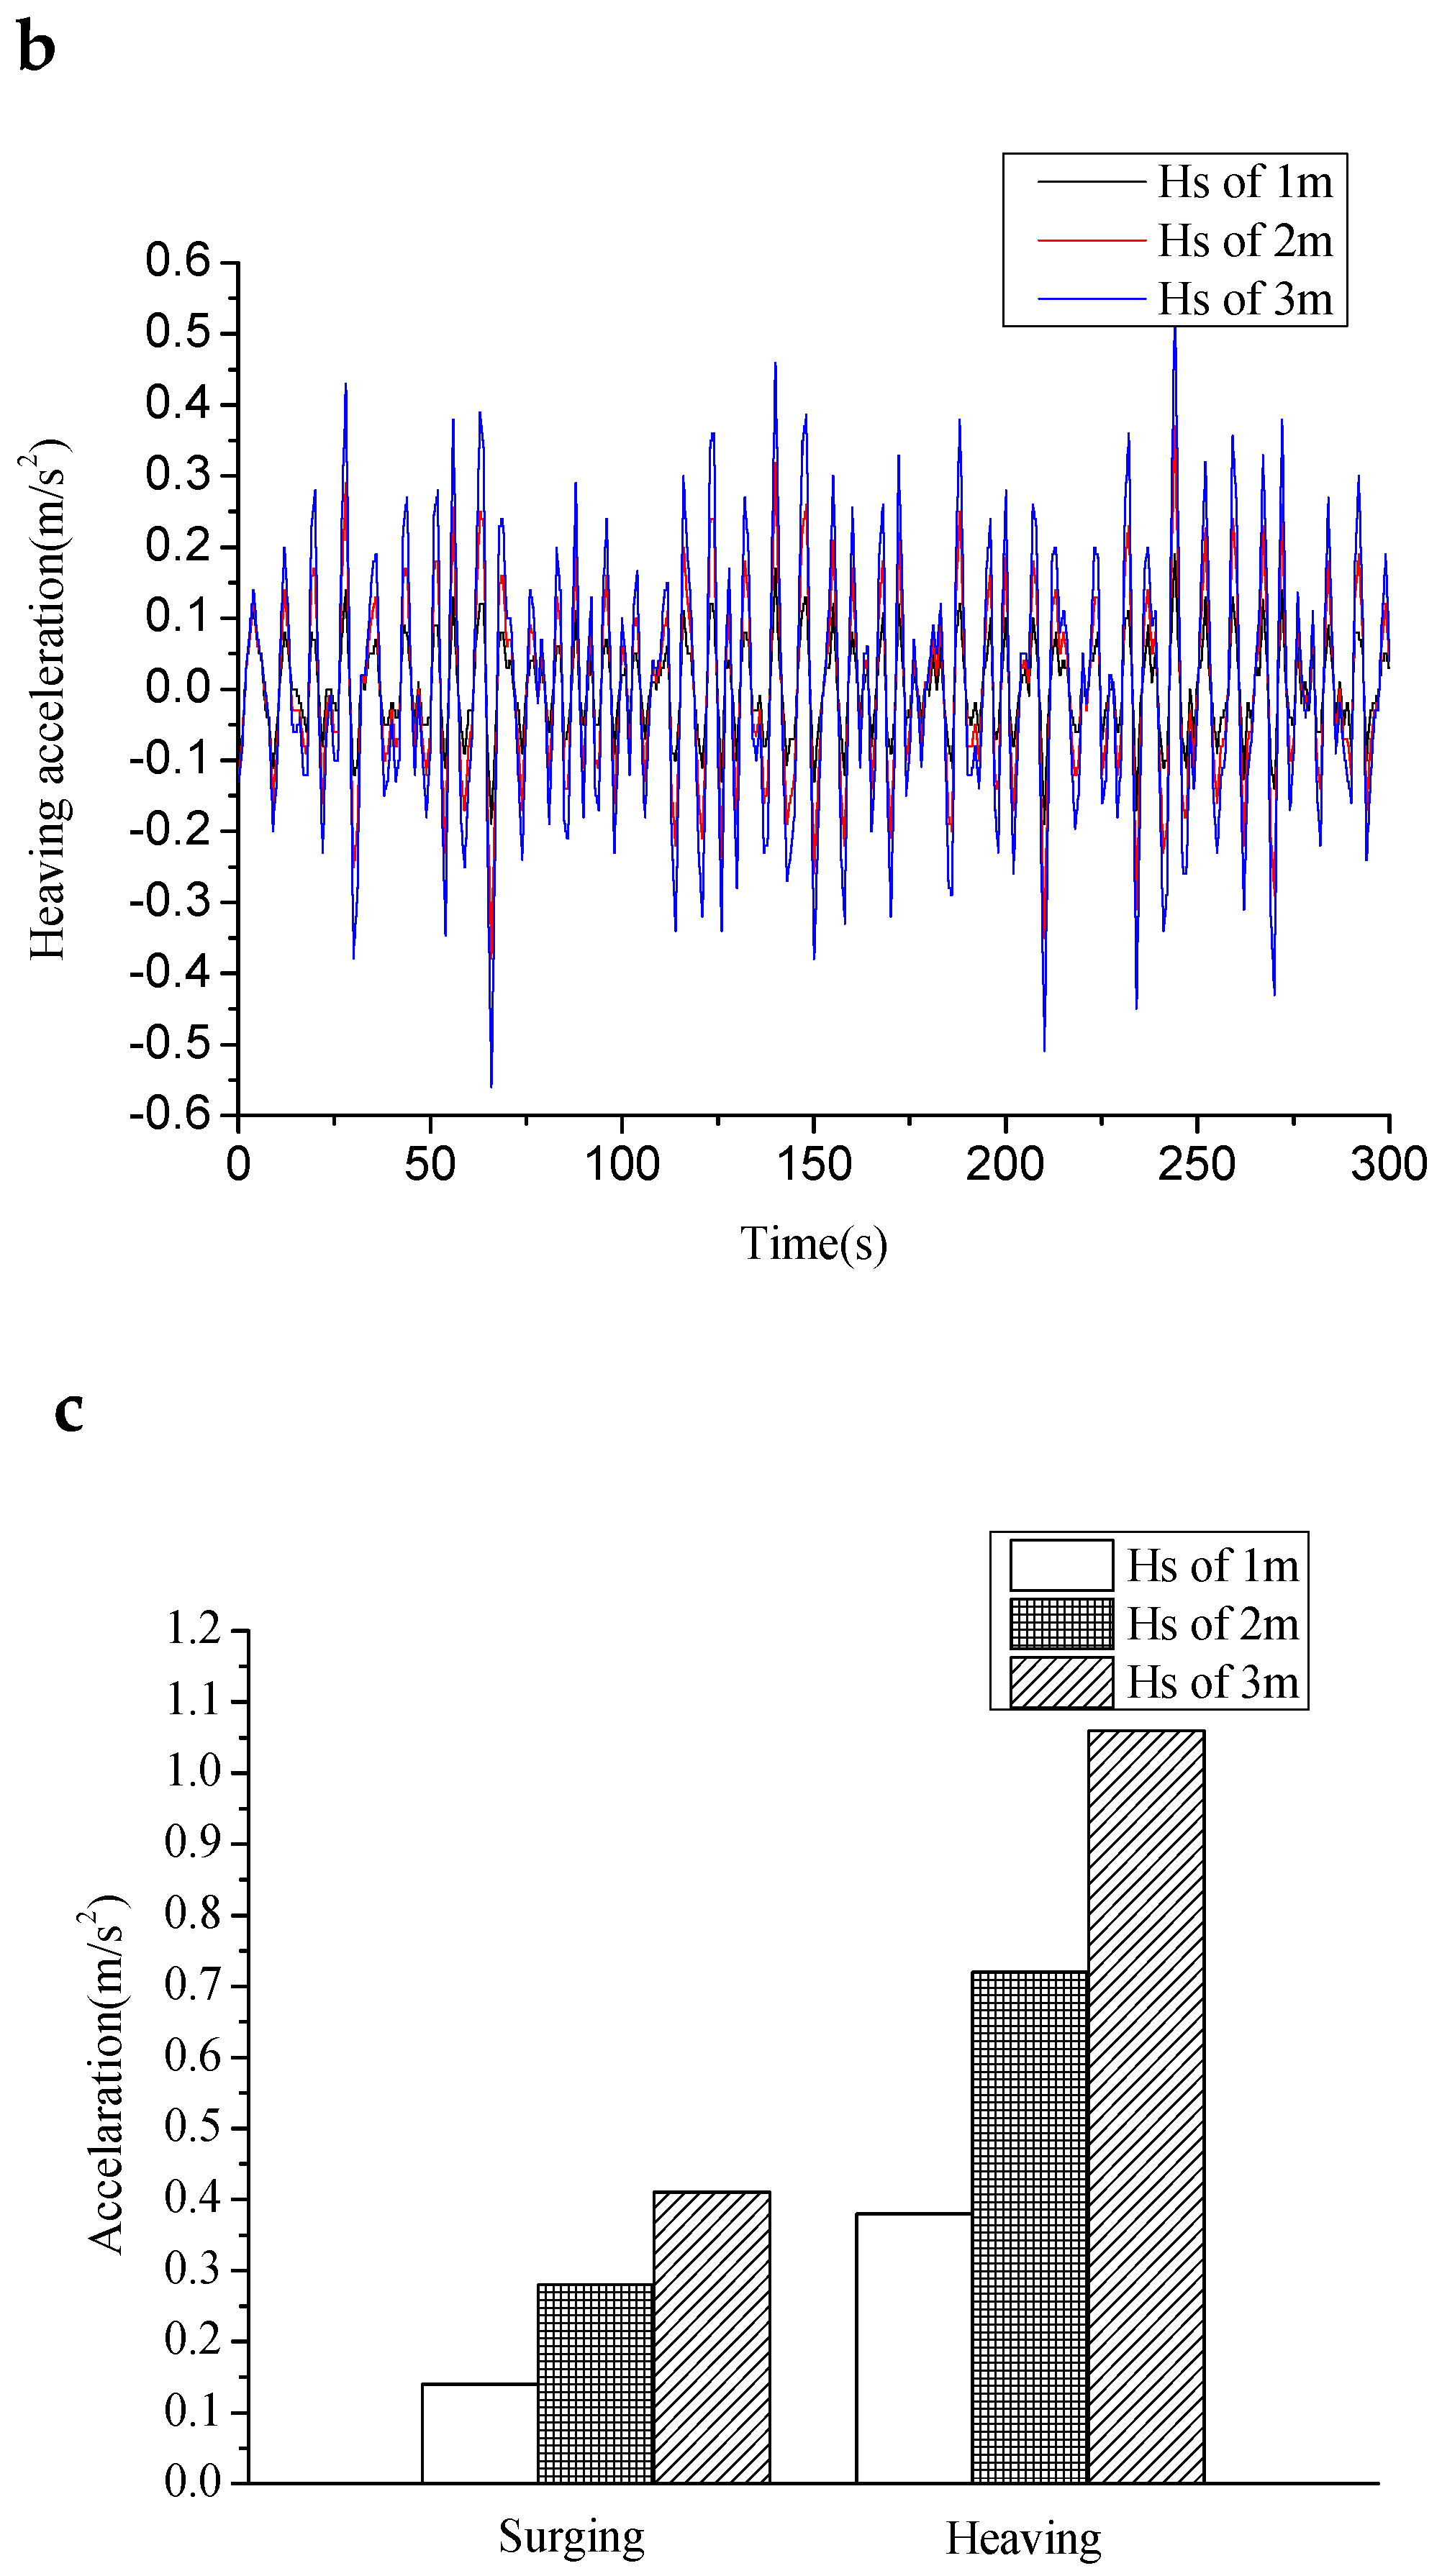
Contrasting analyses of the surging and heaving acceleration of the transportation and installation vessel under different wave height conditions are shown in
Figure 25,
Figure 26 and
Figure 27.
It can be seen that as the height of the model wave increased, the amplitude of the surging acceleration increased. For regular waves, the multiple increased from 0.1 m/s at 1 m wave height to 0.3 m/s at 3 m wave height. For irregular waves, the multiple increased from 0.15 m/s at 1 m wave height to 0.4 m/s at 3 m wave height. For regular waves, the amplitude of the heaving acceleration increased multiple times, from 0.2 m/s at 1 m wave height to 0.6 m/s at 3 m wave height. For irregular waves, the amplitude of the heaving acceleration increased multiple times, from 0.35 m/s at 1 m wave height to 1 m/s at 3 m wave height.
It can be seen from the above analysis that as the wave height increases, the amplitude of the towing cable force, spring force, surging acceleration, and heaving acceleration increase multiply. Therefore, an increase in wave height is not at all conductive to the safety of navigation.


