Article

Utilization of Industrial Waste in Cement in a Marine Environment with a Tropical Climate

1
College of Harbor, Coastal and Offshore Engineering, Hohai University, Nanjing 210098, China
2
Faculty of Civil Engineering, Thuyloi University, 175 Tay Son, Dong Da, Hanoi 100000, Vietnam
3
Department of Civil Engineering, Southeast University, Dhaka 1213, Bangladesh
4
Faculty of Environment and Labour Safety, Ton Duc Thang University, Ho Chi Minh City 700000, Vietnam
*
Author to whom correspondence should be addressed.
J. Mar. Sci. Eng. 2019, 7(8), 245; https://doi.org/10.3390/jmse7080245
Submission received: 12 May 2019 / Revised: 16 July 2019 / Accepted: 25 July 2019 / Published: 27 July 2019
(This article belongs to the Special Issue Sustainable Concrete in the Marine Environment)

Abstract

:
This novel study on cement paste material was conducted with the aim of keeping up with the rapid development of urban construction and contributing to the continuous improvement of building materials to overcome environmental issues. In this study, several kinds of industrial waste were used to enhance the properties of cement paste for application in a marine environment with a tropical climate, such as in Vietnam. This study focuses on evaluating the properties of cement paste containing cement replacement combining 0–30% fly ash, 0–10% silica fume, and plasticizer accounting for 0.3% and 0.4% of the binder by mass. Water demand, chloride ion and sulfate ion permeability, and microstructural properties of the cement paste were determined by thermogravimetric analysis (TGA), X-ray diffraction (XRD), and scanning electron microscope (SEM) and they were investigated after 28 and 56 days. The test results show that an optimum mixture could be obtained with the use of 20% fly ash, 10% silica fume (replacing Portland cement), and 0.4% plasticizer. The application of such materials to sea dikes affected by a tropical climate (characterized by heat, humidity, salty seawater, many big storms, large waves, and strong tides) was investigated for four years on the Vietnamese coast. The test results indicate that fly ash and silica fume can improve the corrosion and abrasion resistance of concrete in coastal areas with a tropical climate, such as in Vietnam.

1. Introduction

More than 70% of concrete and reinforced concrete structures become highly corroded in marine environments. Coastal constructions in Vietnam are vulnerable to corrosion due to the high humidity and high-temperature conditions that persist there, as well as the exposure to water with high salinity [1]. Therefore, effective corrosion protection technology must be developed that considers the actual climatic conditions in Vietnam. The penetration of saline water into concrete structures causes its corrosion, which decreases its comprehensive strength. Fly ash and silica fume are supplementary cement materials, which are widely used in concrete production. Such materials not only reduce the use of cement and CO2 emissions but also enhance the stability and strength of concrete. Annually, around one billion tons of fly ash and between 1 and 1.5 million tons of silica fume are produced in coal-fired steam power plants worldwide [2,3]. A large amount of fly ash and silica is being used as source material in the concrete production industry [4]. Silica fume and fly ash have been used as a partial cement replacement in mortar and concrete production [5,6,7,8]. Fly ash has been suggested to improve rheological properties and reduce the cracking of concrete due to its lower heat of hydration. Concrete using fly ash with less superplasticizer achieves a slump similar to plain concrete with Portland cement. Moreover, silica fume has been used to improve the abrasion resistance of concrete, as well as to prevent the penetration of chloride ions [9,10,11].
Antoni et al. [12] studied the use of fly ash in the range of 0–30% and silica fume in the range of 0–10% by mass to replace cement content. They observed that increasing the partial replacement of cement with fly ash increased the workability and compressive strength of mortar. The use of silica fume, however, reduced the workability of fresh mortar, and thus required the addition of superplasticizer to improve workability. However, this research has only been done in the laboratory and has not been tested in the field. Leung et al. [13] reported that the effect of the combined use of fly ash and silica fume on reducing water absorption and sorptivity is much more significant than using fly ash alone. Moreover, it has been noted that increasing the proportion of fly ash and silica fume leads to an enhanced reduction in water absorption. Benli et al. [14] conducted an experiment to specify the effects of sea water on the mechanical properties and durability of self-compacting mortars containing fly ash and silica fume. The results showed that the tensile strength of ternary mixtures of silica fume and fly ash performed similar and better than the binary mixes of fly ash and silica fume, except for fly ash 10% and silica fume 6%. In binary mixtures of silica fume and fly ash, as the content of admixture increases, the tensile strength tends to decrease during seawater curing. The service life of concrete structures depends significantly on the ambient climate conditions. Mohammad et al. [15] suggested the use of silica fume (7.5–12.5% of cement) to reduce the permeability and diffusion of chloride ions, contributed to an increase in the durability and longevity of a concrete structure. Meanwhile, Chalee and his team [16] reported that the use of fly ash in concrete significantly reduced chloride penetration and corrosion in reinforced concrete in Southeast Asia, where the weather is hot and humid. However, there is a scarcity of research data on the durability of marine concrete containing fly ash and silica fume in Vietnam, which has a monsoon tropical climate. Therefore, the objective of this study is to determine the optimum mixture containing fly ash, silica fume, and superplasticizer to apply to sea dykes on the Vietnam coast, which has a tropical climate (with high-temperature and high-humidity conditions; high salinity; strong wind, waves, and tides; and sometimes big storms). The present study deals with the water demand, durability characteristics, and microstructural properties of cement partially replaced with fly ash and silica fume along with superplasticizer. On the basis of the experimental results, the decision was made to check the optimal ratio when fly ash was combined with silica fume as a cement replacement. This study proposed a reasonable admixture rate for concrete to improve the durability of concrete structures used for coastal protection with the effect of chemical and mechanical actions; and produced components for coastal protection with the percentage of admixture proposed and successfully applied on the Vietnam coast. The results show that the concrete had very good corrosion and abrasion resistance.

2. Experimental Details

2.1. Materials

In this study, the type of cement used was PC 40 from the HoangThach cement company in Vietnam. Natural river sand (Lo river, Phutho, Vietnam) (Ninhbinh, Vietnam) was used as a fine aggregate and a coarse aggregate in concrete mixes in field tests. The properties of the materials used are presented in Table 1. Fly ash (FA) type C from the Pha Lai thermal power plant was used to improve the corrosion resistance of the concrete. Silica fume (SF) from the Castech Company in Vietnam was used to improve the abrasion resistance of the concrete. The chemical compositions of the cement, FA and SF, are given in Table 2. The data in Table 1 and Table 2 were obtained from experiments according to Vietnam standards TCVN 141: 2008 and TCVN 8262: 2009. These standards correspond to ASTM C114-18 and ASTM C311-18, respectively. A plasticizer with a naphthalene sulfonate base was used as the water-reducing admixture. High-range water-reducing admixture was used in the form of golden-brown powder.

2.2. Test Procedures

2.2.1. Water Demand

The amount of water required to produce the same ductility of cement paste with different admixtures was determined. Moreover, the relationship between the amount of water and mineral admixture ratio, in addition to the effect of the plasticizer admixture, was determined.
The water demand of the cement paste was determined in accordance with ISO 9597:2015 by using the Vicat mold. The Vicat mound was filled with the blended cement paste in one layer, and the surface on the top of the mold was smoothed to be level as quickly as possible. The test block, confined in the mold and resting on the plate, was placed under a rod bearing a plunger. The plunger was lowered gently into contact with the surface of the test block, quickly released, and allowed to sink in. Trial-blended cement pastes, made with varying amounts of water, were used until the plunger settled at 6 mm from the bottom of the water used, and they were recorded as standard consistency (water demand) and expressed as a percentage by mass of the dry cement.
There were 15 series of specimens, as shown in Table 3. A sample without admixture (P-F0S0) was used as the control, whereas, the other samples were used with mineral admixture, in which the total mineral admixture replacement of cement was 30% by mass. Specifically, the mix combinations used were 30% fly ash (P-F30S0), 25% fly ash + 5% silica fume (P-F25S5), 20% fly ash + 10% silica fume (P-F20S10), and 15% fly ash + 15% silica fume (P-F15S15). The amounts of plasticizer used were 0% (P0), 0.3% (P0.3), and 0.4% (P0.4) of the binder by mass.

2.2.2. Chloride Ion and SO3 Permeability Tests

Five groups (P-F0S0P0, P-F30S0P0.4, P-F25S5P0.4, P-F20S10P0.4, and P-F15S15P0.4) of cubic specimens with dimensions of 20 × 20 × 20 mm were prepared, where one group (P-F0S0P0) was the control sample without plasticizer and four groups used P0.4% of water-reducing plasticizer. After one day, the specimens were soaked in seawater and 10% MgSO4 solution for six months (Figure 1) to determine the chloride ion and SO3 permeability.

Method of Determining the Amount of SO3

SO3 content was determined by chemical analysis, which is summarized as follows:
  • Use dilute HCl solution to extract the dissolved sulfate in the concrete sample into the solution.
  • Precipitate the sulfate ions in the acidic medium by using barium chloride, forming barium sulfate.
  • Filter, wash, and precipitate the precipitate at (850 ± 25) °C and weigh the sample.
  • The sulfate content of SO3 is calculated as a percentage (%) of the cement sample weight, according to the formula in Vietnam Standard 9336:2012, which corresponds to ASTM C114:
    SO 3 = ( m 1 m 2 ) × 0.343 m × 100
    where, m1 is the mass of the precipitate in grams (g), m2 is the weight of the beaker in grams (g), m is the mass of sample taken for analysis in grams (g), and 0.343 is the conversion ratio from BaSO4 to SO3.

Method of Determining the Amount of Chlorine

Chloride ions were measured by a CL-3000 James Instruments Corporation instrument. The results of this test represented the total amount of chloride concentration, which was determined according to American standard ASTM C1152 in the case of acid-soluble chloride, as summarized below:
  • Cast the paste samples and soak them in saline for some time as determined by the experimental plan.
  • Drill the paste samples.
  • Use electronic scales to determine a 3 g sample.
  • Slowly pour the weighed sample into the prepared 20 mL of acid solution (with the machine) and shake to dissolve the powder into the solution.
  • Release the corrected electrode into a jar of acid solution and cement paste.
  • The results represent the chloride ion concentration (%) in the cement sample.

2.2.3. Microstructural and Mineralogical Studies

Five groups were prepared in the same way as the samples for the chloride ion and SO3 permeability tests. However, the samples were soaked in freshwater for one day. These specimens were used in the TGA, X-ray, and SEM analyses after 28 days and 56 days to determine the effect of hydrotreatment on the presence of fly ash and silica fume.

Thermogravimetric Analysis (TGA) Tests

Common thermoanalytical techniques depend on detecting and measuring changes in weight, energy, dimension, and the nature and amounts of evolved volatiles when heated. When a cement paste specimen is heated to 1000 °C, it undergoes decomposition of Ca(OH)2, hydrated calcium silicate (C–S–H), hydrated calcium aluminate, calcium carbonate, etc. The weight loss corresponding to the decomposition of Ca(OH)2 in the temperature range of 450–550 °C forms a step (a major change in slope) in the TGA curve. The height of the step can be used to determine the Ca(OH)2 content [17]. The weight loss below the Ca(OH)2 step is due to the decomposition of C–S–H and hydrated calcium aluminate. The weight loss above the Ca(OH)2 steps are mainly due to the decarbonization of calcium carbonate and partially due to the final stages of dehydration of C–S–H and hydrated aluminate.
Differential thermal analysis (DTA) is a thermogravimetric analysis method in which the material under study and an inert reference are heated (or cooled) under identical conditions, while recording any temperature differences between the sample and the reference. The equipment used for the TGA test was developed by Labsys Evo.

X-ray Diffraction (XRD) Tests

It became apparent that the quality of Ca(OH)2 indicated by XRD, in terms of reference intensity and thermal analysis, produced a linear relationship for Portland cement-based cement paste. Therefore, it was possible to use only the XRD peak reference intensity for the relative qualitative estimation of Ca(OH)2 in a cement paste that used Portland cement. A Portland cement-based paste was used for XRD experimentation. The equipment used for the XRD test was the Siemens D5000.

Scanning Electron Microscope (SEM) Analysis

The images obtained from the experiments allowed for the evaluation of the components added to the cement paste with the additional admixture. Each type of crystal had a different geometry. Thus, analyzing the images from the scanning electron microscope helped to determine which new constituents were formed. The SEM investigation was conducted using S-4800 equipment.

2.2.4. Field Experiments

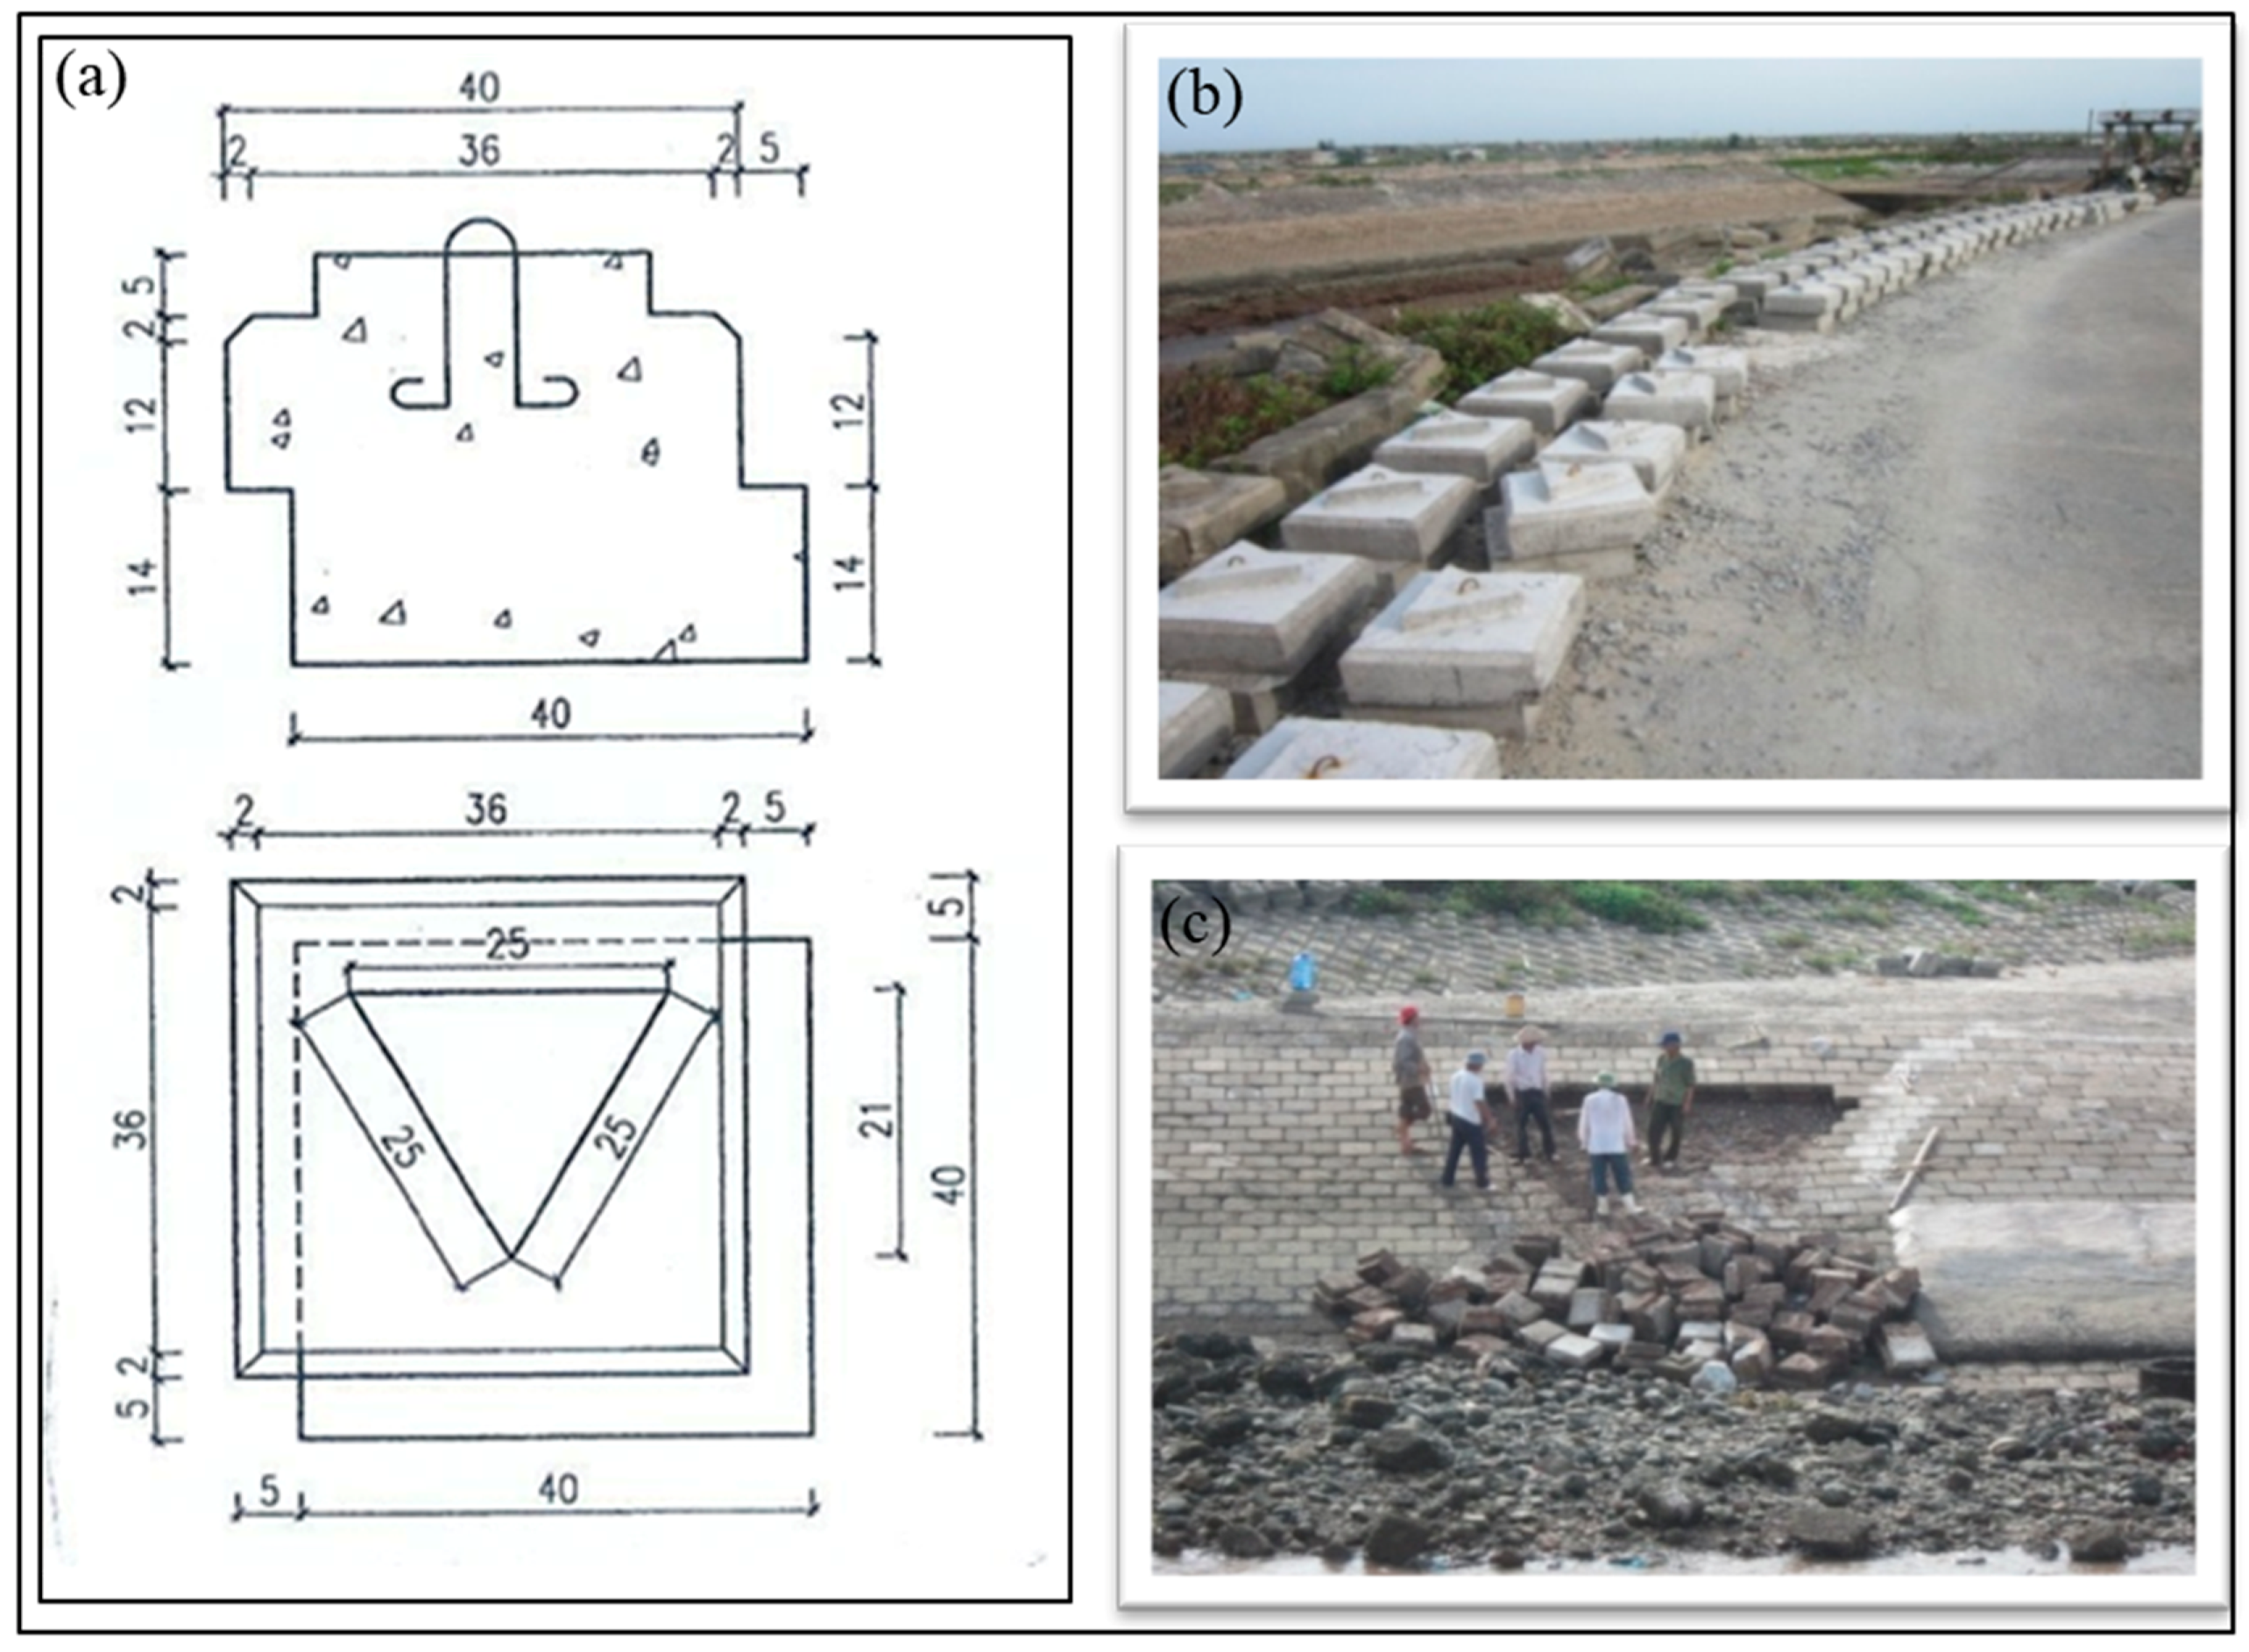
The sea dykes studied here, which were selected as being representative of the sea dyke system in northern Vietnam, have characteristics appropriate to those in tropical climates, and are currently experiencing severe deterioration that needs to be overcome soon. These dykes are strongly affected by waves and tides. A total of 100 old components of the dykes (50 components without admixture (C-F0S0P0) and 50 components with 20% fly ash, 10% silica fume, and 0.4% plasticizer (C-F20S10P0.4)) were replaced. The details of the mixture proportions of the concrete components are given in Table 4. The size of the components is shown in Figure 2. The compressive strength was measured after setting (one month) and after 6, 12, 18, 24, 36, and 48 months. The compressive strength test was a rebound hammer test, which is a non-destructive testing method of concrete that provides a convenient and rapid indication of the compressive strength of the concrete. The equipment used for the rebound hammer test was the Model Silver Schmidt-Type N, SH01-006-1581.

3. Results and Discussion

3.1. Water Demand

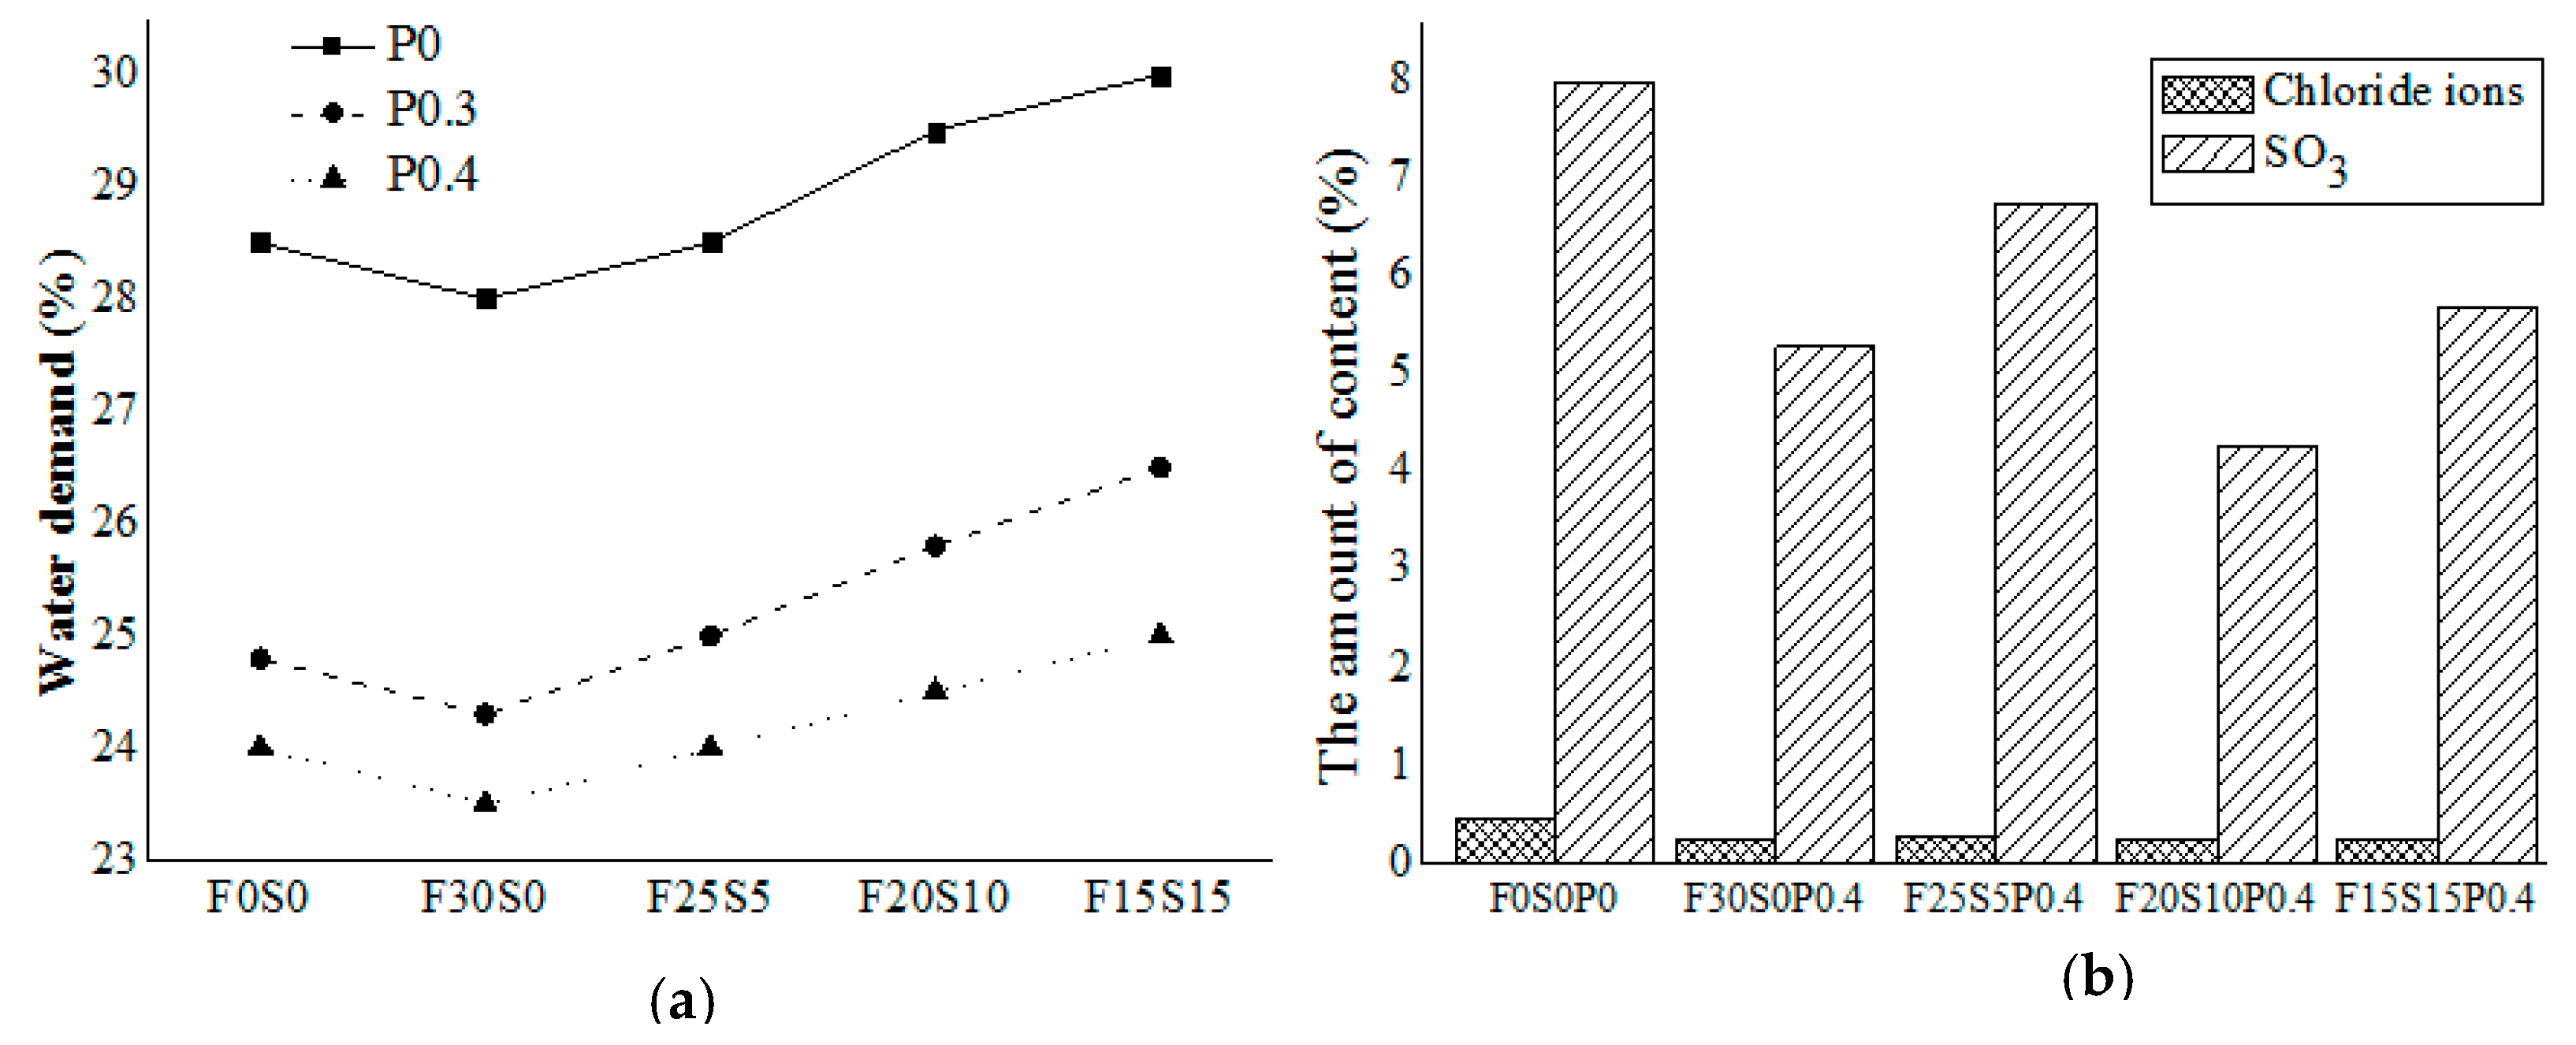
Figure 3a shows the water demand of the fabricated cement paste samples. The water demands of the samples with plasticizer were smaller than those of the samples without plasticizer. Furthermore, the water demand appeared to be the lowest in the binary mixture of fly ash, which may have been caused by the fly ash particles filling the micro air voids in the paste matrix to inhibit water absorption. In all the mixtures used in this study, the water demand of the 15% silica fume samples was highest for all rates of plasticizer due to the fact that the higher surface area and the very small particle size of silica fume increased the water demand. These results agreed with those of the previous study by Leung et al. [13] who reported that the replacement of fly ash and silica fume significantly reduced water absorption. Using fly ash to replace the ordinary Portland cement (OPC) at certain rates, especially greater than 25%, the rate of water use was reduced. The effect of using the combination of fly ash and silica fume on water demand and absorption is much more considerable than that of using fly ash alone.
Replacing 30% and 0% of the cement with fly ash without silica fume reduced the final water demand with the same rate of superplasticizer. The water demand increased with the decrease of FA together with the increase of SF. This was also observed by S.A. Abo-El-Enein et al. [18]. Alonso and Wesche [19] and Helmuth [20] found that once the unburned carbon in fly ash is below around 1%, the water absorption of fly ash is low. The water demands of all the samples with silica fume were higher than those of the ones without silica fume (comparing mixes with the same amount of fly ash). This could be explained by the fact that silica fume has an extremely fine particle size with a high specific surface area resulting in a greater water demand [21]. Samples with 0.4% plasticizer had the lowest water demand among those with the same rate of mineral admixture.

3.2. Chloride Ion and Sulfate Ion Permeability

Figure 3b reports the experimental results on the chloride ion and sulfate ion permeability of the tested concrete. The samples with admixture had a lower rate of chloride ion and sulfate ion permeability than the control.
In detail, the amounts of chloride ions in P-F30S0 and P-F20S10 were 0.243% and 0.244%, respectively, whereas those amounts increased up to 0.263% and 0.251% for P-F25S5 and P-F15S15, respectively. Usually, chloride ions can react with C3A and C4AF to form 3CaO Al2O3 CaCl2 10H2O (calcium chloroaluminate: Friedel’s salt) and 3CaO·Fe2O3 Al2O3 CaCl2 10H2O (calcium chloroferrites), which are stable forms leading to a decrease in available free chloride [22]. The presence of fly ash increases the amount of C3A due to the higher amount of alumina present in the mix. In addition, using fly ash leads to an increase in the calcium silicate hydrate (C–S–H) content, which is formed in the pozzolanic reactions to the chloride physically binding [23,24].
In the case of the SO3 content, P-F20S10 had the smallest value at 4.26%, followed by P-F30S0 at 5.28%, while P-F25S5 and P-F15S15 had higher levels at 6.75% and 5.68%, respectively. The fly ash and silica fume normally used in high-strength concrete are very effective in reducing calcium hydroxide, which greatly enhances concrete resistance to sulfate attack. In addition to reducing the calcium hydroxide, the pozzolanic reaction also produces calcium silicate hydrates, which can incorporate aluminum ions for ettringite formation. In a study on the durability of high-performance concrete against chemical attack, Grandet [25] indicated that silica fume reacts with calcium hydroxide, resulting in particularly dense and amorphous C–S–H, which progressively fills up the remaining interstices in the structure. It was concluded that low permeability is an essential factor governing durability. When fly ash was reduced to 25% plus 5% silica fume replacing cement, the SO3 content and the amount of chloride ion of the samples increased as compared with that of the sample with 30% fly ash and without silica fume.
In this study, 5% silica fume was not effective in reducing the corrosion of the chloride and sulfate ions. However, using 20% FA and 10% SF had a significant effect on improving chloride and sulfate ion resistance. As a result, evaluating the ability to resist damage caused by the erosion of chlorine and sulfate ions, a fly ash replacement rate of 15–20% and a silica fume replacement rate of 10–15% was considered to be superior.

3.3. Experimental Results Using Microstructural Analysis

Microstructural experiments were carried out with five groups of cement paste samples after 28 days and 56 days:

3.3.1. TGA Analysis

TGA of the hardened cement pastes after 28 and 56 days was carried out at temperatures up to 800 °C. In theory, this TGA result represents the weight loss due to the decomposition of some ingredients in the hardened cement in different ranges of temperature. The TGA of the hardened cement was conducted in three temperature ranges: 0–200 °C, 400–600 °C, and 600–800 °C. The endothermic peaks located below 200 °C are attributed to the removal of free water and the decomposition of C–S–H overlapping with calcium sulphoaluminate hydrates (ettringite and monosulfate hydrates), as well as calcium aluminosilicate hydrates [26]. The endotherm located at about 400–600 °C is characteristic of the decomposition of portlandite. The last overlapping endotherm located at 600–800 °C is related to the calcination of amorphous and crystalline calcite (CaCO3). On the basis of the TGA result of the five groups of cement paste samples after 28 days and 56 days and by applying the geometric method, the content of portlandite and C–S–H was estimated, as shown in Table 5.
The results of the decomposition of portlandite for all the samples after 28 days and 56 days show that the samples containing the admixture had significantly reduced the lime content as compared with the control sample without admixture. Specifically, the Ca(OH)2 content of the control sample was estimated at 4.09%, whereas the values in the admixture samples were 2.36% (P-F30S0P0.4), 2.42% (P-F25S5P0.4), 2.03% (P-F20S10P0.4), and 2.56% (P-F15S15P0.4) after 28 days.
The results show that after 28 days, the C–S–H fraction crystallized in the control sample was the smallest with an estimated amount of 2.56%, while the samples with admixture had higher values of C–S–H fraction crystallized at 3.78% (for P-F30S0P0.4), 3.39% (for P-F25S5P0.4), 3.85% (for P-F20S10P0.4), and 3.73% (for P-F15S15P0.4).
After 56 days, the crystallized C–S–H in the sample groups decreased slightly, but it still followed the same mass difference as it did after 28 days, that is, the control sample still had crystallized C–S–H of at least 2.55%, and all the samples with admixture had higher crystalline C–S–H. The effect of using admixture on different mixing ratios was found to be based on the amount of C–S–H formed, which included the total of both the crystalline and gel C–S–H. This result was difficult to discern because the endothermic peaks located below 200 °C had the same overlap at the same temperature range. However, the results of the analysis clearly show the effect of using mineral admixture in cement as compared with that of the non-admixture, because the amount of C–S–H in the samples with admixture was higher than that in the sample without admixture.
The results of the TGA analysis estimate that the hydrolysis components in the cement paste were perfectly consistent with the theoretical backgrounds analyzed and helped to demonstrate the role of the active minerals of fly ash and silica fume. The limitation of corrosion through the quantification of pozzolanic reaction reduced the Ca(OH)2 content in the hard cement, thereby significantly reducing the corrosion.

3.3.2. X-ray Diffraction Analysis

The following section describes the X-ray diffraction analysis used to identify the crystalline phases and also investigate the crystal structure of some of the phases. Routine qualitative scans of the various mixtures readily identified the predominant phases, Ca(OH)2 and C–S–H gel, as well as evidence of unhydrated concrete minerals, such as silicon dioxide (a-quartz), calcite (CaCO3), and gypsum (C–S–H).
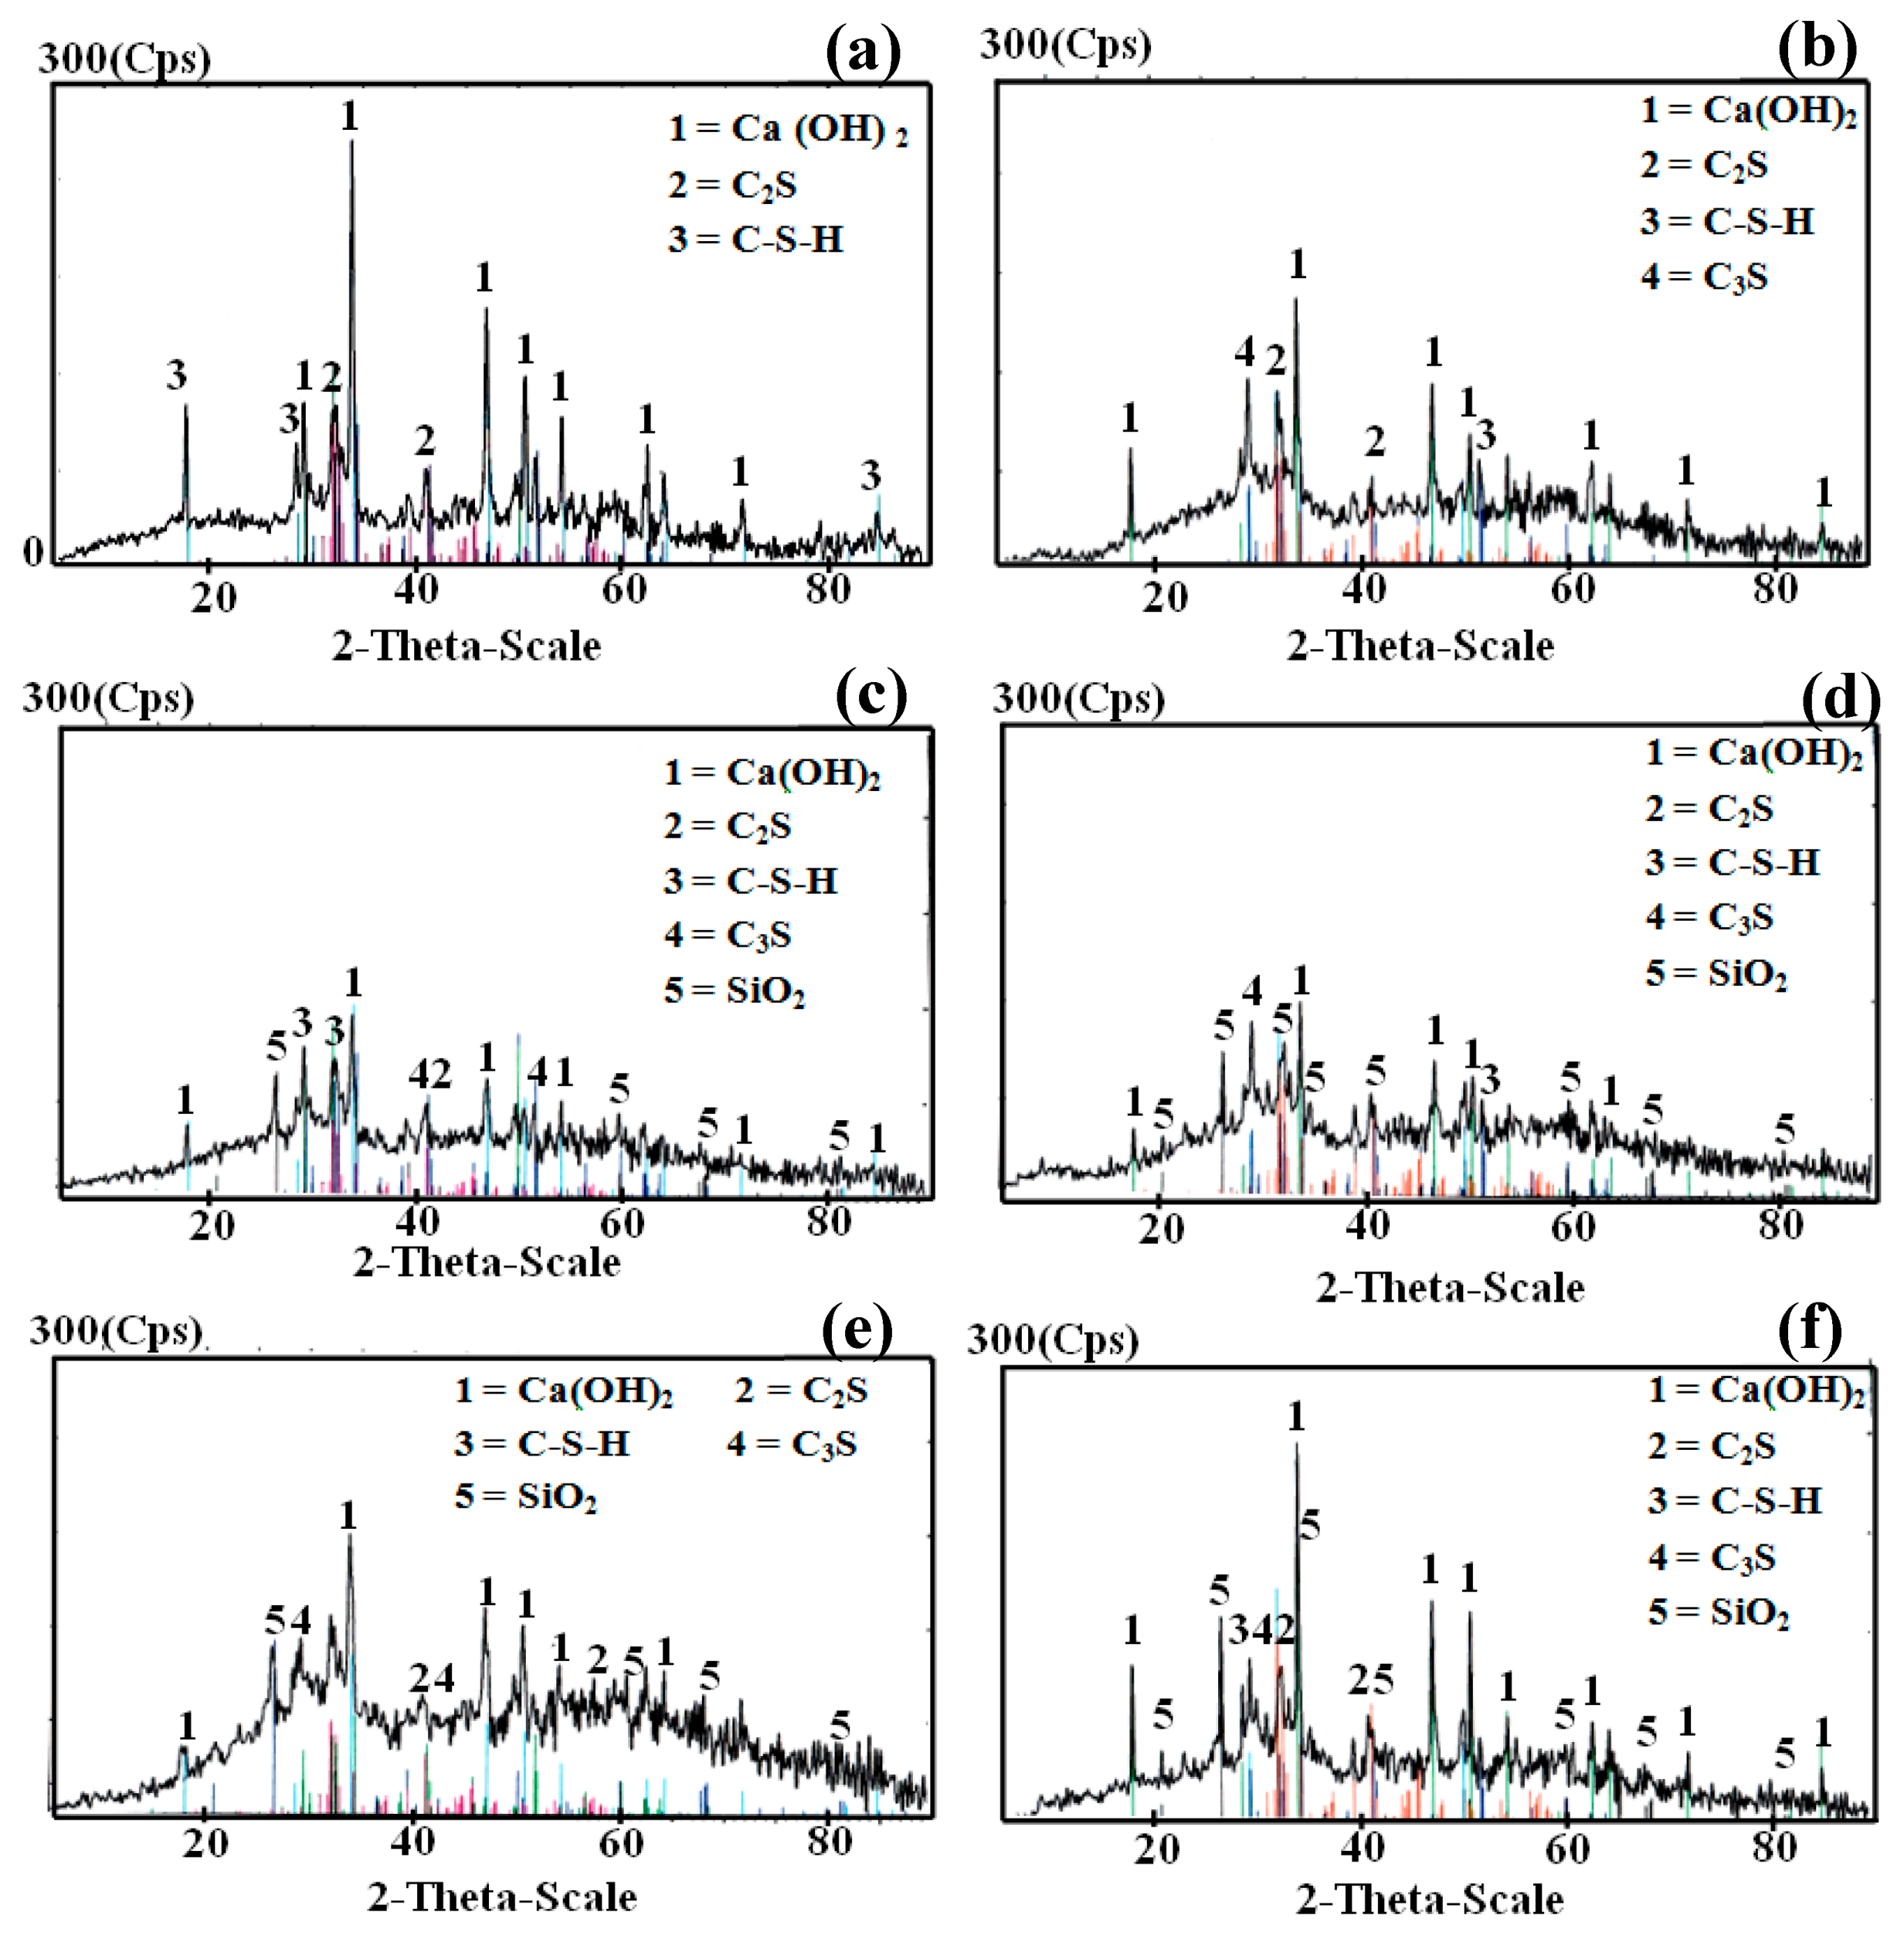
The results of XRD after 28 and 56 days, as shown in Figure 4, show that the intensities of the portlandite of the admixture samples were smaller than that of the control sample, due to the continuous hydration of β-C2S and C3S. Meanwhile, for the control sample, the intensity of the peak characterizing the calcium silicate hydrate (C–S–H) overlapped with that of CaCO3 and increased with the length of time of hydration over the 56 days. The peaks characterizing the calcite (CaCO3) could also be detected in the diffraction patterns and overlapped with those of C–S–H.
Figure 4 shows the XRD patterns of the hardened cement pastes made of the mixtures. Peaks characteristic of calcium silicate hydrates (C–S–H), portlandite (Ca(OH)2), and unhydrated OPC constituents (C3S and β-C2S) could be distinguished. Peaks characterizing the quartz (Q) in fly ash and calcium carbonate were also detected. The intensities of the peak characteristic of portlandite decreased with the partial substitution of OPC with fly ash and silica fume. This was mainly due to the decrease in the amount of Portland cement, which is the main source of portlandite, as well as the pozzolanic reaction of portlandite with fly ash and silica fume [18].
The hardened P-F20S10P0.4 blend after 28 and 56 days indicated the formation of C–S–H and Ca(OH)2 phases as the main hydration products. Peaks characterizing the anhydrous cement clinker (C3S and β-C2S), quartz (Q), and calcium carbonate also appeared in the XRD diffractograms. The intensities of the peaks characterizing C3S and β-C2S decreased in the remaining samples, the intensities of the peaks of the hydration products, mainly calcium silicate hydrates (C–S–H), increased with the increasing length of time of hydration. However, the intensities of the peaks characteristic of free calcium hydroxide decreased with the length of time of hydration. This was due to the enhanced rate of pozzolanic interaction of the released free lime from the OPC hydration with fly ash and silica fume, leading to a marked consumption in the free lime content with the increasing length of time of hydration. The results show that specimen F20S10P0.4 showed the best XRD patterns. This indicates that the sample with the optimal mixture composition consisted of 20% fly ash, 10% silica fume, and 0.4% superplasticizer.

3.3.3. SEM Results

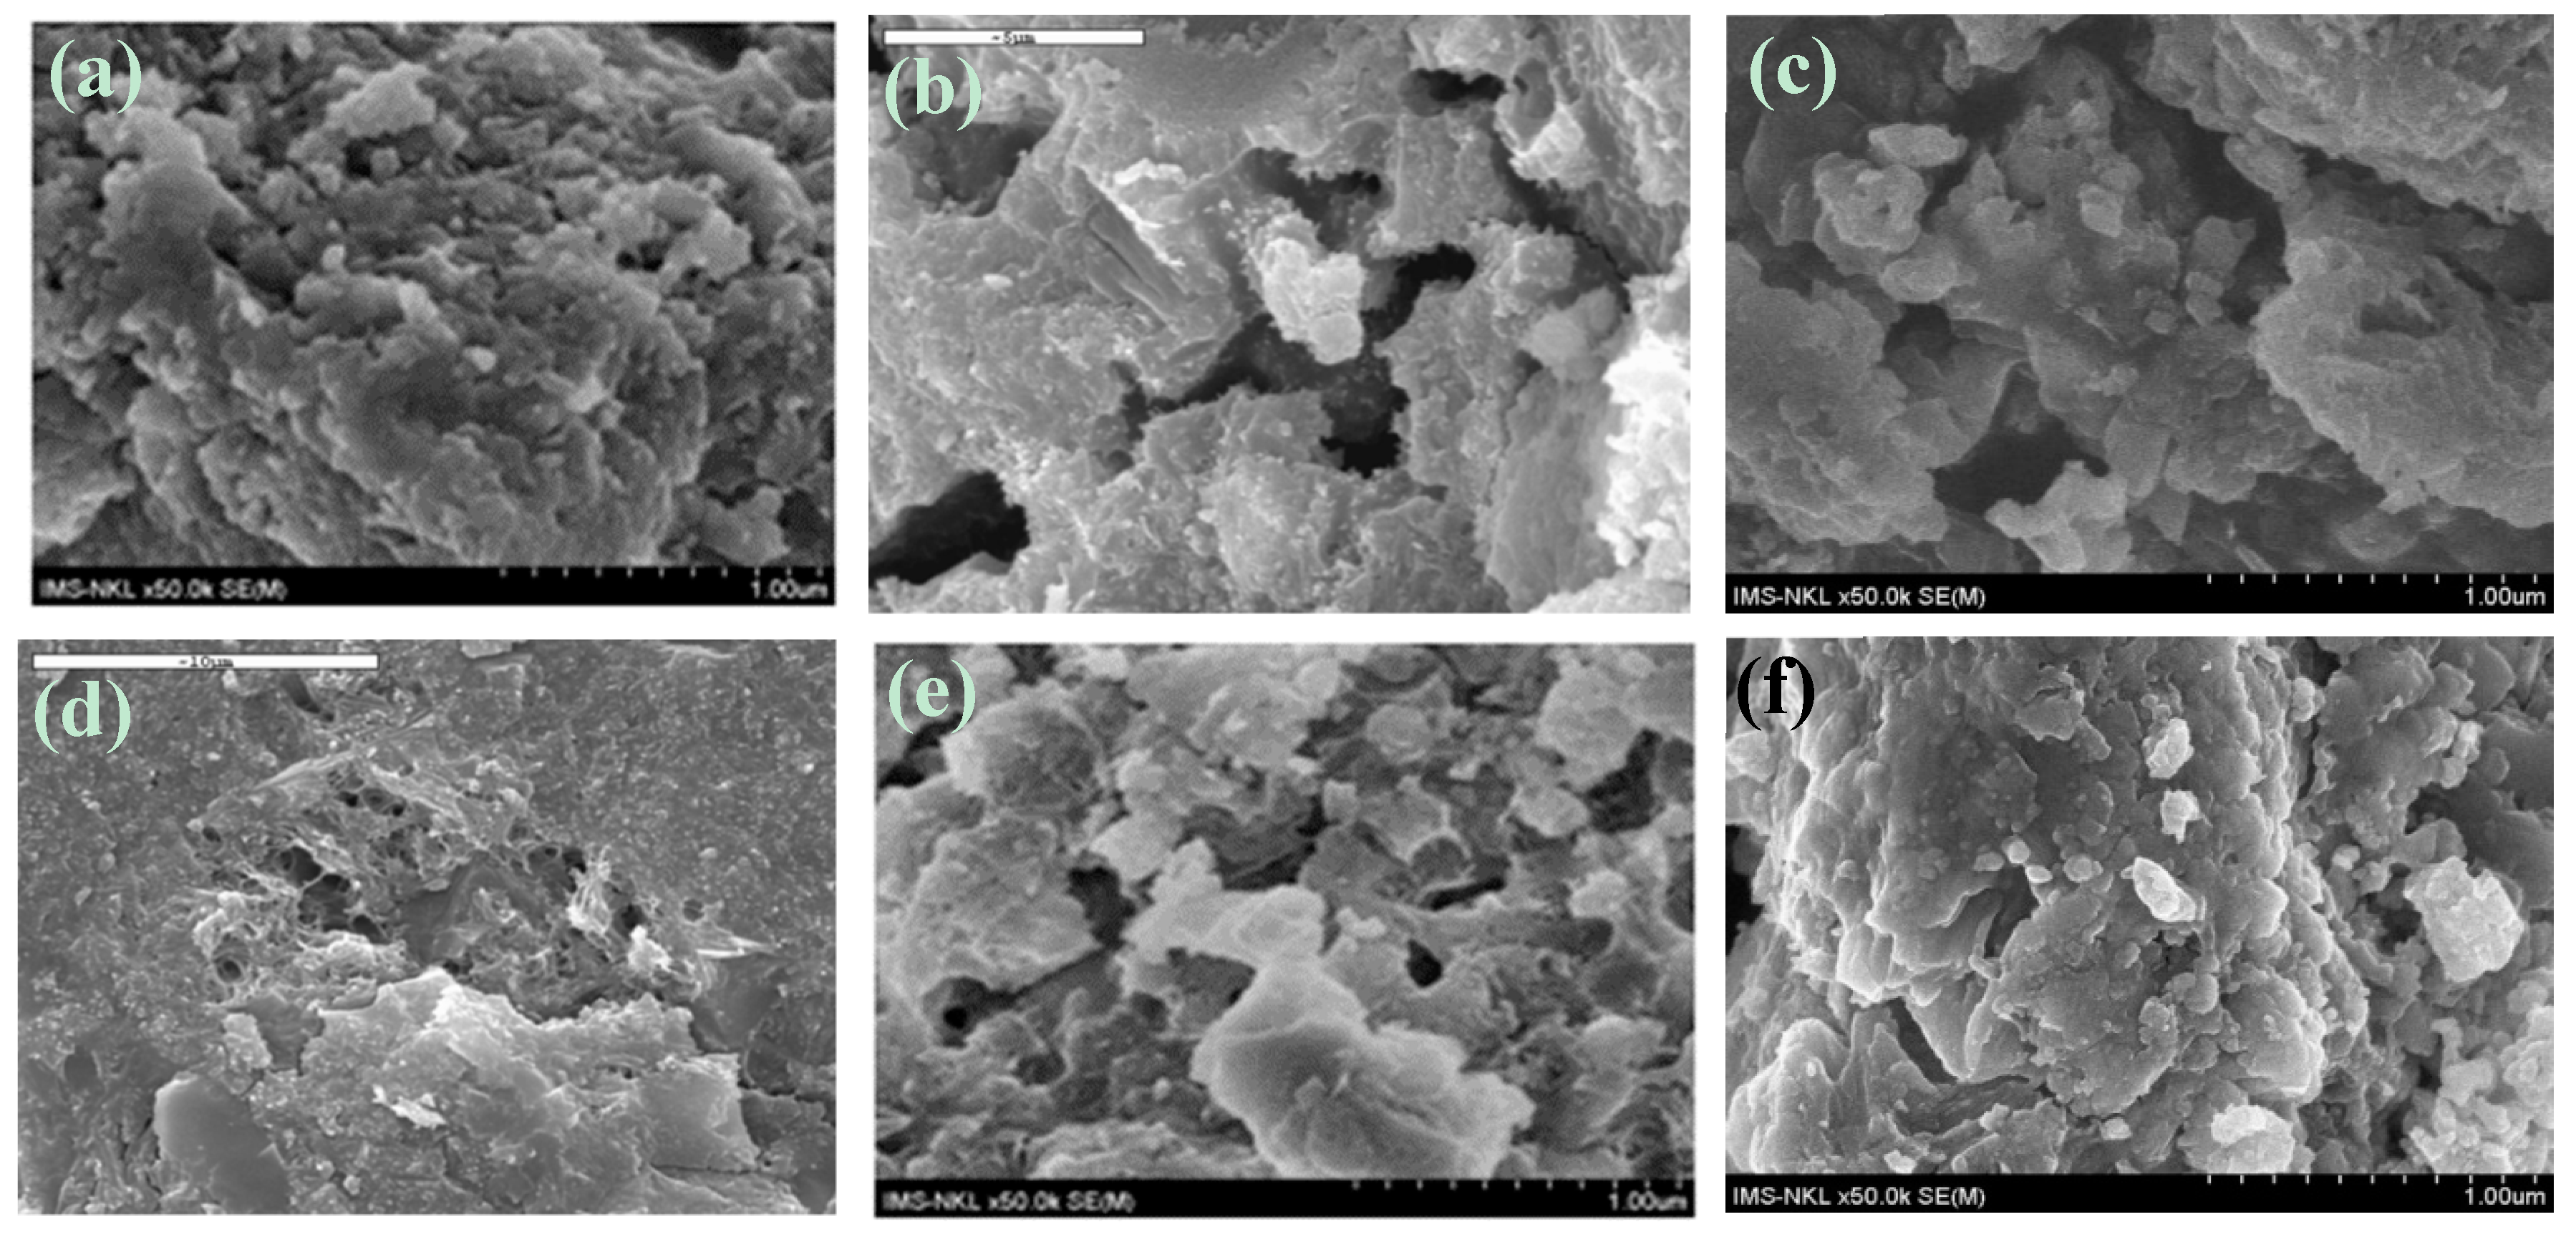
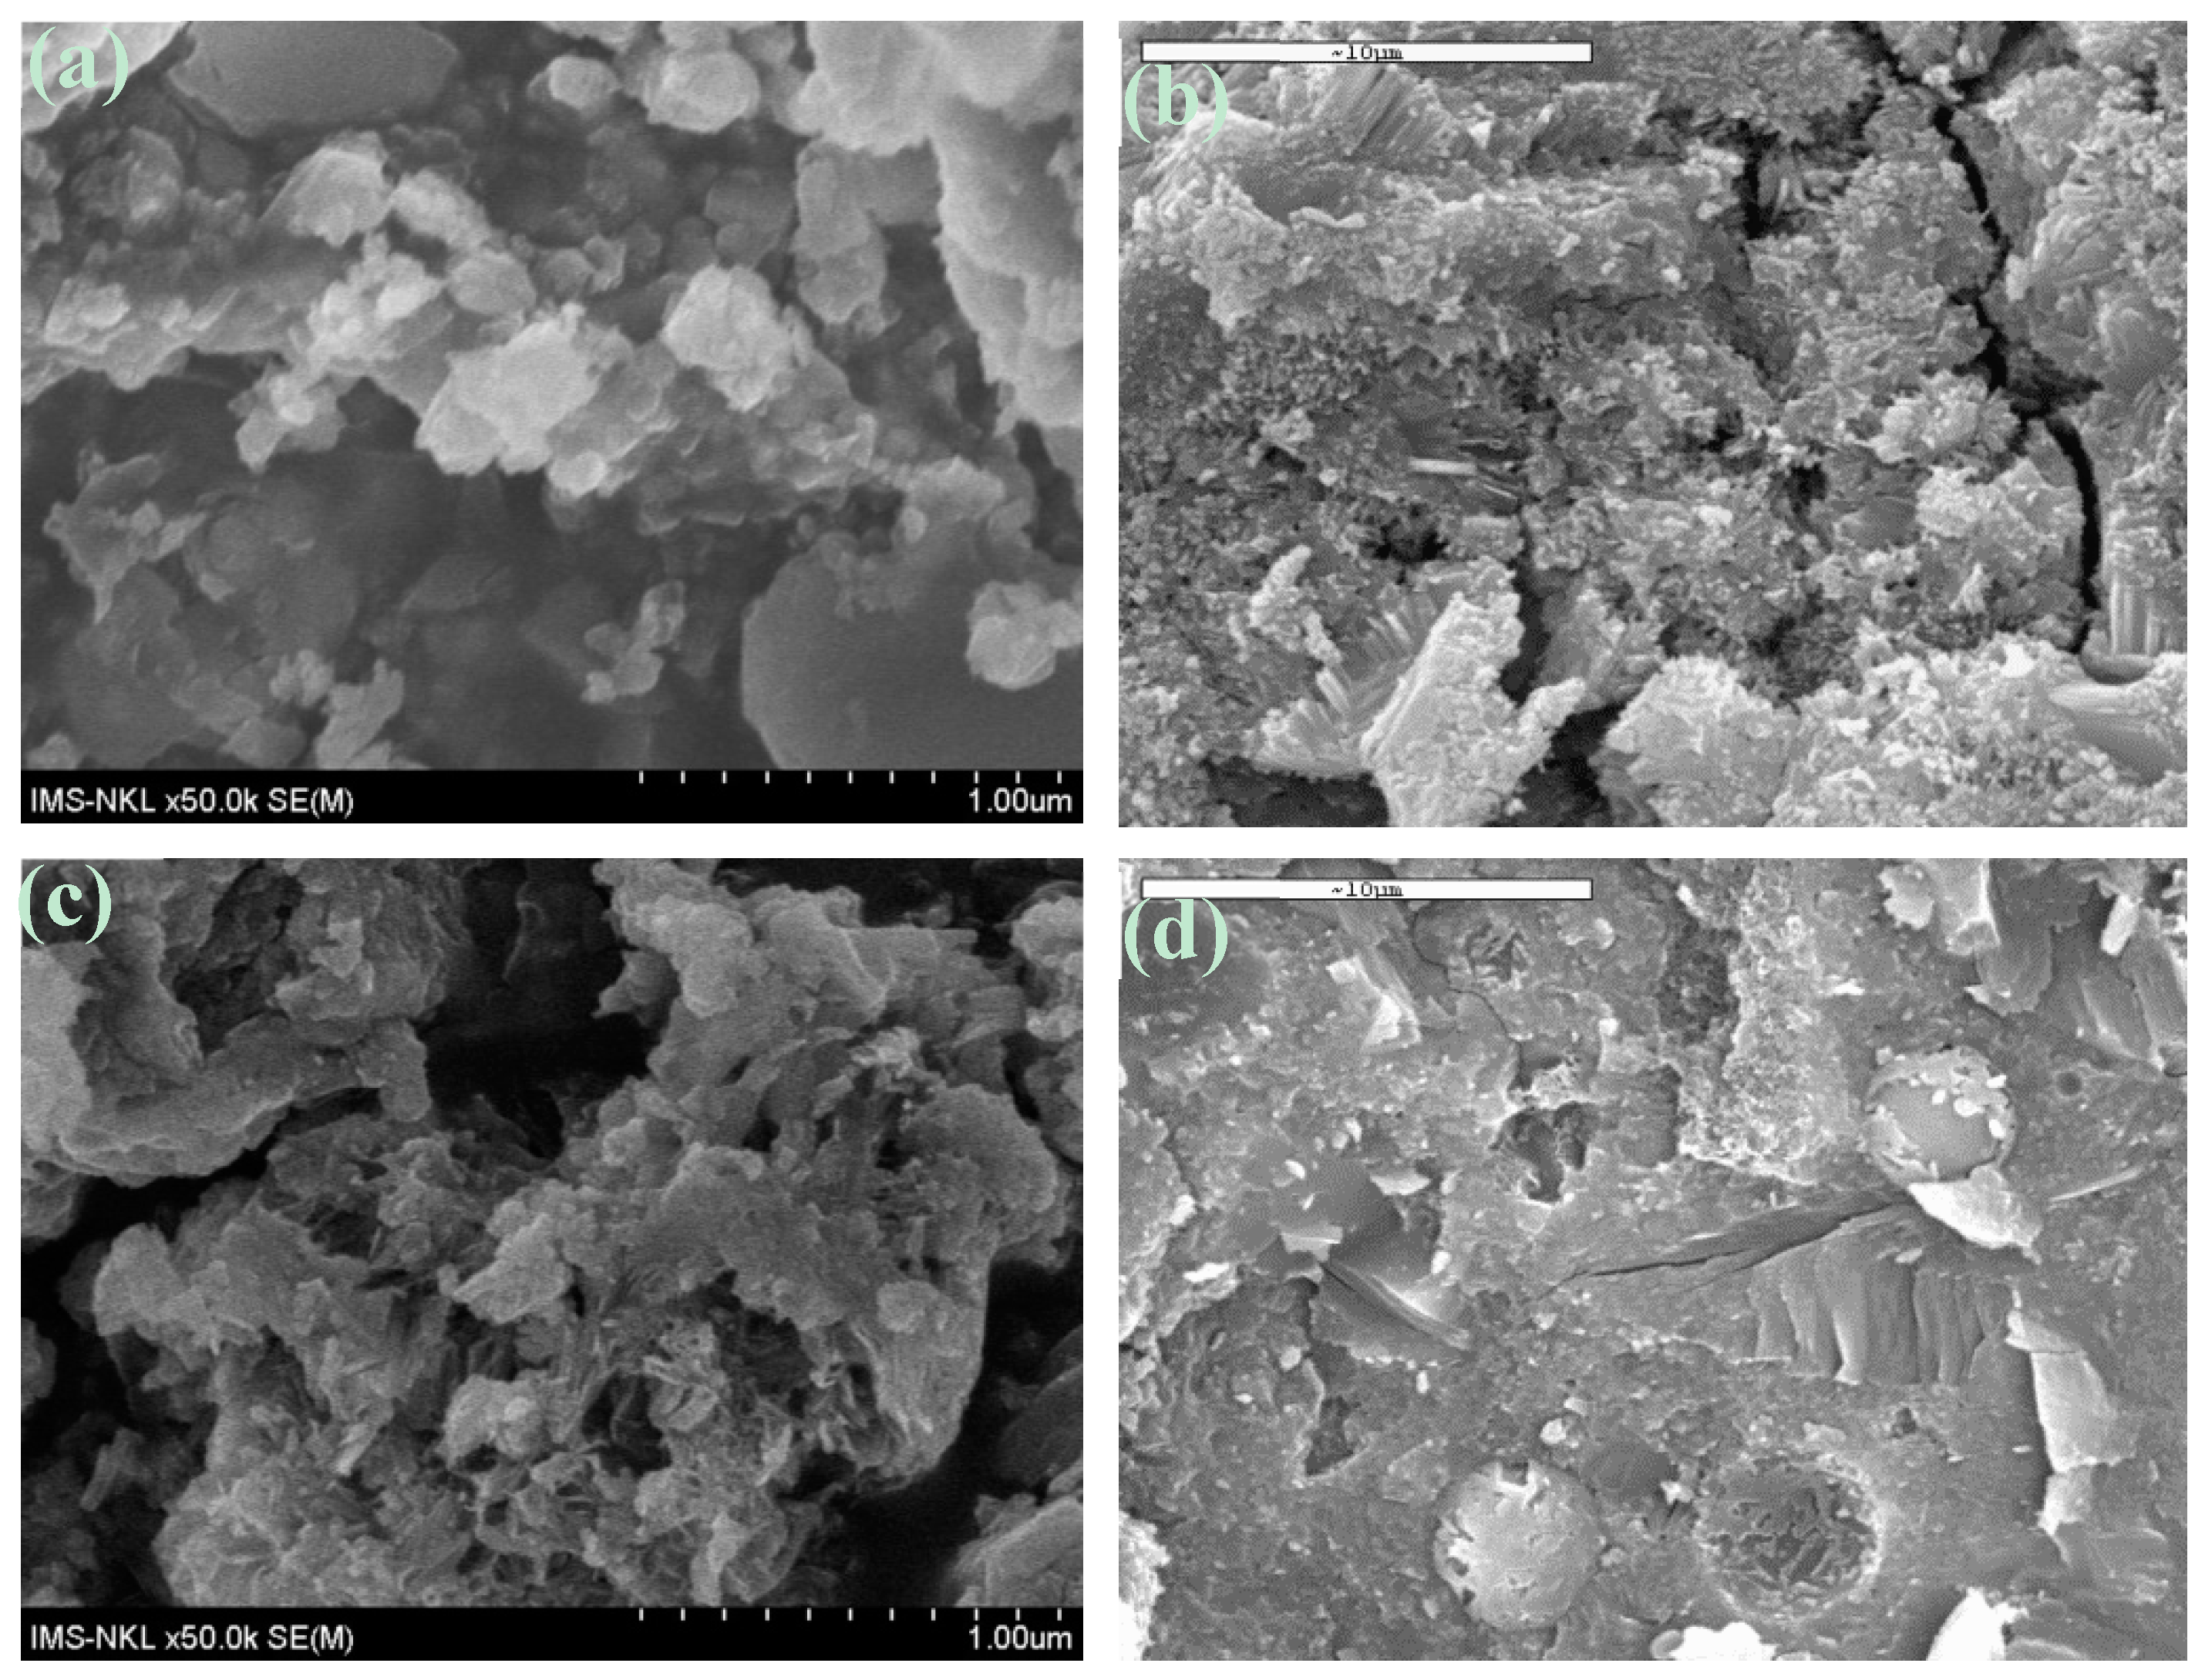
The hydration products, ettringite, calcium silicate hydrate (C–S–H), and calcium hydroxide Ca(OH)2, of some of the samples were easily visible after 28 days and 56 days of curing in water (Figure 5 and Figure 6). Ca(OH)2 of the admixture samples was still observed but to a lesser extent than in the control sample. Furthermore, samples containing silica fume had reduced Ca(OH)2 content. This was due to the pozzolanic reaction that occurred between silica fume and Ca(OH)2. At a much higher magnification, parts of the C–S–H phase were found to be filled with silica fume particles in the pores between C–S–H phases (silica fume particles are shown having a spherical shape).
Microstructural images of the samples after 28 days show multiple porosity, and the cohesion of formed substances was discrete in all the samples (Figure 5a,c,e and Figure 6a,c). However, up to 56 days, the control sample showed cracks in its structure, whereas the structure of the admixture samples was more evenly distributed and continuously solid than that of the control sample. After 56 days of curing, samples with only fly ash added (30% fly ash, Figure 5b) showed significantly reduced cracking as compared with the control without admixture (Figure 6b). However, when 5% of silica fume was replaced with 5% fly ash (F25S5 sample, Figure 5d), the appearance of the pore significantly reduced. Moreover, no pore was visible when the amount of silica fume increased by 10% (F20S10 sample, Figure 6d). However, when the amount of silica fume increased to 15% and the fly ash decreased dramatically to 15% (F15S15 sample, Figure 5f), the pore seemed to reappear. In other words, the consistency of the sample with 10% silica fume was higher than that of the sample with 15% silica fume. Duval and Kadri [27] asserted that the compressive strength of concrete is maximized when silica fume changes from 10% to 15%, because compressive strength is closely related to solidity. In addition, the results of this study are consistent with those of Amarkhail’s study [28] in that 10% silica fume replacement achieved higher compressive strength than concrete with 15% silica fume, although there was no significant difference between them. This is because fly ash and silica fume particles, which are much finer than cement particles, can affect the structure of the pores, as well as reduce both capillary porosity and diffusion in the concrete mix. In addition, fly ash and silica fume, with their cracking properties, reduce the number of cracks.
As a result, after evaluating the microstructural images of the samples, a fly ash replacement rate of 20–25% and a silica fume replacement rate of 5–10% were determined to be optimal. Thus, it was concluded that the P-F20S10P0.4 sample had the best structural integrity based on its SEM image (Figure 6).

3.4. Results of Field Experiments

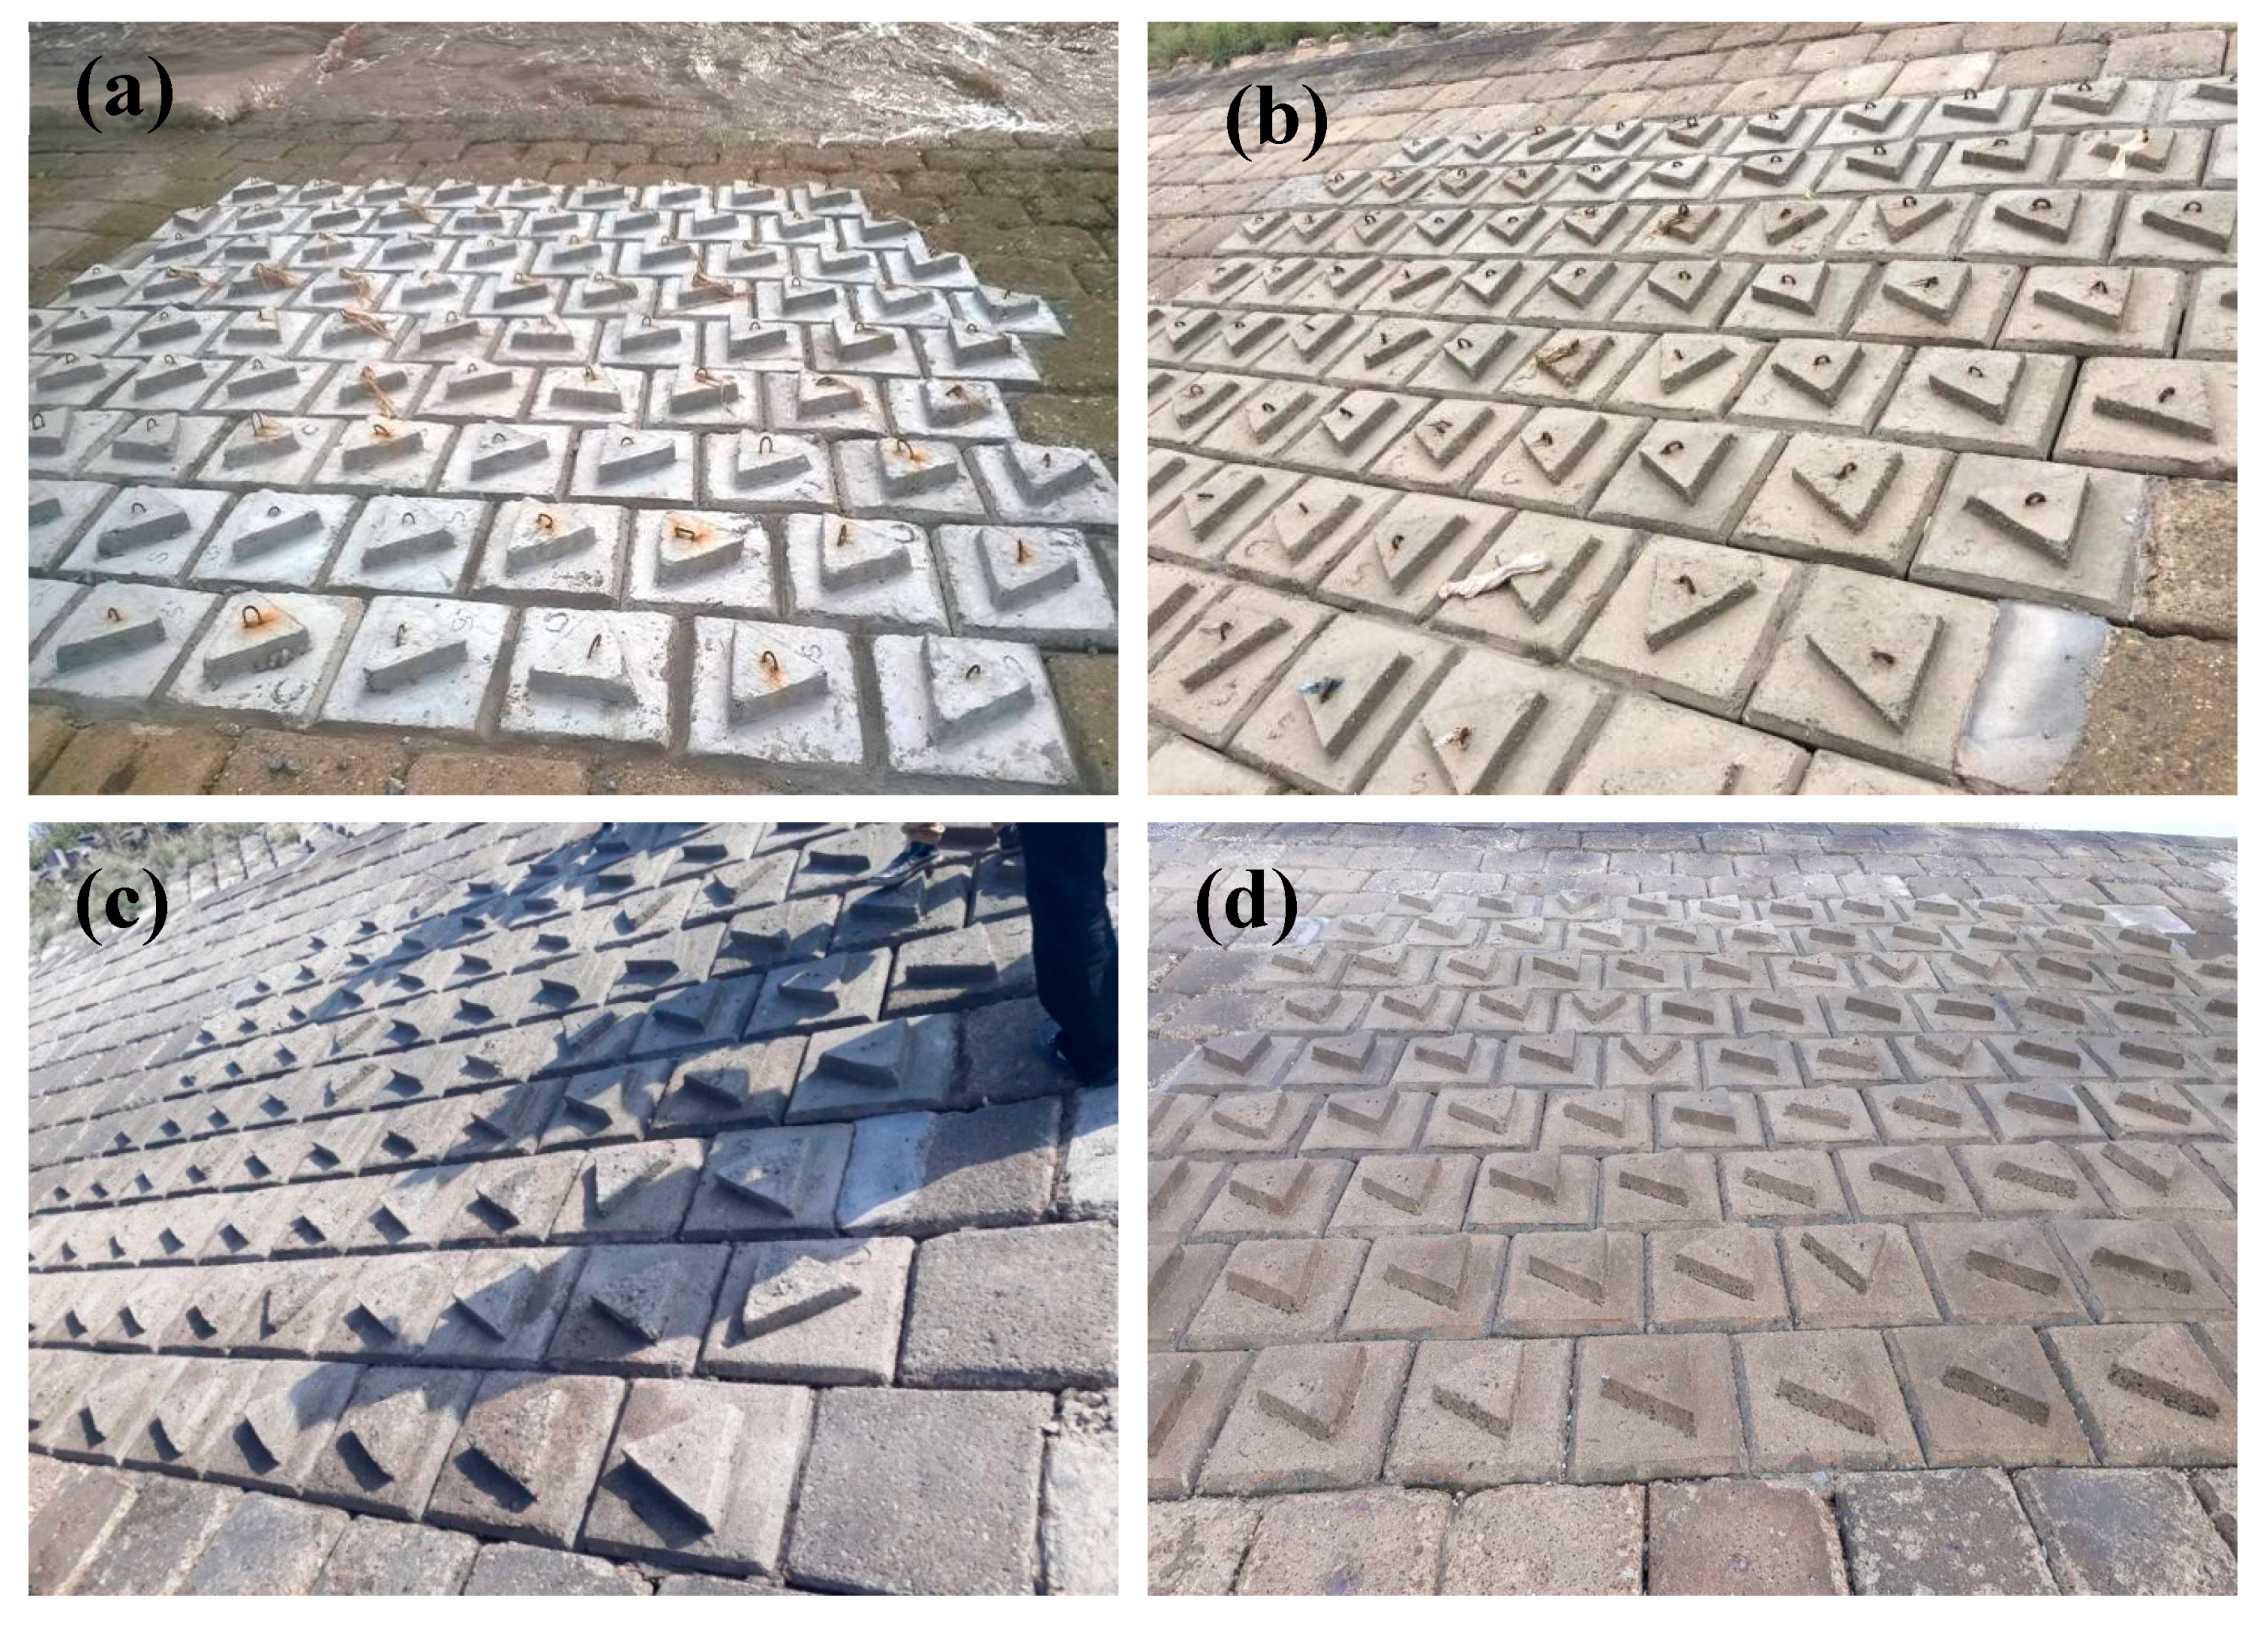
The studied dykes are strongly affected by waves and tides. One hundred old components were replaced by 50 components without admixture (C-F0S0P0) and 50 components with 20% fly ash, 10% silica fume, and 0.4% plasticizer (C-F20S10P0.4). The compressive strength was measured after setting and after 6, 12, 18, 24, 36, and 48 months in a tropical climate in Vietnam.
The replacement components were inspected every six months by non-destructive methods, such as guns and ultrasound, which determined the compressive strength, and in combination with direct observation to evaluate the process of corrosion. Specifically, the experiment was performed with four fixed components in class F0S0P0 and four components in class F20S10P0.4, and each component had two components located in the middle of the body of the embankment and two components located lower in the embankment. Images of the field experiments are shown in Figure 7. At installation, the components without admixture had a compressive strength of 26.4–27 MPa (average 26.6 MPa), which was lower than the compressive strength of the components with admixture at 36.9–37.5 MPa (average 37.1 MPa). Figure 8a shows the difference in compressive strength between the old components without admixture and the new components with admixture.
The components with admixture demonstrated very little compressive strength reduction (at most from 37.1 to 36.2 MPa—a reduction of 0.9 MPa after 4 years). The surfaces of the components with admixture showed no signs of deterioration or changes from the original (Figure 8b). At the same time, the components without admixture exhibited degradation intensity at a faster rate (at most from 26.6 to 21.6 MPa—a decrease of 5 MPa after 4 years) and showed signs of corrosion and surface erosion more clearly. Thus, after 4 years, it was found that the compressive strength of the control samples was reduced by about 18.8%, whereas the compressive strength of the F20S10P0.4 samples was very slightly decreased by about 2.4% under the same climate conditions.
As a result, the experimental results in the laboratory and field initially showed the effectiveness of the combination of the admixture in improving the compressive strength and durability of the sea dyke protection structures when these structures were impacted by strong waves and the ebb and flow of the tides. However, there must be a longer follow-up in order to reach a conclusion on the true effectiveness of this concrete mixture.
The compressive strength of the samples with the mineral admixture showed a very nominal difference: the surfaces of these samples showed no signs of deterioration or changes as compared with the original. At the same time, the samples without mineral admixture exhibited degraded strength at a faster rate and showed significant abrasion wear on their surfaces.
The iron pieces, which were used to transport and install the components, were gradually eroded over time. Thereby, it was found that the location of the field test was completely reasonable in that the tide rose and fell in this area, the study area was greatly impacted by waves, and it was affected by a tropical climate with high humidity and high temperatures. Moreover, every year, this area suffers from many big storms. Thus, this study showed the effect of using fly ash and silica fume in structural concrete on the coast, particularly in a tropical sea area.

4. Conclusions

This paper presents an experimental study on the effect of fly ash and silica fume on the properties of cement paste with various percentages of fly ash and silica fume in order to determine the optimum proportion of these materials with respect to durability. On the basis of the obtained results, the following conclusions can be drawn:
(1)
Using plasticizer, as well as partial replacement of ordinary Portland cement with fly ash and silica fume, led to an improvement of the physical-micro-structural properties and durability of the hardened cement pastes.
(2)
The water demand increased as the content of silica fume increased and decreased with the increasing fly ash content.
(3)
The incorporation of fly ash and silica fume was found to decrease the chloride ion and sulfate ion concentration.
(4)
The microstructure analysis shows that the total porosity values of the hardened OPC–FA–SF blended cement pastes were higher than those of the neat cement paste at the early and intermediate periods of hydration (up to 56 days) and became close to, or even lower than (in the case of some cement blends), the neat OPC paste. In general, the total porosity of all of the blended cement pastes decreased with the length of time of hydration.
(5)
The optimal mixture composition was that with 20% fly ash, 10% silica fume, and 0.4% plasticizer.
(6)
The results of field tests in Vietnam in a tropical climate (high heat and humidity) after 4 years of operation showed that the components using admixture had better mechanical properties and less degradation than the control components.

Author Contributions

Conceptualization, T.X.H.C., J.Z., D.C., and T.T.H.N.; data curation, T.X.H.C. and T.T.H.N.; formal analysis, T.X.H.C. and T.T.H.N.; methodology, T.X.H.C., J.Z., D.C., and T.T.H.N.; visualization, T.X.H.C.; writing—original draft, T.X.H.C.; writing—review and editing, T.X.H.C., E.E., and V.T.T.

Funding

This research received no external funding.

Acknowledgments

This study was supported by the College of Harbor, Coastal and Offshore Engineering, Hohai University, Nanjing, Jiangsu, 210098, China and Thuyloi University, 175 Tay Son, Dongda, Hanoi 100000, Vietnam.

Conflicts of Interest

The authors declare no conflicts of interest.

Data Availability

The datasets used to support the findings of this study are available from the corresponding author upon request.

References

  1. Hanh, D.K.; Hien, D.T. Corrosion status of reinforced concrete and resistance corrosion solution for reinforced concrete structures in the Vietnam marine environment. J. Sci. Technol. Water Resour. Environ. Vietnam 2011, 32, 44–49. [Google Scholar]
  2. Bakharev, T. Geopolymeric materials prepared using Class F fly ash and elevated temperature curing. Cem. Concr. Res. 2005, 35, 1224–1232. [Google Scholar] [CrossRef]
  3. Rashad, A.M.; Khalil, M.H. A preliminary study of alkali-activated slag blended with silica fume under the effect of thermal loads and thermal shock cycles. Constr. Build. Mater. 2013, 40, 522–532. [Google Scholar] [CrossRef]
  4. Rashad, A.M. An exploratory study on high-volume fly ash concrete incorporating silica fume subjected to thermal loads. J. Clean. Prod. 2015, 87, 735–744. [Google Scholar] [CrossRef]
  5. Anilkumar, P.M.; Raghavendra, M.; Sudhakumar, J. Effects of silica fume and fly ash on durability characteristics of high-performance concrete. Int. J. Emerg. Technol. Adv. Eng. 2014, 4, 298–303. [Google Scholar]
  6. García-taengua, E.; Sonebi, M.; Hossain, K.M.A.; Lachemi, M.; Khatib, J. Effects of the addition of nanosilica on the rheology, hydration and development of the compressive strength of cement mortars. Compos. Part B 2015, 81, 120–129. [Google Scholar] [CrossRef]
  7. Jalal, M.; Pouladkhan, A.; Harandi, O.F.; Jafari, D. Comparative study on effects of Class F fly ash, nano silica and silica fume on properties of high-performance self-compacting concrete. Construct. Build. Mater. 2015, 94, 90–104. [Google Scholar] [CrossRef]
  8. Sabet, F.A.; Libre, N.A.; Shekarchi, M. Mechanical and durability properties of self-consolidating high-performance concrete incorporating natural zeolite, silica fume and fly ash. Construct. Build. Mater. 2013, 44, 175–184. [Google Scholar] [CrossRef]
  9. Neville, A. Properties of Concrete, 4th ed.; Addison Wesley Longman Limited: London, UK, 1997. [Google Scholar]
  10. Thomas, M.D.A.; Hooton, R.D.; Scott, A.; Zibara, H. The effect of supplementary cementitious materials on chloride binding in hardened cement paste. Cem. Concr. Res. 2012, 42, 1–7. [Google Scholar] [CrossRef]
  11. Florea, M.V.A.; Brouwers, H.J.H. Chloride binding related to hydration products: Part I: Ordinary Portland Cement. Cem. Concr. Res. 2012, 42, 282–290. [Google Scholar] [CrossRef]
  12. Chandra, L.; Hardjito, D. The impact of using fly ash, silica fume and calcium carbonate on the workability and compressive strength of mortar. Procedia Eng. 2015, 125, 773–779. [Google Scholar]
  13. Leung, H.Y.; Kim, J.; Nadeem, A.; Jagannathan, J.; Anwar, M.P. Sorptivity of self-compacting concrete containing fly ash and silica fume. Construct. Build. Mater. 2016, 113, 369–375. [Google Scholar] [CrossRef] [Green Version]
  14. Benli, A.; Karataş, M.; Gurses, E. Effect of seawater and MgSO4 solution on the mechanical properties and durability of self-compacting mortars with fly ash/silica fume. Construct. Build. Mater. 2017, 146, 464–474. [Google Scholar] [CrossRef]
  15. Shekarchi, M.; Rafiee, A.; Layssi, H. Long-term chloride diffusion in silica fume concrete in harsh marine climates. Cem. Concr. Res. 2009, 31, 769–775. [Google Scholar] [CrossRef]
  16. Chalee, W.; Ausapanit, P.; Jaturapitakkul, C. Utilization of fly ash concrete in the marine environment for long term design life analysis. Mater. Design 2010, 31, 1242–1249. [Google Scholar] [CrossRef]
  17. Taylor, H.F.W.; Turner, A.B. Reactions of tricalcium silicate paste with organic liquids. Cem. Concr. Res. 1987, 17, 613–623. [Google Scholar] [CrossRef]
  18. Abo-El-Enein, S.A.; El-kady, G.; El-Sokkary, T.M.; Gharieb, M. Physico-mechanical properties of composite cement pastes containing silica fume and fly ash. Hbrc J. 2015, 11, 7–15. [Google Scholar] [CrossRef] [Green Version]
  19. Alonso, J.; Wesche, K. Characterization of Fly Ash. Fly Ash in Concrete; Taylor and Francis: London, UK, 1991; pp. 3–23. [Google Scholar]
  20. Helmuth, R.A. Fly ash in cement and concrete, Portland cement association. Cem. Concr. Res. 1987, 30, 201–204. [Google Scholar]
  21. Nochaiya, T.; Wongkeo, W.; Chaipanich, A. Utilization of fly ash with silica fume and properties of Portland cement—Fly ash–silica fume concrete. Fuel 2010, 89, 768–774. [Google Scholar] [CrossRef]
  22. Dinakar, P.; Babu, K.G.; Santhanam, M. Durability properties of high volume fly ash self-compacting concrete. Cem. Concr. Compos. 2008, 30, 880–886. [Google Scholar] [CrossRef]
  23. Yerramala, A.; Ganesh Babu, K. Transport properties of high volume fly ash roller compacted concrete. Cem. Concr. Compos. 2011, 33, 1057–1062. [Google Scholar] [CrossRef]
  24. Uysal, M.; Akyuncu, V. Durability performance of concrete incorporating Class F and Class C fly ashes. Construct. Build. Mater. 2012, 34, 170–178. [Google Scholar] [CrossRef]
  25. Aitcin, P.; Pigeon, M.; Pleau, R.; Malier, R.; Gagne, Y. Durability of high performance concretes. High-Performance Concrete. In From Material to Structure; E&FN Spon: London, UK, 1992; pp. 239–251. [Google Scholar]
  26. EI-Didamony, H.; Helmy, I.; Mostafa, K. Durability of sulfate resisting slag blended cement and mortars in sea water. Indian J. Eng. Mater. Sci. 1996, 3, 35–40. [Google Scholar]
  27. Duval, R.; Kadri, E. Influence of Silica Fume on the Workability and the Compressive Strength of High-Performance Concretes. Cem. Concr. Res. 1998, 28, 533–547. [Google Scholar] [CrossRef]
  28. Amarkhail, N. Effects of silica fume on properties of high-strength concrete. Int. J. Tech. Res. Appl. 2015, 32, 13–19. [Google Scholar]
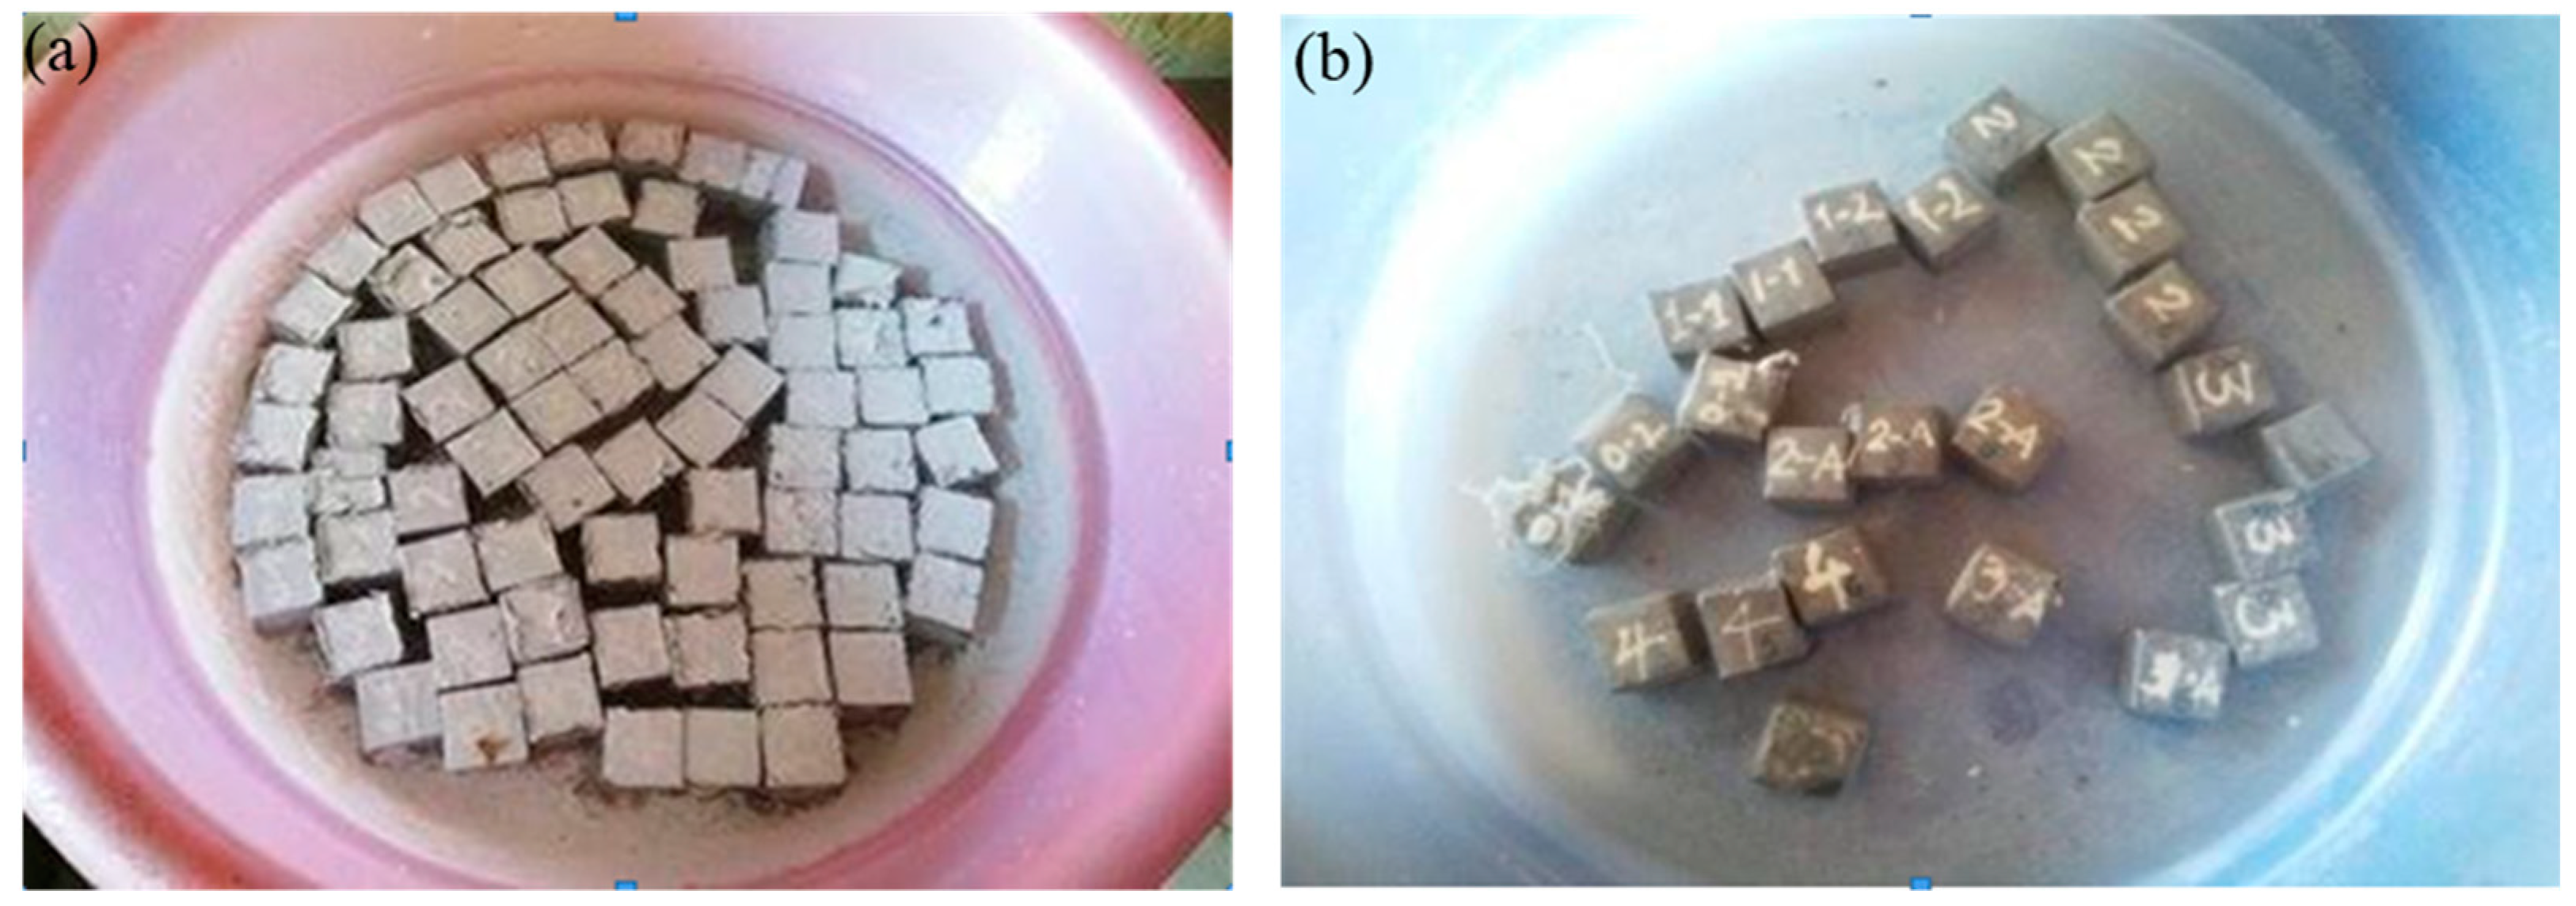
Figure 1. Cement paste specimens of the chloride and sulfate ion permeability tests: (a) specimens soaked in 10% MgSO4 solution and (b) specimens soaked in seawater.
Jmse 07 00245 g001
Figure 2. The components as prepared: (a) dimension of component (cm), (b) image of components, and (c) replacing components.
Jmse 07 00245 g002
Figure 3. (a) Water demand for cement paste specimens and (b) the amount of chloride ion and SO3 content of the samples.
Jmse 07 00245 g003
Figure 4. X-ray diffraction (XRD) of cement paste specimens: (a) P-F0S0P0, 28 days; (b) P-F0S0P0, 56 days; (c) P-F20S10P0.4, 28 days; (d) P-F20S10P0.4, 56 days; (e) P-F30S0P0.4, 28 days; and (f) P-F30S0P0.4, 56 days. 1: portlandite Ca(OH)2; 2: larnite Ca2SiO4; 3: calcium silicate hydrate Ca·5SiO3·5H2O; 4: calcium silicate Ca3SiO5; 5: quartz SiO2; 6: ettringite Ca6Al2(SO4)3(OH)12·26H2O.
Jmse 07 00245 g004
Figure 5. Scanning electron microscope (SEM) of cement paste specimens: (a) P-F30S0P0.4, 28 days; (b) P-F30S0P0.4, 56 days; (c) P-F25S5P0.4, 28 days; (d) P-F25S5P0.4, 56 days; (e) P-F15S15P0.4, 28 days; and (f) P-F15S15P0.4, 56 days.
Jmse 07 00245 g005
Figure 6. SEM of cement paste specimens: (a) P-F0S0P0, 28 days; (b) P-F0S0P0, 56 days; (c) P-F20S10P0.4, 28 days; and (d) P-F20S10P0.4, 56 days.
Jmse 07 00245 g006
Figure 7. Field test: (a) after setting, (b) after 2 years, (c) after 3 years, and (d) after 4 years.
Jmse 07 00245 g007
Figure 8. Field test: (a) average compressive strength in the field experiment and (b) the surface of the components after use for 4 years.
Jmse 07 00245 g008
Table 1. The material properties.
PropertiesCementFly AshSilica FumeFine AggregateCoarse Aggregate
Specific density (g/cm3)3.132.302.102.682.76
Bulk density (kg/m3)-1084.00925.001580.001450.00
Percentage of bulking (%)---41.0046.90
Humidity (%)---3.800.70
Percentage of lumps (%)---0.870.45
Fineness modulus (%)0.20 2.42-
Table 2. The main chemical compositions of cement, fly ash, and silica fume (%).
ComponentsCementFly AshSilica Fume
(%)(%)(%)
SiO220.5985.1093.45
Fe2O31.091.750.52
Al2O33.159.870.92
CaO67.441.091.57
SO31.790.100.63
Table 3. The mix proportions of the paste specimens.
Sample CodePCFASFWSample CodePCFASFW
(g)(g)(g)(g)(g)(g)(g)(g)(g)(g)(g)(g)
P-F0S0P0050000142.5P-F20S10P0.31.535010050129.0
P-F30S0P003501500140.0P-F15S15P0.31.53507575132.5
P-F25S5P0035012525142.5P-F0S0P0.42.050000120.0
P-F20S10P0035010050147.5P-F30S0P0.42.03501500117.5
P-F15S15P003507575150.0P-F25S5P0.42.035012525120.0
P-F0S0P0.31.550000124.0P-F20S10P0.42.035010050122.5
P-F30S0P0.31.53501500121.5P-F15S15P0.42.03507575125.0
P-F25S5P0.31.535012525125.0
Table 4. The mix proportions of concrete specimens.
Sample SymbolsQuantity of Materials for Concrete (kg/m3)w/b
FASFPCFine AggregateCoarse AggregateBW
C-F0S0P000029868412362981800.6
C-F20S10P0.463321.2722165412193161550.49
(FA: fly ash; SF: silica fume; P: plasticizer; C: cement; B: binder; w: water; w/b: water/binder).
Table 5. The content of portlandite and C–S–H in the hardened cement estimated from the thermogravimetric analysis (TGA) results.
Sample Code400–600 °C (Ca(OH)2)600–800 °C (C–S–H)
28 Days56 Days28 Days56 Days
P-F0S0P04.093.562.552.56
P-F30S0P0.42.361.763.703.78
P-F25S5P0.42.422.263.343.39
P-F20S10P0.42.031.463.623.85
P-F15S15P0.42.561.983.553.73