Article

A Fuzzy-Based Decision-Making Model for Improving the Carrying Capacity of Ship Locks: A Three Gorges Dam Case

1
School of Automation, Wuhan University of Technology, Wuhan 430000, China
2
Intelligent Transportation Systems Research Center, Wuhan University of Technology, Wuhan 430063, China
3
National Engineering Research Center for Water Transport Safety, Wuhan 430063, China
4
School of Engineering, Aalto University, Espoo FI-00076, Finland
5
School of Navigation, Wuhan University of Technology, Wuhan 430063, China
*
Author to whom correspondence should be addressed.
J. Mar. Sci. Eng. 2019, 7(8), 244; https://doi.org/10.3390/jmse7080244
Submission received: 18 June 2019 / Revised: 16 July 2019 / Accepted: 25 July 2019 / Published: 27 July 2019
(This article belongs to the Section Ocean Engineering)

Abstract

:
This paper develops a decision-making model to assist the improvement of the carrying capacity of ship locks by combing fuzzy logic, the analytic hierarchy process (AHP) method, and the technique for order preference by similarity to an ideal solution (TOPSIS). A three-level hierarchical structure is constructed to identify the key factors influencing the carrying capacity of ship locks from the aspects of ship locks, vessels, environment, and administration. On this basis, a series of targeted strategies have been put forward to improve the carrying capacity of ship locks, and the TOPSIS method is applied to rank these strategies in terms of their performance. A case study of the five-stage dual-track ship lock of the Three Gorges Dam in China has been conducted to demonstrate the feasibility and rationality of the proposed model, and correlation analysis is conducted to verify the identified influencing factors in order to eliminate potential bias which may be generated from using AHP. The results obtained from the proposed methods are consistent with the real-life situation to a certain extent, indicating that the proposed method can provide a useful reference for improving the carrying capacity of ship locks.

1. Introduction

Maritime transportation is at the core of international trade due to its outstanding advantages compared to other transport modes, accounting for around 80% of the volume of goods transported around the globe, and this share is estimated to be even higher for most developing countries [1]. As shown in Figure 1, global containerized trade continued to expand after 2009, and reached an expansion rate of nearly 5% in 2017, with volumes attaining an estimated 145 million 20-foot equivalent units (TEUs) [2].
In response to the rapid development of maritime transportation, a series of studies have been conducted to develop innovative models in order to improve the effectiveness of maritime transportation, including berth planning [3,4,5,6,7] and vessel scheduling [8,9], to name but a few. As an important complement to the global maritime transportation system, inland waterway transportation provides a crucial linkage between domestic and international shipping markets, and the boom of inland shipping in recent years further highlights the strategic position of inland waterways such as the Yangtze River—the longest inland river in China [10].
The Three Gorges hydro-junction is located at the Xiling Gorge section of the Three Gorges. It is a key backbone for using the waterway resource of the Yangtze River, which plays an important role in promoting the circulation of nationwide cargos as well as the development of the regional economy [11]. However, the constantly increasing gap between the limited carrying capacity of the Three Gorges Ship Locks and the vigorous transportation demand of ships passing through it is becoming increasingly prominent. Many vessels detained in the lock areas, putting great pressure on the operational management of ship locks. On the other hand, the crowed ships in the lock areas also increase the safety and security risks [12]. Therefore, it is both significant and urgent to solve the problem of ship detention in ship locks. In view of this, this study identifies the factors that influence the carrying capacity of ship locks and the measures their weights according to their impact levels. Some countermeasures are developed to improve the carrying capacity of ship locks, and they are ranked with respect to their effects on the control of each influencing factors. The contributions of this study are two-fold. Firstly, analyzing the reasons for ship detention in ship lock areas is helpful for administrative officers on actively responding to similar situations. Secondly, the proposed countermeasures, as well as the flexible approaches presented in this paper, can be tailored and used to achieve congestion risk reduction in other ship locks to improve the transportation safety and efficiency [13,14].
The rest of this paper is organized as follows. Section 2 reviews the previous studies conducted on carrying capacity improvement of ship locks, and the research related to multiple-criteria decision-making (MCDM) problems to disclose the advantages and explore the applicability of the hybrid method in this study. Section 3 describes the research steps and proposed methods to select suitable countermeasures for ship lock carrying capacity improvement. The feasibility of the proposed approach method is analyzed using a real case study of the ship locks in Three Gorges Dam in Section 4. The findings are discussed in Section 5, and this paper is concluded in Section 6.

2. Literature Review

In this section, the previous studies relating to the carrying capacity of ship locks are reviewed, followed by the introduction of the features and applications of the TOPSIS method.

2.1. Safety and Carrying Capacity of Ship Locks

There were some early studies on guaranteeing the operational safety of ship locks and the emergency response schemes to unexpected incidents, which have been done in Germany, Austria, and other countries in Europe. In Germany, navigational accidents were classified into three categories, namely general, abnormal, and important ones according to the different risk levels. The labors assigned to each type of accident were different according to different accident levels [15]. Normally, two sets of emergency plans would be set, which were internal and external emergency plans, aiming at addressing different aspects of accidents [16]. Taking the safety management of ship locks as an example, external emergency specified tasks such as the rescue measures, the rescue of the persons in charge of the accident, and the communication with rescuers. Meanwhile, the internal emergency plans were mainly used to guide the escape of staff of the ship once an accident occurs [17]. In Austria, management departments keep track of the operational risk status of ship locks and conduct early-warning analysis and risk assessment regularly. Advanced scientific and technological approaches were adopted to adjust emergency response measures according to the actual situation, and targeted measures are taken to reduce operational risks of ship locks [18]. There was also some research related to the safety of the ship locks of the Three Gorges Dam. However, most the current research only put forward some countermeasures to enlarge the carrying capacity of the Three Gorges ship locks in a general level, without assessing the usefulness of different countermeasure, let along the quantitative evaluations [19].
Regarding the carrying capacity of ship locks, two main branches of research can be concluded in previous studies. One branch focused on the operational condition of ship locks and measures the carrying capacity of ship locks by using the calculation model from a macroscopic perspective. They were referred to as quantity-oriented research branch. Whereas, another branch paid more attention to the service quality of ship lock operations. They try to develop the simulation model of ships going through ship locks by using operational data of ship locks, and thus they were regarded as quality-oriented research branch.
In quantity-oriented research, comprehensive influencing factors were generalized to facilitate the calculation of ship lock carrying capacity [20]. The average daily number of times that ships went through ship locks was used to characterize the technical factors and the average lockage tonnage was used to characterize the ship types and their navigating behaviors. Then, the ideal carrying capacity could be calculated as the sum of the product of the average lockage number and the average lockage tonnage. The quality-oriented research emphasized on the service quality of ship locks. In their research, the ship locks were innovatively regarded as one or more service windows, and the whole system was viewed as a queuing system. The waiting time of ships for lockage could then be predicted by using queuing models. In recent years, some researchers realized that the two research branches should not be isolated. On the contrary, both the actual operating conditions of the ship locks and the associated service quality should be considered together from a systematic perspective, taking into account the interests of different stakeholders such as shipping companies and transport management authorities [21,22,23].

2.2. Multiple-Criteria Decision-Making Methods

MCDM plays a critical role in practice, as this kind of problems are frequently encountered in almost every aspect of real life. MCDM methods can be defined as structured frameworks that deal with the process of making decisions in the presence of multiple objectives. They are the methods that used to find the best opinion from all the feasible alternatives in the presence of multiple, usually conflicting, decision criteria. Various methods have been developed to solve MCDM problems, such as analytic hierarchy process (AHP), Technique for Order Preference by Similarity to an Ideal Solution (TOPSIS), and Elimination Et Choice Translating Reality (ELECTRE), to name but a few.
TOPSIS has been applied in various fields including the risk management of waterway congestion, maritime risk analysis [24], and evaluation of supply chain performance [25]. With respect to its application related to the inland waterway transportation, Wan [26] proposed a set of risk control options according to the current development of the Yangtze River and comparatively analyzed the performance of each risk control option under different cost-benefit ratios in order to choose the best one. In the research of [27], an entropy-TOPSIS method is applied to select the railway express freight train service sites and group them into different classes.
In this study, the TOPSIS method is applied to assist the selection of the most suitable carrying capacity improvement (CCI) countermeasures of ship locks due to the following reasons [28]. Firstly, differing from AHP or simple weighted sum methods, TOPSIS prioritize the selections considering two distances. This could be, for instance, the case when the decision-makers seek not only for the maximum effectiveness of carrying capacity improvement of ship locks but above all for the minimum cost to achieve the goal. Secondly, the method is intuitive, as well as easy to be applied in practice. It can also reduce the effect of the decision maker’s subjective point of view. This important to an industrial implementation by ship lock management authorities. Thirdly, it can manage each kind of variables and each type of criteria, to address the rank reversal issue.
Taking all the above into consideration, the limitations of the current research are obvious. Firstly, there are quite a few studies considering the features of traffic flows when analyzing the factors influencing the carrying capacity of ship locks. Besides, there is a lack of quantitative analysis when identifying key factors influencing the carrying capacity of ship locks and proposing relevant countermeasures. Therefore, based one statistical analysis methods, both the identification of key factors and the proposition of CCI schemes are achieved in this study, and the performance of CCI schemes are further evaluated to ensure their effectiveness.

3. Methodology

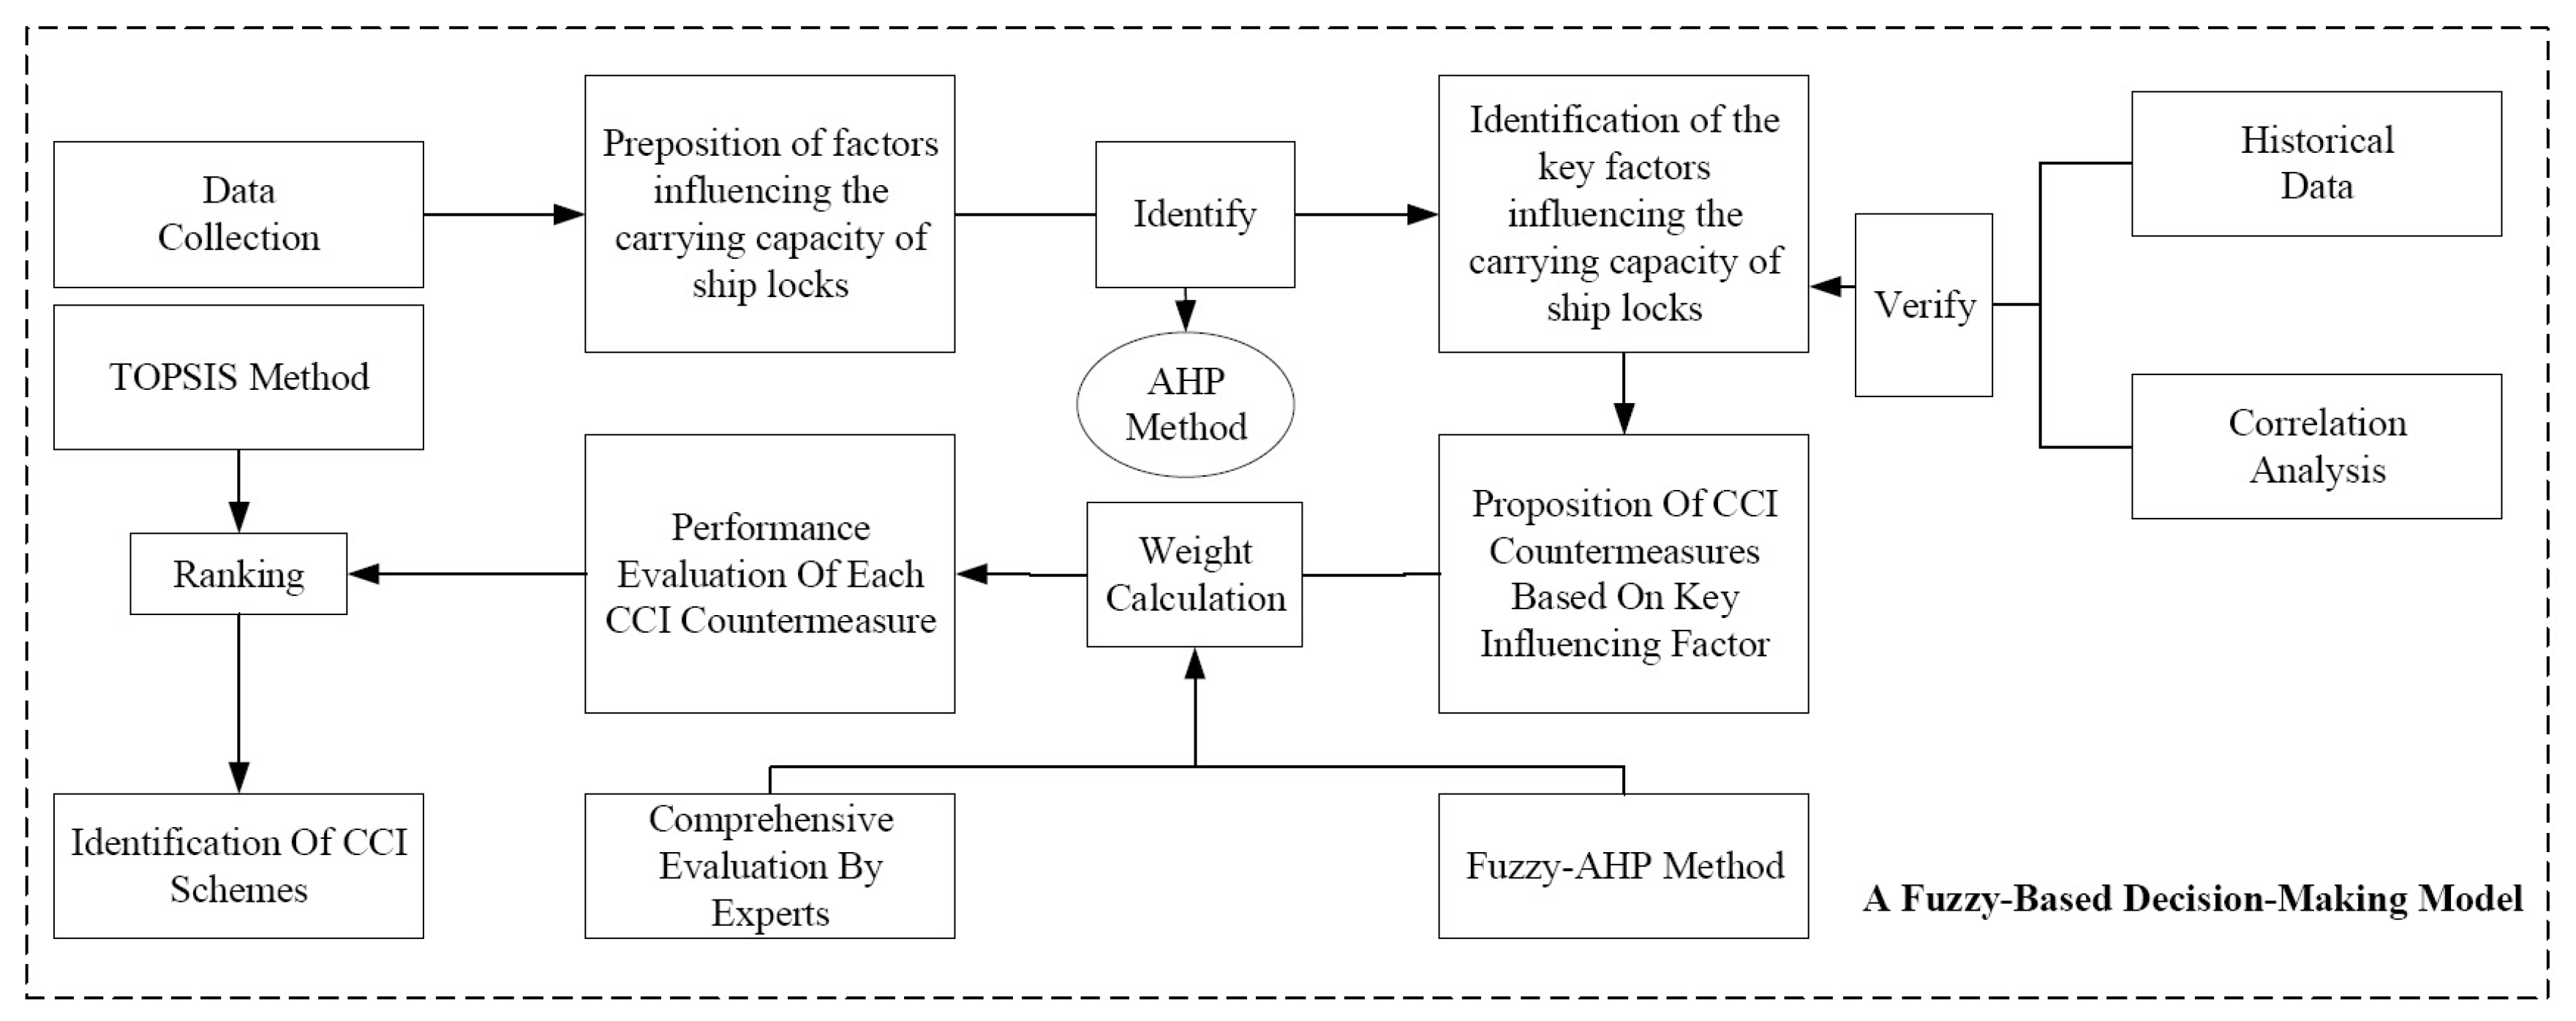
3.1. Research Framework

In view of the present situation and common problems faced by ship locks, the ship traffic flow characteristics of ship locks are analyzed, especially the characteristics of inland ship traffic flow between ship locks. Moreover, the factors affecting the carrying capacity of the ship locks are systematically studied in a quantitative way. Finally, a real-world case of the Three Gorges Dam is conducted to illustrate the capability of the proposed model. The main steps developed to support the selection of CCI countermeasures are described as below:
Step 1: Identification of the key factors influencing the carrying capacity of ship locks
A hierarchical model will be developed to identify the possible factors that affect the carrying capacity of ship locks. Based on that, historical operational data and expert opinions will be collected to investigate the factors that influence most the working status of ship locks by using a fuzzy-AHP judgment matrix. The weight of each factor within each level will be calculated level by level, and then the global weight of every factor can be obtained.
Step 2: Proposition of CCI countermeasures
According to the identified key influencing factors, some countermeasures for improving the carrying capacity of ship locks are put forward and sorted into different groups.
Step 3: Performance evaluation of each CCI countermeasure
An expert survey is conducted to measure the positive effect of each countermeasure on the improvement of carrying capacity of ship locks. Four criteria are cost, expected benefit, implementation difficulty, and project cycle. A triangle fuzzy function is further applied to transform subjective judgments into fuzzy numbers.
Step 4: Ranking of the CCI countermeasures
The Positive Ideal Reference Point (PIRP) and Negative Ideal Reference Point (NIRP) are determined, and the distances from each CCI countermeasure to PIRP and NIRP are calculated. The closeness coefficient of each CCI countermeasure is calculated, and CCI countermeasures are ranked according to their closeness coefficients.
The research framework of the fuzzy-based decision-making model is shown in Figure 2.

3.2. Comprehensive Evaluation by Experts

The comprehensive evaluation by experts is achieved based on experts’ knowledge and long-term working experience in the field [29]. This method is more suitable, especially when there is a lack of statistical data. This method relies much on the design of questionnaires and the selection of experts. As the capability of each expert may vary, each expert will be assigned different weights according to the importance of their judgments when merging their opinions.
In this study, the evaluation of the carrying capacity improvement of ship locks is represented by D, the importance coefficient of each factor is represented by I, and the improved value of ship locks’ carrying capacity is represented by A. They all can be obtained by weighting average the results of questionnaires, and their relations are expressed as follows:
D k = I k × A k
where D k is the assessed value of ship locks carrying capacity improvement by the k th factor considering its importance, I k is evaluation coefficient of the importance of k th factor, and A k is the assessed value of ship locks carrying capacity improvement by the k th factor. They can be calculated as follows:
I k = 1 n m = 1 n w m i km = 1 n w 1 i k 1 + w 2 i k 2 + + w m i km
where n is the total number of valid questionnaires; m indicates the m th questionnaire; k represents the k th influencing factor; w is the weight of the questionnaire. Similarly, the following equation can be used to calculate the score of the k th influencing factor in terms of capacity improvement of ship locks.
A k = 1 n m = 1 n w m α km = 1 n w 1 α k 1 + w 2 α k 2 + + w m α km

3.3. Fuzzy-AHP Method

Although traditional AHP needs few quantitative data when providing solutions for multi-objective and multi-criterion problems, it still shows some inherent drawbacks. For example, only an integer of a certain scale can be assigned when constructing a judgment matrix, which cannot reflect the real situation accurately. Meanwhile, the judgment matrix constructed by this method usually has limitations [30,31]. Therefore, in this paper, a fuzzy-AHP judgment matrix will be constructed by using triangular fuzzy numbers (TFNs). In this way, the fuzziness between the attributes and human knowledge can be better reflected to minimize the impact of participants’ bias on outcomes.
In a fuzzy-AHP judgment matrix, the comparative importance of two factors can be represented with a 9-scale of importance, as shown in Table 1.
According to Table 1, the results of pairwise comparisons are used to construct the fuzzy-AHP judgment matrix for each level of factors as follows. Assuming that there are n factors in a certain level of the hierarchical model, and a ˜ ij represents the pairwise comparisons for the importance of the i th factor with respect of the jth one. The judgment matrix A ˜ of each level can be represented by a n × n matrix.
A ˜ = a ˜ ij n * n = ( 1 , 1 , 1 ) a ˜ 12 a ˜ 1 n 1 / a ˜ 12 ( 1 , 1 , 1 ) a ˜ 2 n 1 / a ˜ 1 n 1 / a ˜ 2 n ( 1 , 1 , 1 ) i , j = 1 , , n , i < j
The following equation is the expansion of fuzzy judgment matrix A ˜ .
A ˜ = a ˜ ij n * n = ( 1 , 1 , 1 ) l 12 , m 12 , u 12 l 1 n , m 1 n , u 1 n 1 u 12 , 1 m 12 , 1 l 12 ( 1 , 1 , 1 ) l 2 n , m 2 n , u 2 n 1 u 1 n , 1 m 1 n , 1 l 1 n 1 u 2 n , 1 m 2 n , 1 l 2 n ( 1 , 1 , 1 )
Support two TFNs are M 1 = l 1 , m 1 , u 1 and M 2 = l 2 , m 2 , u 2 , then the operations with these fuzzy numbers are defined as follows.
l 1 , m 1 , u 1 l 2 , m 2 , u 2 = l 1 + l 2 , m 1 + m 2 , u 1 + u 2
l 1 , m 1 , u 1 l 2 , m 2 , u 2 = 1 1 l 2 , m 1 m 2 , u 1 u 2
( λ , λ , λ ) l 2 , m 2 , u 2 = λ l 2 , λ m 2 , λ u 2 , λ > 0 , λ R
l 1 , m 1 , u 1 1 1 / u 1 , 1 / m 1 , 1 / l 1
According to the proposed TFNs, the sum of the column vectors of the fuzzy judgment matrix A ˜ can be calculated as:
RS i = j = 1 n a ˜ ij = j = 1 n l ij , j = 1 n m ij , j = 1 n u ij , i = 1 , , n
The normalization of matrix A ˜ can be realized by the following equation.
S ˜ i = R S i j = 1 n RS j = j = 1 n l ij j = 1 n l ij + k = 1 , k i n j = 1 n u kj , j = 1 n m ij k = 1 n j = 1 n m kj , j = 1 n u ij j = 1 n u ij + k = 1 , k i n j = 1 n l kj , i = 1 , , n .
where S ˜ i represents the weight of TFNs of the i th index in judgment matrix A ˜ , and S ˜ 1 , , S ˜ n T consists of the eigenvectors of fuzzy judgment matrix A ˜ . When numerous pairwise comparisons are evaluated, their consistency must be checked before a convincing result can be achieved, which can be achieved as follows.
C R = C I R I
where C R is the consistency ratio and R I is the random index for the matrix size. C I is the consistency index that can be obtained from Equation (13).
C I = λ max n n 1
where λ max is the maximum weighting value of a n × n comparison matrix A ˜ . The comparisons will be considered reasonable only if the consistency ratio is equal to or less than 0.10.

3.4. TOPSIS Method

The TOPSIS method is used for identifying solutions from a finite set of alternatives, with a basic principle that the chosen alternative should have the shortest distance from the positive ideal solution and the farthest distance from the negative ideal solution. As a useful method in dealing with multi-attribute or multi-criterion decision-making problems in the real world, TOPSIS has been successfully applied to various aspects such as human-resource management, transportation and manufacturing [32,33]. The TOPSIS method can be expressed in the following steps:
(1) Establish a decision matrix
When conducting TOPSIS, it is required that a decision problem be well structured and represented in the form of decision matrix D with m rows, each representing the alternatives under consideration and n columns, each representing the evaluation criterion. Matrix D consists of various original information is shown as Equation (14).
D = x 11 x 12 x 1 n x 21 x 22 x 2 n x m 1 x m 2 x mn
Each variable x ij in matrix D describes the performance of alternative O i ( i = 1 , 2 , , m ) with respect to the criterion C j ( j = 1 , 2 , , n ) .
(2) Normalize the decision matrix
It is essential to normalize the data to transform it into a dimensionless matrix, which allows the comparison of the criteria from different sources. Normalized value r i j of each variable x i j is calculated through Equation (15).
r ij = x ij / i = 1 m x ij 2 , j = 1 , 2 , , n
(3) Obtain the weighted normalized decision matrix
Then, the weighted normalized decision matrix ( V i j ) can be obtained by multiplying the normalized decision matrix by its associated weights with Equation (16).
v ij = w j · r ij , i = 1 , 2 , , m , j = 1 , 2 , , n
where w j is the weight of j th criteria.
(4) Identify the positive ideal solutions (PIS) and negative ideal solutions (NIS)
In a TOPSIS, the PIS ( A + ) and NIS ( A ) are defined as Equation (17).
A + = v 1 + , v 2 + , , v n + = max i v ij | j J 1 , min i v ij | j J 2 ; A = v 1 , v 2 , , v n = min i v ij | j J 1 , max i v ij | j J 2
where J 1 and J 2 represent the criteria benefit and cost, respectively.
(5) Calculate separation measures
The Euclidean distances from the PIS ( d j + ) and the NIS ( d j ) of each alternative O i can be calculated as:
d i + = j = 1 n v ij v j + 2 , i = 1 , 2 , , m ; d i = j = 1 n v ij v j 2 , i = 1 , 2 , , m
(6) Calculate the relative closeness to the ideal solution
The relative closeness S j for each alterative with respect to PIS is calculated using Equation (10).
S j = d j d j + + d j , j = 1 , 2 , , m
where 0 S j 1 .
(7) Rank the alternatives
As the distance to both PIS and NIS are considered in the last step, the larger value of result S j represents a better alternative O j that is close to positive ideal and far from a negative ideal solution. In addition, therefore, the solution with the largest S j should be ranked at the top when choosing the preferable alternative.

4. A Case Study of the Ship Locks of the Three Gorges Dam

The Three Gorges Dam locates on the Yangtze River (west of the city of Yichang in Hubei province, China). It is a straight-crested concrete gravity structure with 2335 m long and a maximum height of 185 m. The five-stage ship lock of Three Gorges Dam, the biggest ship lock in the world, acts as an elevator which raises and lowers ships to cross the Three Gorges Dam. It can lift a cargo ship of 14,000 tons to a height of 113 m [34]. In total, it will take about half an hour to cross Three Gorges Dam. Due to its significant role in the world, the ship locks of the Three Gorges Dam are believed to be representative for the case study.
Statistics of all types of ships passing through the Three Gorges Dam area are shown in Figure 3. During the flood season in 2016, the detention of ships reached 941 ship times [35]. Moreover, the ships detained due to Three Gorges ship lock suspension in one day are usually cleared up in a week or even half a month. In special periods such as bad weathers (e.g., strong wind and heavy fog), navigation limit between two dams in flood season, suspension due to exceeding design flow, and ship lock maintenance, the detention of ships in the Three Gorges Dam area will become more serious [36].
To obtain a complete overview of the results, individuals that have an explicit and recognizable role in relevant domains are chosen as experts in this survey. These experts have rich working experience in their respective organizations and are familiar with the operation and management of ship locks of the Three Gorges Dam. The number of experts of different types is listed in Table 2.

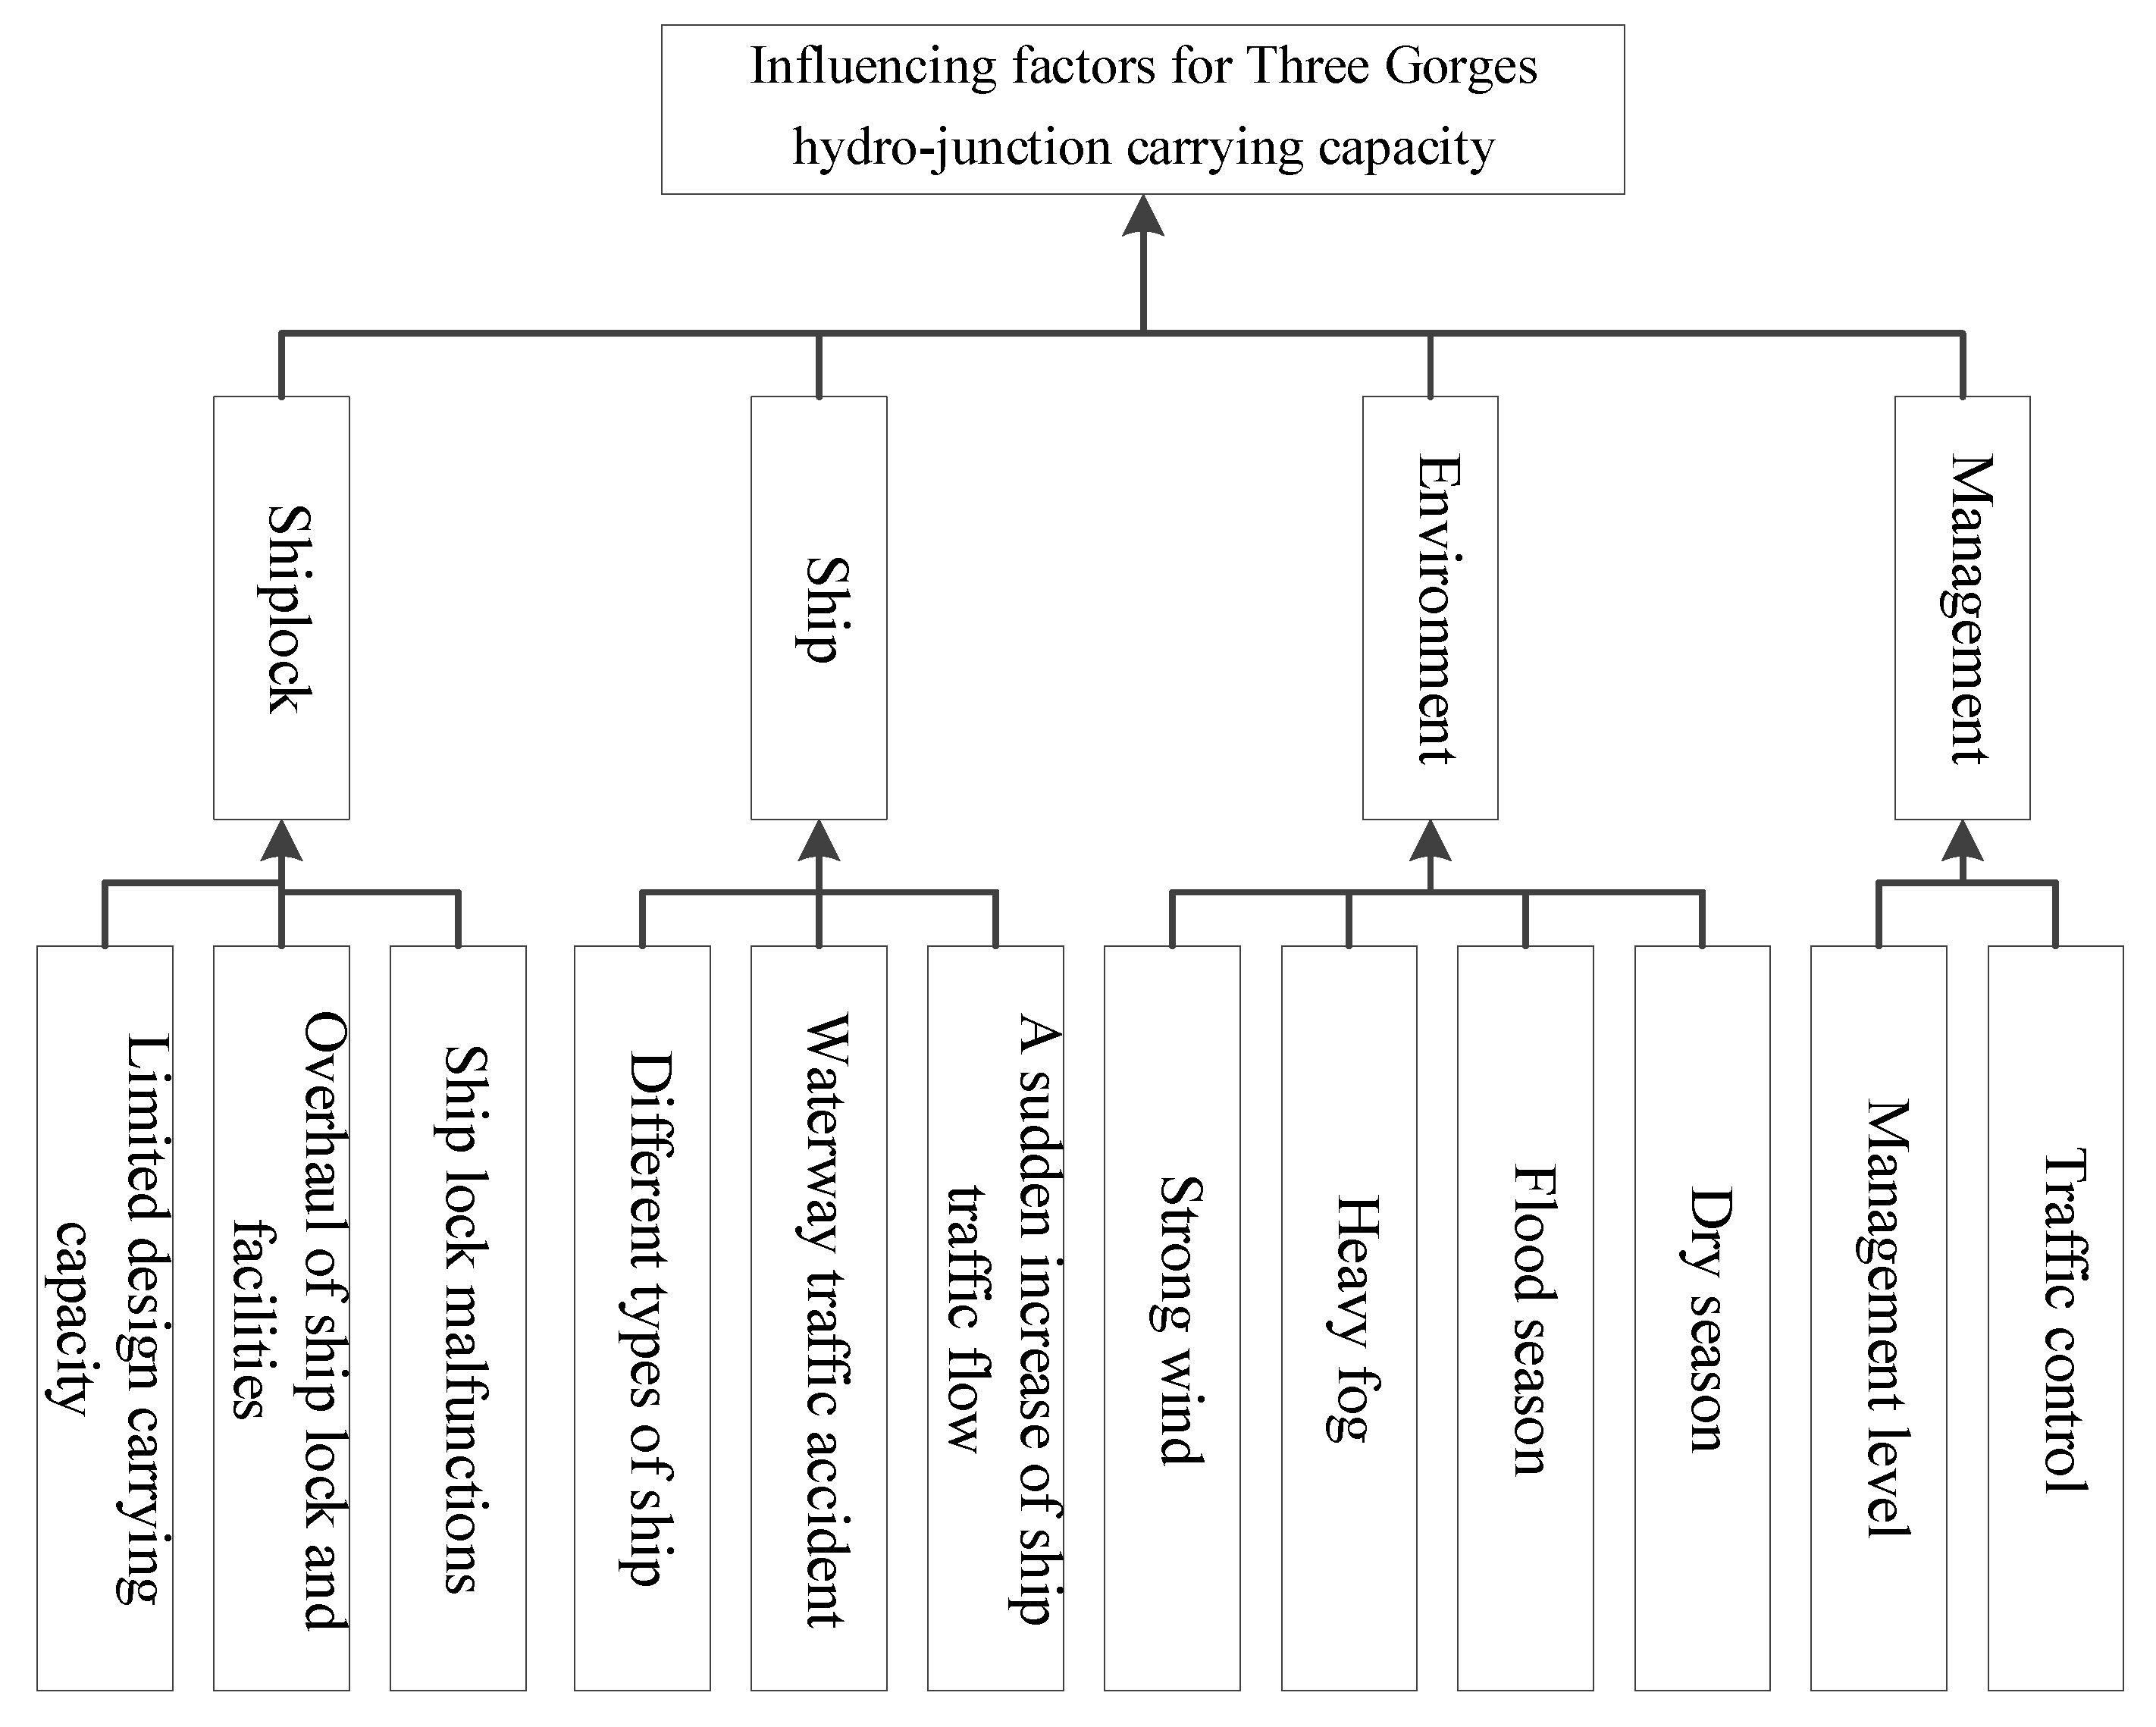
4.1. Identification of Factors Influencing the Carrying Capacity of Ship Locks

There are multiple factors simultaneously affecting the carrying capacity of the ship locks of the Three Gorges water area. In this study, literature review, expert survey, and field investigations are adapted to identify and analyze the risk factors influencing the carrying capacity of ship locks of the Three Gorges Dam from different aspects. Altogether, there are 12 factors are identified, and the identified factors are finally categorized into the ship, ship lock, environment, and administrative classes with 12 sub-indices, as listed in Table 3.
The hierarchical structure model of influencing factors for Three Gorges Dam carrying capacity is established, as shown in Figure 4.
It is clear from the above AHP that four major factors are in the target layer, each layer with several sub-index factors, as shown in Table 4. To ensure the appropriate data processing, the collected expert questionnaires should be first calculated and then weight-averaged.
According to the hierarchical structure in Section 4.1, the weight of each factor is calculated according to the method in Section 3.2. By calculating the factor weights of the index on each level, the weights of Level II indices and corresponding Level I indices were multiplied, resulting in the synthetic weight value of each index, as shown in Table 5.
To ensure the appropriate data processing, the opinion results of experts are averaged, generating the final results shown in Table 6.

4.2. Selections of Measures to Improve the Carrying Capacity of Ship Locks

According to the recognition of risk factors, using field research methods, and combining opinions of experts and personnel of the Three Gorges ship lock and anchorage, the relevant optimization scheme was set up, as listed in Table 7.
For each scheme and corresponding optimization factors, an AHP model is established. Taking Scheme A as an example, the structure of the model is shown in Figure 5.
According to the methods introduced in Section 3.2, the weights were assigned based on the influencing degree of each factor in each scheme on capacity improvement. However, since the numbers of optimization factors in different schemes were different, the factors in Table 7 should be normalized, resulting in the normalized weights of 32 factors, listed in Table 8.
Based on risk factor identification and the factors of each scheme, according to the weights of each scheme in capacity improvement, the optimization ability index of each factor in each scheme can be quantized in the capacity optimization system. Results sorted according to optimization performance are listed in Table 9.

4.3. Quantification of Optimization Factors’ Improving Effect

For each optimization factor, the evaluation was made in terms of cost, expected benefit, implementation difficulty, and project cycle. The factors for the above four evaluation indices were quantized according to the scores of the experts for each factor. The average values of the evaluation indices of all experts were used as the scores of the economic inputs of implementation, expected effect after implementation, the ease of realization, implementation cycle, with maximum and minimum scores being 9 and 0. Finally, sorting was made according to the optimization effect. The emerged judgments from experts are listed in Table 10.

4.4. Evaluation of the Performance of CCI Schemes on the Three Gorges Dam

On the basis of selecting risk factors and optimization ability in Section 4.2 and Section 4.3, calculate the sum of the Euclidean distance between the optimization scheme to the positive and negative ideal schemes, as shown in Table 11, and calculate the closeness between the Three Gorges carrying capacity optimization scheme and the positive ideal scheme, with the closeness score of each factor shown in Table 12 according to the TOPSIS method in Section 3.3.
It can be concluded that ship type standardization [A1], maintenance at off-season [B1], ship scheduling [D2], electronic patrol [J2], organizational scheduling optimization [A3], and usage of ship lift [A5] have greater impacts on improving the carrying capacity of ship locks in the Three Gorges Dam.

5. Discussion

Since the use of AHP method may bring bias, the analysis results in the previous section need to be verified using correlation analysis to ensure the accuracy of the obtained results. Correlation analysis is a mathematical method which discovers whether there is dependence among different factors and how strong it is. Without the loss of generality, taking the correlation analysis of two groups of data as an example, correlation coefficient r is used to describe the correlation degree between them, and it can be either positive or negative [37]. Given two groups of variables X and Y , and then the correlation coefficient can be calculated as follows.
r = i = 1 n x i X ¯ y i Y ¯ i = 1 n x i X ¯ 2 i = 1 n y i Y ¯ 2
where X ¯ = 1 n i = 1 n X i and Y ¯ = 1 n i = 1 n Y i represents the mathematic expectation of variables X and Y , respectively; i = 1 n x i X ¯ 2 , i = 1 n y i Y ¯ 2 represents the standard deviation of X and Y ; i = 1 n x i X ¯ y i Y ¯ represents the covariance of X and Y .
Generally, an absolute value of r that is larger than 0.95 indicates a significant correlation between variables X and Y . An absolute value of r that is larger than 0.8 indicates that X and Y are highly correlated. If 0.5 | r | < 0.8 , X and Y are moderately correlated. If 0.3 | r | < 0.5 , X and Y have low correlation. If |r | < 0.3 , the correlation between X and Y is very weak, or they are irrelevant. The results of correlation analysis are presented in Table 13.
It can be seen from Table 13 that the correlation between ship lock maintenance and ship detention capacity is the highest, while the correlations between the ship detention capacity and high flow during flood season, fog weather, and gale weather respectively show a decreasing trend, which indicates that the influence of ship lock maintenance is more significant than that of other three factors.
Based on the statistics for the Three Gorges in ship lock maintenance period from 2010 to 2016, the average navigation delay time of Three Gorges ship lock caused by routine maintenance, overhaul, and malfunctions were 167.58 h, 81.75 h, 124.43 h, 121.65 h, respectively. It is clear that ship lock maintenance and malfunction are the key factors influencing carrying capacity.
In the flood season of 2016, The Three Gorges received the largest flood since the opening of the Three Gorges ship lock, with large numbers of flood peaks and large peak value, the maximum flow being 71,200 m 3 / s . The flood dramatically affected the ship navigation in the Three Gorges river segment, causing the detention of large numbers of ships, with a maximum number of detained ships being 941. Therefore, the large flow of flood season in Three Gorges has a large influence on ship detention in the dam area, and the larger the flow is, the more ships are detained. Therefore, it can be concluded that the results are consistent with the analyses results obtained from this research.
This paper develops a decision-making model to assist the improvement of the carrying capacity of ship locks by combing the fuzzy logic, the AHP method, and the TOPSIS. A three-level hierarchical structure is constructed to identify the key factors influencing the carrying capacity of ship locks from the aspects of ship locks, vessels, environment, and administration.
A decision-making model to assist the improvement of the carrying capacity of ship locks by combing the fuzzy logic, AHP, and TOPSIS is proposed, and the results obtained from the proposed methods are consistent with the real-life situation to a certain extent, indicating that the proposed method can provide a good reference for improving the carrying capacity of ship locks. The uncertainties on the conclusions will be taken in consideration as follows: Inaccuracies in data, assumptions in model and modelling procedures are conditions or choices which may affect the conclusions. Various uncertainty assessment methods have been proposed [38]. The simple approach is applied in the research, which is suggested by Flage and Aven [39].
The navigational records of Three Gorges Dam contain detailed information including the summary and statistics, general description of ships, external conditions, navigational environment, and so on, which can facilitate the influencing factors identification. Though the number of the navigational records is not so many years, the qualitative risk identification carried in this research is further complemented with expert knowledge. The uncertainty assessment for the proposed method is shown in Table 14.
In brief, this may question the reliability of the navigational records when used to determine the influencing factors in assisting the improvement of the carrying capacity of ship locks. Besides, the research involves uncertainties. The research relies on navigational records formulated in a specific format, where a larger number of navigational records would reduce the uncertainty of the collision risk factors. We will improve the research in the terms of uncertainty analysis in the future. The proposed method for improving the carrying capacity of ship locks has also some potential benefits to the analysis of traffic flow in Three Gorges Dam.

6. Conclusions

In this paper, AHP method and correlation analysis method are synthetically used to effectively quantify the influencing factors of Three Gorges carrying capacity. In view of traffic engineering, correlation analysis is carried out combining ship traffic flow characteristics. The Three Gorges navigation optimization system was established in aspects of optimization capability, economy, expected effect, ease of realization, period. TOPSIS decision method is adopted to obtain the optimization factors of Three Gorges carrying capacity, avoiding the drawback in most studies that only corresponding optimization schemes were proposed without re-evaluation for the proposed schemes.
The five most significant factors influencing the Three Gorges Dam carrying capacity are “limited design carrying capacity”, “overhaul of ship lock and facilities”, “ship lock malfunctions”, “waterway traffic accidents”, and “a sudden increase of ship traffic flow”. Based on that some CCI schemes are proposed, and their performance is compared with respect to the cost, expected benefit, implementation difficulty, and project cycle. It is found that CCI schemes such as organizational scheduling optimization, establish a scheduling performance assessment system, management officer training, ship type standardization, usage of ship lift, ship scheduling, new channel of the Gezhouba Dam, new channel of the Three Gorges are among the ones that improve the carrying capacity of the ship locks of the Three Gorges the most.
Since the sample data were difficult to collect, in this study, experts’ judgment is involved, which may inevitably bring some bias. Therefore, under certain conditions where more statistical data is available, more quantitative analysis can be conducted to improve the accuracy of the performance evaluation results of the proposed CCI schemes, and these schemes will be further compared to the real situation in the Three Gorges Dam area.

Author Contributions

Conceptualization, S.S. and Y.S.; Methodology, D.Z. and M.Z.; Validation, C.W.; Formal analysis, S.S. and C.W.; Resources, D.Z.; Data curation, M.Z. and C.L.; Writing—original draft preparation, S.S., C.W. and M.Z.; Writing—review and editing, S.S., C.W., M.Z. and C.L.; Visualization, Y.S. and C.L. All of the authors above approved the final manuscript for submission.

Funding

The research was financially supported by National Key Technologies Research & Development Program (2017YFE0118000), the Natural Science Foundation of Hubei Province (2016CF-B502 and 2015CFB586) and the Fundamental Research Funds for the Central Universities (163111005 and 2017-YB-030).

Acknowledgments

The authors would like to thank the anonymous reviewers for their constructive suggestions which comprehensively improve the quality of the paper.

Conflicts of Interest

The authors declare no conflict of interest.

References

  1. WSC. Containers Lost at Sea 2017. Available online: http://www.worldshipping.org/industry-issues/safety/Containers_Lost_at_Sea_-_2017_Update_FINAL_July_10.pdf (accessed on 22 July 2019).
  2. UNCTAD. Review of maritime transport 2017. Rev. Marit. Transp. 2017, 13, 251–257. [Google Scholar]
  3. Li, M.-W.; Hong, W.-C.; Geng, J.; Wang, J. Berth and quay crane coordinated scheduling using multi-objective chaos cloud particle swarm optimization algorithm. Neural Comput. Appl. 2017, 28, 3163–3182. [Google Scholar] [CrossRef]
  4. Umang, N.; Bierlaire, M.; Erera, A.L. Real-time management of berth allocation with stochastic arrival and handling times. J. Sched. 2017, 20, 1–17. [Google Scholar] [CrossRef]
  5. Dulebenets, M. A novel memetic algorithm with a deterministic parameter control for efficient berth scheduling at marine container terminals. Marit. Bus. Rev. 2017, 2, 302–330. [Google Scholar] [CrossRef] [Green Version]
  6. Zhen, L.; Liang, Z.; Zhuge, D.; Lee, L.H.; Chew, E.P. Daily berth planning in a tidal port with channel flow control. Transp. Res. Part B Methodol. 2017, 106, 193–217. [Google Scholar] [CrossRef]
  7. Xiang, X.; Liu, C.; Miao, L. Reactive strategy for discrete berth allocation and quay crane assignment problems under uncertainty. Comput. Ind. Eng. 2018, 126, 196–216. [Google Scholar] [CrossRef]
  8. Dulebenets, M. A comprehensive multi-objective optimization model for the vessel scheduling problem in liner shipping. Int. J. Prod. Econ. 2018, 196, 293–318. [Google Scholar] [CrossRef]
  9. Chen, Z.; Zhang, Y.; Wu, C.; Ran, B. Understanding individualization driving states via Latent Dirichlet allocation model. IEEE Intell. Transp. Syst. Mag. 2019, 11, 41–53. [Google Scholar] [CrossRef]
  10. China SCo. Guidance on the Basis Golden Waterway to Promote the Development of the Yangtze River Economic Belt. 2014. Available online: http://www.gov.cn/zhengce/content/2014-09/25/content_9092.htm (accessed on 22 July 2019).
  11. Wan, C.; Yan, X.; Zhang, D.; Qu, Z.; Yang, Z. An advanced fuzzy Bayesian-based FMEA approach for assessing maritime supply chain risks. Transp. Res. Part E Logist. Transp. Rev. 2019, 125, 222–240. [Google Scholar] [CrossRef]
  12. Jiang, D.; Hao, G.; Huang, L.; Zhang, D. Use of cusp catastrophe for risk analysis of navigational environment: A case study of Three Gorges Reservoir Area. PLoS ONE 2016, 11, e0158482. [Google Scholar] [CrossRef]
  13. Fan, Q.; Yang, Z.; Liu, G. The practice of project construction and management of Three Gorges ship-lock. Eng. Sci. 2011, 09, 82–87. [Google Scholar]
  14. Wan, C.; Yang, Z.; Zhang, D.; Yan, X.; Fan, S. Resilience in transportation systems: A systematic review and future directions. Transp. Rev. 2018, 38, 479–498. [Google Scholar] [CrossRef]
  15. Kaplan, S. The words of risk analysis. Risk Anal. 2010, 17, 407–417. [Google Scholar] [CrossRef]
  16. Wang, J. Offshore safety case approach and formal safety assessment of ships. J. Saf. Res. 2002, 33, 81–115. [Google Scholar] [CrossRef]
  17. Wang, J. A brief review of marine and offshore safety assessment. Mar. Technol. 2002, 39, 77–85. [Google Scholar]
  18. Wang, J. Technology and Safety of Marine Systems; Elsevier Ocean Engineering Book Series; Elsevier: Amsterdam, The Netherlands, 2003. [Google Scholar]
  19. Jensen, O.C.; Stage, S.; Noer, P. Injury and time studies of working processes in fishing. Saf. Sci. 2006, 44, 349–358. [Google Scholar] [CrossRef]
  20. Zhang, X.; Yuan, X.; Yuan, Y. Improved hybrid simulated annealing algorithm for navigation scheduling for the two dams of the Three Gorges Project. Comput. Math. Appl. 2008, 56, 151–159. [Google Scholar] [CrossRef] [Green Version]
  21. Du, J.; Yu, S. Dynamic programming model and algorithm of shiplock scheduling problem. Comput. Digit. Eng. 2003, 03, 47–50. [Google Scholar]
  22. Zhang, M.; Zhang, D.; Fu, S.; Yan, X.; Goncharov, V. Safety distance modeling for ship escort operations in Arctic ice-covered waters. Ocean. Eng. 2017, 146, 226–235. [Google Scholar] [CrossRef]
  23. Zhang, M.; Zhang, D.; Goerlandt, F.; Yan, X.; Kujala, P. Use of HFACS and fault tree model for collision risk factors analysis of icebreaker assistance in ice-covered waters. Saf. Sci. 2019, 111, 128–143. [Google Scholar] [CrossRef]
  24. Senel, M.; Şenel, B.; Alpay Havle, C. Risk analysis of ports in Maritime Industry in Turkey using FMEA based intuitionistic Fuzzy TOPSIS Approach. In Proceedings of the ITM Web of Conferences, Ho Chi Minh City, Vietnam, 18–20 December 2018; p. 01018. [Google Scholar]
  25. Mohamadi Janaki, D.; Izadbakhsh, H.; Hatefi, S. The evaluation of supply chain performance in the Oil Products Distribution Company, using information technology indicators and fuzzy TOPSIS technique. Manag. Sci. Lett. 2018, 8, 835–848. [Google Scholar] [CrossRef]
  26. Wan, C.; Yang, X.; Fan, S. A novel model for quantitative of green port development—A case study of major ports in China. Transp. Res. Part D Transp. Environ. 2018, 61, 431–443. [Google Scholar] [CrossRef]
  27. Huang, W.; Shuai, B.; Xu, Y.; Zhang, S.; Mao, B. Railway express freight train service sites planning: A two stage Entropy-TOPSIS approach. Transp. A Transp. Sci. 2018, 15, 1360–1381. [Google Scholar] [CrossRef]
  28. Sahin, B.; Senol, Y.E. A novel process model for marine accident analysis by using Generic Fuzzy-AHP Algorithm. J. Navig. 2014, 68, 162–183. [Google Scholar] [CrossRef]
  29. Hu, S.; Fang, Q.; Xia, H.; Xi, Y. Formal safety assessment based on relative risks model in ship navigation. Reliab. Eng. Syst. Saf. 2017, 92, 369–377. [Google Scholar] [CrossRef]
  30. Jing, C.; Finlayson, B.L.; Wei, T.; Sun, Q.; Webber, M.; Li, M.; Chen, Z. Changes in monthly flows in the Yangtze River, China—With special reference to the Three Gorges Dam. J. Hydrol. 2016, 536, 293–301. [Google Scholar]
  31. Chen, L. Research on Macroscopical Evaluation of Marine Traffic Safety in China. Master’s Thesis, Dalian Maritime University, Dalian, China, 2007. [Google Scholar]
  32. Qu, J.; Chen, N.; Huang, Q.; Xu, J. Improved TOPSIS method for evaluating groundwater carrying capacity. J. Hydraul. Eng. 2008, 39, 1309–1315. [Google Scholar]
  33. Wu, B.; Zong, L.; Yan, X.; Guedes Soares, C. Incorporating evidential reasoning and TOPSIS into group decision-making under uncertainty for handling ship without command. Ocean. Eng. 2018, 164, 590–603. [Google Scholar] [CrossRef]
  34. Xiong, C.; Zhu, H.; Fang, H.; Zheng, W. Study on optimization of ship scheduling in Three Gorges Dam. China Water Transp. 2016, 16, 43–47. [Google Scholar]
  35. Liu, L.; Zhang, P. Early Warning Management Operation Mechanism for Traffic Safety in the Yangtze River. J. Transp. Inf. Saf. Sci. 2010, 28, 116–118. [Google Scholar]
  36. Li, Z. Research of the Expansion of Three Gorges Navigation Capacity. Master’s Thesis, Chongqin Jiaotong University, Chongqi, China, 2013. [Google Scholar]
  37. Piniella, F.; Fernández-Engo, M.A. Towards system for the management of safety on board artisanal fishing vessels: Proposal for check-lists and their application. Saf. Sci. 2009, 47, 265–276. [Google Scholar] [CrossRef]
  38. Flage, R.; Aven, T. Expressing and communicating uncertainty in relation to quantitative risk analysis (QRA). Reliab. Theory Appl. 2009, 132, 9–18. [Google Scholar]
  39. Aven, T.; Heide, B. Reliability and validity of risk analysis. Reliab. Eng. Syst. Saf. 2009, 94, 1862–1868. [Google Scholar] [CrossRef]
Figure 1. Global containerized trade in recent two decades (Millions TEUs and annual percentage change). Sources: By author based on the data from the Review of Maritime Transport 2017.
Jmse 07 00244 g001
Figure 2. Research framework of the fuzzy-based decision-making model.
Jmse 07 00244 g002
Figure 3. Type of ships in the Three Gorges Dam in 2016.
Jmse 07 00244 g003
Figure 4. Hierarchical structure of influencing factors.
Jmse 07 00244 g004
Figure 5. The AHP model of scheme A.
Jmse 07 00244 g005
Table 1. The relational scale for pairwise comparisons with TFNs.
Scale of ImportanceInterpretationTFN ( l i , m i , u i )
1Equal importance of two elements(1,1,1)
3Former is slightly more important than the latter.(2,3,4)
5Former is clearly more important than the latter.(4,5,6)
7Former is strongly more important than the latter.(6,7,8)
9Former is absolutely more important than the latter.(8,9,9)
2, 4, 6, 8The middle value of the above judgment.(1,2,3), (3,4,5), (5,6,7), (7,8,9)
ReciprocalIf the importance ratio between elements i and j is a ij , then the importance ratio between elements j and i is a ji = 1 / a ij .( 1 / u i , 1 / m i , 1 / l i )
Table 2. Number of experts of different types.
Type of ExpertsNumber of Response
Senior research fellows from enterprises2
Management staff3
Project manager2
Dispatcher4
Maintenance staff3
Testing staff4
On-site staff10
Professor from universities3
Table 3. The factors influencing the carrying capacity of the Three Gorges Dam.
Target LevelLevel I IndexLevel II IndexRemarks
Factors Influencing the carrying capacityShip lockLimited design carrying capacityRepresenting the ultimate capacity of ship locks
Overhaul of ship lock and facilitiesCaused by ship lock maintenance
Ship lock malfunctionsOperation barred by ship lock failure
VesselDifferent types of shipThe poor use rate of the lock chamber area
Waterway traffic accidentBacklogs caused by safety accidents
A sudden increase of ship traffic flowToo large traffic density
EnvironmentStrong windAffecting ship voyage
Heavy fog
Flood season
Dry season
ManagementManagement levelIneffective management systems
Traffic controlManagement measures due to special circumstances
Table 4. Index system of influencing factors.
Target LevelLevel I IndexLevel II Index
Influencing factors of carrying capacity CShip lock C1Limited design carrying capacity C11
Overhaul of ship lock and facilities C12
Ship lock malfunctions C13
Ship C2Waterway traffic accident C21
Different types of ships C22
A sudden increase of ship traffic flow C23
Environment C3Flood season C31
Strong wind C32
Dry season C33
Heavy fog C34
Management C4Management Level C41
Traffic control C42
Table 5. Local weights of influencing factors.
FactorsLocal WeightOrder
Limited design carrying capacity0.26491
Overhaul of ship lock and facilities0.14583
Ship lock malfunctions0.08024
Waterway traffic accident0.06947
Different types of ships0.023210
A sudden increase of ship traffic flow0.15562
Flood season0.07016
Strong wind0.03619
Dry season0.020911
Heavy fog0.04748
Management level0.07195
Traffic control0.014412
Table 6. Final weights of influencing factors.
FactorsWeightOrder
Limited design carrying capacity0.22541
Overhaul of ship lock and facilities0.17892
Ship lock malfunctions0.14203
Waterway traffic accident0.10844
A sudden increase of ship traffic flow0.10065
Different types of ships0.06986
Flood season0.05537
Strong wind0.03748
Dry season0.02859
Heavy fog0.023310
Management level0.016511
Traffic control0.014012
Table 7. CCI schemes related to ship locks of the Three Gorges Dam.
CodeEffectCCI Scheme
AIncrease the carrying capacity of ship locksShip type standardization [A1],
Optimization of lock chamber use[A2],
Organizational scheduling optimization [A3],
Ship lock capacity expansion [A4],
Usage of ship lift [A5],
Pipeline transportation [A6]
BReduce the repair time of ship lock and facilitiesMaintenance at off-season [B1],
Overhaul of two ship lock chambers at one time [B2],
Overhaul process optimization [B3]
CReduce ship lock failure rateTesting regularly [C1],
On-site inspection [C2],
Monitoring and alarming [C3]
DAlleviate the effects of waterway traffic accidentsEarly warning [D1],
Ship scheduling [D2],
Improve crew quality [D3],
Ship safety management [D4]
EDiversion of traffic flowsDiversion at dam areas [E1],
Transshipment over dam [E2],
Diversion at source [E3]
FLower the impact of a sudden increase of ship traffic flowRestrict navigation [F1]
GReduce the influence of high flow during flood seasonReduce flood discharge [G1],
Restrict navigation [G2],
Navigational priority for full loaded ships [G3]
HReduce the influence of bad weathersWeather forecast [H1],
Scheduling optimization [H2]
IReduce the influence of dry seasonIncrease flood discharge [I1]
JImprove management levelEstablish a scheduling performance assessment system [J1],
Electronic patrol [J2],
Management officer training [J3]
KTraffic controlEstimation of control system [K1],
Improve management efficiency [K2],
Develop management plan [K3]
LDevelop New channelsNew channels of the Gezhouba Dam [L1],
New channels of Three Gorges [L2]
Table 8. Normalized results of factors.
CCI SchemeNormalized WeightCCI SchemeNormalized Weight
Ship type standardization [A1]0.4043Optimization of lock chamber use [A2]0.0740
Usage of ship lift [A5]0.1469Pipeline transportation [A6]0.0567
Overhaul process optimization [B3]0.104Testing regularly [C1]0.251
Early warning [D1]0.100Ship scheduling [D2]0.1687
Diversion at dam areas [E1]0.2355Transshipment over dam [E2]0.1155
Reduce flood discharge [G1]0.2355Restrict navigation [G2]0.1155
Scheduling optimization [H2]0.1355Increase flood discharge [I1]0.217
Management officer training [J3]0.2185Estimation of control system [K1]0.1165
New channels of the Gezhouba Dam [L1]0.181New channels of Three Gorges [L2]0.152
Organizational scheduling optimization [A3]0.1705Ship lock capacity expansion [A4]0.1476
Maintenance at off-season [B1]0.2105Overhaul of two ship lock chambers at one time [B2]0.1855
On-site inspection [C2]0.1155Monitoring and alarming [C3]0.1335
Improve crew quality [D3]0.2873Ship safety management [D4]0.110
Diversion at source [E3]0.0667Restrict navigation [F1]0.1667
Navigational priority for full loaded ships [G3]0.149Weather forecast [H1]0.1667
Establish a scheduling performance system [J1]0.1475Electronic patrol [J2]0.1165
Improve management efficiency [K2]0.2185Develop management plan [K3]0.165
Table 9. Ranking of CCI schemes according to the weights.
OrderCCI SchemeWeightOrderCCI SchemeWeight
1Ship type standardization [A1]0.107118Ship scheduling [D2]0.0117
2Organizational scheduling optimization [A3]0.045219Scheduling optimization [H2]0.0113
3Ship lock capacity expansion [A4]0.039120Monitoring and alarming [C3]0.0107
4Usage of ship lift [A5]0.038921Establish a scheduling performance assessment system [J1]0.0106
5Maintenance at off-season [B1]0.030722Navigational priority for full loaded ships [G3]0.0104
6Overhaul of two ship lock chambers at one time [B2]0.027023On-site inspection [C2]0.0093
7Restrict navigation [F1]0.025924Electronic patrol [J2]0.0084
8Testing regularly [C1]0.020125Restrict navigation [G2]0.0081
9Improve crew quality [D3]0.019926Ship safety management [D4]0.0076
10Optimization of lock chamber use [A2]0.019627Early warning [D1]0.0069
11New channels of the Gezhouba Dam [L1]0.018128Diversion at dam areas [E1]0.0055
12Reduce flood discharge [G1]0.016529Increase flood discharge [I1]0.0045
13Management officer training [J3]0.015730Improve management efficiency [K2]0.0031
14New channels of Three Gorges [L2]0.015231Transshipment over dam [E2]0.0027
15Overhaul process optimization [B3]0.015132Develop management plan [K3]0.0024
16Pipeline transportation [A6]0.015033Estimation of control system [K1]0.0017
17Weather forecast [H1]0.013934Diversion at source [E3]0.0015
Table 10. Performance of CCI schemes of different criteria.
CCI SchemeCostExpected BenefitImplementation DifficultyProject Cycle
Organizational scheduling optimization [A3]8368
Optimization of lock chamber use [A2]8358
Increase flood discharge [I1]8438
Diversion at source [E3]7278
Early warning [D1]6556
Scheduling optimization [H2]8368
On-site inspection [C2]8278
Restrict ship navigation [G2]7568
Restrict navigation [F1]6658
Estimation of control system [K1]8288
Weather forecast [H1]7358
Improve management efficiency [K2]8268
Improve crew quality [D3]6435
Overhaul of two ship lock chambers at one time [B2]6765
Usage of ship lift [A5]5756
Navigational priority for full loaded ships [G3]8268
New channels of the Gezhouba Dam [L1]1931
Establish a scheduling performance assessment system [J1]8278
Develop management plan [K3]8378
Reduce flood discharge [G1]8428
Overhaul process optimization [B3]9537
Testing regularly [C1]7277
Monitoring and alarming [C3]7367
Management officer training [J3]7376
Pipeline transportation [A6]3644
Ship lock capacity expansion [A4]5665
Transshipment over dam [E2]6567
Electronic patrol [J2]6457
Maintenance at off-season [B1]7477
Ship safety management [D4]7467
Ship type standardization [A1]5733
Ship scheduling [D2]8378
Diversion at dam areas [E1]7567
New channels of Three Gorges [L2]2742
Table 11. Performance of CCI schemes of different criteria.
CCI Scheme d + d CCI Scheme d + d
Organizational scheduling optimization [A3]0.17060.1287Establish a scheduling performance assessment system [J1]0.26430.0575
Optimization of lock chamber use [A2]0.24010.0679Develop management plan [K3]0.28630.0521
Increase flood discharge [I1]0.28160.0451Reduce flood discharge [G1]0.25000.0600
Diversion at source [E3]0.28900.0473Overhaul process optimization [B3]0.25260.0624
Early warning [D1]0.27450.0397Testing regularly [C1]0.23870.0690
Scheduling optimization [H2]0.26220.0559Monitoring and alarming [C3]0.26410.0504
On-site inspection [C2]0.26790.0560Management officer training [J3]0.25030.0605
Restrict ship navigation [G2]0.27070.0487Pipeline transportation [A6]0.25480.0429
Restrict navigation [F1]0.22280.0771Ship lock capacity expansion [A4]0.18760.1086
Estimation of control system [K1]0.28840.0552Transshipment over dam [E2]0.28580.0404
Weather forecast [H1]0.25570.0535Electronic patrol [J2]0.27080.0410
Improve management efficiency [K2]0.28470.0492Maintenance at off-season [B1]0.20940.0925
Improve crew quality [D3]0.24060.0594Ship safety management [D4]0.27220.0472
Overhaul of two ship lock chambers at one time [B2]0.21940.0811Ship type standardization [A1]0.03870.2893
Usage of ship lift [A5]0.18830.1077Ship scheduling [D2]0.26100.0589
Navigational priority for full loaded ships [G3]0.26490.0547Diversion at dam areas [E1]0.27790.0461
New channels of the Gezhouba Dam [L1]0.25690.0447New channels of Three Gorges [L2]0.24750.0500
Table 12. Performance of CCI schemes of different criteria.
CCI SchemeClosenessCCI SchemeCloseness
Ship type standardization [A1]0.5819Transshipment over dam [E2]0.2238
Maintenance at off-season [B1]0.5063Optimization of lock chamber use [A2]0.2205
Ship scheduling [D2]0.4842Improve crew quality [D3]0.1979
Electronic patrol [J2]0.4315Scheduling optimization [H2]0.1757
Organizational scheduling optimization [A3]0.43On-site inspection [C2]0.1729
Usage of ship lift [A5]0.4139Navigational priority for full loaded ships [G3]0.1711
Management officer training [J3]0.3947Estimation of control system [K1]0.1607
Establish a scheduling performance assessment system [J1]0.3787Monitoring and alarming [C3]0.1602
New channels of Three Gorges [L2]0.3681Restrict ship navigation [G2]0.1524
Ship lock capacity expansion [A4]0.3667Ship safety management [D4]0.1477
Develop management plan [K3]0.3539Improve management efficiency [K2]0.1474
New channels of the Gezhouba Dam [L1]0.3482Diversion at dam areas [E1]0.1422
Pipeline transportation [A6]0.344Diversion at source [E3]0.1406
Overhaul process optimization [B3]0.298Increase flood discharge [I1]0.1379
Overhaul of two ship lock chambers at one time [B2]0.2699Early warning [D1]0.1263
Restrict navigation [F1]0.257Reduce flood discharge [G1]0.1135
Testing regularly [C1]0.2243Weather forecast [H1]0.0916
Table 13. Analysis of correlations between ship backlog and key factors.
NumberThe Object of Correlation AnalysisData SourceCorrelation Coefficient
1Ship detention capacityShip lock maintenanceStatistics from 2010 to 20160.823
2Gale0.487
3Fog0.512
4Flood season0.682
Table 14. The uncertainty assessment for the proposed method.
Model ElementUncertaintyJustification
Navigational records of the Three Gorges DamLowThe navigational records of Three Gorges Dam are presented by Three Gorges Navigation Administration usually present valuable and detailed information, which contain the summary and statistics, general description of ships, external conditions, navigational environment, and so on. This allows defining that the uncertainty assessment for accident reports can be considered good.
Expert knowledgeMediumThe experts have experience to identify and classify the influencing factors under icebreaker assistance. The certainty of the expert’s knowledge is medium which will be described regarding the influence of influencing factors identification and optimization ability on the results.
Models and assumptionsLowOther factors outside the analysis framework, which could affect the results, new navigation systems which may affect the soundness of the analysis. However, A decision-making model is used to assist the improvement of the carrying capacity of ship locks using combing the fuzzy logic, AHP, and TOPSIS based on the navigational records of Three Gorges Dam and expert knowledge. Thus, this allows defining that the uncertainty assessment for models and assumptions can be considered low.

