Spatial Variability of Coastal Foredune Evolution, Part A: Timescales of Months to Years


Abstract
1. Introduction
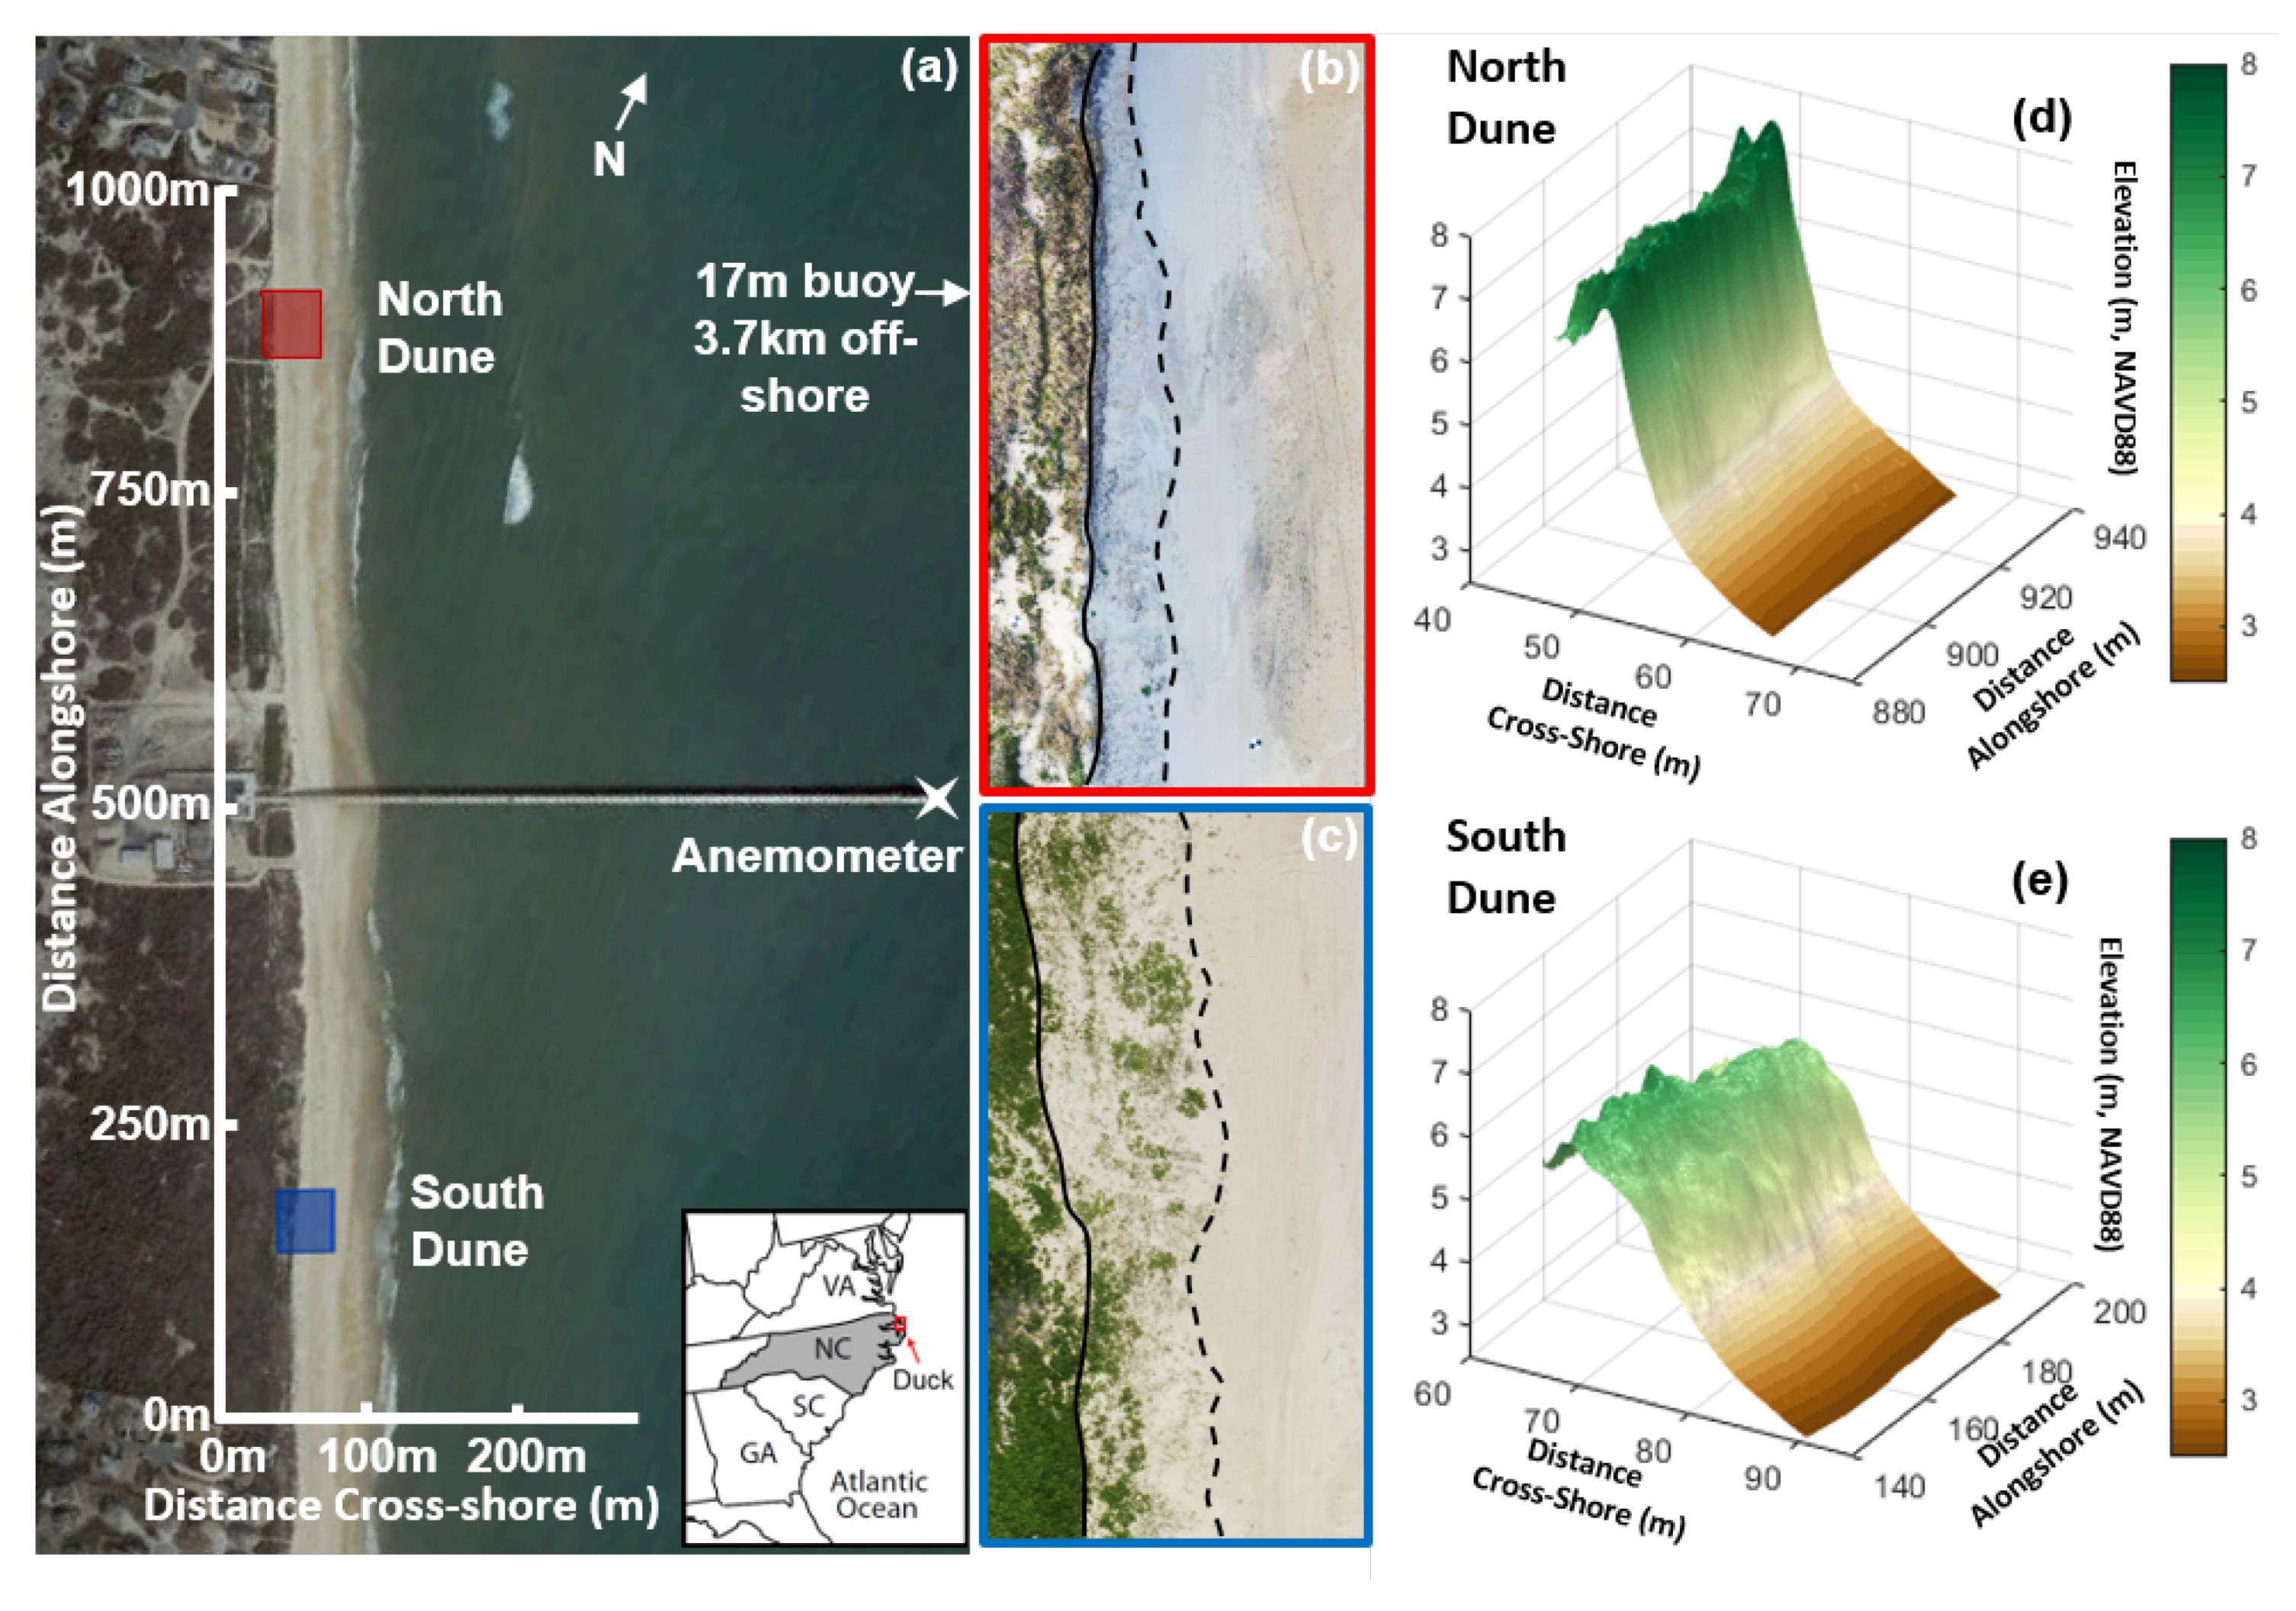
2. Field Site
3. Methodology
3.1. Lidar Data Collection and Processing
3.2. Morphology Metrics
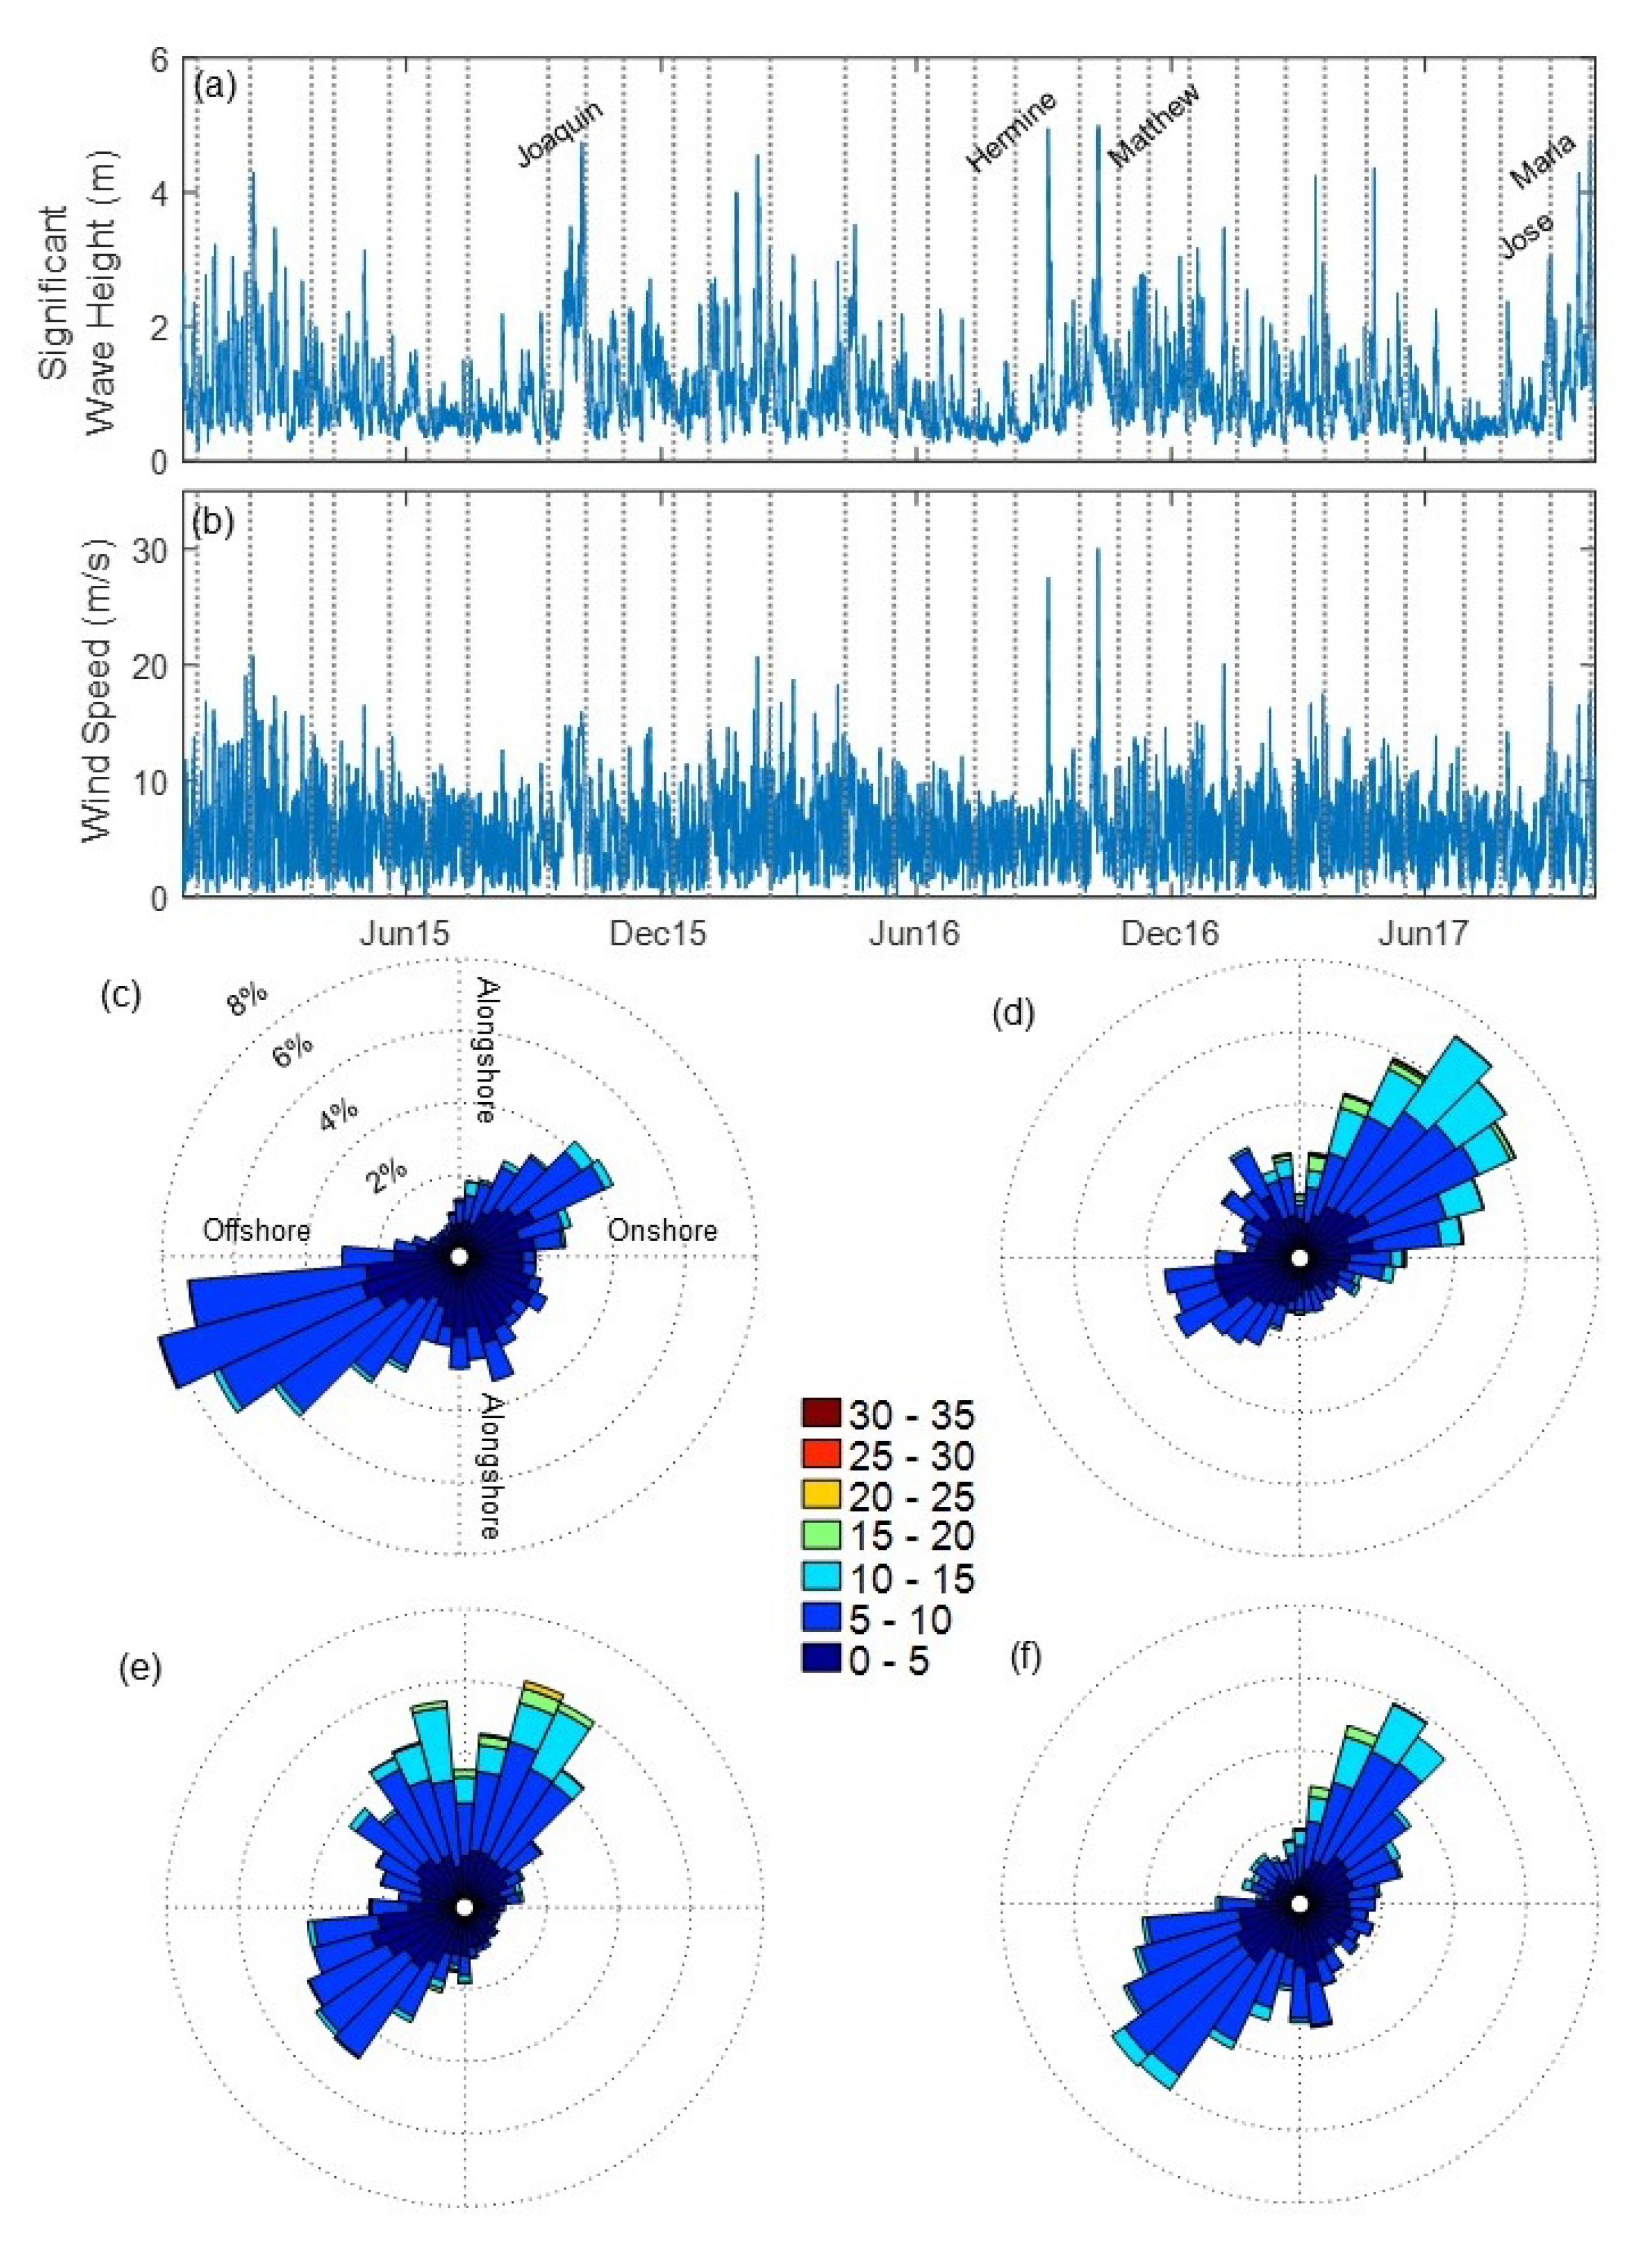
3.3. Wind and Wave Data
3.4. Eco-Morphodynamic Analysis
4. Results
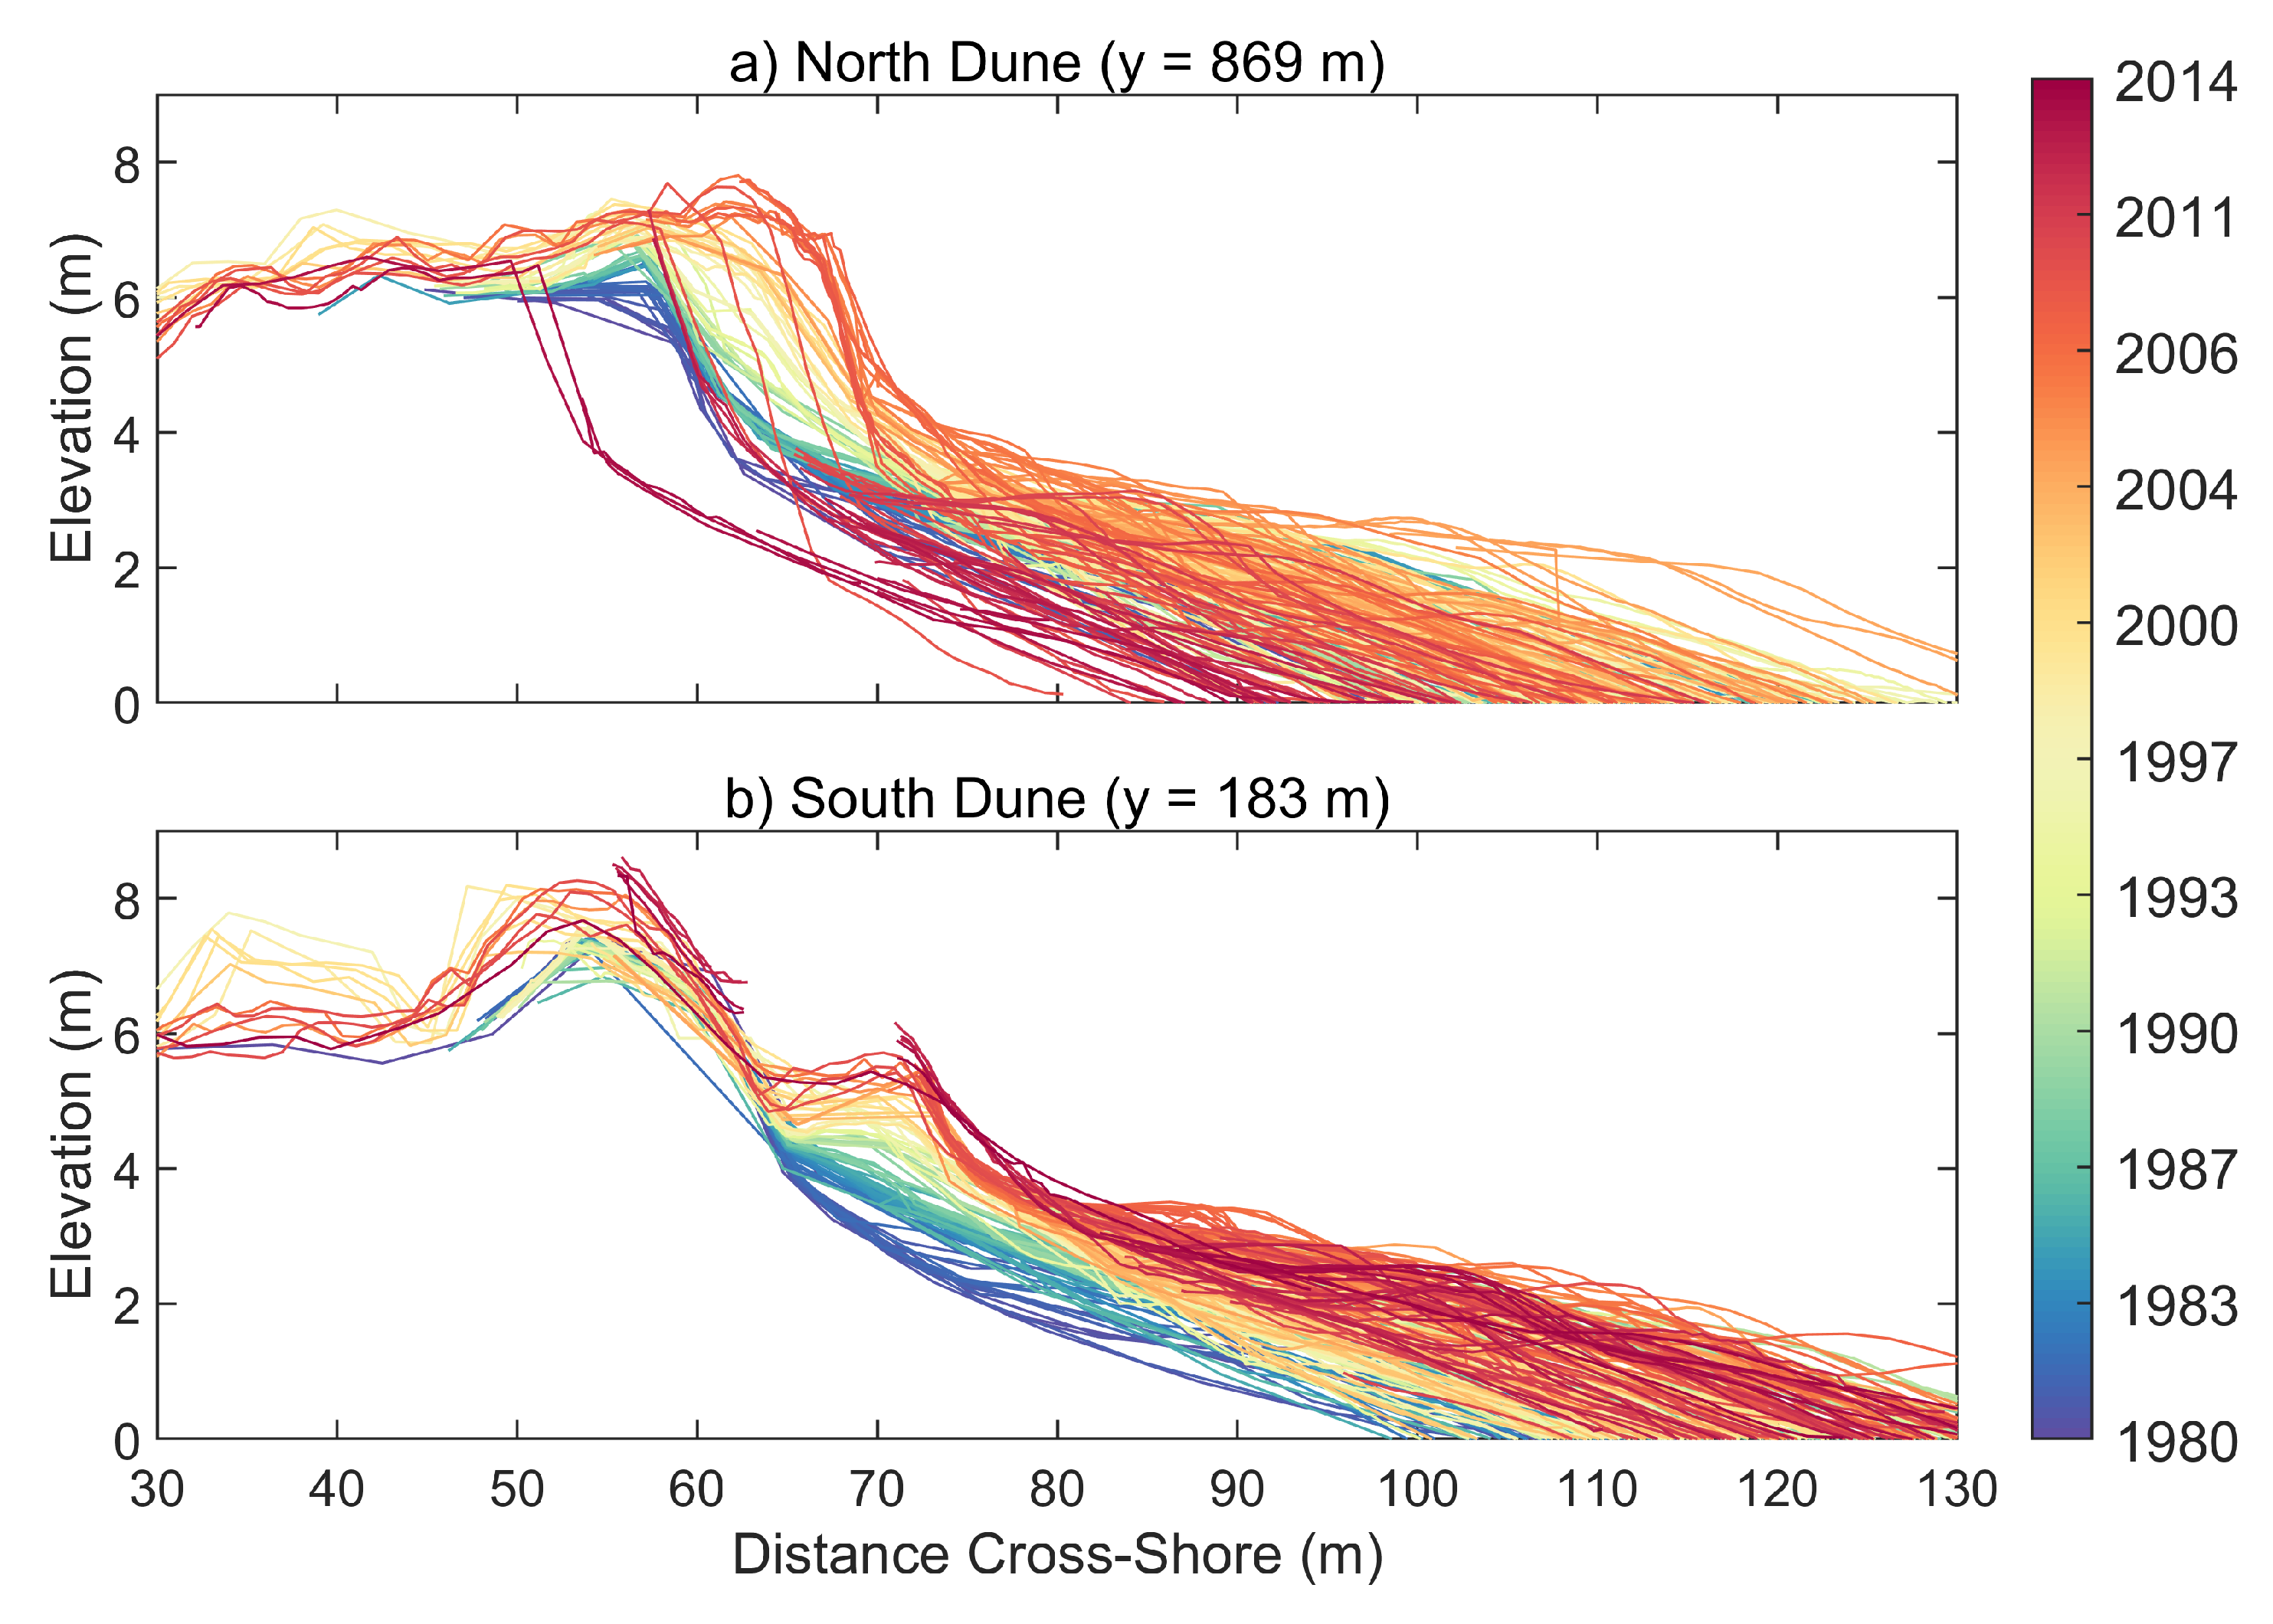
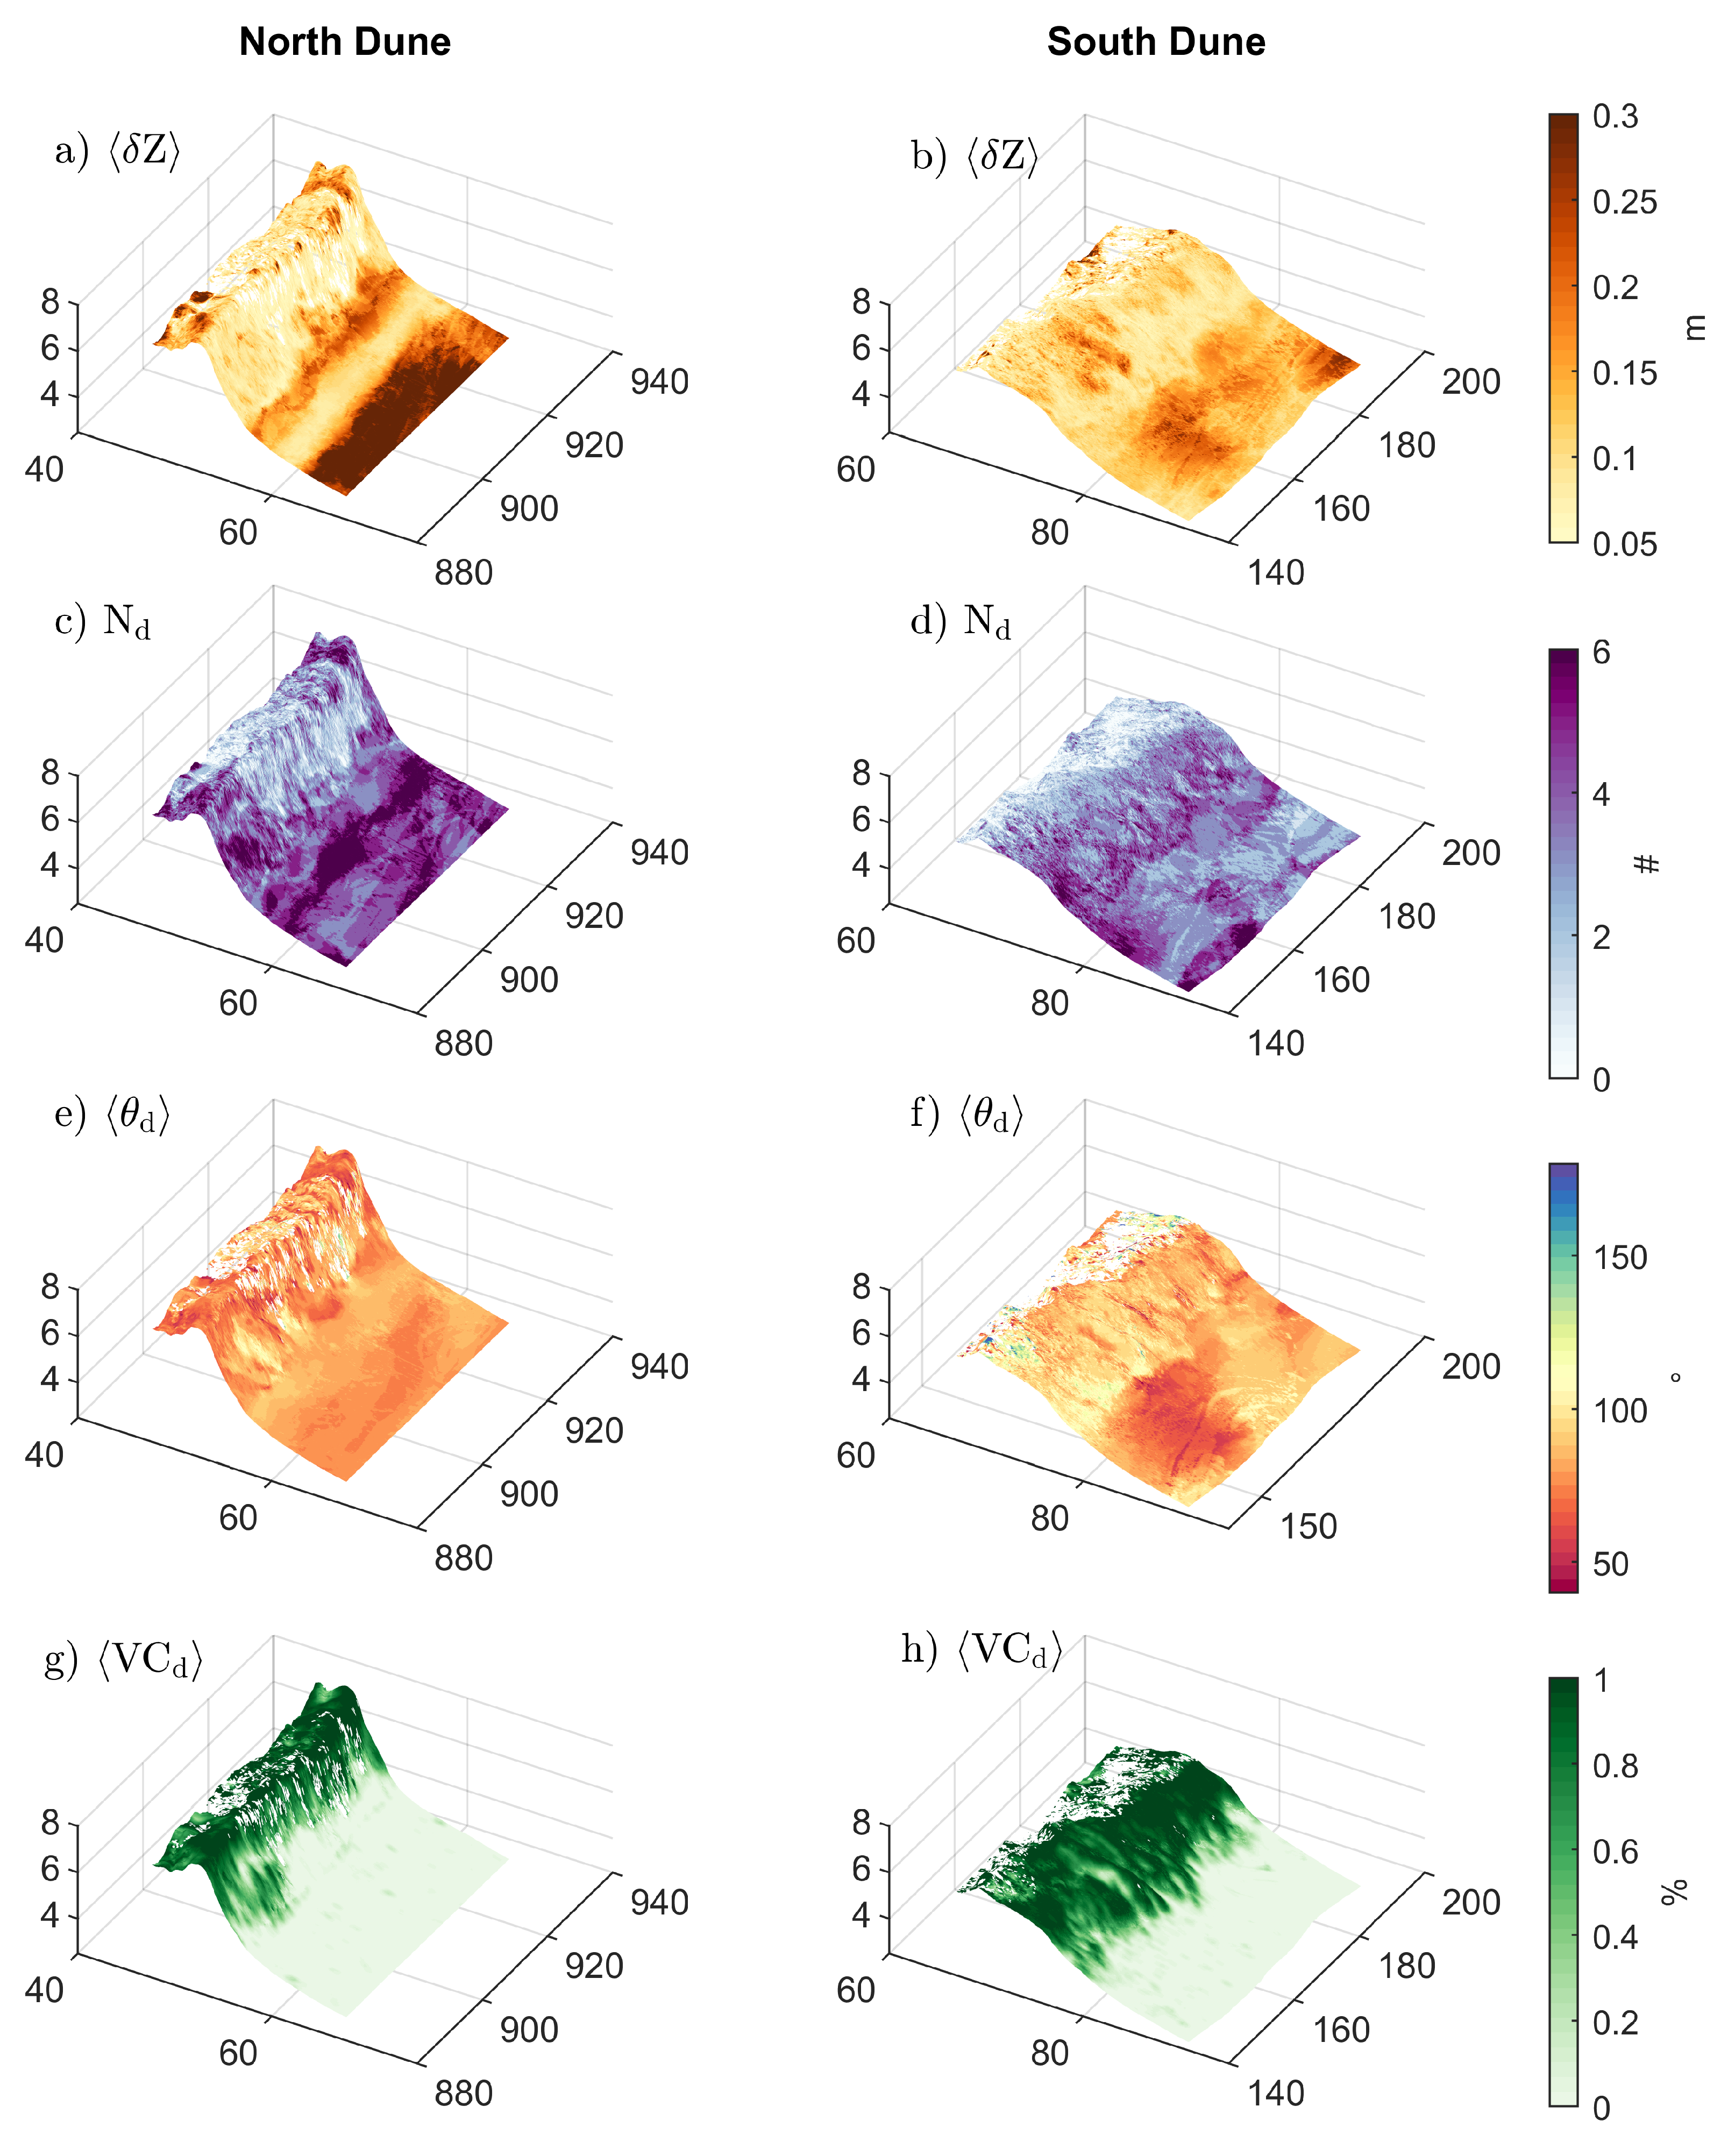
4.1. Dune Characteristics
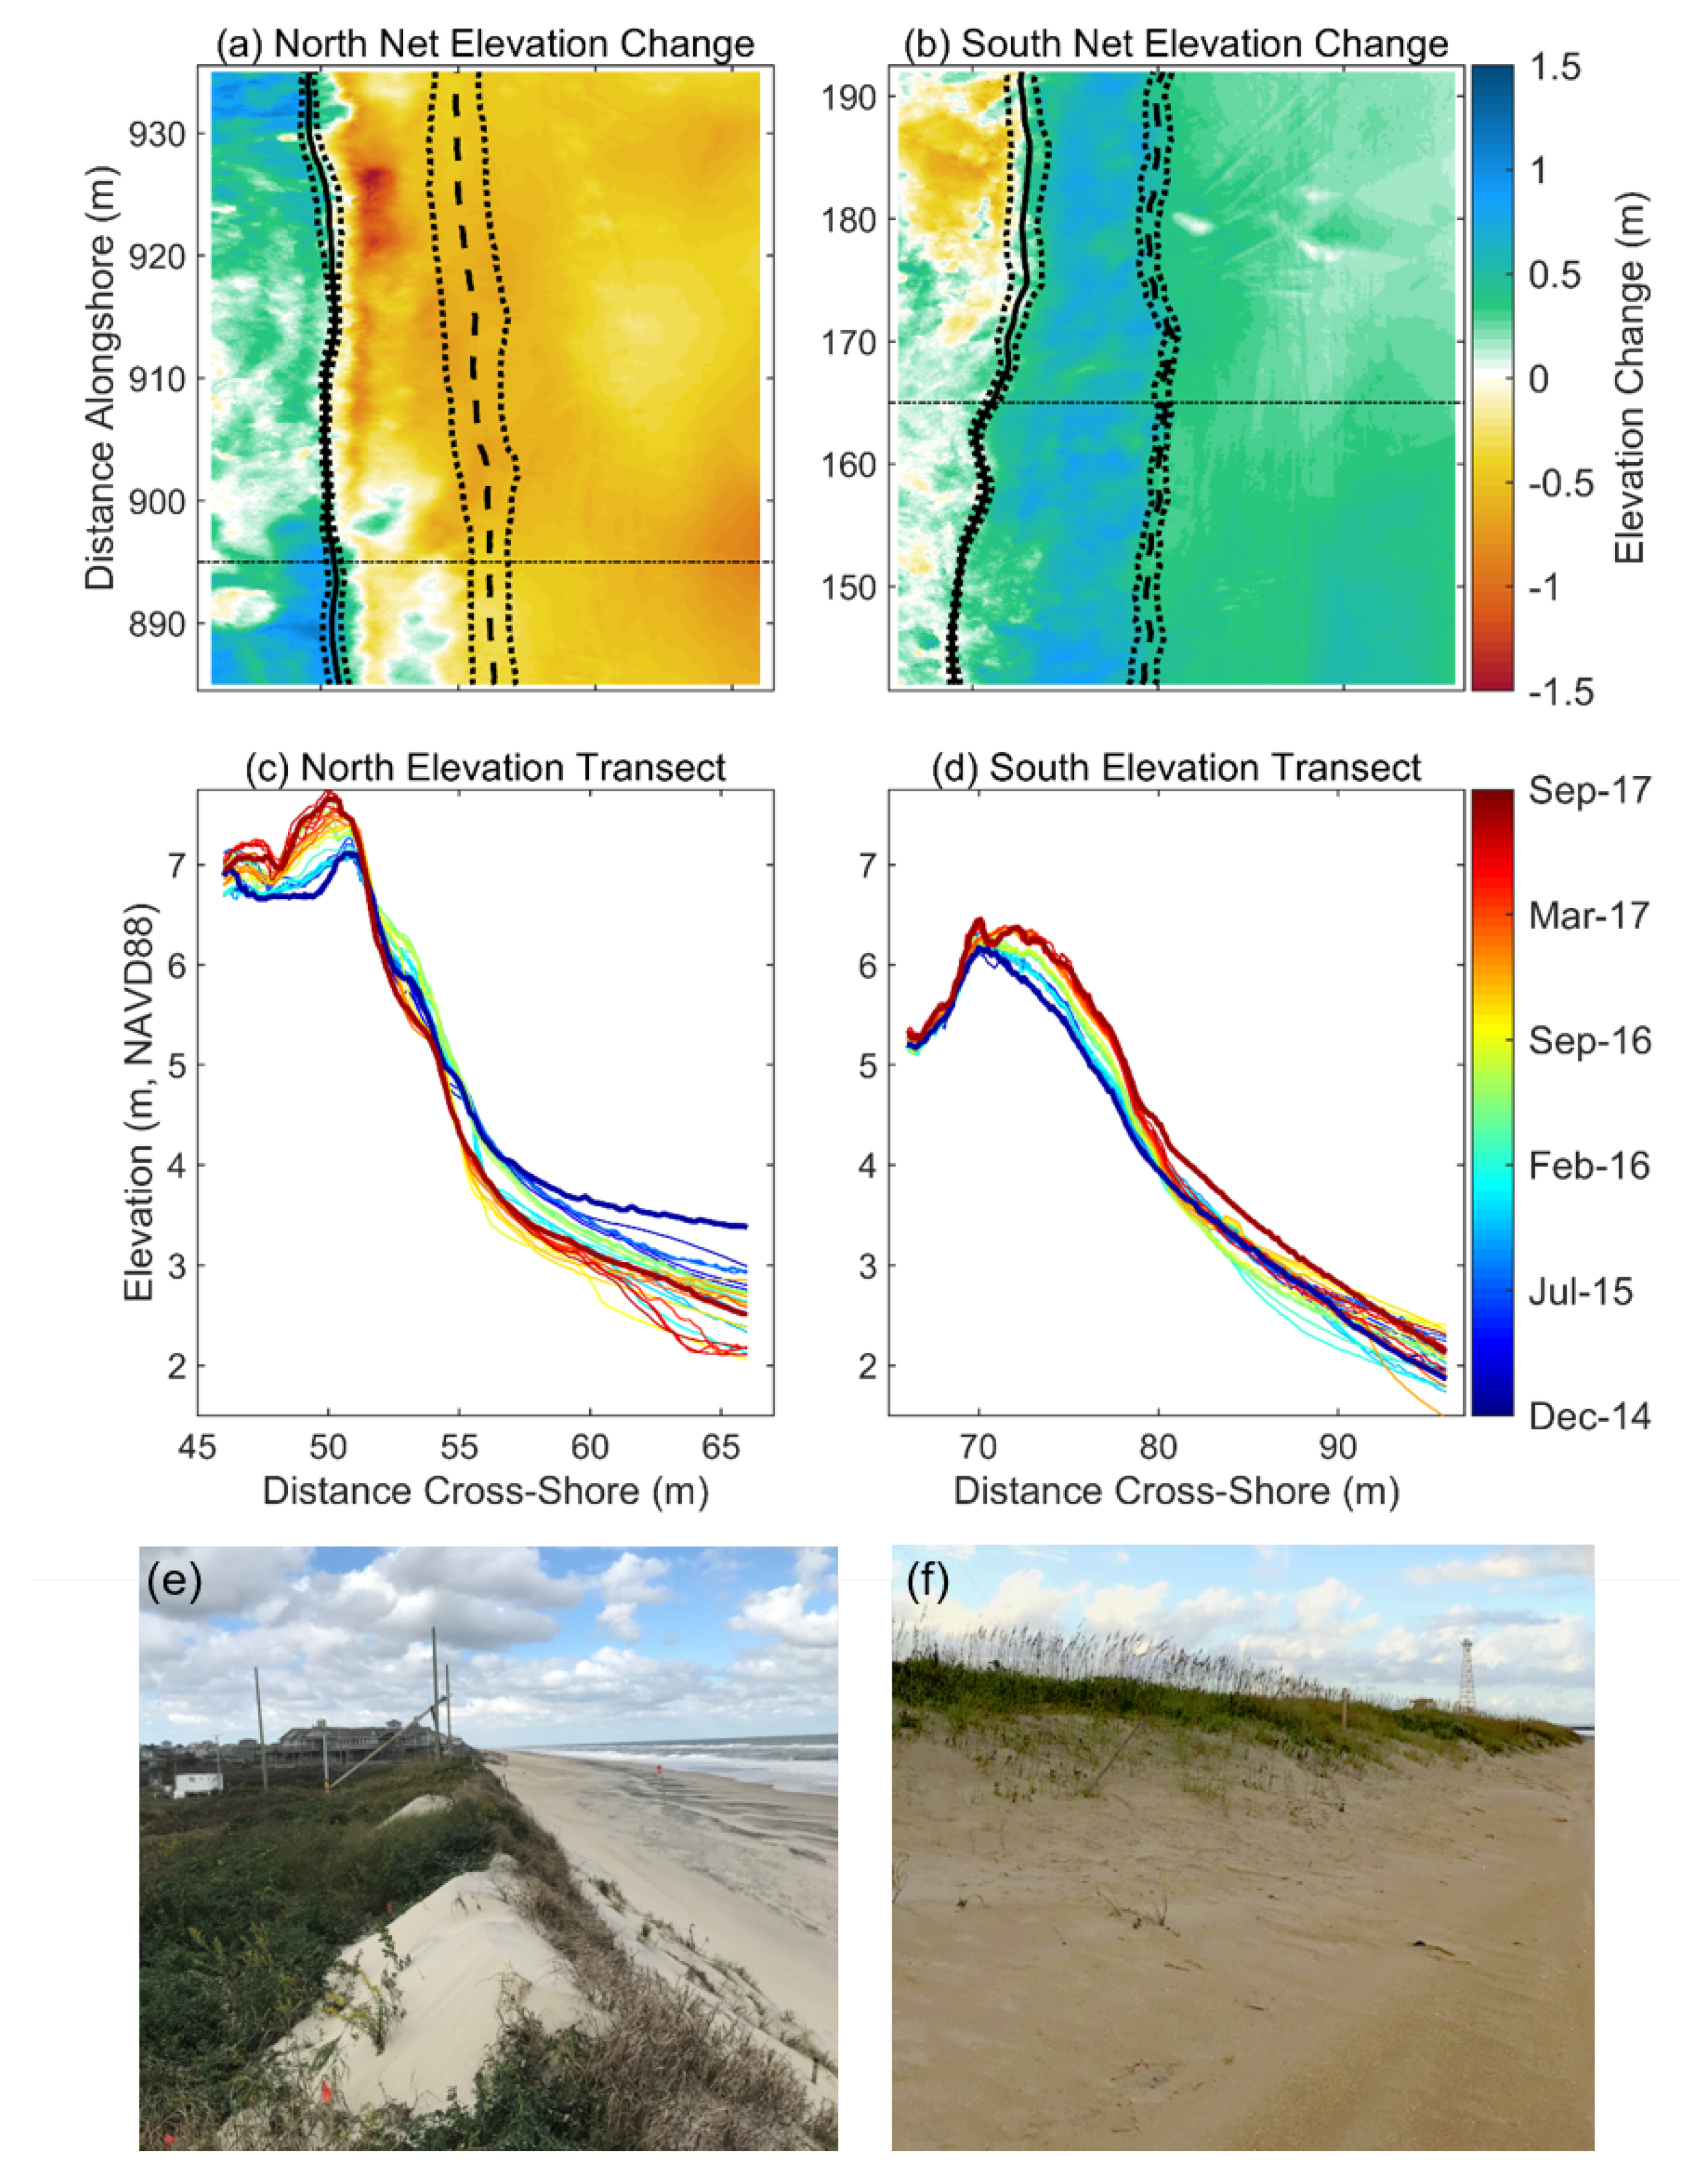
4.2. Storm Response
4.3. Vegetation
4.4. Temporal Variability in Dune Growth and Vegetation
4.5. Intra- and Inter-Site Spatial Variability in Dune Growth
5. Discussion
5.1. Scales of Spatial and Temporal Variability in Dune Evolution
5.2. Alongshore Variations in Beach and Nearshore Morphology
5.3. Implications for Management
5.4. Value-Added from High-Resolution Terrestrial Lidar Scanning
6. Conclusions
Author Contributions
Funding
Acknowledgments
Conflicts of Interest
References
- Van Slobbe, E.; de Vriend, H.J.; Aarninkhof, S.; Lulofs, K.; de Vries, M.; Dircke, P. Building with Nature: In search of resilient storm surge protection strategies. Nat. Hazards 2013, 66, 1461–1480. [Google Scholar] [CrossRef]
- Hanley, M.; Hoggart, S.; Simmonds, D.; Bichot, A.; Colangelo, M.; Bozzeda, F.; Heurtefeux, H.; Ondiviela, B.; Ostrowski, R.; Recio, M.; et al. Shifting sands? Coastal protection by sand banks, beaches and dunes. Coast. Eng. 2014, 87, 136–146. [Google Scholar] [CrossRef]
- Bridges, T.S.; Burks-Copes, K.A.; Bates, M.E.; Collier, Z.A.; Fischenich, J.C.; Piercy, C.D.; Russo, E.J.; Shafer, D.J.; Suedel, B.C.; Gailani, J.Z.; et al. Use of Natural and Nature-Based Features (NNBF) for Coastal Resilience; US Army Engineer and Research Development Center: Vicksburg, MS, USA, 2015; ERDC SR015-1; p. 477. [Google Scholar]
- Sutton-Grier, A.E.; Wowk, K.; Bamford, H. Future of our coasts: The potential for natural and hybrid infrastructure to enhance the resilience of our coastal communities, economies and ecosystems. Environ. Sci. Policy 2015, 51, 137–148. [Google Scholar] [CrossRef]
- De Lillis, M.; Costanzo, L.; Bianco, P.; Tinelli, A. Sustainability of sand dune restoration along the coast of the Tyrrhenian Sea. J. Coast. Conserv. 2004, 10, 93–100. [Google Scholar] [CrossRef]
- Grafals-Soto, R.; Nordstrom, K. Sand fences in the coastal zone: Intended and unintended effects. Environ. Manag. 2009, 44, 420–429. [Google Scholar] [CrossRef]
- Nordstrom, K.F.; Jackson, N.L. Foredune restoration in urban settings. In Restoration of Coastal Dunes; Springer: Berlin/Heidelberg, Germany, 2013; pp. 17–31. [Google Scholar]
- Harley, M.D.; Ciavola, P. Managing local coastal inundation risk using real-time forecasts and artificial dune placements. Coast. Eng. 2013, 77, 77–90. [Google Scholar] [CrossRef]
- Biel, R.G.; Hacker, S.D.; Ruggiero, P.; Cohn, N.; Seabloom, E.W. Coastal protection and conservation on sandy beaches and dunes: Context-dependent tradeoffs in ecosystem service supply. Ecosphere 2017, 8. [Google Scholar] [CrossRef]
- Kobayashi, N. Analytical solution for dune erosion by storms. J. Waterw. Port Coast. Ocean Eng. 1987, 113, 401–418. [Google Scholar] [CrossRef]
- Morton, R.A.; Sallenger, A.H., Jr. Morphological impacts of extreme storms on sandy beaches and barriers. J. Coast. Res. 2003, 19, 560–573. [Google Scholar]
- Larson, M.; Erikson, L.; Hanson, H. An analytical model to predict dune erosion due to wave impact. Coast. Eng. 2004, 51, 675–696. [Google Scholar] [CrossRef]
- Priestas, A.M.; Fagherazzi, S. Morphological barrier island changes and recovery of dunes after Hurricane Dennis, St. George Island, Florida. Geomorphology 2010, 114, 614–626. [Google Scholar] [CrossRef]
- Sallenger, A. Storm impact scale for barrier islands. J. Coast. Res. 2000, 16, 890–895. [Google Scholar]
- Johnson, B.; Kobayashi, N.; Gravens, M. Cross-Shore Numerical Model CSHORE for Waves, Currents, Sediment Transport and Beach Profile Evolution; Technical Report Report ERDC/CHL-TR-12-22; U.S. Army Corps of Engineers Coastal Engineering Research Center: Vicksburg, MS, USA, 2012. [Google Scholar]
- van Thiel de Vries, J.; Van Gent, M.; Walstra, D.; Reniers, A. Analysis of dune erosion processes in large-scale flume experiments. Coast. Eng. 2008, 55, 1028–1040. [Google Scholar] [CrossRef]
- Cohn, N.; Ruggiero, P.; García-Medina, G.; Anderson, D.; Serafin, K.; Biel, R. Environmental and morphologic control on wave induced dune response. Geomorphology 2019, 329, 108–128. [Google Scholar] [CrossRef]
- Splinter, K.D.; Kearney, E.T.; Turner, I.L. Drivers of alongshore variable dune erosion during a storm event: Observations and modelling. Coast. Eng. 2018, 131, 31–41. [Google Scholar] [CrossRef]
- Overbeck, J.R.; Long, J.W.; Stockdon, H.F. Testing model parameters for wave-induced dune erosion using observations from Hurricane Sandy. Geophys. Res. Lett. 2017, 44, 937–945. [Google Scholar] [CrossRef]
- Walker, I.J.; Davidson-Arnott, R.G.; Bauer, B.O.; Hesp, P.A.; Delgado-Fernandez, I.; Ollerhead, J.; Smyth, T.A. Scale-dependent perspectives on the geomorphology and evolution of beach-dune systems. Earth-Sci. Rev. 2017, 171, 220–253. [Google Scholar] [CrossRef]
- Jackson, N.; Sherman, D.; Hesp, P.; Klein, A.; Ballasteros, F., Jr.; Nordstrom, K. Small-scale spatial variations in aeolian sediment transport on a fine-sand beach. J. Coast. Res. 2006, 1, 379–383. [Google Scholar]
- Davidson-Arnott, R.G.; Yang, Y.; Ollerhead, J.; Hesp, P.A.; Walker, I.J. The effects of surface moisture on aeolian sediment transport threshold and mass flux on a beach. Earth Surf. Process. Landforms 2008, 33, 55–74. [Google Scholar] [CrossRef]
- Sherman, D.J.; Li, B.; Farrell, E.J.; Ellis, J.T.; Cox, W.D.; Maia, L.P.; Sousa, P.H. Measuring aeolian saltation: A comparison of sensors. J. Coast. Res. 2011, 280–290. [Google Scholar] [CrossRef]
- de Vries, S.; Arens, S.; de Schipper, M.; Ranasinghe, R. Aeolian sediment transport on a beach with a varying sediment supply. Aeolian Res. 2014, 15, 235–244. [Google Scholar] [CrossRef]
- Psuty, N. The coastal foredune: A morphological basis for regional coastal dune development. In Coastal Dunes; Martínez, M., Psuty, N., Eds.; Springer: Berlin, Germany, 2004; pp. 11–27. [Google Scholar]
- de Vries, S.; Southgate, H.; Kanning, W.; Ranasinghe, R. Dune behavior and aeolian transport on decadal timescales. Coast. Eng. 2012, 67, 41–53. [Google Scholar] [CrossRef]
- Ollerhead, J.; Davidson-Arnott, R.; Walker, I.J.; Mathew, S. Annual to decadal morphodynamics of the foredune system at Greenwich Dunes, Prince Edward Island, Canada. Earth Surf. Process. Landforms 2012, 38, 284–298. [Google Scholar] [CrossRef]
- Cohn, N.; Ruggiero, P.; de Vries, S.; Kaminsky, G. New insights on the relative contributions of marine and aeolian processes to coastal foredune growth. Geophys. Res. Lett. 2018, 45, 4965–4973. [Google Scholar] [CrossRef]
- Hoonhout, B.M.; de Vries, S. A process-based model for aeolian sediment transport and spatiotemporal varying sediment availability. J. Geophys. Res. Earth Surf. 2016, 121, 1555–1575. [Google Scholar] [CrossRef]
- Bauer, B.O.; Davidson-Arnott, R.G. A general framework for modeling sediment supply to coastal dunes including wind angle, beach geometry, and fetch effects. Geomorphology 2003, 49, 89–108. [Google Scholar] [CrossRef]
- Bauer, B.; Davidson-Arnott, R.; Hesp, P.; Namikas, S.; Ollerhead, J.; Walker, I. Aeolian sediment transport on a beach: Surface moisture, wind fetch, and mean transport. Geomorphology 2009, 105, 106–116. [Google Scholar] [CrossRef]
- Delgado-Fernandez, I. A review of the application of the fetch effect to modelling sand supply to coastal foredunes. Aeolian Res. 2010, 2, 61–70. [Google Scholar] [CrossRef]
- Short, A.; Hesp, P. Wave, beach and dune interactions in southeastern Australia. Mar. Geol. 1982, 48, 259–284. [Google Scholar] [CrossRef]
- Buckley, R. The effect of sparse vegetation on the transport of dune sand by wind. Nature 1987, 325. [Google Scholar] [CrossRef]
- Hesp, P. A review of biological and geomorphological processes involved in the initiation and development of incipient foredunes. Proc. R. Soc. Edinburg B 1989, 96, 181–201. [Google Scholar] [CrossRef]
- Davidson-Arnott, R.G.; MacQuarrie, K.; Aagaard, T. The effect of wind gusts, moisture content and fetch length on sand transport on a beach. Geomorphology 2005, 68, 115–129. [Google Scholar] [CrossRef]
- Moulton, M.A.; Hesp, P.A.; Miot da Silva, G.; Bouchez, C.; Lavy, M.; Fernandez, G.B. Changes in vegetation cover on the Younghusband Peninsula transgressive dunefields (Australia) 1949–2017. Earth Surf. Process. Landforms 2018, 44, 459–470. [Google Scholar] [CrossRef]
- Cohn, N.; Hoonhout, B.M.; Goldstein, E.B.; De Vries, S.; Moore, L.J.; Durán Vinent, O.; Ruggiero, P. Exploring Marine and Aeolian Controls on Coastal Foredune Growth Using a Coupled Numerical Model. J. Mar. Sci. Eng. 2019, 7, 13. [Google Scholar] [CrossRef]
- Roelvink, D.; Costas, S. Coupling nearshore and aeolian processes: XBeach and Duna process-based models. Environ. Modell. Softw. 2019, 115, 98–112. [Google Scholar] [CrossRef]
- Zarnetske, P.L.; Hacker, S.D.; Seabloom, E.W.; Ruggiero, P.; Killian, J.R.; Maddux, T.B.; Cox, D. Biophysical feedback mediates effects of invasive grasses on coastal dune shape. Ecology 2012, 93, 1439–1450. [Google Scholar] [CrossRef]
- Smyth, T.A.; Hesp, P.A. Aeolian dynamics of beach scraped ridge and dyke structures. Coast. Eng. 2015, 99, 38–45. [Google Scholar] [CrossRef]
- Hesp, P.A.; Smyth, T.A. Nebkha flow dynamics and shadow dune formation. Geomorphology 2017, 282, 27–38. [Google Scholar] [CrossRef]
- Hesp, P.A. The Formation of Shadow Dunes. SEPM J. Sediment. Res. 1981, 51. [Google Scholar] [CrossRef]
- Durán, O.; Moore, L.J. Vegetation controls on the maximum size of coastal dunes. Proc. Natl. Acad. Sci. USA 2013, 110, 17217–17222. [Google Scholar] [CrossRef]
- Sherman, D.J.; Bauer, B.O. Dynamics of beach-dune systems. Prog. Phys. Geogr. 1993, 17, 413–447. [Google Scholar] [CrossRef]
- Sherman, D.J. Problems of scale in the modeling and interpretation of coastal dunes. Mar. Geol. 1995, 124, 339–349. [Google Scholar] [CrossRef]
- Elko, N.; Brodie, K.; Stockdon, H.; Nordstrom, K.; Houser, C.; McKenna, K.; Moore, L.; Rosati, J.; Ruggiero, R.; Thuman, R.; Walker, I. Dune management challenges on developed coasts. Shore Beach 2016, 84, 15–28. [Google Scholar]
- Sigren, J.M.; Figlus, J.; Highfield, W.; Feagin, R.A.; Armitage, A.R. The Effects of Coastal Dune Volume and Vegetation on Storm-Induced Property Damage: Analysis from Hurricane Ike. J. Coast. Res. 2018, 34, 164–173. [Google Scholar] [CrossRef]
- Ruggiero, P.; Kaminsky, G.M.; Gelfenbaum, G.; Cohn, N. Morphodynamics of prograding beaches: A synthesis of seasonal- to century-scale observations of the Columbia River littoral cell. Mar. Geol. 2016, 376, 51–68. [Google Scholar] [CrossRef]
- Houser, C.; Wernette, P.; Rentschlar, E.; Jones, H.; Hammond, B.; Trimble, S. Post-storm beach and dune recovery: Implications for barrier island resilience. Geomorphology 2015, 234, 54–63. [Google Scholar] [CrossRef]
- Eisemann, E.R.; Wallace, D.J.; Buijsman, M.C.; Pierce, T. Response of a vulnerable barrier island to multi-year storm impacts: LiDAR-data-inferred morphodynamic changes on Ship Island, Mississippi, USA. Geomorphology 2018, 313, 58–71. [Google Scholar] [CrossRef]
- de Vries, S.; Verheijen, A.; Hoonhout, B.; Vos, S.; Cohn, N.; Ruggiero, P. Measured spatial variability of beach erosion due to aeolian processes. In Proceedings of the Coastal Dynamics Conference 2017, Helsingør, Denmark, 12–16 June 2017. [Google Scholar]
- Smith, A.; Gares, P.A.; Wasklewicz, T.; Hesp, P.A.; Walker, I.J. Three years of morphologic changes at a bowl blowout, Cape Cod, USA. Geomorphology 2017, 295, 452–466. [Google Scholar] [CrossRef]
- Donker, J.; van Maarseveen, M.; Ruessink, G. Spatio-Temporal Variations in Foredune Dynamics Determined with Mobile Laser Scanning. J. Mar. Sci. Eng. 2018, 6, 126. [Google Scholar] [CrossRef]
- O’Dea, A.; Brodie, K.; Hartzell, P. Continuous Coastal Monitoring with an Automated Terrestrial Lidar Scanner. J. Mar. Sci. Eng. 2019, 7, 37. [Google Scholar] [CrossRef]
- Phillips, M.; Blenkinsopp, C.; Splinter, K.; Harley, M.; Turner, I. Modes of berm and beachface recovery following storm reset: Observations using a continuously scanning lidar. J. Geophys. Res. Earth Surf. 2019. [Google Scholar] [CrossRef]
- Palmsten, M.; Brodie, K. Spatial Variability of Coastal Foredune Evolution, Part B: Timescales of Years to Decades. J. Mar. Sci. Eng. 2019. in review. [Google Scholar]
- Stauble, D.K. Long-Term Profile and Sediment Morphodynamics: Field Research Facility Case History; Technical Report; Coastal Engineering Research Center: Vicksburg, MS, USA, 1992. [Google Scholar]
- Plant, N.G.; Holman, R.A. Intertidal beach profile estimation using video images. Mar. Geol. 1997, 140, 1–24. [Google Scholar] [CrossRef]
- Lippmann, T.; Holman, R. The spatial and temporal variability of sand bar morphology. J. Geophys. Res. Ocean. 1990, 95, 11575–11590. [Google Scholar] [CrossRef]
- Lee, G.H.; Nicholls, R.J.; Birkemeier, W.A. Storm-driven variability of the beach-nearshore profile at Duck, North Carolina, USA, 1981–1991. Mar. Geol. 1998, 148, 163–177. [Google Scholar] [CrossRef]
- van Gaalen, J.F.; Tebbens, S.F.; Barton, C.C. Longshore sediment transport directions and rates from northern Maine to Tampa Bay, Florida: Literature compilation and interpretation. J. Coast. Res. 2016, 32, 1277–1301. [Google Scholar] [CrossRef]
- Birkemeier, W.; Dolan, R.; Fisher, N. The evolution of a barrier island: 1930–1980. Shore Beach 1984, 52, 2–12. [Google Scholar]
- Pianca, C.; Holman, R.; Siegle, E. Shoreline variability from days to decades: Results of long-term video imaging. J. Geophys. Res. Ocean. 2015, 120, 2159–2178. [Google Scholar] [CrossRef]
- Conery, I.; Brodie, K.; Spore, N.; Walsh, J. Terrestrial lidar monitoring of coastal foredune evolution in managed and unmanaged systems. Earth Surf. Process. Landforms 2019. in review. [Google Scholar]
- LeWinter, A. Characterization of the Overlook Crater and Lava Lake of Kīlauea Volcano through Terrestrial Laser Scanning. Master’s Thesis, University of Northern Colorado, Greeley, CO, USA, 2014. [Google Scholar]
- Ruggiero, P.; Kaminsky, G.M.; Gelfenbaum, G.; Voigt, B. Seasonal to Interannual Morphodynamics along a High-Energy Dissipative Littoral Cell. J. Coast. Res. 2005, 213, 553–578. [Google Scholar] [CrossRef]
- Gelfenbaum, G.; Stevens, A.W.; Miller, I.; Warrick, J.A.; Ogston, A.S.; Eidam, E. Large-scale dam removal on the Elwha River, Washington, USA: Coastal geomorphic change. Geomorphology 2015, 246, 649–668. [Google Scholar] [CrossRef]
- Stockdon, H.F.; Doran, K.S.; Sallenger, A.H. Extraction of Lidar-Based Dune-Crest Elevations for Use in Examining the Vulnerability of Beaches to Inundation During Hurricanes. J. Coast. Res. 2009, 10053, 59–65. [Google Scholar] [CrossRef]
- Yates, M.L.; Guza, R.T.; O’Reilly, W.C.; Hansen, J.E.; Barnard, P.L. Equilibrium shoreline response of a high wave energy beach. J. Geophys. Res. 2011, 116. [Google Scholar] [CrossRef]
- Davidson, M.; Splinter, K.; Turner, I. A simple equilibrium model for predicting shoreline change. Coast. Eng. 2013, 73, 191–202. [Google Scholar] [CrossRef]
- Davidson-Arnott, R.; Hesp, P.; Ollerhead, J.; Walker, I.; Bauer, B.; Delgado-Fernandez, I.; Smyth, T. Sediment Budget Controls on Foredune Height: Comparing Simulation Model Results with Field Data. Earth Surf. Process. Landforms 2018. [Google Scholar] [CrossRef]
- Holman, R.; Stanley, J. The history and technical capabilities of Argus. Coast. Eng. 2007, 54, 477–491. [Google Scholar] [CrossRef]
- Levy, G.F. Vegetative Study at the Duck Field Research Facility, Duck, North Carolina; Technical Report; Old Dominion University, Department of Biological Sciences: Norfolk, VA, USA, 1976. [Google Scholar]
- Goldstein, E.B.; Mullins, E.V.; Moore, L.J.; Biel, R.G.; Brown, J.K.; Hacker, S.D.; Jay, K.R.; Mostow, R.S.; Ruggiero, P.; Zinnert, J. Literature-based latitudinal distribution and possible range shifts of two US east coast dune grass species (Uniola paniculata and Ammophila breviligulata). PeerJ 2018, 6, e4932. [Google Scholar] [CrossRef]
- Arens, S.M. Patterns of sand transport on vegetated foredunes. Geomorphology 1996, 4, 339–350. [Google Scholar] [CrossRef]
- Hesp, P.A.; Walker, I.J.; Chapman, C.; Davidson-Arnott, R.; Bauer, B.O. Aeolian dynamics over a coastal foredune, Prince Edward Island, Canada. Earth Surf. Process. Landforms 2013, 38, 1566–1575. [Google Scholar] [CrossRef]
- Laporte-Fauret, Q.; Marieu, V.; Castelle, B.; Michalet, R.; Bujan, S.; Rosebery, D. Low-Cost UAV for High-Resolution and Large-Scale Coastal Dune Change Monitoring Using Photogrammetry. J. Mar. Sci. Eng. 2019, 7, 63. [Google Scholar] [CrossRef]
- Delgado-Fernandez, I.; Davidson-Arnott, R. Meso-scale aeolian sediment input to coastal dunes: The nature of aeolian transport events. Geomorphology 2011, 217–232. [Google Scholar] [CrossRef]
- Lynch, K.; Jackson, D.W.; Cooper, J.A.G. Foredune accretion under offshore winds. Geomorphology 2009, 105, 139–146. [Google Scholar] [CrossRef]
- Bauer, B.O.; Davidson-Arnott, R.G.D.; Walker, I.J.; Hesp, P.A.; Ollerhead, J. Wind direction and complex sediment transport response across a beach–dune system. Earth Surf. Process. Landforms 2012, 37, 1661–1677. [Google Scholar] [CrossRef]
- Walker, I.J.; Hesp, P.A.; Davidson-Arnott, R.G.D.; Ollerhead, J. Topographic Steering of Alongshore Airflow over a Vegetated Foredune: Greenwich Dunes, Prince Edward Island, Canada. J. Coast. Res. 2006, 22, 1278–1291. [Google Scholar] [CrossRef]
- Walker, I.J.; Hesp, P.A.; Davidson-Arnott, R.; O.Bauer, B.; Namikas, S.L.; Ollerhead, J. Responses of three-dimensional flow to variations in the angle of incident wind and profile form of dunes: Greenwich Dunes, Prince Edward Island, Canada. Geomorphology 2009, 105, 127–138. [Google Scholar] [CrossRef]
- Hesp, P.A.; Smyth, T.A.; Nielsen, P.; J.Walker, I.; O.Bauer, B.; Davidson-Arnott, R. Flow deflection over a foredune. Geomorphology 2015, 230, 64–74. [Google Scholar] [CrossRef]
- Guedes, R.; Bryan, K.R.; Coco, G.; Holman, R.A. The effects of tides on swash statistics on an intermediate beach. J. Geophys. Res. 2011, 116. [Google Scholar] [CrossRef]
- Soldini, L.; Antuono, M.; Brocchini, M. Numerical Modeling of the Influence of the Beach Profile on Wave Run-Up. J. Waterw. Port Coast. Ocean Eng. 2013, 139, 61–71. [Google Scholar] [CrossRef]
- Brodie, K.L.; Spore, N.J. Foredune classification and storm response: Automated analysis of terrestrial lidar DEMs. In Proceedings of the Coastal Sediments 2015, San Diego, CA, USA, 11–15 May 2015; World Scientific: Singapore, 2015. [Google Scholar]
- Wiedemann, A.M.; Pickart, A. TheAmmophila problem on the Northwest coast of North America. Landsc. Urban Plan. 1996, 34, 287–299. [Google Scholar] [CrossRef]
- Mullins, E.; Moore, L.J.; Goldstein, E.B.; Jass, T.; Bruno, J.; Durán Vinent, O. Investigating dune-building feedback at the plant level: Insights from a multispecies field experiment. Earth Surf. Process. Landforms 2019. [Google Scholar] [CrossRef]
- Jackson, N.L.; Nordstrom, K.F. Aeolian sediment transport and landforms in managed coastal systems: A review. Aeolian Res. 2011, 3, 181–196. [Google Scholar] [CrossRef]
- Mancini, F.; Dubbini, M.; Gattelli, M.; Stecchi, F.; Fabbri, S.; Gabbianelli, G. Using unmanned aerial vehicles (UAV) for high-resolution reconstruction of topography: The structure from motion approach on coastal environments. Remote Sens. 2013, 5, 6880–6898. [Google Scholar] [CrossRef]
- Ruessink, B.; Arens, S.; Kuipers, M.; Donker, J. Coastal dune dynamics in response to excavated foredune notches. Aeolian Res. 2018, 31, 3–17. [Google Scholar] [CrossRef]
- Brodie, K.L.; Bruder, B.L.; Slocum, R.K.; Spore, N.J. Simultaneous Mapping of Coastal Topography and Bathymetry from a Lightweight Multi-Camera UAS. IEEE Trans. Geosci. Remote Sens. 2019, in press. [Google Scholar]


| North Dune | South Dune | |
|---|---|---|
| Mean (m) | 0.018 | 0.015 |
| Min (m) | 0.013 | 0.001 |
| Max (m) | 0.025 | 0.020 |
| Mean Number Planes | 272 | 391 |
| Min Number Planes | 122 | 67 |
| Max Number Planes | 424 | 523 |
© 2019 by the authors. Licensee MDPI, Basel, Switzerland. This article is an open access article distributed under the terms and conditions of the Creative Commons Attribution (CC BY) license (http://creativecommons.org/licenses/by/4.0/).
Share and Cite
Brodie, K.; Conery, I.; Cohn, N.; Spore, N.; Palmsten, M. Spatial Variability of Coastal Foredune Evolution, Part A: Timescales of Months to Years. J. Mar. Sci. Eng. 2019, 7, 124. https://doi.org/10.3390/jmse7050124
Brodie K, Conery I, Cohn N, Spore N, Palmsten M. Spatial Variability of Coastal Foredune Evolution, Part A: Timescales of Months to Years. Journal of Marine Science and Engineering. 2019; 7(5):124. https://doi.org/10.3390/jmse7050124
Chicago/Turabian StyleBrodie, Katherine, Ian Conery, Nicholas Cohn, Nicholas Spore, and Margaret Palmsten. 2019. "Spatial Variability of Coastal Foredune Evolution, Part A: Timescales of Months to Years" Journal of Marine Science and Engineering 7, no. 5: 124. https://doi.org/10.3390/jmse7050124
APA StyleBrodie, K., Conery, I., Cohn, N., Spore, N., & Palmsten, M. (2019). Spatial Variability of Coastal Foredune Evolution, Part A: Timescales of Months to Years. Journal of Marine Science and Engineering, 7(5), 124. https://doi.org/10.3390/jmse7050124