Assessing Natural and Mechanical Dune Performance in a Post-Hurricane Environment


Abstract
:1. Introduction
2. Materials and Methods
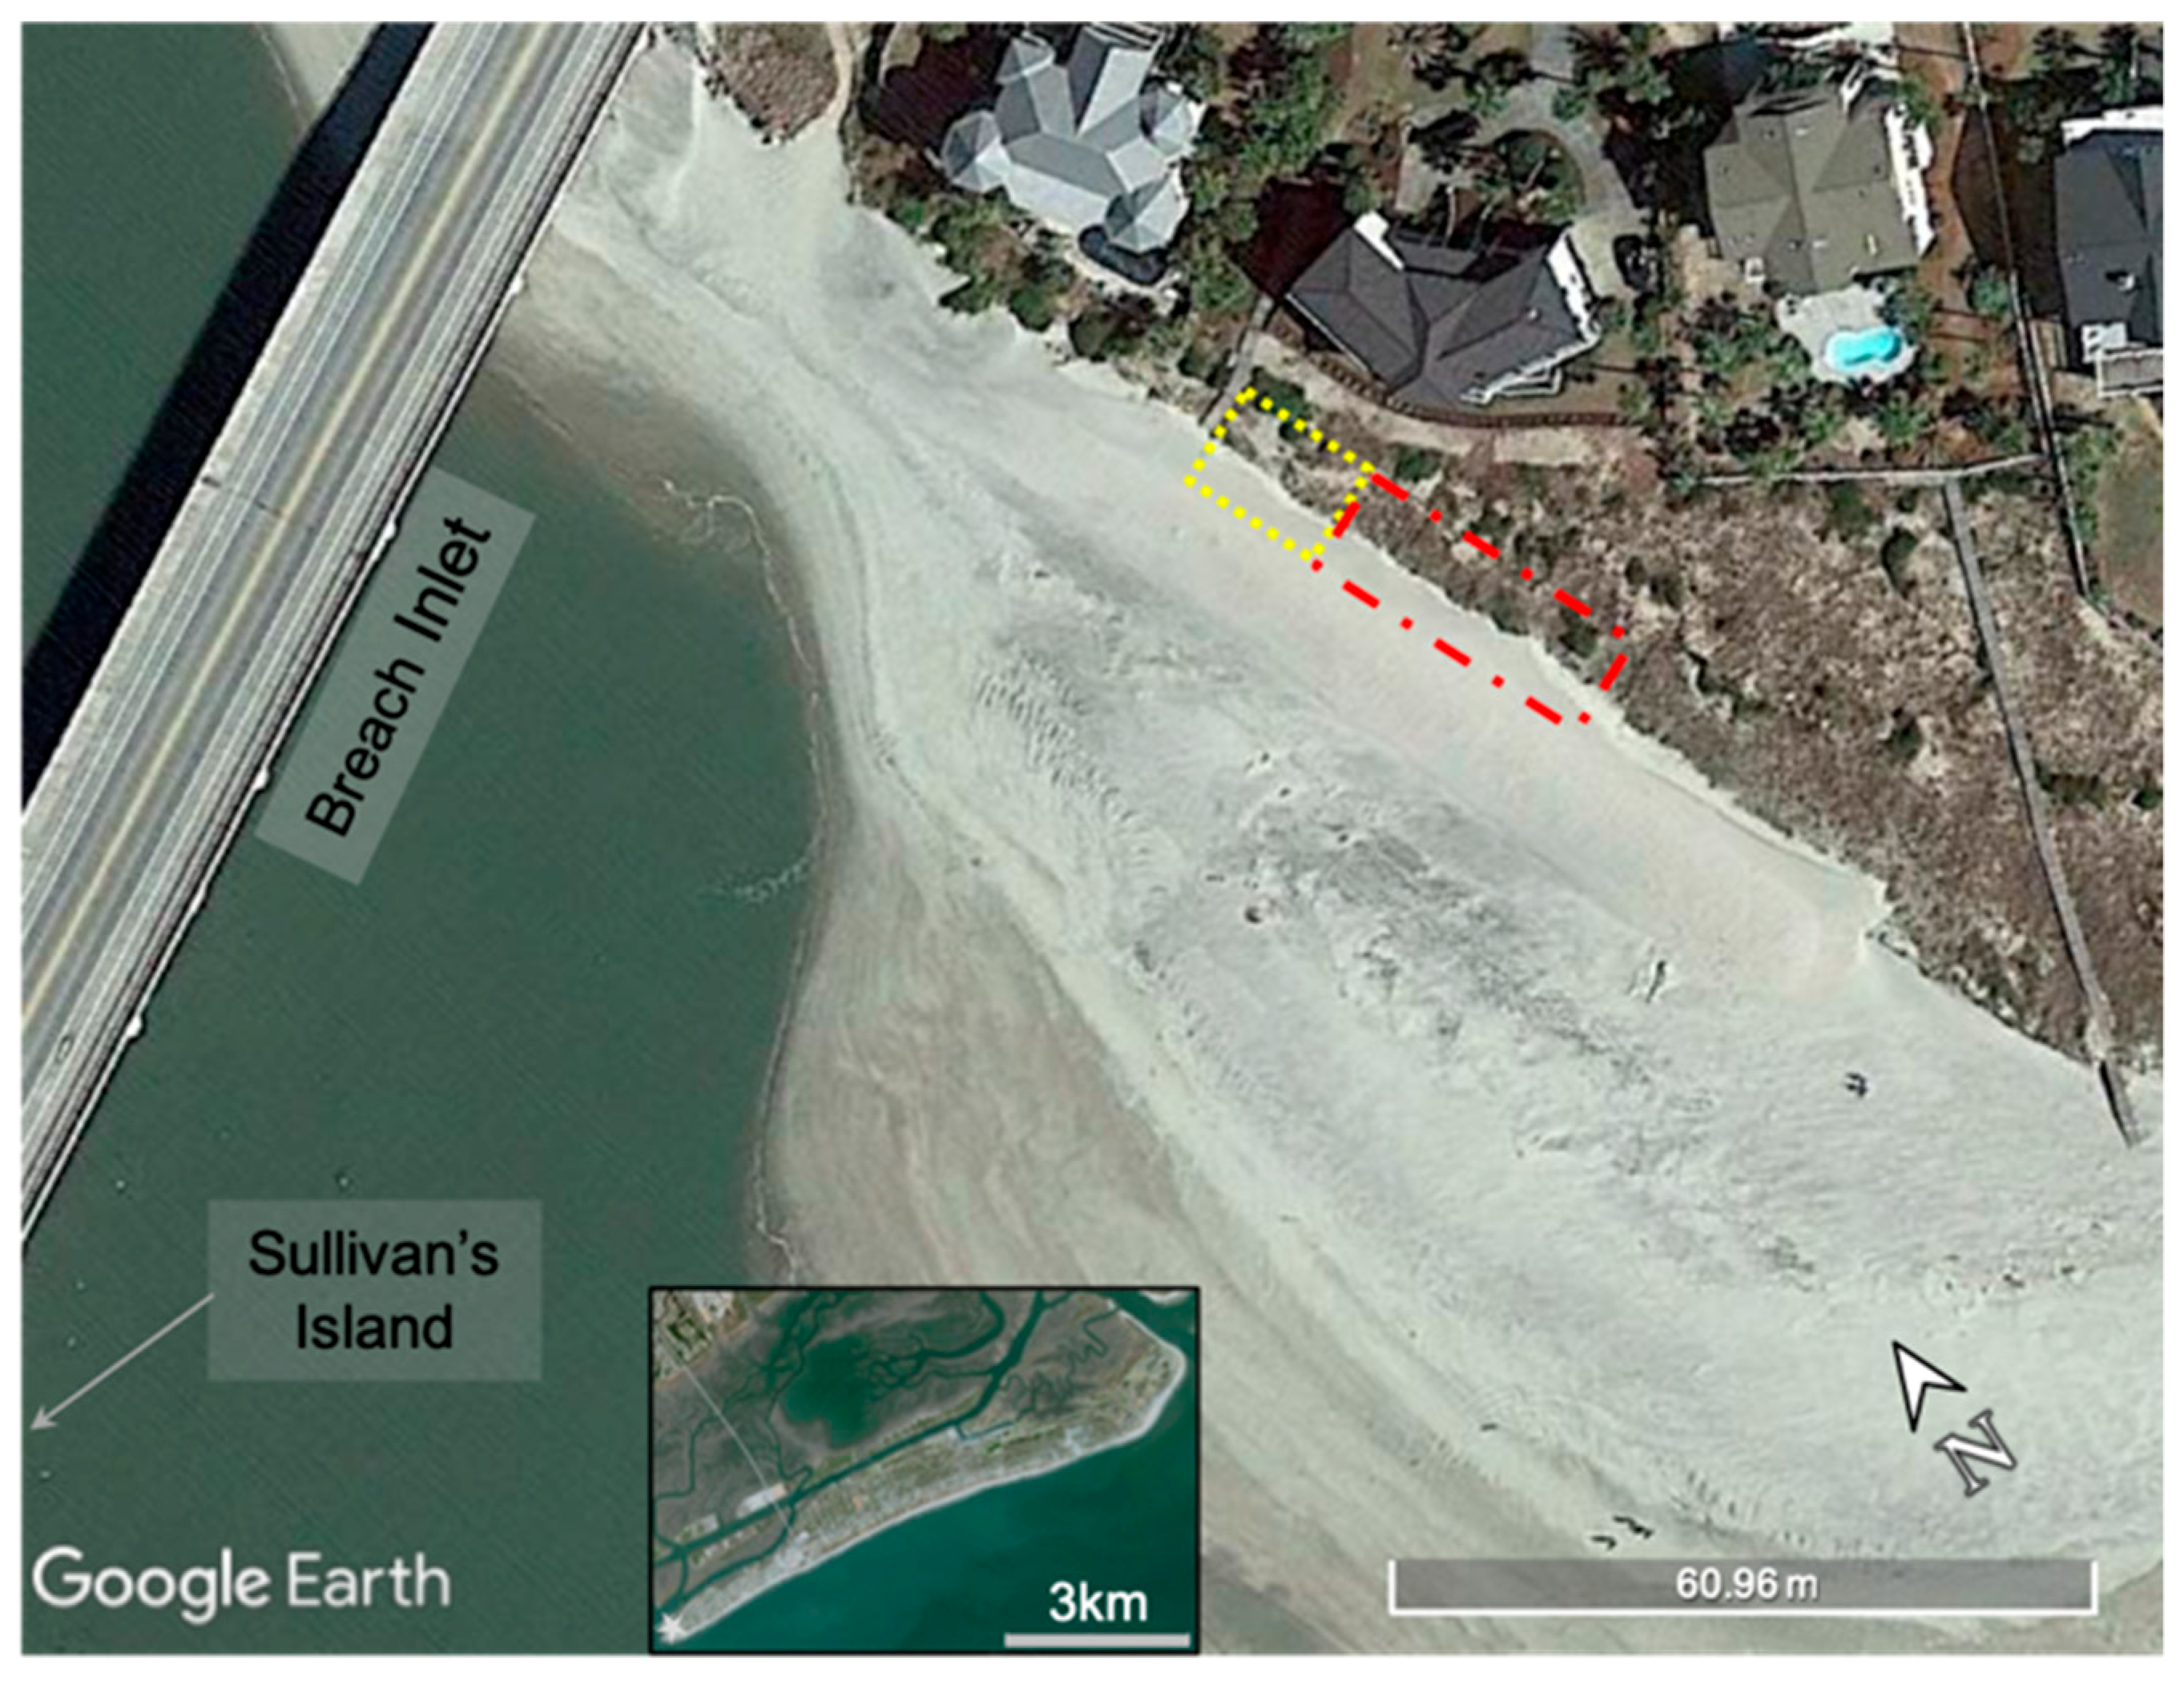
2.1. Study Area
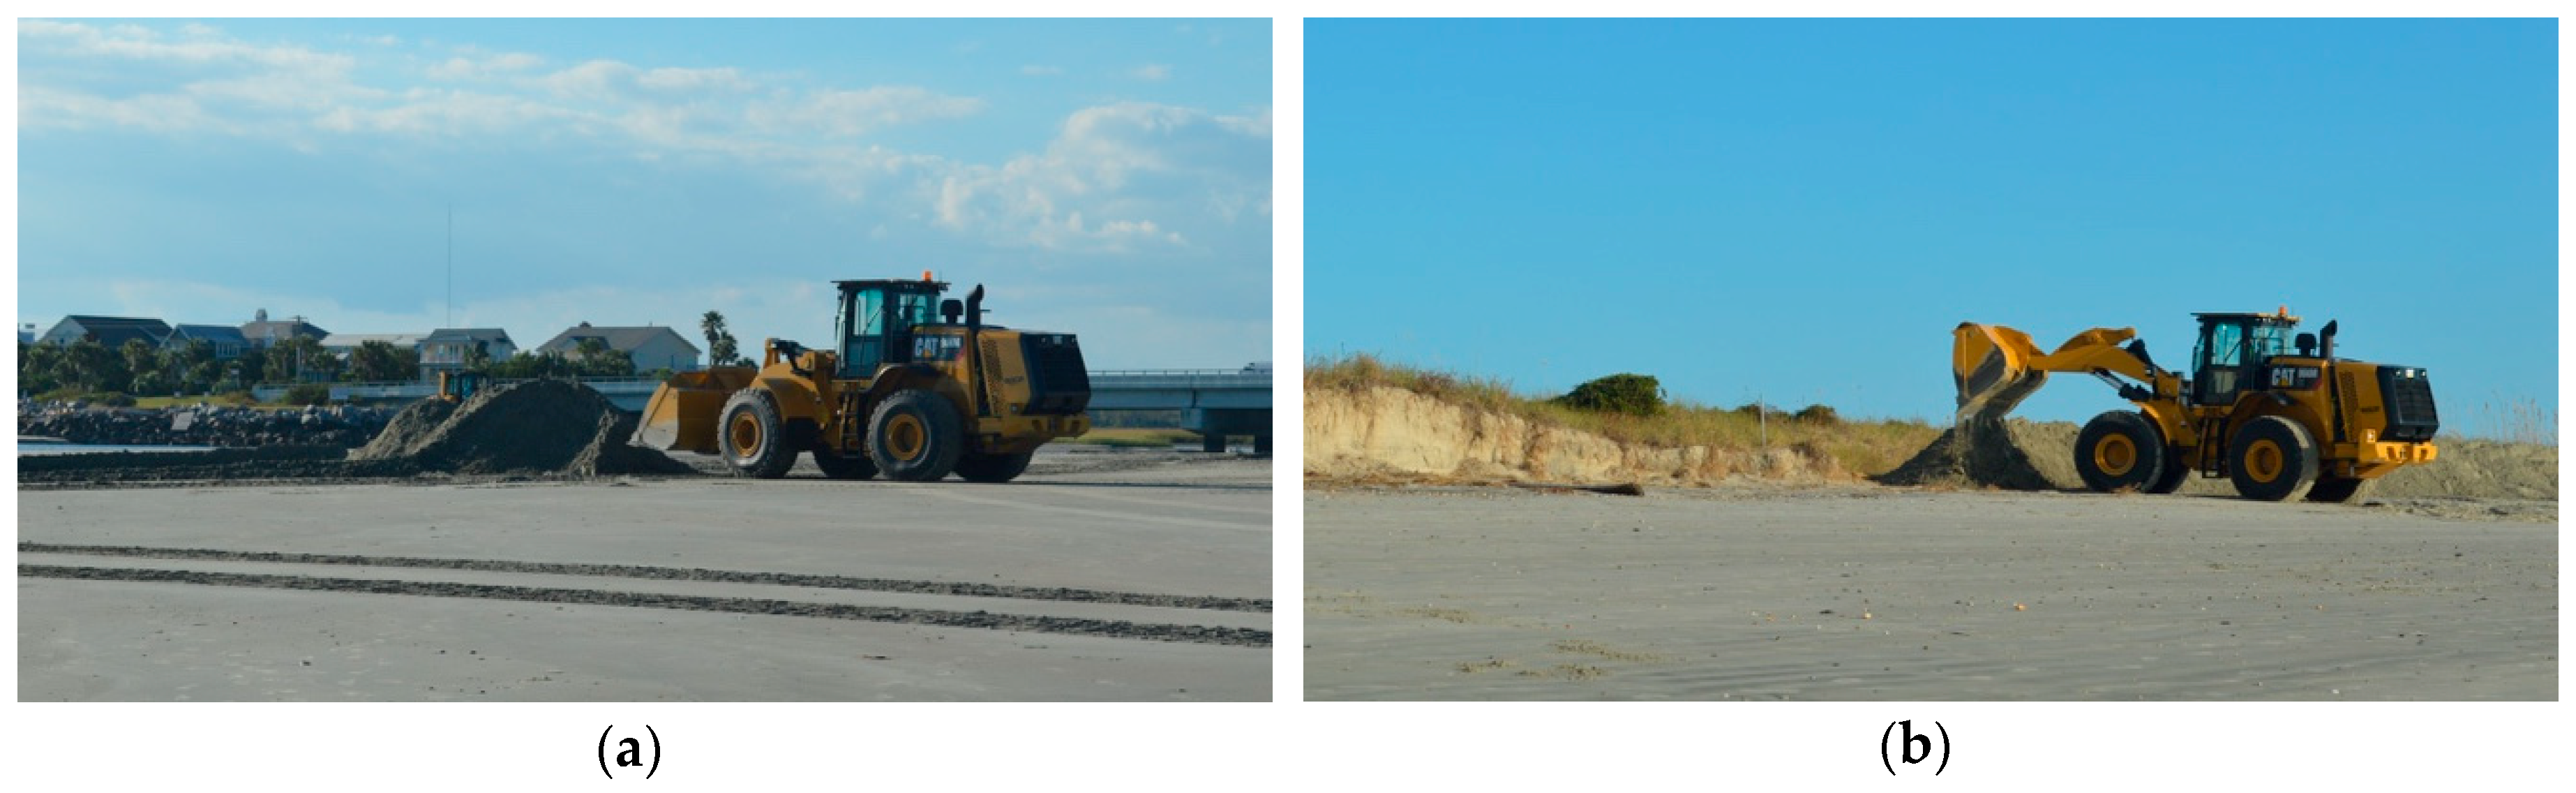
2.2. Field Methods
2.3. Data Analysis
2.3.1. Grain Size
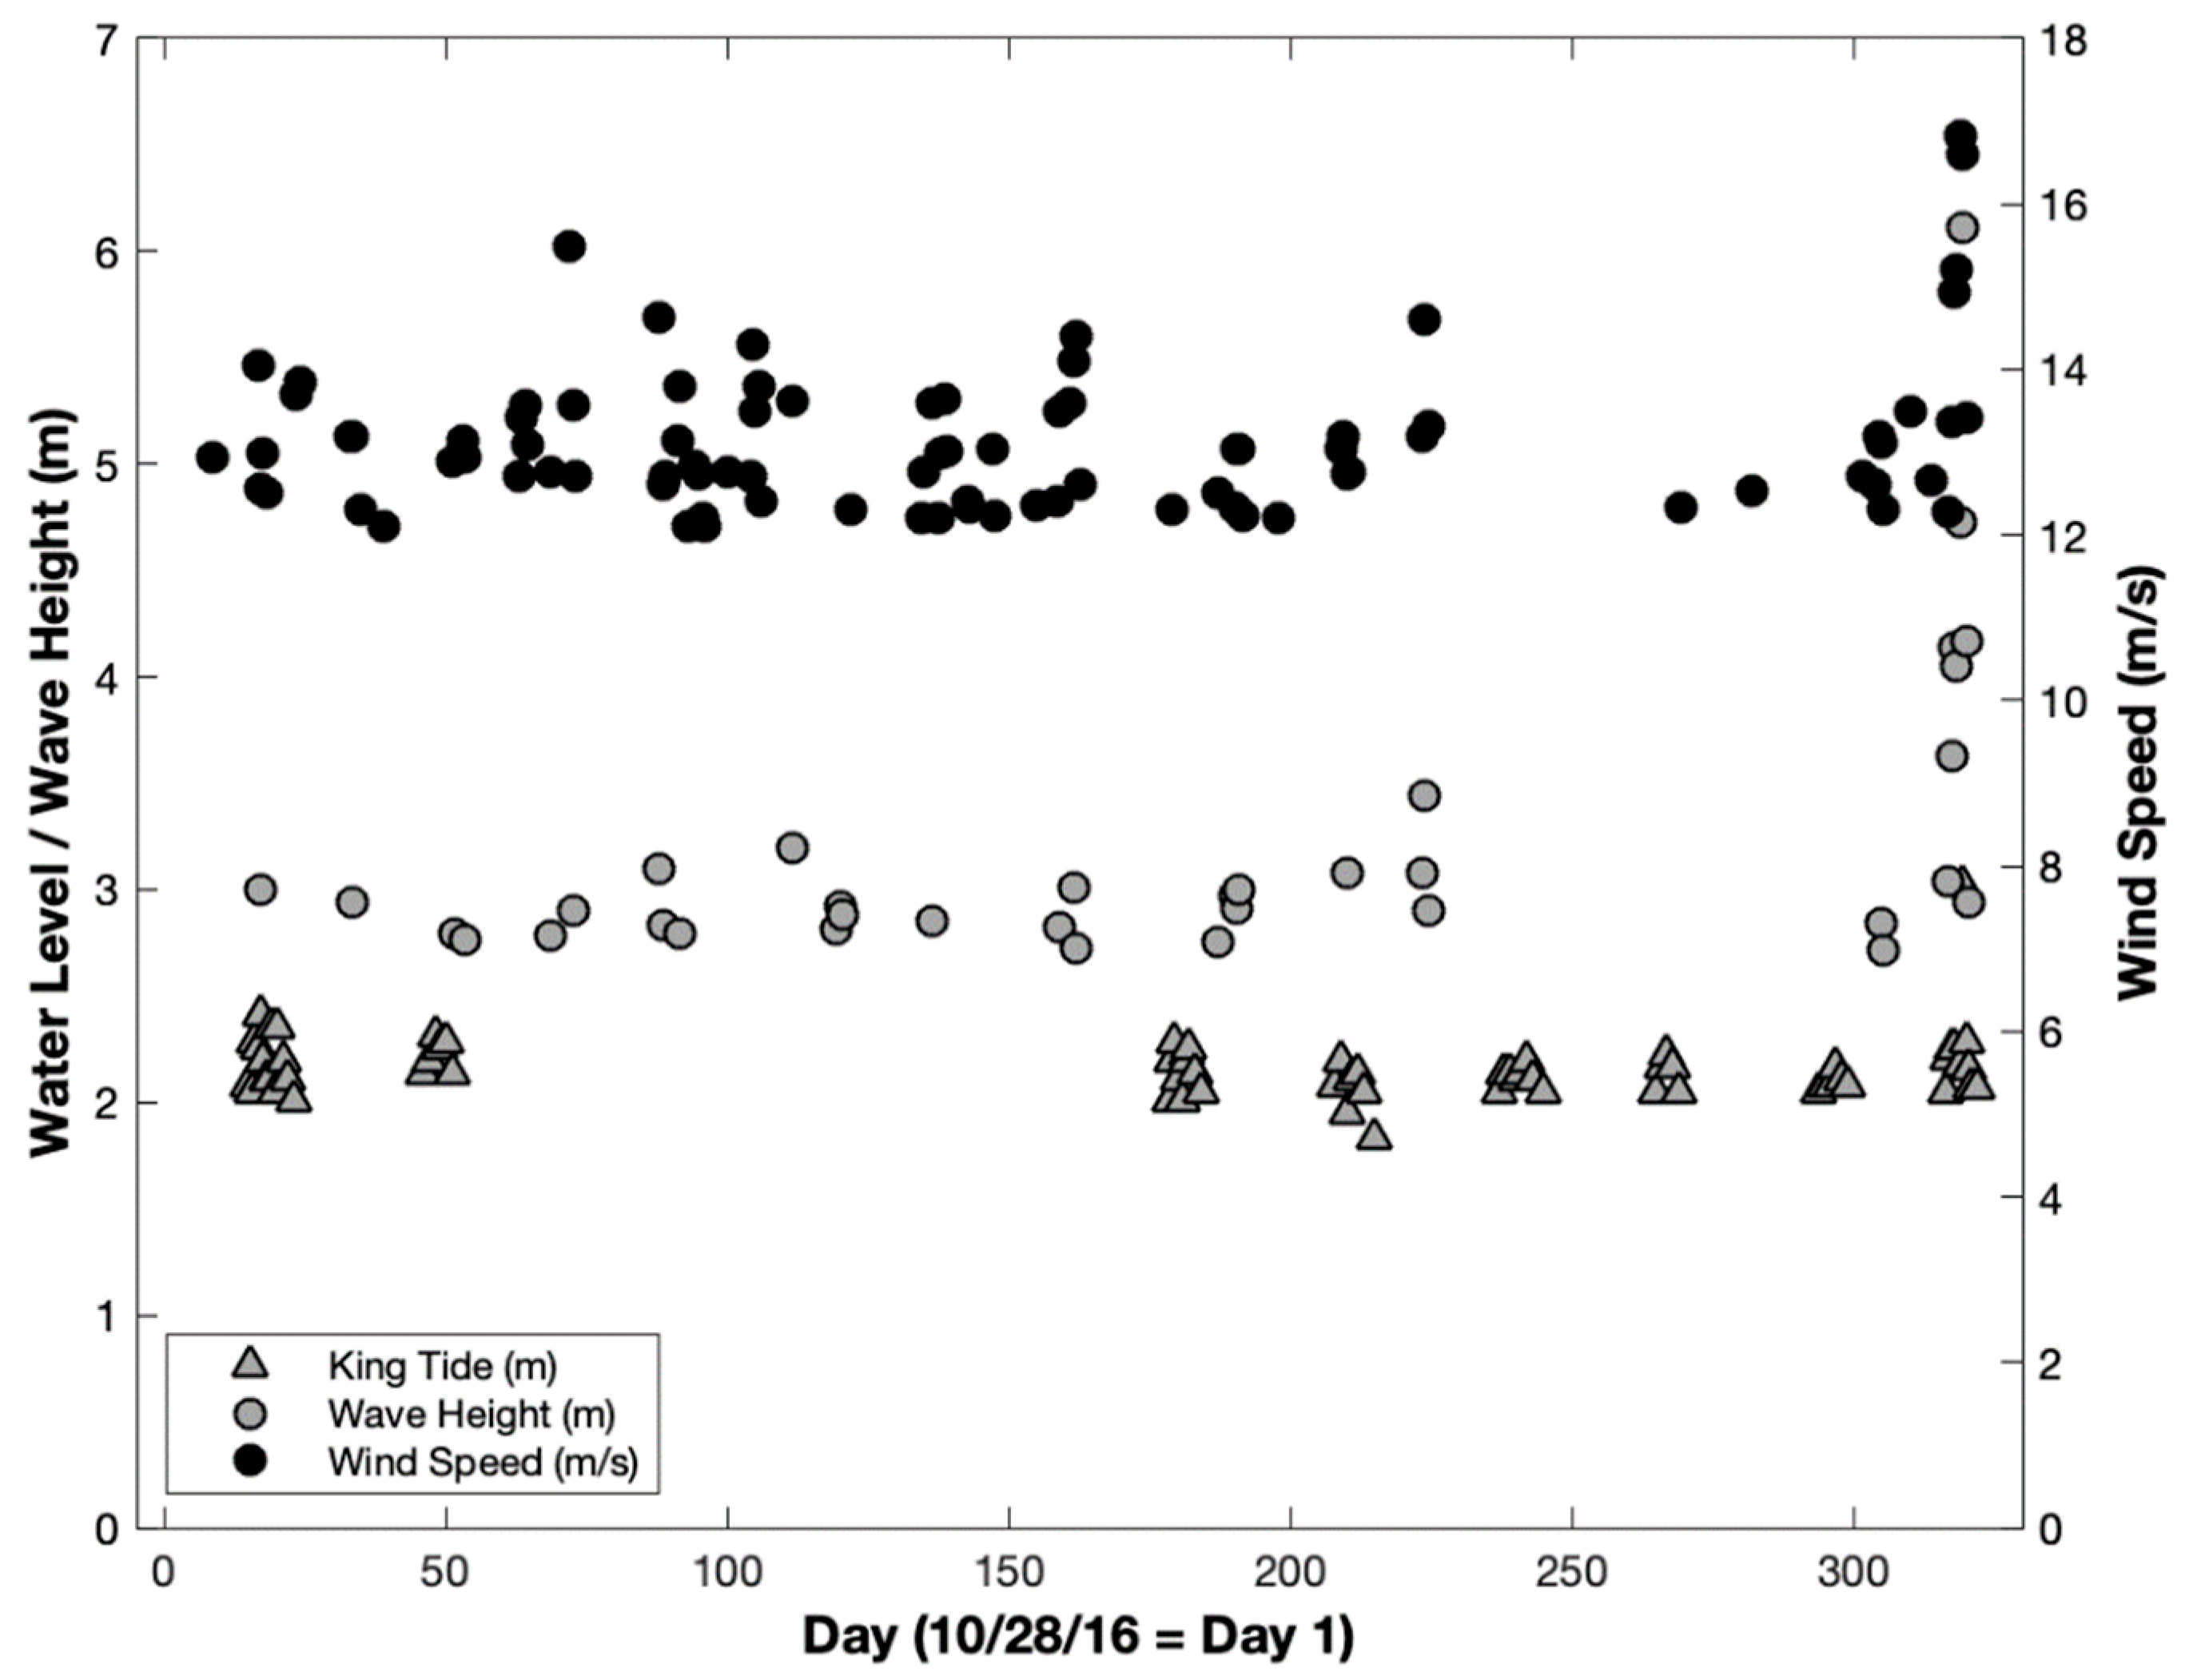
2.3.2. Forcing Events
2.3.3. Topographic Surveys
3. Results
3.1. Grain Size
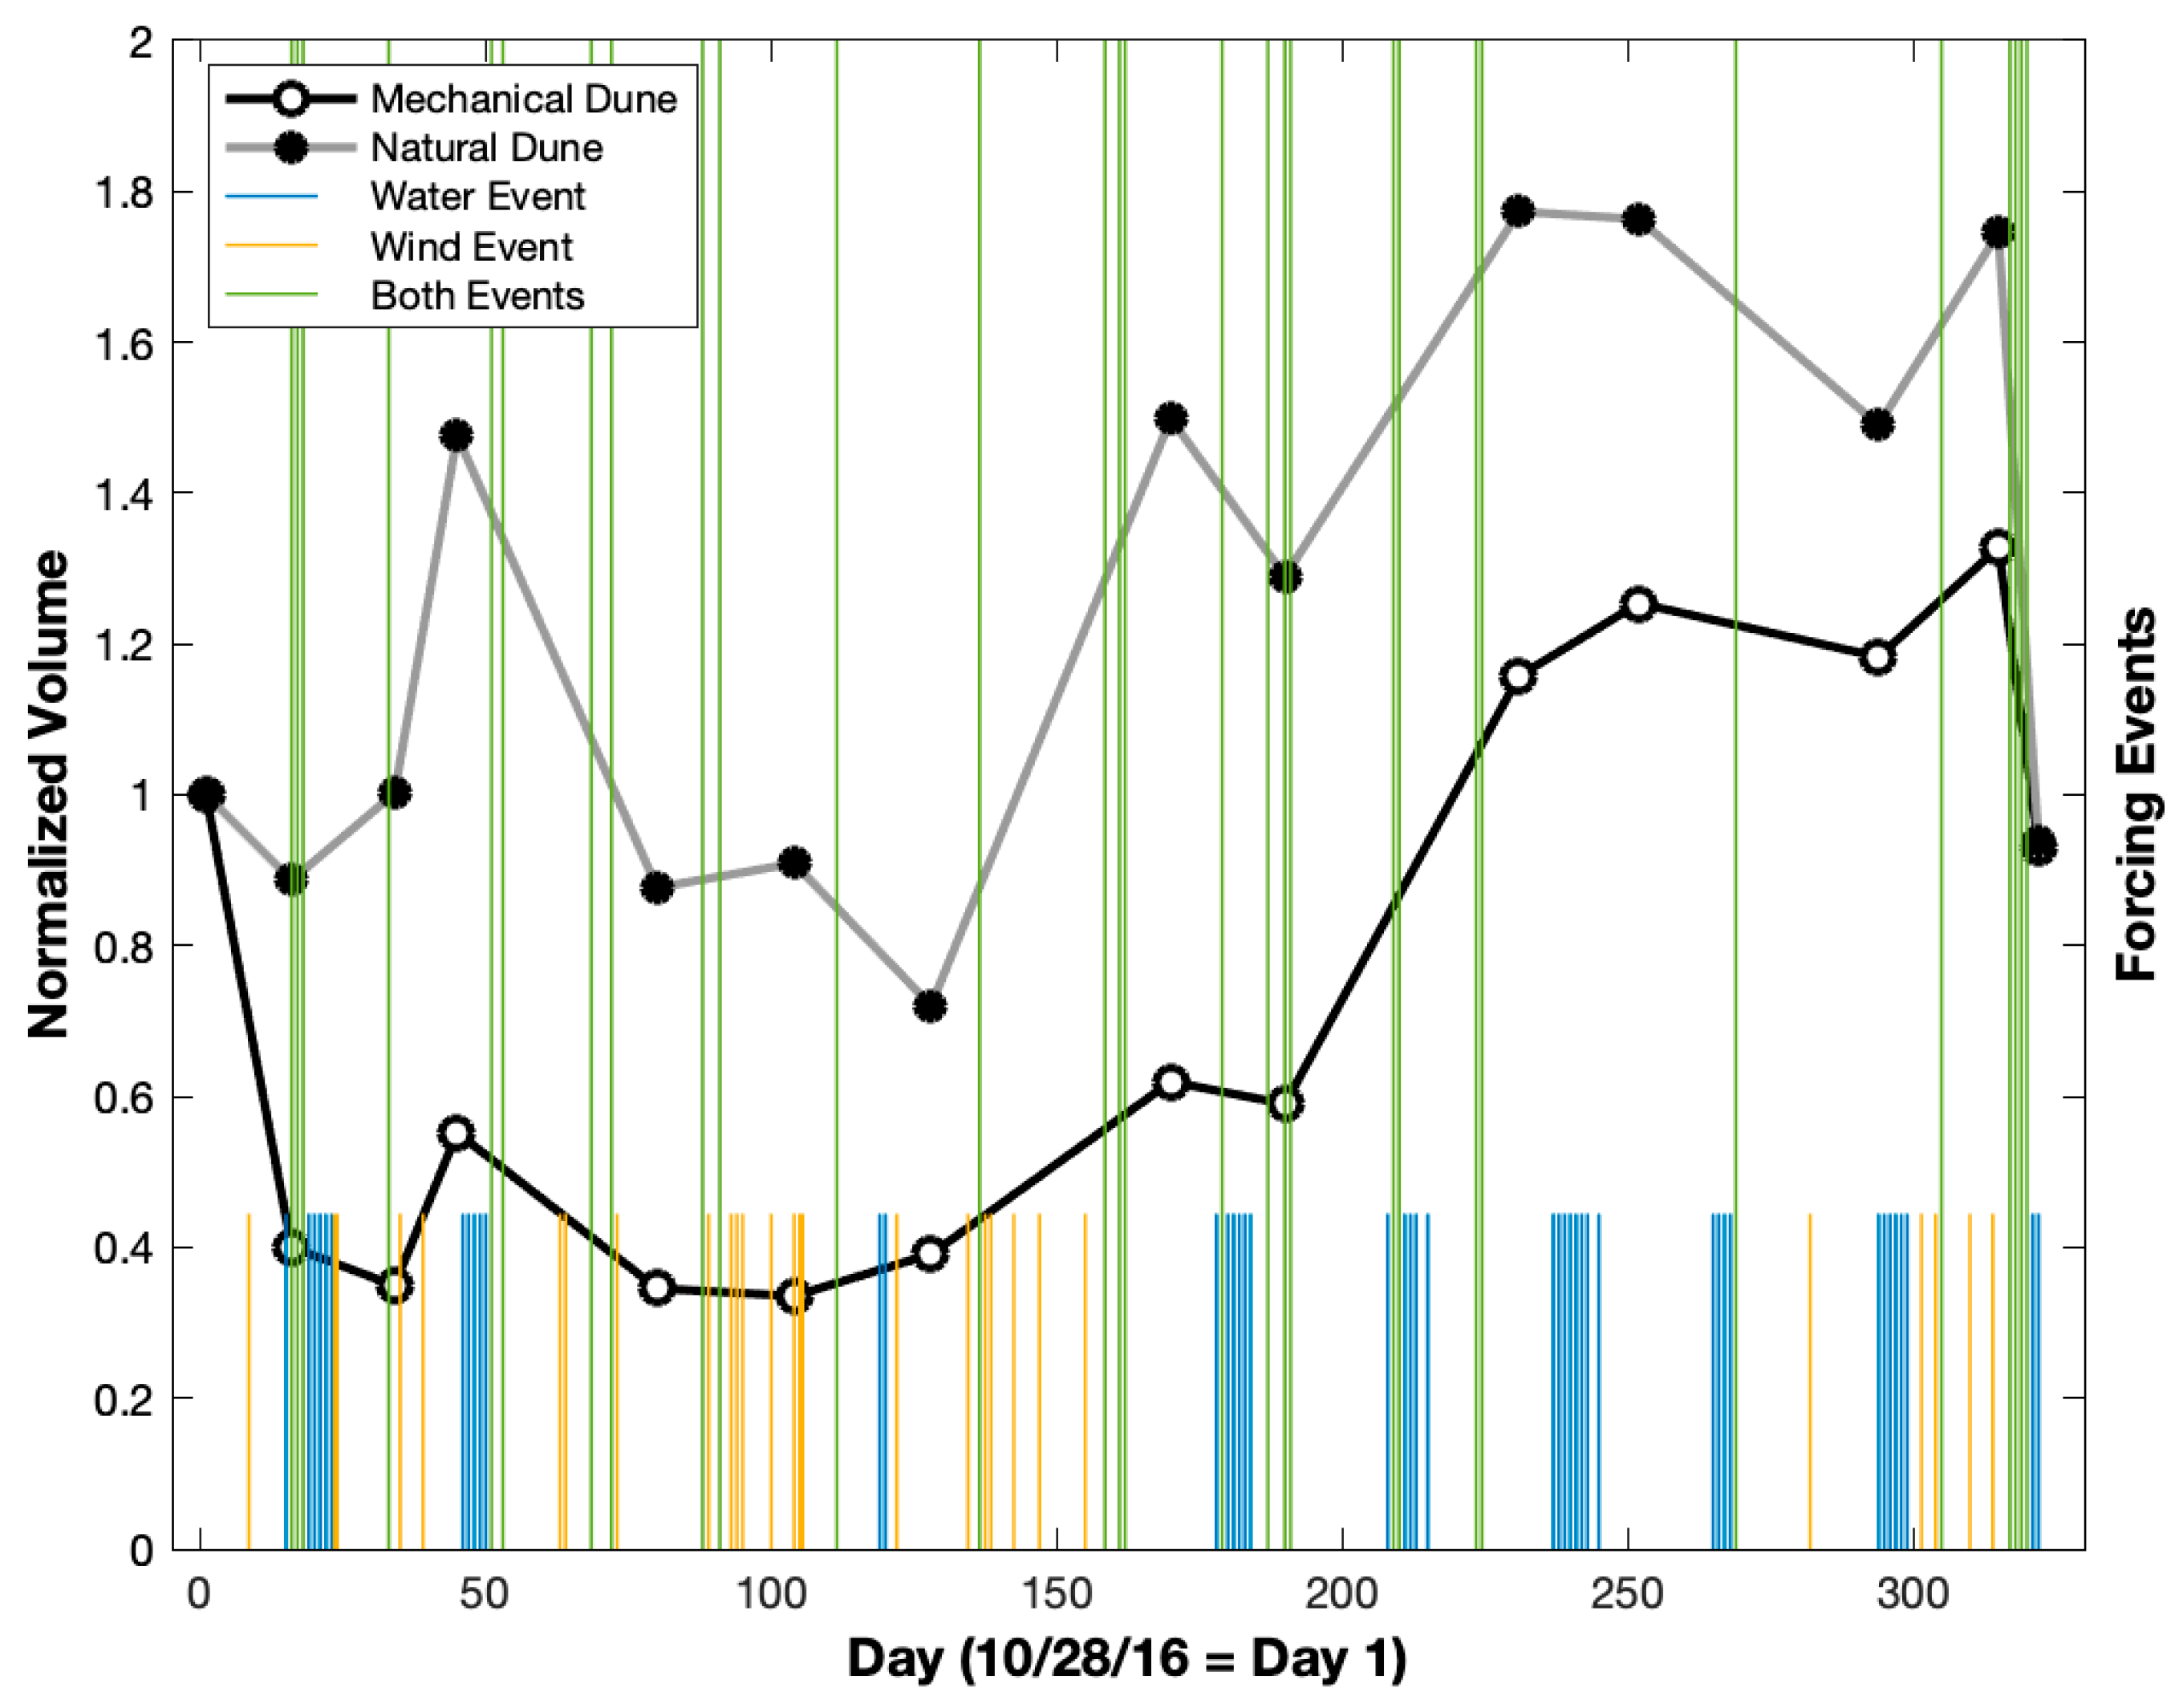
3.2. Forcing Events
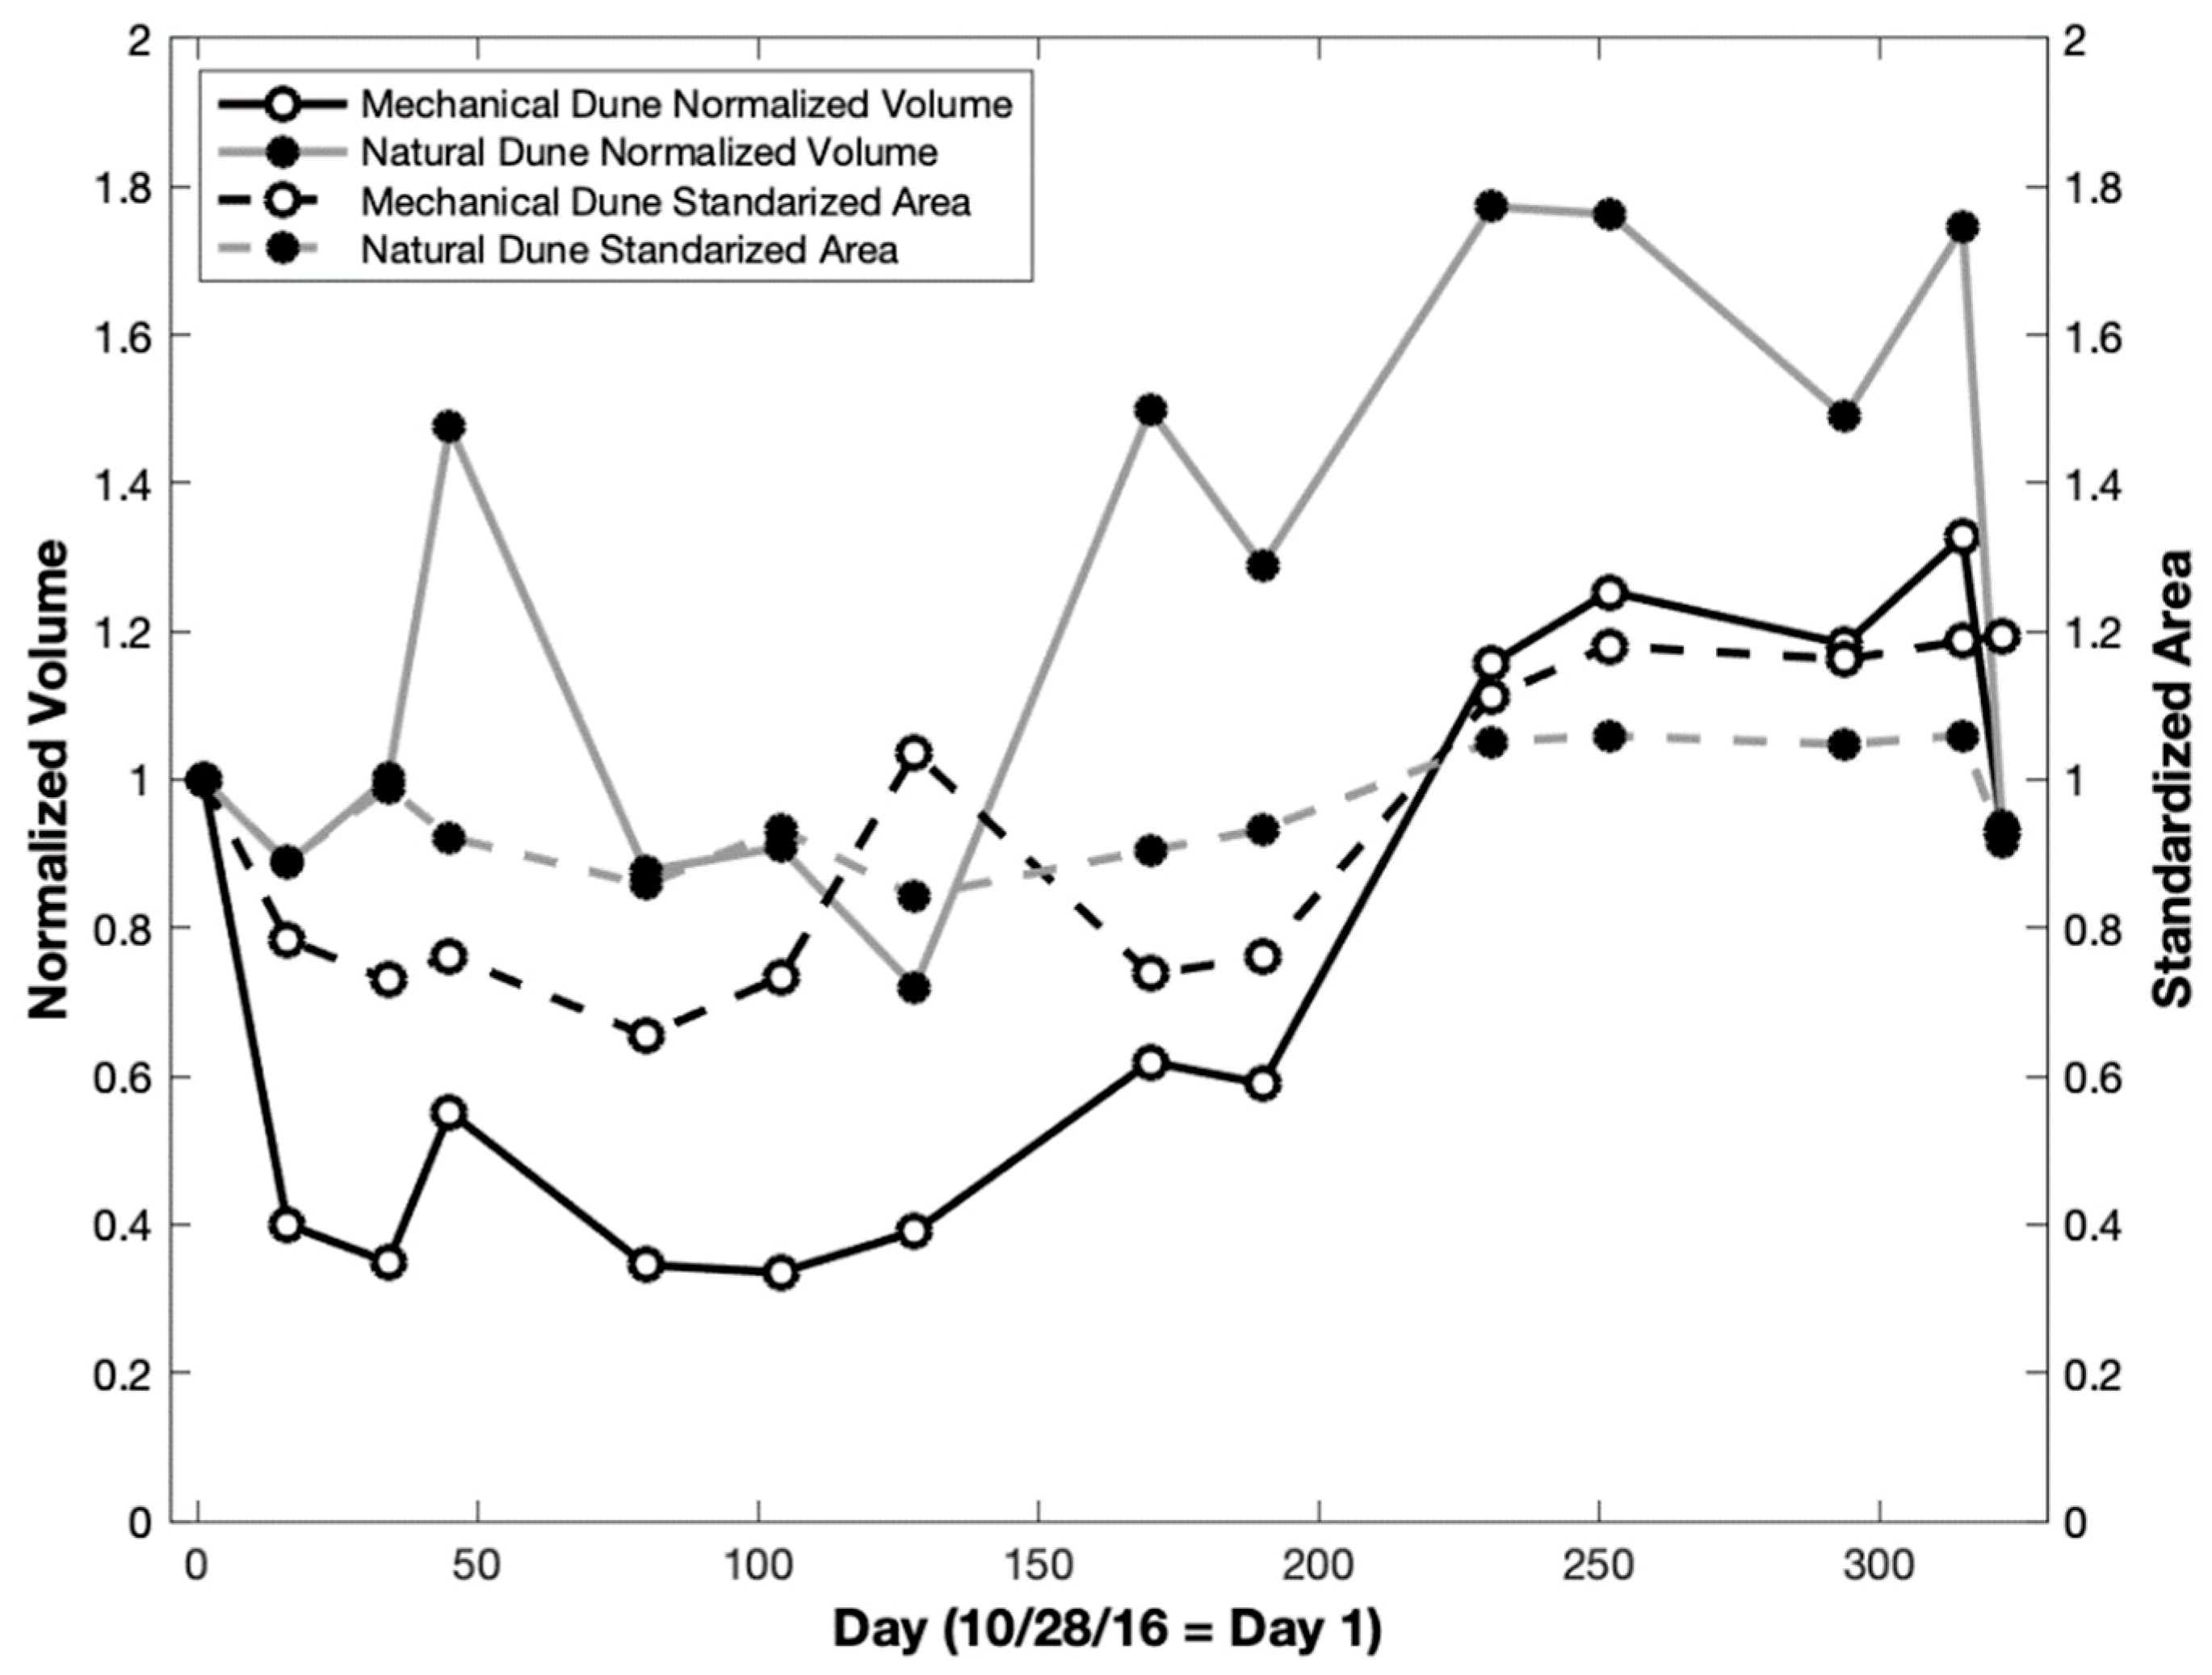
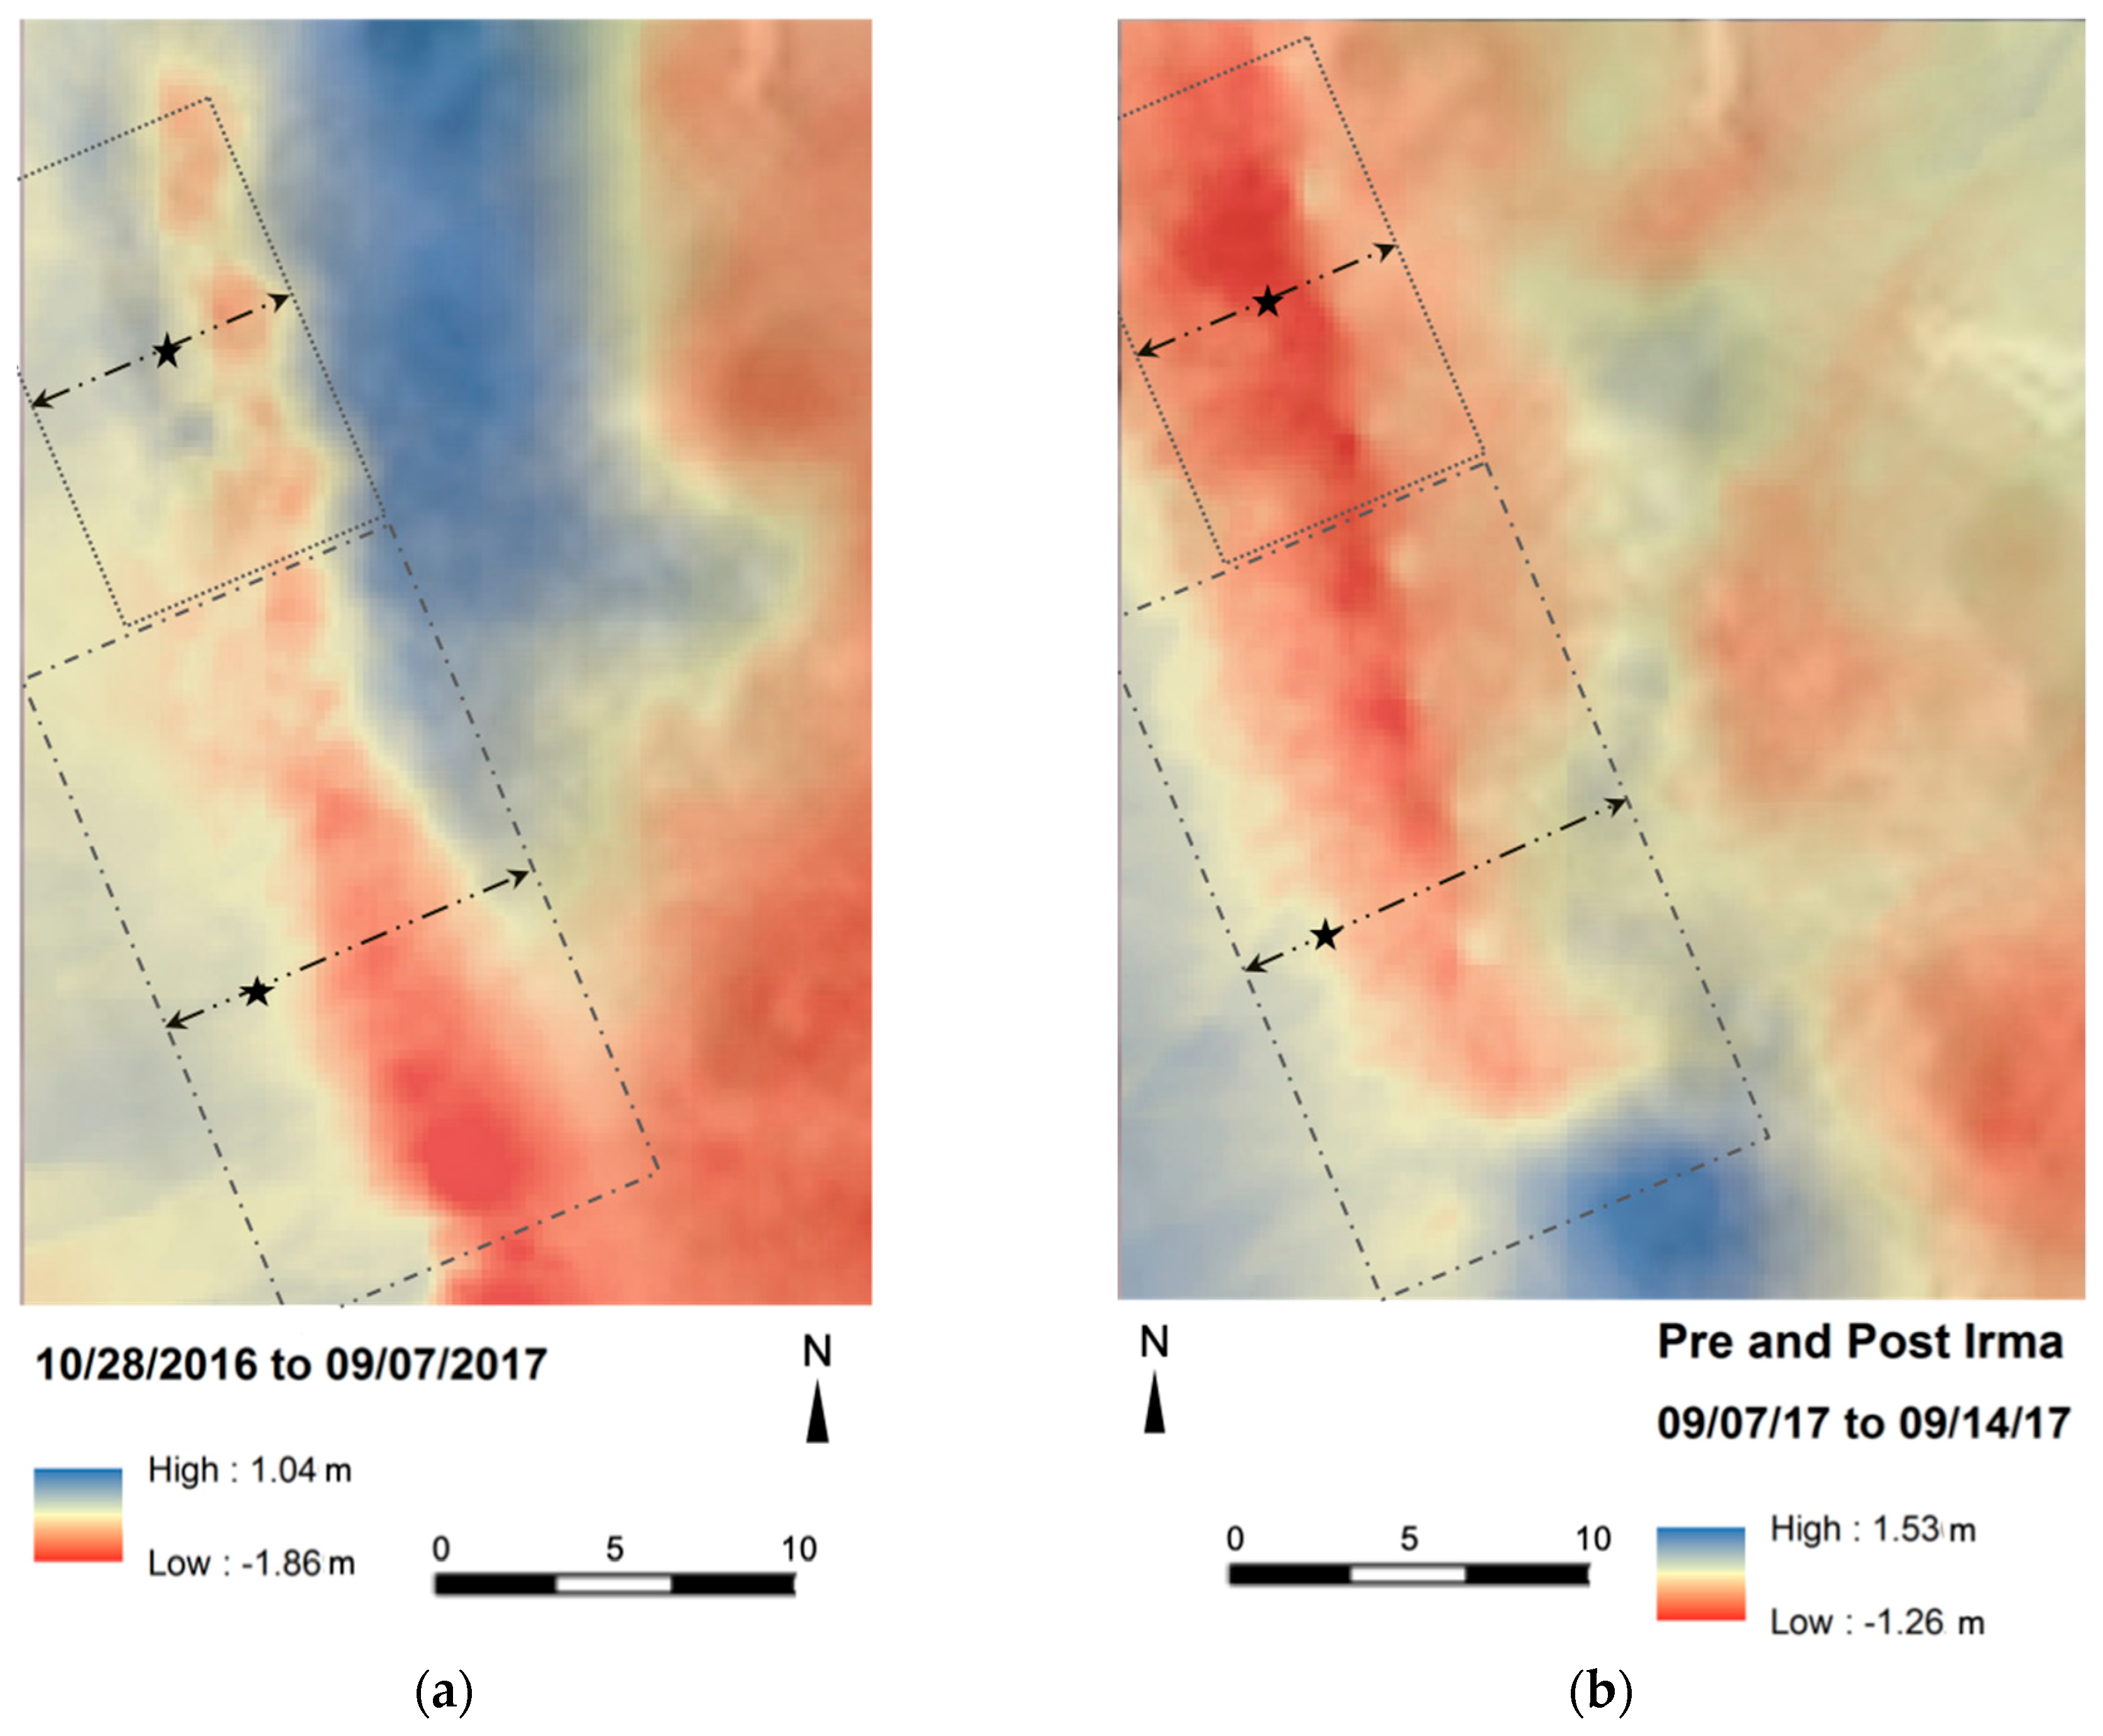
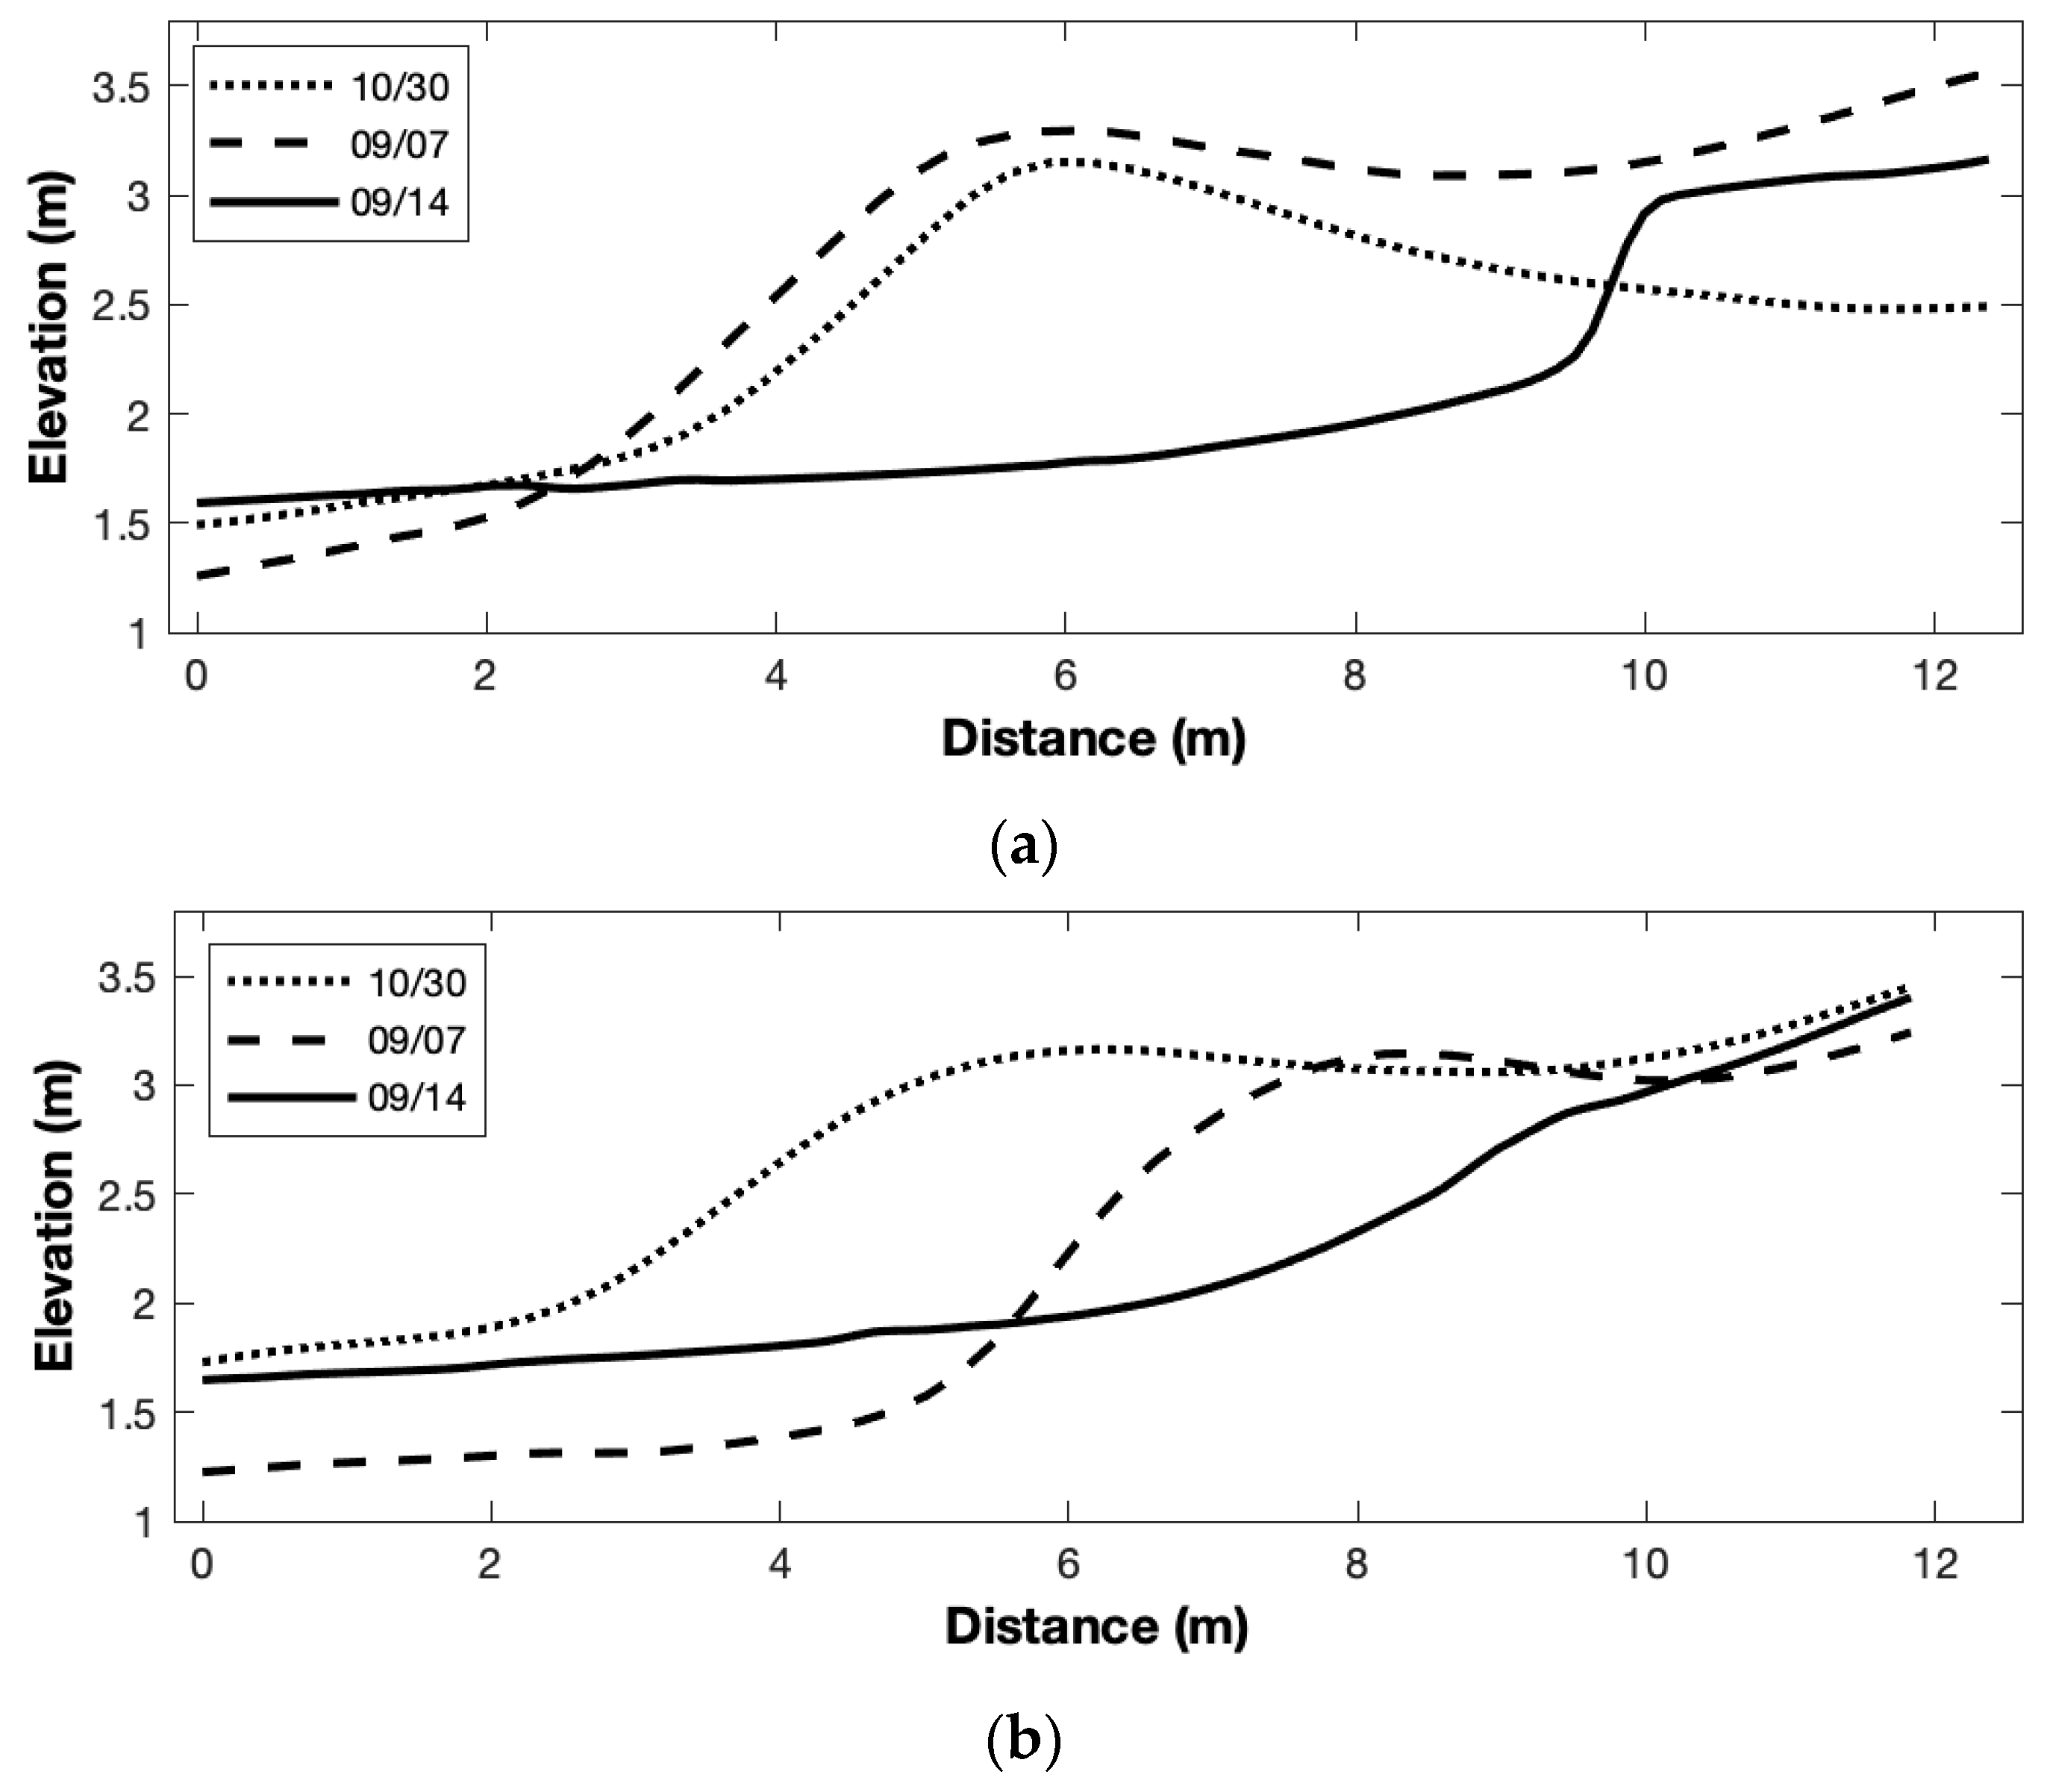
3.3. Topographic Surveys
4. Discussion
5. Conclusions
Author Contributions
Funding
Acknowledgments
Conflicts of Interest
References
- Wells, J.T.; McNinch, J. Beach Scraping in North Carolina with Special Reference to its Effectiveness During Hurricane Hugo. J. Coast. Res. 1991, SI8, 249–261. [Google Scholar]
- Katuna, M.P. The Effects of Hurricane Hugo on the Isle of Palms South Carolina: From Destruction to Recovery. J. Coast. Res. 1991, SI8, 263–273. [Google Scholar]
- Román-Rivera, M.A.; Ellis, J.T. The King Tide Conundrum. J. Coast. Res. 2018, 34, 769–771. [Google Scholar] [CrossRef]
- Nordstrom, K.F.; Liang, B.; Garilao, E.S.; Jackson, N.L. Topography, Vegetation Cover and Below Ground Biomass of Spatially Constrained and Unconstrained Foredunes in New Jersey, USA. Ocean Coast. Manag. 2018, 156, 117–126. [Google Scholar] [CrossRef]
- Portz, L.; Manzolli, R.P.; Hermanns, L.; Alcántara Carrió, J. Evaluation of the Efficiency of Dune Reconstruction Techniques in Xangri-lá (Rio Grande Do Sul, Brazil). Ocean Coast. Manag. 2015, 104, 78–89. [Google Scholar] [CrossRef]
- Bruun, P. Review of Conditions of Uses of the Bruun Rule of Erosion. Coast. Eng. 1983, 7, 77–89. [Google Scholar] [CrossRef]
- Psuty, N.P. Sediment Budget and Dune/Beach Interaction. J. Coast. Res. 1988, 3, 1–4. [Google Scholar]
- Houser, C.; Ellis, J.T. Beach and Dune Interaction. In Treatise on Geomorphology; Shroder, J., Sherman, D.J., Eds.; Academic Press: San Diego, CA, USA, 2013; Volume 10, pp. 267–288. [Google Scholar]
- Lindquist, N.; Manning, L. Impacts of Beach Nourishment and Beach Scraping on Critical Habitat and Productivity of Surf Fishes; Final Report; NC Sea Grant, Fisheries Resource Grant Program: Raleigh, NC, USA, 2001. [Google Scholar]
- Kerhin, R.T.; Halka, H.P. Beach Changes Associated with Bulldozing of the Lower Foreshore: Maryland Geological Survey; Open File Report; Maryland Geological Surve: Baltimore, MD, USA, 1981.
- Tye, R.S. Impact of Hurricane David and Mechanical Dune Restoration on Folly Beach, South Carolina. Shore Beach 1983, 51, 3–9. [Google Scholar]
- Nordstrom, K.F.; Arens, S.M. The Role of Human Action in Evolution and Management of Foredunes in the Netherlands and New Jersey, U.S.A. J. Coast. Conserv. 1998, 4, 169–180. [Google Scholar] [CrossRef]
- Conaway, C.A.; Wells, J.T. Aeolian Dynamics Along Scraped Shorelines, Bogue Banks, North Carolina. J. Coast. Res. 2005, 21, 242–254. [Google Scholar] [CrossRef]
- Nordstrom, K.F.; Bauer, B.O.; Davidson-Arnott, R.G.D.; Gares, P.A.; Carter, R.W.G.; Jackson, D.W.T.; Sherman, D.J. Offshore Aeolian Transport Across a Beach: Carrick Finn Strand, Ireland. J. Coast. Res. 1996, 12, 664–672. [Google Scholar]
- Smyth, T.A.G.; Hesp, P.A. Aeolian Dynamics of Beach Scraped Ridge and Dyke Structures. Coast. Eng. 2015, 99, 38–45. [Google Scholar] [CrossRef]
- Kana, T.W.; Svetlichny, M. Artificial Manipulation of Beach Profiles. Coast. Eng. 1982, 903–922. [Google Scholar] [CrossRef]
- Dolan, R.; Godfrey, P. Effects of Hurricane Ginger on the Barrier Islands of North Carolina. Geol. Soc. Am. Bull. 1973, 84, 1329–1334. [Google Scholar] [CrossRef]
- Coch, N.K.; Wolff, M.P. Probable Effects of a Storm Like Hurricane Hugo on Long Island NY Northeast. Environ. Sci. 1990, 9, 1–14. [Google Scholar]
- Nordstrom, K.F. Beach and Dune Restoration; Cambridge University Press: Cambridge, UK, 2008. [Google Scholar]
- SCDHEC. Blue Ribbon Committee on Shoreline Management—Recommendations for Improved Beachfront Management in South Carolina; Final Report; South Carolina Department Health Environmental Control: Columbia, SC, USA, 2013; pp. 1–28.
- U.S. Army, Isle of Palms, Sullivan’s Island, and Charleston, South Carolina; Chief of Engineers, Department of the Army: Washington, DC, USA, 1966; Volume 61–806, 40p.
- Hayes, M.O. Barrier Island Morphology as a Function of Tidal and Wave Regime. In Barrier Island; Leatherman, S., Ed.; Academic Press: New York, NY, USA, 1979; pp. 1–26. [Google Scholar]
- Fico, C. Influence of Wave Refraction on Coastal Geomorphology: Bull Island to Isle of Palms, South Carolina; Coastal Research Division, Department of Geology Technical Report: Columbia, SC, USA, 1978. [Google Scholar]
- Gaudiano, D.J.; Kana, T.W. Shoal Bypassing in Mixed Energy Inlets: Geomorphic Variables and Empirical Predictions for Nine South Carolina Inlets. J. Coast. Res. 2001, 17, 280–291. [Google Scholar]
- Coastal Science and Engineering. City of Isle of Palms, SC Hurricane Matthew Beach Damage Assessment and Recommendations; CSE Report 2453; CSE: Columbia, SC, USA, 2016; pp. 1–44.
- Coastal Science and Engineering. City of Isle of Palms, SC Hurricane Irma Beach Damage Assessment; CSE Report 2453-IRMA; CSE: Columbia, SC, US, 2017; pp. 1–6.
- NOAA National Hurricane Center. 2016 Atlantic Hurricane Season; Annual Summary; NOAA National Hurricane Center: Miami, FL, USA, 2016; pp. 1–15.
- Kana, T.W. A Brief History of Beach Nourishment in South Carolina. Shore Beach 2012, 80, 9–21. [Google Scholar]
- Wang, P.; Li, J.; Li, Z.; Lim, A.H.N.; Li, J.; Schmit, T.J.; Goldberg, M.D. The Impact of Cross-Track Infrared Sounder (CrIS) Cloud-Cleared Radiances on Hurricane Joaquin (2015) and Matthew (2016) Forecasts. J. Geophys. Res. Atmos. 2017, 122, 13201–13218. [Google Scholar] [CrossRef]
- National Weather Service. October 2016 Hurricane Matthew; U.S. Department of Commerce, National Oceanic and Atmospheric Administration Service Assessment: Washington, DC, USA, 2017; pp. 1–59.
- NWS Charleston, SC Weather Forecast Office. Tropical Storm Irma. 10–11 September 2017. Available online: http://www.webcitation.org/77Hh2fLC0 (accessed on 31 March 2019).
- SCDHEC-OCRM. SC Beachfront Jurisdictional Lines. Available online: http://www.webcitation.org/77Hp6TL9w (accessed on 31 March 2019).
- Blott, S.; Pye, K. GRADISTAT: A grain size distribution and statistics package for the analysis of unconsolidated sediments. Earth Surf. Process. Landf. 2001, 26, 1237–1248. [Google Scholar] [CrossRef]
- Folk, R.L.; Ward, W.C. Brazos River Bar [Texas]; A Study in the Significance of Grain Size Parameters. J. Sediment. Res. 1957, 27, 3–26. [Google Scholar] [CrossRef]
- Burvingt, O.; Masselink, G.; Russell, P.; Scott, T. Beach Response to Consecutive Extreme Storms Using LiDAR along the SW coast of England. J. Coast. Res. 2016, SI75, 1052–1056. [Google Scholar] [CrossRef]
- Zhang, K.; Douglas, B.; Leatherman, S. Do Storms Cause Long-Term Beach Erosion along the U.S. East Barrier Coast? J. Geol. 2002, 110, 493–502. [Google Scholar] [CrossRef]
- Bagnold, R.A. The Movement of Desert Sand. Proceedings of the Royal Society of London. Ser. A Math. Phys. Sci. 1936, 157, 594–620. [Google Scholar]
- Ellis, J.T.; Sherman, D.J. Fundamentals of Aeolian Sediment Transport: Wind-Blown Sand. In Treatise on Geomorphology; Shroder, J., Lancaster, N., Sherman, D.J., Baas, A.C.W., Eds.; Academic Press: San Diego, CA, USA, 2013; Volume 11, pp. 85–108. [Google Scholar]
- Maun, M.A. Burial of Plants as a Selective Force in Sand Dunes. In Coastal Dunes: Ecology and Conservation; Martínez, M.L., Psuty, N.B., Eds.; Springer: Berlin, Germany, 2004; pp. 119–135. [Google Scholar]
- Kent, M.; Owen, N.; Dale, P.; Newnham, R.; Giles, T. Studies of Vegetation Burial: A Focus for Biogeography and Biogeomorphology? Prog. Phys. Geogr. 2001, 25, 455–482. [Google Scholar] [CrossRef]
- Stallings, J.A. Stability Domains in Barrier Island Dune Systems. Ecol. Complex. 2005, 2, 410–430. [Google Scholar] [CrossRef]


| Survey Date | Mechanical Dune | Natural Dune | Mid-Beach | Swash |
|---|---|---|---|---|
| D50 (µm) | ||||
| 10/28/16 | 149.4 | 183.0 | 155.9 | 170.1 |
| 05/05/17 | 151.6 | 161.8 | 143.2 | - |
| 08/17/17 | 153.8 | - | 136.7 | - |
| 09/07/17 | 172.7 | - | 155.2 | 179.8 |
| 09/14/17 | 155.2 | - | 161.8 | 232.3 |
| Sorting(σG) | ||||
| 10/28/16 | 1.32 | 1.27 | 1.48 | 1.32 |
| 05/05/17 | 1.33 | 1.27 | 1.29 | - |
| 08/17/17 | 1.31 | - | 1.30 | - |
| 09/07/17 | 1.28 | - | 1.27 | 1.37 |
| 09/14/17 | 1.29 | - | 1.27 | 1.36 |
| Survey Date | Study Date | Area (m2) | Volume (m3) | Area (m2) | Volume (m3) |
|---|---|---|---|---|---|
| Natural Dune | Mechanical Dune | ||||
| 10/28/16 | 1 | 339.51 | 397.17 | 413.75 | 705.09 |
| 11/12/16 | 16 | 301.92 | 352.19 | 324.61 | 282.01 |
| 11/30/16 | 34 | 336.10 | 397.89 | 302.14 | 246.37 |
| 12/11/16 | 45 | 313.24 | 586.30 | 315.59 | 389.15 |
| 01/15/17 | 80 | 291.42 | 348.28 | 271.06 | 243.58 |
| 02/08/17 | 104 | 316.91 | 361.06 | 303.52 | 236.46 |
| 03/04/17 | 128 | 286.22 | 286.22 | 428.86 | 275.57 |
| 04/15/17 | 170 | 307.24 | 595.18 | 305.27 | 436.88 |
| 05/05/17 | 190 | 316.66 | 512.17 | 314.61 | 416.00 |
| 06/15/17 | 231 | 357.02 | 704.24 | 460.26 | 816.13 |
| 07/06/17 | 252 | 359.69 | 700.29 | 488.43 | 884.07 |
| 08/17/17 | 294 | 355.75 | 591.87 | 481.17 | 834.02 |
| 09/07/17 | 315 | 359.95 | 693.24 | 491.15 | 936.29 |
| 09/14/17 | 322 | 310.83 | 372.39 | 494.06 | 656.47 |
© 2019 by the authors. Licensee MDPI, Basel, Switzerland. This article is an open access article distributed under the terms and conditions of the Creative Commons Attribution (CC BY) license (http://creativecommons.org/licenses/by/4.0/).
Share and Cite
Ellis, J.T.; Román-Rivera, M.A. Assessing Natural and Mechanical Dune Performance in a Post-Hurricane Environment. J. Mar. Sci. Eng. 2019, 7, 126. https://doi.org/10.3390/jmse7050126
Ellis JT, Román-Rivera MA. Assessing Natural and Mechanical Dune Performance in a Post-Hurricane Environment. Journal of Marine Science and Engineering. 2019; 7(5):126. https://doi.org/10.3390/jmse7050126
Chicago/Turabian StyleEllis, Jean T., and Mayra A. Román-Rivera. 2019. "Assessing Natural and Mechanical Dune Performance in a Post-Hurricane Environment" Journal of Marine Science and Engineering 7, no. 5: 126. https://doi.org/10.3390/jmse7050126
APA StyleEllis, J. T., & Román-Rivera, M. A. (2019). Assessing Natural and Mechanical Dune Performance in a Post-Hurricane Environment. Journal of Marine Science and Engineering, 7(5), 126. https://doi.org/10.3390/jmse7050126