Path Analysis of Causal Factors Influencing Marine Traffic Accident via Structural Equation Numerical Modeling


Abstract
1. Introduction
2. Literature Review
3. Theoretical and Research Hypothesis
3.1. HFACS in MTAs
3.2. Causal Factors in MTAs
3.3. Relationship of Causal Factors in MTAs
- (1)
- Positive or negative factors of the correlation coefficient. If the correlation coefficient is positive, there is a positive correlation of the factors; if the correlation coefficient is negative, then there is a negative correlation of the factors.
- (2)
- Scale of the correlation coefficient. For the correlation coefficient, the greater the absolute value, the stronger the correlation of the factors is; if the minimum value is 0, at that time, in general, the factors do not depend on each other.
- (3)
- Rank in the correlation of factors. The interaction of factors is reflected in the relationship of the factors, so some are directly associated, indicating that the factors are direct and influential, but some are indirectly showing secondary effects.
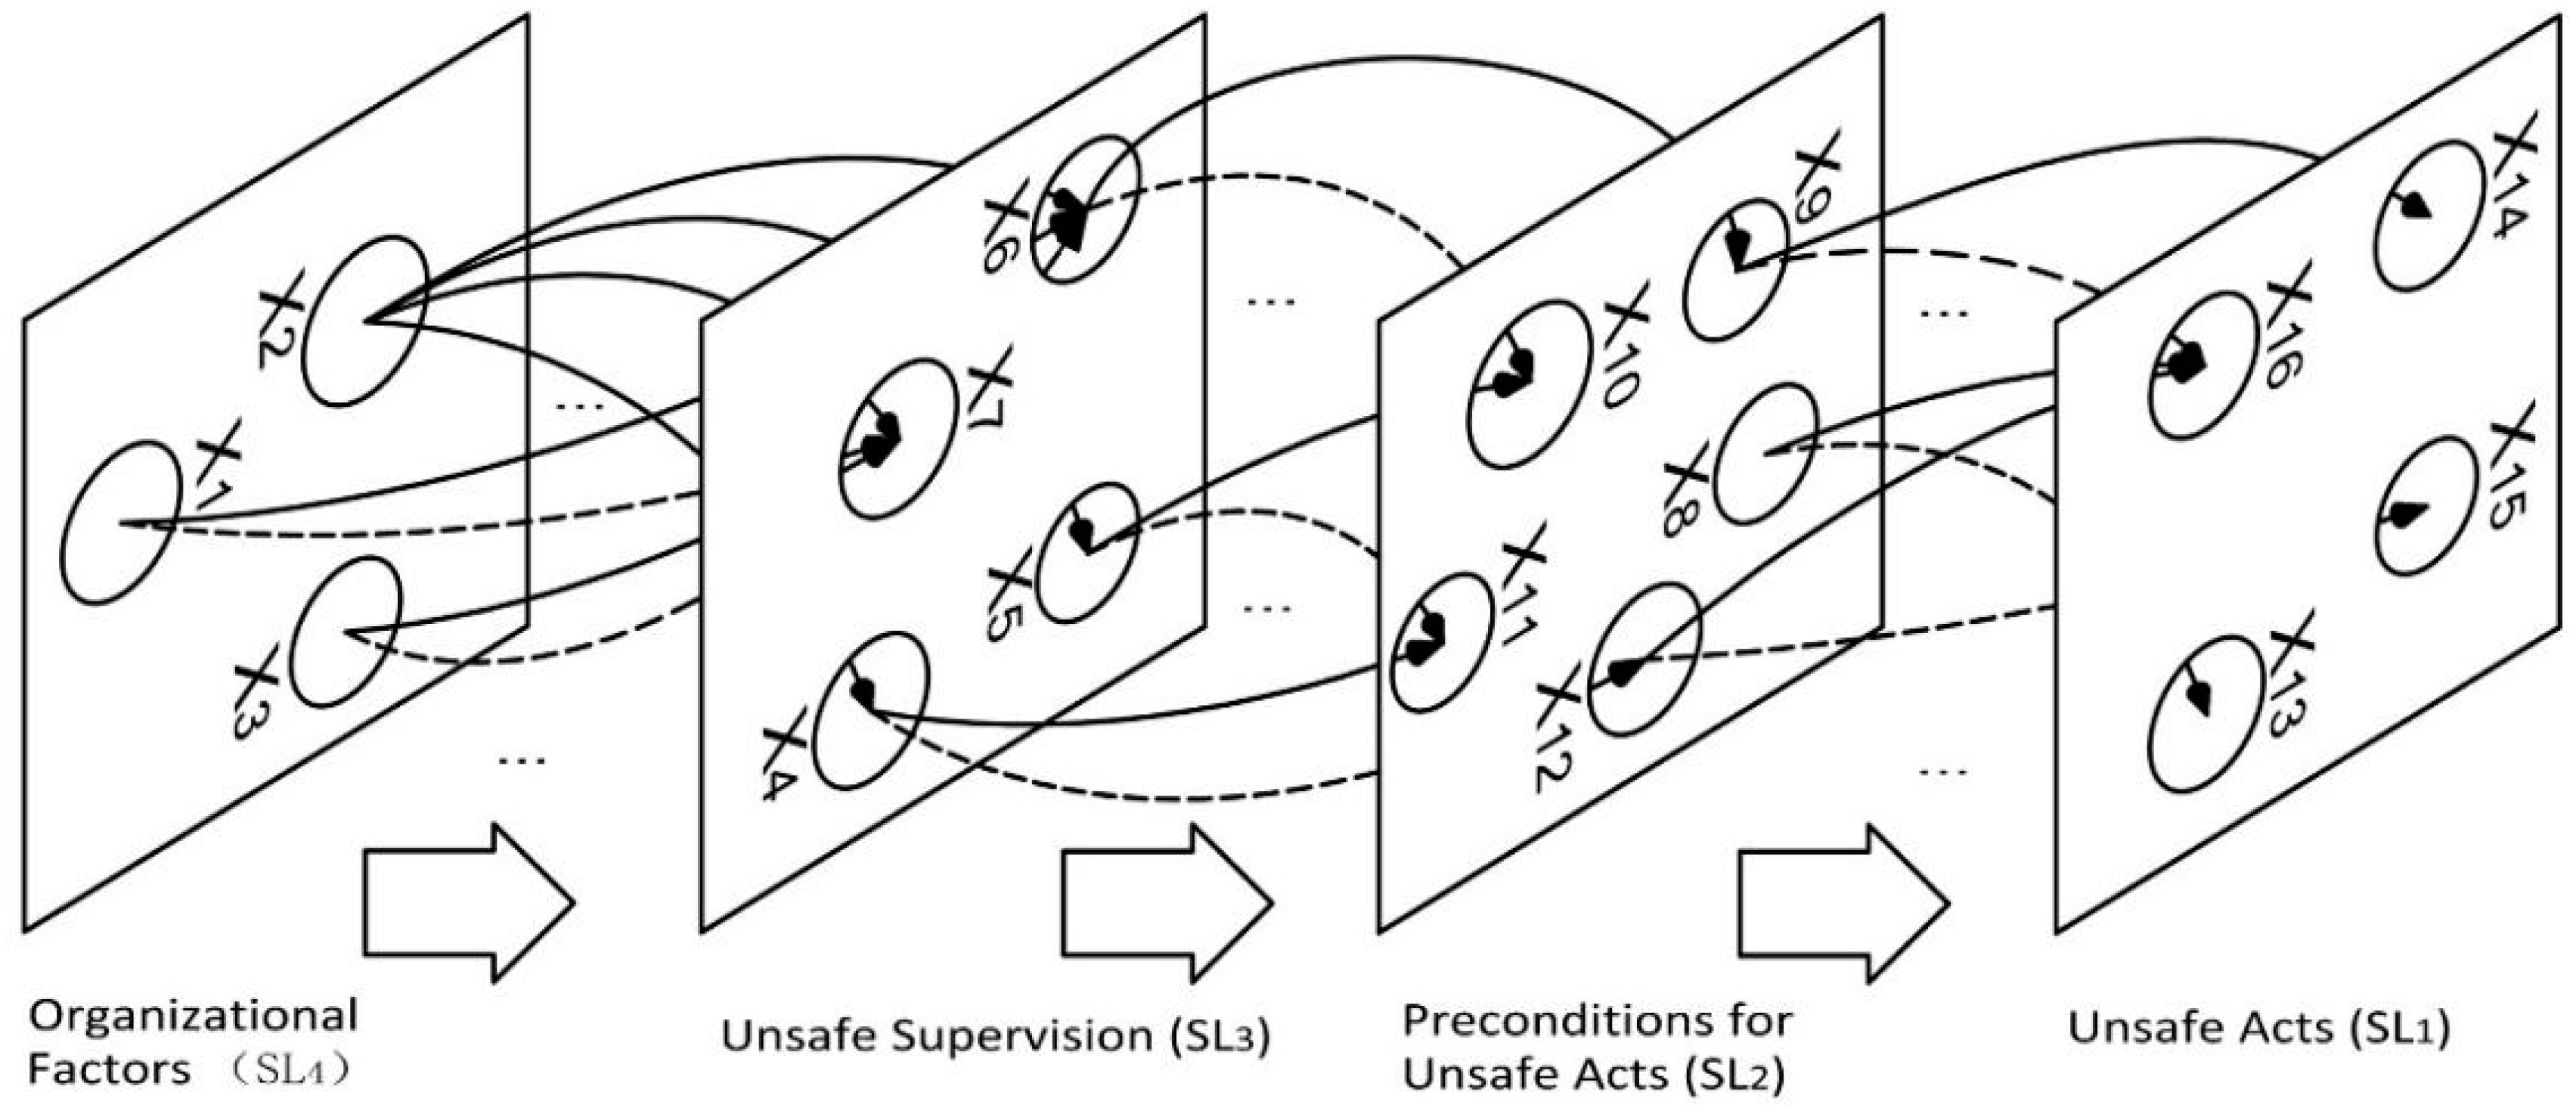
3.4. Path Analysis on Causal Factors of the MTA System
4. Correlation Model in the Causal Factor Chain for MTAs
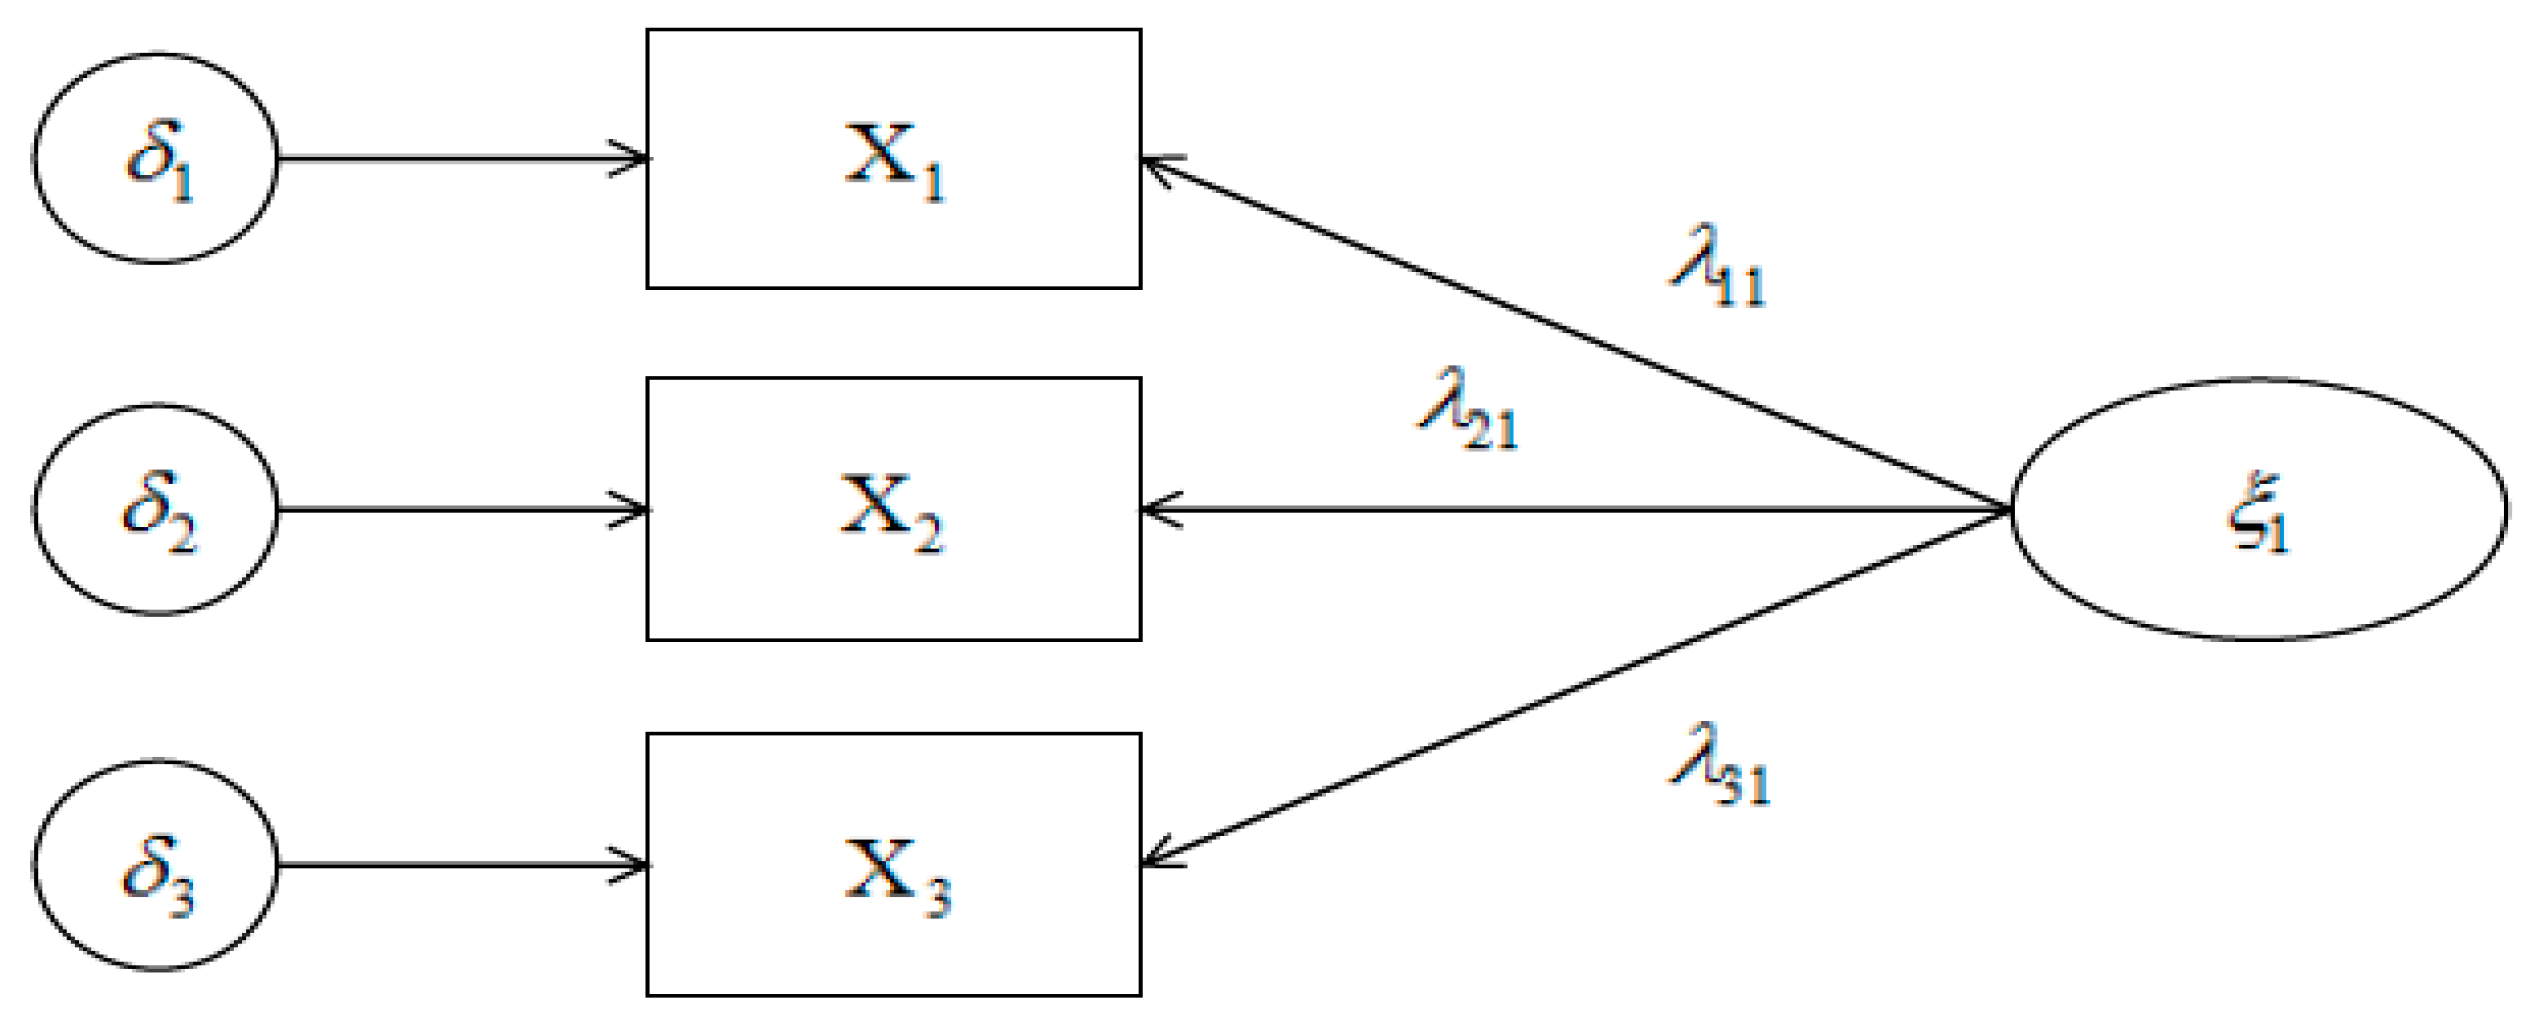
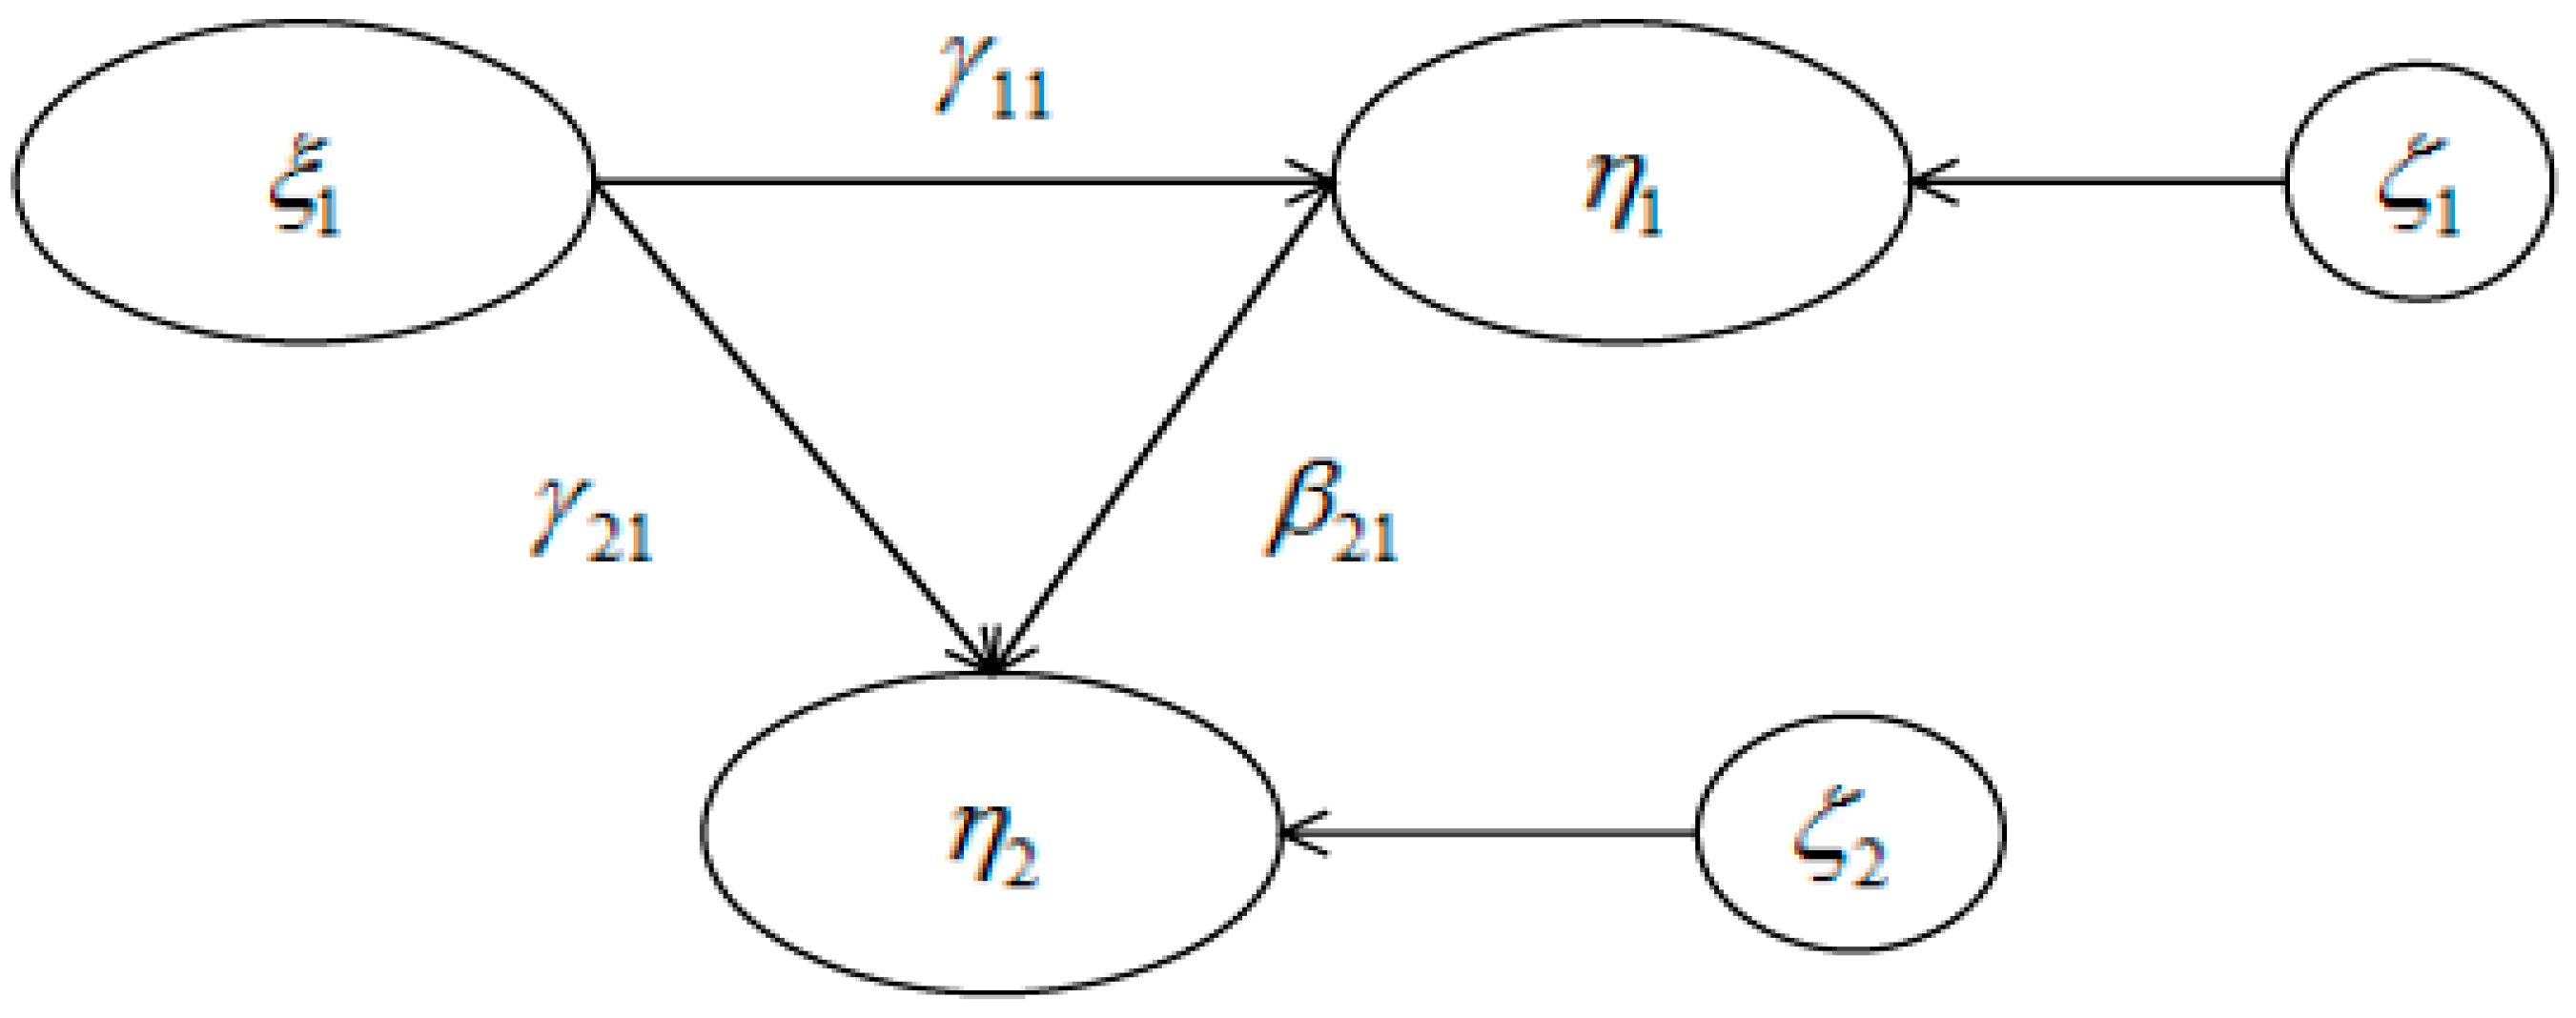
4.1. Methods and Models
- x: Vector consisting of observed variables from exogenous latent variables.
- y: Vector consisting of observed variables from endogenous latent variables.
- : The strength of association from exogenous observed variables.
- : The strength of association from endogenous observed variables.
- ξ: Unobserved exogenous latent variables.
- η: Unobserved endogenous latent variables.
- δ: The error items of the exogenous variables.
- ε: The error items of the endogenous variables.
- β: The relationship between endogenous latent variables.
- γ: The relationship between exogenous latent variables.
- ζ: The residual term of the equation, and it represents the portion of the endogenous latent variable that is not interpreted in the SEM.
- (1)
- When 0 < path coefficient ≤ 1, it means that there is a positive correlation between variables or one variable has a positive effect on another variable; that is, the function between variables is monotonically increasing.
- (2)
- When −1 ≤ path coefficient < 0, it means that there is a negative correlation between variables or one variable has a negative effect on the other variable; that is, the function between variables is monotonously decreasing.
- (3)
- When the path coefficient is equal to 0, it means that the variables are independent of each other and not related to each other.
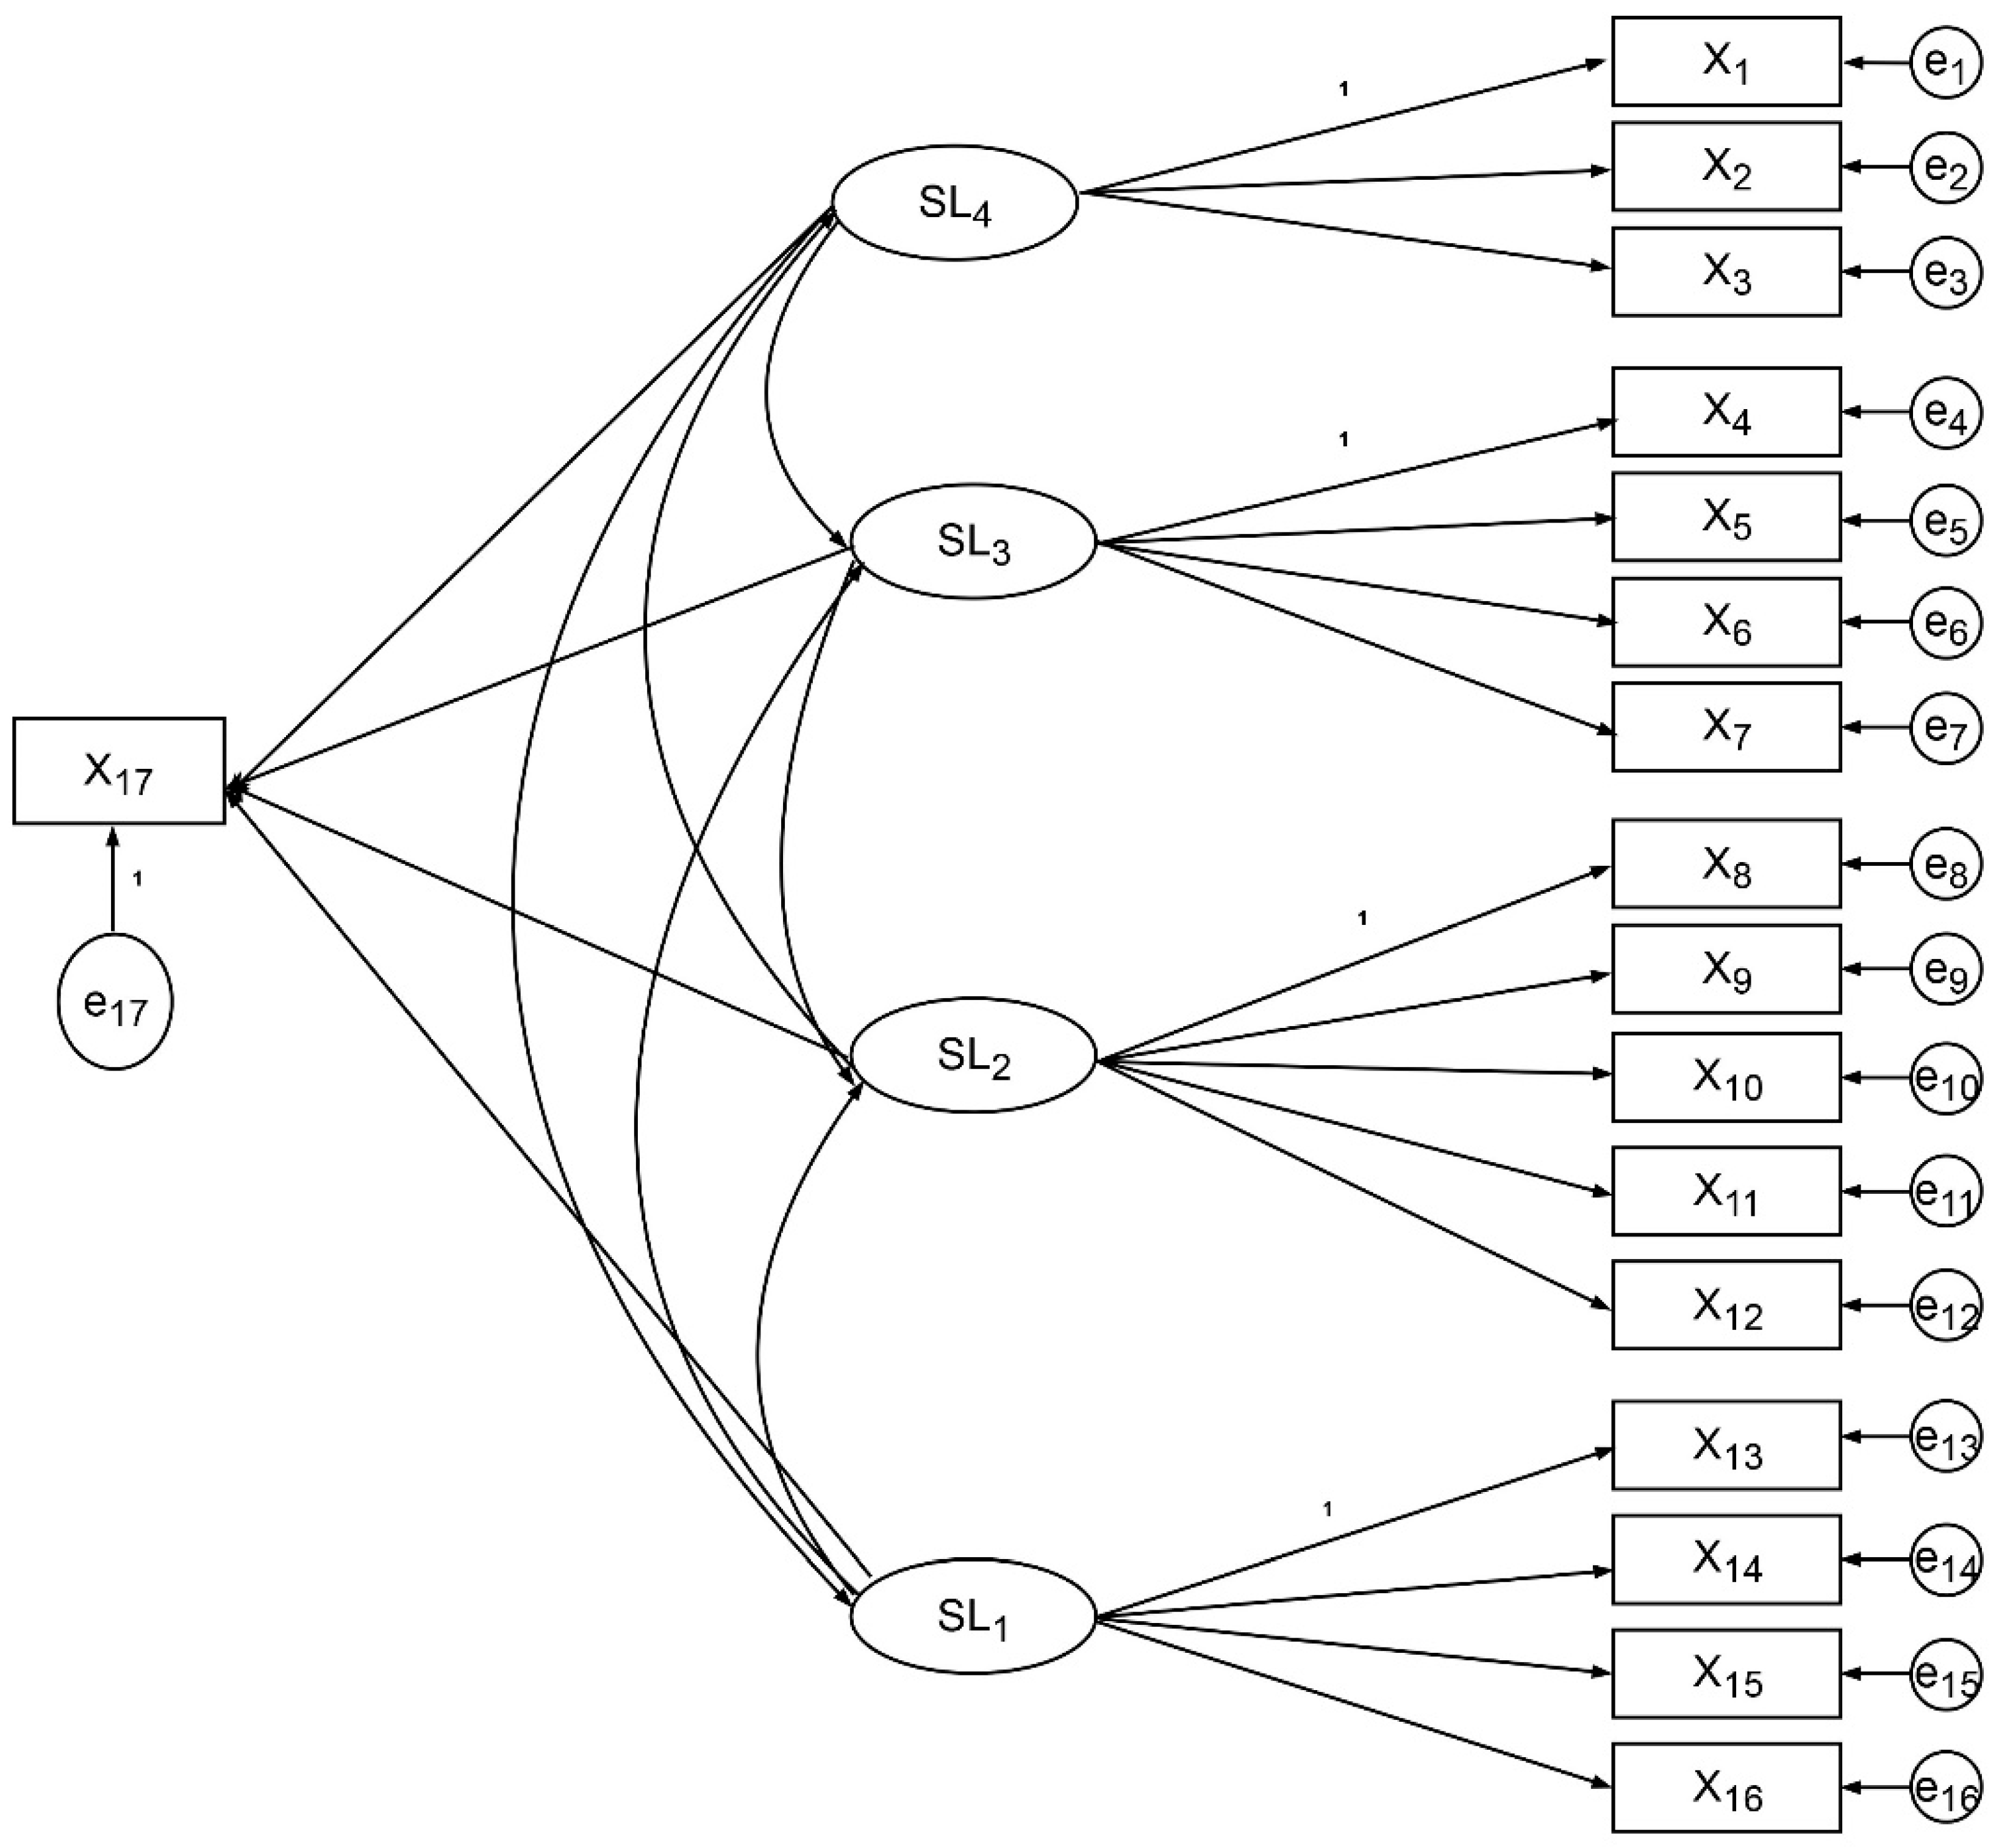
4.2. Hypothesis Structure Model for the Human Factors of MTAs
5. Case Study
5.1. Accident Sample Analysis
5.1.1. Accident Sample Scale
5.1.2. Formatting Causal Factors of the Accident
- (1)
- Liveware–liveware interface (L–L): The interaction between people in the system, such as leadership, management, communication, and cooperation between people.
- (2)
- Liveware–hardware interface (L–H): The relationship between people and ships, equipment, and other hardware, such as whether the design or layout of the ship or equipment conforms to human characteristics, whether it is convenient for people to manage and maintain the hardware, and to use or operate the hardware.
- (3)
- Liveware–software interface (L–S): The relationship between people and software, such as whether the information is complete and easy to follow as well as the ease of the operation of the software.
- (4)
- Liveware–environment interface (L–E): The relationship between humans and the environment, such as whether the working conditions limit human behavior and whether external conditions affect people’s judgments.
- (1)
- Management items: Maritime administration limit, company management limit.
- (2)
- Natural items: Natural disasters, poor visibility, wind, tides, surges.
- (3)
- Channel or terminal items: Navigation loops, channel bends, aids to navigation, navigable waters, chart publications, fishing areas.
- (4)
- Traffic items: Navigation order, traffic accident, berth anchorage, navigation management.
- (5)
- Ship cargo items: Structural defects, equipment defects, cargo defects, latent defects, large workload.
- (6)
- Personnel involved items: The tugboat operator, the ship operator, and the outboard operator.
- (7)
- Crew items: Violation operation, negligence of route planning, negligence of navigation operation, negligence in avoidance of collision, negligent manipulation, emergency-handling, communication and cooperation negligence.
- Level I, the factor may not impact the accident outcome, no effect.
- Level II, the factor may partly impact the accident outcome, involved.
- Level III, the factor may mainly impact the accident outcome, mainly.
- Level IV, the factor may apparently impact the accident outcome, directly.
5.2. Data Acquisition and Reliability Analysis
5.3. Model Fitting and Correction
5.4. Reliability Analysis in Path Dependency
5.5. Sensitivity Analysis of the HFACS-MTA Based on the SEM Model
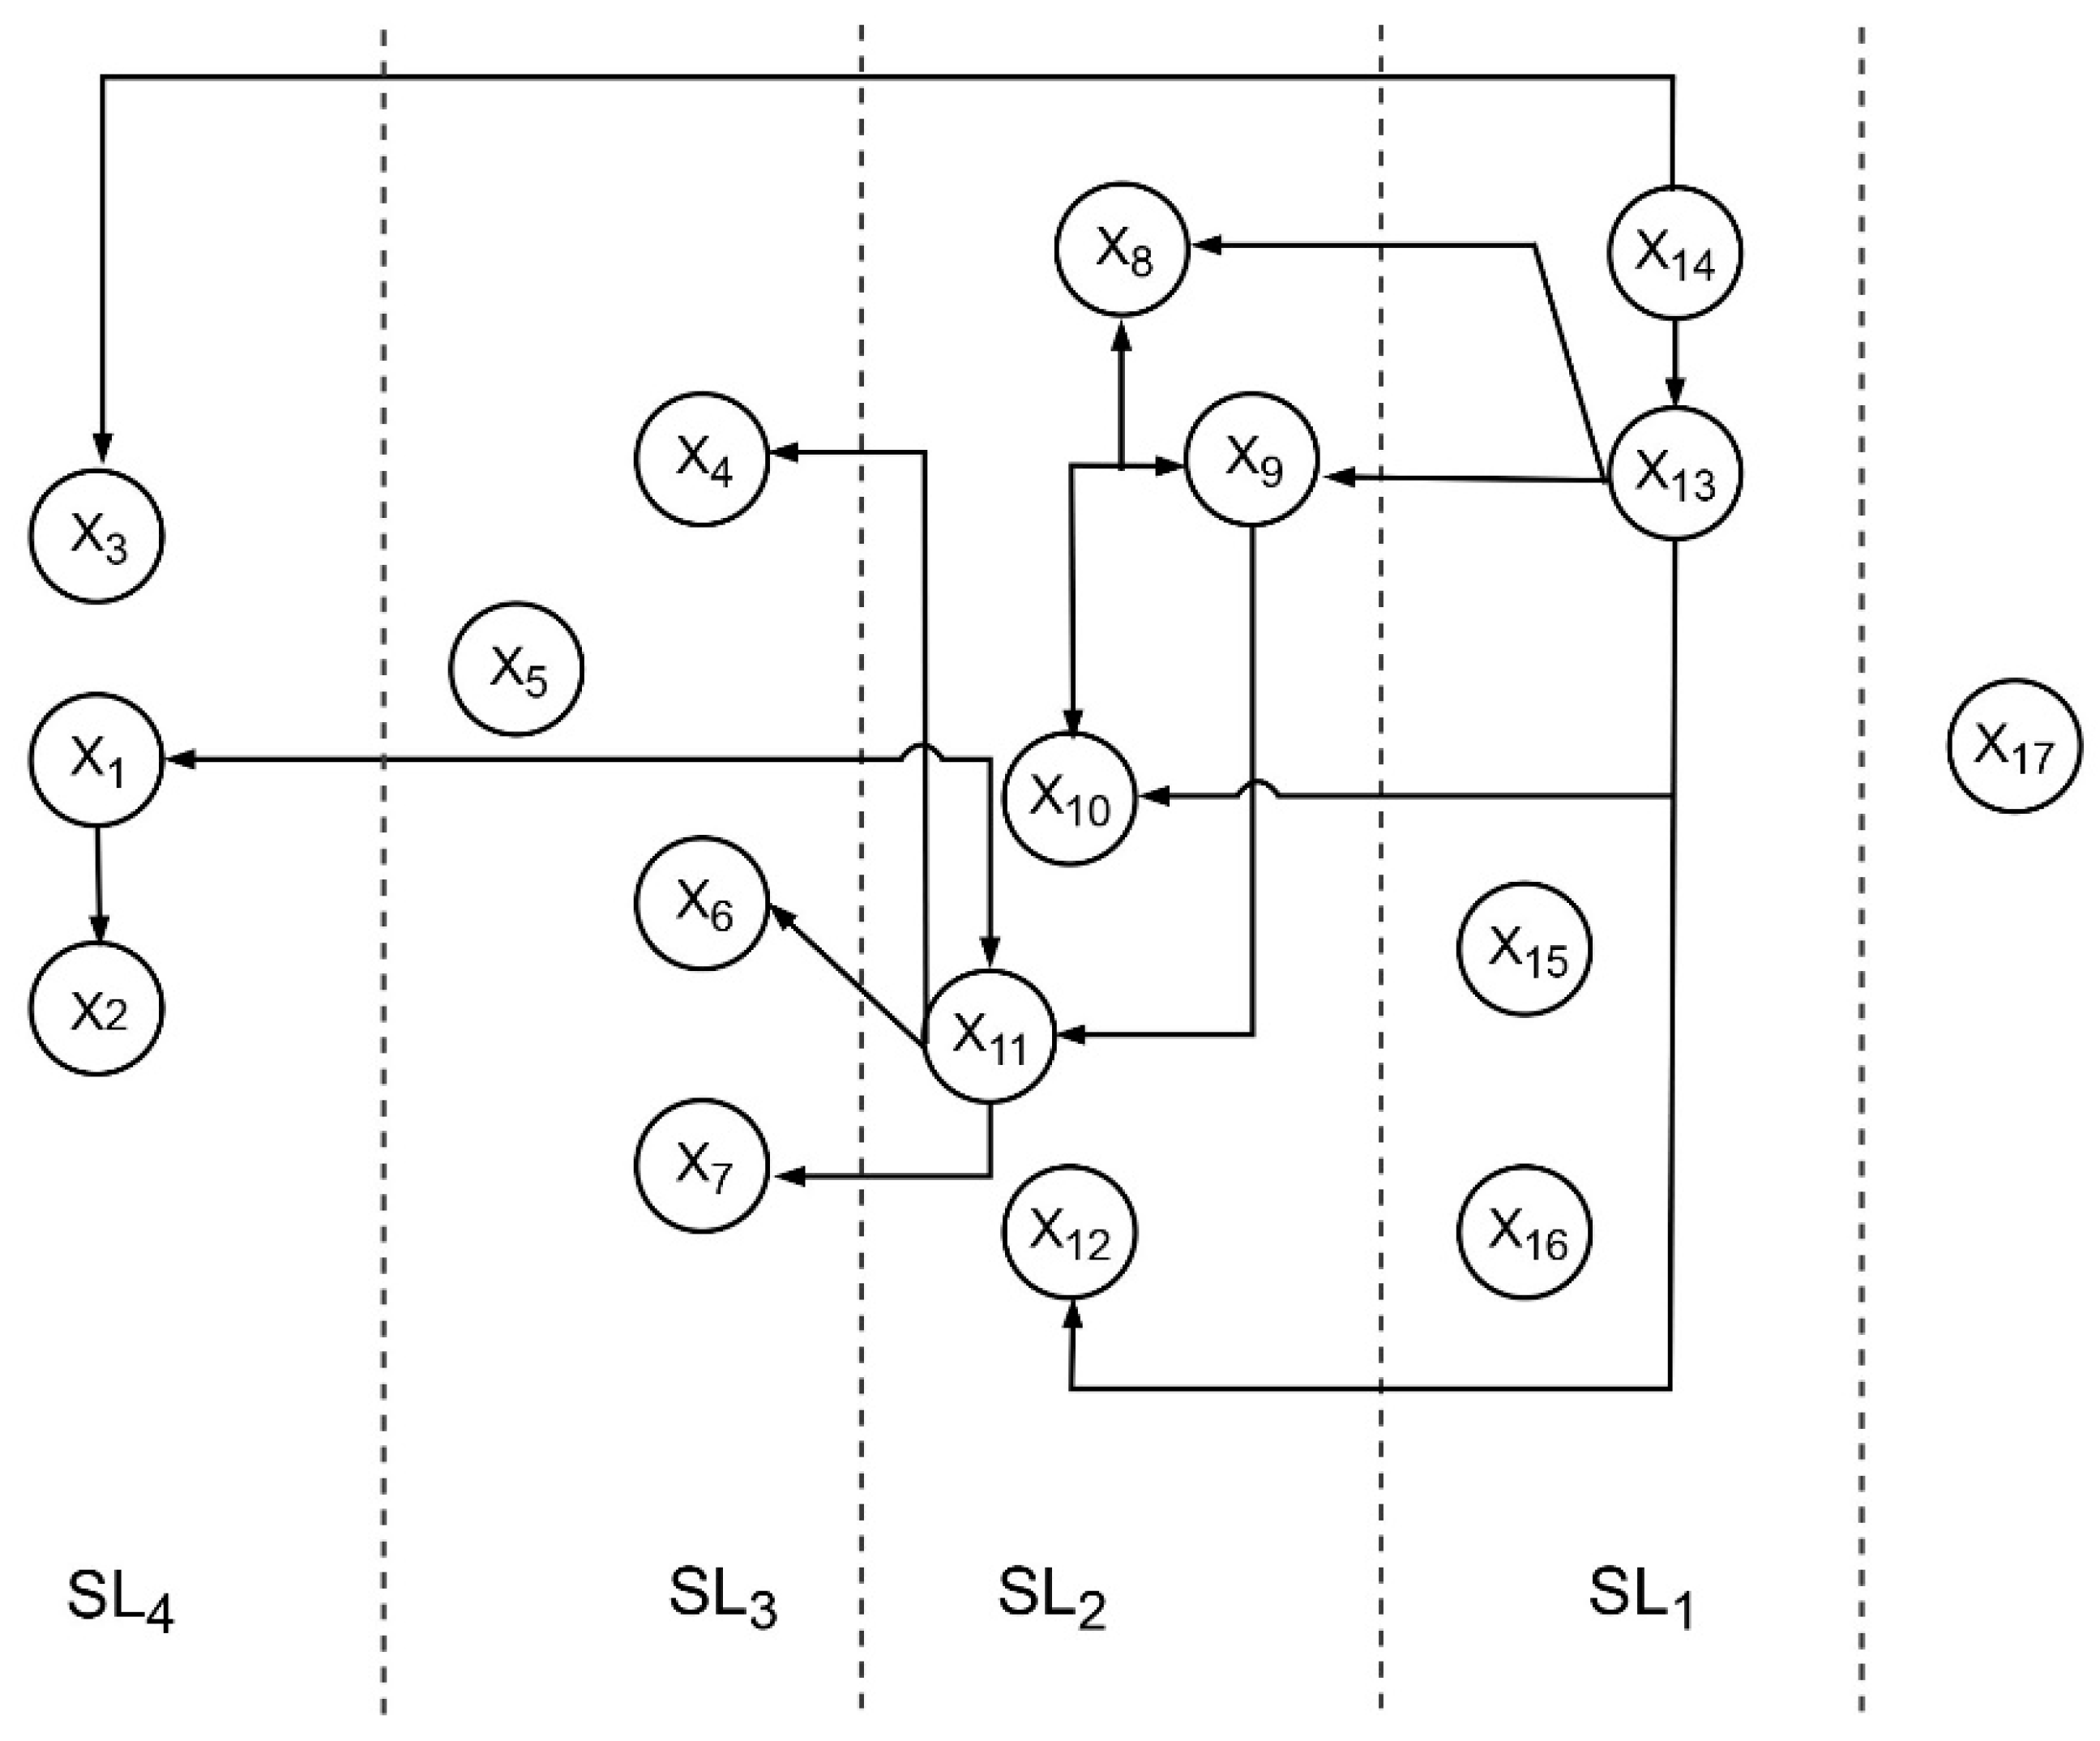
- (1)
- Organizational influences, SL4, are not only related to the three types of human factors in the theory, but also related to the natural environment.
- (2)
- There is no significant correlation between unsafe supervision, SL3, and unsuitable execution plan, X5, in HFACS theory, but there is a correlation with slip, X13.
- (3)
- The preconditions for unsafe acts, SL2, are related to unsuitable execution plan, X5, and violation monitoring, X7.
- (4)
- There are correlations between unsafe acts, SL1, and resource management, X1, unsuitable execution plan, X5, error-correction parsing, X6, team factors, X8, and material factors, X10.
6. Path Analysis and Discussion
- The “natural environment” is the important reason for the entire accident system, and it is the key link between the previous factor and the next.
- “Resource management” has a prominent position in the organizational influence level (root cause) and is highly relevant.
- “Process safety control” directly affects the “slip” of unsafe human acts.
- (1)
- The organizational influences, SL4, corresponding to category II human factors are resource management, organizational climate, process safety control, and natural environment. Category II human factors corresponding to unsafe supervisions, are: Error-correction parsing, inadequate oversight, violation monitoring, team factors, and slip.
- (2)
- The preconditions for unsafe acts, SL2, corresponding to category II human factors are violation monitoring, team factors, unsuitable execution plan, individual factors, and violation.
- (3)
- The unsafe acts, SL1, corresponding to category II human factors are resource management, error-correction parsing, lapse, and mistake. Among them, resource management, error-correction parsing, team factors, and violation monitoring distribution are related to two category I human factors.
- (4)
- After comparing the four levels of the HFACS framework, organizational influences, SL4, preconditions for unsafe acts, SL2, and unsafe acts, SL1, were detected to strongly contribute to marine accident risks. This implies that organizational and individual factors should be emphasized instead of unsafe supervision, SL3, considerations. This study further identified that the factors at the preconditions for unsafe acts level are most influential to marine accident risks among all factors at the HFACS levels, and the unsafe supervisions level influences marine accident consequences.
- (5)
- From the path of the accident, there are simple chains, complex chains, and system networks [46,47]. The accident path is a simple chain described by the domino model, Swiss cheese model, and the HFACS. The domino model considers that the accident causes the dominoes represented by each module to fall down one after another so that an accident will occur. This logic model was clear, but such a simple linear description cannot truly reflect the nonlinear interactions of various factors present in complex social technology systems. The path of the accident described by the trajectory crossover model is a complex chain, in which, such as in this model, two parallel paths are proposed to lead to the accident. This study has involved the thinking mode of system theory on the HFACS to describe the path of the system network about an accident. It is thought that there are both hierarchical and causal relationships between the causes of accidents, and the interactions are mixed to form a network, which is closer to the real material world.
7. Conclusions
- (1)
- The HFACS-MTA generic texture hypothesis paradigm based on the SEM can develop system pathway maps between the latent (independent) variable and observed (dependent) variable, which could allow quantitative study of interrelationships in various causes. The hypothesis model application shows that the relationship of human factors in the MTA is consistent with the HFACS, and the direction of human error in the MTA is in the order of organizational influences, unsafe supervisions, and preconditions for unsafe acts, and finally passed on to unsafe acts. The mutual influences in the factors of the accident causes are obviously different.
- (2)
- Structural equation modeling is a powerful research tool in the field of safety sciences, but the establishment of related models relies on the knowledge of relevant scientific fields. The setting of the implicit variables of the structural equations of accident causation theory and the setting of the relationship between hidden variables are the theoretical knowledge base of the maritime field. The setting and measurement of the measured variables corresponding to the hidden variables also have their theoretical basis. The structural equation model is only a mathematical expression of the theoretical knowledge base of the relevant scientific field, and it provides a tool for us to study related safety sciences.
- (3)
- We have seen that in recent times, the theory of safety-oriented causation based on system theory has greatly changed and developed an understanding of the formation of traditional accidents. In particular, the characteristics of safety are seen as an emergence of systems, with safety issues as a matter of control. The cause of the accident is not only to describe the components in the system structure, but also to explain the interaction and coupling between the causal factors. This paper believes that a certain mathematical algorithm is used to analyze the degree of cross-linking between factors, describe the process of controlling between factors, and then determine the path of accident formation. This is a quantitative demonstration of the cheese model, revealing the path dependence of management defects in the field of marine safety affecting human behavior.
- (4)
- We also see that to study the safety problems of complex marine traffic systems, a theoretical model of a complex system needs to be constructed, and thus an accident cause structural hypothesis was proposed. Appropriate algorithms for the theoretical human-machine-control model were used to understand the safety performance of marine traffic systems under different parameters through mathematical analysis. Accident databases providing manifold data were only measured, but were subjective especially in relation to the assessment of human failures and the question of how consistent the database is, which remains a critical issue. Combined with big data ideas and intelligent prediction theory, it provides an important basis for risk pre-warning and accident prevention. This will be a problem that will require further research.
Author Contributions
Funding
Acknowledgments
Conflicts of Interest
References
- Graziano, A.; Teixeira, A.P.; Soares, C.G. Classification of human errors in grounding and collision accidents using the tracer taxonomy. Saf. Sci. 2016, 86, 245–257. [Google Scholar] [CrossRef]
- Yang, Z.L.; Wang, J.; Li, K.X. Maritime safety analysis in retrospect. Marit. Policy Manag. 2013, 40, 261–277. [Google Scholar] [CrossRef]
- Yang, Z.L.; Bonsall, S.; Wall, A.; Wang, J.; Usman, M. A modified CREAM to human reliability quantification in marine engineering. Ocean Eng. 2013, 58, 293–303. [Google Scholar] [CrossRef]
- Schröder-Hinrichs, J.U.; Hollnagel, E.; Baldauf, M. From Titanic to Costa Concordia: A century of lessons not learned. Wmu J. Marit. Aff. 2012, 11, 151. [Google Scholar] [CrossRef]
- Xi, Y.T.; Yang, Z.L.; Fang, Q.G.; Chen, W.J.; Wang, J. A new hybrid approach to human error probability quantification–applications in maritime operations. Ocean Eng. 2017, 138, 45–54. [Google Scholar] [CrossRef]
- Pidgeon, N.; O’Leary, M. Man-made disasters: Why technology and organizations (sometimes) fail. Saf. Sci. 2000, 34, 15–30. [Google Scholar] [CrossRef]
- Grant, E.; Salmon, P.M.; Stevens, N.J.; Goode, N.; Read, G.J. Back to the future: What do accident causation models tell us about accident prediction? Saf. Sci. 2018, 104, 99–109. [Google Scholar] [CrossRef]
- Reason, J.T. The Human Contribution: Unsafe Acts, Accidents and Heroic Recoveries; Ashgate Publishing Ltd.: Farnham, UK, 2008. [Google Scholar]
- Rasmussen, J. Risk management in a dynamic society: A modelling problem. Saf. Sci. 1997, 27, 183–213. [Google Scholar] [CrossRef]
- Rasmussen, J. Human factors in a dynamic information society: Where are we heading? Ergonomics 2000, 43, 869–879. [Google Scholar] [CrossRef]
- Leveson, N.G. A New Accident Model for Engineering Safer Systems. Saf. Sci. 2004, 42, 237–270. [Google Scholar] [CrossRef]
- Leveson, N. A systems approach to risk management through leading safety indicators. Reliab. Eng. Syst. Saf. 2015, 136, 17–34. [Google Scholar] [CrossRef]
- Hänninen, M. Bayesian networks for marine traffic accident prevention: Benefits and challenges. Accid. Anal. Prev. 2014, 73, 305–312. [Google Scholar] [CrossRef] [PubMed]
- Hollnagel, E. FRAM: The Functional Resonance Analysis Method: Modelling Complex Socio-Technical Systems; Ashgate Publishing Ltd.: Farnham, UK, 2012. [Google Scholar]
- Hollnagel, E. Safety-I and Safety–II: The Past and Future of Safety Management; Ashgate Publishing Ltd.: Farnham, UK, 2014. [Google Scholar]
- Jones, C.; Phipps, D.; Ashcroft, D. Understanding procedural violations using safety-I and safety-II: The case of community pharmacies. Saf. Sci. 2018, 105, 114–120. [Google Scholar] [CrossRef] [PubMed]
- Hu, S.; Zhang, J. Risk assessment of marine traffic safety at coastal water area. Procedia Eng. 2012, 45, 31–37. [Google Scholar] [CrossRef]
- Dai, T.; Wang, H. The human factors analysis of marine accidents based on goal structure notion. In Proceedings of the 2011 IEEE International Conference on Industrial Engineering and Engineering Management, Singapore, 6–9 December 2011; pp. 1883–1887. [Google Scholar]
- Hu, S.; Huang, C.; Deng, H.; Huang, D. Markov chain model for the dynamic simulation of process risk in ship pilotage at harbor. J. Harbin Eng. Univ. 2017, 38, 1391–1398. [Google Scholar]
- Fan, Y.X.; Ming, L.U.; Zhi, L.I.; Pei, J.J. A review of accident modelling approaches based on factors of hazards. China Saf. Sci. J. 2014, 24, 319–346. [Google Scholar]
- Sotiralis, P.; Ventikos, N.P.; Hamann, R.; Golyshev, P.; Teixeira, A.P. Incorporation of human factors into ship collision risk models focusing on human centred design aspects. Reliab. Eng. Syst. Saf. 2016, 156, 210–227. [Google Scholar] [CrossRef]
- Lyu, S.; Ckh, H.; Chan, A.; Fkw, W.; Javed, A.A. Relationships among safety climate, safety behavior, and safety outcomes for ethnic minority construction workers. Int. J. Environ. Res. Public Health 2018, 15, 484. [Google Scholar] [CrossRef]
- Dekker, S.; Cilliers, P.; Hofmeyr, J.-H. The complexity of failure: Implications of complexity theory for safety investigations. Safety Sci. 2011, 49, 939–945. [Google Scholar] [CrossRef]
- Dekker, S.; Pitzer, C. Examining the asymptote in safety progress: A literature review. Int. J. Occup. Saf. Ergon. 2016, 22, 57–65. [Google Scholar] [CrossRef]
- Gaur, D. Human factors analysis and classification system applied to civil aircraft accidents in India. Aviat. Space Environ. Med. 2005, 76, 501–505. [Google Scholar] [PubMed]
- Shappell, S.A.; Wiegmann, D.A. A Human Error Approach to Accident Investigation: The Taxonomy of Unsafe Operations. Int. J. Aviat. Psychol. 1997, 7, 269–291. [Google Scholar] [CrossRef]
- Shappell, S.A.; Wiegmann, D.A. The human factors analysis and classification system-HFACS. Am. Libr. 2000, 1, 20–46. [Google Scholar]
- Wiegmann, D.A.; Shappell, S.A. Human error analysis of commercial aviation accidents: Application of the human factors analysis and classification system (HFACS). Aviat. Space Environ. Med. 2001, 72, 1006. [Google Scholar] [PubMed]
- Krulak, D.C. Human factors in maintenance: Impact on aircraft mishap frequency and severity. Aviat. Space Environ. Med. 2004, 75, 429–432. [Google Scholar]
- Shappell, S.; Detwiler, C.; Holcomb, K.; Hackworth, C.; Boquet, A.; Wiegmann, D.A. Human error and commercial aviation accidents: An analysis using the human factors analysis and classification system. Hum. Factors 2007, 49, 227–242. [Google Scholar] [CrossRef] [PubMed]
- Celik, M.; Er, I.D. Identifying the potential roles of design-based failures on human errors in shipboard operations. In Proceedings of the 7th Navigational Symposium on Marine Navigation and Safety of Sea Transportation, Gdynia, Poland, 20–22 June 2007; pp. 617–621. [Google Scholar]
- Celik, M.; Cebi, S. Analytical HFACS for investigating human errors in shipping accidents. Accid. Anal. Prev. 2009, 41, 66–75. [Google Scholar] [CrossRef]
- Chen, S.T.; Wall, A.; Davies, P.; Yang, Z.; Wang, J.; Chou, Y.H. A human and organisational factors (HOFs) analysis method for marine casualties using HFACS-marine accidents (HFACS-MA). Saf. Sci. 2013, 60, 105–114. [Google Scholar] [CrossRef]
- Huang, C.; Hu, S. Factors correlation mining on maritime accidents database using association rule learning algorithm. Cluster Comput. 2018. [Google Scholar] [CrossRef]
- Hu, S.; Fang, Q.; Xia, H.; Xi, Y. Formal safety assessment based on relative risks model in ship navigation. Reliab. Eng. Syst. Saf. 2007, 92, 369–377. [Google Scholar] [CrossRef]
- Chen, Z.B.; Dong, Z. Analysis of human factors in coal mine accidents based on HFACS. China Saf. Sci. J. 2013, 23, 116–121. [Google Scholar]
- Wang, H.; Jiang, H.; Yin, L. Cause mechanism study to human factors in marine accidents: Towards a complex system brittleness analysis approach. Procedia Soc. Behav. Sci. 2013, 96, 723–727. [Google Scholar] [CrossRef]
- Byrne, B.M. Structural Equation Modeling with AMOS: Basic Concepts, Applications, and Programming; Routledge: London, UK, 2009. [Google Scholar]
- Seo, D.C. An explicative model of unsafe work behavior. Saf. Sci. 2005, 43, 187–211. [Google Scholar] [CrossRef]
- Seo, H.C.; Lee, Y.S.; Kim, J.J.; Jee, N.Y. Analyzing safety behaviors of temporary construction workers using structural equation modeling. Saf. Sci. 2015, 77, 160–168. [Google Scholar] [CrossRef]
- Marshall, P.; Hirmas, A.; Singer, M. Heinrich’s pyramid and occupational safety: A statistical validation methodology. Saf. Sci. 2018, 101, 180–189. [Google Scholar] [CrossRef]
- Chauvin, C.; Lardjane, S.; Morel, G.; Clostermann, J.P.; Langard, B. Human and organisational factors in marine accidents: Analysis of collisions at sea using the HFACS. Accid. Anal. Prev. 2013, 59, 26–37. [Google Scholar] [CrossRef] [PubMed]
- Wu, B.; Yan, X.; Wang, Y.; Soares, C.G. An evidential reasoning based CREAM to human reliability analysis in marine accident process. Risk Anal. 2017, 37, 1936–1957. [Google Scholar] [CrossRef]
- Zhang, Y.; Shao, W.; Zhang, M.; Li, H.; Yin, S.; Xu, Y. Analysis 320 coal mine accidents using structural equation modeling with unsafe conditions of the rules and regulations as exogenous variables. Accid. Anal. Prev. 2016, 92, 189–201. [Google Scholar] [CrossRef] [PubMed]
- Crowley, S.L.; Fan, X. Structural equation modeling: Basic concepts and applications in personality assessment research. J. Personal. Assess. 1997, 68, 508. [Google Scholar] [CrossRef]
- Salmon, P.M.; Cornelissen, M.; Trotter, M.J. Systems-based accident analysis methods: A comparison of Accimap, HFACS, and STAMP. Safety Science. 2012, 50, 1158–1170. [Google Scholar] [CrossRef]
- Sobieski, J.S. Integrated system-of-system synthesis. In Proceedings of the 11th AIAA/ISSMO Multi-Disciplinary Analysis and Optimization Conference, Portsmouth, Virginia, 6–8 September 2006; pp. 6–8. [Google Scholar]


| Symbol | Item of Causal Factors | Symbol | Item of Causal Factors |
|---|---|---|---|
| SL0 | Accident | X7 | Violation Monitoring |
| SL1 | Unsafe Acts | X8 | Team factors |
| SL2 | Preconditions for Unsafe Acts | X9 | Individual factors |
| SL3 | Unsafe Supervisions | X10 | Material factors |
| SL4 | Organizational Influences | X11 | Natural Environment |
| X1 | Resource Management | X12 | Physical Environment |
| X2 | Organizational Climate | X13 | Slip |
| X3 | Process Safety Control | X14 | Lapse |
| X4 | Inadequate Oversight | X15 | Mistake |
| X5 | Unsuitable Execution Plan | X16 | Violation |
| X6 | Error-Correction Parsing | X17 | Accident Consequence |
| No: | Item | Description and Observation Character |
|---|---|---|
| X1 | Resource management | Ship resource allocation, the allocation of ship resources, including operators, equipment, and facilities, information support, and monitoring, embodied in the suitability of personnel, the seaworthiness of the ship, and the suitability and effectiveness of external supporters. |
| X2 | Organizational climate | The organizational climate can influence employees’ events, activities, and procedures, as well as those that may be rewarded, supported, and expected. It can be divided into employees’ internal perceptions and team climates. |
| X3 | Process safety control | Process safety refers to how to prevent accidental loss of control and possible traffic accidents caused by installations and facilities during navigation, berthing, and operation process, resulting in damage to employees and ships, environmental damage, and property loss. |
| X4 | Inadequate oversight | No finding in operation arrangements or process issues. Insufficient staff training time, vessel traffic system monitoring failure. |
| X5 | Unsuitable execution plan | Improper arrangement of berths and anchorages, operation plan negligence, operation plan rationality defect. |
| X6 | Error-correction parsing | Similar accident recurrence |
| X7 | Violation monitoring | Limit cause from draught, weather, ship scale, etc. |
| X8 | Team factors | Crew member’s mistake; tug crew error; communication and cooperation negligence. |
| X9 | Individual factors | Illness or bad physiological state; alcoholic beverage; continuous operation, fatigue etc. |
| X10 | Material factors | Equipment defects, structural defects, cargo defects, latent defects, overload. |
| X11 | Natural environment | Natural disasters, poor visibility, wind currents, tides, surges, navigational environments, waterway bends, navigation aids, navigable waters, fishing areas. |
| X12 | Physical environment | Channel curvature; obstacle (including dock or anchorage restrictions). Navigation aid; navigation density; navigable water depth; navigable water width. |
| X13 | Slip | Precaution to the natural conditions of the fairway; precaution on ship traffic conditions; precaution to encountering ship behavior; visual hope negligence; navigation instrument not used correctly. |
| X14 | Lapse | Navigation operation; avoidance collision behavior; manipulation judgment. |
| X15 | Mistake | Emergency treatment; manipulating behavior (an anchorage, by mooring). |
| X16 | Violation | Violation operation (relevant ship); violation operation (assisting tugboat); violation operation (pilot); deviation (pilot). |
| X17 | Accident consequence | Degree of the consequences of the accident, including near miss. |
| Rank | Value | Description |
|---|---|---|
| incidents | 1 | Near miss Hazard An event considered to be worthy of attention |
| minor accidents | 2 | Failure that can be readily compensated by the crew No significant harm to people, property or the environment |
| general accidents | 3 | Local damage to ship Marginal conditions for, or injuries to crew |
| major accidents | 4 | Major casualties excluding total loss Single fatality or multiple severe injuries |
| serious accidents | 5 | Total loss (actual loss and constructive total loss) Many fatalities |
| Case No: | X1 | X2 | X3 | X4 | X5 | X6 | X7 | X8 | X9 | X10 | X11 | X12 | X13 | X14 | X15 | X16 | X17 |
|---|---|---|---|---|---|---|---|---|---|---|---|---|---|---|---|---|---|
| 1 | 5 | 4 | 4 | 5 | 1 | 5 | 1 | 1 | 1 | 4 | 2 | 4 | 1 | 4 | 4 | 1 | 3 |
| 2 | 4 | 4 | 5 | 5 | 5 | 5 | 5 | 5 | 1 | 5 | 2 | 4 | 1 | 4 | 4 | 5 | 5 |
| 3 | 4 | 5 | 5 | 5 | 4 | 4 | 4 | 1 | 1 | 5 | 4 | 5 | 1 | 4 | 4 | 5 | 4 |
| 4 | 4 | 4 | 4 | 5 | 5 | 4 | 5 | 5 | 5 | 5 | 5 | 4 | 5 | 4 | 5 | 5 | 4 |
| 5 | 5 | 5 | 4 | 4 | 5 | 5 | 4 | 1 | 1 | 5 | 5 | 4 | 1 | 4 | 5 | 4 | 4 |
| 6 | 4 | 4 | 5 | 4 | 5 | 4 | 4 | 1 | 1 | 5 | 2 | 4 | 1 | 4 | 5 | 4 | 4 |
| 7 | 4 | 5 | 4 | 5 | 5 | 4 | 5 | 4 | 5 | 5 | 5 | 5 | 5 | 5 | 4 | 4 | 4 |
| 8 | 5 | 4 | 5 | 4 | 5 | 4 | 5 | 5 | 1 | 4 | 2 | 5 | 1 | 4 | 4 | 4 | 5 |
| 9 | 5 | 5 | 5 | 5 | 1 | 5 | 1 | 1 | 1 | 4 | 5 | 5 | 1 | 4 | 5 | 1 | 3 |
| 10 | 5 | 5 | 5 | 4 | 1 | 4 | 1 | 1 | 1 | 5 | 4 | 5 | 1 | 5 | 4 | 1 | 3 |
| ------------------ | |||||||||||||||||
| 891 | 4 | 5 | 4 | 4 | 5 | 5 | 5 | 1 | 1 | 2 | 4 | 4 | 1 | 4 | 4 | 4 | 2 |
| 892 | 4 | 5 | 4 | 5 | 5 | 5 | 5 | 1 | 1 | 2 | 5 | 5 | 1 | 4 | 5 | 4 | 2 |
| 893 | 4 | 4 | 4 | 4 | 1 | 5 | 1 | 1 | 1 | 5 | 2 | 4 | 1 | 5 | 5 | 1 | 1 |
| 894 | 4 | 5 | 5 | 5 | 1 | 4 | 1 | 1 | 1 | 5 | 4 | 4 | 1 | 4 | 5 | 1 | 1 |
| μ | 4.1 | 4.2 | 4.1 | 4.2 | 4.0 | 4.1 | 2.7 | 2.9 | 2.3 | 4.1 | 3.7 | 4.4 | 2.1 | 4.5 | 4.5 | 4.0 | 4.3 |
| σ | 0.8 | 0.7 | 0.7 | 0.7 | 1.3 | 0.8 | 1.3 | 1.7 | 1.7 | 0.9 | 1.1 | 0.4 | 1.6 | 0.4 | 0.4 | 1.3 | 1.1 |
| Hypothesis | Estimate Value | Critical Ratio | Conclusion |
|---|---|---|---|
| H1: SL3- > SL4 | 0.944 | 33.727 | Significant influences exist, defined hypothesis is true |
| H2: SL2- > SL3 | 0.077 | 2.175 | Significant influences exist, defined hypothesis is true |
| H3: SL1- > SL2 | 0.125 | 2.921 | Significant influences exist, defined hypothesis is true |
| Evaluation Index | Estimate Value | Adaptation Standard |
|---|---|---|
| Absolute index | ||
| x2 Significant probability value | 0.281 | >0.05 |
| Goodness-of-fit index (GFI) | 0.989 | >0.90 |
| Adjusted goodness-of-fit index (AGFI) | 0.980 | >0.90 |
| Root mean square residual (RMR) | 0.031 | <0.05 |
| Root mean square error of approximation (RMSEA) | 0.010 | <0.05 |
| Relative index | ||
| Normal fit index (NFI) | 0.993 | >0.90 |
| Relative fitness index (RFI) | 0.988 | >0.90 |
| Incremental fit index (IFI) | 0.999 | >0.90 |
| Tracker—Lewis index (TLI) | 0.999 | >0.90 |
| Comparative-fit index (CFI) | 0.999 | >0.90 |
| Parsimony index | ||
| Parsimony goodness-of-fit Index (PGFI) | 0.552 | >0.50 |
| Parsimony-adjusted (PNFI) | 0.629 | >0.50 |
| x2/nf (NC) indicating the degree of minimalist fit | 1.088 | 1 < NC < 3 |
| Correlation Mode | Standardized Path Coefficient | ||
|---|---|---|---|
| SL4 | -> | X11 | 0.24 |
| SL3 | -> | X5 | No significant effect |
| X13 | 0.21 | ||
| SL2 | -> | X5 | 0.94 |
| X7 | 0.82 | ||
| SL1 | -> | X1 | 0.27 |
| X5 | 0.16 | ||
| X6 | 0.23 | ||
| X8 | 0.08 | ||
| X10 | 0.09 | ||
© 2019 by the authors. Licensee MDPI, Basel, Switzerland. This article is an open access article distributed under the terms and conditions of the Creative Commons Attribution (CC BY) license (http://creativecommons.org/licenses/by/4.0/).
Share and Cite
Hu, S.; Li, Z.; Xi, Y.; Gu, X.; Zhang, X. Path Analysis of Causal Factors Influencing Marine Traffic Accident via Structural Equation Numerical Modeling. J. Mar. Sci. Eng. 2019, 7, 96. https://doi.org/10.3390/jmse7040096
Hu S, Li Z, Xi Y, Gu X, Zhang X. Path Analysis of Causal Factors Influencing Marine Traffic Accident via Structural Equation Numerical Modeling. Journal of Marine Science and Engineering. 2019; 7(4):96. https://doi.org/10.3390/jmse7040096
Chicago/Turabian StyleHu, Shenping, Zhuang Li, Yongtao Xi, Xunyu Gu, and Xinxin Zhang. 2019. "Path Analysis of Causal Factors Influencing Marine Traffic Accident via Structural Equation Numerical Modeling" Journal of Marine Science and Engineering 7, no. 4: 96. https://doi.org/10.3390/jmse7040096
APA StyleHu, S., Li, Z., Xi, Y., Gu, X., & Zhang, X. (2019). Path Analysis of Causal Factors Influencing Marine Traffic Accident via Structural Equation Numerical Modeling. Journal of Marine Science and Engineering, 7(4), 96. https://doi.org/10.3390/jmse7040096