Article

Performance Simulation of the Transportation Process Risk of Bauxite Carriers Based on the Markov Chain and Cloud Model

1
Merchant Marine College, Shanghai Maritime University, Shanghai 201306, China
2
Australia Maritime College, University of Tasmania, Launceston 7248, Australia
3
College of Transport & Communications, Shanghai Maritime University, Shanghai 201306, China
*
Author to whom correspondence should be addressed.
J. Mar. Sci. Eng. 2019, 7(4), 108; https://doi.org/10.3390/jmse7040108
Submission received: 4 March 2019 / Revised: 15 April 2019 / Accepted: 16 April 2019 / Published: 18 April 2019
(This article belongs to the Special Issue Advances in Marine Dynamic Simulation)

Abstract

:
China imports a large quantity of bauxite each year. Bauxite in fine particles with high moisture has a high risk of liquefaction during the maritime transportation process, which is harmful to the stability and safety of the carrier. To ensure safe shipping, it is necessary to pay attention to the effects of the operation of cargo, the ship’s maneuvering and the ocean environment during the whole transportation process. The simulation of the process risk helps to develop measures to intervene with the cargo behavior to keep the risk to an acceptable level. This study examined the transportation process of a bauxite carrier using the Markov Chain method at different stages of loading, unberthing, departure and sea navigation. Based on the risk transfer matrix of the operational status at different stages of transportation, a cloud simulation model was developed to analyze the transportation process risk of a ship carrying bulk bauxite. Results: the research revealed that the risk evolution rule of the solid bulk cargoes with potential liquefaction during the transportation process, especially bauxite. The risk alteration during the prophase of the transportation process conforms to the rule of the “spoon curve”. Conclusions: a simulation model of the process risk based on the Markov Chain Cloud is suitable for the simulation analysis of the transportation risk of the bulk bauxite carrier. The outcomes of this study may contribute to better safety management to prevent the occurrence of ship capsizing.

1. Introduction

Bauxite is an abundant resource and unevenly distributed in the world. Due to huge urban constructions and the rapid development of its aviation industry, China has created a great demand for industrial aluminum. China’s imported bauxite increased sharply from about 2.3 million tons in 2007 to 82.62 million tons in 2018 [1], resulting in a substantial increase in the transport of bauxite by shipping.
Due to its cargo characteristics, bauxite can be liquefied under certain conditions during the maritime transport process. The consequence of the liquefaction of bulk cargoes can be extremely severe, including the possible capsize of the ships. For example, M.V. Bulk Jupiter, a Suezmax bulk carrier transporting 46,000 tons of bauxite, capsized in the South China Sea in January 2015. Munro [2] investigated this accident and compared the Bulk Jupiter with the M.V. Orchid Island, which was loaded with bauxite from the same wharf and sailed the same route at sea. Bauxite liquefied during the prophase of the transportation process and the accident happened on the fourth day after departure. Based on bulk carrier casualties between 2005 and 2018, the International Association of Dry Cargo Shipowners stated that Cargo shift and liquefaction had become a great concern for the safe carriage of dry bulk [2,3,4]. Bauxite liquefaction has caused more than 80 seafarer casualties in the past [5]. In responding to the accidents of bauxite carriers, the International Maritime Organisation (IMO) requested that the global bauxite industry undertakes research into the behavior and characteristics of bulk bauxite during ocean transportation [6]. The study of the law of dynamic risk evolution and risk quantification of the ship transportation process under the condition of status transferring is helpful to risk prevention and the intervention of bauxite carriers. In order to develop a quantitative expression of the risk in the maritime transport process, the Markov Chain Cloud (MCC for short) method was introduced to simulate the process.
The rest of this paper is organized as follows. The most recent studies about the risk and the mechanism of cargo liquefaction are reviewed in Section 2. The research theory and model for simulation are presented in Section 3. The research is applied to a specific case in Section 4 and Section 5, where relevant data were collected, assessed and applied to the model and the result was analyzed and discussed. Conclusions are drawn in Section 6.

2. Literature Review

The safety of solid bulk cargo with potential liquefaction (CPL) has been studied from the perspectives of naval and marine engineering and system safety engineering these years. Research reveals the characteristics of cargo that contribute to liquefaction during maritime transportation including particle distribution, moisture content and other properties. To avoid liquefaction, the first thing is to avoid the increase of moisture in cargoes during the storage period at the yard [2]. In addition, special attention should also be paid to other physical properties [7]. For example, Gebeng bauxite [8] was further researched from several properties including article size distribution, moisture content and specific gravity. Generally, sand with more fineness tends to be liquefied [9]. Granular or lump sizes are stable; array sand with better cementation resulting in the ability to prevent liquefaction of soil to occur [10]. The higher risk of bauxite liquefaction is due to the presence of a high level of fine particles, which tend to absorb moisture more than granular particles. Percentages of moisture have a relationship with the particle size distribution where the presence of fine particles will influence the water-holding property [11]. The saturation of the cargo also affects the degree of liquefaction [12]. A suitable moisture limit [8] should be maintained to prevent liquefaction. There are different risk effects on the carrier because of the density distribution of the cargo. The specific density of bauxite, which is between 2.5–3.0 T/m3 affects the stability safety of the carrier during transportation [13].
Some risks arise from cargo-worthiness and the seaworthiness of the ship to be loaded. In order to prevent the cargo shift caused by liquefaction, special ships should be built to transport CPL exceeding the transportable moisture limit (TML) or reliable measures should be taken to prevent cargo shifts in accordance with the requirements of the International Maritime Solid Bulk Cargoes (IMSBC) Code 2017 [14]. The cargo hold stowage plan shall be properly developed in accordance with the specifications of the carrier [15].
There are also high dynamic risks in the process of cargo loading. Uneven loading [16] causes ship sway and endangers the safety of the hull structure. Portella [16] proposed a synchronous drain-loading process for the bauxite carrier to reduce the initial risk of stress superimposed on the hull structure during single-hold loading. Lamba [17] simulated different stages of loading to calculate the stability of the ship. Munro [2] studied the alteration and influence of moisture during cargo loading and storage at sea.
In addition to those internal factors, the external factors also have an important influence on the liquefaction of cargo. Therefore, the moisture of cargo should be properly controlled and monitored due to the conditions of the maritime environment and carrier during the whole transportation [2]. The water retention of cargo during the navigation process [18] involves both water content and particle distribution [11]. Christos [19] revealed that atmospheric moisture is related to the stowage condition of cargo, high moisture increases the risk of liquefaction and the cargo shift in transportation. Such cargo may appear to be in a relatively dry granular state when loaded and yet may contain sufficient moisture to become fluid under the stimulus of compaction and vibration, which occurs during a voyage [20], resulting in a cargo shift [21].
Ship motion acceleration [22], rolling, pitching, and the hull vibration caused by onboard machinery is not only harmful to the safety of the ship structure [23], but can also change the characteristics of the cargo on board [24] and facilitate the liquefaction of cargo [25]. The safe ocean transport of bauxite by large bulk ships is vitally dependent on the stability of the cargo under the influence of wave-induced ship motion [26]. Different vibration amplitudes and frequencies have different effects on cargo liquefaction and ship stability [27]. For example, the interference of strong vibration waves (such as seismic waves) will lead to the liquefaction of mineral sand [28]. Large angle rolling caused by the high wave attracts more emphasis on the derivative risks during the transportation process.
In the case of random waves, especially strong wind waves, ships will roll at large angles, which will easily lead to capsizing accidents [29,30]. Ship rolling may lead to cargo shifts [31] depending on the failure of stowage. The initial displacement of cargo after liquefaction and the inclination moment of an external wind wave may lead to capsizing [32]. The effect of liquefying solid bulk cargo at different stages on the ship’s stability is different [17]. At the initial stage, the weak liquefaction results in ship rolling in small angles. Once the superposition of the ship is disturbed by the wind and waves, the rolling is intensified, which can lead to the loss of stability and thus, ship capsizing [32].
The effects of the above-mentioned causes are not short-term but continuous and real-time during the whole maritime transport process. The actual moisture content (MC) and the extent of the subsequent liquefaction of cargo are affected to varying degrees in various stages such as storage at the yard, the loading stage, and the maritime transport process. Liquefaction in bulk cargo is very dangerous since the probability of the ship capsizing is very high [8]. In order to understand the impact of cargo liquefaction on the stability of the ship, Koromila [33] carried out many experiments and Zou [34] simulated the capsizing case by numerical methods. Ju [27] predicted the liquefaction of cargo and its effect on the stability of the ship by analyzing the time domain characteristics based on different amplitudes and frequencies of the ship and the initial saturation of the cargo.
In the above research, the risk measurement for ships transporting CPL was solved under relatively discrete and independent conditions. Many of the research focuses on the safety technology and risk assessment of cargo operation and ship navigation in the maritime regulations and practices, the amendment of which concerning the loading and stowage of cargos in bulk come into force these years. However, the knowledge on the behavior of liquefied cargo and its impact on ship safety is still limited [35]. There is a lack of the systematic quantitative expression of the cargo-ship interface effect and the status of the ship and cargo in the maritime environment.
Studies on the sequential correlation of risk status in the transportation process need to be strengthened. Due to the complex mechanism of risk during the ship’s operation and transportation, Hu [36] introduced an artificial intelligence cloud model to study the multi-factor coupling risk for marine traffic system, the influence degree and the effect mechanism from the risk factors of humans, ships and the environment was found. Based on Markov steady-state characteristics of the transfer of pilotage state, Hu [37] used the Markov Chain Monte Carlo algorithm to reveal the risk evolution law during the navigation process under the pilotage condition. Based on the Markov Chain Monte Carlo algorithm, Hu [38] researched the process risk on the ship navigation at Arctic seas by cloud simulation, which focuses on the risk of the natural environment in the Arctic ice waterway. With a view to revealing the influence of the liquefiable cargoes, Wu [39] estimated the pre- and post- stage risks during the whole voyage of the carrier.
Based on the analysis of loading and the voyage plan of the ship transportation process, this paper established the transfer mode of the ship over space from the berth to the ocean, including the harbor basin, entrance channels and coastal waters. Meanwhile, the transfer mode on time was built from loading, unberthing, departure and ringing off the engine. The dynamic risk simulation model of the ship transportation system was presented in combination with the status transfer matrix and the MCC simulation method. The purpose is much more than bringing the attention of the master and crew with responsibilities for the loading and carriage of fine bauxite. The law of relevance between the ship’s position and risk due to bauxite liquefaction during the transportation process was revealed in the paper, which is helpful for seafarers to design a voyage route in lower risk seas, controlling the ship’s posture [33,40] in response to the risk of the liquefaction of cargo. In addition, it helps to make the decision for abandoning ship accurately and timely, dispose reasonably and dispatch powerful onshore and maritime search and rescue resources to reduce deaths.

3. Methods

3.1. Transportation Risk Assessment

Under the logical concept of the time series, the term process expresses the development of things by status and phase. The transportation process refers to the status transition of the ship in time and space under human intervention according to the voyage plan. The whole transportation process can be divided into three phases including prophase (loading, unberthing and navigation in coastal waters), metaphase (ocean navigation stage) and anaphase (approaching the harbor, berthing and unloading). In this study, the prophase of the transportation process was studied as an example. The continuous influence from cargo risk status on the carrier during the whole voyage may be revealed. The process of status transition is a continuous sequence which can be classified into multiple stages with each stage being composed of numerous instantaneous or real-time states. In order to represent the ship transportation process, random information acquisition is conducted at multiple stages to form a dynamic chain of risk.
Modeling the transportation process mathematically, the relationship of risk status during two adjacent stages can be expressed as
R t = R t 1 · P
where R t is the risk status value matrix of the stage at time t; R t 1 is the risk status value matrix of the stage at time t − 1; t = 1, …, T, T is quantity of stages of the ship’s transportation. R 0 is the risk status value matrix of the ship’s transportation at an initial time; P is the probability matrix of the risk status transition of ij under the ship time series which is
P = [ p 11 p 1 i p 1 j p 1 N p i 1 p i i p i j p i N p j 1 p j i p j j p j N p N 1 p N i p N j p N N ]
where i = 1, …, N, j = 1, …, N; N is the quantity of risk status of the ship’s transportation.

3.2. Markov Chain

The Markov chain describes a status sequence x 1 t x 2 t x n t whose status value depends on the prior status distribution at the time t. If the conditional probability distribution of x n t + 1 is a function of the past status x n t , then there is
P ( x n + 1 t = x | x 1 t = x 1 , x 2 t = x 2 , , x n t = x n ) = P ( x n t = x | x n t = x n )
There are three determinative indicators of the Markov chain: the discreteness of the time series (a number of non-continuous phases), the randomness of the sequence (state transition of the adjacent phase is random, which meets probability distribution), and the Markov Property of sequence (state transition probability is only related to the current state, but not to the previous). When applying the Markov process, the three indicators must be determined, especially the Markov property.
As for the discrete variable sequence D y (y = 1, 2, …, z is data source sequence), the risk status distribution of the transportation process acquired at different sampling times is x 1 i x 2 i x t i , where x t i stands for the risk value of i at time t. The transfer frequency from the risk status i at time t to the risk status j at the next time t + 1 is recorded by f t , t + 1 i , j , and the sum of the transfer frequency from i to j is f i j = t = 1 f t , t + 1 i , j . Therefore, the transfer frequency matrix of the y sequence can be presented as
f y = [ f y 1 , 1 f y 1 , 2 f y 1 , 5 f y 2 , 1 f y 2 , 2 f y 2 , 5 f y 5 , 1 f y 5 , 2 f y 5 , 5 ]
The entire risk status transfer frequency matrix covering all data source sequences is
F 5 × 5 = [ f y ] = [ y = 1 z f y 1 , 1 y = 1 z f 12 1 , 2 y = 1 z f y 1 , 5 y = 1 z f y 2 , 1 y = 1 z f y 2 , 2 y = 1 z f y 2 , 5 y = 1 z f y 5 , 1 y = 1 z f y 5 , 2 y = 1 z f y 5 , 5 ]
where p i , j = f i , j / j = 1 5 f i , j is the status transfer probability.
The marginal transfer probability is
p , j = i 5 f i , j / i = 1 5 j = 1 5 f i , j
The judgment mechanism of the chi-square test is established to deal with sampling data:
χ 2 = 2 i = 1 5 j = 1 5 f i , j | ln p i , j i = 1 5 p , j |
where i = 1, …, 5, j = 1, …, 5.
The threshold value χ α 2 will be found at the significance level α and freedom degree by looking up a chi-square distribution table [41]. If χ 2 > χ α , ( n 1 ) 2 2 is satisfied, the Markov Chain method is suitable to study risk during the bauxite transportation process at sea.

3.3. Cloud Model

As properties of risk, possibility and consequence are both uncertain and partially qualitative information with fuzziness and randomness. In addition, there is a limitation of data availability as maritime risk data are either sparse or missing. In responding to this problem, the Bayesian network was introduced into the maritime risk analysis [42,43]. In order to prevent accidents and ensure safety at Arctic waters, an object-oriented Bayesian network model was built to solve the high degree of uncertainty in the performance of vessel operating systems and humans [44]. For the focus on sample requirements on the dataset of small-sample events, the B spline least square method was combined with the BP neural network [45] to increase the number of samples. The Monte Carlo method was applied with complex empirical and statistical methods in accident probability assessment [46]. Due to the risk events with a small number of discrete samples, the cloud model can be applied to transform qualitative and quantitative information in order to express the quantification of risk [47].
Risks are represented by the corresponding units of measurement. The risk is defined as the combination of the possibility of accidents and the severity of consequences. Risk assessment functions are formulated to quantify the risk value of the sample, which is divided into five grades: ‘very low’, ‘low’, ‘medium’, ‘high’ and ‘very high’. Moreover, a large number of cloud clusters with uncertain information can be generated by the cloud generator [48] based on the cloud simulation of the sample information, and then a multi-source risk database is constructed.
A cloud model is expressed by C l o u d ( E x , E n , H e ) . Here, Ex (Expectation) is the core of all cloud-drops in the number field, reflecting the best projection of the qualitative concept in the number field. En (Entropy) is the variable that expresses the qualitative concept as well as others, reflecting the extent of the linguistic values accepted in the number field, which is fuzziness. It also reflects the probability of the linguistic value represented in the number field. He (Hyper) is the dispersion degree of entropy, standing for the cohesiveness of each value representing the certainty of linguistic values and reflecting the degree of condensation of cloud-drops.
Based on the five grades of risk, which are assigned an internal value between 0 and 5, each grade of risk is expressed by Ex, En and He, respectively, in Table 1.
Visualization of risk grade can be expressed by the cloud model with membership and risk value as in Figure 1.
The mathematical principle of the cloud model is the information conversion mechanism of E x , E n , H e , establishing the mapping between qualitative and quantitative information based on the function generator of E x , E n , H e and associating fuzziness with randomness.

3.4. Markov Chain Cloud Simulation

Sample data related to risk were collected and the original cloud was established. Based on the analysis of uncertain information of the original cloud and establishment of the inverse cloud generator, the normal cloud model was constructed. C l o u d ( E x , E n , H e ) of the sample information was obtained.
N cloud-drops were generated by the cloud-drop generator and the reduction cloud was obtained. The recovery cloud data were examined by adjusting the characteristic parameters of the original cloud of random events. Finally, the effective characteristic parameters and the recovery cloud were established. N cloud-drop was selected as a random event simulation value and then the simulation was carried out under the random state. Based on the simulation process by M times, M × N random samples were generated. All the obtained simulation data were filtered by the interval of risk value, followed by the generation of the final effective sample group of simulation.
The effective sample group was counted by M times in order to find the curve of risk distribution. Then, the risk status distribution sequence with N status was produced to simulate K sampling sites by the same cloud model. In the following, a K × M × N multi-dimensional data sequence was obtained. Changes in the N status distribution were counted after the compare sequence and neighboring sampling sites; the status transition matrix of the step t−1 was expressed as follows:
P t 1 t = [ p 11 p 12 p 1 N p 21 p 22 p 2 N p N 1 p N 2 p N N ] ,
where t = 2 , 3 , , K .
The status transition matrix was reprocessed. Particularly, if the frequency of the status i at the sampling t − 1 is 0, as an inevitable event, the occurrence frequency of the status i at the next sampling point t must be 0. Therefore, the corresponding probability of the status transition is 1 and the probability of transferring to other states must be 0. Then, the final matrix of the status transition is as follows:
P t 1 t = [ 1 p 1 i p 1 N 1 p i 1 1 p i N 1 p N 1 p N i 1 ]
where i = 1 , 2 , , N , t = 2 , 3 , , K .

4. Results

4.1. Data Collection

The data were collected from the nautical logbook of MV Y.M., a 48,000-ton Handy bulk carrier that carried bauxite from Kuantan Port, Malaysia to Yantai Port, Shandong Province, China on 28 July 2015. That voyage was the same as that taken by MV Bulk Jupiter eight months ago. MV Y.M. berthed at Kuantan port on 25 July and loaded bauxite for 76.5 h. During the loading period, there were several stoppages due to the trimming of cargo and waiting for the tide and shifting berth. The ship’s draught and static posture were observed regularly. The weather was good during loading and during the whole voyage.
The risk conditions at different sampling sites during the whole process between loading and navigating with the rung of the engine was obtained by questionnaire investigation and interviews with Captains and Chief Officers of MV Y.M. where the author has serviced as a crew member. Based on the risk quantification of prophase of the transportation process of bauxite carriers between the port and the coastal waters, the sampling risk value matrix in the transportation process was formed as shown in Table 2.

4.2. Markov Property Judgment

The threshold value is χ α 2 = 26.296 when the significance level is 0.05 and the freedom degree is 16 according to the chi-square distribution table. Meanwhile, χ 2 = 63.2546 when we ran the judgment mechanism of the Markov property. Obviously, χ 2 > χ α 2 , which meets the judgment mechanism. Therefore, it can be concluded that the risk transfer process of the ship carrying bauxite is a Markov process.

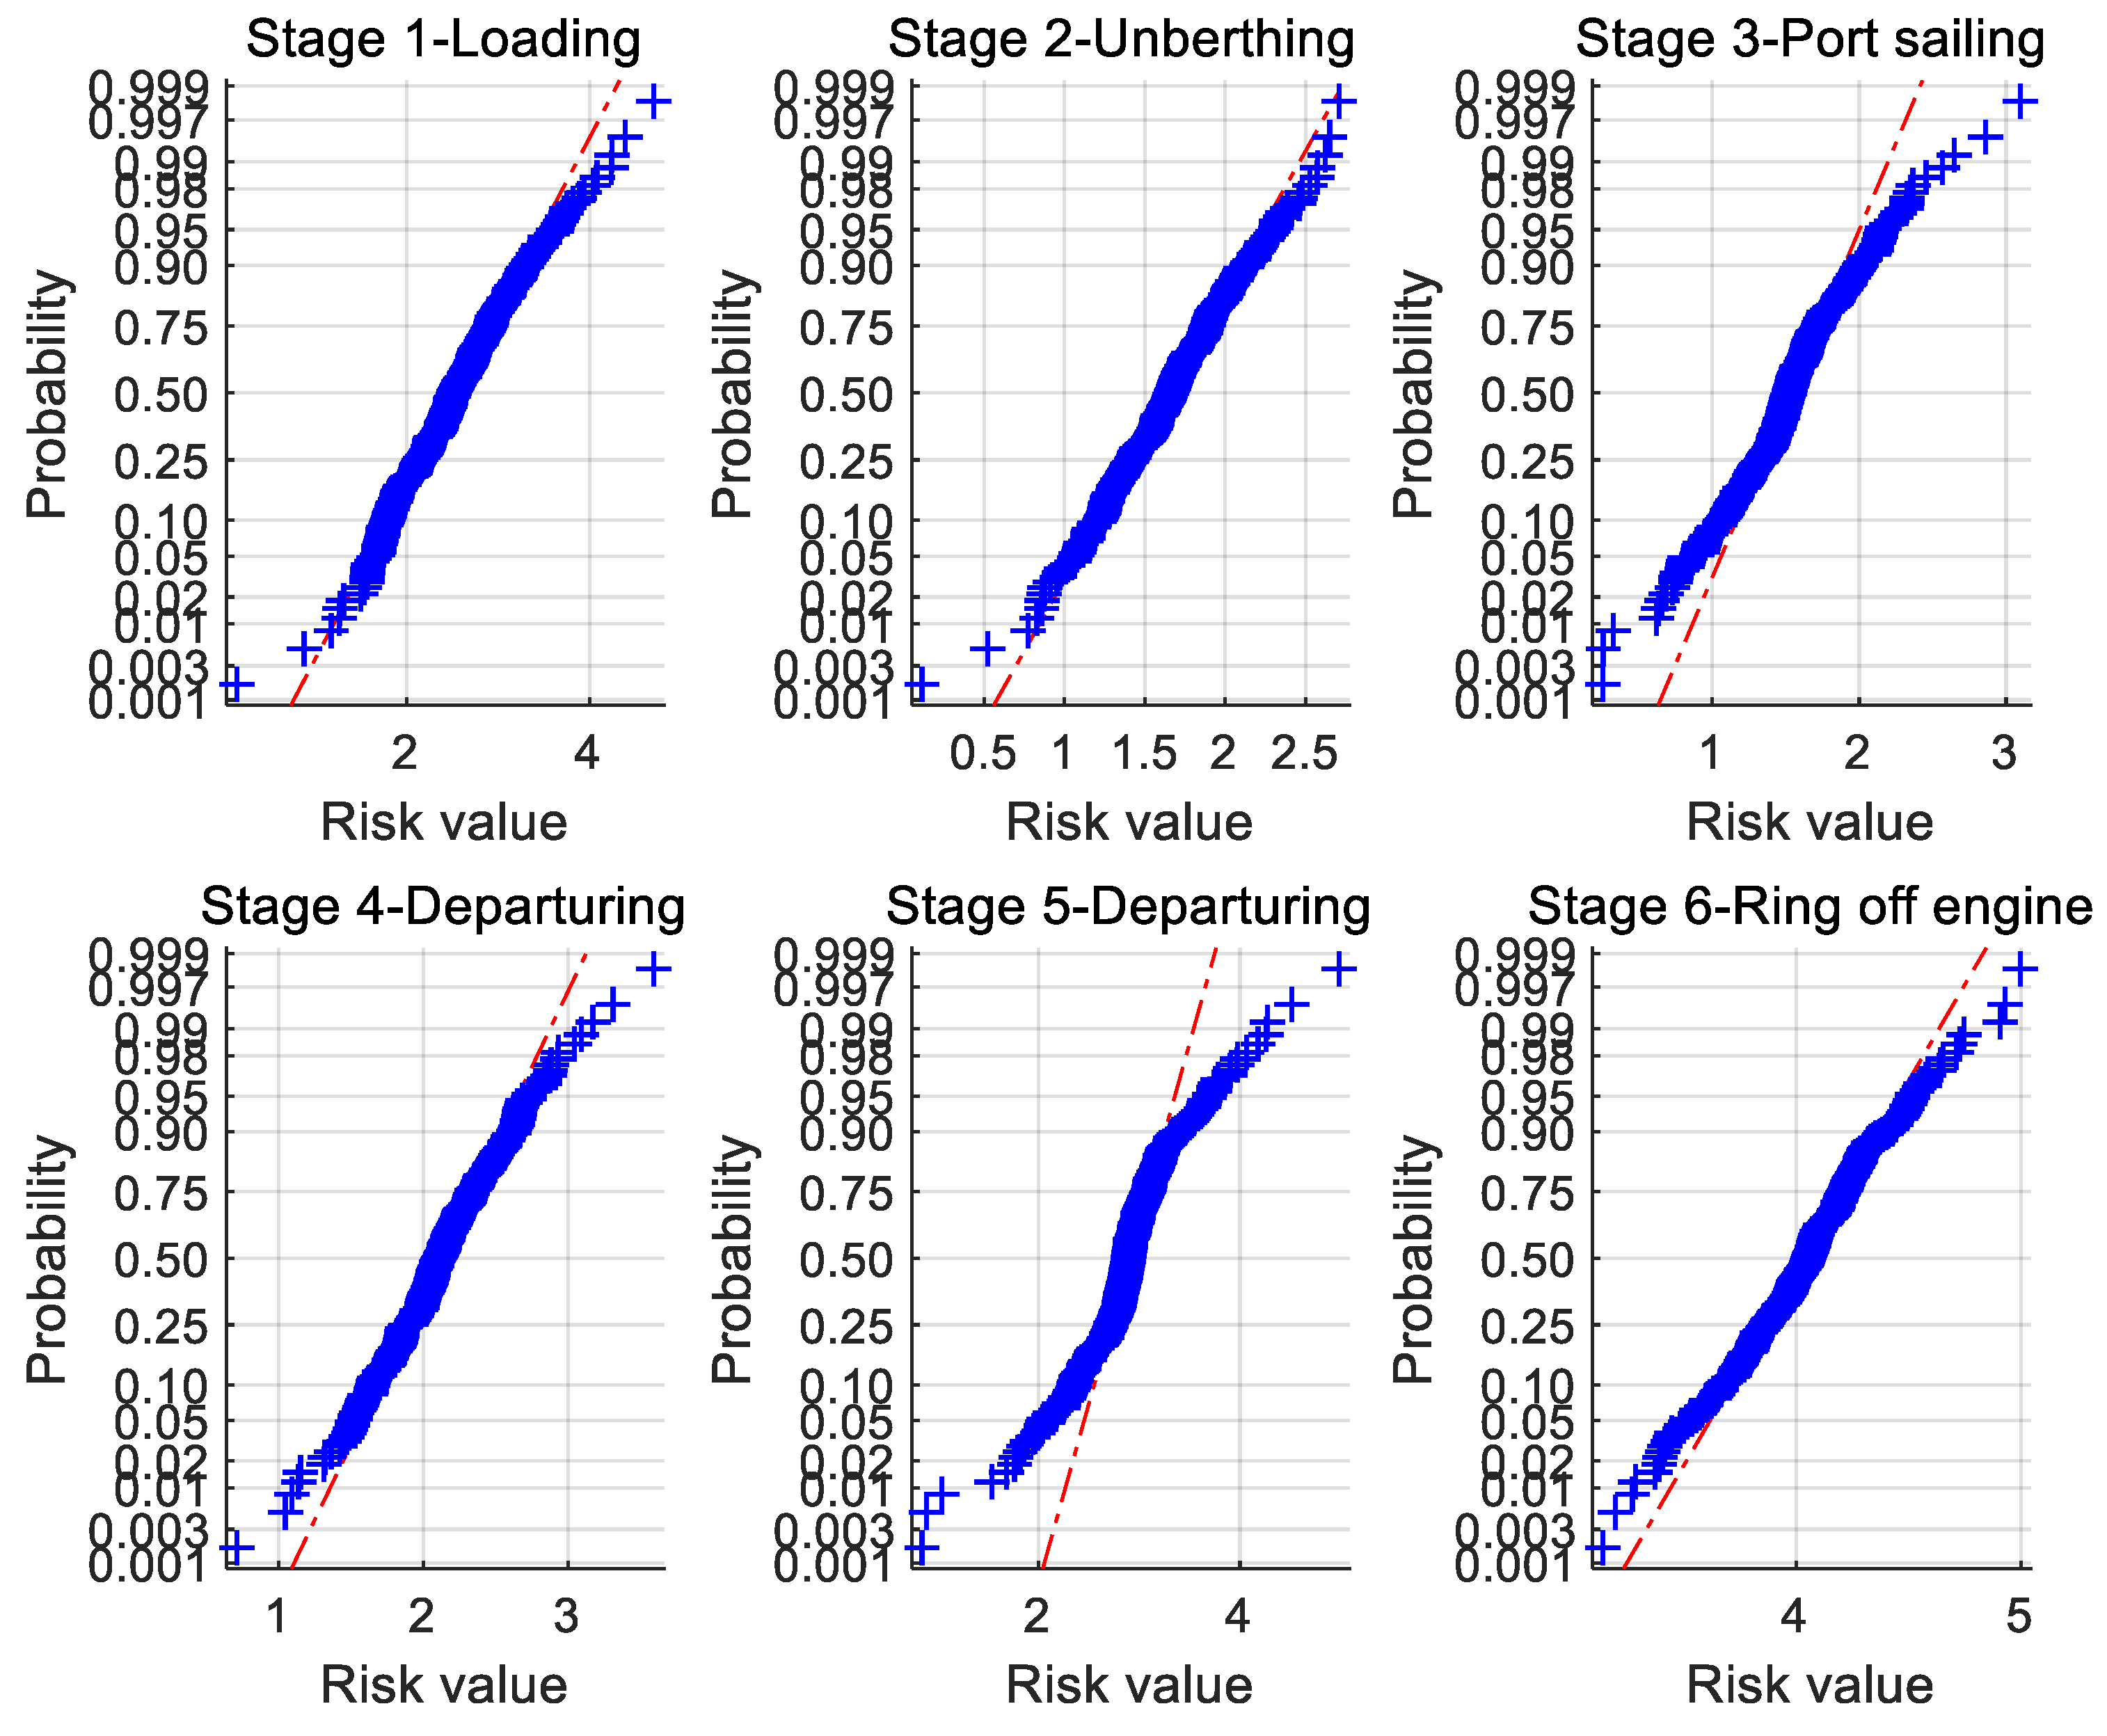
4.3. Cloud Simulation

(1) Calculation of the Cloud parameter
The cloud parameters of each sampling sequence risk value are shown in Table 3:
(2) Cloud simulation
After 500 cloud simulations, the multi-source group sample data at six sampling sites are obtained. Figure 2 presents the risk simulation cloud during the prophase of the transportation process.
After eight groups of sampling data were applied to the cloud model which was simulated 500 times, the multi-source group sampling data of the six sampling sites are obtained. The risk simulation cloud for the six sampling sites was shown in Figure 2. In the figure, the green cloud drops stand for the 500 simulated risks in the Harbor basin, while blue stands for those in the Wharf apron, black for the Inner channel, yellow for the Wharf, pink for the Outer channel and red for the Coastal sea.
(3) Distribution of the risk status
In the 500 simulations based on the cloud model, the value of the risk simulation produced by the cloud-generator complies with the normal distribution law, where some random number will be outside of the interval of 0 and 5 points. Therefore, after eliminating the invalid values of risk, the distribution of risk status of the top 300 was counted in the histogram.
Figure 3 is the statistics of the risk frequency of each stage according to the five grades of risk. The sample values may obey the law of approximate normal distribution from the former figure.
Figure 4 shows the normal probability of the risk value of stages. Due to sample values of risk, the value is distributed near a straight line, the risk values are in line with the normal distribution. Moreover, based on the application of the t-test method on the six group samples, the parameter was obtained so that h (a Boolean variable) is 0 and sig (Significance) is larger than 0.5, therefore, the risk value distribution of stages comply with the normal distribution.
In the first stage of transportation, the risk status is at medium risk with a risk expectation of 2.5375; the second stage is at a low risk with a risk value of 1.6750; the third stage is also at a low risk with 1.5250; the fourth and fifth stages are in medium risk with 2.1000 and 2.9125, respectively; and the sixth stage is of very high risk, with a value of 4.0500.

4.4. Status Transfer of Process Risk

The risk transfer status was depicted through the transition probability. The probability matrix of the first step of the transition is obtained as follows: P 1 = [ 0 0 0.5000 0.5000 0 0 0 0.1695 0.7458 0.0847 0 0 0.1302 0.8333 0.0365 0 0 0.1860 0.7907 0.0052 0 0 0 0.7500 0.2500 ] .
Similarly, the matrices of the following steps are P2, P3, P4 and P5, respectively.
P 2 = [ 1 0 0 0 0 0 1 0 0 0 0 0 0.0227 0.8864 0.0909 0 0 0.0826 0.8388 0.4318 0 0 0.0714 0.7857 0.1429 ] ,   P 3 = [ 1 0 0 0 0 0 1 0 0 0 0 0.0455 0.5909 0.3636 0 0.0040 0.0040 0.6640 0.3281 0 0 0 0.5600 0.4400 0 ] ,  
P 4 = [ 1 0 0 0 0 0 0 1.0000 0 0 0 0.5000 0.5000 0 0 0.0410 0.2821 0.6410 0.0308 0.0051 0.0294 0.3137 0.6275 0.0294 0 ] ,   P 5 = [ 0.0426 0.0160 0 0 0 0.2512 0.1659 0 0 0 0.5812 0.4188 0 0 0 0.4444 0.5556 0 0 0 1.0000 0 0 0 0 ] .

5. Analysis and Discussion

5.1. Tendency of Risk

Based on the cloud simulation, the risk status of the six sampling sites were found, as well as the risk value, of which the minimum and maximum formed a boundary of the risk zone. The risk expectation of the sampling sites in different stages represented the tendency of the development of risk during the transportation process in the style of a fitted curve.
Figure 5 demonstrates the risk tendency during the prophase of the transportation process by applying the simulation risk group sample. The outcome shows that the overall risk during the prophase of the transportation process of a bauxite carrier is in line with the “spoon curve”. After departure from the wharf, the risk of the transportation of bauxite is lower than the beginning stages and the following stages.

5.2. Characteristics of Process Risk

To further explain the tendency of risk during the transportation process, a space-time expression was developed (Figure 6) based on the results of the simulation and systematic logic analysis.
In Figure 6, the Y-axis represents the risk value, the lower X-axis represents the change of the ship’s position, and the upper X-axis represents the change of the transportation process. The background color of the spatial and temporal expression figure of the risk from light green to blue indicates that the ship is navigating away from the wharf to deeper water. The wide arrow indicates that the trend of the risk factors affecting the ship. The circle chart shows the influence of the main risk factors on the ship’s safety during the transportation process. The number of risk factors is increasing and the influence is increasing. The red arrow indicates the overall change trend of the risk values in the transportation process.
Based on the figure of spatial and temporal expression, some characteristics of the process risk were found in the following.
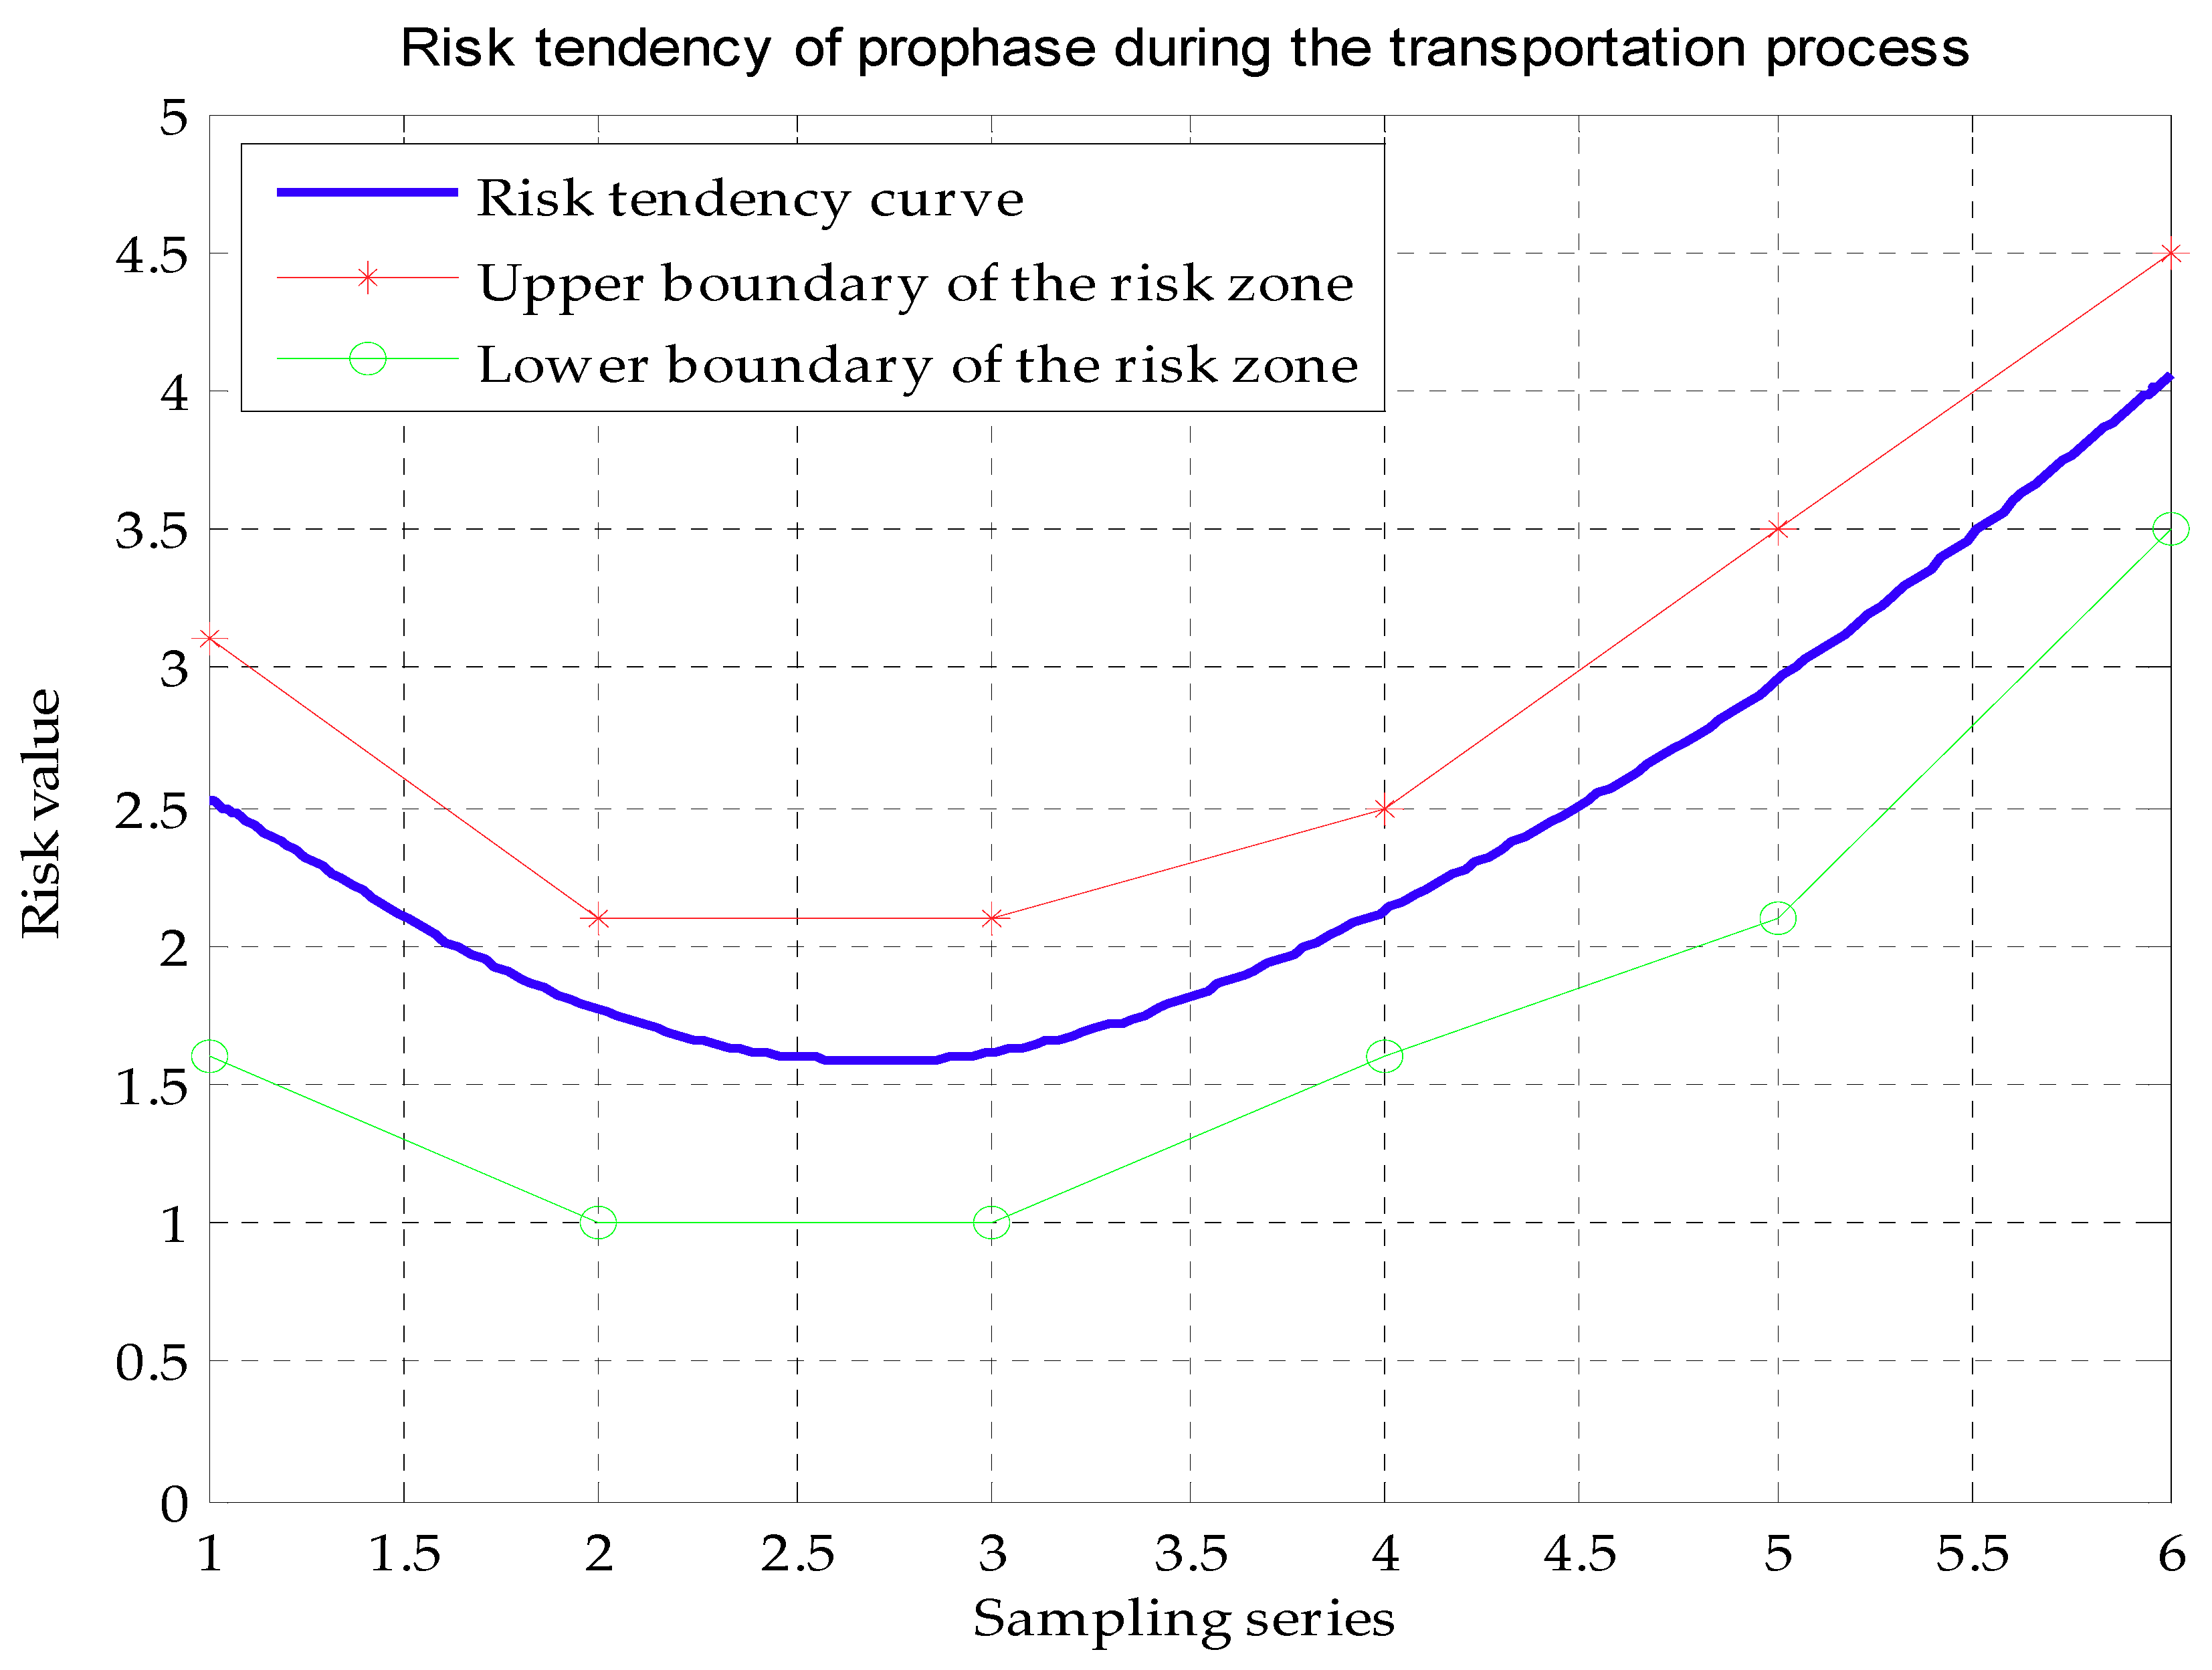
  • The initial moisture content of the cargo, the conformity of the stowage plan, the weather condition during the cargo loading process, the safety status of the ship, the competence and preparation of the seafarers contribute to the initial risks of the whole transportation process. As a result, the loading stage of the bauxite transportation is at a relatively higher risk status. The special property of the bauxite determines the basic value for the overall risk of the carrier, which is consistent with the practice of shipping. According to the interviews and questionnaires, some risks are hidden in the stages of pre-loading and loading. A total of 65% of seafarers put more emphasis on the inspection of the suitability of the ship prior to loading. A total of 47% of seafarers stated that there is a certain amount of false information provided by shippers prior to loading. A total of 50% of seafarers said that the ship detected water content occasionally in accordance with the IMSBC code. A total of 47% of the seafarers thought good cooperation and communication was lacking between the ship and shore during the process of loading and unloading the bauxite.
  • Once loading is completed, the engine trial and the irregular rotation of propeller lead to the vibration of the whole ship, which has negative effects on the status of the bauxite and results in the formation of volatility risk. During unberthing, the risk imposed on the carrier has due to the great fluctuation. The overall risk was low due to the assistance of tugboats and the pilot on board at the wharf apron and harbor waters. However, because of the frequent change of the course and speed, the external interference on the bauxite carrier fluctuates. Therefore, the risk of this phrase is referred to as volatility risk.
  • After passing the approach channel offshore, the bauxite carrier encounters a greater disturbance from the complexity of the navigation environment, due to such things as the wind, current and waves [49]. Due to great hull vibrations and wave swings of the ship in the coastal sea, a huge influence on the liquefaction characteristics of bauxite occurred. The risk of the transverse inclination was aggravated on the basis of the small angle heel produced by cargo shifts and compaction. That is the derivative risk in the ocean navigation stage during the transportation process. The risk status in the stages of departure and sea-voyages gradually increase.
  • As the bauxite carrier sails farther away from the land and the risk of bauxite liquefaction greatly increases, this is referred to as the derivative risk of the transportation process.

5.3. Discussion

Limited to only six sampling sites, the sampling time-space of this study did not have high coverage of the typical water. As a result, the status transition of the process risk was not obvious. Data should be selected to meet the randomness of the Markov process, which represents the risk status at different phases. Therefore, data sampling must be specified in different phases. The evolution of the result processing system has a huge difference from the traditional Markov method. The final risks of the Markov method have great fluctuations in the early stage and good stability in the later stage. However, when the Markov process method is based on a short-time sequence, the status transition matrix maintains continuous changes. For the long-time sequence, that is, when ships sail in the open seas, the risk status tends to be stable. When the normal process is disturbed by more intense interference factors, the risk degree rises abruptly to reach “peak” risk, which causes risk events and/or accidents. The characteristics of process risk are consistent with the practical experience in the maritime transport of solid bulk cargo. It is generally believed that the dangerous period for the cargo is within 8–16 h after departure and the high probable time for liquefaction is within 3–5 days at sea [50]. For example, liquefaction happens onboard the MV Orchid Island on the fifth day after departing from the loading port [51]. Compared with the full development of liquefaction, the time from a large angle roll to capsizing is very short. From the initial roll to sinking, the time ranges from about 20 mins to several h [51]. Just like the accident of MV Harita Bauxite, the ship rolled regularly and then began to incline three degrees portside. After 40 mins, the alarm was triggered. About 10 mins later, the ship capsized. The “Bulk Jupiter” accident was also caused by an atypical roll of the ship due to the change of the cargo’s behavior, which led to an irreversible inclination and rapid capsizing without warning.

6. Conclusions

The cloud model simulation method based on the Markov chain can produce a large sample. Compared with the description of finite data based on sampling, the Markov process of the statistical rules of the big data can produce a more macroscopic law of evolution. The risk value based on this model is slightly larger than that obtained by the single Markov method. Therefore, an earlier warning and longer emergency response time for the related decision making is conducive to the safety of bauxite transportation and maritime safety supervision. The process risk of bauxite transportation is non-constant and time-variant, which varies with time and space. The risk of the transportation prophase presents the tendency of the “Spoon curve”. The method of granular thinking will be introduced into the risk simulation of bauxite transportation in the next research, laying the foundation for dynamic risk monitoring, short-term risk prediction and real-time risk forecasting during the whole transportation process.

Author Contributions

Conceptualization, S.H. and Y.J.; methodology, S.H.; investigation, visualization and writing, J.W.; funding acquisition, S.F.; supervision, Y.J. and J.F.; review, Y.J., S.H., J.F. and S.F.; proofreading, J.F. and S.F.

Funding

This work was supported by the National Science Foundation of China (NSFC) under grant No. 51709168.

Conflicts of Interest

The authors declare no conflict of interest.

References

  1. China’s Imported Bauxite Was 82.62 Million Tons in 2018. Available online: http://www.mofcom.gov.cn/article/i/jyjl/k/201902/20190202834585.shtml (accessed on 15 February 2019).
  2. Munro, M.C.; Mohajerani, A. Liquefaction incidents of mineral cargoes on board bulk carriers. Adv. Mater. Sci. Eng. 2016, 2016, 5219474. [Google Scholar] [CrossRef]
  3. International Association of Dry Cargo Shipowners. Bulk Carrier Casualty Report (Years 2008 to 2017 and the Trends). Available online: https://www.intercargo.org/bulk-carrier-casualty-report-2017/ (accessed on 3 May 2018).
  4. International Association of Dry Cargo Shipowners. Media Release, 31 January 2019.
  5. Insurance Companies Appeal Shipowners to Pay Attention to Bauxite Transportation. Available online: http://www.eworldship.com/html/2015/ ship_finance_0109/97262.html (accessed on 9 January 2015).
  6. IMO: Bauxite Liquefaction Sank Bulk Jupiter. Available online: https://worldmaritimenews.com/archives/172059/imo-bauxite-liquefaction-sank-bulk-jupiter/ (accessed on 21 September 2015).
  7. Munro, M.C.; Mohajerani, A. Moisture content limits of iron ore fines to prevent liquefaction during transport: Review and experimental study. Int. J. Mineral Process. 2016, 148, 137–146. [Google Scholar] [CrossRef]
  8. Muzamir, H.; Siti, H.A.; Wan, N.W.J. Basic properties of Gebeng bauxite in accordance to IMSBC Code. Indian J. Sci. Technol. 2017, 10, 1–5. [Google Scholar] [CrossRef]
  9. Rahman, M.; Mal, B.; Lo, S.R. Prediction of undrained monotonic and cyclic liquefaction behavior of sand with fines based on the equivalent granular state parameter. Int. J. Geomech. 2014, 14, 254–266. [Google Scholar] [CrossRef]
  10. Wu, A.X.; Sun, Y.Z. Granular Dynamic Theory and Its Applications; Metallurgical Industry Press: Beijing, China; Springer: Berlin/Heidelberg, Germany, 2008. [Google Scholar]
  11. Buchanan, S.J.; So, H.B.; Kopittke, P.M.; Menzies, N.W. Influence of texture in bauxite residues on void ratio, water holding characteristics, and penetration resistance. Geoderma 2010, 158, 421–426. [Google Scholar] [CrossRef]
  12. Wang, H.L.; Koseki, J.; Sato, T.; Chiaro, G.; Tian, J.T. Effect of saturation on liquefaction resistance of iron ore fines and two sandy soils. Soils Found. 2016, 56, 732–744. [Google Scholar] [CrossRef]
  13. Gandhi, R.L.; Norwood, J.; Che, Y.G. Cross-Country Bauxite Slurry Transportation. Essential Readings in Light Metals: Alumina and Bauxite; Springer: Cham, Switzerland, 2016; Volume 1, pp. 70–71. [Google Scholar]
  14. IMO. MSC 85/26/Add.2 ANNEX 3. International Maritime Solid Bulk Cargoes (IMSBC) Code; International Maritime Organization: London, UK, 2008. [Google Scholar]
  15. Cai, W.S.; Gao, J.Y.; Zhang, F.J.; Jin, Y.L. Coupling effects between sloshing of liquefied nickel ore and ship motion. Navig. China 2014, 3, 54–58. [Google Scholar]
  16. Portella, R.B.; Andrade, L.F.; Neto, T.G.; Coelho, N. Single-pour/single pass loading an innovative concept for a new generation of ore carriers. In Proceedings of the 30th International Conference on Offshore Mechanics and Arctic Engineering, Rotterdam, The Netherlands, 19–24 June 2011. [Google Scholar]
  17. Lamba, D.; Barsan, E.; Varsami, C.; Arsenie, A. Simulations performed on a bulk carrier in order to analyze the ship’s stability. Green Mar. Technol. 2015, 717–724. [Google Scholar] [CrossRef]
  18. Ding, J.H.; Jin, Y.L.; Wang, H. ALE-based parallel numerical simulation for sloshing problem of liquefied ore fines cargo. J. Ship Mech. 2015, 19, 927–933. [Google Scholar]
  19. Spandonidis, C.C. Modelling and Numerical/Experimental Investigation of Granular Cargo Shift in Maritime Transportation. Ph.D. Thesis, National Technical University of Athens, Athens, Greece, 2016. [Google Scholar]
  20. Hull Department and Research Institute. ClassNK’s Approach to Safe Carriage of Nickel Ore; ClassNK TECHNICAL BULLETIN: Tokyo, Japan, 2012; pp. 33–37. [Google Scholar]
  21. Rose, T.P. Solid Bulk Shipping: Cargo Shift, Liquefaction and the Transportable Moisture Limit. Master’s Thesis, University of Oxford, Oxford, UK, 2014. [Google Scholar]
  22. Wang, H. Effects of Ship Motion on the Transportable Moisture Limit Determination for the Liquefied Cargoes. Master’s Thesis, Dalian Maritime University, Dalian, China, 2015. [Google Scholar]
  23. Ding, S. Numerical study on vibration characteristics of a cargo ship. Ship Sci. Technol. 2017, 39, 19–21. [Google Scholar]
  24. Munro, M.C.; Mohajerani, A. Variation of the geotechnical properties of Iron Ore Fines under cyclic loading. Ocean Eng. 2016, 126, 411–431. [Google Scholar] [CrossRef]
  25. Drzewieniecka, B. Safety aspect of handling and carriage of solid bulk cargoes by sea. Sci. J. Marit. Univ. Szczec. 2014, 39, 63–66. [Google Scholar]
  26. Holmes, R.; Williams, K.; Honeyands, T.; Orense, R.; Roberts, A.; Pender, M.; McCallum, D.; Krull, T. Bulk commodity characterisation for transportable moisture limit determination. In Proceedings of the International Mineral Processing Congress, Québec City, QC, Canada, 11–15 September 2016. [Google Scholar]
  27. Ju, L.; Vassalos, D.; Boulougouris, E. Numerical assessment of cargo liquefaction potential. Ocean Eng. 2016, 120, 383–388. [Google Scholar] [CrossRef] [Green Version]
  28. Shi, D.D.; Wang, F. Discrete element simulation on seismic liquefaction of saturated free-field sand deposits. J. Shanghai Marit. Univ. 2017, 38, 96–102. [Google Scholar]
  29. Wang, Y.G.; Tan, J.H. Research progress on ship stability and capsizing in random waves. J. Ship Mech. 2010, 14, 191–201. [Google Scholar]
  30. Zhang, J.W.; Wu, W.Q.; Hu, J.Q. Quantitative study on safety degree of ship capsizing in stochastic waves. J. Dalian Marit. Univ. 2016, 42, 28–34. [Google Scholar]
  31. Zhong, Z.Y. The effect of ship’s rolling on the movement of cargo in hatch. J. Ningbo Univ. 1997, 10, 110–113. [Google Scholar]
  32. Zhao, Y.L.; Meng, S.X. Safety transportation of easily fluidized cargoes. J. Dalian Marit. Univ. 2012, 38, 15–18. [Google Scholar]
  33. Koromila, I.A.; Spandonidis, C.C.; Spyrou, K.J. Experimental investigation of cargo liquefaction and impact on the stability of a bulk-carrier. In Proceedings of the 13th International Ship Stability Workshop, Brest Brittany, France, 23–26 September 2013. [Google Scholar]
  34. Zou, Y.J.; Shen, C.; Xi, X.Y. Numerical Simulations on the Capsizing of Bulk Carriers with Nickel Ores. J. Navig. 2013, 66, 919–930. [Google Scholar] [CrossRef] [Green Version]
  35. Andrei, C.; Pazara, R.H. The impact of bulk cargoes liquefaction on ship’s intact stability. UPB Sci. Bull. 2013, 75, 12–16. [Google Scholar]
  36. Hu, S.P.; Li, F.M.; Xi, Y.T.; Wu, J.J. Novel simulation on Coupling Mechanism of Risk Formation Segments for Marine Traffic System. J. Basic Sci. Eng. 2015, 23, 409–419. [Google Scholar]
  37. Hu, S.P.; Huang, C.H.; Deng, H.; Huang, D.Z. Markov chain model for the dynamic simulation of process risk in ship pilotage at harbor. J. Harbin Eng. Univ. 2017, 38, 1391–1398. [Google Scholar]
  38. Hu, S.P.; Xuan, S.Y.; Liu, Y.; Fu, S.S.; Xi, Y.T. Dynamic simulation of process risk on ship navigation at the arctic northeast route. Chin. J. Polar Res. 2019, 31, 84–93. [Google Scholar]
  39. Wu, J.J.; Liu, Y.X.; Hu, S.P.; Zhao, Y.H. Hidden Markov model for risk estimation of ship carrying liquefiable cargoes. China Saf. Sci. J. 2017, 21, 73–78. [Google Scholar]
  40. Barrass, C.B.; Derrett, D.R. Simplified Stability Information. In Ship Stability for Masters and Mates, 7th ed.; Butterworth-Heinemann Elsevier Ltd.: Oxford, UK, 2012; pp. 441–446. [Google Scholar]
  41. Xie, D.W.; Shi, S.L. Mine water inrush prediction based on cloud model theory and Markov model. J. Cent. South Univ. Sci. Technol. 2012, 43, 2308–2315. [Google Scholar]
  42. Hu, S.P.; Li, X.D.; Fang, Q.G.; Yang, Z.L. Use of Bayesian method for assessing vessel traffic risks at sea. Int. J. Inf. Technol. Decis. Mak. 2008, 7, 627–638. [Google Scholar] [CrossRef]
  43. Li, K.X.; Yin, J.B.; Bang, H.S.; Yang, Z.L. Bayesian network with quantitative input for maritime risk analysis. Transp. A Transp. Sci. 2014, 10, 89–118. [Google Scholar] [CrossRef]
  44. Khan, B.; Khan, F.; Veitch, B.; Yang, M. An operational risk analysis tool to analyze marine transportation in Arctic waters. Reliab. Eng. Syst. Saf. 2018, 169, 485–502. [Google Scholar] [CrossRef]
  45. Zhang, X. Study on ship oil-spill risk assessment based on small samples. Ship Eng. 2009, 31, 76–80. [Google Scholar]
  46. Gucma, L.; Smalko, Z. Selected problems and methods of navigational risk assessment. In Proceedings of the 12th International Congress of the International Maritime Association of the Mediterranean, Lisboa, Portugal, 26–30 September 2005. [Google Scholar]
  47. Hermanns, H.; Katoen, J.; Meyer-Kayser, J.; Siegle, M. A markov chain model checker. Lect. Notes Comput. Sci. 2000, 1785, 347–362. [Google Scholar]
  48. Li, D.Y.; Meng, H.J.; Shi, X.M. Membership clouds and membership cloud generators. J. Comput. Res. Dev. 1995, 32, 15–20. [Google Scholar]
  49. Pak, J.Y.; Yeo, G.T.; Oh, S.W.; Yang, Z.L. Port safety evaluation from a captain’s perspective: The Korean experience. Saf. Sci. 2015, 72, 172–181. [Google Scholar] [CrossRef] [Green Version]
  50. Liu, X. To prevent the risk of nickel ore transportation. China Ship Surv. 2016, 8, 68–71. [Google Scholar]
  51. Global Bauxite Working Group. IMO-CCC4/INF.10. Global Bauxite Working Group Report on Research into the Bauxite during Shipping; International Maritime Organization: London, UK, 2017. [Google Scholar]
Figure 1. The cloud-based expression of risk grade.
Jmse 07 00108 g001
Figure 2. The risk simulation cloud during the prophase of the transportation process.
Jmse 07 00108 g002
Figure 3. The histogram of the risk frequency during the prophase of the transportation process.
Jmse 07 00108 g003
Figure 4. The normal probability plot of risk value of the stages during the prophase.
Jmse 07 00108 g004
Figure 5. The risk situation and tendency during the prophase of the transportation process.
Jmse 07 00108 g005
Figure 6. The space-time expression of risk during the prophase of the transportation of bauxite carrier.
Jmse 07 00108 g006
Table 1. The parameters of cloud expression of risk grade.
Risk GradeVery LowLowMediumHighVery High
Risk value[0, 1][1, 2][2, 3][3, 4][4, 5]
Ex01.52.53.55
En1/31/61/61/61/3
He1/251/301/301/301/25
Table 2. The sampling risk value matrix during the prophase of the transportation process of the bauxite carrier.
Sampling SiteWharf
(t1)
Wharf Apron
(t2)
Harbor Basin
(t3)
Inner Channel
(t4)
Outer Channel
(t5)
Coastal Sea
(t6)
No.11.61.51.52.03.04.2
No.23.01.02.02.02.54.0
No.32.82.01.32.43.24.5
No.43.01.61.01.82.13.8
No.52.72.11.52.53.54.2
No.61.81.51.31.62.53.5
No.73.11.82.12.53.04.0
No.82.31.91.52.03.54.2
Table 3. The parameters of risk simulation cloud during the prophase of the transportation process.
PositionWharfWharf ApronHarbor BasinInner ChannelOuter ChannelCoastal Sea
Ex2.53751.67501.52502.10002.91254.0500
En0.59920.34470.32900.34470.10970.1097
He0.16690.07880.15920.08580.49350.1091

