Abstract
This study utilized a shock-capturing Boussinesq model FUNWAVE-TVD to investigate the maximum momentum flux in the solitary wave run-up zone over back-reef slopes. Validation results of the present model were compared to the previous version of FUNWAVE using the eddy viscosity breaking model to demonstrate the advantages of the shock-capturing method in predicting the breaking solitary wave transformation and run-up over fringing reefs. A series of numerical experiments was designed comprehensively and performed then to obtain a new formulation for the envelope of the spatial distribution of the maximum momentum flux within the solitary wave run-up zone over back-reef beaches, which is different from the one used over uniformly-sloping beaches. Finally, the effects of the variation of reef parameters (i.e., the fore-reef slope angle, reef flat width, and water depth over the reef flat) on the maximum momentum flux at the initial shoreline were investigated to better understand the role of fringing reefs in the mitigation of tsunami hazard.
1. Introduction
Tsunamis are known as seismic sea waves, which are caused by the displacement of a large volume of water in the ocean. Destructive hazards can be induced by the tsunami in coastal areas as demonstrated in the 2004 Indian Ocean Tsunami and the 2011 North-East Japan Tsunami. Since the early 1970s, the solitary wave has been frequently introduced as a benchmark in modeling tsunami wave behaviors in nearshore regions (e.g., [1,2,3,4]) because a solitary wave is believed to model some important features of the coastal effects of the leading soliton of a tsunami [5]. On the other hand, some researchers [6] have also questioned the geophysical relevance of this solitary wave paradigm. They pointed out that the formation of leading solitons may take a long time and not happen in reality because of geophysical constraints, and the main tsunami wave may not break before reaching the shoreline. If these are the cases, a real tsunami can hardly be represented as a solitary wave. Thus, the link between the solitary wave paradigm and geophysical tsunamis is still not clearly established. Nevertheless, the solitary wave paradigm remains a popular simplified approach in physical and mathematical studies of tsunamis so far.
Tsunami run-up is the key process to consider for an assessment of the tsunami hazard, and several studies (e.g., [1,7,8]) have been conducted for an estimate of tsunami run-up height in the case of uncertainty in both the bathymetry and water level at the seaward boundary. Meanwhile, in order to mitigate the tsunami hazard, researchers are trying to improve protective structures since coastal structures are widely used for shore and harbor protections. Interactions between tsunami waves and coastal structures have been studied to better understand the performance of coastal structures under tsunami attacks (e.g., [9,10,11]). In addition to coastal structures, the effects of coastal vegetation (such as fringing reefs, which are abundant in tropical and sub-tropical regions) on tsunami hazards have also attracted researchers’ attentions, and numerous post-disaster surveys on tsunami hazards over reef-fringed coasts have been conducted. For example, some [12,13,14] indicted coral reefs could reduce the tsunami impact efficiently with lower run-up height and inundation distance, while some found coral reefs seemed to offer little or no protection for the reef-lined coasts [15,16,17]. Moreover, several researchers also performed physical model tests [4,18,19,20,21,22,23] to investigate the wave–reef interactions. Among these studies, Quiroga and Cheung [4] and Yao et al. [23] focused on the solitary wave, while others adopted the regular or irregular waves for wind waves in their laboratory experiments. The effects of reef roughness on the solitary wave transformation over fringing reefs have been studied [4], and empirical formulas have been proposed for the solitary wave run-up height on the back-reef beach [23].
However, the results from field surveys and physical model tests are still less conclusive as they did not comprehensively demonstrate the effects of different reef parameters on tsunami hazards. Reliable numerical models are convenient tools to study the effects of reef geometry and hydrodynamic parameters, such as the fore-reef slope, reef flat water level, and reef flat width, since they can be easily adjusted in numerical experiments. For the reef bathymetry, shock-capturing ability is the preferable property for a model that aims at simulating nearshore reef hydrodynamics [24,25]. Abrupt flow transition from the dispersion-dominated state to the flux-dominated state is induced by the intense wave breaking over the steep reef face, and accurate capture of this shock-related process requires satisfaction of conservation laws across flow discontinuities [25]. It is well known that nonlinear shallow water equations have the ability of treating bores and shocks (e.g., [26,27]). However, due to the absence of frequency dispersion, the nonlinear shallow water equations are restricted to the propagation of bores in the inner surf zone after wave breaking is fully developed. The Boussinesq equations are an attractive alternative to the nonlinear shallow water equations, and in contrast to nonlinear shallow water equations, they have been reported to be better at predicting the process of wave transformation under deeper water in front of the fringing reef because of retention of dispersive terms [23]. However, the Boussinesq equations do not automatically lead to wave breaking in shallow water, and additional breaking models (e.g., [28,29]) need to be coupled to extend the Boussinesq equations in the surf zone. Combined with additional breaking models, Boussinesq-type models were applied to simulate the motions of regular waves [30,31], irregular waves [20,32], and solitary waves [23] over fringing reefs. Recently, considering the merits of nonlinear shallow water equations and Boussinesq equations, a number of Boussinesq-type models with shock-capturing capability [24,33,34,35,36] have been proposed for a more realistic account of wave hydrodynamics over fringing reefs. Wave breaking is captured as shock waves by simply switching the Boussinesq equations to the nonlinear shallow water equation, making the implementation of an additional breaking model and further parameterization unnecessary. Shoreline movement can also be handled quite naturally and efficiently. Utilizing shock-capturing Boussinesq models, researchers [24,25] successfully modeled the solitary wave transformation over the sharply varying reef bathymetry, and the effects of different reef parameters on solitary wave breaking, reflection, and transmission over fringing reefs were studied [37].
After a review of the existing numerical studies for solitary wave evolution over fringing reefs, we are aware that most of them mainly focused on the wave characteristics over the fore-reef slope and shallow reef flat, and the run-up process over the back-reef beach was rarely included or investigated. Therefore, they are still insufficient to demonstrate the role of fringing reefs in the mitigation of tsunami hazards. More recently, Yao et al. [23] and Ning et al. [38] numerically investigated the effects of reef parameters on solitary wave run-up height, contributing to the understanding of the role of fringing reefs. Besides the run-up height, the maximum momentum flux in the solitary wave run-up zone also serves as a measure of tsunami damage potential with engineering and environmental significance. The momentum flux here mainly refers to the fluid forces exerted on stationary structures in the run-up zone, which is the fundamental cause of the structural damage by a tsunami [39]. Considering a long tsunami period, the run-up flows can be considered as quasi-steady, and the drag force exerted on a surface-piercing surface in a steady flow is applicable to represent the fluid forces in the run-up zone [40]. Based on this approximation, numerical models based on nonlinear shallow water equations have been applied to simulate the solitary wave run-up [41,42], and the maximum momentum flux distribution in the solitary wave run-up zone has been obtained and regarded as a convenient estimate of fluid force attenuation from the initial shoreline to the maximum run-up location [40]. However, these studies just focused on the uniformly-sloping beaches. The maximum momentum flux distribution obtained for the uniformly-sloping beaches may not be applicable for the back-reef beaches, as waves propagating onto the fringing reef usually undergo significant transformation, and the wave shape and flow pattern may be different from the ones over the plane beaches. Therefore, in light of the aforementioned studies, the main objectives of this paper are to: (1) utilize a shock-capturing Boussinesq model to study the maximum momentum flux distribution in the solitary wave run-up zone over back-reef slopes; (2) investigate the effects of the reef geometry and hydrodynamic parameters on the maximum momentum flux at the initial shoreline. The shock-capturing Boussinesq model utilized in this study is FUNWAVE-TVD [34], which developed a high-order shock-capturing TVD (Total Variation Diminishing) scheme for the original FUNWAVE model [43]. With a proper value of the grid size and Manning coefficient incorporated in the bottom friction term, the present model has been shown to be robust for the solitary wave transformation and run-up over fringing reefs, as presented in Ning et al. [38].
The remainder of this paper is organized as follows. In Section 2, the adopted numerical model is briefly reviewed. In Section 3, validation results of the present model are presented and compared to the previous version of FUNWAVE using the eddy viscosity breaking model. In Section 4, the numerical experiments design is comprehensively presented and performed using the model to investigate the maximum momentum flux distribution in the run-up zone over back-reef slopes and the effects of reef parameters on the maximum momentum flux at the initial shoreline. Numerical results are also discussed in this section. Finally, the main conclusions are summarized in Section 5.
2. Brief Description of the Numerical Model
The governing equations used in FUNWAVE-TVD were based on the fully-nonlinear Boussinesq equations proposed by Chen [44], extended to incorporate a moving reference level introduced by Kennedy et al. [45]. The use of a moving reference elevation is more consistent with a time-varying representation of elevations at the moving shoreline in modeling of swash zone dynamics and coastal inundations. The governing equations were reformulated into a well-balanced conservative form, and spatial derivatives were discretized using a hybrid finite volume-finite difference scheme. A high-order MUSCL (Monotone Upstream-centered Schemes for Conservation Laws) reconstruction technique, which is accurate up to the fourth-order, was used in the Riemann solver. An adaptive time step instead of a uniform time step was implemented based on a third-order Runge–Kutta method. Wave breaking treatment followed the approach of Tonelli and Petti [33], who used the shock-capturing ability of the nonlinear shallow water equations with a TVD solver to simulate moving hydraulic jumps. The Boussinesq equations were switched to the nonlinear shallow water equations via disregarding all the dispersion terms when the ratio of surface elevation to water depth exceeded a threshold 0.8, and wave breaking was triggered and treated as shock waves. The bottom friction for wave attenuation was calculated by a quadratic friction law incorporating a Manning coefficient, whose values for surfaces of commonly-used materials can be found in any standard text book for hydraulics and fluid mechanics. Moving shoreline was handled as part of the Riemann solver underlying the finite volume scheme. The model was parallelized using the Message Passing Interface (MPI) with non-blocking communication for data communication between processors. More details about the present model can be found in Shi et al. [34].
3. Model Validation
The present model was validated with experimental data for the solitary wave transformation and run-up over an idealized reef-beach profile in our previous study [38]. For completeness and clarity, we briefly introduce the laboratory experiments and demonstrate the validation results herein.
Laboratory experiments were performed in the two-dimensional wave flume (Dalian University of Technology, Dalian, China) of the Ocean Experiment Hall at Zhejiang University. Figure 1 shows a schematic layout of the experimental setup. An idealized reef-beach model was designed and placed in the wave flume to reproduce the main aspects of a fringing reef adjacent to the back-reef beach based on the Froude similarity with a geometric scale factor of 1:100. The offshore water depth in front of the reef model was 0.413 m, and the water depth above the reef flat was 0.03 m. Accordingly, at the prototype scale, the characteristic fore-reef slope angle (1:3), reef flat width (493 m), and the water depth over the reef flat (3 m) were within the common ranges reported in Quataert et al. [46]. Seven wave gauges (HR Wallingford, Oxfordshire, UK) were used in the experiment. One Wave Gauge (WG1) was positioned seaward of the reef in deeper water. Two gauges (WG2, WG3) were placed over the fore-reef slope. One gauge (WG4) was placed at the reef edge, and two gauges (WG5, WG6) were placed at the middle and end of the reef flat. Moreover, the run-up motions were measured by a 2 m-long wave gauge, which was laid parallel on the back-reef slope (Figure 2). Solitary waves were generated by the piston-type wave maker with incident wave heights from 0.01 m–0.07 m. The generation technique followed the method described in Guizien and Barthélemy [47]. Further details on the experimental setup can be found in Ning et al. [38]
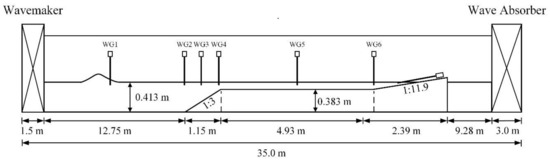
Figure 1.
Experimental setup.
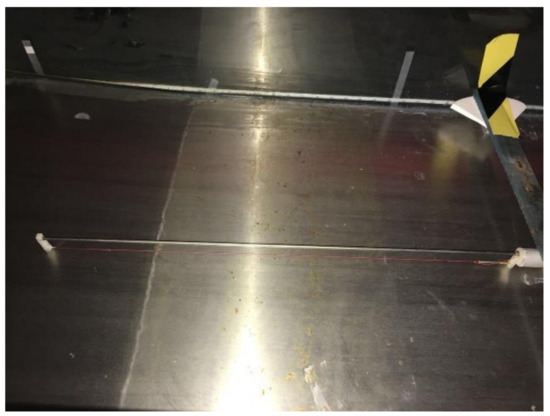
Figure 2.
A snapshot of the run-up gauge.
In FUNWAVE-TVD, the internal wave maker was implemented for the incident solitary waves following Wei and Kirby [48], who obtained an analytical solitary-wave solution for Nwogu’s extended Boussinesq equations [49]. The sensitivity of the gird size and Manning coefficient adopted in FUNWAVE-TVD were well examined by Ning et al. [38] for the aforementioned laboratory experiments. The grid size of FUNWAVE-TVD, which uses the TVD technique in conjunction with a nonlinear shallow water equation to deal with wave breaking, was reported to be important to capture the breaking point accurately and introduce the right amount of energy dissipation for short waves [34]. However, for the solitary wave with a larger wave length generated in the aforementioned wave flume experiments, the run-up height prediction was found to be more sensitive to the grid size. Comparing the numerical results obtained from FUNWAVE-TVD with three grid sizes dx = 0.05 m, 0.01 m, 0.005 m, dx = 0.01 m, it was found to be fine enough to gather accurate results [38]. Therefore, all numerical simulations using the present model in the subsequent numerical experiments adopted the grid size dx = 0.01 m. It was also found that the Manning coefficient incorporated in the bottom friction term could well represent the surface roughness, in which case the value n = 0.012 indicated by the standard textbooks of hydraulics for the smooth steel gave the best results, especially for the run-up height prediction [38]. Figure 3 and Figure 4 show the comparisons of measured and predicted time series of water surfaces at WG1–WG6 with grid size dx = 0.01 m and Manning coefficient n = 0.012 for the wave cases with incident wave heights of 0.05 m and 0.07 m. Moreover, simulated results from a previous version of FUNWAVE using the eddy viscosity breaking model [29] are presented additionally in this paper for comparison to better demonstrate the advantages of the shock-capturing method in predicting the solitary wave transformation and run-up over the reef bathymetry. Solitary waves with incident wave heights of 0.05 m and 0.07 m both broke over the fore-reef slope and therefore were chosen for comparisons of the two models. Moreover, the results of a 0.07-m solitary wave were not presented before. As seen in Figure 3 and Figure 4, both the present model and Kennedy et al.’s model [29] reasonably reproduced the wave motions at WG1–WG6, but numerical results from Kennedy et al. [29] had some small noises at WG5 and WG6. Additional sources of noise may be related to the eddy viscosity formulation, which remains less well understood, while the shock-capturing method can automatically detect discontinuities in solution and introduces nonlinear dissipation to suppress nonphysical oscillations arising from them [50]. Moreover, it should be noted that phase discrepancies were observed between the numerical results and experimental data at WG6. The bore-arrival time predicted by FUNWAVE-TVD tended to be later, while the bore-arrival time predicted by Kennedy et al. [29] tended to be earlier. The largest phase discrepancy observed between the numerical results of FUNWAVE-TVD and the experimental data in Figure 4 was less than 0.6 s, which was 6 s at the prototype scale based on the scaling in this study. Therefore, the phase discrepancies observed at WG6 may be negligible in the prediction of real tsunami propagation for both models.
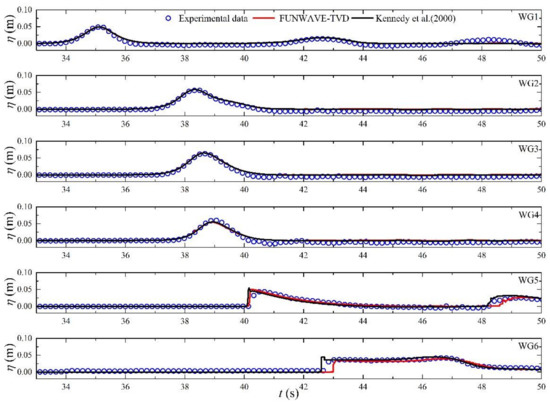
Figure 3.
Comparisons of measured and predicted time series of water surfaces at Wave Gauges 1 (WG1)–WG6 for the wave case with an incident wave height of 0.05 m.
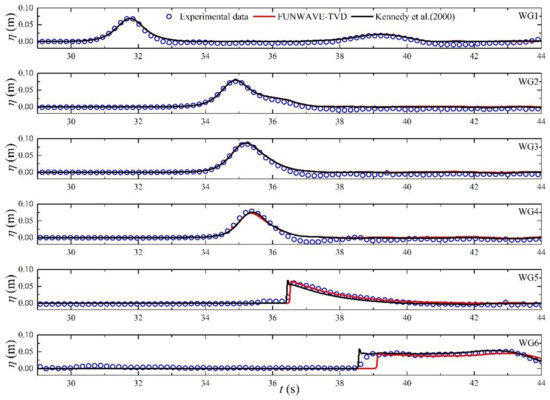
Figure 4.
Comparisons of measured and predicted time series of water surfaces at WG1–WG6 for the wave case with an incident wave height of 0.07 m.
Figure 5 and Figure 6 show the comparisons of measured and predicted time series of run-up height. As seen in Figure 5 and Figure 6, the present model shows better predictive skills at the run-up gauge, in which case Kennedy et al. [29] slightly overestimated the maximum run-up height.
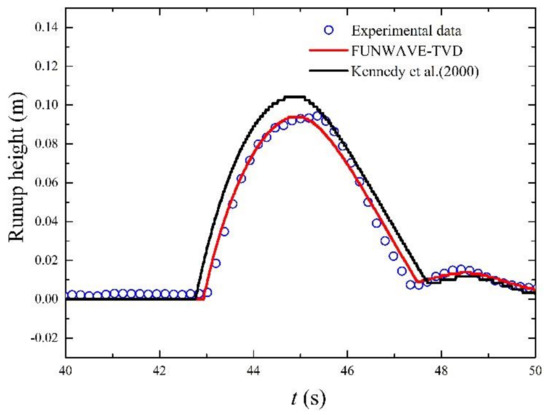
Figure 5.
Comparisons of measured and predicted time series of run-up height for the wave case with an incident wave height of 0.05 m.
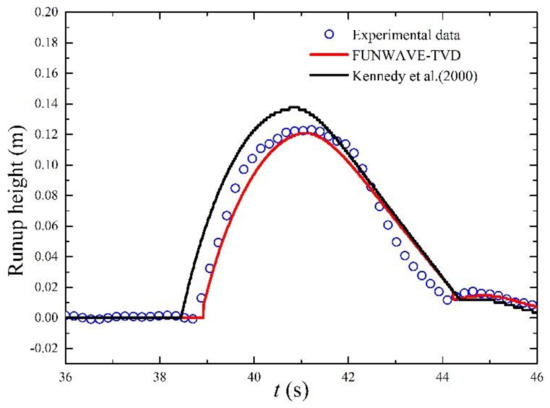
Figure 6.
Comparisons of measured and predicted time series of run-up height for the wave case with an incident wave height of 0.07 m.
4. Numerical Results and Discussions
4.1. Maximum Momentum Flux Distribution in the Run-Up Zone
The actual tsunami flow is not steady; however, considering a long tsunami period, the run-up flow can be considered as quasi-steady, and the drag force exerted on a surface-piercing surface in a steady flow can be applicable to represent the fluid force, F, in the tsunami run-up zone [40], which can be expressed as:
where ρ is the fluid density, u is the depth-averaged velocity, Cd is the drag coefficient, and A is the wetted area of the body projected on the plane normal to the flow direction (i.e., A = hb, h is the total water depth, and b is width of the object). The drag coefficient Cd varies from 1.2–2, depending on the width-depth ratio. This range of Cd is suggested by the Coastal Construction Manual of Federal Emergency Management Agency, USA, and was also confirmed by laboratory experiments of Arnason [51]. Therefore, with a proper value of the drag coefficient, an estimate of the fluid force on structures constructed at a given location in the tsunami run-up zone can be obtained from Equation (1), once the momentum flux hu2 in Equation (1) is estimated. In Yeh [40], the envelope of the spatial distribution of the maximum value of hu2 in the solitary wave run-up zone over uniform sloping beaches was obtained by plotting the dimensionless parameter hu2/gl2tan2α as a function of x/l (g is gravitational acceleration; α is the slope angle; x indicates the horizontal distance between the location in the run-up zone and the maximum run-up location; l is the final horizontal inundation distance between the initial shoreline and maximum run-up location). Following his study, several numerical experiments with different incident wave heights Hi, reef parameters (i.e., water depth over the reef flat, hr, reef flat width, w, fore-reef slope angle, θ) and back-reef slope angles, β, as listed in Table 1, were performed in this study using FUNEAVE-TVD to investigate the variation of the dimensionless parameter hu2/gl2tan2β as a function of the parameter x/l for the tsunami-like solitary wave run-up over fringing reefs. The numerical experiments’ setups are shown in Figure 7. The internal wave maker was 12.75 m from the toe of the fore-reef slope, and the whole computational domain of 40 m was applied with grid size dx = 0.01 m. The numerical experiments were designed based on the Froude similarity with the same geometric scale factor of 1:100. Incoming solitary waves of all cases in Table 1 were designed to break over the fore-reef slope. The Manning coefficient n of the fringing reef was set to 0.05 in the numerical experiments. This value is based on the previous studies [52,53], where n = 0.05 represents the roughness of natural and normal coral reefs. An offshore roughness for sand (n = 0.02) and onshore roughness for cobbles (n = 0.04) were fixed in all runs, consistent with the study of tsunami inundation over fringing reefs [53]. The choices of breaking solitary wave and rough reef was based on the exiting studies [14,54], which suggested that the rough reef flat and wave breaking are usually important for tsunami energy dissipation over fringing reefs.

Table 1.
Conditions of numerical experiments.
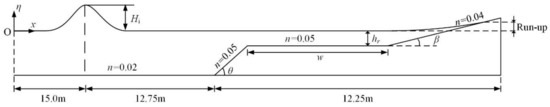
Figure 7.
Numerical experiments setup.
Figure 8 shows the dimensionless parameter hu2/gl2tan2β as a function of the parameter x/l for all cases listed in Table 1. As seen in Figure 8, the resulting distribution curves of all cases appear to form the envelope as well. With a curve fit, the envelope can be expressed by:
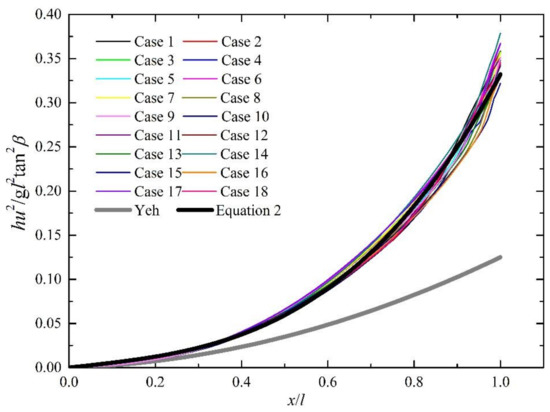
Figure 8.
Variation of the dimensionless parameter hu2/gl2(tanβ)2 as a function of the parameter x/l for Case 1–Case 17. The results of Yeh are also shown for comparison.
Notably, the values and ranges of the reef parameters (i.e., water depth over the reef flat, reef flat width, fore-reef slope angle) of the numerical experiments in Table 1 were set comprehensively based on the reported literature, as summarized in Quataert et al. [46], so that the new Equation (2) for the envelope of the spatial distribution of the maximum value of hu2 is expected to be applicable for most of the reported fringing reefs. The back-reef slope angles were designed based on the values used in previous studies [20,50]. Moreover, the envelope obtained by Yeh [40] over the uniformly-sloping beach is also plotted in Figure 8. It is noted that the envelope of the maximum hu2 obtained in this study was obviously higher than the one obtained by Yeh [40]. This indicates that with the same run-up height, the reef-fringed coasts may suffer more serious damage than natural mild beaches. In addition, the equation of Yeh [40] is a quadratic function, while when we used the quadratic function for the curve fit, the envelope could not represent the spatial distribution of the maximum value of hu2 well. The cubic function was found to be more suitable for the curve fit in this study. As pointed out by Yeh [40], the envelope of the maximum momentum flux distribution within the solitary run-up zone should provide a convenient estimate of tsunami-force attenuation from the initial shoreline to the maximum run-up location, and here, we proposed a new equation of maximum momentum flux distribution within the solitary wave run-up zone for reef-fringed beaches.
4.2. Effects of Reef Parameters
The state of a typical atoll or fringing reef is characterized by the fore-reef slope, reef flat width, and water depth over the reef flat. These parameters vary widely from place to place due to their variation in coral species, geology, and tidal conditions [46]. To better understand the role of fringing reefs in the mitigation of the tsunami hazard, numerical results of several cases in Table 1 were further analyzed to check the effects of these reef parameters on the maximum momentum flux at the initial shoreline.
Figure 9 shows the simulated maximum momentum flux (hu2)max at the initial shoreline with the variation of the water depth over the reef flat for Cases 3–7. As seen in Figure 9, (hu2)max at the shoreline increased significantly with the increase of the water depth over the reef flat. The effect of the water depth over the reef flat on the maximum momentum flux at the initial shoreline is similar to the one on the run-up height, as presented in Ning [38] and Yao [23]. Larger water depth means, by nature, less bottom friction induced by the reef flat. Moreover, as revealed by Zhou [37], larger water depth also means less reflection by the fore-reef slope and less energy dissipation by the wave breaking for the solitary wave.
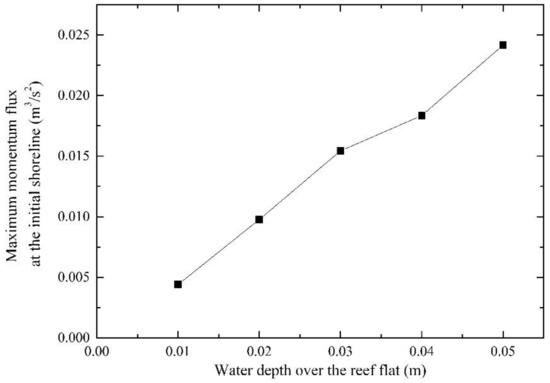
Figure 9.
Maximum momentum flux at the initial shoreline with the variation of the water depth over the reef flat for Cases 3–7.
Figure 10 shows the simulated maximum momentum flux (hu2)max at the initial shoreline with the variation of the reef flat width for Case 3 and Cases 15–18. As seen in Figure 10, (hu2)max at the shoreline decreased significantly with the increase of the reef flat width. The effect of the reef flat width on the maximum momentum flux at the initial shoreline was also similar to the one on the run-up height, as presented in Yao [23]. During wave propagation over the reef flat, energy can be dissipated continuously through turbulent bore and bottom friction. Thus, a wider reef flat means more energy dissipation during longer propagation.
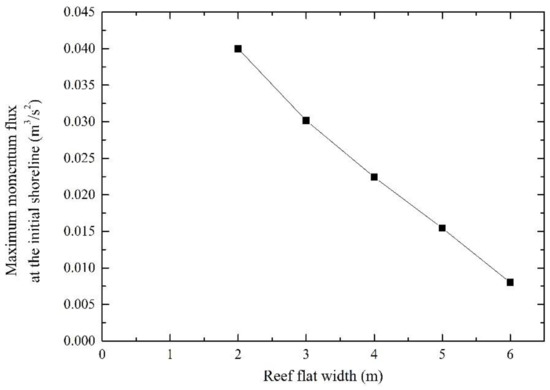
Figure 10.
Maximum momentum flux at the initial shoreline with the variation of the reef flat width for Case 3 and Cases 15–18.
Figure 11 shows the simulated maximum momentum flux (hu2)max at the initial shoreline with the variation of the fore-reef slope angle for Case 3 and Case 8–Case 12. As seen in Figure 11, (hu2)max at the shoreline decreased firstly as the fore-reef slope angle became milder, while when cotβ was larger than seven, (hu2)max at the shoreline did not vary much with the change of the fore-reef slope angle. Unlike the reef flat width and water depth over the reef flat, the effect of the fore-reef slope angle on the maximum momentum flux at the initial shoreline was different from the one on the run-up height, as presented in Ning [38]. The effect of the fore-reef slope on the run-up was reported to be insignificant when the fore-reef slope angle was changed from 1:2 to 1:20. Although milder fore-reef slope means less reflection, the long-distance and thorough breaking process over a milder fore-reef slope may offset the reflection effect so that the solitary wave run-up height is not affected much by the fore-reef slope [38]. In contrast, the present study demonstrated that a steeper fore-reef slope induced larger momentum flux at the initial shoreline, although a steeper fore-reef slope should mean more energy reflected seaward. This effect of the fore-reef slope on the momentum flux may be explained by Gelfenbaum et al. [53], who suggested that the nearshore wave transformation over a reef is important as it dictates whether the wave comes onshore more like a rapidly-rising tide or more like a turbulent bore, which can be significantly more destructive near the shoreline. The steeper fore-reef slope may make the wave front become more bore-shaped as it propagates over the reef flat and therefore increase the fluid forces within the solitary wave run-up flow. The results in Figure 11 may somehow explain why some coasts behind a wide, shallow, and rough reef flat still suffered serious tsunami damage [17]. However, as seen in Figure 8, the effect of the fore-reef slope on the fluid forces was still not very obvious so that the resulting distribution curves of Case 3 and Case 8–Case 12 still appeared to form the envelope of Equation (2). We think other structural failure modes, which are outside the scope of the present study, may be also enhanced by the steeper fore-reef slope.
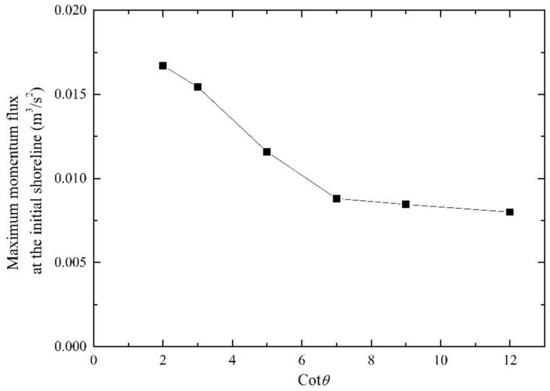
Figure 11.
Maximum momentum flux at the initial shoreline with the variation of the reef flat width for the fore-reef slope angle for Case 3 and Case 8–Case 12.
Finally, we have to remind about the possible limitations of this study arising from the solitary wave paradigm. Based on the work by Madsen et al. [6], the real tsunami run-up features and the effects of the reef parameters may be different from the results obtained in this study, which adopted breaking solitary waves. Future observations of more details of tsunami processes over fringing reefs are strongly expected to elucidate the validity of the solitary wave paradigm for experimental or mathematical studies of tsunamis over fringing reefs.
5. Conclusions
In this study, the shock-capturing Boussinesq wave model FUNWAVE-TVD was utilized to study the maximum momentum flux in the solitary wave run-up zone over fringing reefs. Numerical experiments were designed comprehensively and performed using FUNWAVE-TVD to investigate the maximum momentum flux distribution in the solitary wave run-up zone over back-reef slopes and the effects of the key reef parameters (i.e., fore-reef slope angle, reef flat width, and water depth over the reef flat) on the maximum momentum flux at the initial shoreline. The main conclusions drawn are listed as follows:
- Validation results of solitary wave transformation and run-up over a typical reef-beach profile clearly showed that with a proper grid size, FUNWAVE-TVD can reasonably reproduce solitary wave breaking and propagation over the sharply varying reef bathymetry and predict the run-up height over the back-reef slope better than the previous version of FUNWAVE using the eddy viscosity breaking model.
- A new equation can be obtained with a curve fit of the numerical experiment results for the envelope of the spatial distribution of the maximum momentum flux within the solitary wave run-up zone over the back-reef beach. The new equation obtained for reef-lined coasts in this study, which is a cubic function, is different from the one obtained in previous studies for uniformly-sloping beds, which is a quadratic function.
- The effects of the water depth over the reef flat and reef flat width on the maximum momentum flux at the initial shoreline were similar to the ones on the run-up height. The maximum momentum flux at the initial shoreline increased significantly with the increase of the water depth over the reef flat and decreased significantly with the increase of the reef flat width. However, the effect of the fore-reef slope angle on the maximum momentum flux at the initial shoreline is different from the one on the run-up height. A steeper fore-reef slope may induce larger momentum flux at the initial shoreline. The results indicated that despite the run-up height, investigating tsunami forces within the solitary wave run-up zone is also necessary for a better understanding of the role of fringing reefs in the mitigation of tsunami hazard.
Author Contributions
Conceptualization, W.L.; methodology, K.S. and Y.N.; validation, K.S. and Y.N.; formal analysis, K.S.; writing, original draft preparation, W.L.; writing, review and editing, W.L.; supervision, W.L.; funding acquisition, W.L.
Funding
This work was funded by the National Natural Science Foundation of China, Grant Number 51809234, the Key Laboratory of Port, Waterway & Sedimentation Engineering, Ministry of Communications, China, Grant Number Yn918002, and the Key Laboratory of Coastal Disasters and Defense of Ministry of Education, China, Grant Number 201708.
Conflicts of Interest
The authors declare no conflict of interest.
References
- Synolakis, C.E. The runup of solitary waves. J. Fluid Mech. 1987, 185, 523–545. [Google Scholar] [CrossRef]
- Maiti, S.; Sen, D. Computation of solitary waves during propagation and runup on a slope. Ocean Eng. 1999, 26, 1063–1083. [Google Scholar] [CrossRef]
- Chang, Y.-H.; Hwang, K.-S.; Hwung, H.-H. Large-scale laboratory measurements of solitary wave inundation on a 1:20 slope. Coast. Eng. 2009, 56, 1022–1034. [Google Scholar] [CrossRef]
- Quiroga, P.D.; Cheung, K.F. Laboratory study of solitary-wave transformation over bed-form roughness on fringing reefs. Coast. Eng. 2013, 80, 35–48. [Google Scholar] [CrossRef]
- Lin, P. A numerical study of solitary wave interaction with rectangular obstacles. Coast. Eng. 2004, 51, 35–51. [Google Scholar] [CrossRef]
- Madsen, P.A.; Fuhrman, D.R.; Schäffer, H.A. On the solitary wave paradigm for tsunamis. J. Geophys. Res. 2008, 113. [Google Scholar] [CrossRef]
- Aniel-Quiroga, Í.; Quetzalcóatl, O.; González, M.; Guillou, L. Tsunami run-up estimation based on a hybrid numerical flume and a parameterization of real topobathymetric profiles. Nat. Hazards Earth Syst. Sci. 2018, 18, 1469–1491. [Google Scholar] [CrossRef]
- Madsen, P.A.; SchÄFfer, H.A. Analytical solutions for tsunami runup on a plane beach: Single waves, N-waves and transient waves. J. Fluid Mech. 2010, 645, 27–57. [Google Scholar] [CrossRef]
- Aniel-Quiroga, Í.; Vidal, C.; Lara, J.L.; González, M.; Sainz, Á. Stability of rubble-mound breakwaters under tsunami first impact and overflow based on laboratory experiments. Coast. Eng. 2018, 135, 39–54. [Google Scholar] [CrossRef]
- Esteban, M.; Jayaratne, R.; Mikami, T.; Morikubo, I.; Shibayama, T.; Thao Nguyen, D.; Ohira, K.; Ohtani, A.; Mizuno, Y.; Kinoshita, M.; et al. Stability of Breakwater Armor Units against Tsunami Attacks. J. Waterw. Port Coast. Ocean Eng. 2014, 140, 188–198. [Google Scholar] [CrossRef]
- Guler, H.G.; Arikawa, T.; Oei, T.; Yalciner, A.C. Performance of rubble mound breakwaters under tsunami attack, a case study: Haydarpasa Port, Istanbul, Turkey. Coast. Eng. 2015, 104, 43–53. [Google Scholar] [CrossRef]
- Fernando, H.J.S.; McCulley, J.L.; Mendis, S.G.; Perera, K. Coral poaching worsens tsunami destruction in Sri Lanka. Eos Trans. Am. Geophys. Union 2005, 86, 301–304. [Google Scholar] [CrossRef]
- Goff, J.; Liu, P.L.F.; Higman, B.; Morton, R.; Jaffe, B.E.; Fernando, H.; Lynett, P.; Fritz, H.; Synolakis, C.; Fernando, S. Sri Lanka Field Survey after the December 2004 Indian Ocean Tsunami. Earthq. Spectra 2006, 22, 155–172. [Google Scholar] [CrossRef]
- Fernando, H.J.S.; Samarawickrama, S.P.; Balasubramanian, S.; Hettiarachchi, S.S.L.; Voropayev, S. Effects of porous barriers such as coral reefs on coastal wave propagation. J. Hydro Environ. Res. 2008, 1, 187–194. [Google Scholar] [CrossRef]
- Adger, W.N.; Hughes, T.P.; Folke, C.; Carpenter, S.R.; Rockström, J. Social-Ecological Resilience to Coastal Disasters. Science 2005, 309, 1036. [Google Scholar] [CrossRef]
- Baird, A.H.; Campbell, S.J.; Anggoro, A.W.; Ardiwijaya, R.L.; Fadli, N.; Herdiana, Y.; Kartawijaya, T.; Mahyiddin, D.; Mukminin, A.; Pardede, S.T.; et al. Acehnese Reefs in the Wake of the Asian Tsunami. Curr. Biol. 2005, 15, 1926–1930. [Google Scholar] [CrossRef]
- Fujima, K.; Shigihara, Y.; Tomita, T.; Honda, K.; Nobuoka, H.; Hanzawa, M.; Fujii, H.; Ohtani, H.; Orishimo, S.; Tatsumi, M.; et al. Survey results of the indian ocean tsunami in the maldives. Coast. Eng. J. 2006, 48, 81–97. [Google Scholar] [CrossRef]
- Seelig, W.N. Laboratory Study of Reef-Lagoon System Hydraulics. J. Waterw. Port Coast. Ocean Eng. 1983, 109, 380–391. [Google Scholar] [CrossRef]
- Gourlay, M.R. Wave set-up on coral reefs. 1. Set-up and wave-generated flow on an idealised two dimensional horizontal reef. Coast. Eng. 1996, 27, 161–193. [Google Scholar] [CrossRef]
- Nwogu, O.; Demirbilek, Z. Infragravity Wave Motions and Runup over Shallow Fringing Reefs. J. Waterw. Port Coast. Ocean Eng. 2010, 136, 295–305. [Google Scholar] [CrossRef]
- Yao, Y.; Huang, Z.; Monismith, S.G.; Lo, E.Y.M. Characteristics of Monochromatic Waves Breaking over Fringing Reefs. J. Coast. Res. 2013, 29, 94–104. [Google Scholar] [CrossRef]
- Yao, Y.; He, W.; Du, R.; Jiang, C. Study on wave-induced setup over fringing reefs in the presence of a reef crest. Appl. Ocean Res. 2017, 66, 164–177. [Google Scholar] [CrossRef]
- Yao, Y.; He, F.; Tang, Z.; Liu, Z. A study of tsunami-like solitary wave transformation and run-up over fringing reefs. Ocean Eng. 2018, 149, 142–155. [Google Scholar] [CrossRef]
- Roeber, V.; Cheung, K. Boussinesq-type model for energetic breaking waves in fringing reef environments. Coast. Eng. 2012, 70, 1–20. [Google Scholar] [CrossRef]
- Fang, K.; Liu, Z.; Zou, Z. Fully nonlinear modeling wave transformation over fringing reefs using shock-capturing Boussinesq model. J. Coast. Res. 2016, 32, 164–171. [Google Scholar] [CrossRef]
- Kobayashi, N.; DeSilva, G.S.; Watson, K.D. Wave transformation and swash oscillation on gentle and steep slopes. J. Geophys. Res. 1989, 94, 951–966. [Google Scholar] [CrossRef]
- Wang, Y.; Liang, Q.; Kesserwani, G.; Hall, J.W. A 2D shallow flow model for practical dam-break simulations. J. Hydraul. Res. 2011, 49, 307–316. [Google Scholar] [CrossRef]
- Madsen, P.A.; Sørensen, O.R.; Schäffer, H.A. Surf zone dynamics simulated by a Boussinesq type model. Part I. Model description and cross-shore motion of regular waves. Coast. Eng. 1997, 32, 255–287. [Google Scholar] [CrossRef]
- Kennedy, A.B.; Chen, Q.; Kirby, J.T.; Dalrymple, R.A. Boussinesq modeling of wave transformation, breaking, and runup. I: 1D. J. Waterw. Port Coast. Ocean Eng. 2000, 126, 39–47. [Google Scholar] [CrossRef]
- Yao, Y.; Huang, Z.; Monismith, S.G.; Lo, E.Y.M. 1DH Boussinesq modeling of wave transformation over fringing reefs. Ocean Eng. 2012, 47, 30–42. [Google Scholar] [CrossRef]
- Skotner, C.; Apelt, C.J. Application of a Boussinesq model for the computation of breaking waves: Part 1: Development and verification. Ocean Eng. 1999, 26, 905–925. [Google Scholar] [CrossRef]
- Yao, Y.; Becker, J.M.; Ford, M.R.; Merrifield, M.A. Modeling wave processes over fringing reefs with an excavation pit. Coast. Eng. 2016, 109, 9–19. [Google Scholar] [CrossRef]
- Tonelli, M.; Petti, M. Hybrid finite volume—Finite difference scheme for 2DH improved Boussinesq equations. Coast. Eng. 2009, 56, 609–620. [Google Scholar] [CrossRef]
- Shi, F.; Kirby, J.T.; Harris, J.C.; Geiman, J.D.; Grilli, S.T. A high-order adaptive time-stepping TVD solver for Boussinesq modeling of breaking waves and coastal inundation. Ocean Model. 2012, 43-44, 36–51. [Google Scholar] [CrossRef]
- Fang, K.; Zou, Z.; Dong, P.; Liu, Z.; Gui, Q.; Yin, J. An efficient shock capturing algorithm to the extended Boussinesq wave equations. Appl. Ocean Res. 2013, 43, 11–20. [Google Scholar] [CrossRef]
- Kazolea, M.; Delis, A.I.; Synolakis, C.E. Numerical treatment of wave breaking on unstructured finite volume approximations for extended Boussinesq-type equations. J. Comput. Phys. 2014, 271, 281–305. [Google Scholar] [CrossRef]
- Zhou, Q.; Zhan, J.-M.; Li, Y.S. Parametric Investigation of Breaking Solitary Wave Over Fringing Reef Based on Shock-Capturing Boussinesq Model. Coastal Eng. J. 2016, 58, 1650007. [Google Scholar] [CrossRef]
- Ning, Y.; Liu, W.; Sun, Z.; Zhao, X.; Zhang, Y. Parametric study of solitary wave propagation and runup over fringing reefs based on a Boussinesq wave model. J. Mar. Sci. Technol. 2018, 1–14. [Google Scholar] [CrossRef]
- Yeh, H. Tsunami Forces in The Runup Zone. In Caribbean Tsunami Hazard; World Scientific: Singapore, 2006. [Google Scholar]
- Yeh, H. Maximum Fluid Forces in the Tsunami Runup Zone. J. Waterw. Port Coast. Ocean Eng. 2006, 132, 496–500. [Google Scholar] [CrossRef]
- Liu, P.L.F.; Synolakis, C.E.; Yeh, H.H. Report on the International Workshop on Long-Wave Run-up. J. Fluid Mech. 1991, 229, 675–688. [Google Scholar] [CrossRef]
- Carrier, G.F.; Wu, T.T.; Yeh, H. Tsunami run-up and draw-down on a plane beach. J. Fluid Mech. 2003, 475, 79–99. [Google Scholar] [CrossRef]
- Kirby, J.T.; Wei, G.; Chen, Q.; Kennedy, A.B.; Dalrymple, R.A. Fully Nonlinear Boussinesq Wave Model. Documentation and User’s Manual; Center for Applied Coastal Research, Department of Civil and Environmental Engineering, University of Delaware: Delaware, DE, USA, 1998. [Google Scholar]
- Chen, Q. Fully nonlinear Boussinesq-type equations for waves and currents over porous beds. J. Eng. Mech. 2006, 132, 220–230. [Google Scholar] [CrossRef]
- Kennedy, A.B.; Kirby, J.T.; Chen, Q.; Dalrymple, R.A. Boussinesq-type equations with improved nonlinear performance. Wave Motion 2001, 33, 225–243. [Google Scholar] [CrossRef]
- Quataert, E.; Storlazzi, C.; Rooijen, A.; Cheriton, O.; Van Dongeren, A. The influence of coral reefs and climate change on wave-driven flooding of tropical coastlines. Geophys. Res. Lett. 2015, 42, 6407–6415. [Google Scholar] [CrossRef]
- Guizien, K.; Barthélemy, E. Accuracy of solitary wave generation by a piston wave maker. J. Hydraul. Res. 2002, 40, 321–331. [Google Scholar] [CrossRef]
- Wei, G.; Kirby, J.T. Time-Dependent Numerical Code for Extended Boussinesq Equations. J. Waterw. Port Coast. Ocean Eng. 1995, 121, 251–261. [Google Scholar] [CrossRef]
- Nwogu, O. Alternative form of Boussinesq equations for nearshore wave propagation. J. Waterw. Port Coast. Ocean Eng. 1993, 119, 618–638. [Google Scholar] [CrossRef]
- Shimozono, T.; Tajima, Y.; Kennedy, A.B.; Nobuoka, H.; Sasaki, J.; Sato, S. Combined infragravity wave and sea-swell runup over fringing reefs by super typhoon Haiyan. J. Geophys. Res. 2015, 120, 4463–4486. [Google Scholar] [CrossRef]
- Arnason, H. Interactions between an incident bore and a free-standing coastal structure. Ph.D. Thesis, University of Washington, Seattle, WA, USA, 2005. [Google Scholar]
- Kunkel, C.M.; Hallberg, R.W.; Oppenheimer, M. Coral reefs reduce tsunami impact in model simulations. Geophys. Res. Lett. 2006, 33. [Google Scholar] [CrossRef]
- Gelfenbaum, G.; Apotsos, A.; Stevens, A.W.; Jaffe, B. Effects of fringing reefs on tsunami inundation: American Samoa. Earth Sci. Rev. 2011, 107, 12–22. [Google Scholar] [CrossRef]
- Lynett Patrick, J. Effect of a Shallow Water Obstruction on Long Wave Runup and Overland Flow Velocity. J. Waterw. Port Coast. Ocean Eng. 2007, 133, 455–462. [Google Scholar] [CrossRef]
© 2019 by the authors. Licensee MDPI, Basel, Switzerland. This article is an open access article distributed under the terms and conditions of the Creative Commons Attribution (CC BY) license (http://creativecommons.org/licenses/by/4.0/).