Article

Integrating Three-Dimensional Benthic Habitat Characterization Techniques into Ecological Monitoring of Coral Reefs

1
Joint Institute for Marine and Atmospheric Research, University of Hawai‘i at Mānoa, Honolulu, HI 96822, USA
2
Papahānaumokuākea Marine National Monument, Office of National Marine Sanctuaries, National Ocean Service, National Oceanic and Atmospheric Administration, Honolulu, HI 96818, USA
3
Marine Science Department, University of Hawai‘i at Hilo, Hilo, HI 96720, USA
*
Author to whom correspondence should be addressed.
J. Mar. Sci. Eng. 2019, 7(2), 27; https://doi.org/10.3390/jmse7020027
Submission received: 4 January 2019 / Revised: 18 January 2019 / Accepted: 22 January 2019 / Published: 28 January 2019
(This article belongs to the Special Issue Underwater Imaging)

Abstract

:
Long-term ecological monitoring of reef fish populations often requires the simultaneous collection of data on benthic habitats in order to account for the effects of these variables on fish assemblage structure. Here, we described an approach to benthic surveys that uses photogrammetric techniques to facilitate the extraction of quantitative metrics for characterization of benthic habitats from the resulting three-dimensional (3D) reconstruction of coral reefs. Out of 92 sites surveyed in the Northwestern Hawaiian Islands, photographs from 85 sites achieved complete alignment and successfully produced 3D reconstructions and digital elevation models (DEMs). Habitat metrics extracted from the DEMs were generally correlated with one another, with the exception of curvature measures, indicating that complexity and curvature measures should be treated separately when quantifying the habitat structure. Fractal dimension D64, calculated by changing resolutions of the DEMs from 1 cm to 64 cm, had the best correlations with other habitat metrics. Fractal dimension was also less affected by changes in orientations of the models compared to surface complexity or slope. These results showed that fractal dimension can be used as a single measure of complexity for the characterization of coral reef habitats. Further investigations into metrics for 3D characterization of habitats should consider relevant spatial scales and focus on obtaining variables that can complement fractal dimension in the characterization of reef habitats.

1. Introduction

Long-term ecological monitoring of reef fish populations generally aims to evaluate the current status of the ecosystem and to detect any trend or sudden changes in the ecosystem due to natural and/or anthropogenic disturbances. One of challenges in conducting fish monitoring is that biotic and abiotic factors, such as water motion, depth and habitat, can affect the structure of fish assemblages [1]. Benthic composition can influence the distributions of fishes that rely on benthic organisms for food [2]. Measures of a habitat’s structural complexity, such as numbers and sizes of holes and topographic relief, also affect the diversity and abundance of fish assemblages by altering the amount of available refuge space, capacity for niche specialization and the encounter rate between competitors [3,4,5,6,7]. In coral reef environments, disturbances such as tropical storms [8], bleaching events [9,10] and the decline of herbivores [11] all have the potential to alter benthic cover and structural complexity, which in turn affect the structure of fish assemblages. Therefore, variations in the structure of fish assemblages explained by these variables need to be considered when assessing temporal changes in the fish assemblages [12].
In recent years, technological advancements in image sensors and data-processing capacity has led to the successful use of photogrammetric techniques (e.g., structure-from-motion photogrammetry) as a cost-effective means to generate three-dimensional (3D) reconstructions of coral reef habitats [13,14,15,16]. The resulting 3D models can be used to quantify the habitat structure by extracting metrics (e.g., fractal dimension, vector dispersion, rugosity, surface complexity, slope and curvature) directly from the digital surface models [15] or from the digital elevation models (DEMs) exported from the 3D models [13]. Habitat metrics extracted from 3D models of coral colonies have been, in turn, linked to reef fish assemblages [17]. Three-dimensional reconstructions can also be used for volumetric analyses to track temporal changes in the habitat structure and/or for obtaining data on the distribution of benthic species after exporting them as orthophotomosaics [14,18,19]. While the use of photogrammetric techniques requires more time for post-survey data processing than in situ observations, it potentially generates high-resolution data [14] with relatively high precision and accuracy [20], and it is less prone to observer bias [21]. Image acquisition for 3D reconstruction is also less time consuming in the field than in situ (i.e., underwater) methods that are commonly used to characterize either the habitat structure (e.g., chain-and-tape rugosity and Habitat Assessment Scores [5]) or benthic cover [22].
Here, we describe a workflow for obtaining habitat variables through benthic surveys, using structure-from-motion photogrammetric techniques, and subsequent processing of the resulting DEMs. We applied these methods to a reef monitoring program in the Northwestern Hawaiian Islands (NWHI) to quantify the 3D habitat structure of coral reefs throughout this region. The NWHI consist of ten major islands and atolls that span approximately 2000 km (Figure 1). They are part of the Papahānaumokuākea Marine National Monument, a marine protected area encompassing 1.5 million square kilometers that is one of the largest conservation areas in the world. While monitoring of shallow-water (≤30 m) coral reef fish and reef habitats has been conducted annually in the NWHI during the reef assessment and monitoring program (RAMP) expedition each summer, maintaining a consistent and sufficient sample size (i.e., number of survey sites) at each island/atoll can be challenging due the large spatial area and remote location of the monument. Nonetheless, a recent study investigating temporal changes in the fish assemblages in the NWHI revealed the importance of obtaining habitat variables when conducting fish surveys [23]. The purpose of this study was, therefore, to establish a procedure to integrate a benthic survey using photogrammetric techniques into the reef fish monitoring in the NWHI without substantial increases in the time required for divers to complete their visual surveys at each site. Owing to a plethora of habitat metrics that can be extracted from DEMs using various geographic information system (GIS) software/packages, identifying the appropriate and relevant metrics for habitat characterization is also important. It streamlines the post-expedition data processing and allows scientists and managers to obtain data quickly. However, application of the procedures described here is not limited to fish monitoring surveys in the NWHI and can be used to accompany any other underwater visual surveys that benefit from high-resolution habitat data.

2. Materials and Methods

2.1. Image Acquisition

Images of coral reefs were collected from islands/atolls of the NWHI during the 2017 RAMP expedition aboard NOAA ship Hi‘ialakai under the conservation and management permit, PMNM-2017-001A. Surveyed islands/atolls were French Frigate Shoals (23°52′ N, 166°17′ W), Laysan Island (25°42′ N, 171°44′ W), Lisianski Island (26°04′ N, 173°58′ W), Pearl and Hermes Atoll (27°56′ N, 175°44′ W), Midway Atoll (28°12′ N, 177°21′ W), and Kure Atoll (28°25′ N, 178°20′ W). Survey sites at each island or atoll were randomly chosen using the GIS software ArcMap (v.10.4) by generating random points (i.e., coordinates) on bathymetric and bottom composition maps, in which target survey sites were hard-bottom habitats at depths ≤30 m.
At each site, a pair of SCUBA divers first laid a 30-m transect line along a depth contour to survey the reef fish inside two adjacent cylinders that were 15 m in diameter using a stationary point count method [24]. After the completion of the fish survey, the divers collected images along the transect line following a procedure that was similar to the one described in Burns et al. [13]. A ground control point (GCP) unit was placed at one end of the transect line. The GCP unit, consisting of three polyvinyl reflectors, was used to obtain accurate x, y and z reference coordinates for scaling. After setting the white balance using a white slate, overlapping photographs were manually taken along the transect line using the single shooting setting, down on one side and back on the other side, while swimming slowly at approximately 3 m above the substrate aiming to cover a 90-m2 (30-m length × 3-m width) area with 70–80% overlaps between images. While this simple approach of image acquisition from above allowed the divers to complete the process relatively quickly and, thus, to maintain the number of monitoring surveys that they could complete per day, certain structures such as overhangs associated with table corals would unlikely be captured in our 3D reconstructions. As our main focus was to characterize each reef habitat as a whole, and not the individual coral colonies, we considered this as an acceptable trade-off for maintaining the sample size for the monitoring program. The number of images captured at each site was, on average, 252 ± 50.48 SD (standard deviation). All photographs were taken using a Canon EOS Rebel SL1 digital SLR camera with an 18–55 mm lens in an Ikelite housing with a 6-inch dome port. The camera lens was set to the focal length of 18 mm with a shutter speed of 1/250, an aperture of f/10 and an auto ISO.

2.2. Generation of 3D Models

Three-dimensional models were constructed from the acquired imagery using the software Agisoft PhotoScan Professional (v. 1.4), following the procedure of Burns et al. [13] (Table 1). Briefly, a sparse 3D point cloud was generated through the photo alignment process for each survey site. The key point limit and tie point limit were initially set to 50,000 and 5000, respectively, with the generic preselection enabled. However, if all the photos did not align with these initial settings, they were increased to 70,000 and 8000, respectively, with the generic preselection disabled. The x, y and z values from the GCP unit were used as known reference coordinates to scale each model accurately. After optimizing the camera alignment using the reference coordinates, a dense point cloud was generated and, in turn, used to generate a triangulated mesh model. A spatially rectified orthophotomosaic and DEM were then exported from the Agisoft PhotoScan at a 1-cm resolution as GeoTIFF elevation data files with local coordinates for further processing. The process was completed on either an Intel Xeon workstation with a 32GB RAM and FirePro W5100 GPU or Intel Core i7 laptops with a 64GB RAM and GeForce GTX 980 GPU.

2.3. Quantification of the Habitat Structure

Quantification of the habitat structure was done using the software ArcMap v.10.4 with 3D Analyst and Spatial Analyst licenses and Benthic Terrain Modeler (BTM) v.3.0 [25], as well as the statistical software R v.3.4.4 [26] with the sp [27,28], raster [29] and rgeos [30] packages. The DEMs were imported into the programs as raster files for spatial analyses. All habitat metrics obtained in ArcMap and R (Table 2, also see Section 2.3.1 and Section 2.3.2 for details) were examined for their relationships using Pearson correlation coefficients (ρ) obtained in R.

2.3.1. ArcMap Procedure

Each DEM and orthophotomosaic were imported as data layers into the ArcMap software. Linear rugosity, surface complexity and slope were obtained using the functional surface toolset available with the 3D Analyst license. For linear rugosity, five polylines (straight lines, each approximately 20-m in length) were haphazardly drawn on each DEM avoiding the edge of the DEM where the amount of image overlap tended to be less than that in the central area. ArcMap’s add surface information tool was used to add surface information (e.g., shape distance, surface distance and the minimum, maximum and average slope) to each polyline and the ratio of the surface distance and shape distance was calculated. The mean of the ratios from the five polylines was used as a measure of linear rugosity for each DEM. For surface complexity and slope, five rectangular polygons of an approximately 8-m2 area (for a total of 40-m2 area) were haphazardly digitized on a DEM avoiding the edge of the DEM, and surface information was added to each polygon. Surface complexity for the DEM was calculated as the ratio of the total 3D surface area of the five polygons to the total 2D surface areas of the five polygons. Slope was calculated as the mean of the average slope values in the attribute table of the polygons.
Three-dimensional topographic features, including curvature and viewshed, were calculated using the surface toolset available with the Spatial Analyst license. Each DEM was first clipped with the five polygons that were used to obtain surface complexity and slope. Curvature values (planform curvature and profile curvature) were obtained with the curvature tool using the clipped DEM as the input raster and taking the mean values from the layer properties of two output raster layers. Viewshed values (viewshed visible area and non-visible area) were also obtained with the viewshed tool by using the clipped DEM as the input raster. Five observer points were digitized on the centers of each of the five polygons and then used to calculate the spatial area that could be seen from the observer points (visible) and the area that could not be seen from any points (non-visible).
The Benthic Terrain Modeler [25] was used to obtain the slope, terrain ruggedness (VRM) and the surface area to planar area ratio. For each of the three BTM variables, the clipped DEM was used as an input bathymetry raster and the mean value was taken from the layer property of the output raster created by the respective BTM function.

2.3.2. R Procedure

The aggregate function in the raster package was utilized to remove the edge of a DEM by aggregating the DEM to either a 64- or 128-cm resolution. Specifically, the aggregate function with an aggregation factor n would produce a cell containing a null value if any of the n × n cells being aggregated were outside the extremity of the DEM. After removing these cells with null values from the aggregated raster layer and converting the raster to a polygon, it was used to clip the original DEM (1-cm resolution), thereby removing the edge. As clipping DEMs with polygons created at a 128-cm aggregation generally removed too much area (see the Result section for details), the surface complexity, slope and curvature were calculated using DEMs clipped with polygons created at a 64-cm aggregation (Text S1).
Surface complexity was obtained as the ratio of the 3D surface area along reef contours to the 2D surface (planar) area. The three-dimensional surface area was calculated using the surfaceArea function in the sp package. Slope and curvature were calculated using the surface properties of the raster cells in 3 × 3 windows, as in the ArcMap’s surface toolset available with the Spatial Analyst license (Text S2, also see the ArcMap tool Reference [31] and the References therein [32,33] for details). For measures of curvature, the profile curvature and planform curvature were calculated as described in Zevenbergen and Throne [33].
Fractal dimension has been previously suggested as a matric for quantifying the shapes of corals or structural complexity of coral reefs [15,34,35,36]. Fractal dimension (D) was calculated as D = 2 − slope logS(δ)/log(δ), in which δ is a resolution of the raster and S(δ) is the 3D surface area at the given resolution [15]. Therefore, calculating the fractal dimension required changing the resolution of the DEMs using the aggregate function. Two separate calculations were done for each DEM, one changing the resolutions from 1 cm to 2, 4, 8, 16, 32 and 64 cm (D64), and the other changing the resolutions from 1 cm to 2, 4, 8, 16, 32, 64 and 128 cm (D128). The two maximum aggregations of 64 cm and 128 cm were chosen based on preliminary investigations where we examined the decreases in 3D surface areas with increases in the aggregation factors (i.e., decrease in resolutions). In theory, fractal dimension remains the same across different spatial scales as the relationship between log(δ) and logS(δ) is linear [34]. (i.e., The slope of log(δ) and logS(δ) is a constant.) In our case where we investigate habitat metrics within a limited spatial area, working from small to large scales, however, the 3D surface area starts approaching an asymptote as it approaches the 2D planar area because the 3D surface area cannot be smaller than the 2D planar area. The maximum aggregations, thus, needed to be chosen to minimize the effect of the change in the slope. DEMs clipped with polygons created at a 64-cm aggregation and a 128-cm aggregation were used to obtain D64 and D128, respectively.

3. Results

In total, the divers collected overlapping photographs from 92 sites in the NWHI, with images from 85 sites achieving complete alignment and producing 3D models and DEMs for analyses of the habitat structure. Ground sampling distances (resolution/pixel) of the 3D models generated in Agisoft Photoscan ranged from 0.00026 to 0.00084 m/pixel, with errors of 0.5–2.3 pixels, confirming that the designated resolution of 0.01 m (1 cm) for DEMs was within the range of model accuracy. The coverage areas of the 85 DEMs ranged from 57.5 to 284.2 m2, with a mean coverage of 142.3 m2 (Table 3); 78% of the DEMs had coverage between 100 and 200 m2. Imagery from the seven sites that did not have complete alignment contained photographs that had a relatively low overlap (visual estimation of less than 50%) with others. These alignment issues produced gaps in the resulting 3D point clouds, so these sites were not included in the present study.
DEMs clipped with polygons to remove the edges retained, on average, 76% of the planar areas of the original DEMs for the 64-cm aggregation, and 54% of the planar areas for the 128-cm aggregation (Table 3). For DEMs clipped with a 64-cm aggregation, retention of the planar areas ranged from 54% to 86%, with 14 DEMs retaining less than 70%. For DEMs clipped with a 128-cm aggregation, retention of the planar areas ranged from 19% to 73%, with 54 DEMs retaining less than 60% of the original planar areas.
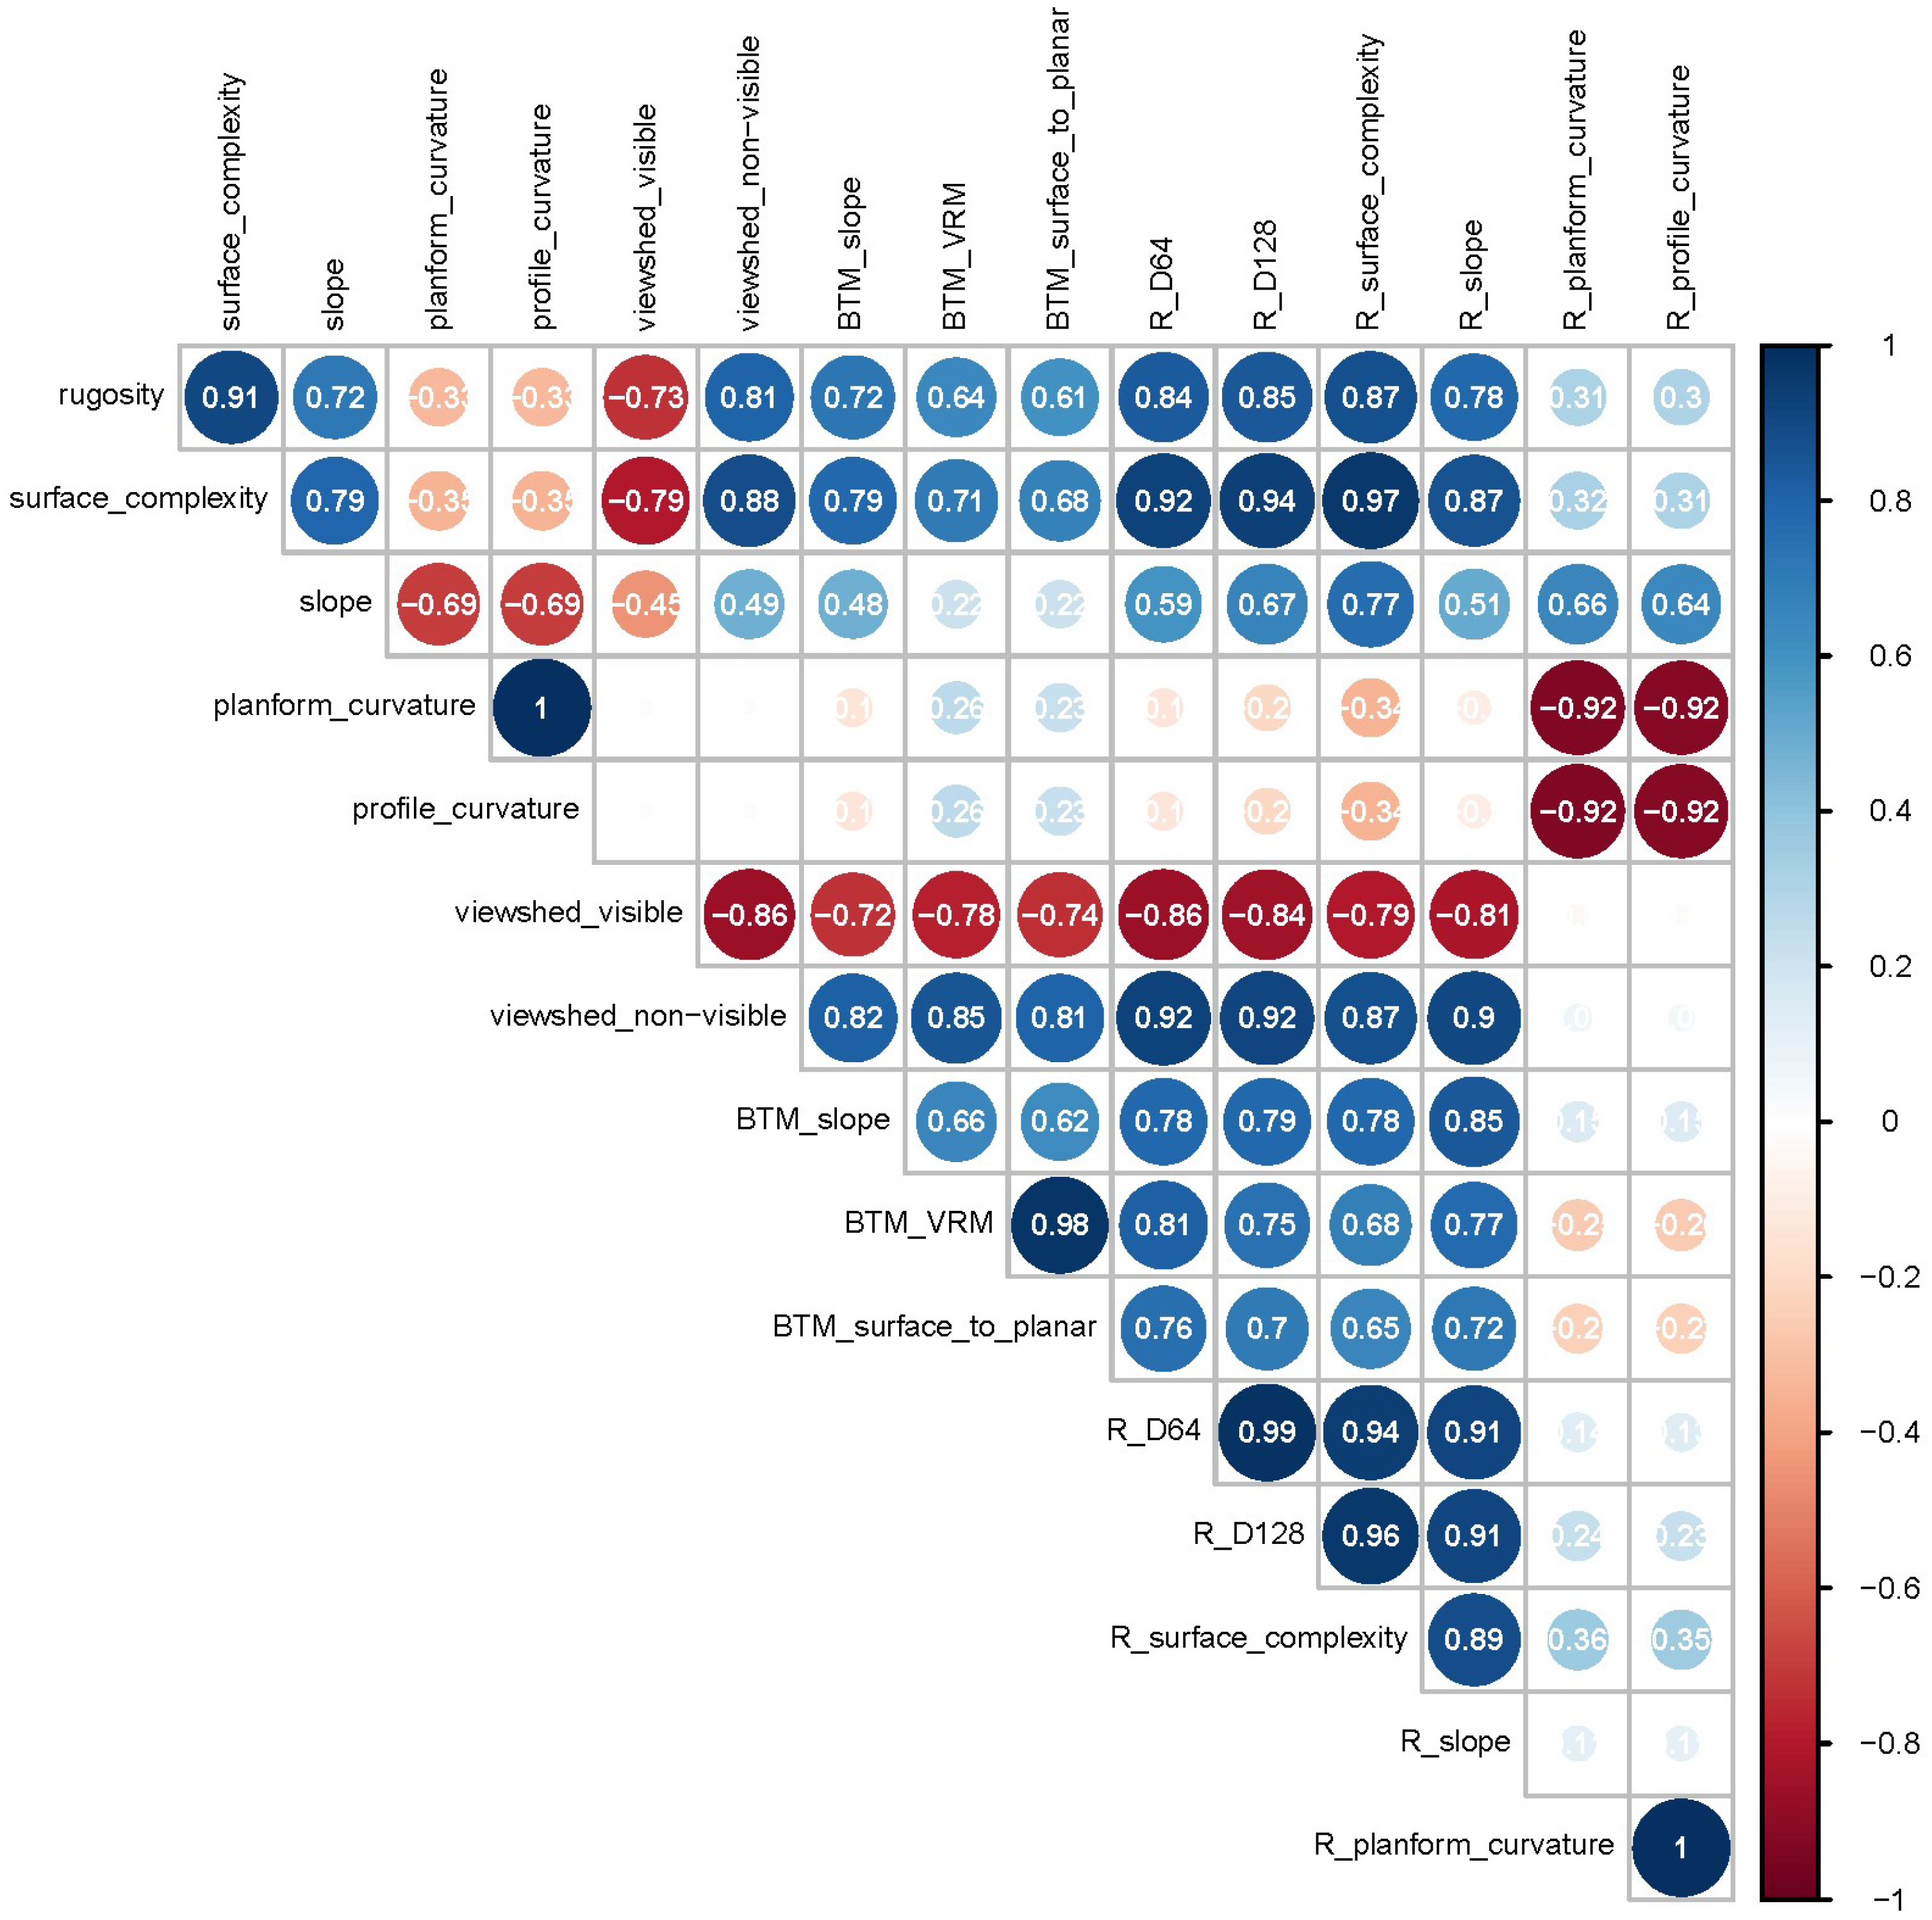
Strong correlations were detected between many of the habitat metrics quantified using ArcMap and R (Figure 2). For example, the linear rugosity obtained using the ArcMap’s functional surface toolset had strong correlations (|ρ| ≥ 0.75) with the surface complexity obtained using the functional surface toolset and viewshed (non-visible) obtained using the surface toolset, as well as fractal dimension, surface complexity and slope calculated in R. Similarly, the VRM and the surface area to planar area ratio obtained using the BTM in ArcMap were strongly correlated with each other and they also had relatively strong correlations (|ρ| ≥ 0.65) with the fractal dimension, surface complexity and slope calculated in R and the viewshed obtained using the surface toolset. Planform curvature and profile curvature had the correlation of ≈ 1, whether they were obtained in ArcMap or R, and the curvatures obtained in ArcMap had strong negative correlations (ρ = −0.92) with curvatures obtained in R. These curvature measures did not have strong correlations with other complexity variables, with the exception of the slope obtained using the functional surface toolset in ArcMap.
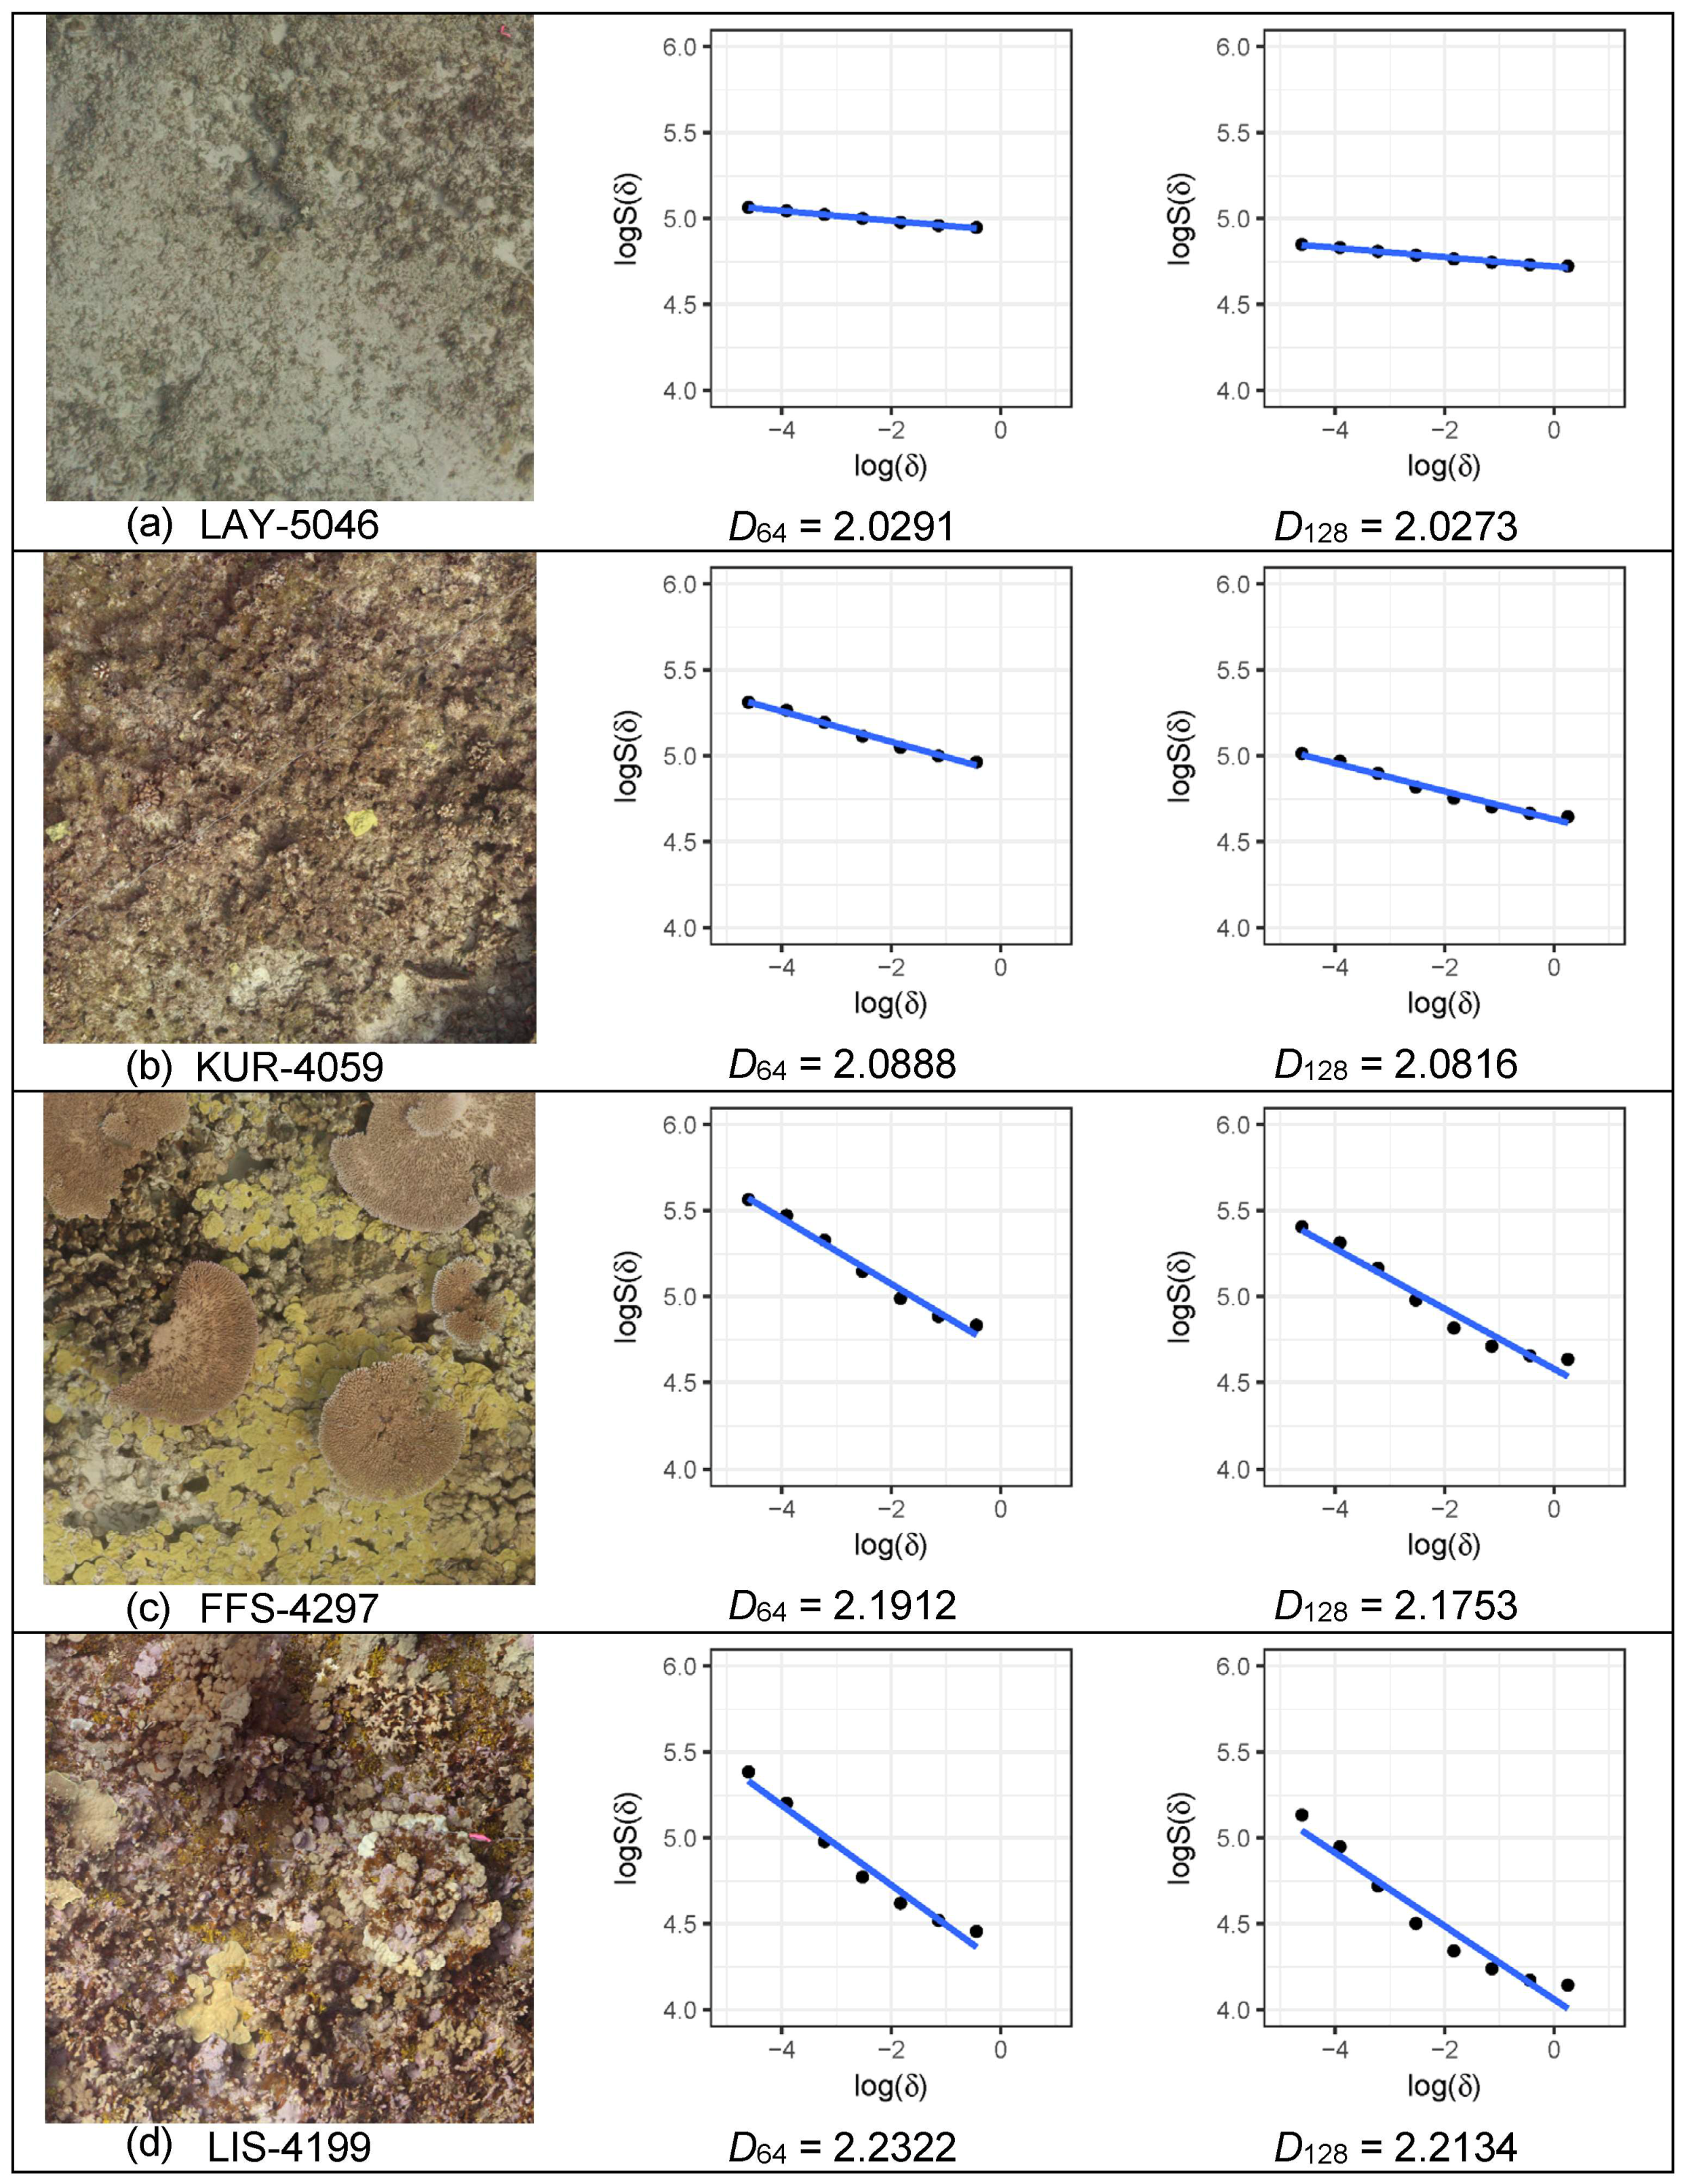
Values of the fractal dimension ranged from 2.029 to 2.249 for D64 and 2.026 to 2.230 for D128, with larger values corresponding to higher structural complexity of the habitat (Figure 3). The generally lower values of D128 in comparison to D64 were due to the inclusion of data at the 128-cm aggregation, resulting in a gentler slope in some cases as values of the 3D surface areas approached the values of their 2D planar areas (e.g., FFS-4297 and LIS-4199 in Figure 3). However, the two fractal dimensions, D64 and D128, had a high correlation of ρ = 0.99. They also had relatively strong correlations (|ρ| ≥ 0.7) with all other habitat metrics, with the exception of the curvature measures and slope obtained using the functional surface toolset. While D128 had slightly higher correlations with rugosity, surface complexity and slope than D64, D64 had higher correlations with the VRM and the surface area to planar area ratio obtained using the BTM than D128.

4. Discussion

This study utilized photogrammetric techniques to create 3D reconstructions of coral reef habitats in the NWHI. Multiple metrics of habitat structure were extracted from the resulting DEMs to establish a procedure for time-efficient characterization of benthic habitats that can accompany the Monument’s reef fish monitoring survey. The amount of time required for divers to complete image acquisition at each site was approximately 10 min, although the time requirement varied slightly depending on the presence/absence of current and surge, with surge being more disruptive than current. Given the amount of information we could extract from the resulting 3D models (e.g., habitat metrics as described in the present study, distribution of benthic species and 3D volume), we considered the 10-min timeframe cost-effective, although the exact amount of time required to obtain the same information in situ would depend on individual surveyors and habitat types. Nonetheless, the relatively quick timeframe required to complete the image acquisition provided the divers with ample time to complete all fish surveys, highlighting that the workflow for 3D mapping described here is a viable method to be integrated into reef fish surveys during annual monitoring expeditions.
The metrics for the 3D habitat structure obtained in the present study generally correlated well with one another, with the exception of the curvature measures, indicating that complexity and curvature measures should be treated separately when quantifying benthic habitat. Correlations between viewshed and other measures of structural complexity were somewhat unexpected but explicable, as the amount of area that is visible or not visible from observer points would be affected by terrain heterogeneity. Among all the metrics examined, fractal dimension, especially D64, had the best correlations with other measures of habitat complexity computed using both R and ArcMap. Unlike all other habitat metrics calculated using DEMs at a 1-cm resolution, fractal dimension combined information obtained at various spatial scales (i.e., 3D surface areas of DEMs at different resolutions in our case), allowing for the quantitative characterization of the habitat structure as a whole [36]. While the calculation of fractal dimension required changing resolutions of each DEM from 1 to 2, 4, 8, 16, 32, 64 and 128 cm, this was achieved relatively quickly in R using the aggregate function in the raster package. Overall, processing DEMs in R required time to write all the scripts, but once they were written, it automated the whole process, from importing image files to changing resolutions, obtaining different habitat metrics and exporting data as a data frame all at once. In ArcMap, the same analysis would have required, for each survey site, manually processing each of the DEMs at different resolutions to obtain 3D surface areas and manually compiling the data from different resolutions to calculate fractal dimension. This advantage of speed and automation, as well as the high correlations between fractal dimension obtained in R and the metrics obtained in ArcMap, demonstrated the high efficiency of the fractal analysis in R relative to the manual approach in ArcMap.
Measures of rugosity (i.e., linear rugosity and 3D surface complexity) had a correlation of >0.85 when either the functional surface toolset in ArcMap or R was used. On the other hand, the surface area to planar area ratio and the VRM obtained using the BTM had much lower correlations with these values. Although these metrics obtained in the BTM measured terrain heterogeneity, they were calculated for each raster cell using the 3 × 3 neighborhood [25], instead of examining the total 3D distance/area versus the total planar distance/area of a DEM. Similarly, the slope calculated using the BTM (BTM slope) and R (R slope) had a strong correlation of 0.85, but they both had correlations of ~0.5 with the slope calculated using the functional surface toolset in ArcMap. This was also likely due to differences in how these values were calculated; BTM slope and R slope were calculated in the same way using a moving 3 × 3 window, while the slope from the functional surface toolset was measured in grade (the tangent of the angle of a surface). It is also interesting to note that the slope in the functional surface toolset had stronger correlations with measures of rugosity, as well as the planform and profile curvatures, than with either the BTM slope or R slope (Figure 2). This emphasized the importance of understanding the underlying mathematical equations for each function when obtaining habitat metrics using a software package. The variability in strength of correlations among these metrics warrants future investigation into how each metric, or combination of metrics, is associated with benthic cover, and ultimately, with the structure of reef fish assemblages.
Profile curvature and planform curvature measure curvature in two different directions: profile curvature in the direction of slope and planform curvature in the direction that is transverse to the slope [33]. Therefore, it was surprising that these two curvature measures had a correlation of ≈1 in both ArcMap and R. Profile curvature and planform curvature values were obtained for every raster cell of a DEM and were subsequently averaged. Therefore, the correlation of ≈1 between these variables means that curvature parallel to slope and curvature perpendicular to slope were the same when they were averaged across the entire coral reef area at each survey site. As curvature measures the rate of change in slope gradient and direction [33], averaging all the cell values to represent each survey area may be an oversimplification for such non-static variables. Rather, examining the range and/or distribution of the curvature values for each DEM may be more useful for assessing structural dynamics of coral reef habitats. Curvature is also strongly affected by resolutions of DEMs [37]. While obtaining curvature values at a 1-cm resolution is particularly useful when comparing structural complexity of coral species [13], using lower resolutions (larger cell sizes) should also be considered depending on the spatial scale of interest. Finally, the negative correlations observed between the profile and planform curvature values obtained in ArcMap and R were due to changes in the plus/minus signs in front of the respective equations in ArcMap [38,39]. As there are many different equations for curvature that are implemented in different software packages, with some inconsistent usage of the plus/minus signs as observed in the present study [38,39], one should use caution when interpreting curvature values.
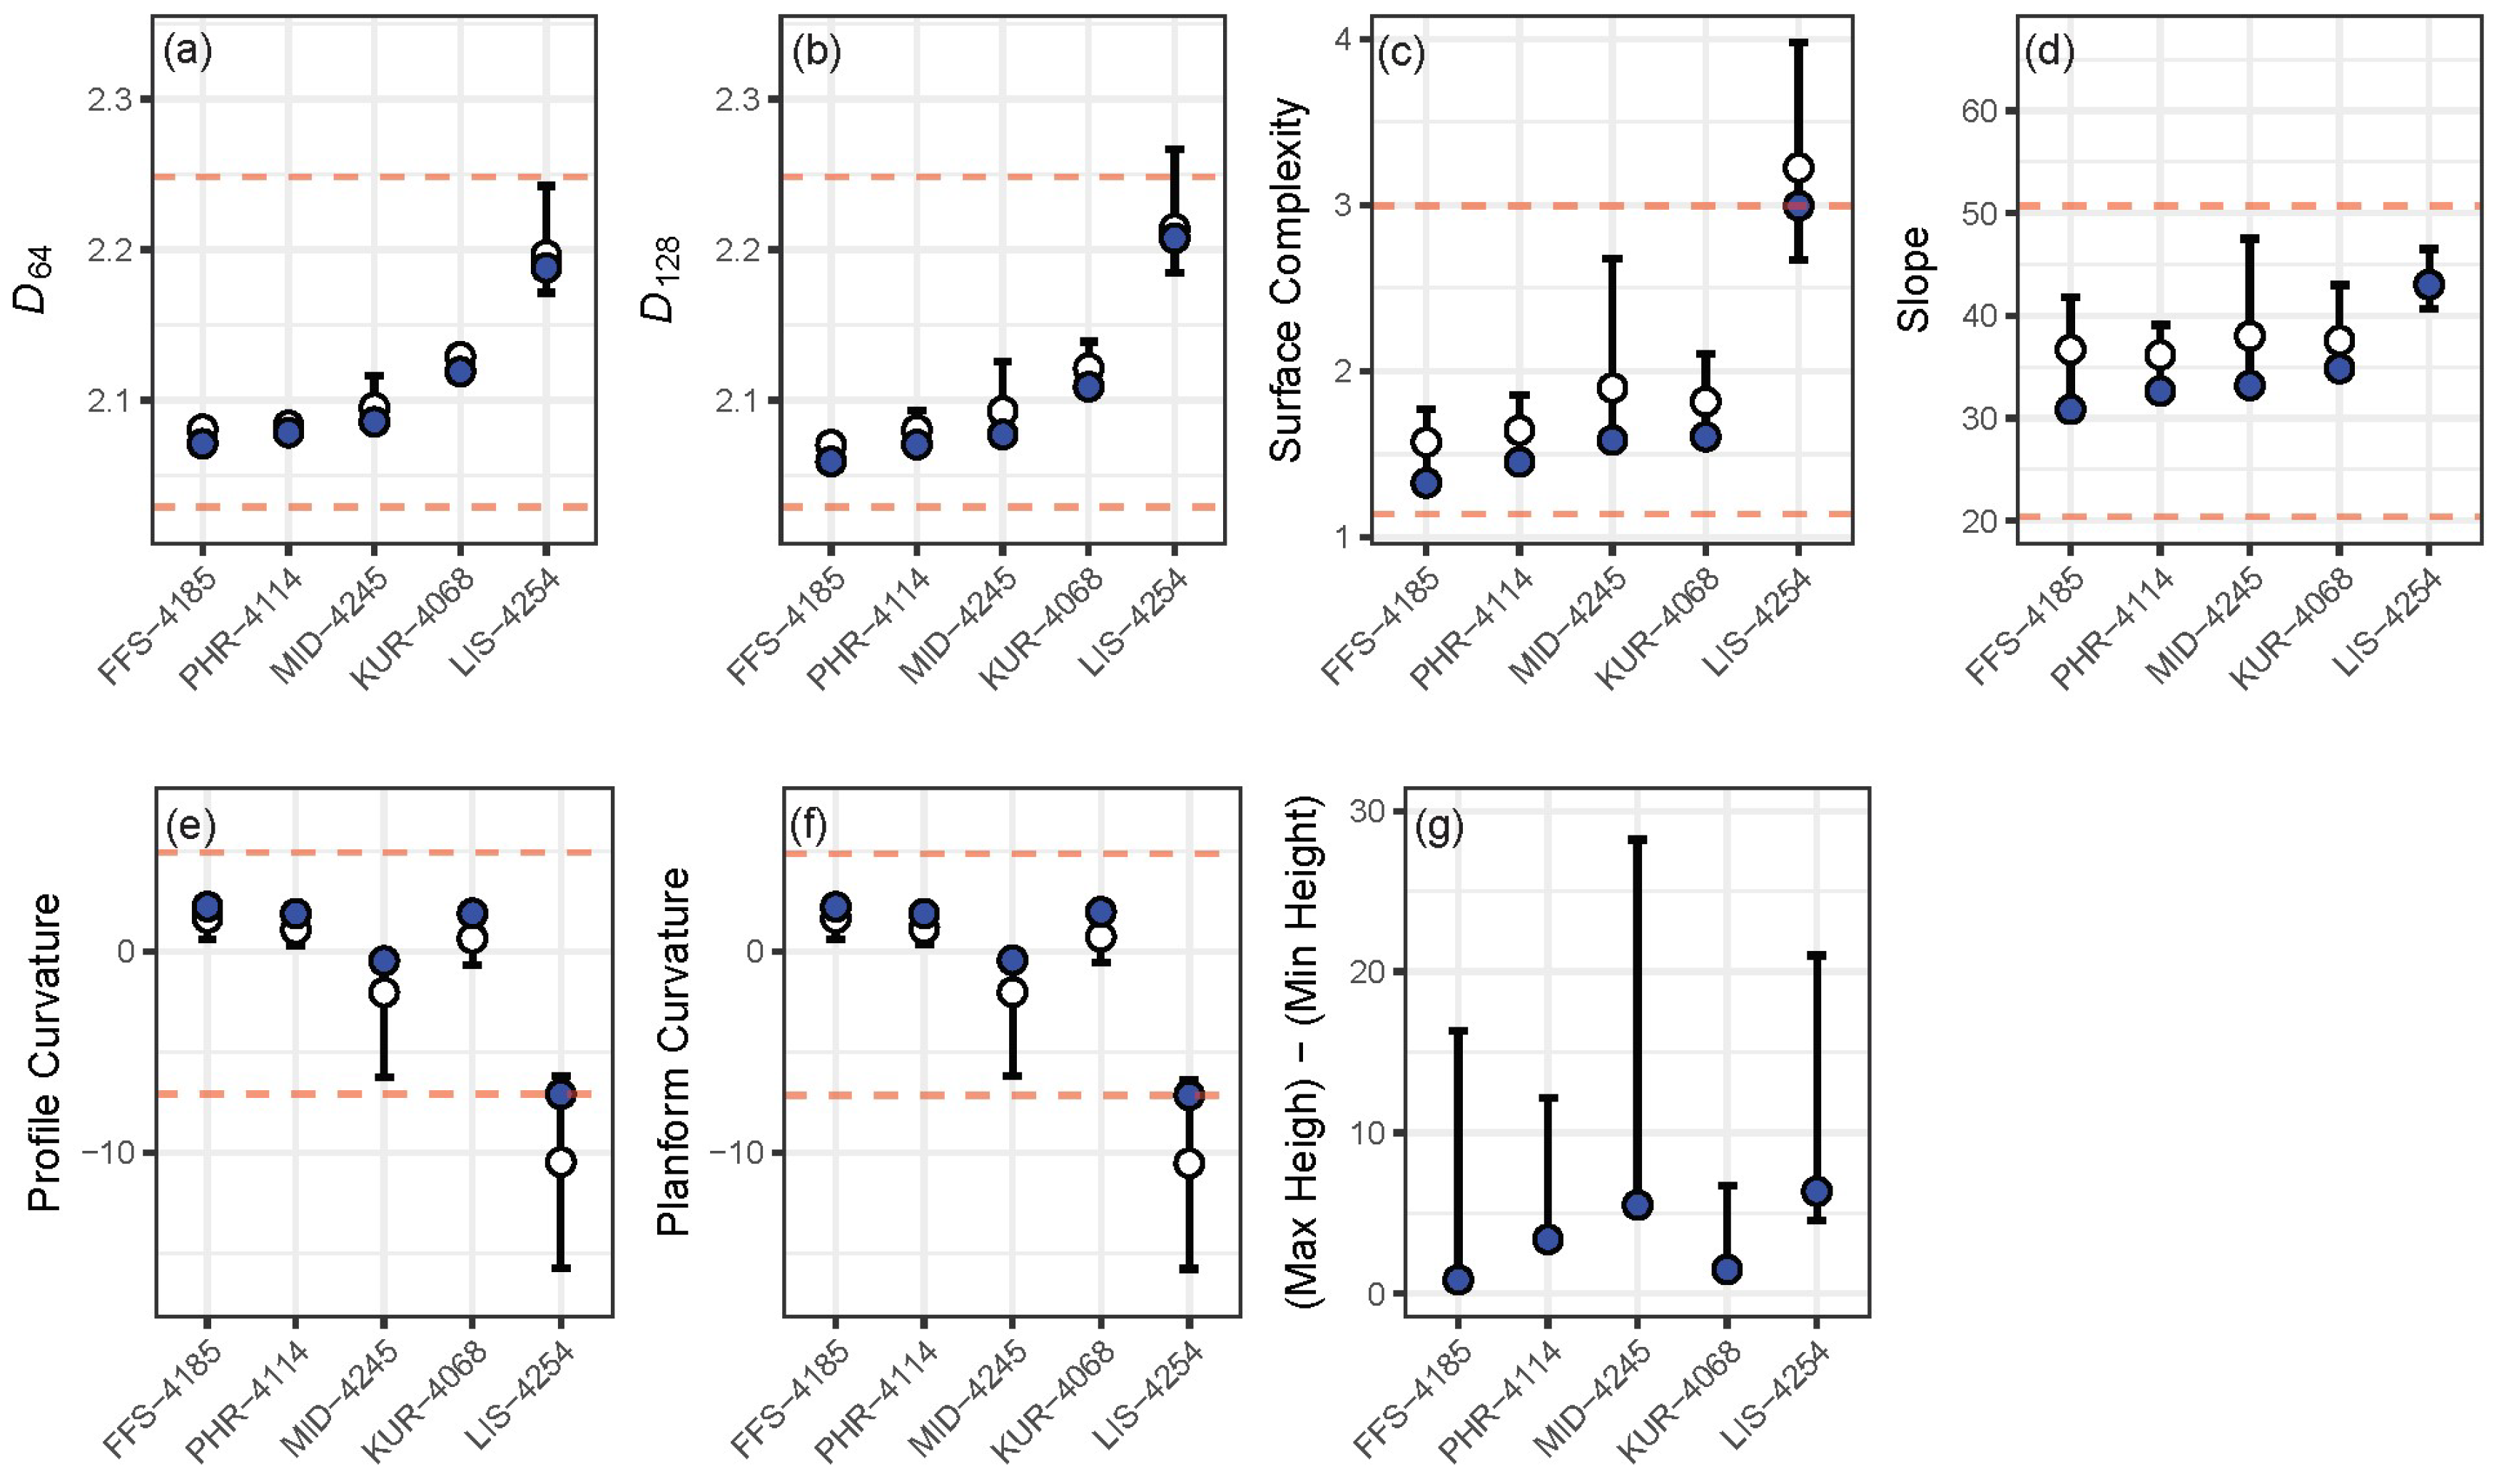
Placing the GCP unit on a completely flat surface prior to image acquisition in the field was difficult due to the complex structure of the benthos. This often resulted in the placement of GCPs where the axes between the GCPs were not parallel along the depth contour of the substrate. Even in these cases, scaling of the 3D models was still correct, but the models became tilted in relation to the contour of the benthic substrate. This tilting of the 3D models required some caution when exporting the DEMs, and in some cases, the models needed to be rotated to ensure the exported DEMs had x and y values corresponding to the horizontal distances along the survey isobath, and z-values corresponding to the planar (overhead “birds-eye-view”) angle from which the images were taken. In order to investigate the effects of this model “tilting” on habitat metrics, we performed a post-hoc analysis after randomly choosing 3D models from five sites and haphazardly rotating each of the five models in six different ways in Agisoft PhotoScan. After each rotation, a DEM was exported using the planar projection with “current view” as a projection plane and it was processed in R for fractal dimension, surface complexity, slope, profile curvature and planform curvature. The rotations were done in the extreme in some cases, as observed by the changes in the range of minimum and maximum heights of DEMs (Figure 4g). While it would be unlikely for models with such levels of “tilting” to go unnoticed and be processed further without any corrections, we wanted to test the degree to which tilting of the models affected the resulting metrics of the habitat structure. The rotations did affect the habitat metrics, with sites with higher complexity generally being more affected than sites with lower complexity (Figure 4). Among fractal dimension, surface complexity and slope, fractal dimension had the least amount of changes in the values after rotations (within each site) relative to the ranges of values observed from the 85 sites, although the change was still relatively high for the manually tilted site with the highest habitat complexity (Figure 4a–d). Future studies employing underwater 3D reconstruction techniques on coral reefs should ensure that an adequate number of GCPs are used and that the relative depths of the GCPs are recorded to validate the correct model orientation. As the quality of habitat metrics obtained from DEMs depends on the accuracy of the DEMs, the benefits of having ample GCPs dispersed throughout the study plot and accurately recording the depth of each GCP greatly outweigh the cost of the additional time and effort for divers.
The benthic survey using photogrammetric techniques and the subsequent extraction of habitat metrics described here can be used with any ecological monitoring programs that require high-resolution data on reef habitat structures. Image collection simply using two swaths along a transect line with two or more GCP units is time-efficient, and the resulting models have sufficient accuracy for extraction of habitat metrics. The use of fractal dimension as a single measure of habitat complexity can simplify and streamline post-survey data processing. This is particularly important if a large number of sites are periodically surveyed and image processing to obtain data needs to keep up with an influx of photographs from survey sites. It also frees up some time if the 3D models are used to obtain other benthic characteristics, such as 3D volume or distributions of benthic species. Further investigations into curvature measures should consider relevant spatial scales and focus on obtaining variables that can complement fractal dimension in characterizing a reef habitat, using DEMs with appropriate resolutions if necessary.

Supplementary Materials

The following are available online at https://www.mdpi.com/2077-1312/7/2/27/s1, Text S1: R code for processing DEMs, including calculation of the fractal dimension, Text S2: R code for a custom function to obtain the slope and curvature.

Author Contributions

Conceptualization, A.F. and J.H.R.B.; methodology, A.F. and J.H.R.B.; validation, A.F. and J.H.R.B.; formal analysis, A.F.; programming, A.F.; investigation, A.F., J.H.R.B., and B.K.C.; resources, J.H.R.B. and R.K.K.; data curation, A.F. and J.H.R.B.; writing—original draft preparation, A.F.; writing—review and editing, A.F., J.H.R.B., B.K.C., and R.K.K.; visualization, A.F.; supervision, A.F., J.H.R.B., and R.K.K.; project administration, R.K.K.; funding acquisition, J.H.R.B., and R.K.K.

Funding

This work was funded by NOAA’s Office of National Marine Sanctuaries, through the Papahānaumokuākea Marine National Monument, and by the National Science Foundation under the CREST-PRF Award #1720706 and EPSCoR Program Award OIA #1557349 to J. Burns.

Acknowledgments

We thank the officers and crew of NOAA ship Hi‘ialakai for logistic support and field assistance and J. Leonard and J. Asher for the collection of imagery. We also thank the three anonymous reviewers who improved the manuscript through their input. K. Fujii prepared the map of the Hawaiian Archipelago. B. Craig was supported by NOAA Ernest F. Hollings Scholarship during this project. The scientific results and conclusions, as well as any views or opinions expressed herein, are those of the authors and do not necessarily reflect the views of NOAA or the Department of Commerce.

Conflicts of Interest

The authors declare no conflict of interest.

References

  1. McGehee, M.A. Correspondence between assemblages of coral reef fishes and gradients of water motion, depth, and substrate size off Puerto Rico. Mar. Ecol. Prog. Ser. 1994, 105, 243–255. [Google Scholar] [CrossRef]
  2. Floeter, S.R.; Krohling, W.; Gasparini, J.L.; Ferreira, C.E.L.; Zalmon, I.R. Reef fish community structure on coastal islands of the southeastern Brazil: The influence of exposure and benthic cover. Environ. Biol. Fish. 2007, 78, 147–160. [Google Scholar] [CrossRef]
  3. Friedlander, A.M.; Parrish, J.D. Habitat characteristics affecting fish assemblages on a Hawaiian coral reef. J. Exp. Mar. Biol. Ecol. 1998, 224, 1–30. [Google Scholar] [CrossRef]
  4. Jones, G.P.; Syms, C. Disturbance, habitat structure and the ecology of fishes on coral reefs. Austral Ecol. 1998, 23, 287–297. [Google Scholar] [CrossRef]
  5. Gratwicke, B.; Speight, M.R. The relationship between fish species richness, abundance and habitat complexity in a range of shallow tropical marine habitats. J. Fish Biol. 2005, 66, 650–667. [Google Scholar] [CrossRef]
  6. Pittman, S.J.; Costa, B.M.; Battista, T.A. Using lidar bathymetry and boosted regression trees to predict the diversity and abundance of fish and corals. J. Coast. Res. 2009, 25, 27–38. [Google Scholar] [CrossRef]
  7. Komyakova, V.; Munday, P.L.; Jones, G.P. Relative importance of coral cover, habitat complexity and diversity in determining the structure of reef fish communities. PLoS ONE 2013, 8, e83178. [Google Scholar] [CrossRef]
  8. Connell, J.H. Disturbance and recovery of coral assemblages. Coral Reefs 1997, 16, S101–S113. [Google Scholar] [CrossRef]
  9. Loya, Y.; Sakai, K.; Yamazato, K.; Nakano, Y.; Sambali, H.; van Woesik, R. Coral bleaching: The winners and the losers. Ecol. Lett. 2001, 4, 122–131. [Google Scholar] [CrossRef]
  10. Couch, C.S.; Burns, J.H.R.; Liu, G.; Steward, K.; Gutlay, T.N.; Kenyon, J.; Eakin, C.M.; Kosaki, R.K. Mass coral bleaching due to unprecedented marine heatwave in Papahānaumokuākea Marine National Monument (Northwestern Hawaiian Islands). PLoS ONE 2017, 12, e0185121. [Google Scholar] [CrossRef] [Green Version]
  11. Bellwood, D.R.; Hughes, T.P.; Folke, C.; Nyström, M. Confronting the coral reef crisis. Nature 2004, 429, 827–833. [Google Scholar] [CrossRef] [PubMed]
  12. Miller, S.L.; Shima, J.S.; Phillips, N.E. Effects of microhabitat availability on estimates of density of a reef fish: Implications for assessments of marine protected areas. Hydrobiologia 2012, 685, 173–190. [Google Scholar] [CrossRef]
  13. Burns, J.H.R.; Delparte, D.; Gates, R.D.; Takabayashi, M. Integrating structure-from-motion photogrammetry with geospatial software as a novel technique for quantifying 3D ecological characteristics of coral reefs. PeerJ 2015, 3, e1077. [Google Scholar] [CrossRef] [PubMed]
  14. Burns, J.H.R.; Delparte, D.; Kapono, L.; Belt, M.; Gates, R.D.; Takabayashi, M. Assessing the impact of acute disturbances on the structure and composition of a coral community using innovative 3D reconstruction techniques. Methods Oceanogr. 2016, 15–16, 49–59. [Google Scholar] [CrossRef]
  15. Young, G.C.; Dey, S.; Rogers, A.D.; Exton, D. Cost and time-effective method for multi-scale measures of rugosity, fractal dimension, and vector dispersion from coral reef 3D models. PLoS ONE 2017, 12, e0175341. [Google Scholar] [CrossRef] [PubMed]
  16. Leon, J.X.; Roelfsema, C.M.; Saunders, M.I.; Phinn, S.R. Measuring coral reef terrain roughness using ‘structure-from-motion’ close-range photogrammetry. Geomorphology 2015, 242, 21–28. [Google Scholar] [CrossRef]
  17. Agudo-Adriani, E.A.; Cappelletto, J.; Cavada-Blanco, F.; Croquer, A. Colony geometry and structural complexity of the endangered species Acropora cervicornis partly explains the structure of their associated fish assemblage. PeerJ 2016, 4, e1861. [Google Scholar] [CrossRef] [PubMed]
  18. Ferrari, R.; Bryson, M.; Bridge, T.; Hustache, J.; Williams, S.B.; Byrne, M.; Figueira, W. Quantifying the response of structural complexity and community composition to environmental change in marine communities. Glob. Chang. Biol. 2016, 22, 1965–1975. [Google Scholar] [CrossRef] [PubMed]
  19. Ferrari, R.; Figueira, W.F.; Pratchett, M.S.; Boube, T.; Adam, A.; Kobelkowsky-Vidrio, T.; Doo, S.S.; Atwood, T.B.; Byrne, M. 3D photogrammetry quantifies growth and external erosion of individual coral colonies and skeletons. Sci. Rep. 2017, 7, 16737. [Google Scholar] [CrossRef] [Green Version]
  20. Figueira, W.; Ferrari, R.; Weatherby, E.; Porter, A.; Hawes, S.; Byrne, M. Accuracy and precision of habitat structural complexity metrics derived from underwater photogrammetry. Remote Sens. 2015, 7, 16883–16900. [Google Scholar] [CrossRef]
  21. Raoult, V.; Reid-Anderson, S.; Ferri, A.; Williamson, J.E. How reliable is structure from motion (SfM) over time and between observers? A case study using coral reef bommies. Remote Sens. 2017, 9, 740. [Google Scholar] [CrossRef]
  22. Raoult, V.; David, P.A.; Dupont, S.F.; Mathewson, C.P.; O’Neill, S.J.; Powell, N.N.; Williamson, J.E. GoPros™ as an underwater photogrammetry tool for citizen science. PeerJ 2016, 4, e1960. [Google Scholar] [CrossRef] [PubMed]
  23. Fukunaga, A.; Kosaki, R.K. Use of multivariate control charts to assess the status of reef fish assemblages in the Northwestern Hawaiian Islands. PeerJ 2017, 5, e3651. [Google Scholar] [CrossRef] [PubMed]
  24. Williams, I.D.; Baum, J.K.; Heenan, A.; Hanson, K.M.; Nadon, M.O.; Brainard, R.E. Human, oceanographic and habitat drivers of central and western Pacific coral reef fish assemblages. PLoS ONE 2015, 10, e0120516. [Google Scholar] [CrossRef]
  25. Walbridge, S.; Slocum, N.; Pobuda, M.; Wright, D.J. Unified geomorphological analysis workflows with Benthic Terrain Modeler. Geosciences 2018, 8, 94. [Google Scholar] [CrossRef]
  26. R Core Team. R: A Language and Environment for Statistical Computing; 3.4.4; R Foundation for Statistical Computing: Vienna, Austria, 2018. [Google Scholar]
  27. Pebesma, E.J.; Bivand, R.S. Classes and methods for spatial data in R. R News 2005, 5, 9–13. [Google Scholar]
  28. Bivand, R.S.; Pebesma, E.; Gómez-Rubio, V. Applied Spatial Data Analysis with R, 2nd ed.; Springer: New York, NY, USA, 2013. [Google Scholar]
  29. Hijmans, R.J. raster: Geographic Data Analysis and Modeling, R package version 2.5-8; Geospatial and Farming Systems Research Consortium: Davis, CA, USA, 2016. [Google Scholar]
  30. Bivand, R.; Rundel, C. rgeos: Interface to Geometry Engine—Open Source (GEOS), R package version 0.3-23; Geospatial and Farming Systems Research Consortium: Davis, CA, USA, 2017. [Google Scholar]
  31. An Overview of the Surface Toolset. Available online: http://desktop.arcgis.com/en/arcmap/10.4/tools/spatial-analyst-toolbox/an-overview-of-the-surface-tools.htm (accessed on 8 November 2018).
  32. Moore, I.D.; Grayson, R.B.; Ladson, A.R. Digital terrain modelling: A review of hydrological, geomorphological, and biological applications. Hydrol. Process. 1991, 5, 3–30. [Google Scholar] [CrossRef]
  33. Zevenbergen, L.W.; Thorne, C.R. Quantitative analysis of land surface topography. Earth Surf. Process. Landf. 1987, 12, 47–56. [Google Scholar] [CrossRef]
  34. Basillais, É. Coral surfaces and fractal dimensions: A new method. Comptes Rendus Acad. Sci. Sci. De La Vie 1997, 320, 653–657. [Google Scholar] [CrossRef]
  35. Martin-Garin, B.; Lathuilière, B.; Verrecchia, E.P.; Geister, J. Use of fractal dimensions to quantify coral shape. Coral Reefs 2007, 26, 541–550. [Google Scholar] [CrossRef] [Green Version]
  36. Reichert, J.; Backes, A.R.; Schubert, P.; Wilke, T. The power of 3D fractal dimensions for comparative shape and structural complexity analyses of irregularly shaped organisms. Methods Ecol. Evol. 2017, 8, 1650–1658. [Google Scholar] [CrossRef]
  37. Shary, P.A.; Sharaya, L.S.; Mitusov, A.V. The problem of scale-specific and scale-free approaches in geomorphometry. Geogr. Fis. Dinam. Quat. 2005, 28, 81–101. [Google Scholar]
  38. Blaga, L. Aspects regarding the significance of the curvature types and values in the studies of geomorphometry assisted by GIS. Ann. Univ. Din Oradea Ser. Geogr. 2012, XXII, 327–337. [Google Scholar]
  39. Krebs, P.; Stocker, M.; Pezzatti, G.B.; Conedera, M. An alternative approach to transverse and profile terrain curvature. Int. J. Geogr. Inf. Sci. 2015, 29, 643–666. [Google Scholar] [CrossRef]
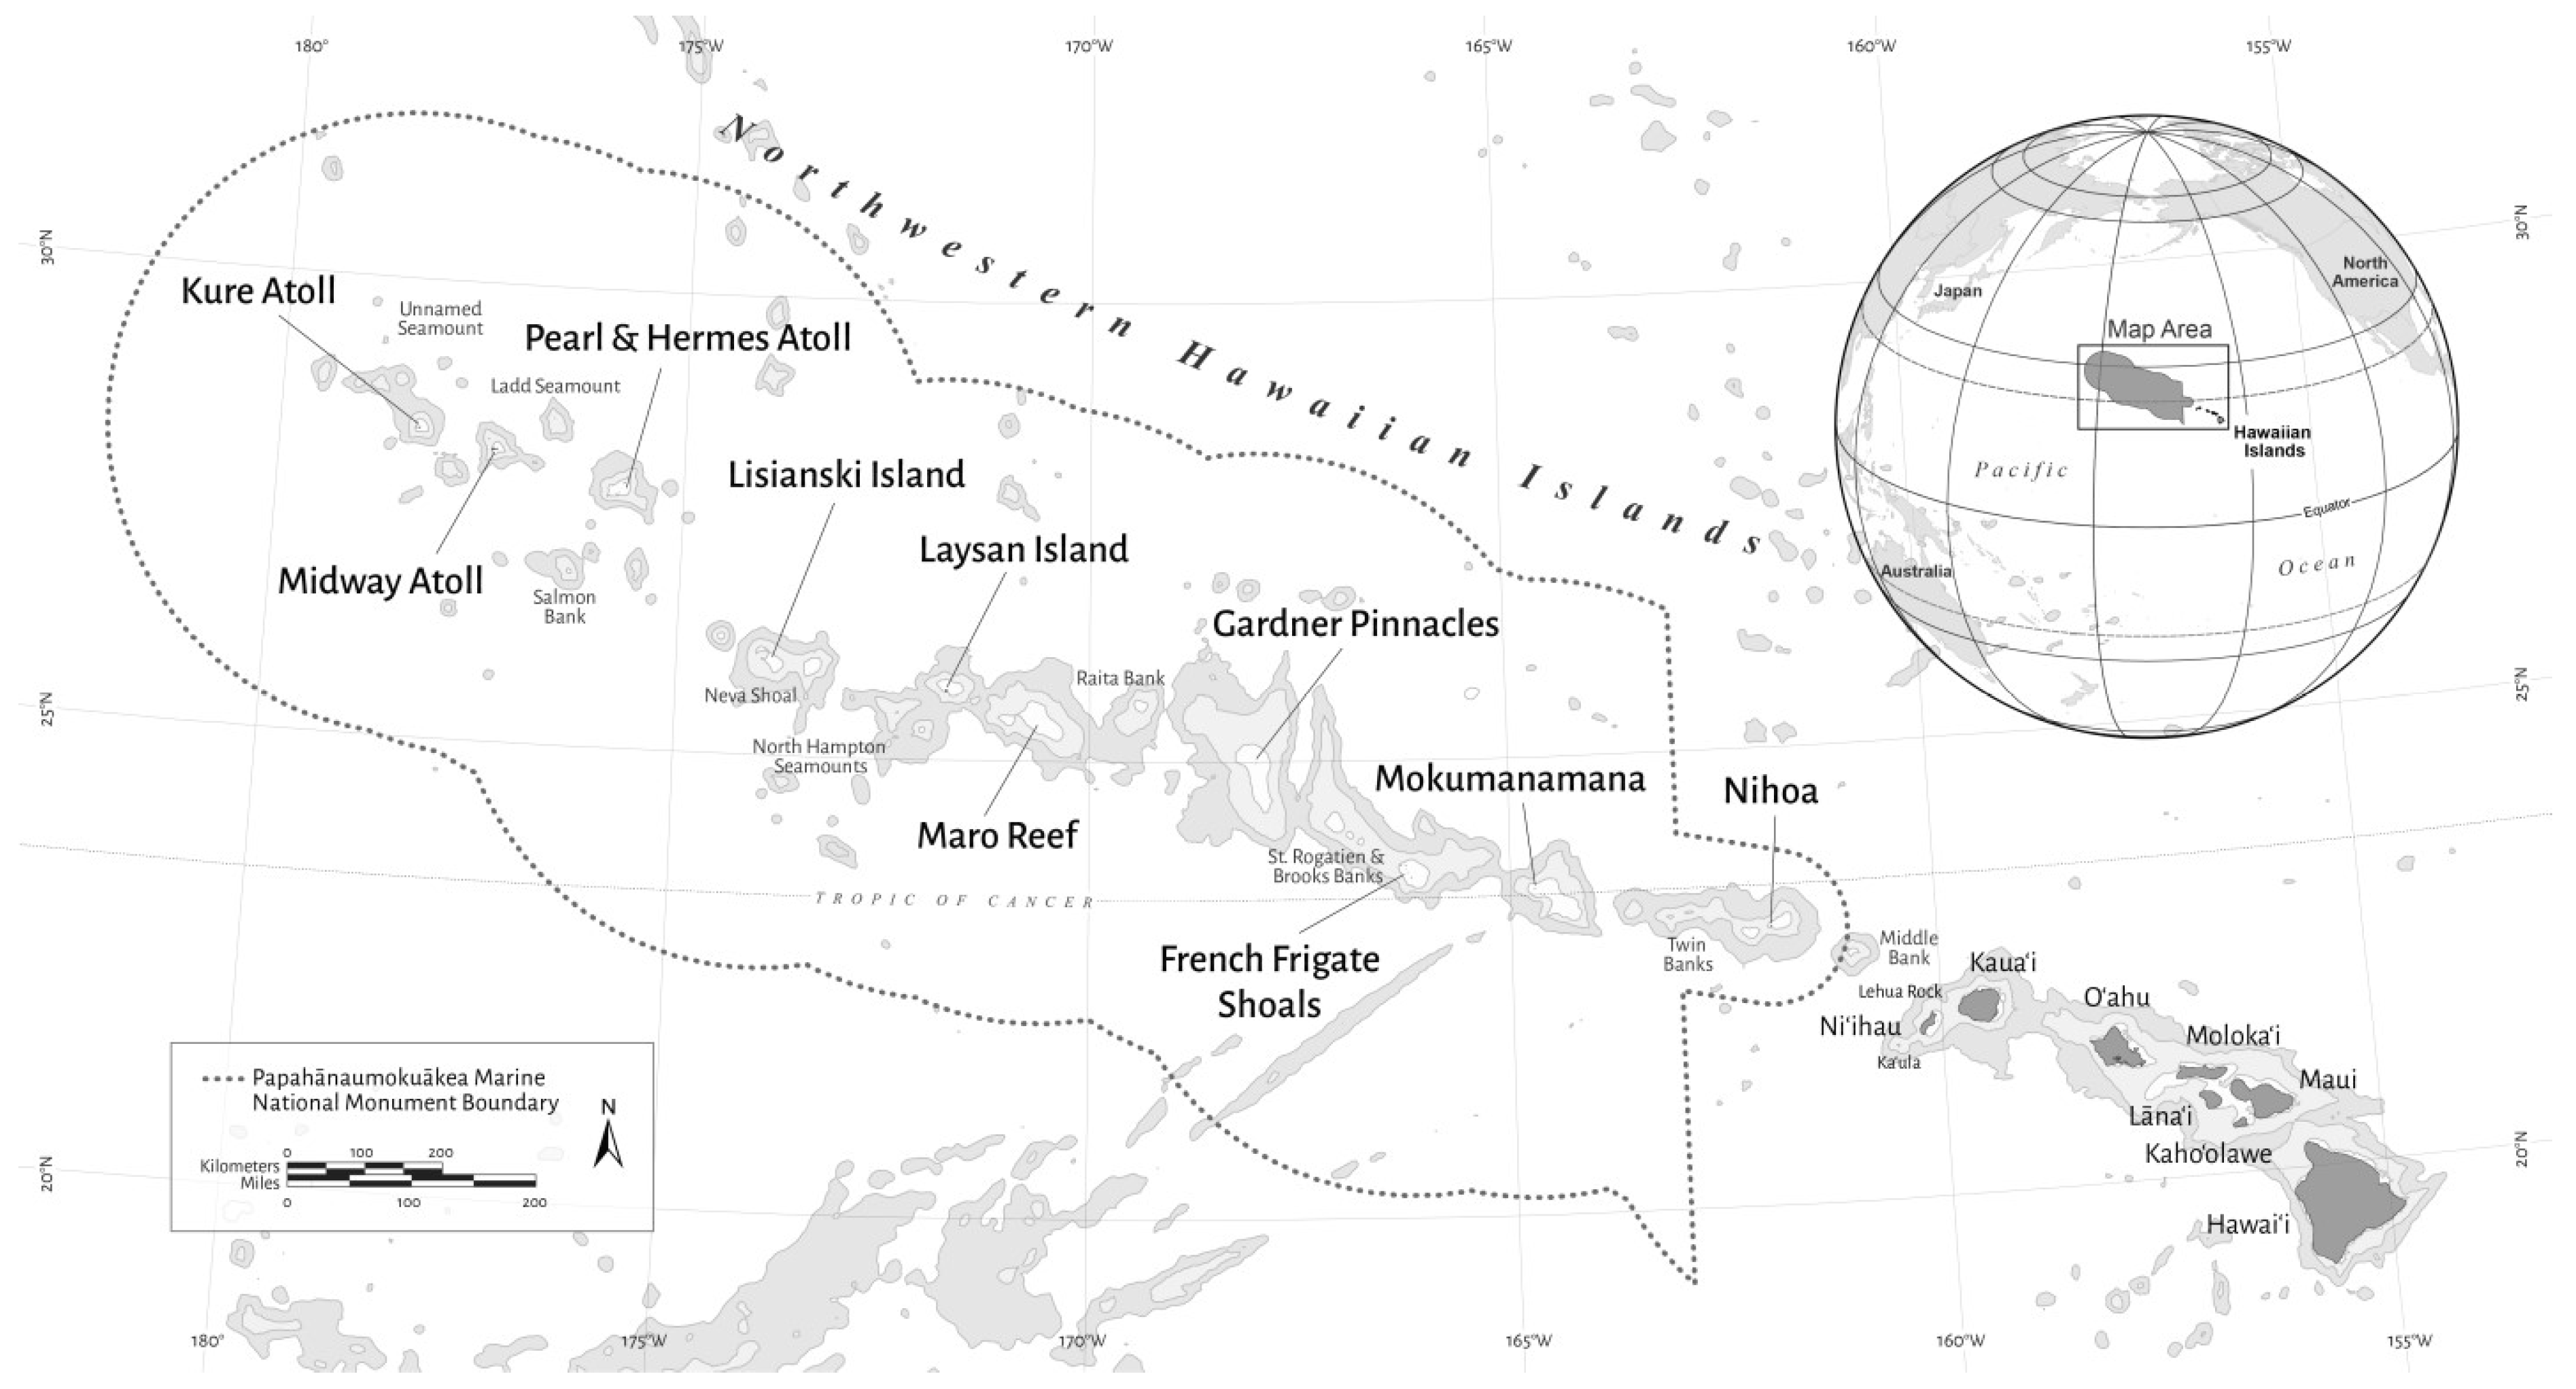
Figure 1. Map of the Hawaiian Archipelago, including the Northwestern Hawaiian Islands (NWHI). The boundary of the Papahānaumokuākea Marine National Monument is shown by the dotted line.
Jmse 07 00027 g001
Figure 2. Pearson correlation coefficients (ρ) between habitat metrics obtained using the ArcMap path distance toolset, ArcMap surface toolset, ArcMap BTM and R.
Jmse 07 00027 g002
Figure 3. Increases in the fractal dimension (D64, D128) with an increase in habitat complexity, using four sites from (a) Laysan (LAY), (b) Kure Atoll (KUR), (c) French Frigate Shoals (FFS) and (d) Lisianski Island (LIS) as examples.
Jmse 07 00027 g003
Figure 4. Habitat metrics calculated in R from five randomly chosen sites, showing (a) D64, (b) D128, (c) 3D surface complexity, (d) slope, (e) profile curvature and (f) planform curvature. The 3D models were haphazardly tilted in six different ways, generating six DEMs for each site. Habitat metrics were then calculated from each DEM. The blue circles show values before tilting. The bars show minimum and maximum values from the seven DEMs (one before titling and six tilted), with white circles showing the mean values. Red dotted lines show minimum and maximum values from the 85 sites, without tilting. Differences in the maximum heights and minimum heights, (Max Height)–(Min Height), of the DEMs are also shown (g) in reference to the extent of model tilting used in this post-hoc analysis.
Jmse 07 00027 g004
Table 1. Settings used to generate 3D models in Agisoft PhotoScan Professional (v. 1.4).
ProcessSettings
Align PhotosHigh accuracy, generic preselection enabled, 50,000 key point limit, 5000 tie point limit.
Optimize Camera Alignment(Use all the ones selected by the software.)
Build Dense CloudMedium quality, mild depth filtering, reuse depth maps disabled.
Build MeshArbitrary surface type, high face count, interpolation enabled, calculate vertex colors enabled.
Build TextureAdaptive orthophoto mapping mode, mosaic blending mode, texture size/count 16,384, enable hole filling.
Table 2. List of habitat metrics obtained and the variable names used in the present study. Software and a toolset/license for ArcMap used for each metric are also listed.
Habitat metricSoftware/LicenseVariable name
linear rugosityArcMap, Functional Surface/3D Analystrugosity
surface complexityArcMap, Functional Surface/3D Analystsurface complexity
RR surface complexity
slopeArcMap, Functional Surface/3D Analystslope
ArcMap, BTMBTM slope
RR slope
curvatureArcMap, Surface/Spatial Analyst

R
planform curvature
profile curvature
R planform curvature
R profile curvature
viewshedArcMap, Surface/Spatial Analystviewshed visible
viewshed non-visible
terrain ruggednessArcMap, BTMBTM VRM
surface area to planar area ratioArcMap, BTMBTM surface to planar
Fractal dimensionRR D64 (1 to 64 cm resolution)
R D128 (1 to 128 cm resolution)
Table 3. Results of clipping digital elevation models (DEMs) with polygons, showing the mean, SD (standard deviation), median, minimum and maximum values of the planar areas of the original DEMs (original planar area), planar areas after the 64-cm aggregation (Planar area ×64), planar areas after the 128-cm aggregation (Planar area ×128), percent retention of planar areas after the 64-cm aggregation (area retained ×64), and percent retention of planar areas after the 128-cm aggregation (area retained ×128).
-MeanSDMedianMin–Max
Original planar area (m2)142.3439.13143.2757.53–284.23
Planar area ×64 (m2)109.5737.00111.0038.50–243.30
Planar area ×128 (m2)80.7634.6481.9214.75–208.08
Area retained ×64 (%)75.616.3177.353.7–85.6
Area retained ×128 (%)54.3910.7157.019.2–73.2