1. Introduction
In recent years there has been a growing concern about the effects of climate change and the sustainable development of the economy, as well as the search for new and more sustainable energy sources. All these aspects, apart from other considerations, have increased the importance of using marine energies such as waves, currents, tides, etc. Offshore wind energy is one of the marine energies; although it can be considered that the resource is not exclusive to the marine environment, some documents consider it as a marine renewable energy because the facilities are installed in the sea. Not all marine energies are in the same state of development; for instance, wave energy converters are in general in initial stages of Technology Readiness Level (TRL), while the offshore wind sector can be considered at a commercial stage [
1].
Figure 1 [
2] represents, in Europe, the installed annual offshore wind power, with blue bars, and the cumulative power, with the red line, having reached 15,780 MW at the end of 2017. Including facilities with partial connection to the network, at the end of 2017 there were in Europe 92 offshore wind farms and 4,149 wind turbines connected to the network, located in 11 countries (
Table 1) [
2].
Worldwide, the picture changes a little, with the appearance of China in the third position of power installed, as well as with the prominent positions of Vietnam, Japan, South Korea, the United States, and Taiwan, with a total installed capacity worldwide of 18,814 MW (
Figure 2) [
3].
Figure 3 represents the basis of many discussions and decisions made in the offshore wind industry over the last decade. It can be seen that one or another type of foundation was recommended for wind turbines depending on the depth of the site. It is appreciated that until 20–25 m, the most interesting types were the gravity-based foundation or gravity-based structure (GBF or GBS) and the monopile; between 20–25 m and 40–50 m the most viable options were the tripod and the jacket; and for larger depths, floating supports appeared as an alternative, with important doubts about its future short-term implantation at the beginning of this decade [
4,
5].
Although the main typologies have not changed very much, there have been certain modifications in the sector in relation to foundations, such as the development of new typologies or the use of previously known typologies in the offshore oil and gas engineering as bucket foundations. When locations for offshore wind facilities around 40 m appeared, a competition began to position the different typologies in the new depth range. At first it seemed that the competition was going to be between the jacket and the tripod, with a prominent role of the first of them. Anyway, some proposals have appeared at these depths of large monopiles (XXL monopiles) as well as new GBS designs [
6,
7].
According to WindEurope’s report [
2] of the statistics of offshore wind in Europe at the end of 2017,
Figure 4 shows that the monopile is at the top of the classification, with 81.7%, followed by the jacket (6.9%), and the gravity foundation (6.2%), taking the floating platforms only seven representatives, being six of them SPARs and one of them semi-submersible.
Although offshore wind sector is in a commercial stage, there are still a lot of uncertainties about the design, construction, maintenance, etc. [
8]. Some of these uncertainties are related to the design of foundations; for instance, in the case of monopile foundations, it can be mentioned the scour, the hydrodynamic domains with current diameters and depths to which offshore wind farms are built, the difference in scale compared to conventional maritime piles, the liquefaction of the soil, the nonlinearity in the wave velocity field, etc. [
9,
10]. Among all the uncertainties, the scour around the pile can be emphasized [
11]. It should be noted that scour has proved to be a key element in the design and maintenance of these facilities, as it has been observed given the evolution of the scour hole around the structure. In some cases, an important evolution of the hole has been detected only some years after the construction of the facility. Consequently, it is one of the main concerns in the offshore wind farms and they have to pay special attention to its evolution in the O&M phase of the facilities.
If this is not addressed in a suitable way and just in time, the scour phenomenon can cause operational unavailability, changes in the natural frequencies of the soil-structure system [
12], fatigue life reduction [
13], and even in extreme cases the collapse of the structure [
14]. There is a significant need to advance in this field and therefore, it is very important to carry out some researches about scour.
There are two possible strategies to face this issue during the design of monopile foundations: (1) allowing the occurrence of the scour phenomenon, predicting the scour hole dimensions around the pile, it is the depth and length, when the scour has reached its equilibrium at medium-long term; so the design of the monopile is carried out considering the scour phenomenon is going to happen, and the existence of the hole is taken in to account in the design of the pile; (2) avoiding the occurrence of the scour phenomenon, by designing and installing an scour protection system around the monopile.
Both strategies must be accompanied by periodical monitoring campaigns of the scour around the structure, well only around the monopile in case of not having scour protection, or in the own scour protection, to validate its good working, and also around it. The strategy of using scour protection is the most common one up to now in the wind industry, having shown good results from the structural point of view, but driving some changes in local ecosystem [
15,
16]. Many studies consider expected scour [
17,
18] and some of them have demonstrated that it is more economical to increase the length of the piles to take into account the possible scour considering the strategy of allowing the scour phenomenon occurs. In addition, it is necessary to consider the scour in other structures of the installation as it is the case of the electrical cables in both the interarray and export cables.
There are different types of protection systems, being the most common ones: riprap, concrete mattress, geocontainers, or other more innovative as SSCC front mats [
19,
20,
21,
22] (
Figure 5), being the most usual and even sanctioned by experience the riprap one. Many researches are currently being carried out in relation to the design of scour protection systems.
Although the use of riprap as scour protection has proven to work well in maritime structures like breakwaters, quays, etc. there is not a clear formulation to be used for designing it in case of offshore wind farms. One of the key aspects in this design is the determination of the size and weight of the stones to be used in the upper part of the protection, it is the armour layer [
23]. Below the armour layer, it is usual to place a filter to prevent seabed natural material from escaping through the gaps between armour units.
Among the uncertainties detected that affect the design of foundations, it is important to highlight the importance of the choice of the scale used in the physical models, because scour formulas are obtained in laboratory tests [
10].
Regarding scour, there is much more experience in fluvial environment than in the marine one. However, with the development of the offshore wind industry, there has been a significant push in research about scour in recent years. Formulas used in fluvial engineering for the design of riprap weight and size are Isbash (1936) replace years with reference numbers, Shields (1936/77), MOP-54 (1936/75), Peterka (1958/66), Maynord (1970/88), Blaisell (1973), Breusers-Raudkivi (1977/91), Blogett-McConaughy (1981), HEC-11 (1989), Pilarczyk (1990/91), Escarameia/May (1992/98), etc., while formulas used for coastal structures are Cox/Campbell (1958/66), Soulsby (1997), Hoffmans-Verheij (1997), De Vos (2012), etc. [
24,
25,
26,
27,
28,
29].
So, there are a lot of existing formulas, none of them developed specifically for the design of the stones used as scour protection in offshore wind farms (flow type, depths, monopile dimensions, etc.) except De Vos formula [
24]. There are two possible approaches for the design of the protection: static and dynamic, allowing the last one some movement of the armour layer stones, being the design more economical [
28,
29] as it happens in other maritime structures as breakwaters. Furthermore, there are more criteria to be considered such as the effect of the diameter value in the scour hole, etc., although it is very important to consider that scour in alone current flow is generally higher than in the case of wave plus current flow.
In some cases, it has been considered appropriate to use some of the fluvial engineering formulas, first due to the existence of a very small number of coastal engineering formulas and second due to the importance of currents in the scour phenomenon.
This paper presents a research with the main objective of analyzing the feasibility of different existing formulas for the design of armour units used in scour protection systems in offshore wind monopiles, emphasizing the uncertainties and giving some recommendations for their use. For that, the formulas are applied to five case studies of offshore wind farms in operation, and the results have been compared to the real data of the scour protection systems really constructed.
2. Methods
The main objective of the paper is to analyze, compare and verify the feasibility of the application of different equations for calculating the weight and size of the stones used as riprap for scour protection of monopiles in offshore wind facilities. It is important to emphasize that the scope of this paper is limited, on the one hand to monopile foundations because it is the type of substructure clearly majority, with 82% representation in European offshore wind farms. On the other hand, it is limited to riprap-type protections, also because it is the most used one so far [
30], having shown its good performance so far.
The methodology followed is divided into four different steps. The first step is the review of the state of knowledge regarding the design formulations of riprap protections, both related to fluvial and marine environment. For this research, one fluvial environment formula has been used (Isbash) to be compared with two marine environment formulas (Soulsby, and De Vos).
The second step consists of the characterization of real case studies. For that, five offshore wind farms in operation have been selected, all of them with monopile foundations and riprap scour protections. For that, it has been necessary a review of different facilities throughout Europe, where more public information about these is available, selecting only those with all the information necessary for this research.
The information includes a general section about the facility (total power, turbine model, depth, distance to the coast, layout, etc.), another one about the foundation and the scour protection (monopile dimensions, soil type and scour protection dimensions), and another one about metocean conditions (wave design parameters associated to 50 years of return period and marine current design velocity). All this is explained in the next section, called case studies. During data collection, it is essential to analyze and verify all available information, discarding non consistent one, with the main objective of having consistent and complete information as input data.
The third step refers to the application of different design equation to calculate the weight and the size of the stones used as riprap scour protection to the five case studies identified and characterized previously. Three equations have been checked, with the objectives to analyze their possible use and the differences in the results. The input data for those equations are metocean climate identified in the second step, and the depth of the location to obtain the horizontal velocity at the seabed level due to waves, and the equations are selected during the state-of-the-art study.
Finally, in the fourth step a comparison is made between the results of riprap weight obtained in the practical application (third step) and the real data of the facilities, obtained by characterizing them (second step). The differences between the weights calculated with different formulas and the actual data documented in each case of study are valued, to end with a discussion and conclusions.
3. Description of the Formulas Used for Scour Protection
As mentioned in the introduction, there are numerous formulas to calculate the weight and size of the stones used for scour protection. While some of them are designed for fluvial environment, others are for the marine one. All equations have been formulated prior to the date of construction of the offshore wind farms except the De Vos formula. Three of these equations have been selected for this paper: Isbash (1936), corresponding to fluvial environment, and Soulsby (1997), and De Vos (2012), corresponding to marine environment.
Although the only formula that fits perfectly the type of structure to be protected against scour is the De Vos formula, two other formulas have been chosen because their wide use at the current time. The first is the Isbash equation for river environments and the second is the Soulsby equation for the marine environment. In the following paragraphs, each of the formulas used in the research is briefly described, following the list shown in
Table 2 in which first is the one formula used in river engineering and later the two formulas used in maritime engineering.
The first formula was proposed by the Russian researcher Isbash in 1936, with the objective of dimensioning the average size of the scour protection material. This equation has been widely used in the margins of discharge channels and dam closures, where high turbulence flows act in a direct current regime. Subsequently, it was adopted by the ASCE-American Society of Civil Engineers in 1950, and its use and application are now widespread [
27].
The next equation is the one proposed by the British researcher Soulsby in 1997 for marine environments. He proposed two equations, one as a function of the flow induced by the waves and the other as a function of the steady current. The formulations defined by Soulsby were based on several concepts, the most relevant ones the amplifying factor and the shear stress on the seabed. These formulations were contrasted by many tests carried out mainly in the laboratory.
The last of the formulas used was proposed by De Vos et al. in 2012. It is a dynamic design formula that determines the size of the stones used in scour protections for monopiles in combined wave and steady current conditions. It is an equation obtained from laboratory tests and it improves the results obtained by the static design formula that they proposed in a previous work.
Isbash formula has been considered for historical reasons. It was the first formula that appeared for the dimensioning of the average size of the protection material and it was widely used in areas with a very turbulent flow such as discharge channels. Soulsby equation was selected because it corresponds to cases where the flow generated by the waves at the base of the monopile is important, but without taking into account the current effect. That formula has been widely used in the marine environment. The fact of choosing these three equations is interesting to compare the behaviour of the three formulas applied to the five case studies.
The meaning of the different symbols included in Isbash equation:
D50 is the median diameter of the stone, in feet.
Va is the average velocity, in feet/s.
g is the gravity acceleration, in feet/s2.
Gs is the relative density between the stone and the water, dimensionless.
N is the stability number of Isbash, dimensionless.
The meaning of the different symbols included in Soulsby equation:
Dn50 is the nominal median diameter of the stone, in m.
Uw is the horizontal velocity due to waves at the seabed level, in m/s.
Tp is the wave peak period, in s.
g is the gravity acceleration, in m/s2.
s is the relative density between the stone and the water, dimensionless.
The meaning of the different symbols included in De Vos equation:
S3D is the three-dimensional damage of a scour protection, dimensionless.
N is the number of waves, dimensionless.
a0, a1, a2, a3, a4 and b0 are parameters obtained to determine the equation.
Um is the bottom orbital velocity, in m/s.
Uc is the average flow velocity.
Tm−1,0 is the spectral wave period order m−1,0, in s.
g is the gravity acceleration, in m/s2.
d is the water depth, in m.
s is the relative density between the stone and the water, dimensionless.
Dn50 is the nominal median diameter of the stone, in m.
ws is the fall velocity, in m/s.
In the De Vos formula, Dn50 is determined from the median stone diameter D50 which is the stone size for which 50% of the stones is lighter by weight as . If the same relationship is applied to Wn50 and W50, the coefficient is 0.593.
4. Case Studies
More than fifty offshore wind farms were identified, analyzed, and characterized. All of them satisfy the criteria of having monopile as foundation, and riprap as scour protection. Anyway, due to confidential issues, there is not a lot of public information of the offshore wind facilities. An essential part of the case study identification and characterization is to analyze and verify all available information, discarding non consistent data, with the main objective of having only consistent and complete information in the research.
Subsequently, and from this broad list, five case studies are selected, justifying their limited number due to the great difficulty encountered when identifying case studies with sufficient information, so as to be able to homogenize all the aspects and their main characteristics, reducing these to only the aspects of its location, the construction process, the foundation structure or those of the wind turbine, also incorporating maritime weather data, being necessary to perform in parallel an analysis of each of the documented data, contrasting and validating each one of them by different sources.
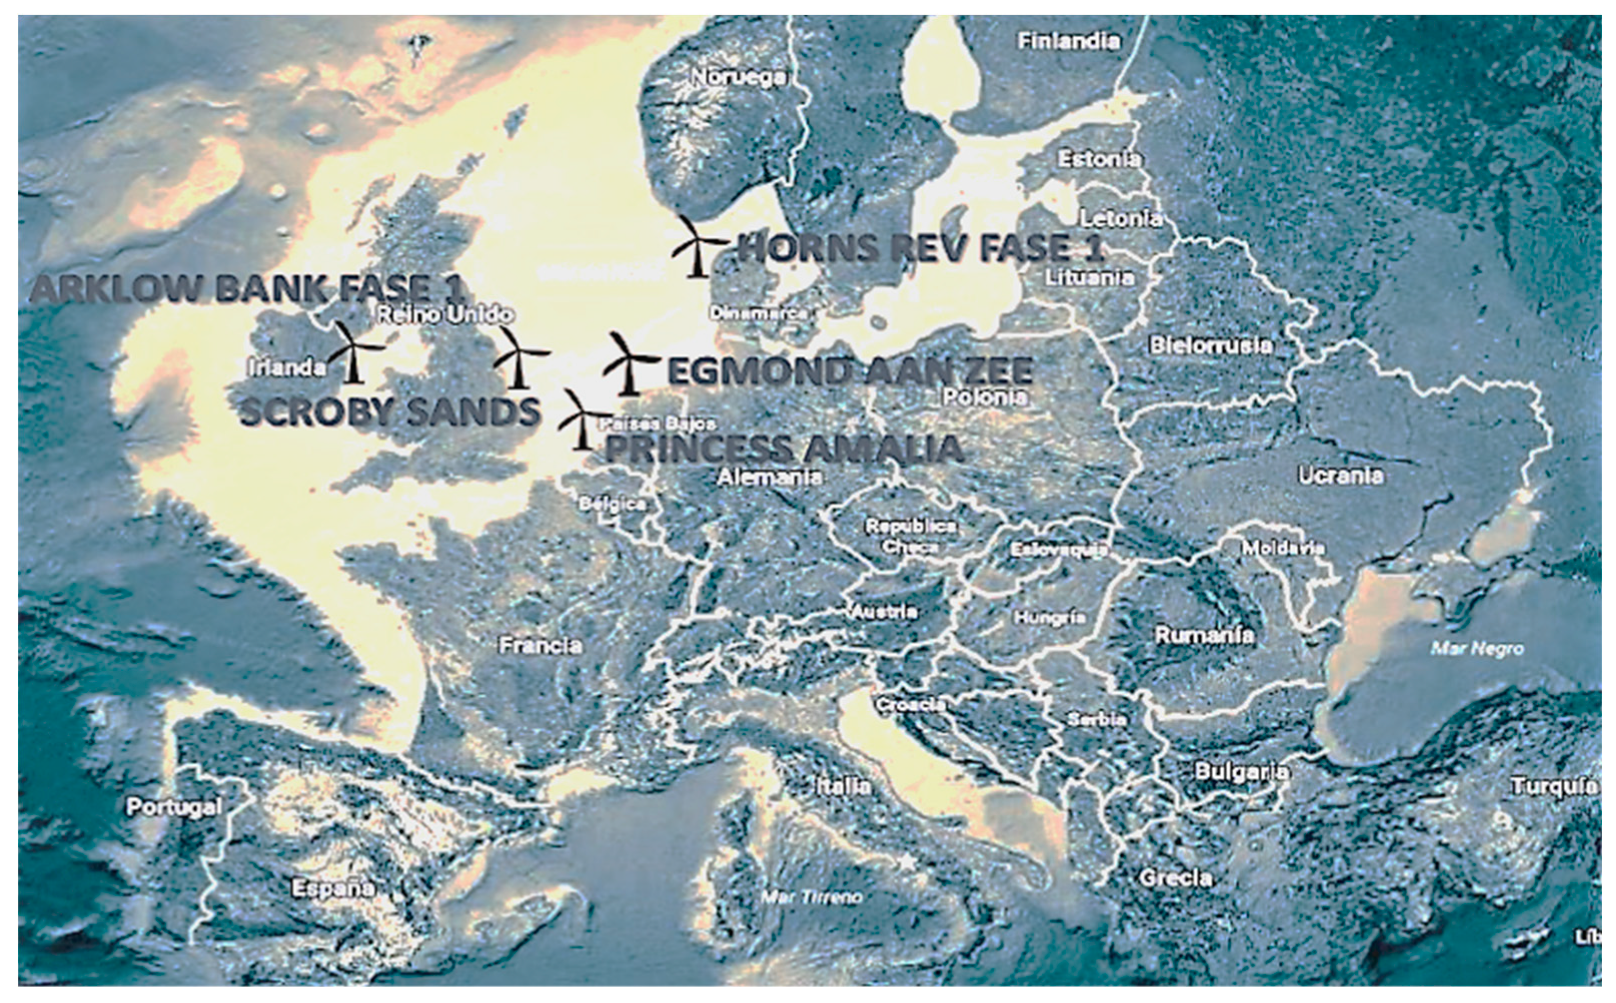
The selected wind farms are Arklow Bank phase 1 (Ireland), Edmond aan Zee (Netherlands), Horns Rev phase 1 (Denmark), Princess Amalia (Netherlands), and Scroby Sands (United Kingdom) (
Figure 6), all of them located in the North Sea.
All information necessary for the different offshore wind farm case studies are summarized in
Table 3,
Table 4 and
Table 5.
Table 3 includes the general characteristics,
Table 4 the characteristics of foundations and scour protections and
Table 5 the metocean conditions. The information included in these three tables are taken, mainly, from the [
29,
30,
31,
32,
33,
34,
35,
36,
37,
38,
39,
40,
41,
42,
43,
44,
45].
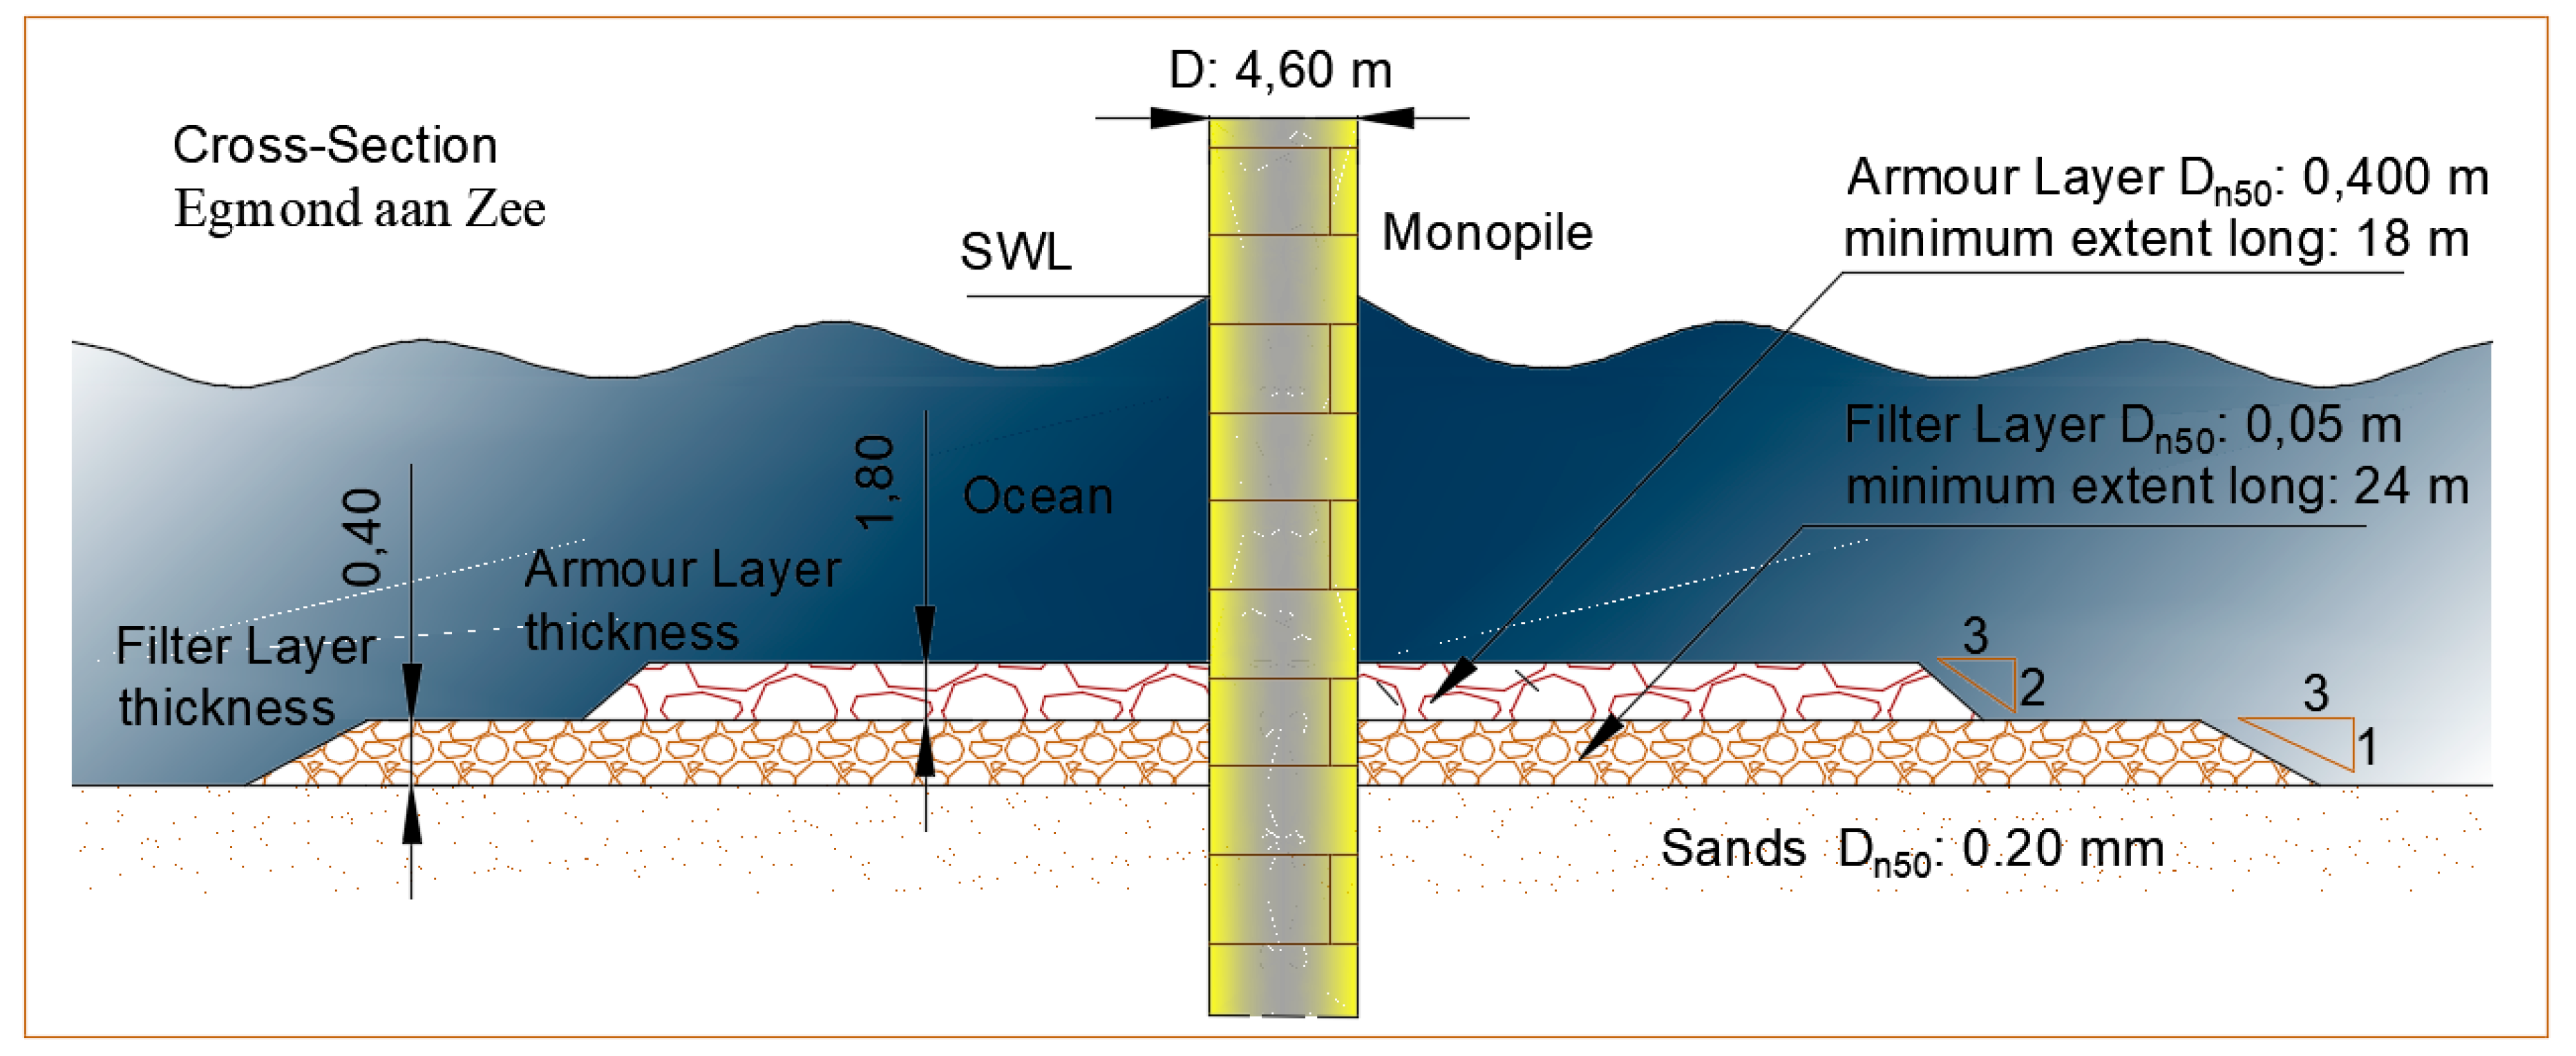
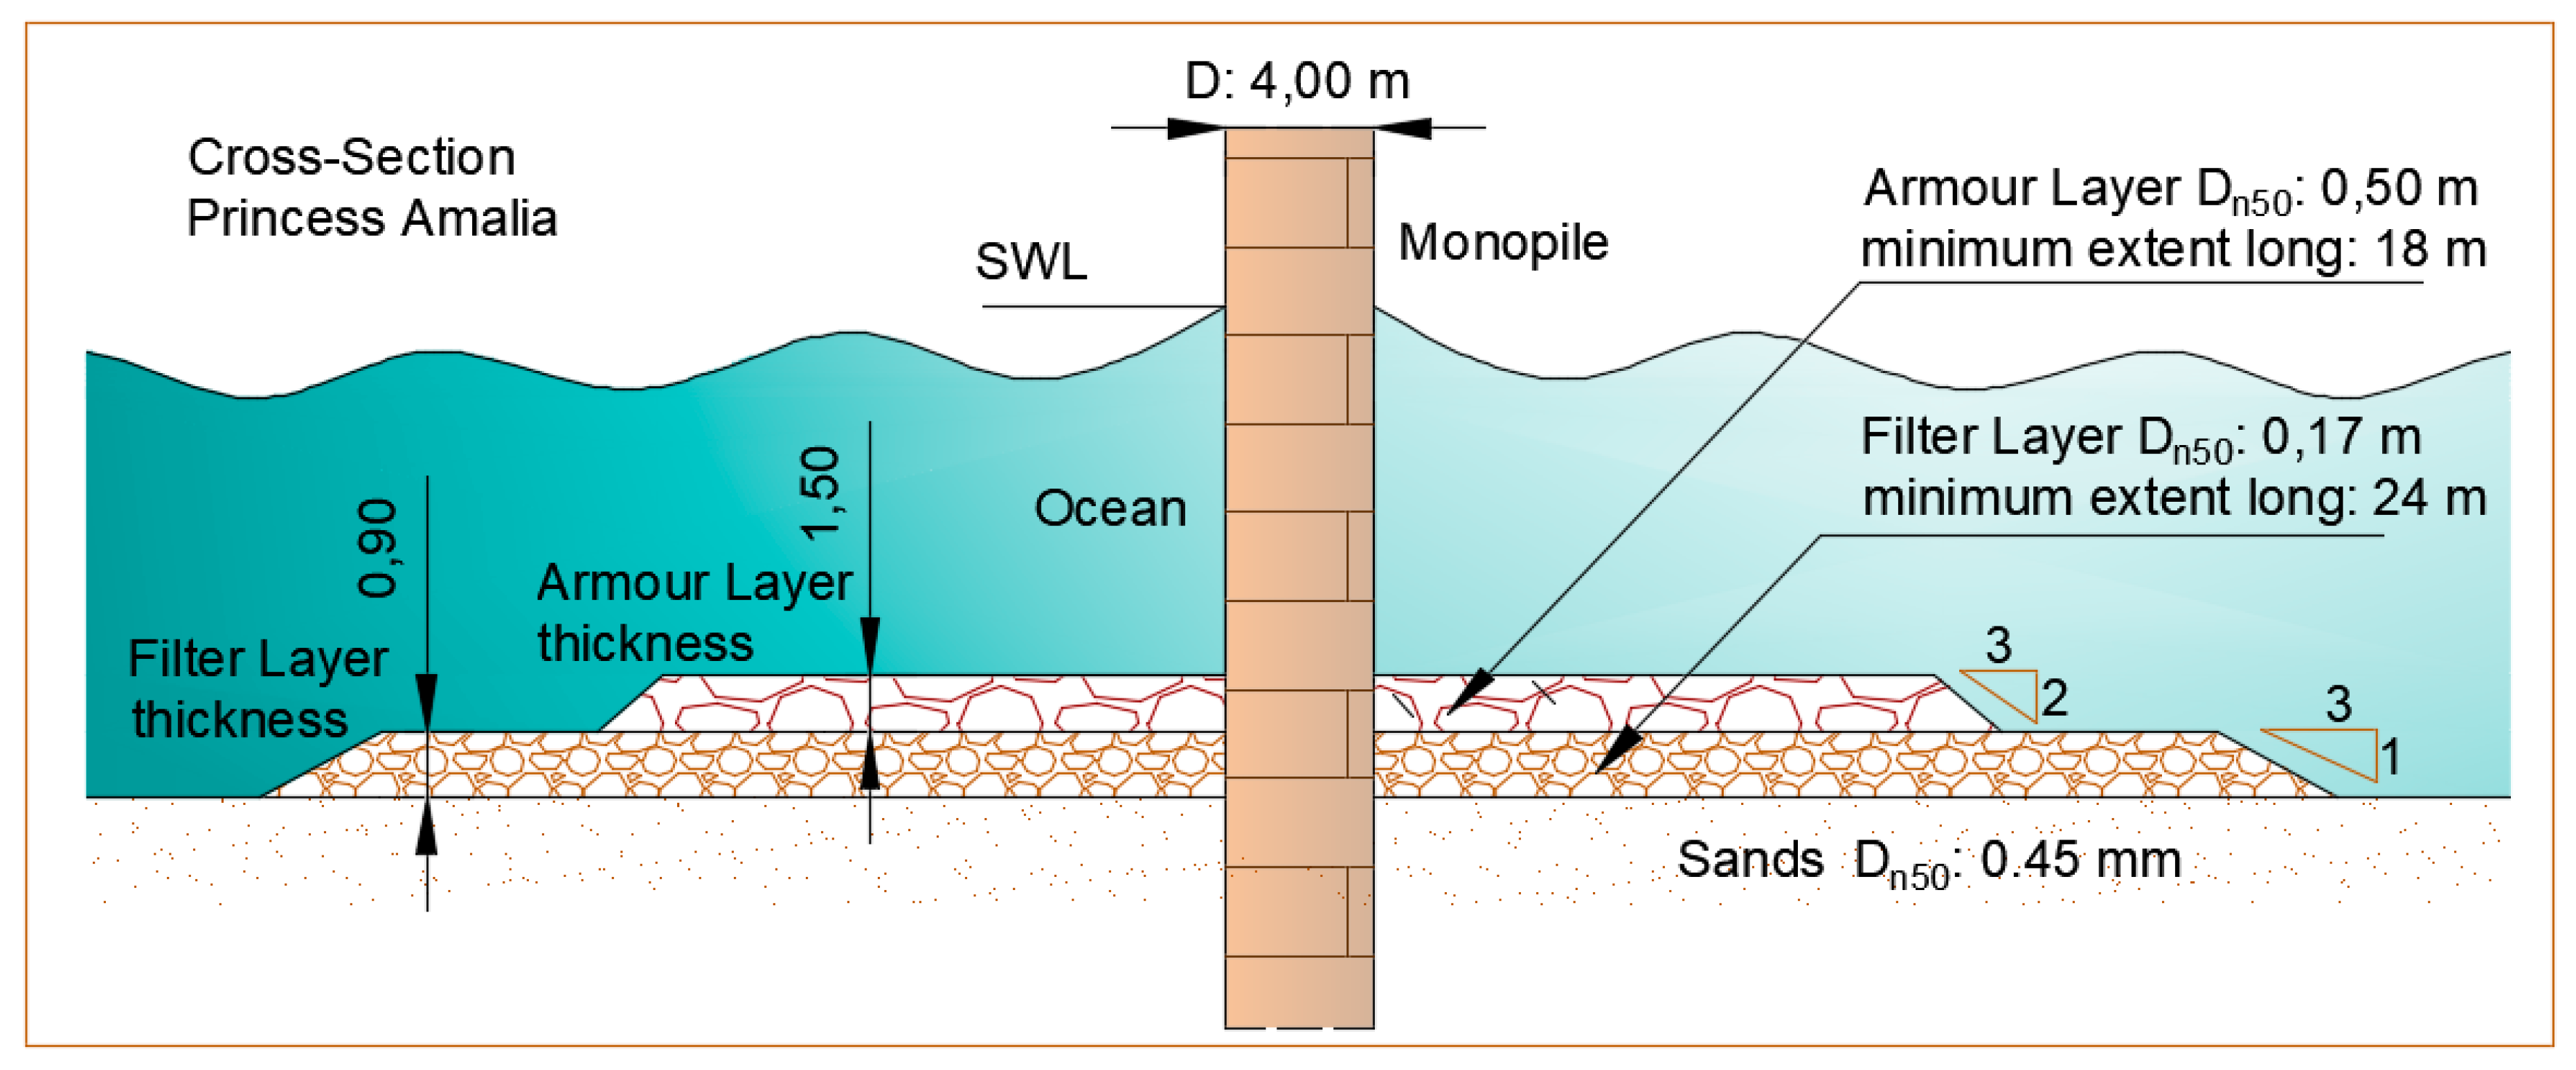
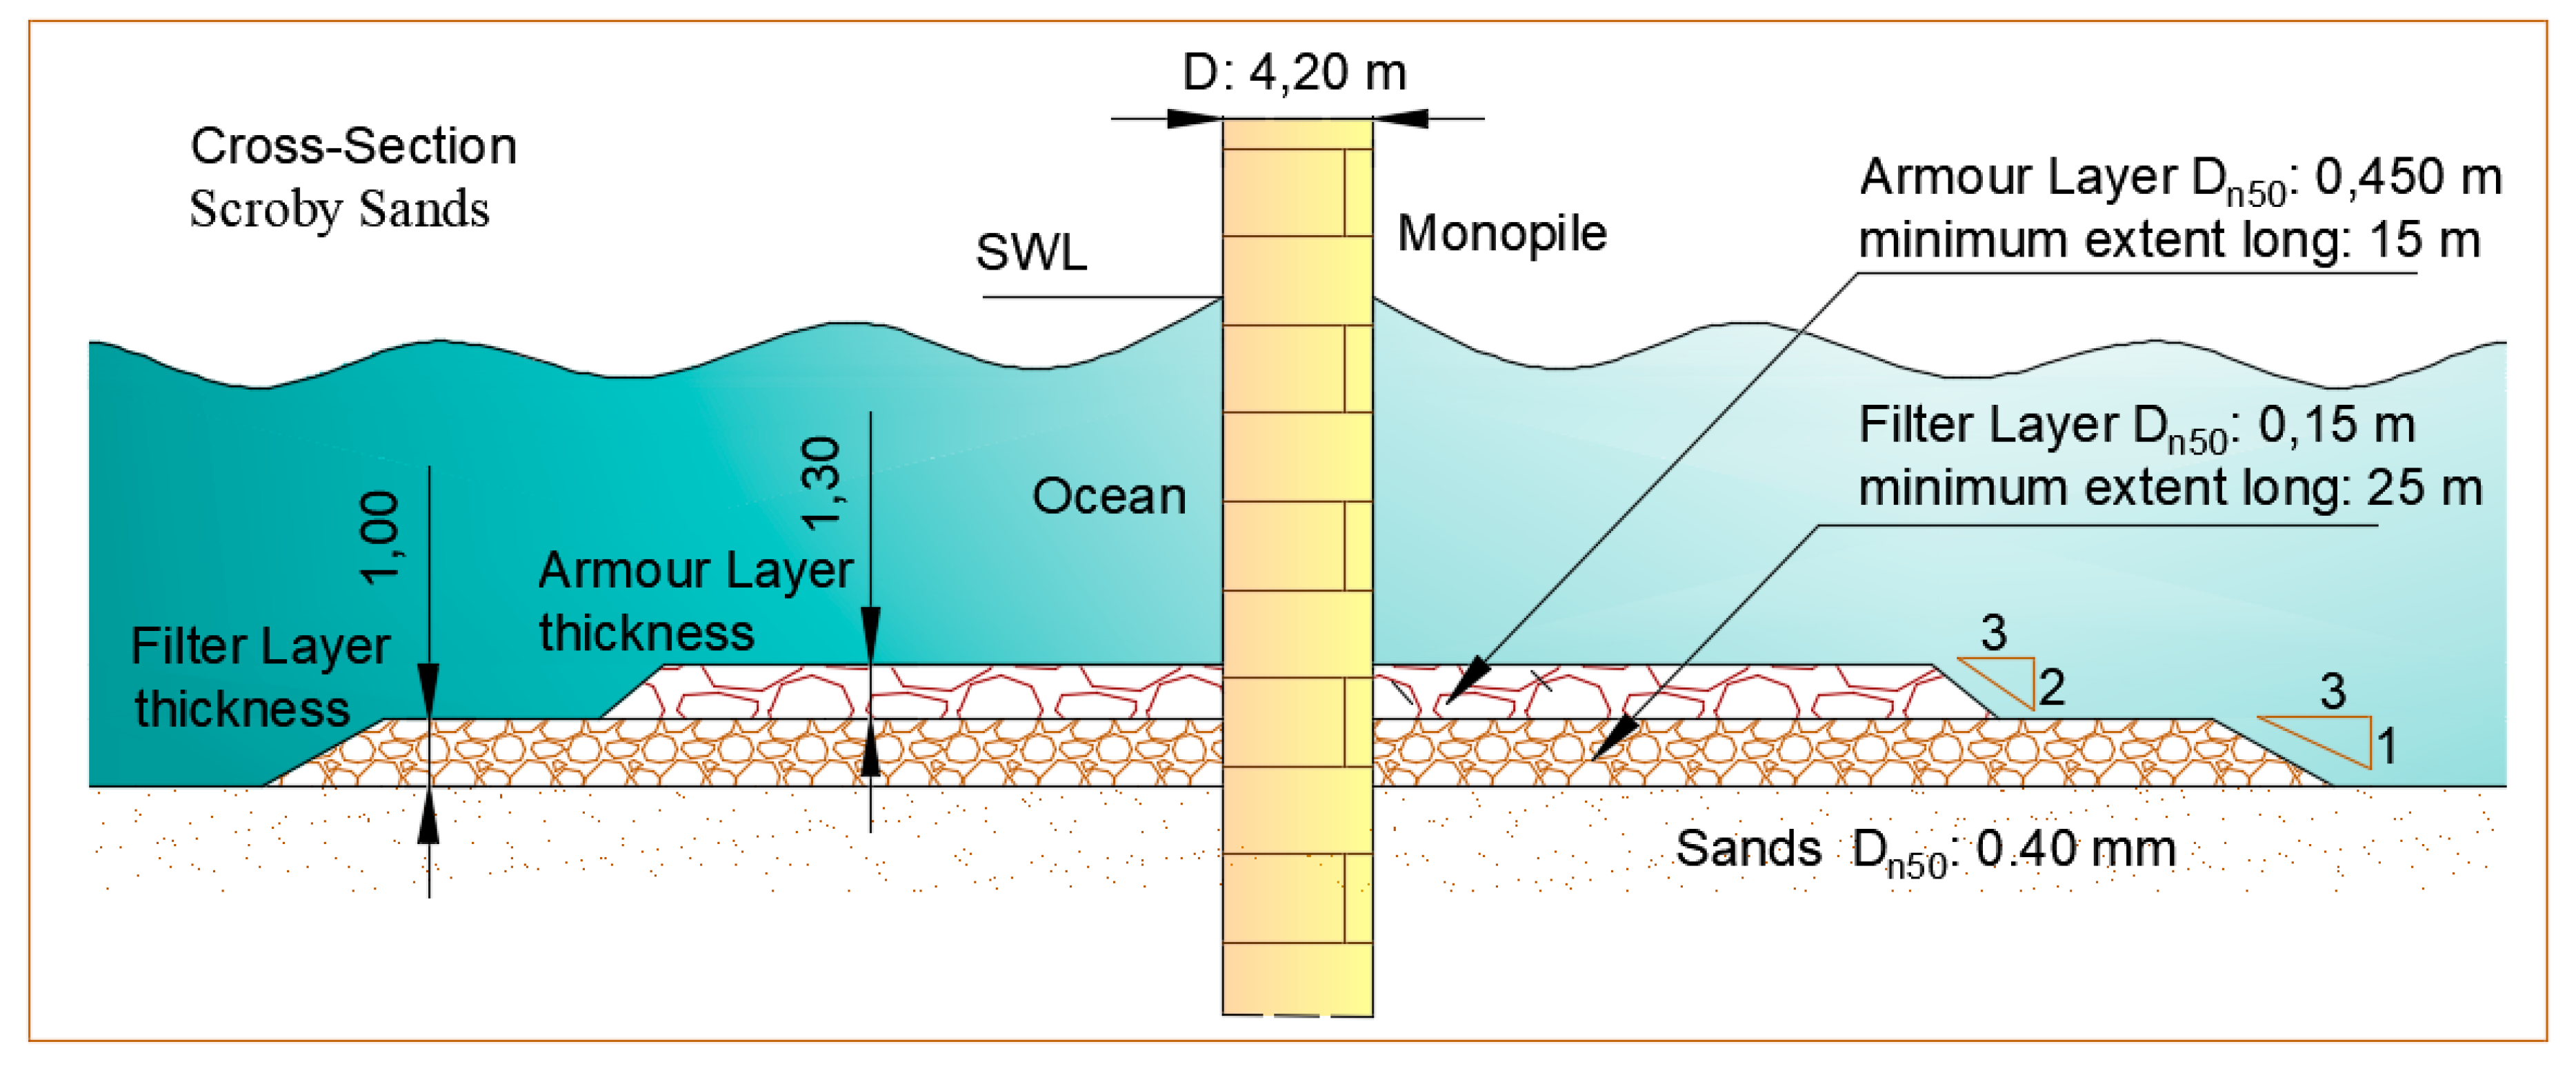
Figures are prepared for the different five offshore wind farms, including the main dimensions of the monopile and scour protection: Arklow Bank phase 1 (Ireland) (
Figure 7), Egmond aan Zee (Netherlands) (
Figure 8), Horns Rev phase 1 (Denmark) (
Figure 9), Princess Amalia (Netherlands) (
Figure 10), and Scroby Sands (United Kingdom) (
Figure 11).
5. Results
In order to check and validate each of the results obtained in the practical application, auxiliary calculations are performed to determine the orbital velocities at seabed level due to waves. Non-linear wave theories (e.g., stream function) are recommended to be applied in function of the zoning resulting from each of the study cases, for instance for the shallow water case study (Arklow Bank phase 1) high order Stokes’ theory is inappropriate.
Only to note that wave velocity at seabed level has been calculated in all the cases according Airy wave theory as simplification, corresponding to the maximum horizontal velocity associated to the wave climate parameters related to 50 years return period.
Table 6 includes the marine current, bottom orbital and design velocities.
Based on the input data corresponding to the case studies, mainly metocean ones, the results of the application Isbash (1936), Soulsby (1997), and De Vos (2012) are included in
Table 7. For De Vos, S
3D has taken as 1, and the number of waves as 2000.
Table 7 shows the results obtained after applying the three design formulations selected in the five case studies, with notable differences among them, which may be due to the fact that each researcher has proposed a different methodology in their application. The real average weight of the stones used for scour protection in each of the case studies has been included in the table in the right-hand column.
Likewise, it is highlighted as the most influential variable in each formulation the velocity of the flow at seabed level, defined as orbital velocity as it can be observed in the different equations, with which its results have an important sensitivity to any variation of the velocities of the flow, obtaining very different results. In order to calculate the design velocity of the current, it has been chosen to consider that waves follow the same direction as currents, this being the most unfavorable situation for the stability of the foundation against scour. It should be mentioned that there are other combinations of wave and currents actions such as waves opposite currents, alternate current such as those induced by tides, etc. However, these have not been the object of the research carried out. In all the cases, it has been considered mild slope and wave breaking coefficient in around of 0.7 referred to the mean sea level.
6. Discussion
The practical application allows to compare and determine differences existing between the two weights analyzed, on the one hand the result of applying the formulations and, on the other hand the one identified in the characterization of the case studies, the real projects, quantifying their difference by means of three different methodologies:
- (a)
Ranges relationship represented by the value of the difference between the real and the calculated weights.
- (b)
Relative error ratio represented by the absolute value of the difference between real and calculated weights divided by the real weight.
- (c)
Step factor relationship defined as the square root of the division between the real and the calculated weights.
All this made possible to detect that the results are very different, specifically using Soulsby equation, designed for the flow produced by the waves on the seabed without taking into account the interaction with the current.
Furthermore, it was observed that the velocities in the case studies are between 1 and 5 m/s, the value of the riprap protection is very related to the velocity. In case of higher velocities, bigger riprap dimensions, being clearly the highest dimension for Arklow Bank, with 4.7 m/s of velocity at sea bottom. Lowest values correspond to Egmond aan Zee, with 1.33 m/s of velocity at sea bottom.
Next table (
Table 8) shows the results obtained after comparing these calculated weights using the three methodologies mentioned for each of the case studies, Arklow Bank phase 1 (Ireland), Edmond aan Zee (Netherlands), Horns Rev phase 1 (Denmark), Princess Amalia (Netherlands) and Scroby Sands (United Kingdom).
In the case of Arklow Bank phase 1, the weights obtained are very conservative with values between 10 and 1000 times higher than those placed in reality, with dispersion ratios between 0.001 and 0.13; the values obtained by means of Soulsby equation are very striking 10 times higher than those obtained by means of the other two equations. This is because the value of the combined velocity (waves and current) is also the highest of all case studies with a high value (4.70 m/s).
In the case of Egmond aan Zee, the three equations give a result with the same order of magnitude, and representing between 0.4% and 1% of the weight actually placed. In this case, the value of the velocity considered in the calculation is the lowest of all (1.33 m/s).
In the rest of cases, the combined current-wave speed considered is between 2 and 3 m/s. Soulsby equation gives very high values of the weight of the stones between 1.5 and 6.2 times the weight of the stones placed, and with values of the ratios one order of magnitude lower than those obtained with the other formulas. On the other hand, the values of the ratios for the Isbash and De Vos formulas are similar. Differences can also be observed with respect to the weights placed. In the case of the Princess Amalia and Scroby Sands parks, the value obtained represents around 25% of the weight placed, while in Horns Rev, it is 3.5%.
It shows that in case of high velocity values at sea bottom, it can be interesting to carry out laboratory tests to try to save money, because in that offshore wind farm, there is important differences between calculated and real weight values using any of the three selected equations. Egmond aan Zee has some important differences between calculated and real weight. In fact, the comparison of the values in the case of the highest and lowest velocity value at sea bottom gives worst results than in case with intermediate values.
For De Vos formula, the expected value of parameter S3D for the diameters of the existing stones in the scour protections has been analyzed. The results obtained are the following: for Arklow Bank phase 1 the value is 3.95, for Egmond aan Zee the value is 0, for Horns Rev phase 1 and for Scroby Sands it is 0.20, for Princess Amalia it was 0.26 is obtained. In view of the values obtained, it follows that all installations, except for Arklow Bank phase 1 and Egmond aan Zee, are in the range of values posed for the equation (0.2–1.0). Therefore, it can be deduced that in Horns Rev phase 1, Princess Amalia and Scroby Sands, the stone sizes placed would be a little smaller than those obtained with the static approximation. In Arklow Bank phase 1, the stone size placed is much smaller than the result of the static approach and in Egmond aan Zee it will be close to the result of the static approach.
Considering the relative error ratio, it is observed that the Isbash and De Vos formulae give very similar values, lower than 1.00, in all cases except for Arklow Bank phase 1. On the other hand, Soulsby’s formula gives the best value of the relative error ratio for Horns Rev phase 1 (0.53), and a value of this ratio very similar to those of the other two formulas in Egmond aan Zee.
According
Table 9 [
46], the D
50 can be obtained knowing the velocity at seabed level. For instance, in Princess Amalia, the design velocity is 2.91 m/s, and according the table the minimum D
50 recommended is 0.40 m for the scour protection armour. D
50 = 0.40 m corresponds to W
50 = 173 kg, considering 2800 kg/m
3 of density, D
n50 is 0.84 multiplied by D
50, and if the same relationship is applied to W
n50 and W
50, the coefficient is 0.593. So, W
50 = 173 kg is converted to W
n50 = 103 kg. This value is in the magnitude order established in the
Table 9 in the case of Isbash, and De Vos equations, although
Table 9 is more conservative than the use of the equation. So, it can be used for estimate values.
7. Conclusions
It is concluded that there is a very small number of formulas applicable for the design of the foundation protection systems of offshore wind turbines. Furthermore, it has been observed that the formulas are not very clear, not allowing a rapid determination, because most of them have not been applied or contrasted for offshore wind farms, having been only verified for coastal structures or in hydraulic channels. An additional uncertainty has to be taken into account, regarding the dimensions used in these structures; these dimensions are completely different to the usual ones included in coastal and offshore engineering.
A high degree of confidentiality is imposed in the offshore wind sector, as a result of which the utilities do not share the information, taking care of their know-how. Anyway, not sharing the information, mainly the failures, make the industry advances slower than in the case of looking for synergies to solve the problems and the uncertainties.
It is also verified that when applying the formulations of scour protections, both for continuous and oscillatory regime, their results presented important inconsistencies, because in general these are thought for depths of the order of 5 m, and not for usual depth of offshore wind facilities, more than 15–20 m depth.
With respect to the comparisons of the weights, in the case of Arklow Bank phase 1, the weights obtained are very conservative with values between 10 and 1000 times higher than those placed in reality, with step factor relationships between 0.03 and 0.36. It shows that in case of high velocity values at sea bottom, it can be interesting to carry our laboratory test to try to save money, because in that offshore wind farm, there is important differences between calculated and real weight values using any of the three selected equations
From the comparison of the results obtained with the different formulas selected, it can be deduced that the Soulsby formula is not applicable because it gives the highest values of the weights of the stones to be placed. Only in the case of the Egmond aan Zee offshore wind farm, the value obtained is close to those of the other two formulas, which can be interpreted as meaning that it can be used in locations with a low speed range, less than 2 m/s.
On the other hand, it can be observed that the values obtained by the Isbash, and De Vos equations are similar in parks whose bottom velocities are between 2 and 3 m/s. Differences can also be observed with respect to the weights placed. In the case of the Princess Amalia and Scroby Sands parks, the value obtained represents around 25% of the weight placed, while in Horns Rev, it is 3.5%.
For the De Vos formula, the expected value of parameter S3D for the diameters of the existing stones in the scour protections has been analyzed. In view of the values obtained, it follows that all installations, except for Arklow Bank phase 1, and Egmond aan Zee, are in the range of values posed for the equation (0.2–1.0). Therefore, it can be deduced that in Horns Rev phase 1, Princess Amalia, and Scroby Sands, the stone sizes placed would be a little smaller than those obtained with the static approximation. In Arklow Bank phase 1, the stone size placed is much smaller than the result of the static approach and in Egmond aan Zee it will be close to the result of the static approach.
Considering the relative error ratio, it is observed that the Isbash and De Vos formulae give very similar values, lower than 1.00, in all cases except for Arklow Bank phase 1. On the other hand, Soulsby’s formula gives the best value of the relative error ratio for Horns Rev phase 1 (0.53), and a value of this ratio very similar to those of the other two formulas in Egmond aan Zee.
Evidently, although with the Isbash formula similar results to the De Vos formula have been obtained in all the facilities analyzed except for Arklow Bank phase 1, this last formula has better possibilities of adjustment to the conditions of this type of foundations when considering more factors, not only the velocity of the current at the bottom, so that it can offer a better result of the average weight of the stones to be placed in the scour protection systems.
For a rapid estimation,
Table 9 can be used because it gives conservative values ad it is very easy to use. Anyway, it is first estimate, and more calculations and possible laboratory test should be done to design the riprap protection.
This makes it essential to continue the research about the scour, for which it would be appropriate to have real data on offshore wind farms in operation, mainly based on monitoring the scour around the structures along the time with field campaign with multibeam echosounders.


