Article

Influence of EEDI (Energy Efficiency Design Index) on Ship–Engine–Propeller Matching

College of Power and Energy Engineering, Harbin Engineering University, Harbin 150001, China
*
Author to whom correspondence should be addressed.
J. Mar. Sci. Eng. 2019, 7(12), 425; https://doi.org/10.3390/jmse7120425
Submission received: 25 October 2019 / Revised: 3 November 2019 / Accepted: 8 November 2019 / Published: 22 November 2019
(This article belongs to the Special Issue Marine Propellers and Ship Propulsion)

Abstract

:
With the increasingly strict international GHG (greenhouse gas) emission regulations, higher requirements are placed on the propulsion system design of conventional ships. Playing an important role in ship design, construction and operation, ship–engine–propeller matching dominantly covers the CO2 emission of the entire ship. In this paper, firstly, a ship propulsion system matching platform based on the ship–engine–propeller matching principle and its application on WinGD 5X52 marine diesel engine have been investigated. Meeting the energy efficiency design index (EEDI) regulation used to calculate the ship CO2 emission is essential and ship–engine–propeller matching has to be carried out with EEDI into consideration. Consequently, a procedure is developed combining the system matching theory and EEDI calculation, which can provide the matching results as well as the corresponding EEDI value to study the relationship between EEDI and ship–engine–propeller matching. Furthermore, a comprehensive analysis is performed to obtain the relationship of EEDI and system matching parameters, such as ship speed, effective power and propeller diameter, reflecting the trend and extent of EEDI when changing these three parameters. The results of system matching parameters satisfying different EEDI phases indicate the initial value selection in matching process to provide reference for the design of ship, engine and propeller under the EEDI regulations.

1. Introduction

Maritime transport is still the backbone of global transport over the entire world due to its large trade volume (big ships) and low unit transportation cost. Around 80 percent of global trade by volume and over 70 percent of global trade by value are carried by sea and are handled by ports worldwide [1]. Over the last decade, there has been an overall increase in the number of vessels of the world commercial fleet with more emissions laying the burden on the environment notably. For example, the global warming caused by the greenhouse gas (GHG) emissions such as carbon dioxide (CO2) brings negative impact on the global agriculture and trade [2]. To limit the GHG emission of marine vessels, the International Maritime Organization (IMO) has put forward the energy efficiency design index (EEDI) regulations. EEDI is an indicator of the ship energy efficiency, which is calculated, based on a complex formula, as the ratio of the ship’s potential CO2 emission to its available capacity for transporting useful weight. As a result, higher requirements are placed on the propulsion design of ships, especially for those conventional ones, in order to meet the EEDI regulations [3]. During ship design, construction and operation, the propulsion system always plays an important role ensuring the ship sailing safety, with the function of keeping the ship operating at a desired speed. To be specific, the main engine drives the propeller through the ship’s shaft system to generate thrust to propel the ship at the desired speed, thus making ship–engine–propeller matching a key problem in propulsion system design. Therefore, the investigation on the influence of EEDI on the ship–engine–propeller matching is useful for the design of an EEDI-satisfying ship propulsion system by offering reference of some key design parameters at the early ship design stage.
The matching of ship, engine and propeller determines the performance of ship sailing, and further influences the ship economy and emissions. Some researches on the ship–engine–propeller matching have been carried out to figure out the relationship of these three components and to improve the basic matching theory. The world’s major marine diesel engine manufacturers, such as MAN B&W, Wärtsilä, WinGD, Rolls-Royce, etc., have been developing their own business on it, seeing ship propulsion system integration as a mainstream concept [4,5,6,7]. MAN B&W summarized the basic principles of ship propulsion, explaining the complex calculation procedure of propulsion system and clarifying some of the parameters pertaining to hull resistance, propeller conditions and the diesel engine’s load diagram [8]. Wärtsilä developed Propac Packages based on the matching theory, which enables the matching and selection of diesel engines, propellers, shafting systems, etc. [9]. On the other hand, fundamental and theoretical research works have been carried out by some universities and research institutes. Rawson et al. proposed the concept of spiral design regarding to the whole ship design process, and indicated that the parameters in the design process are numerous and interrelated, thus complicating the design procedure of the whole ship, and especially the propulsion system [10]. Stapersma et al. introduced the theory of the basic matching problem of a diesel engine to the propulsor, by which the methods can evaluate both the ship design and off-design conditions [11,12]. Taskar et al. explored the interaction effects of engine and propeller under different sea conditions, which is a step towards optimization of the overall propulsion system [13]. Besides the matching for conventional power configuration, there are some researches on the new types of ship propulsion such as hybrid propulsion. Ogar et al. analyzed performance of controllable pitch propeller (CPP), ship hull and engine in both design and off-design conditions to design a control strategy for the optimal matching of a combined diesel or gas turbine (CODOG) system [14]. Sasaki et al. introduced a design method for hybrid CRP (contra rotating propeller) podded drive systems to achieve the best index for transportation efficiency and avoid poor navigation operations [15].
The core of matching theory normally is based on the energy balance, but the process of using a propeller diagram is somewhat different, which is the main contribution to the overall calculation time. Since open water characteristics of series propellers or actual ones are commonly coded to polynomials in the programs, the mathematics used in this procedure has an important impact on the system calculation accuracy and time cost. With the rapid development of computer capacity and intelligent algorithms application in engineering, some new methodologies and optimizations have sprung up in order to make the system matching faster and more accurate. Genetic algorithm, which is used in the matching program, takes the propulsive efficiency as the objective and the energy balance and propeller cavitation as the constraints. Xie employed the non-dominated sorting genetic algorithm II (NSGA II) to carry on an evolutionary optimized matching process with open water propeller efficiency as the design objective for the best solution to ship–engine–propeller matching [16]. Qin et al. developed a method to search for the optimal solution of matching based on the genetic algorithm (GA), which greatly shortened the calculation time of ship–engine–propeller matching [17,18]. The neural network algorithm, as a black box monitoring the relationship of inputs and outputs, is widely used in a complex system calculation. Feng et al. applied the neural network to the matching theory to achieve the advantages of simplicity, versatility and accuracy, compared with the traditional regression coefficient method [19].
The basic matching mostly considers the propulsive efficiency, open water propeller efficiency mainly, as the single design objective in the conventional or complex propulsion system. Recently some other objectives and constraints have been considered in the system matching, taking not only the energy conversion efficiency, but also the ship operating cost and environmental impact into account [20]. Esmailian et al. developed the approach to optimize the propeller-hull system simultaneously with two objective functions considered, i.e., lifetime fuel consumption (LFC) and the cost function including thrust, torque and open water propeller efficiency, to design a hull-propeller system with minimum LFC and cost [21]. Koenhardono et al. established an engine–propeller matching model based on the neural network algorithm to predict the best performance of main engines, and to achieve minimum fuel consumption [22]. Meanwhile, with more concern on the environmental impact, there are some researches on the relationship of the ship propulsion system and its emission in order to meet the corresponding regulation requirements. Trozzi introduced the methodology to estimate emissions of nitrogen oxide (NOx), non-methane volatile organic compounds (NMVOC) and particulate matter (PM) during ship operation, in which the installed capacity and fuel consumption are used to estimate the emissions of both the main and auxiliary engines [23]. Borkowski et al. proposed a method to determine engine shaft power, fuel consumption and exhaust NOx emission based on the vessel speed and automatic identification system (AIS) data [24]. Trodden investigated the primary effects of the environmental conditions experienced at the early ship design stage to minimize the CO2 emission of the ship via a philosophy of improved efficiency by design of the in-service conditions [25]. Although CO2 is not a harmful emission compared to the others from engines, it is considered to be the first cause of the greenhouse effect. In order to restrict the CO2 emissions from ocean transportation, energy efficiency design index (EEDI) is proposed by the International Maritime Organization (IMO) as a mandatory technical measure, which will certainly guide and change some key procedures during ship design and operation. Some fundamental research work has been carried out in both theory and applications. Stapersma et al. proposed that any pollutant index in principle is a ratio between the penalties and benefits [26], laying fundamental of EEDI formula used today. For example, “Specific Tractive Effort” [27] is a ratio of prime mover power used to mobility power. However, the heart of any index is an energy conversion index (ECI) where the numerator sums up the penalties and the denominator means the benefits to society delivered [26]. In order to make EEDI suitable for different sail conditions and all ships with different fuels or energy efficient technologies, some relating coefficients has been taken into account [28,29,30,31]. Kristensen et al. carried out a regression analysis and found that the requirement of a maximum allowable EEDI for new ships will be a good design driver for more efficient ships in the future [32]. Papanikolaou et al. analyzed the measure to lower attained EEDI and its influence on ship operational performance in adverse conditions [33]. Sui et al. defined the energy conversion effectiveness and fuel index and investigated these definitions under various propulsion system control modes [34].
Since EEDI is mandatory, ships built after 2013 have to meet the requirements. Some regarding researches of EEDI application on actual ships have been carried on. Norwegian Marine Technology Research Institute investigated the application of existing analytical tools and methods to figure out GHG emission reduction possibilities through different technical, operational and market-based approaches, and according to these, EEDI indeed promotes the improvements on ships to decrease CO2 emission [35]. It can also be known from this report that ship hull optimization, alternative energy, innovative energy efficient technologies and ship speed reduction are the popular methods to reduce CO2 emissions and meet the EEDI regulations. Ship hull optimization is mainly used to the new ships, and knowing the influence of hull structure on EEDI restrictions, a reasonable evaluation criterion to optimize the energy structure of ship hull under EEDI can be given [36]. Hou analyzed the relationship between EEDI and vessel factors to realize the hull optimization for large shallow draft bulk carriers based on EEDI requirement [37]. Liquefied natural gas (LNG) as a green fuel has been increasingly used as the alternative energy for marine vessels to have a better environmental protection. After the comparison between classical fuel type (heavy fuel oil, HFO) and LNG propulsion systems, it turned out that LNG has a lower EEDI value under the same ship operating conditions [38,39]. Livanos et al. investigated the techno-economic sustainability of four alternative propulsion plants, running either on diesel or LNG fuel, equipped with or without waste heat recovery system to find the solution to reduce GHG emission [40]. Regarding to innovative energy efficient technologies, the feasibilities of wind propulsion power, air lubrication system, waste heat recovery system as well as their own EEDI calculation methods were discussed by the Marine Environment Protection Committee (MEPC) [41,42,43].
Although EEDI is a mandatory regulation to reduce GHG emissions, how to implement EEDI is still a controversy. For example, Devanney criticized EEDI from the prospective of engine selection and fuel consumption based on the calculation and analysis of VLCCs (very large crude carrier). He proposed that the ship owner could meet the EEDI requirements by simply reducing the speed of a new ship [44,45], which is an easy way but may cause the risk to the ship in terms of safety and fuel pollution. Stefan Kruger found that EEDI actually results in a severe speed limit for some ships, which can fulfill the EEDI only at physically impossible negative wave resistances for their desired design speed. He pointed out that the installed power of large ships would not be able to provide safe speed according to the current EEDI formula [46]. However, the ship speed reduction in some degree to satisfy the EEDI is tolerant as long as the engine power under this speed can make the ship sail safely, taking the engine margin and see margin into account.
There are some applications and researches of EEDI on ship hull optimization, alternative energy and emission abatement techniques, but merely on the propulsion system matching. Since the GHG emission of propulsion system accounts for more than 80% of the entire ship, it is necessary to do some research on the effect of EEDI on propulsion system matching. In terms of EEDI study based on the ship–engine–propeller matching, Li studies the impacts of the related parameters set on the EEDI during the main engine selection and established a comprehensive evaluation model to have a reasonable assessment [47]. Kristensen et al. built a generic model to conclude the reduction in propulsion power and emissions by varying the ship speed and other main ship design parameters, and finally get the relationship between EEDI and the parameters [32]. However, the influence of EEDI on matching and its potential guidance on matching are still unclear.
In summary, most ship propulsion system matching applications care about propulsive efficiency and fuel cost [16,48], ignoring the environmental impact. Consideration of EEDI or other emission index should be added into matching process due to their negative impact on marine transportation [49]. On the other hand, EEDI value is only calculated as verification after the matching design to ensure the ship meets the EEDI regulation requirements. With more and more stringent EEDI regulation [50], the single goal of the propulsion system matching with propulsive efficiency would not be sufficient to the ship design and operation. It would be necessary to involve EEDI at the early ship propulsion system design stage, i.e., the potential guidance of EEDI on the design parameters during the system matching.
In this paper, a matching procedure combining the propulsion system matching theory and EEDI calculation is developed to investigate the influence of EEDI on ship–engine–propeller matching. Based on the sea trial data of 38800 DWT (deadweight tonnage) bulk carrier, the ship–engine–propeller matching platform is built and calibrated, and after both formula derivation and program calculation, the inversely proportional relationship of EEDI and open water propeller efficiency can be found out. In matching, ship speed, propeller diameter and ship effective power are the main inputs, thus by varying these three parameters separately, not only the trend of EEDI, but also the extent that EEDI will change can be predicted. It concludes that reduction of ship speed is still the most effective method to meet the EEDI requirements. Last but not least, the system matching parameters satisfying the EEDI requirements in different stages are discussed, providing a reference of the pre-selection of these inputs at early stage for further design on ship–engine–propeller matching under the guideline of EEDI regulations.

2. Methodology

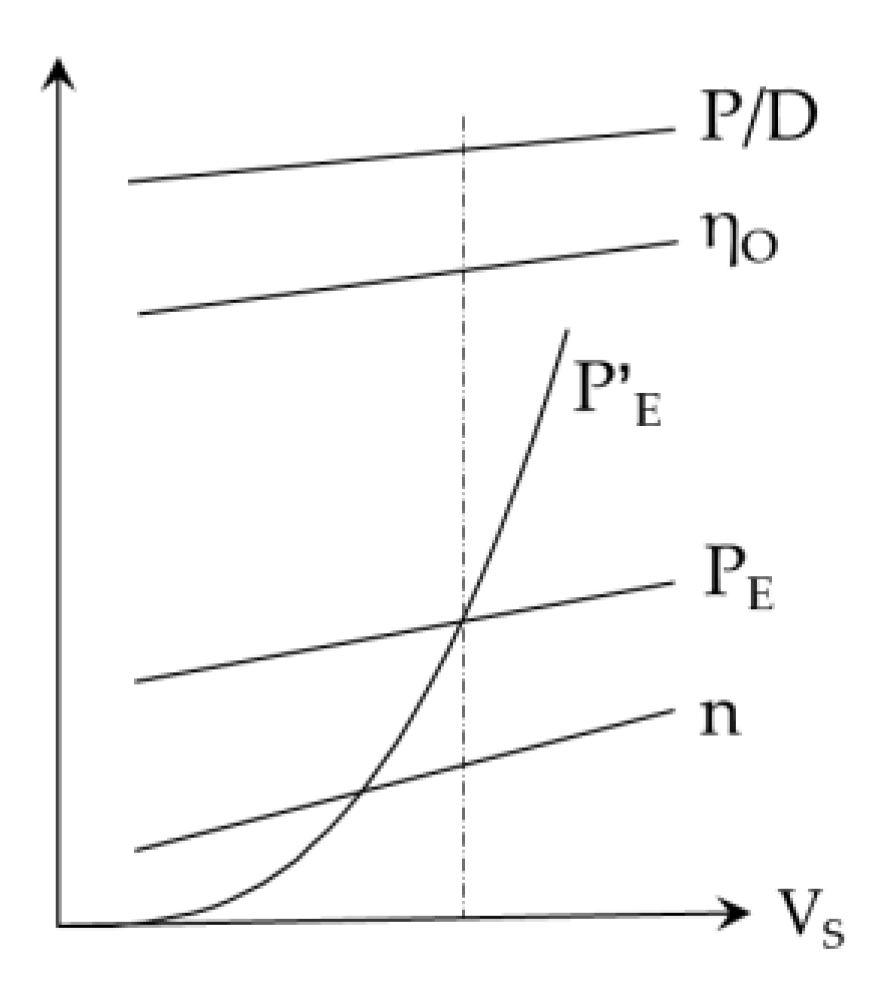
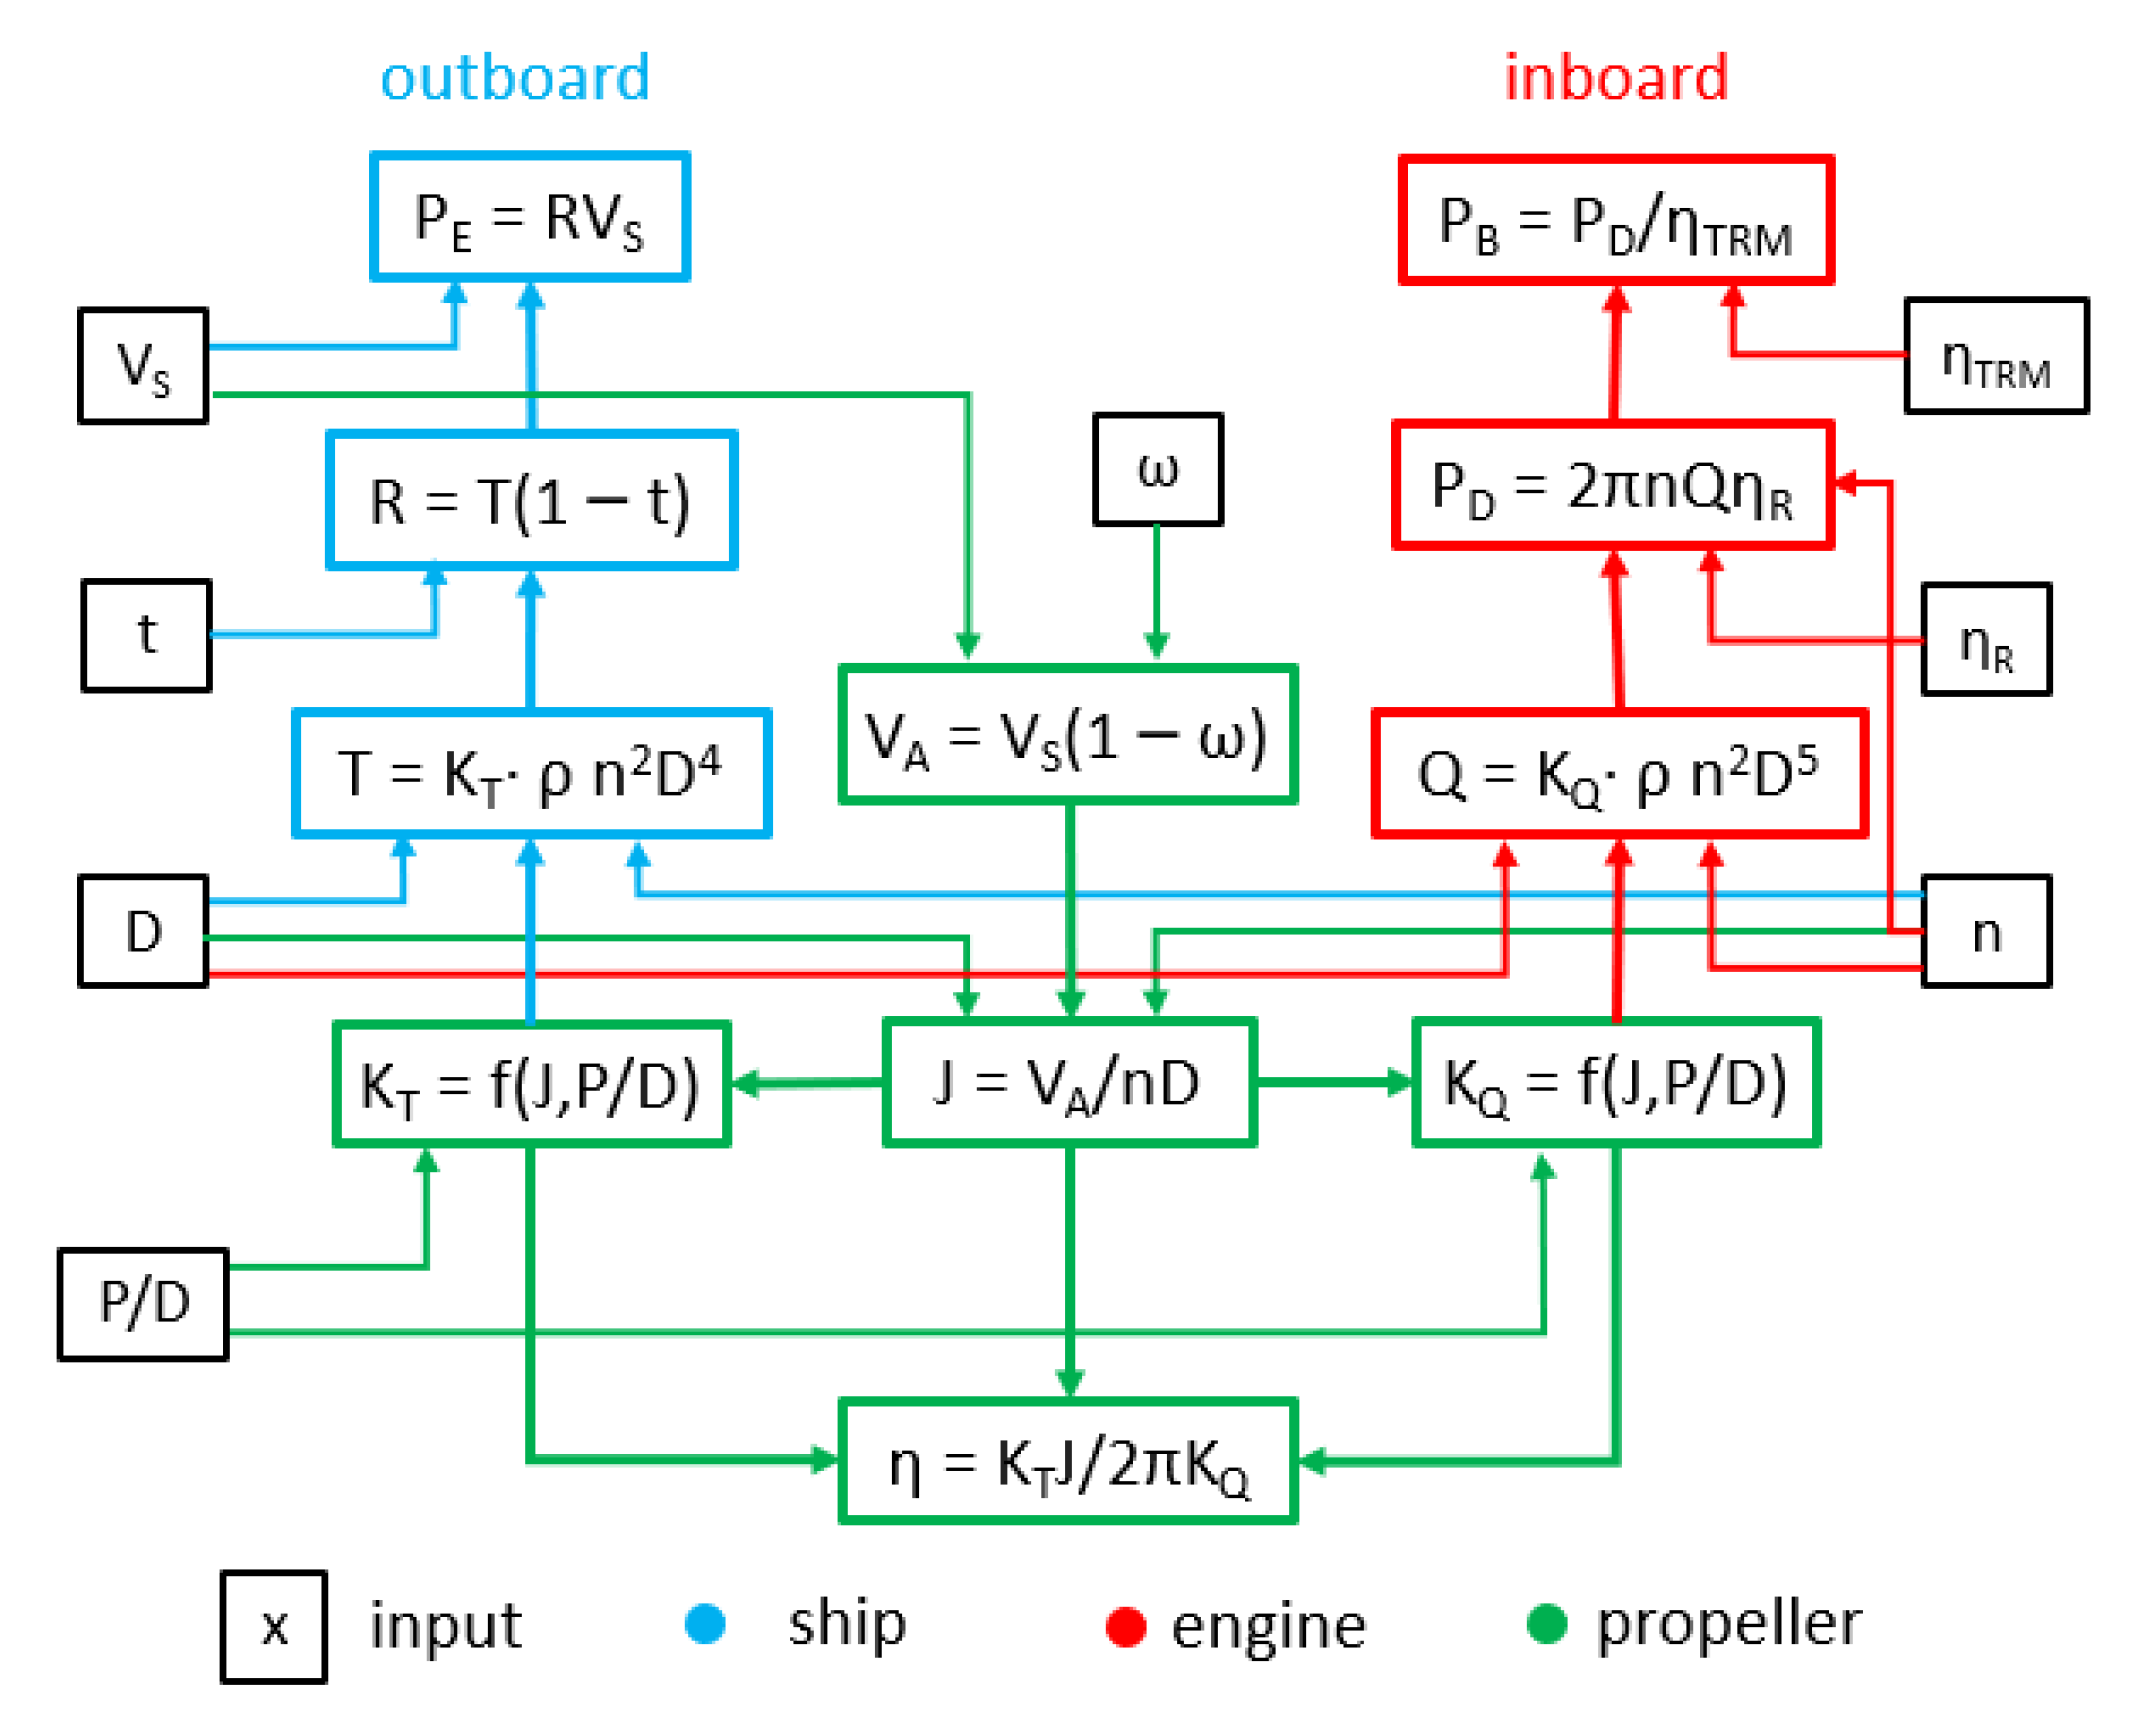
2.1. Basic Principles of Ship–Engine–Propeller Matching

The propulsion system consisting of the main engine, shaft system and propeller is the focus through the whole process of ship design, construction and operation. The engine transforms the fuel chemical energy to the torque during the power stroke at a certain rotational speed, and then the power is transmitted to the propeller by the shaft system to generate the thrust overcoming the ship resistance, so that the ship can sail at a certain translational speed. The relationship of the ship, engine and propeller can be expressed by the framework [51] as shown in Figure 1, and the basic theory of matching was introduced as follows.
From the aspect of ship, when it sails at the speed VS (m/s), the power that overcomes the ship resistance R (N) is called the effective power PE (W), which is expressed by Equation (1):
P E = R V S
According to the dynamic relationship between the ship and propeller, at the same advance velocity, the propeller thrust T (N; which is decreased by multiplying the thrust deduction factor) is equal to the hull resistance R, as shown by Equation (2), where t (–) is the thrust deduction factor.
R = T ( 1 t )
From the perspective of engine, engine brake power PB (W) is transmitted to the delivered power PD (W) of the propeller considering the transmission loss, as shown in Equation (3), where ηTRM (–) is the transmission efficiency. While the delivered power PD actually acts on the propeller in the form of the torque Q (Nm) at a certain rotational speed n (r/s), as shown by Equation (4), where ηR (–) is the relative rotation efficiency.
P D = P B η T R M
P D = 2 π n Q η R
From a system engineering perspective, the hull and the engine are connected by a propeller. According to the hydrodynamic characteristics of the propeller, the thrust T (N) and the torque Q (Nm) of the propeller are respectively represented by Equation (5) and Equation (6).
T = K T ρ n 2 D 4
Q = K Q ρ n 2 D 5
where KT is the thrust coefficient (–), KQ is the torque coefficient (–), ρ is the density of sea water (kg/m3) and D is the diameter of the propeller (m). KT and KQ can be expressed as a function of the advance ratio J (–), which is defined as shown in Equation (7), and ω (–) is the wake factor.
J = V A n D = V S ( 1 ω ) n D
Furthermore, empirical functions of KT and KQ are expressed as propeller geometries. Taking B-series propeller as an example, polynomials have been fitted to the Wageningen KT and KQ data, as shown in Equation (8) and Equation (9) [52].
K T = n = 1 39 C n ( J ) s n ( P / D ) t n ( A E / A o ) u n ( Z ) v n
K Q = n = 1 47 C n ( J ) s n ( P / D ) t n ( A E / A o ) u n ( Z ) v n
where P/D is the pitch ratio (–), Ae/Ao is the area ratio (–), Z is the number of blades (–) and Cn, Sn, tn, un and Vn are the coefficient for the series separately (–).
When the propeller is selected, i.e., the area ratio and the blade number have been determined, the thrust coefficient KT and the torque coefficient KQ are functions of the pitch ratio and the advance ratio, i.e., KT = f(J, P/D) and KQ = f(J, P/D).
Finally, the propeller open water efficiency ηO (–) can be calculated by Equation (10), which is always considered to be the goal of matching.
η O = K T K Q J 2 π
However, the different combinations of inputs or outputs makes the ship–engine–propeller matching complex, thus there are mainly three cases of matching in use, as Table 1 shows. Among the inputs, wake factor, thrust deduction factor, propeller area ratio, shaft efficiency and relative rotation efficiency are generally fixed, while ship speed, resistance, propeller diameter and engine brake power can be changed by the designers.
In Case 1, ship resistance R (or ship effective power PE) and ship speed VS were given, which means the ship information was known and the matching process was from outboard to inboard. Since the resistance was known, the Equation (11) could be deduced from the above basic principles eliminating the unknown propeller rotational speed. Therefore, KT/J2 was taken as a constraint, as shown in Figure 2a. The crossing point where the corresponding efficiency was the largest in the propeller open water characteristic was the design condition with KT/J2 as a constraint. Once the open water efficiency was determined, the brake power of engine could be calculated as well by the energy chain of propulsion [11].
K T = T ρ n 2 D 4 = R ρ V S 2 ( 1 ω ) 2 J 2 D 2 D 4 ( 1 t ) = R ρ V S 2 ( 1 ω ) 2 D 2 ( 1 t ) J 2
In Case 2, the engine brake power PB (or propeller delivered power PD) and ship speed VS were given. Contrary to Case 1, the engine information was known and the matching process was from the inboard to the outboard. Since the engine brake power was known, Equation (12) could be deduced according to the basic principle of matching and the unknown propeller rotational speed was eliminated. The ship speed however was still an input so the method was not truly ’inboard’. Therefore, KQ/J3 was taken as a constraint, as shown in Figure 2b. Like the previous case, the crossing point with the largest efficiency could be chosen as the propeller design condition. Similarly, the effective power of the ship at that speed could be calculated by an energy chain.
K Q = Q ρ n 2 D 5 = P D 2 π ρ V S 3 ( 1 ω ) 3 J 3 D 3 D 5 = P B 2 π ρ V S 3 ( 1 ω ) 3 D 2 η TRM J 3
In Case 3, the maximum attainable ship speed was predicted when the brake power and resistance curve (R–VS curve) were given. That is to say, in this case the brake power and resistance curve (R–VS curve) were the inputs and the ship speed was to be designed. So, Case 3 was more complicated starting at both the hull and the engine. To solve this matching problem, the looping could be used. Using the looping, an adequate set of ship speeds was assumed, and at each speed, combined with the engine information, the ship effective power was calculated. Once the calculated ship effective power was equal to the given one, the balance of propulsion system was met, see Figure 3, so the ship speed was then the desired one.
Attention should be paid that at each ship speed, the input values of Case 3 were exactly the same as Case 2, so Case 2 could be regarded as a single step of Case 3 and it was performed at each speed to obtain the pitch ratio, rotational speed and effective power of the ship at the highest efficiency. As a result, the relationship of system matching parameters and ship speed could be known. In Figure 3, the P’EVS curve and PEVS curve represents the actual and calculated effective curve respectively and the intersection of these two lines is the ship design condition. According to the ship speed of the point, propeller parameters, such as pitch ratio, rotational speed and efficiency, were obtained as well. If the calculation was based on the CSR (continuous service rating) power of engine, the speed obtained was the service speed. If the MCR (maximum continuous rating) power was used for calculation, the speed obtained was the maximum speed.

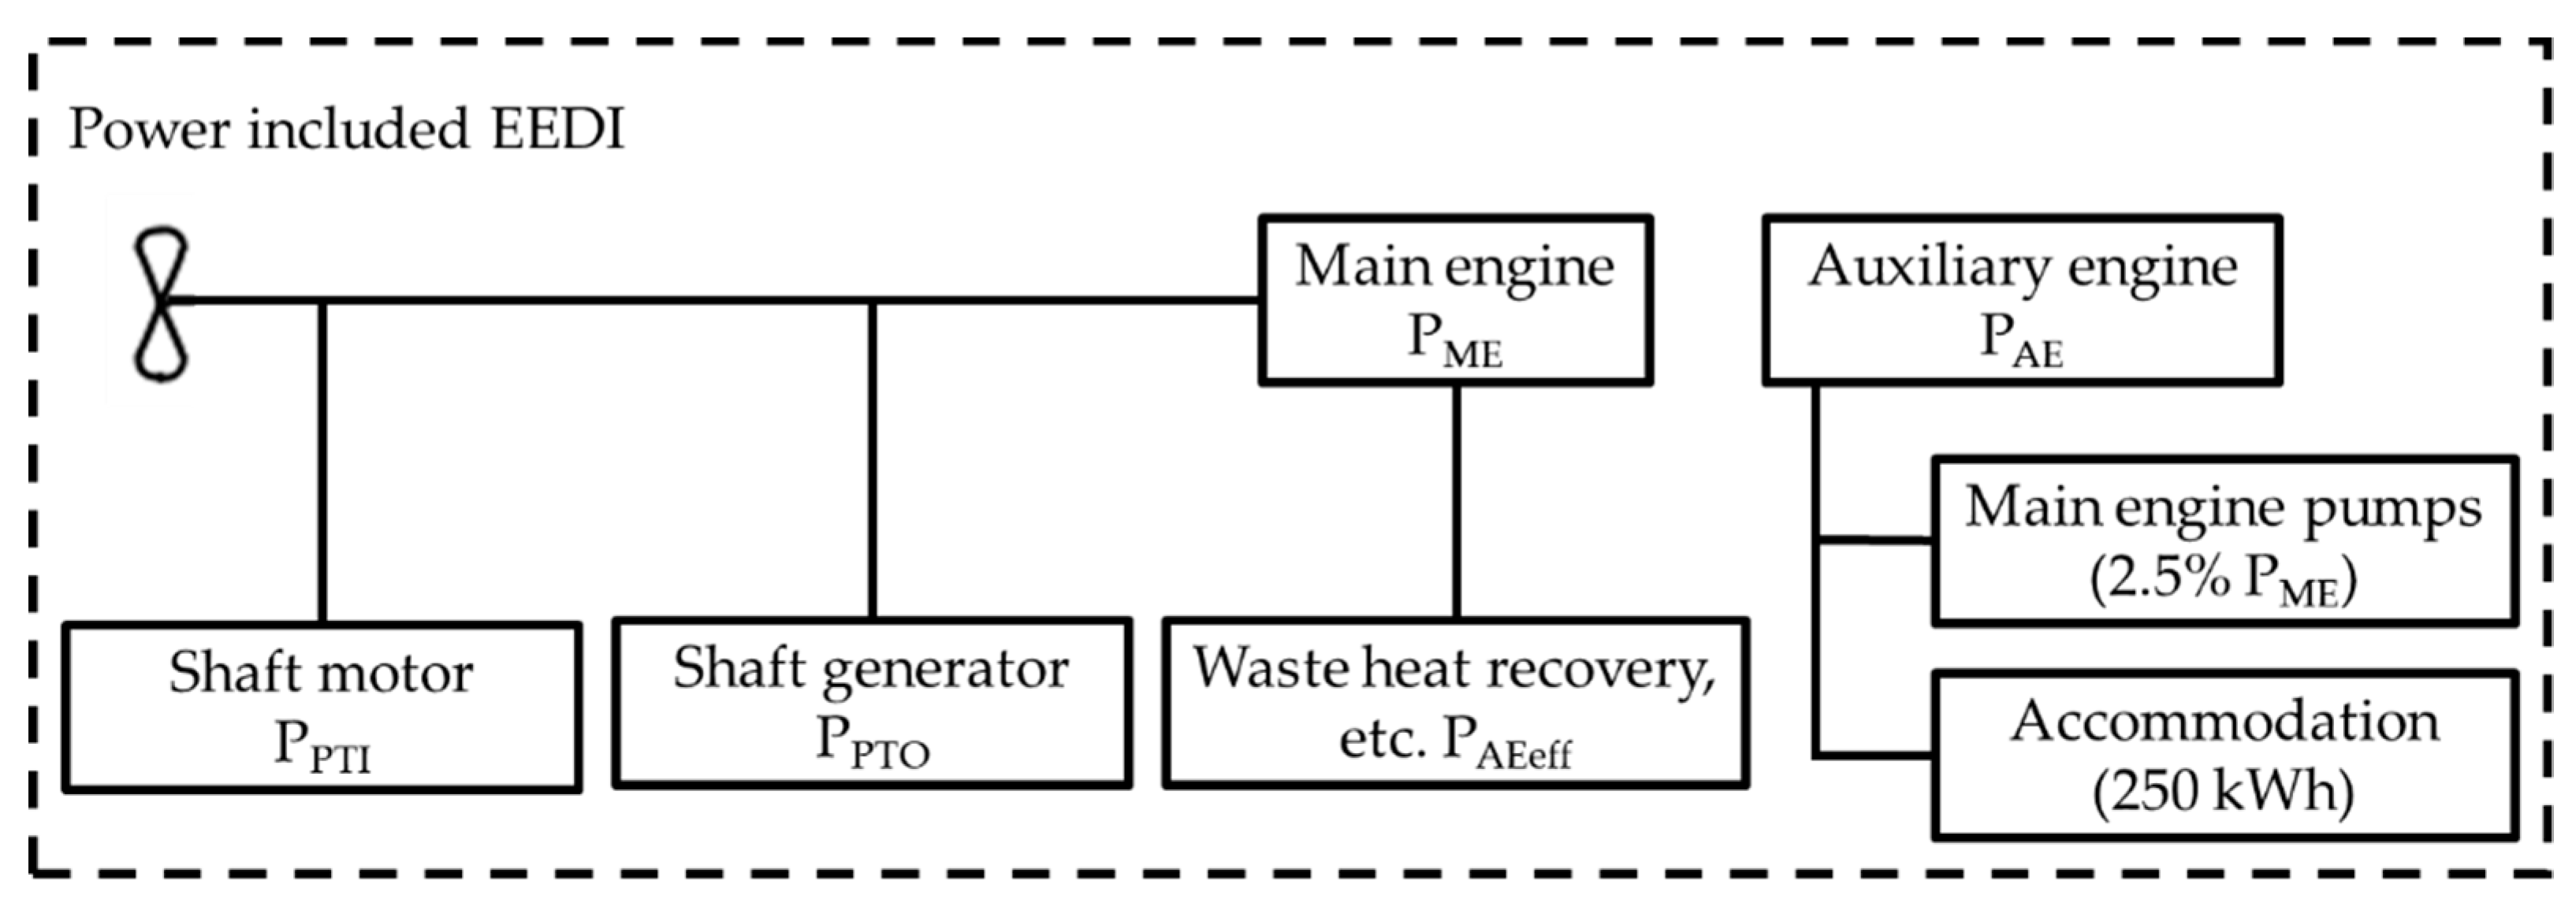
2.2. Basic Theory of EEDI

EEDI (energy efficiency design index) is a legislation proposed by the International Maritime Organization (IMO) for calculating the energy efficiency of ships. EEDI is an estimate of the CO2 emissions generated per unit of ship transport during the ship design phase and the lower the ship’s EEDI index, the less CO2 emission. EEDI is based on a complex formula, taking the ship’s emissions, capacity and speed into account. According to the ICCT’s (International Council on Clean Transportation) definition of EEDI [3], it can be calculated as Equation (13) shows, and the power of the equipment involved is shown in the Figure 4.
EEDI = ( j = 1 M f j ) ( i = 1 n M E P M E ( i ) C F M E ( i ) S F C M E ( i ) ) + ( P A E C F A E SF C A E ) f w f l f i   Capacity . V ref f w + ( ( j = 1 M f j i = 1 nPTI P PTI ( i ) i = 1 neff f eff ( i ) P AEeff ( i ) ) C FAE SF C AE ) ( i = 1 neff f eff ( i ) P eff ( i ) C FME SF C ME ) f w f l f i   Capacity . V ref f w
In Equation (13), P is the individual engine power at 75% of MCR, (kW), C is the CO2 emission factor based on of fuel type used by the given engine, (t-CO2/t-Fuel), SFC is the specific fuel consumed per unit of engine power, as certified by manufacturer, (g/kWh), f is the non-dimensional factors that were added to the EEDI equation to account for some specific existing conditions, Vref is the ship speed at maximum design load condition, (kn), Capacity is the deadweight tonnage (DWT) for bulk ships, (t).
According to MARPOL Annex VI [50], the attained EEDI should be as follows:
Attained   EEDI Required   EEDI = ( 1 X 100 ) reference line value
where X is the reduction factor specified in Table 2 for the required EEDI compared to the EEDI reference line.
The reference line values shall be calculated as follows:
Reference   line   value   =   a b c
where a, b and c are the parameters given in Table 3.
For a new-built ship, the attained EEDI is calculated by Equation (13), and its required EEDI is recommended by Equations (14) and (15). Only meeting the requirement that the attained ≤EEDI required EEDI, can this ship get a EEDI license.

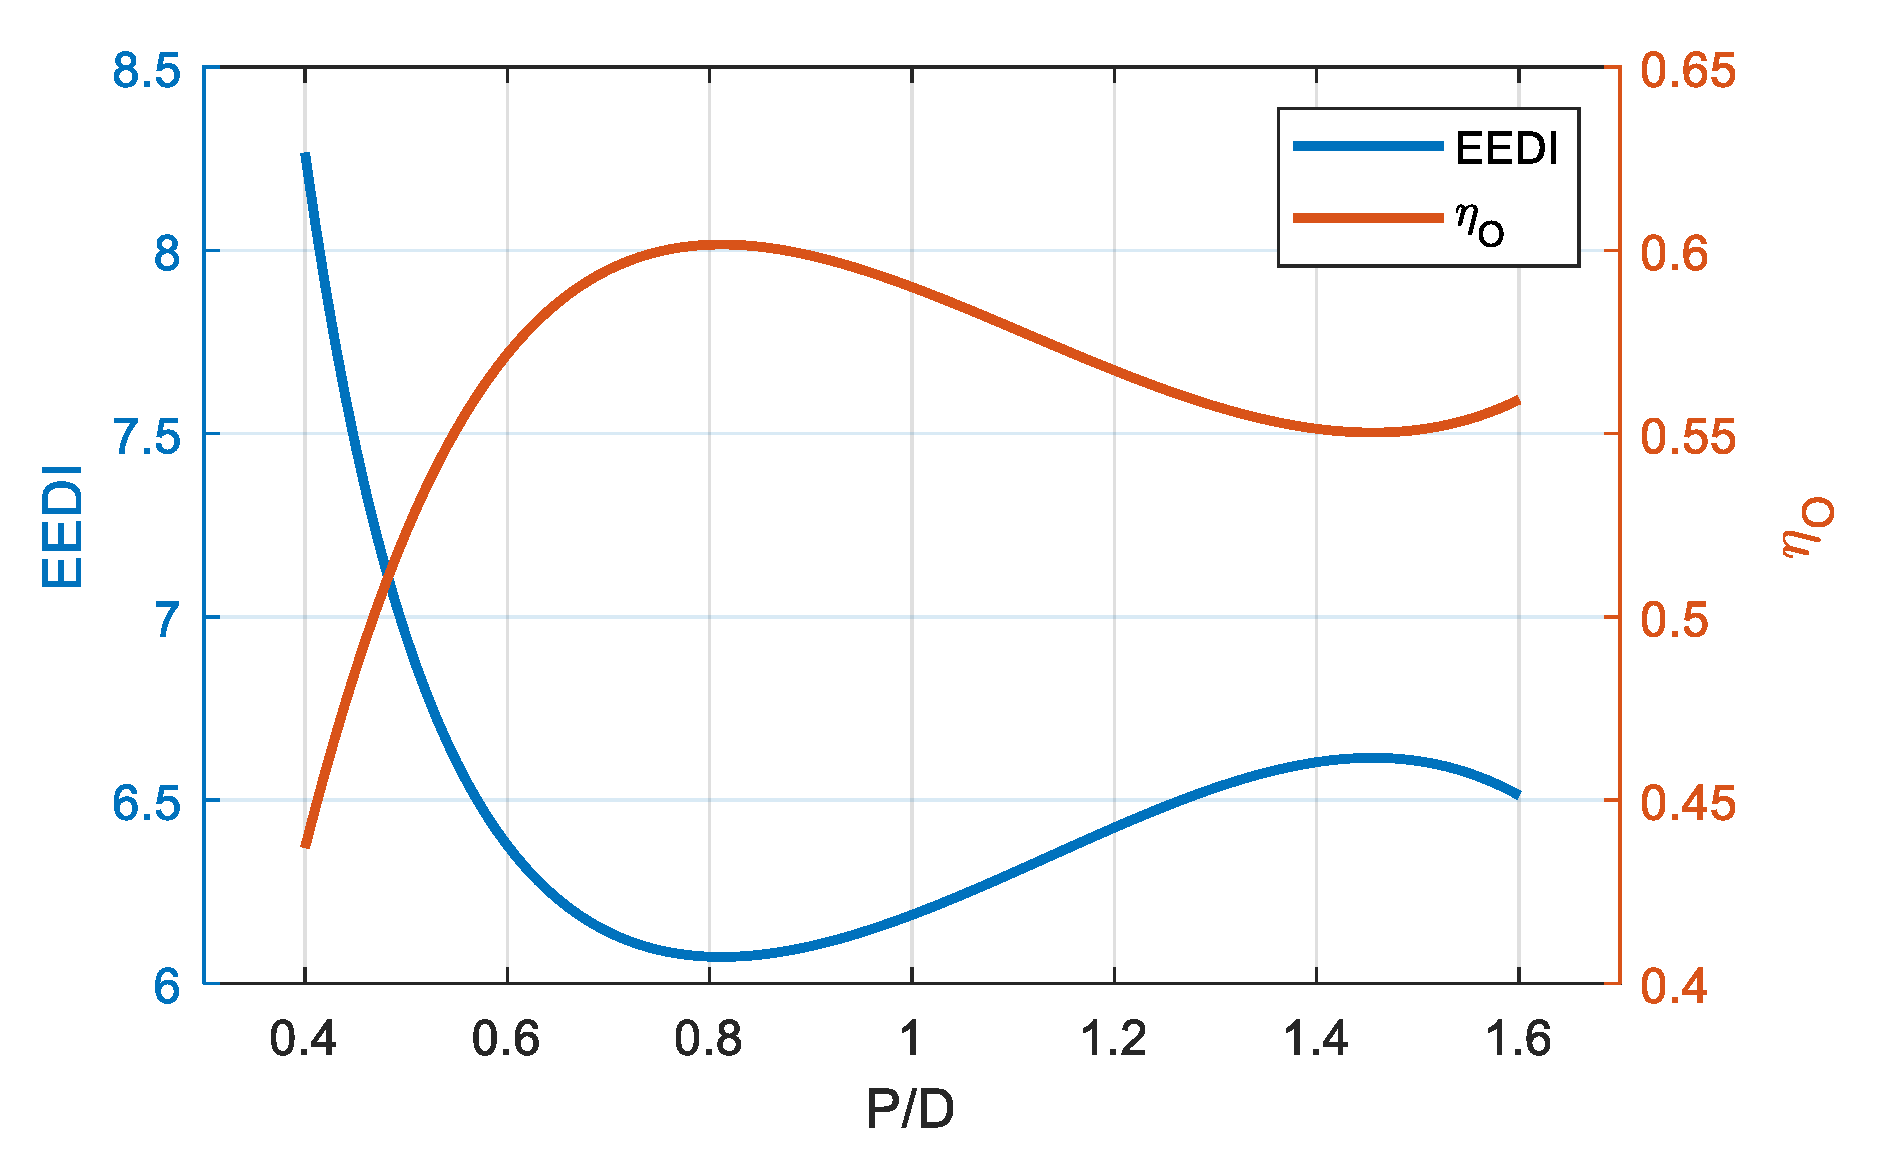
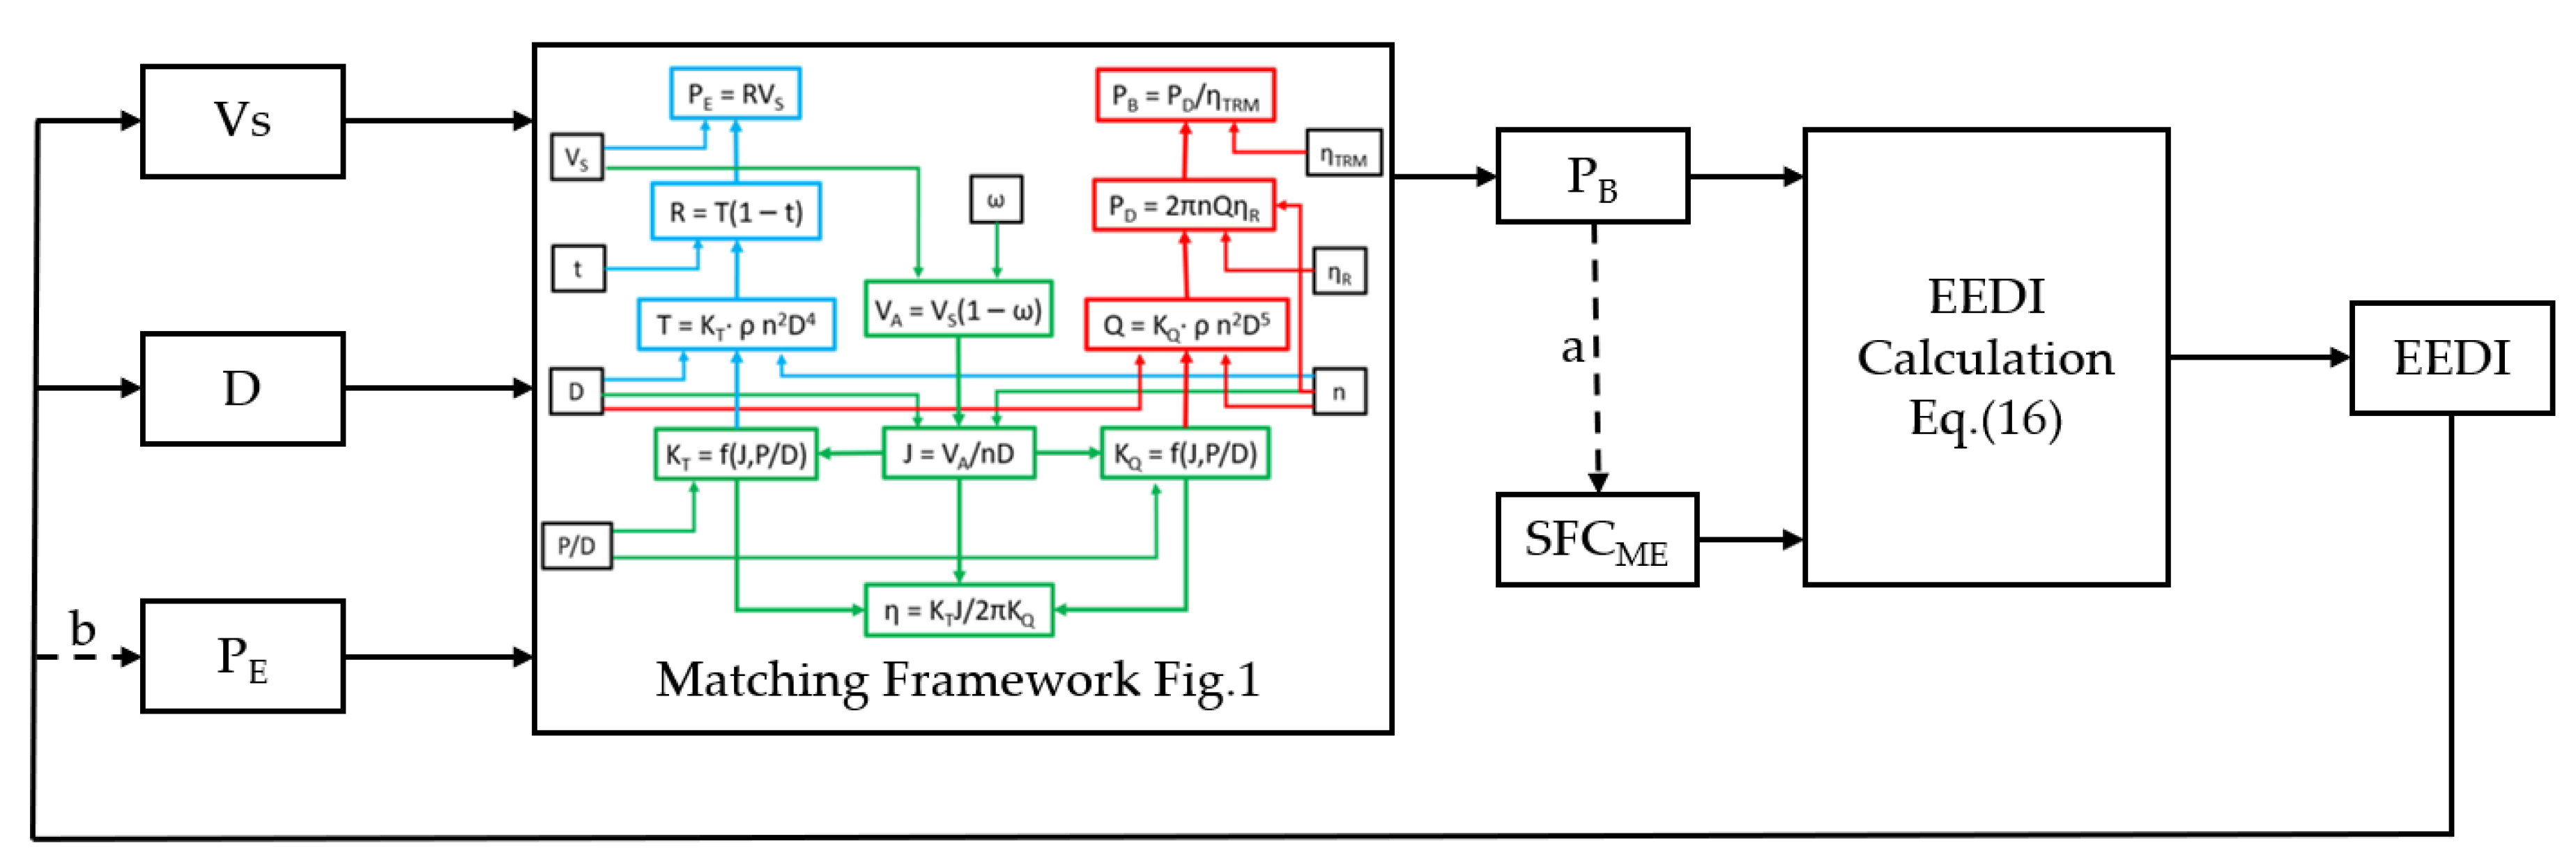
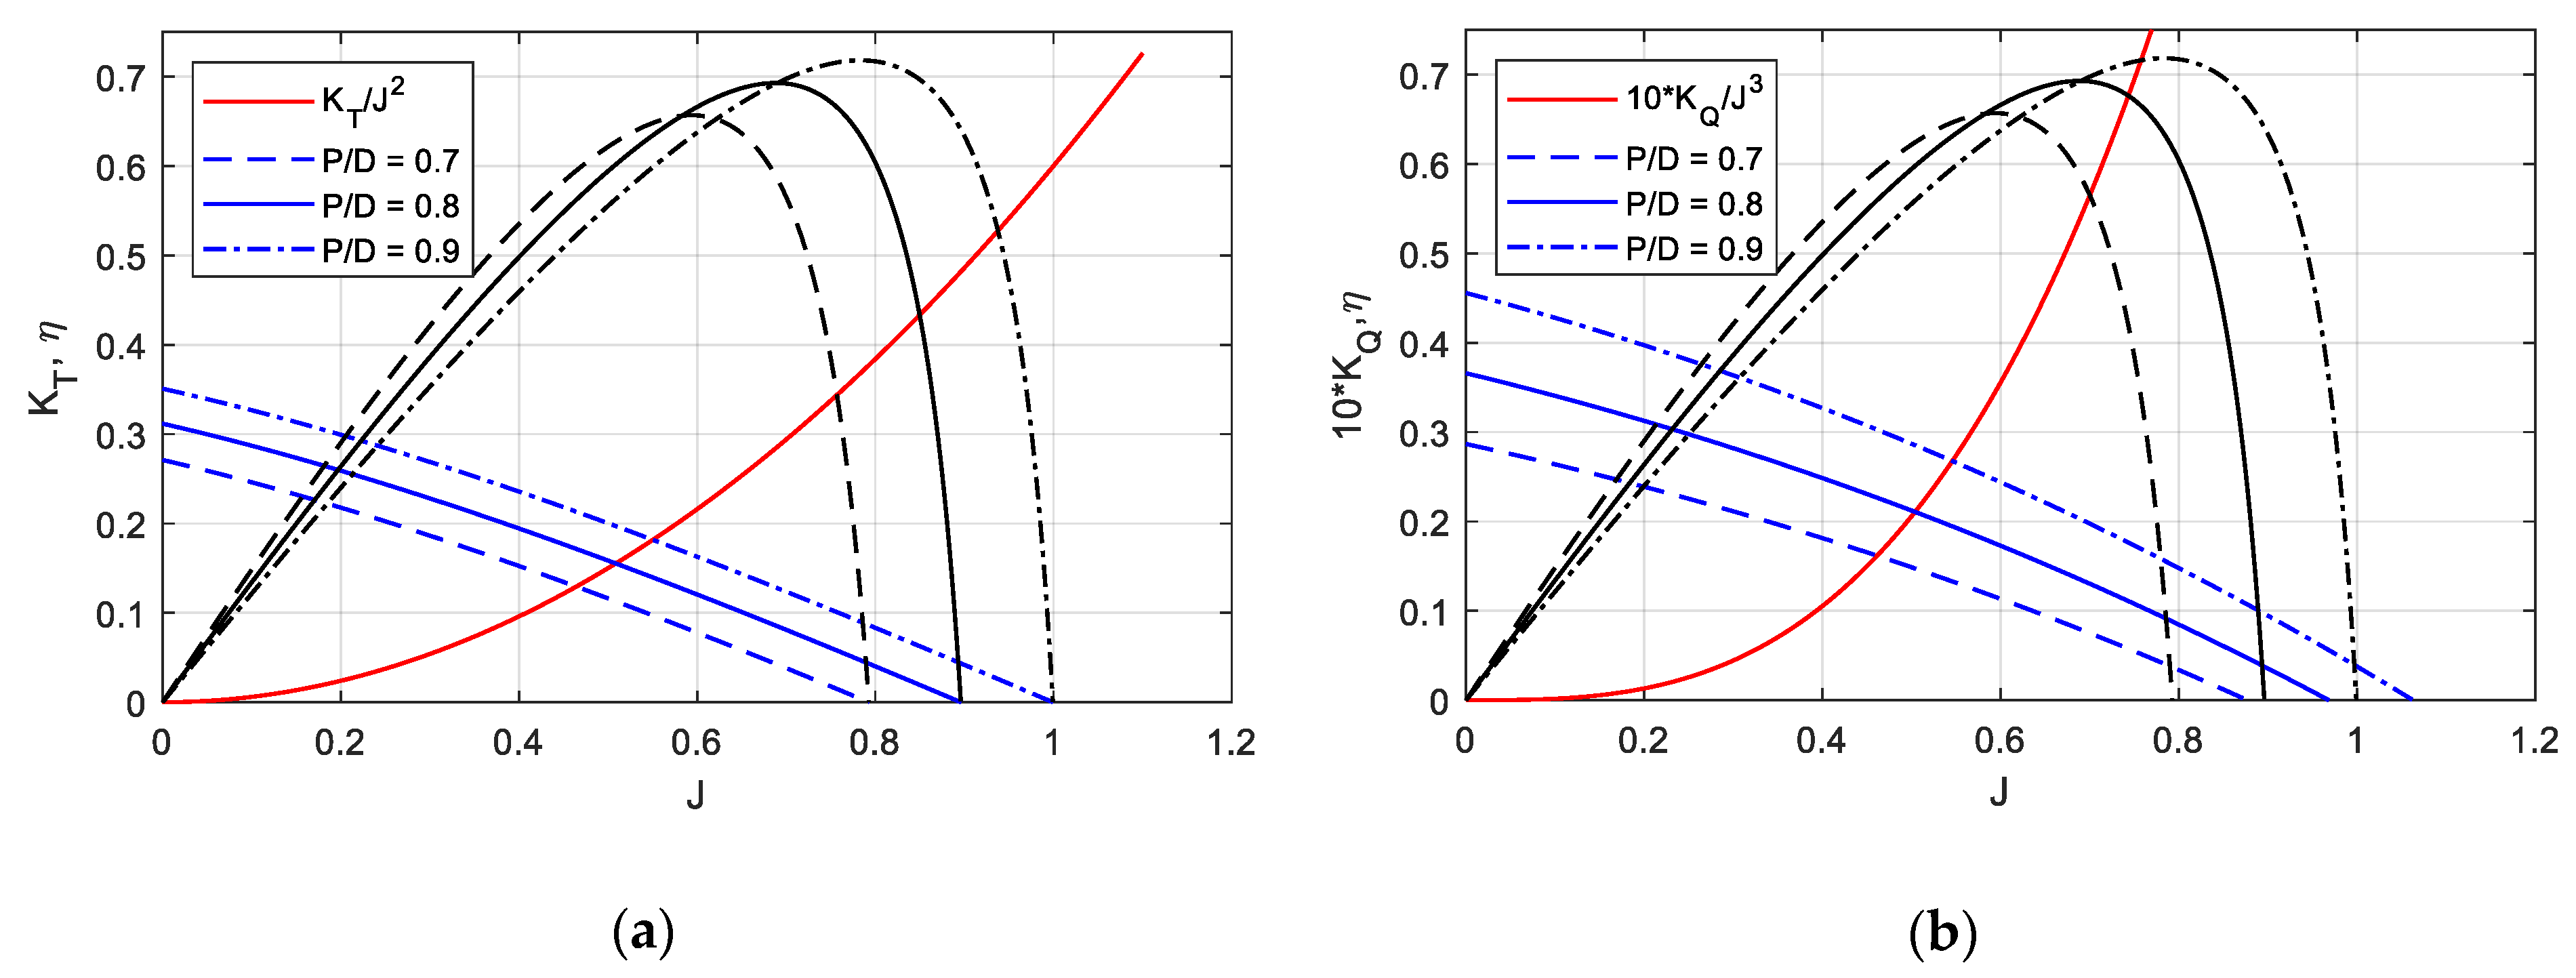
2.3. Relationship between EEDI and the Propeller Open Water Efficiency in Matching

For the direct-drive diesel engine propulsion system with only propulsion power considering, EEDI can be expressed as follows and the detailed information on the parameters can be found in Section 3.3:
EEDI = f j P ME C FME SF C ME + P AE C FAE SF C AE f c f l f i   Capacity V ref   f w
In Equation (16), PAE, the required auxiliary engine power to supply the necessary power for propulsion machinery and accommodation, can be defined as Equation (17) [50], and for a specific ship, it is regarded as a constant.
P AE = { 0.025 × MC R ME + 250 MC R ME 10000 kW 0.05 × MC R ME MC R ME < 10000 kW
In order to study the relationship between EEDI and propeller open water efficiency (the most important target in matching), the SFC is normally regarded as a constant, and then the EEDI formula is simplified as Equation (18) shows, and c1c7 represent the constants involved,
EEDI = f j P ME C FME SF C ME + P AE C FAE SF C AE f c f l f i   Capacity V ref   f w = c 1 P ME + c 2 c 3 Capacity V ref
where c 1 = f j C FME SF C ME , c 2 = P AE C FAE SF C AE and c 3 = f c f l f i   f w
According to the propulsion energy chain, PME can be calculated from the ship effective power and some related efficiency, see Equation (19).
P ME = P E η TRM η D = P E η TRM η H η O η R
Therefore, Equation (20) can be converted as follows:
EEDI = c 1 P ME + c 2 c 3 Capacity . V ref = c 1 P E c 3 Capacity V ref η TRM η H η O η R + c 2 c 3 Capacity V ref = c 4 P E Capacity V ref η O + c 5 Capacity V ref
where c 4 = c 1 c 3 η TRM η H η R and c 5 = c 2 c 3 .
If the Capacity, Vref and PE are given for a certain ship, the EEDI and open water efficiency satisfy the following equation:
EEDI = c 6 η O + c 7
where c 6 = c 4 P E Capacity V ref and c 7 = c 5 Capacity V ref .
It can be seen from Equation (21) that EEDI is approximately inversely proportional to the open water efficiency of propeller, which means the process to achieve the maximum open water efficiency can also get the minimum EEDI in general matching.

3. Results and Analysis

3.1. The Ship Bench Mark

The calibration is based on the data of the 38800 DWT bulk carrier. The relevant data, from trial report of shipyard, are shown as follows in Table 4 and Table 5.
In the matching process, the propeller characteristic is crucial due to the transfer of the energy from engine to the ship hull. For this ship, the installed propeller was a special one with the open water characteristics, which is from the ship design company as shown in Figure 5. As to the engine, since the fuel consumption would be used in the calculation of EEDI, the fuel consumption of each condition was obtained from the manual of the engine manufacturer.

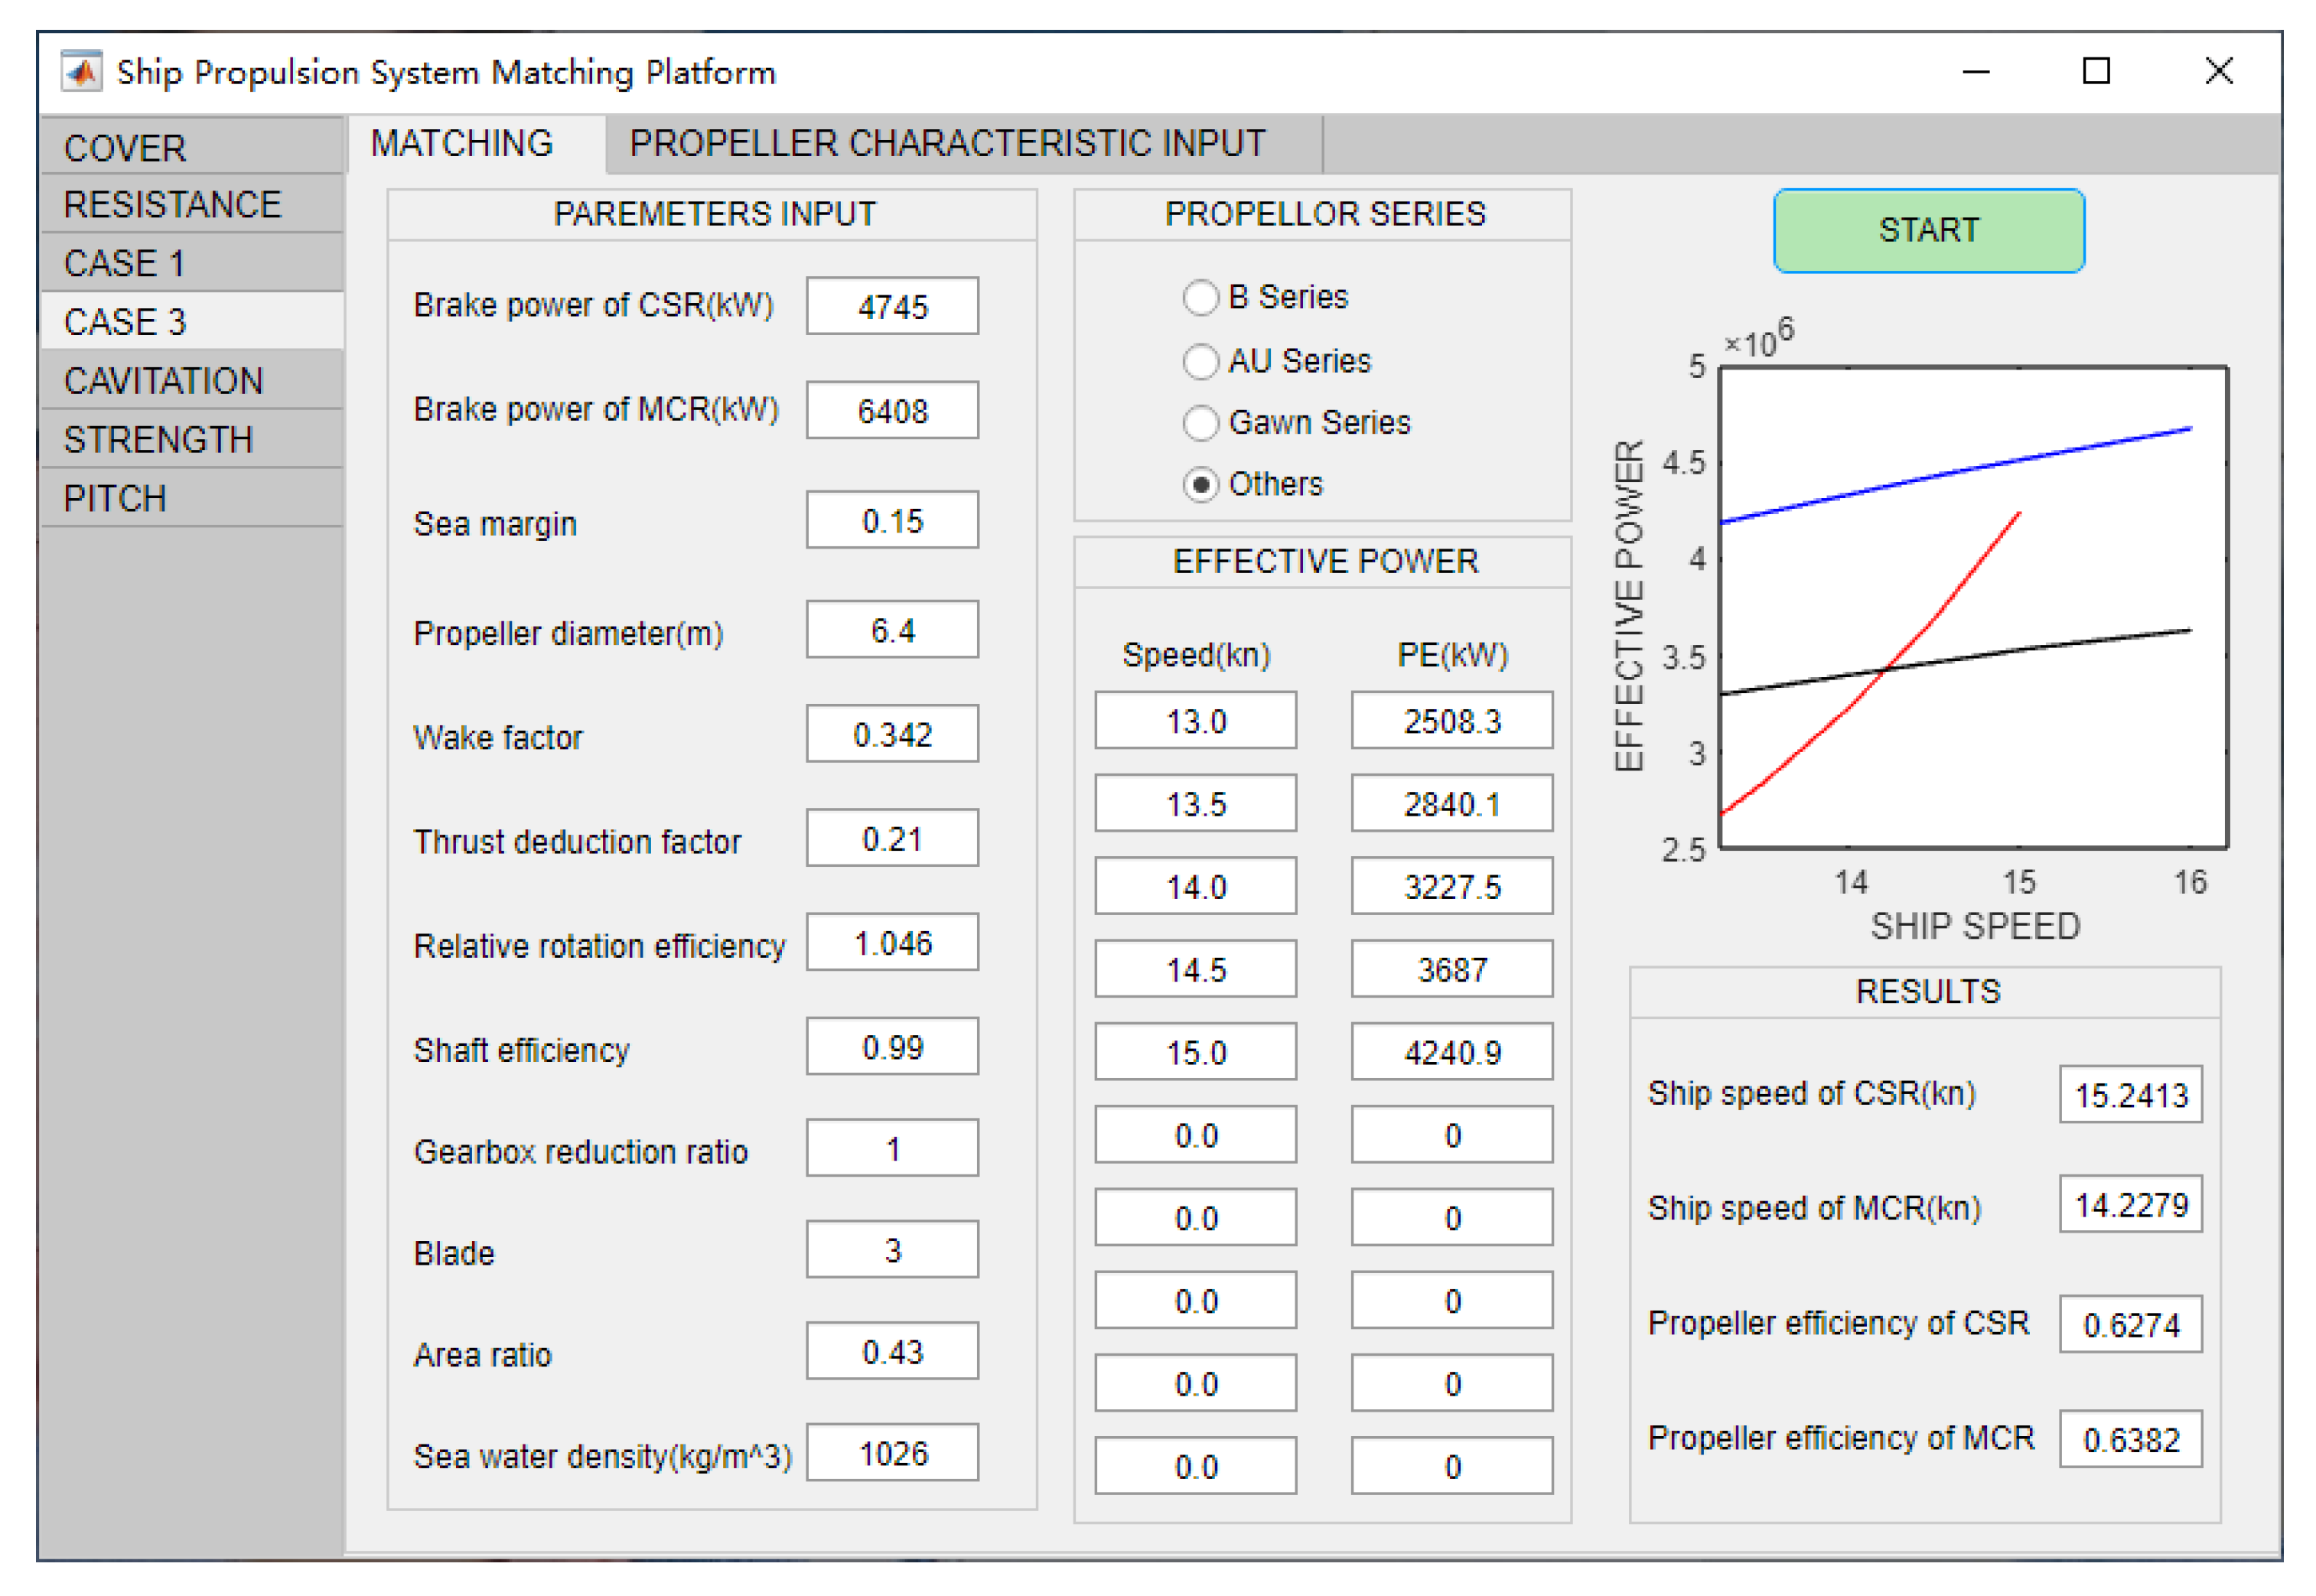
3.2. Results of Ship–Engine–Propeller Matching

Based on the principle of the ship–engine–propeller matching as discussed before, a system matching platform (part of the interface is shown in Figure 6) was compiled to perform the matching calculation with the data of 38800 DWT bulk carrier.
As the results shown in Table 6, the engine power and rotational speed errors at CSR were 2.89% and 1.58% respectively, which could be explained by the difference between the sea trial data and the system platform data, while the later one was provided by the hull designer or empirical formula. In order to meet the actual power of MCR, the engine margin was set to 25% in this simulation, although this value was not commonly selected during ship designing, compared with 28.6% of the actual value.
It can be seen in Table 7, compared with the actual ship speed (14.0 kn) at CSR, the error of ship speed at CSR operating point (14.2 kn) was 1.4%, and the ship speed at MCR was not given by the shipyard, while according to the matching results, the attainable maximum speed was 15.2 knots. In this case, the attainable maximum speed was the ship speed at 100% utilization of engine power, which means the engine margin (EM) setting for lower fuel consumption and a power reserve had turned to an increased ship speed (about 1 knot) in order to be able to catch up delays for the scheduled ships.
The system matching platform in this paper was based on the first principle of ship–engine–propeller matching, and the matching errors between the sea trial data and calculated ones were acceptable. Therefore, the calculation results of matching in this bulk carrier could be regarded as sufficiently accurate and reliable, indicating that the matching investigation was reasonable and feasible, laying the foundation of the research and application of EEDI.

3.3. Results of EEDI Calculation

The calculation of EEDI with the actual value (see Table 8) in the sea trial was conducted as shown in Equations (22)–(24).
P ME = 0.75 × 6408 = 4806 kW
P AE = 0.05 × 6408 = 320.4 kW
EEDI = 1   ×   ( ( 4806   × 3.206 × 160.75 + 320.4 × 3.206 × 215.0 ) + 0 0 ) 1 × 1 × 1 × 38800 × 14 × 1 = 4.97
While based on the results from system matching platform, the calculation of EEDI was conducted with all the correction and adjustment factors set as 1.0, as shown in Equations (25)–(27), and the fuel consumption was 160.64 g/kWh by means of interpolation from the fuel measurement in the engine test bed.
P ME = 0.75 × 6276 = 4707 kW
P AE = 0.05 × 6276 = 313.8 kW
EEDI = 1   ×   ( ( 4707   × 3.206 × 160.64 + 313.8 × 3.206 × 215.0 ) + 0 0 ) 1 × 1 × 1 × 38800 × 14 × 1 = 4.86
The relative error of EEDI based on the actual value from the shipyard and that of the calculated value from the system matching platform was (4.97 − 4.86)/4.97 = 2.2%. From the previous analysis, the error caused by that of the engine power of MCR was 2.06%, which would be transmitted to the PAE and SFCME.
By adding the EEDI calculation formulas to the system matching platform, a new platform was obtained that would display the corresponding EEDI value while outputting a matching result. From the theory of matching, it was found that one set of open water characteristic curves with a certain pitch ratio could only get one desired efficiency and its EEDI value. In order to investigate the relationship between EEDI and propeller open water efficiency, the mature open water characteristic of B series propellers was adopted to obtain the advance ratio, propeller efficiency and EEDI at different pitch ratios. In this case, the fuel consumption was assumed as 190 g/kWh to be consistent with the formula deduction previous, which was used in the calculation of EEDI reference line by IMO [50], thus obtaining the EEDI–ηO curve, as shown in Figure 7.
It can be seen from the figure that ηO was inversely proportional to EEDI. For the confirmation, the regression analysis was performed, and the results are shown in Equation (28) (c6,c7 in Equation (21) was 3.505 and 0.2456 separately) and Table 9, which was consistent with the results of the previous formula derivation.
EEDI = 3.505 η O + 0.2456

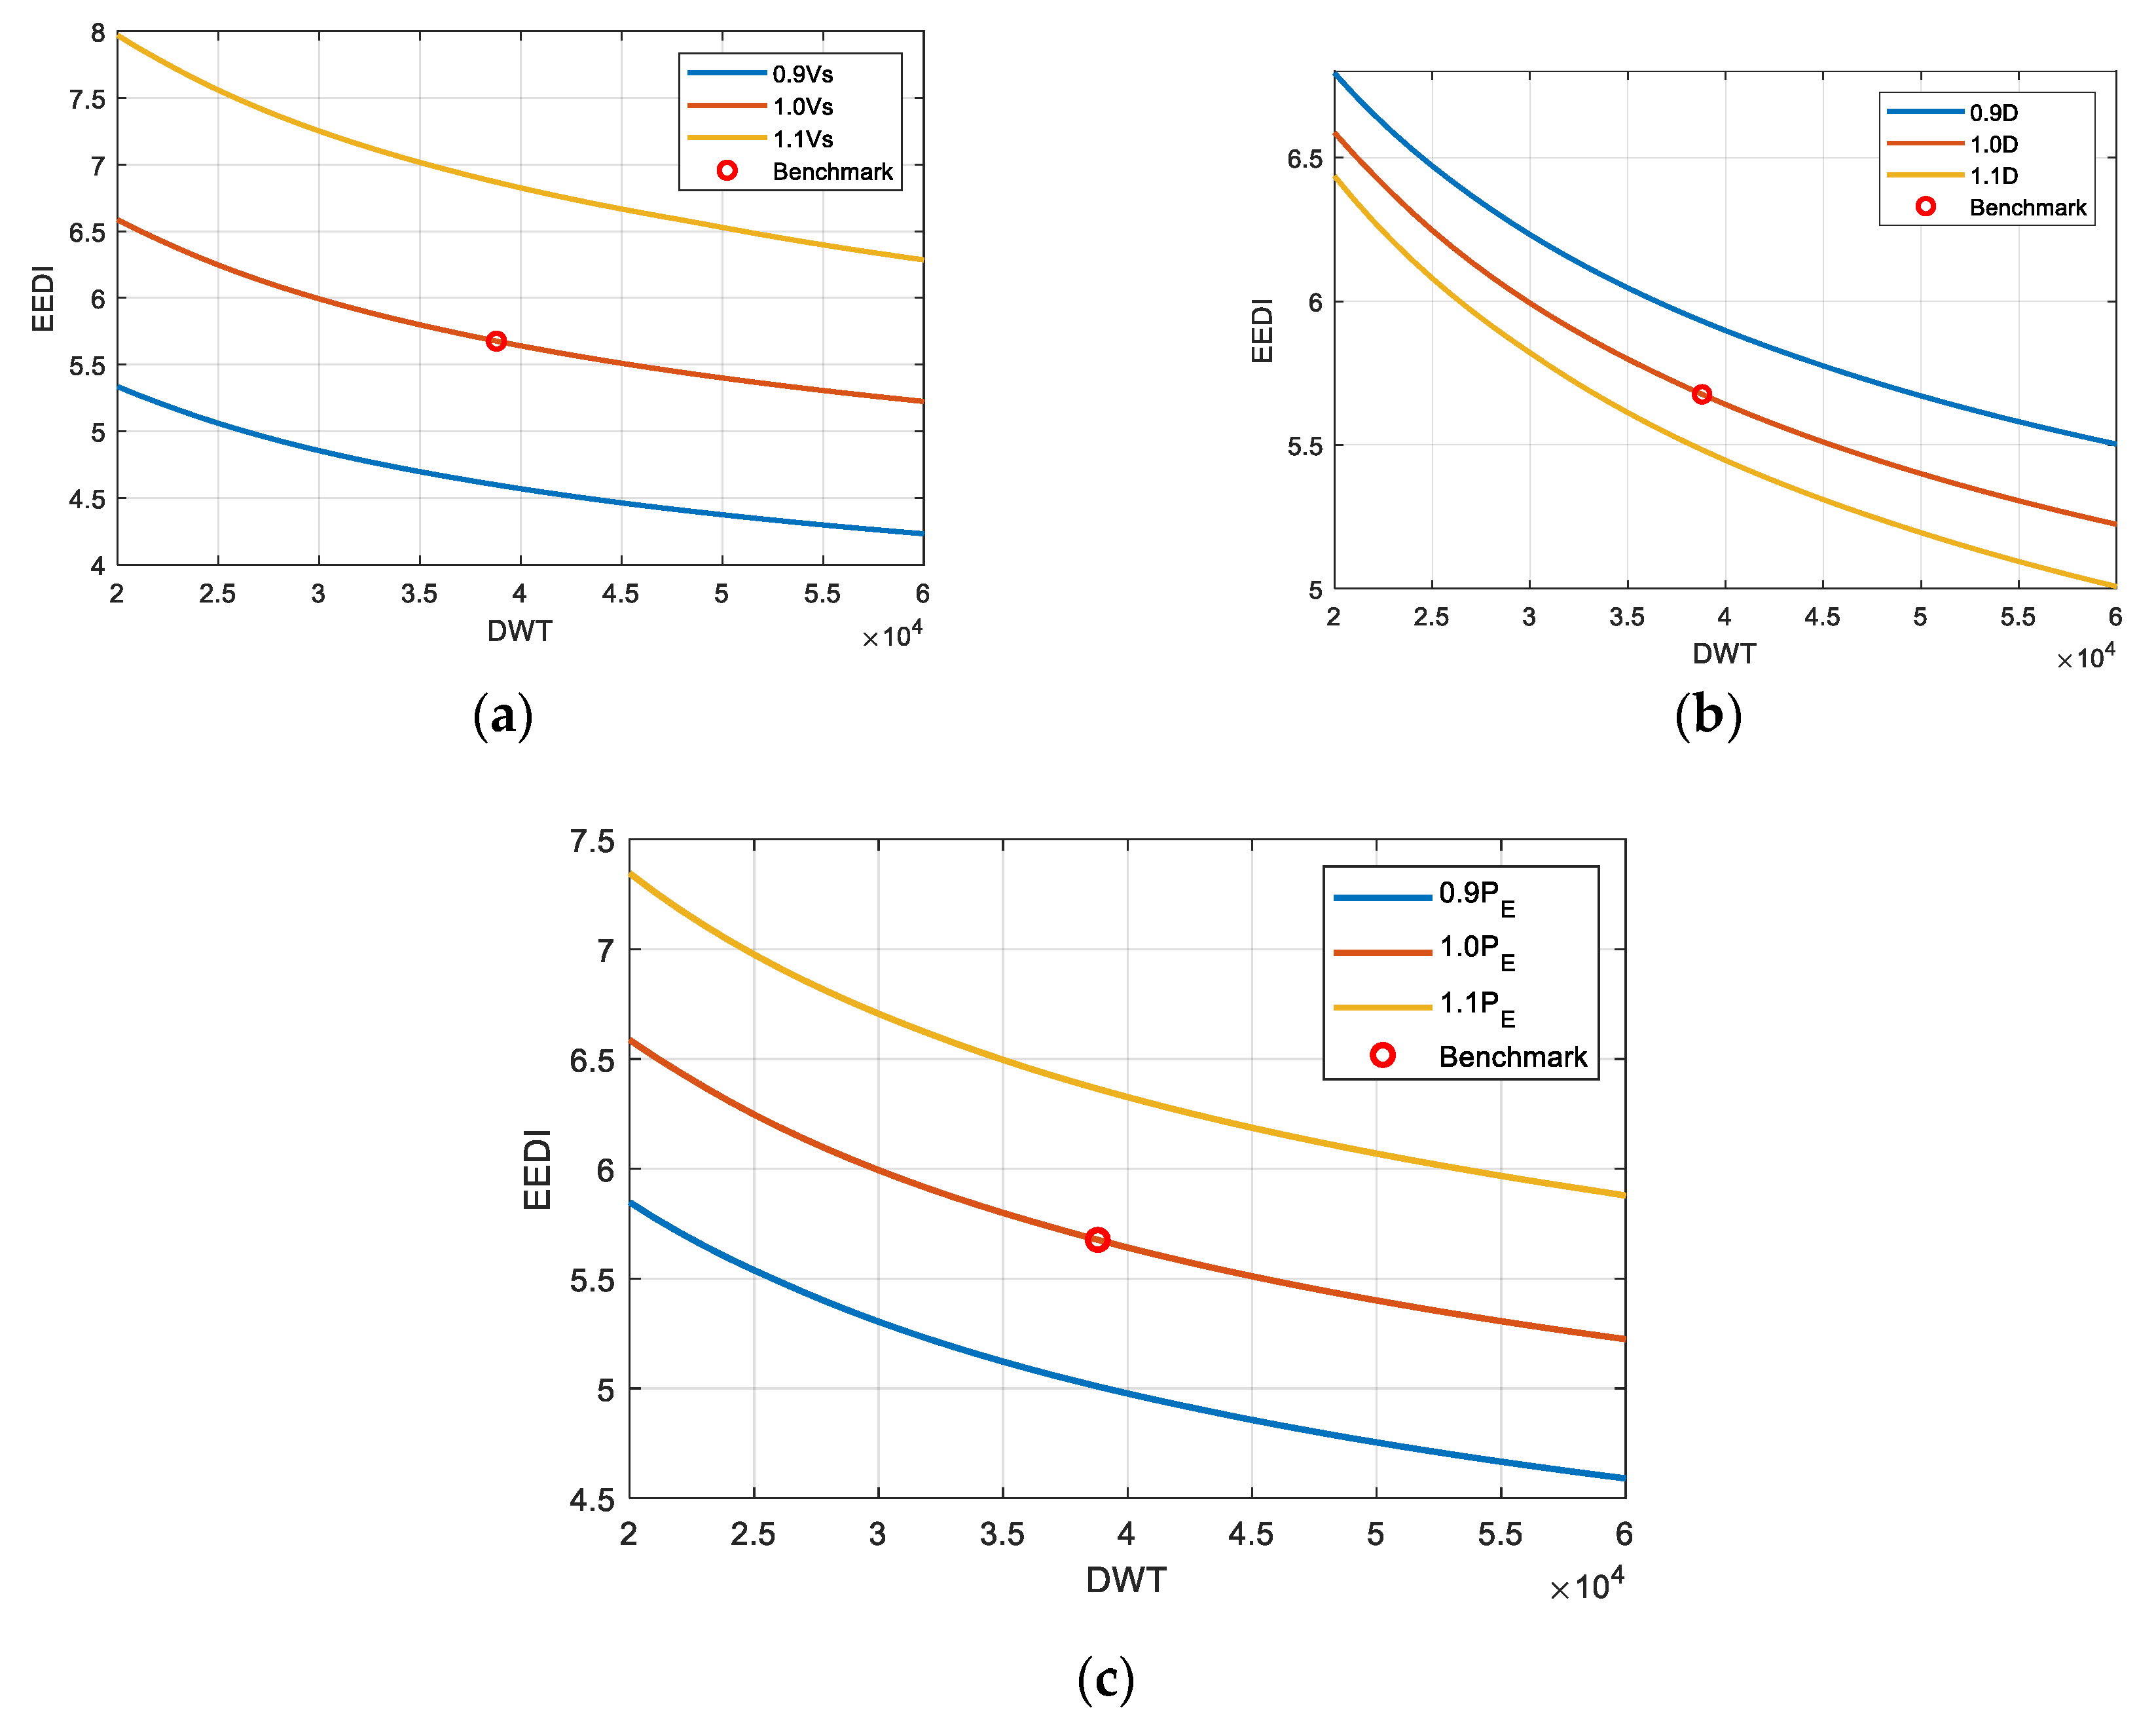
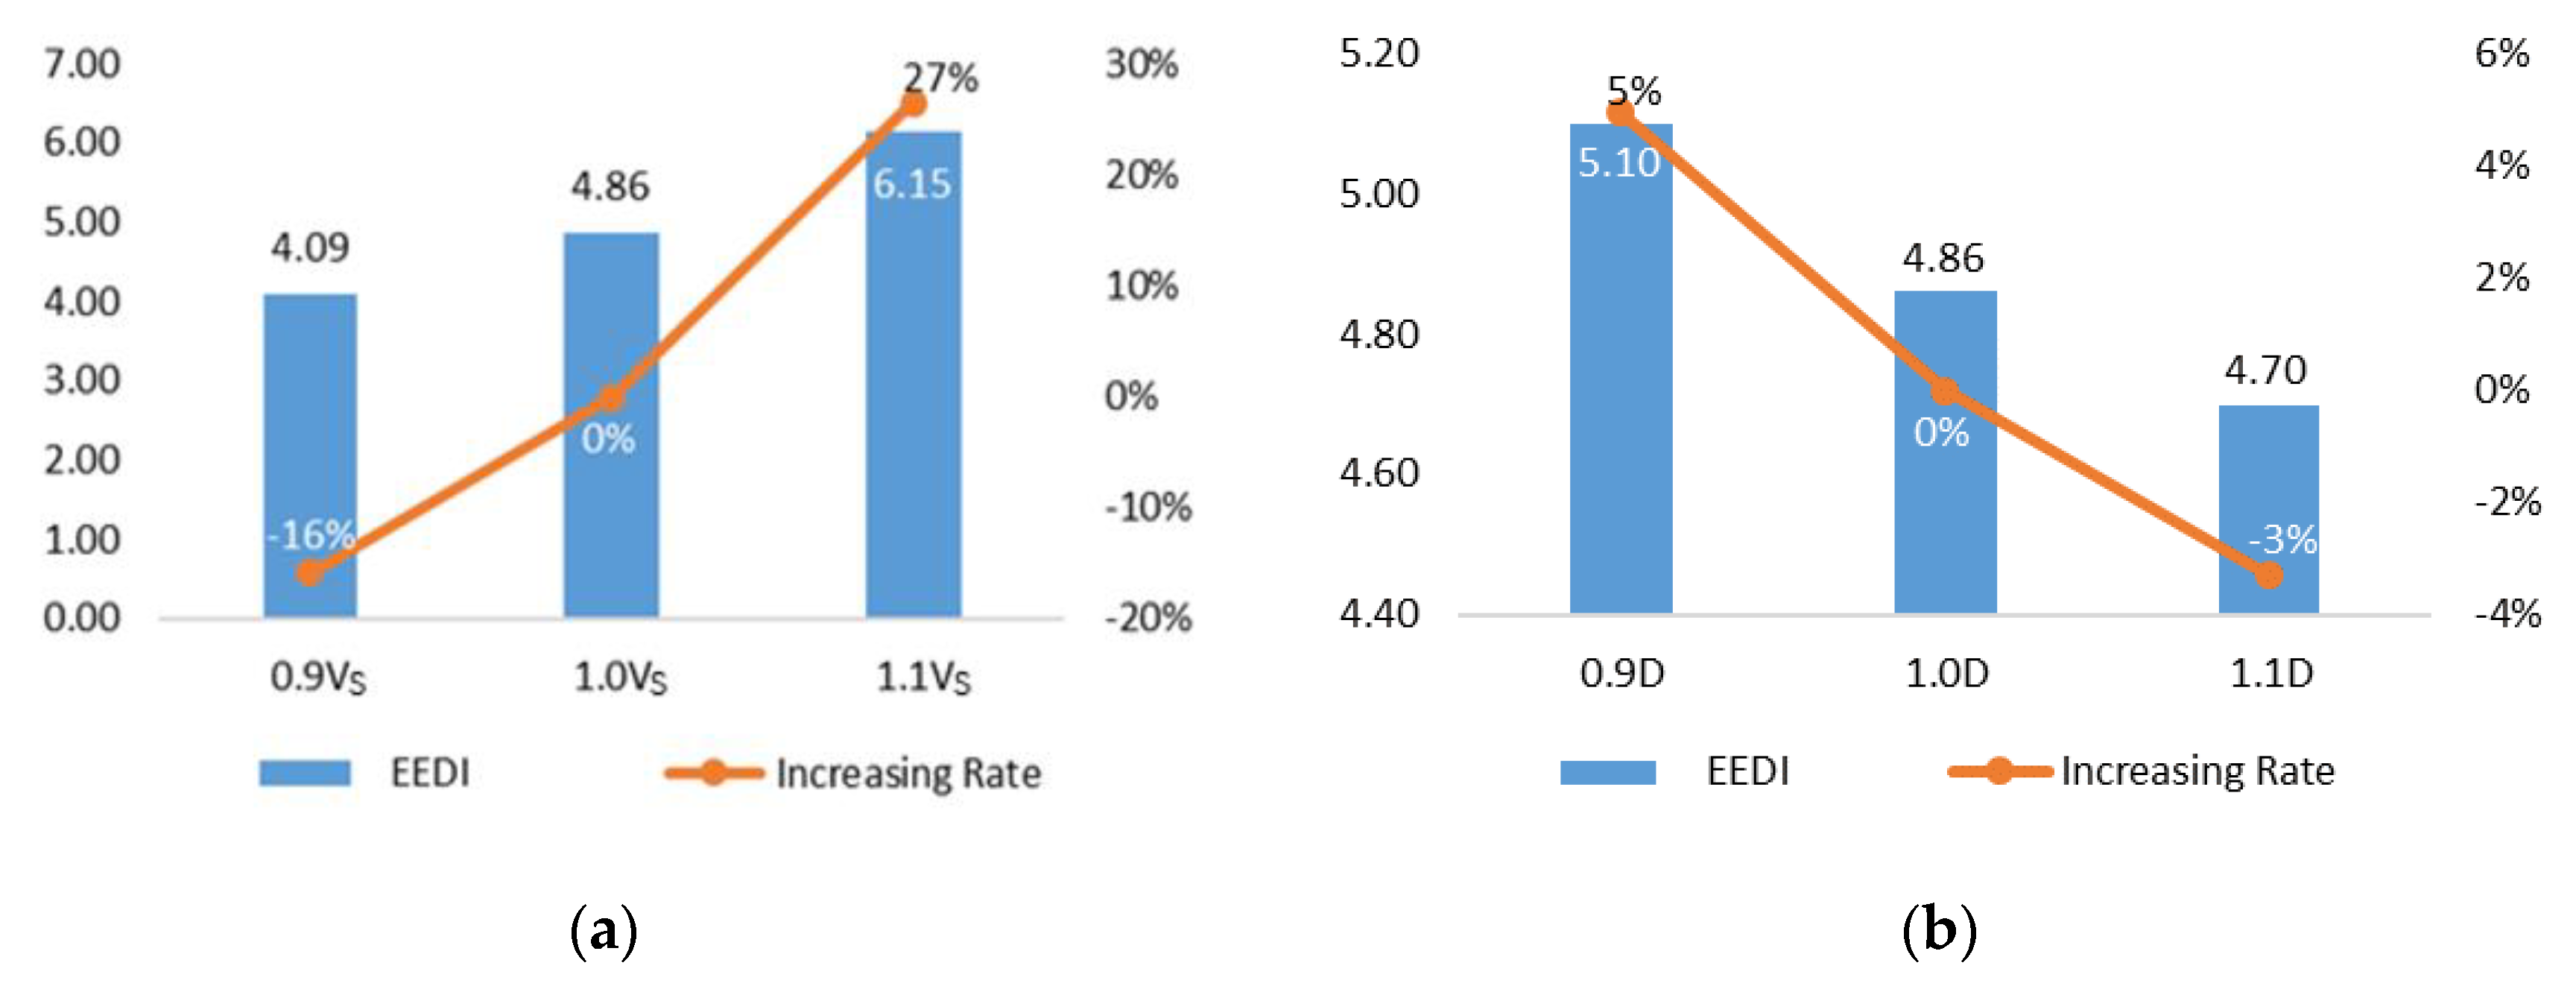
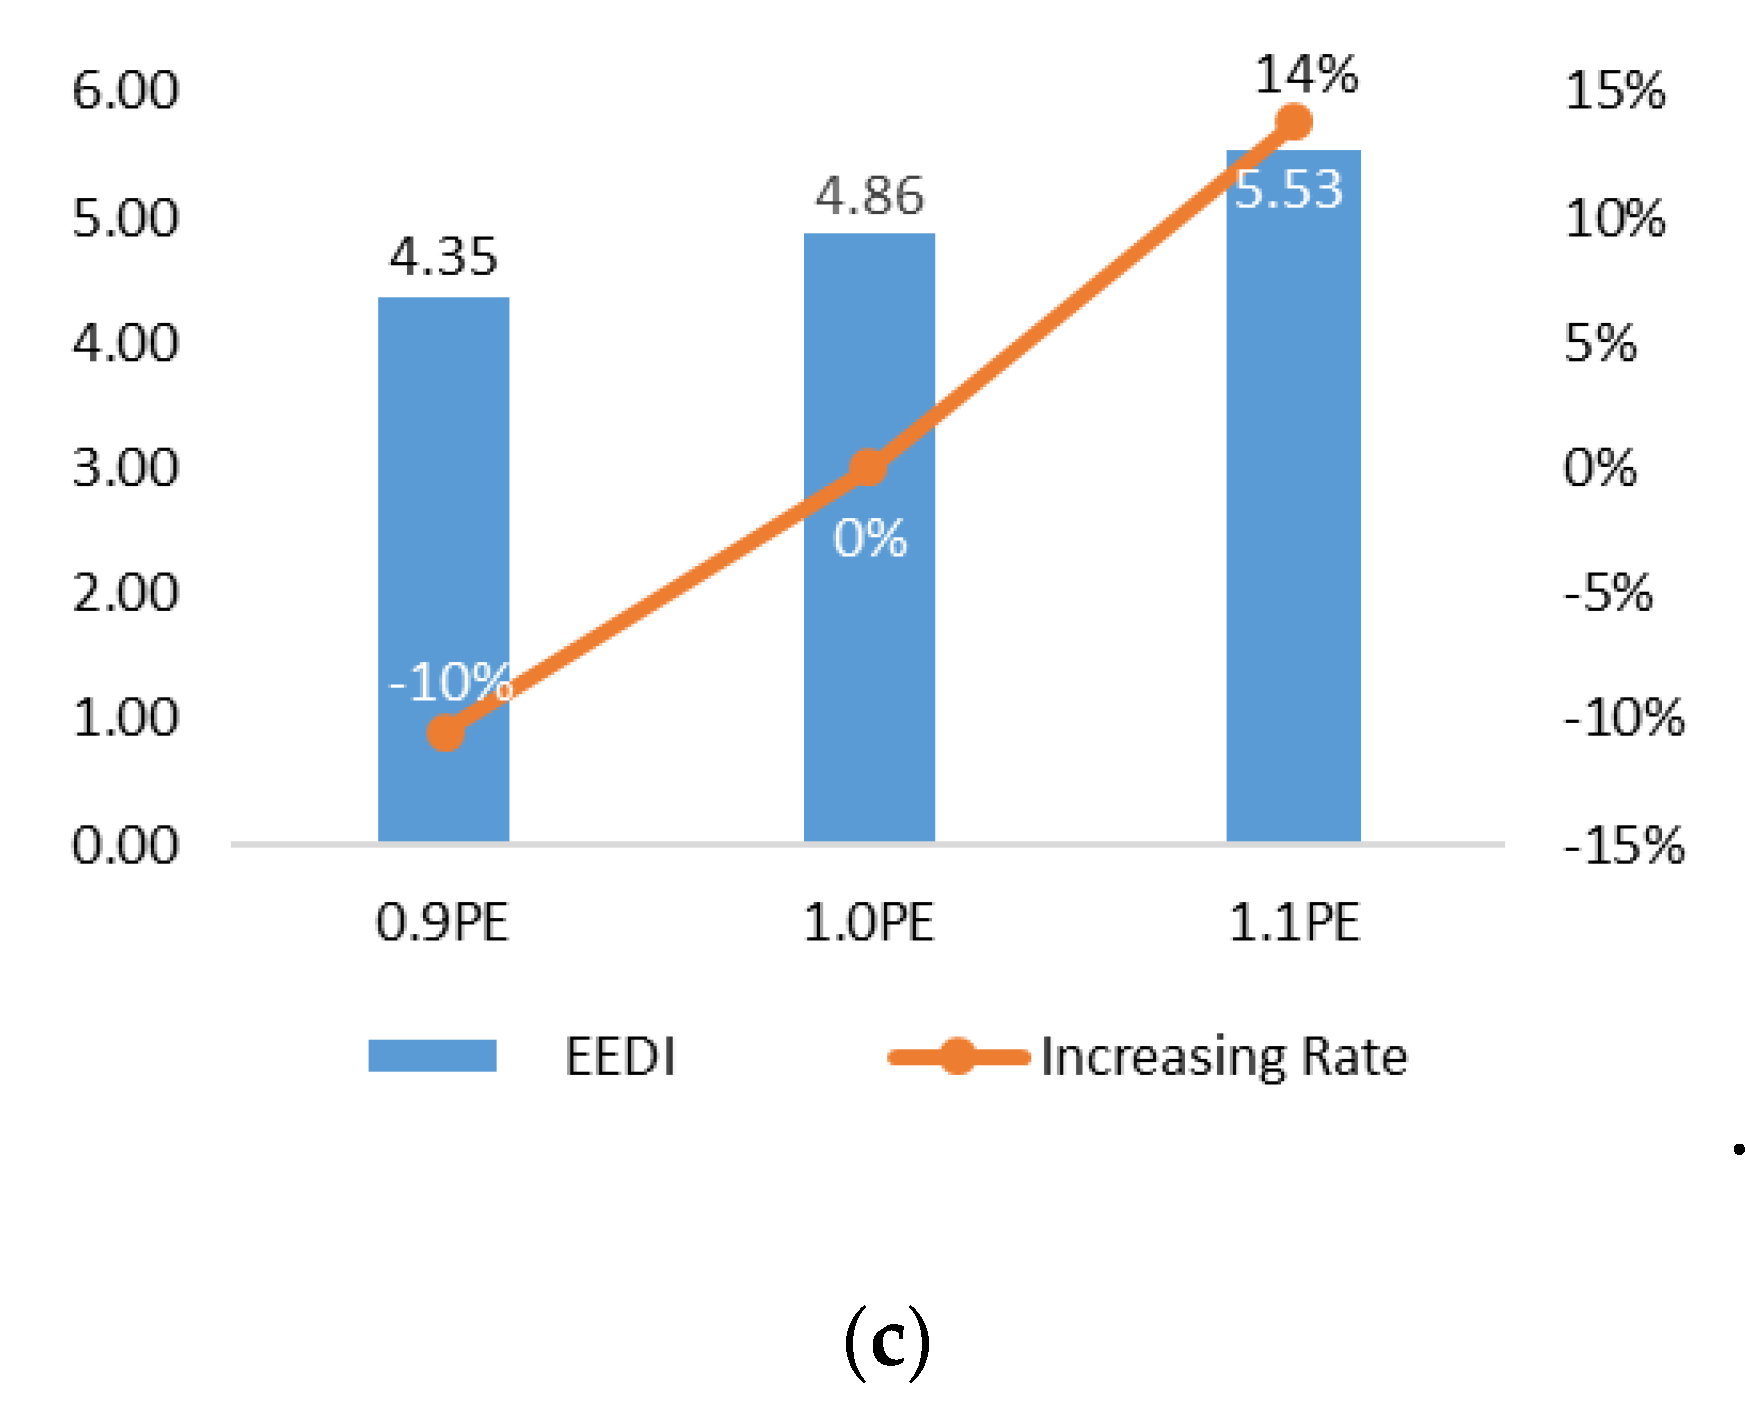
3.4. Study of System Matching Parameters on EEDI

To study the influencing values of EEDI, the following assumptions were made [50]:
(1) The specific fuel consumption is constant for all main engines, i.e., SFCME = 190 g/kWh.
(2) The specific fuel consumption is constant for all auxiliary engines, i.e., SFCAE = 215 g/kWh.
(3) The power of the auxiliary machine is determined according to Equation (17).
(4) No correction factors are used.
(5) Innovative mechanical energy efficiency technology, shaft motors and other innovative energy efficient technologies are all excluded, i.e., PAE,eff = 0, PPTI= 0 and Peff= 0.
(6) PE is modified by the ship speed and deadweight tons according to the admiralty coefficient method [53].
In the matching process of the ship–engine–propeller, the main inputs were ship speed, propeller diameter and ship effective power, which had a strong impact on the engine selection, thus influencing the following EEDI calculation. On the other hand, these three input parameters were not chosen randomly at the beginning of ship propulsion system design. If EEDI is set up to be the optimization target, their initial value in matching should be chosen with EEDI under consideration. Therefore, the effects of these three factors on EEDI were studied separately in the following section.
As shown in Figure 8, for a ship with a certain DWT, the required engine power could be calculated by the principle based on system matching platform with ship speed, propeller diameter and ship effective power regarded as variables respectively, and other parameters were fixed with the benchmark data. Combined with SFC, the EEDI value could be calculated by Equation (16). Finally, with the DWT as the independent variable, a for-loop was programmed to repeat the above steps to achieve the EEDI value under different DWTs, as shown in Figure 9. To be specific, if the ship speed was the variable with the initial value as Vs (14 kn), any other inputs of matching was fixed as the benchmark data, except for the ship effective power, which was highly influenced by the DWT and should be modified with different DWTs. After the matching procedure, the MCR engine power as well as the auxiliary power (see Equation (17)) could be obtained, thus the corresponding EEDI could be calculated with the assumed SFCME, SFCAE, DWT and other fixed values from benchmark. As a result, the red curve in Figure 9a could be drawn with the initial ship speed and a group of curves could be obtained by adjusting the ship speed.
The results indicate that reducing the ship speed, increasing the propeller diameter and reducing the ship effective power could all reduce EEDI, in which, reducing the ship effective power was mainly realized by the optimization of ship hull, i.e., not solidly related to matching. According to the comparison between these three groups of curves, the ship speed seemed to be the most influential values. In order to observe the sensitivity of EEDI to the three parameters, further analysis on the benchmark ship, i.e., with the fixed DWT as 38800, taking the 5 × 52 diesel engine fuel consumption into account was conducted, as shown in Figure 10.
It can be seen that if the ship speed decreased by 10%, EEDI could drop to 84% (Figure 10a), implying the great potential of speed reduction to meet the EEDI requirements. On the contrary, EEDI changes in less of an extent with the propeller diagram changing, in which when the diameter increased by 10%, EEDI just decreased by 3%. Meanwhile, ship effective power also had a relatively large influence on EEDI, when the ship effective power decreased by 10%, EEDI dropped by 10%. However, reducing the ship effective power was mainly realized by hull optimization, which was out of the area of propulsion system design. As a result, ship speed indeed had the most influence on EEDI, when it came to reducing EEDI value, the sequence of these methods was reducing ship speed, optimizing the ship hull and enlarging the propeller.

3.5. System Matching Parameters to Satisfy EEDI at Different Phases

According to the baseline in different EEDI stages, which is drawn based on Table 2 and Table 3, as shown in Figure 11, although the benchmark ship now meets the EEDI requirements, it would not satisfy the EEDI standard in Phase 3. Therefore, in the aspect of ship–engine–propeller matching, considerations should be taken to reduce the EEDI value by changing the speed or replacing a larger propeller. The study of changing these two parameters in order to satisfy EEDI in all phases was investigated to give reference for system matching.

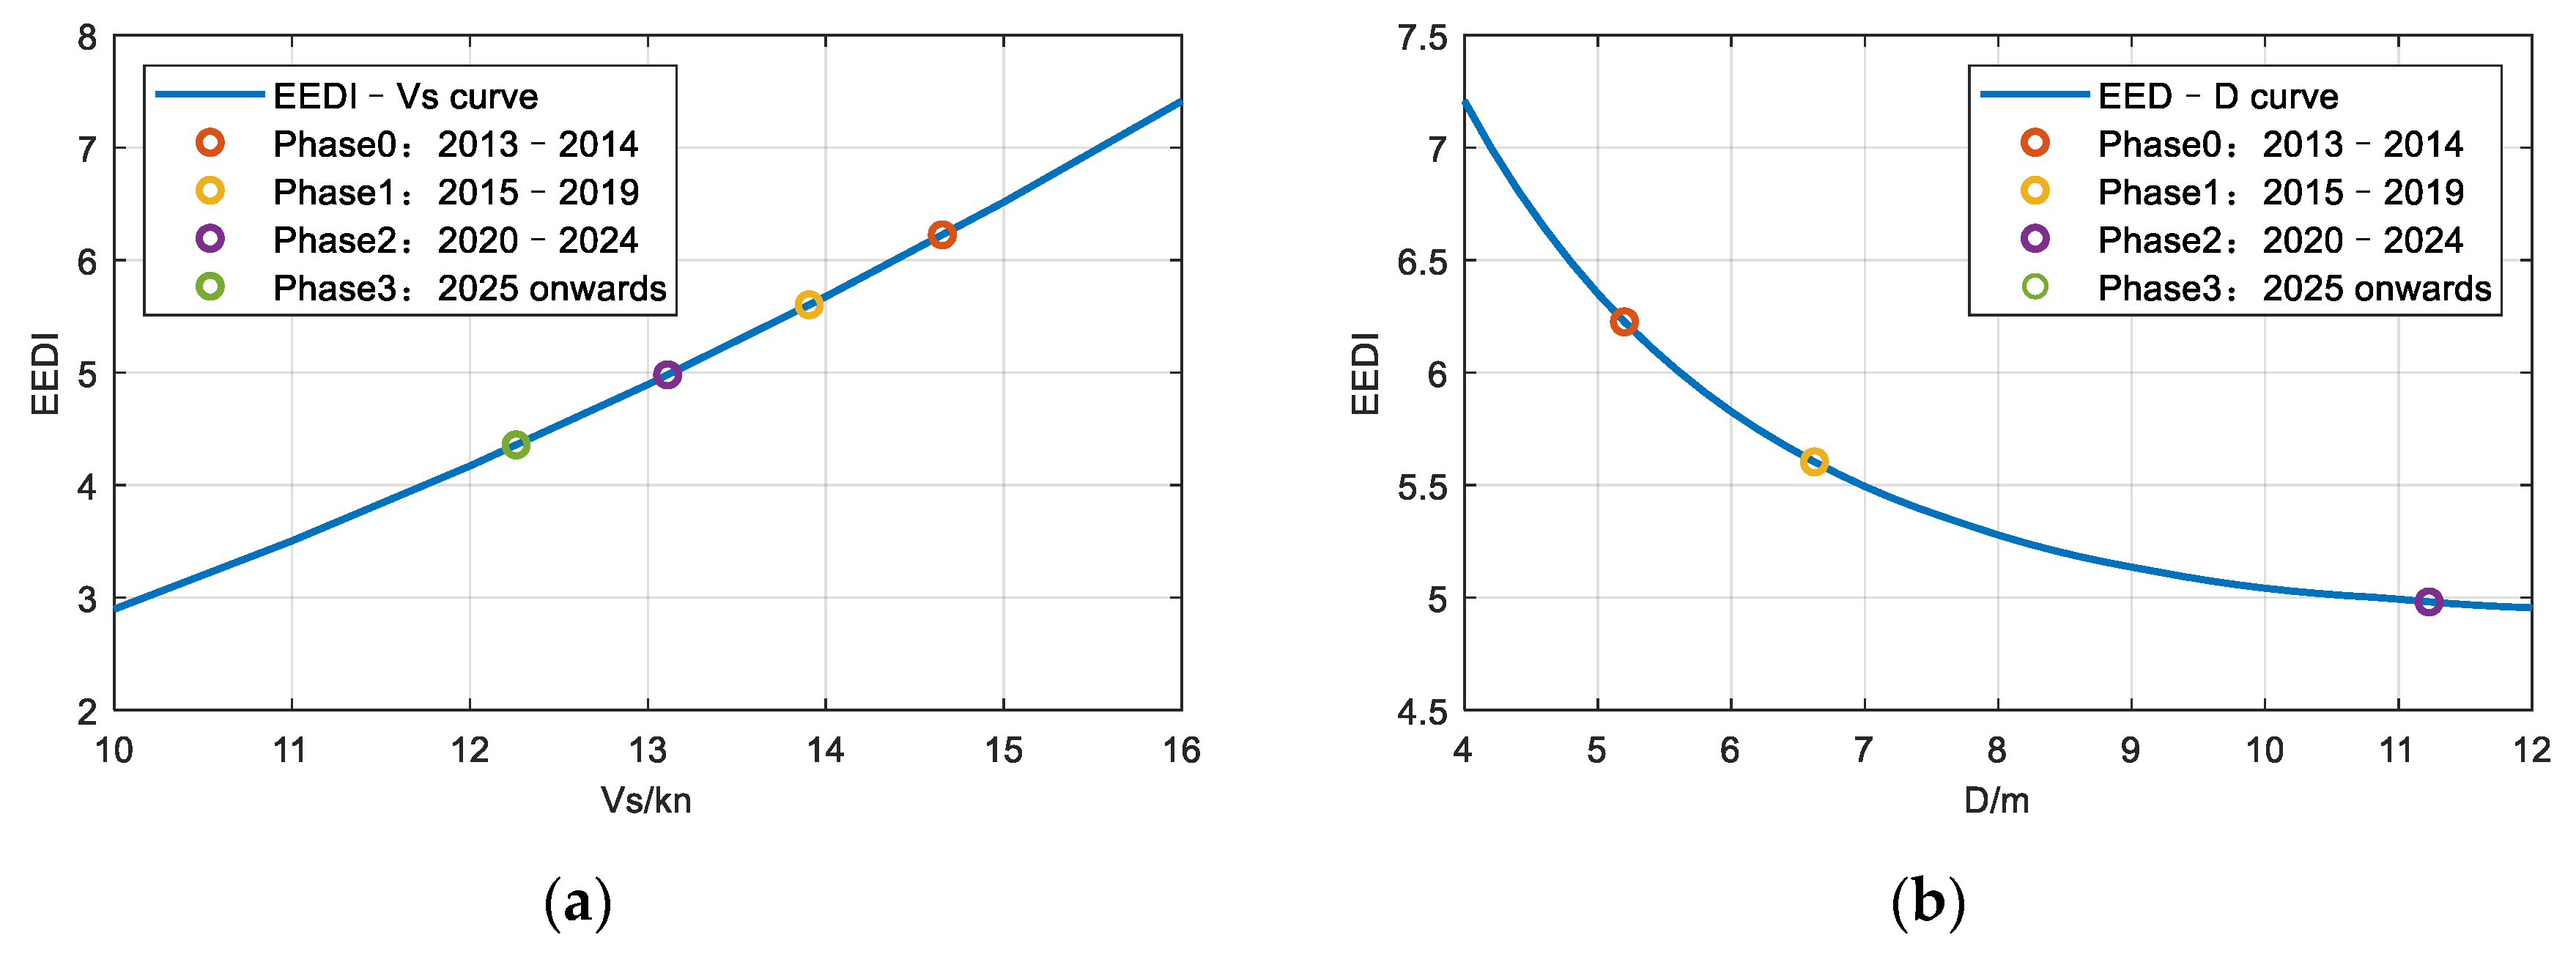
3.5.1. A Certain Ship at Different EEDI Phases

Based on Section 3.4, a series of ship speed values were set instead of DWTs, and the relation of EEDI and ship speed could be obtained with the fixed DWT (38800 DWT) and SFC (190 g/kWh). The reason why SFC was fixed was that the engine power varies in a large extent with changing ship speed and as a result the 5 × 52 diesel engine was no longer applicable in some cases. Due to the uncertainty of the engine and its SFC, a fixed fuel consumption recommended by IMO regulation was used instead of the 5 × 52 diesel engine SFC curve [50]. After obtaining the EEDI values at different ship speeds, the curve was drawn with the EEDI value of the 38800 DWT bulk carrier under different phases marked, as shown in Figure 12a.
Similarly, the required propeller diameters of different EEDI phases could be obtained, as shown in the Figure 12b. It could be found that the propeller diameter varied greatly from Phase 1 to Phase 2 (from 6.5 m to 11.2 m), and it could not satisfy the EEDI at Phase 3 within 12 m, which means it would exceed the propeller limitation. On the other hand, the propeller diameter was limited by not only its construction, but also the actual ship draught requirements. Therefore, there were certain limitations of increasing the propeller diameter to reduce the EEDI value.

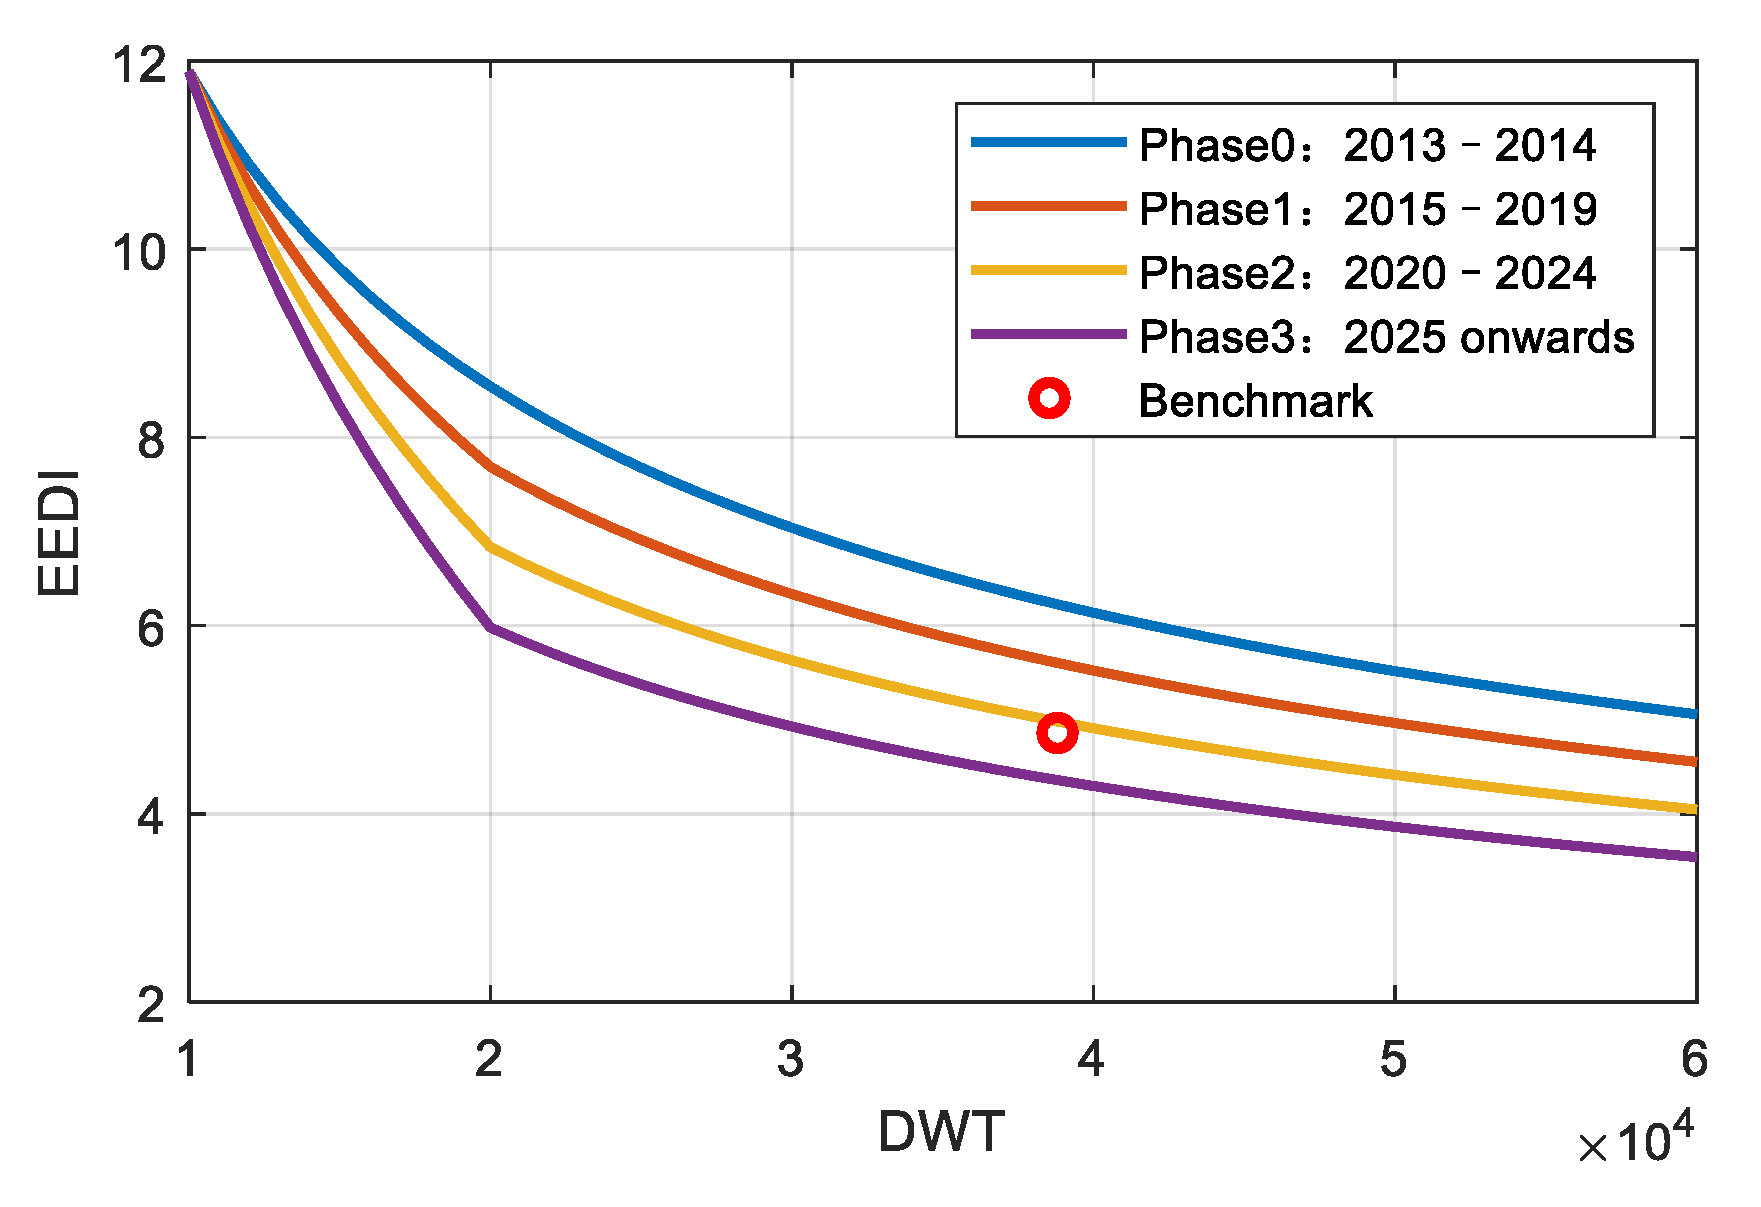
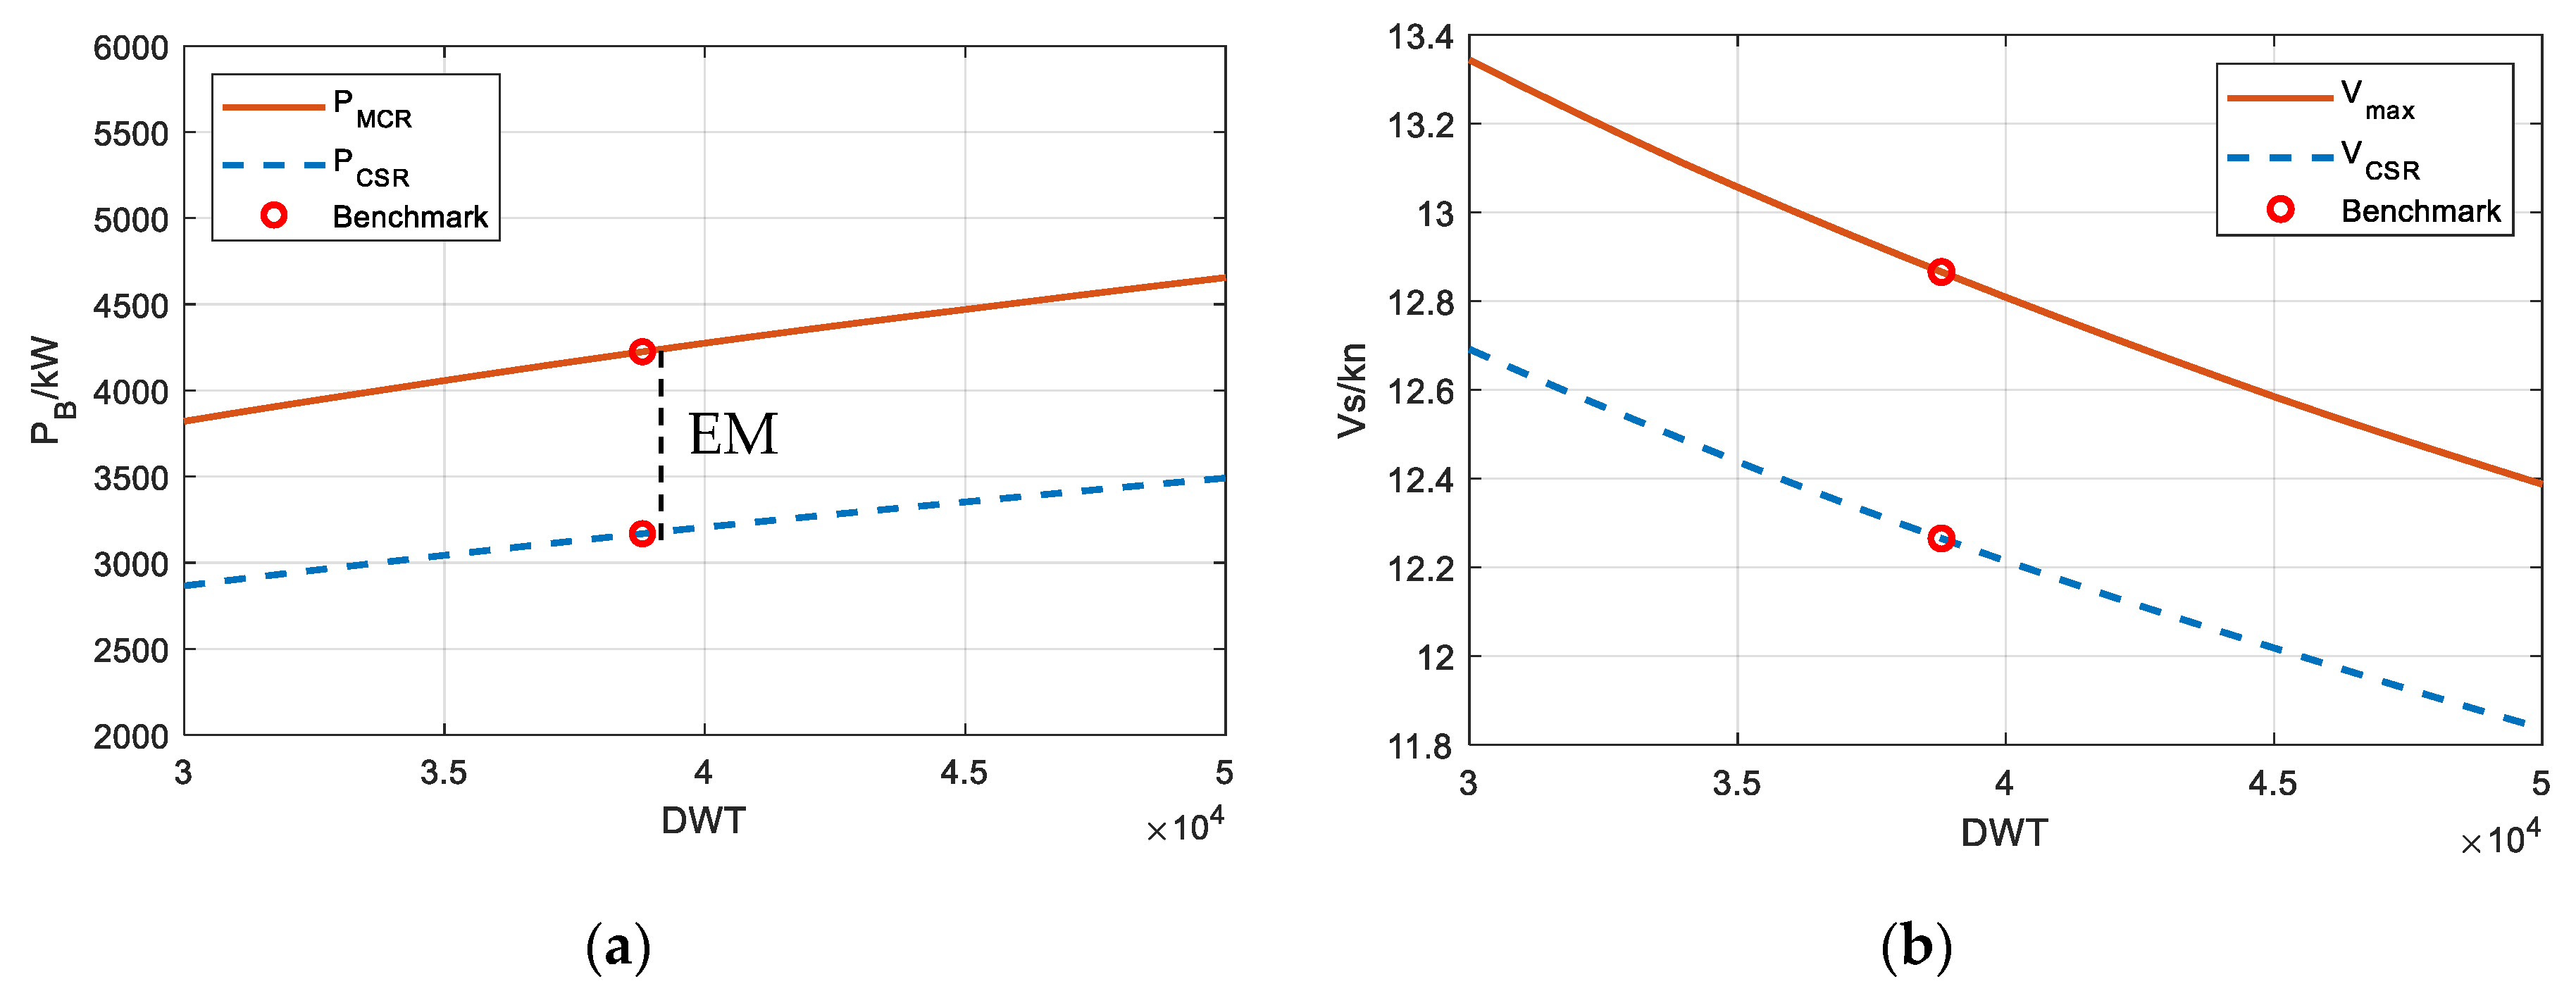
3.5.2. The DWT’s Changing at a Certain EEDI (Phase 3)

Since the propeller diameter is always limited by the ship draught when designing and it could be seen from the previous analysis that enlarging the propeller to meet the EEDI baseline at Phase 3 had enormous limitations. Therefore, the study of the speed reducing method to satisfy EEDI was mainly concerned. Taking Phase 3 (see the purple line in Figure 11) as an example, EEDI under different DWTs and ship speeds could be calculated with the help of double-layer for-loop and those values at the Phase 3 baseline were filtered as well as the corresponding engine power. Moreover, to predict the ship speed of a specific engine power, matching Case 3 was applied and the results are shown in Figure 13.
As shown in Figure 13, the ship speed at maximum attainable EEDI was obtained, as well as the corresponding engine power, that is to say, any point below the red line could be chosen as PMCR (Vmax) under EEDI consideration. The difference between PMCR and PCSR was caused by the engine margin (EM), which was set for a power reserve and lower fuel consumption, especially for a low-speed diesel engine. Attention should be paid that in Figure 13b, the blue line indicates the attainable service speed calculated by PCSR satisfying EEDI, which was more significant in ship design and sailing than Vmax.

4. Conclusions

EEDI is a mandatory regulation of ship CO2 emissions proposed by IMO. Regarding to the study of EEDI, few attention is paid to the perspective of ship–engine–propeller design and matching. However, since most of the CO2 emission is from the ship propulsion system, this paper built a matching platform based on the ship–engine–propeller theory, by which, the investigation on the influence of EEDI on matching was carried out. The conclusions could be drawn as follows:
(1) The principle-based matching platform provided an efficient way on the designing of ship–engine–propeller matching in particular for those traditional propulsion systems without shaft generators or shaft motors. The accuracy of this platform verified by the benchmark data was larger than 95%, which was sufficient in application.
(2) For a traditional marine propulsion system without emission abatement techniques, EEDI was inversely proportional to propeller open water efficiency, and also the propulsive efficiency. For these ships, the relatively low EEDI limiting CO2 emissions means a trend of high propulsive efficiency and eliminates the low-efficiency ships in force.
(3) From the perspective of ship–engine–propeller matching, the main methods of reducing EEDI were decreasing the ship speed, optimizing the ship hull and enlarging the propeller. In this case, the 10% sacrifice of ship speed at design point resulting in the 16% reduction of EEDI made the ship speed decreasing method a easy way to meet the EEDI requirement.
(4) The values of the relevant design parameters to satisfy the EEDI at different phases were calculated, providing theoretical guidance for the selection of design parameters to satisfy EEDI requirement at early stage of ship–engine–propeller matching.
The research investigated in this paper was the optimization and application of the ship–engine–propeller matching with EEDI accounted. However, the work was mainly based on the low-speed diesel engine direct-driven propulsion system, i.e., with the gear box ratio as 1.0, and the EEDI performance improved by some advanced gear boxes with the ship speed reduction function could be studied in the following work. What is more, further work could be done on the matching with other emission index considered, such as NOx or PM.

Author Contributions

Conceptualization, H.R. and Y.D.; Data curation, Y.D.; Formal analysis, H.R.; Investigation, H.R. and Y.D.; Methodology, H.R.; Project administration, Y.D.; Software, H.R.; Validation, Y.D.; Visualization, C.S.; Writing—original draft, H.R.; Writing—review & editing, Y.D. and C.S.

Funding

This research was funded by ‘International Science & Technology Cooperation Program of China’, 2014DFA71700; Marine Low-Speed Engine Project-Phase I.

Acknowledgments

The authors wish to acknowledge the data support given by Shanghai Merchant Ship Design and Research Institute, China. We would like to thank Prof. Douwe Stapersma from Delft University of Technology in the Netherlands for his guidance on this paper.

Conflicts of Interest

The authors declare no conflict of interest.

Abbreviations

AEauxiliary engine
AISAutomatic Identification System
CSRcontinuous service rating
CO2Carbon Dioxide
CODOGCombined Diesel or Gas Turbine System
CPPControllable Pitch Propeller
CRPContra Rotating Propeller
DWTdeadweight tonnage
EEDIEnergy Efficiency Design Index
GHGGreenhouse Gas
ICCTInternational Council on Clean Transportation
IMOInternational Maritime Organization
LFCLifetime Fuel Consumption
LNGLiquefied Natural Gas
MCRmaximum continuous rating
MEmain engine
MEPCMarine Environment Protection Committee
NMVOCNon-Methane Volatile Organic Compounds
NOxNitrogen Oxide
NSGANon-dominated Sorting Genetic Algorithm
PMparticulate matter
SFCspecific fuel consumption
Symbols
Capacitydeadweight tonnage rating for bulk carriers
CFCO2 emission factor
Ddiameter
feff(i)availability factor of individual energy efficiency technologies
fjcorrection factor for ship specific design elements
fwcoefficient indicating the decrease in ship speed
ficapacity adjustment factor
fccubic capacity correction factor
flcorrection factor to compensate deadweight losses
Jadvance ratio
KQtorque coefficient
KTtrust coefficient
nrotational speed
PAEpower of auxiliary engine
PEship effective power
PMEpower of main engine
Rship resistance
tthrust deduction factor
Vship speed
Vrefship speed at maximum design load condition
ωwake factor
η H hull efficiency
η O open water propeller efficiency
η R relative rotation efficiency
η T R M transmission efficiency

References

  1. UNCTAD. Review of Maritime Transport 2018; United Nations Publication: New York, NY, USA, 2018; pp. 23–26. [Google Scholar]
  2. MAN Diesel & Turbo. EEDI (Energy Efficiency Design Index); MAN Diesel & Turbo: Augsburg, Germany, 2007; pp. 3–4. [Google Scholar]
  3. Hon, G.; Wang, H. The Energy Efficiency Design Index (EEDI) for New Ships. Available online: https://theicct.org/publications/energy-efficiency-design-index-eedi-new-ships (accessed on 18 July 2019).
  4. MAN Diesel & Turbo. Propulsion of 200,000–210,000 dwt Large Capesize Bulk Carrier; MAN Diesel & Turbo: Copenhagen, Denmark, 2014; pp. 7–17. [Google Scholar]
  5. Winterthur Gas & Diesel. Low-Speed Engines 2018; Winterthur Gas & Diesel: Gothenburg, Sweden, 2018; pp. 39–41. [Google Scholar]
  6. Wärtsilä. Wärtsilä Solutions for Marine and Oil & Gas Markets; Wärtsilä: Helsinki, Finland, 2015; pp. 91–185. [Google Scholar]
  7. Rolls-Royce. MARINE Products and Systems; Rolls-Royce: Newcastle, UK, 2017; pp. 25–33. [Google Scholar]
  8. MAN Diesel & Turbo. Basic Principles of Ship Propulsion; MAN Diesel & Turbo: Copenhagen, Denmark, 2011; pp. 12–30. [Google Scholar]
  9. Wärtsilä. Marine Solutions; Wärtsilä: Helsinki, Finland, 2012; pp. 77–79. [Google Scholar]
  10. Rawson, K.J.; Tupper, E.C. Basic Ship Theory, 5th ed.; Butterworth-Heinemann: Oxford, UK, 2001; pp. 652–661. [Google Scholar]
  11. Woud, H.K.; Stapersma, D. Design of Propulsion and Electric Power Generation Systems; IMarEST: London, UK, 2002; pp. 413–469. [Google Scholar]
  12. Stapersma, D.; Woud, H.K. Matching propulsion engine with propulsor. J. Mar. Eng. Technol. 2005, 4, 25–32. [Google Scholar] [CrossRef]
  13. Taskar, B.; Yum, K.K.; Pedersen, E. Dynamics of a marine propulsion system with a diesel engine and a propeller subject to waves. In Proceedings of the ASME 2015 34th International Conference on Ocean, Offshore and Arctic Engineering, St. John’s, NL, Canada, 31 May–5 June 2015. [Google Scholar]
  14. Ogar, O.B.; Nitonye, S.; John-Hope, I. Design Analysis and Optimal Matching of a Controllable Pitch Propeller to the Hull and Diesel Engine of a CODOG System. J. Power Energy Eng. 2018, 6, 53. [Google Scholar] [CrossRef]
  15. Sasaki, N.; Kuroda, M.; Fujisawa, J.; Imoto, T.; Sato, M. On the model tests and design method of hybrid CRP podded propulsion system of a feeder container ship. In Proceedings of the 1st International Symposium on Marine Propulsors SMP, Trondheim, Norway, 1 June 2009; Volume 9. [Google Scholar]
  16. Xie, G. Optimal preliminary propeller design based on multi-objective optimization approach. Procedia Eng. 2011, 16, 278–283. [Google Scholar] [CrossRef]
  17. Qin, F.; Zhan, Z.; Yang, B. Design of ship engine and propeller matching for ship propulsion system based on genetic algorithm. J. Wuhan Univ. Technol. 2003, 27, 50–52. [Google Scholar]
  18. Xun, J. Design of ship engine and propeller matching platform for ship propulsion system based on genetic algorithm. Ship Sci. Technol. 2017, 20, 174–176. [Google Scholar]
  19. Feng, F.; Huang, S.; Hu, J. Application of Artificial Neural Network to Design of Propeller. J. Harbin Eng. Univ. 2002, 23, 1–4. [Google Scholar]
  20. Bondia, R.; Ghosh, S.; Kanjilal, K. International crude oil prices and the stock prices of clean energy and technology companies: Evidence from non-linear cointegration tests with unknown structural breaks. Energy 2016, 101, 558–565. [Google Scholar] [CrossRef]
  21. Esmailian, E.; Ghassemi, H.; Zakerdoost, H. Systematic probabilistic design methodology for simultaneously optimizing the ship hull–propeller system. Int. J. Nav. Archit. Ocean Eng. 2017, 9, 246–255. [Google Scholar] [CrossRef]
  22. Koenhardono, E.S.; Djatmiko, E.B.; Soeprijanto, A.; Irawan, M.I. Neural Network-Based Engine Propeller Matching (NN-EPM) for Trimaran Patrol Ship. Appl. Mech. Mater. 2014, 493, 388–394. [Google Scholar] [CrossRef]
  23. Trozzi, C. Emission Estimate Methodology for Maritime Navigation; Techne Consulting: Kilchberg, Switzerland, 2010. [Google Scholar]
  24. Borkowski, T.; Kasyk, L.; Kowalak, P. Assessment of ship’s engine effective power, fuel consumption and emission using the vessel speed. J. KONES 2011, 18, 31–39. [Google Scholar]
  25. Trodden, D.G. Optimal Propeller Selection When Accounting for a Ship’s Maneuvering Response due to Environmental Loading. Ph.D. Thesis, Newcastle University, Newcastle, UK, 2014. [Google Scholar]
  26. Stapersma, D. The Importance of (E) Mission Profiles for Naval Ships; INEC: Plymouth, UK, 1994. [Google Scholar]
  27. Gabrieli, G.; Karman, G. What Price Speed? Mech. Eng. 1950, 7, 75–78. [Google Scholar]
  28. MEPC 59-4-21. Comments on the Coefficient “fw” in the EEDI Formula; International Maritime Organization: London, UK, 2009. [Google Scholar]
  29. MEPC 59-4-14. Correction Coefficients fj and fi for EEDI for Ships Having an Ice Class; International Maritime Organization: London, UK, 2009. [Google Scholar]
  30. MEPC 60-4-1. Clarifications for Definitions of Ship Types and for the Use of Ice Class Correction Factors fj and fi in the Calculation of EEDI; International Maritime Organization: London, UK, 2009. [Google Scholar]
  31. Li, C.L.; Zhou, S.; Han, Y. Research on the Influence of Wind Energy on New Energy Utilization Coefficient of EEDI. Adv. Mater. Res. 2013, 744, 561–565. [Google Scholar] [CrossRef]
  32. Kristensen, H.O.H.; Lützen, M. Existing Design Trends for Tankers and Bulk Carriers—Design Changes for Improvement of the EEDI in the Future; IMDC: Galsgow, UK, 2012. [Google Scholar]
  33. Papanikolaou, A.; Zaraphonitis, G.; Bitner-Gregersen, E.; Shigunov, V.; Moctar, O.E.; Soares, C.G.; Reddy, D.N.; Sprenger, F. Energy Efficient Safe Ship Operation (SHOPERA). Transp. Res. Procedia 2016, 14, 820–829. [Google Scholar] [CrossRef]
  34. Sui, C.; Stapersma, D.; Visser, K.; De Vos, P.; Ding, Y. Energy effectiveness of ocean-going cargo ship under various operating conditions. Ocean Eng. 2019, 190, 106473. [Google Scholar] [CrossRef]
  35. Henningsen, R.; Skjolsvik, K.; Andersen, A.; Corbett, J.; Skjelvik, J. Study of Greenhouse Gas Emissions from Ships: Final Report to the International Maritime Organization; MARINTEK: Trondheim, Norway, 2000. [Google Scholar]
  36. Li, J. Design of large ship based on EEDI calculation and optimization. Ship Sci. Technol. 2017, 39, 1–3. [Google Scholar]
  37. Hou, C. Key Technologies Study on the Energy Efficiency Design Index of Shallow Draught Bulk Carrier. Master’s Thesis, Zhejiang University, Hangzhou, China, 2014. [Google Scholar]
  38. MEPC 70-5-4. EEDI Calculation Method for Ships Using Gas Fuel as Non-Primary Fuel; International Maritime Organization: London, UK, 2016. [Google Scholar]
  39. Faitar, C.; Novac, I. A new approach on the upgrade of energetic system based on green energy. A complex comparative analysis of the EEDI and EEOI. IOP Conf. Ser. Mater. Sci. Eng. 2016, 145, 42014. [Google Scholar] [CrossRef]
  40. Livanos, G.A.; Theotokatos, G.; Pagonis, D.N. Techno-economic investigation of alternative propulsion plants for Ferries and RoRo ships. Energy Convers. Manag. 2014, 79, 640–651. [Google Scholar] [CrossRef]
  41. MEPC 62-INF.35. Calculation Method to be Applied in the EEDI Calculation of Wind Propulsion Systems; International Maritime Organization: London, UK, 2011. [Google Scholar]
  42. MEPC 64-4-8. Guidance on Treatment of Innovative Energy Efficiency Technologies for Calculation and Verification of the Attained EEDI; International Maritime Organization: London, UK, 2012. [Google Scholar]
  43. MEPC 1-Circ.1-Circ.815. 2013 Guidance on Treatment of Innovative Energy Efficiency Technologies for Calculation and Verification of the Attained EEDI; International Maritime Organization: London, UK, 2013. [Google Scholar]
  44. Devanney, J. The impact of the energy efficiency design index on very large crude carrier design and CO2 emissions. Ships Offshore Struct. 2011, 6, 355–368. [Google Scholar] [CrossRef]
  45. Devanney, J.; Beach, S. EEDI—A Case Study in Indirect Regulation of CO2 Pollution; Center for Tankship Excellence: Tavernier, FL, USA, 2010. [Google Scholar]
  46. Krüger, S. The Energy Efficiency Design Index (EEDI) for RoRo-Vessels; Technische Universität Hamburg-Harburg: Hamburg, Germany, 2004. [Google Scholar]
  47. Li, G. Study on Marine Engine Selection Based on Ship Energy Efficiency Design Index. Master’s Thesis, Dalian Maritime University, Dalian, China, 2014. [Google Scholar]
  48. Shi, W.; Grimmelius, H.T.; Stapersma, D. Analysis of ship propulsion system behavior and the impact on fuel consumption. Int. Shipbuild. Prog. 2010, 57, 35–64. [Google Scholar]
  49. Chen, Y.Y.; Cao, Y.F.; Xing, H.L. Analysis of Marine Exhaust Pollutant Emission Standard Research. In Proceedings of the 4th International Conference on Sustainable Energy and Environmental Engineering, Shenzhen, China, 20–21 December 2015. [Google Scholar]
  50. International Maritime Organization. MARPOL Annex VI and NTC 2008: With Guidelines for Implementation; International Maritime Organization: London, UK, 2013. [Google Scholar]
  51. Ding, Y.; Ren, H.; Sui, C. Design and Application of a Ship Propulsion System Matching Platform with Low-Speed Engine; CIMAC: Vancouver, BC, Canada, 2019. [Google Scholar]
  52. Molland, A.F.; Turnock, S.R.; Hudson, D.A. Ship Resistance and Propulsion, 2nd ed.; Cambridge University Press: Cambridge, UK, 2017. [Google Scholar]
  53. Tu, H.; Yang, Y.; Zhang, L.; Xie, D.; Lyu, X.; Song, L.; Guan, Y.; Sun, J. A modified admiralty coefficient for estimating power curves in EEDI calculations. Ocean Eng. 2018, 150, 309–317. [Google Scholar] [CrossRef]
Figure 1. Framework of ship–engine–propeller matching.
Jmse 07 00425 g001
Figure 2. Water diagrams under two constraints. (a) Case 1 with KT/J2 as a constraint and (b) Case 2 with KQ/J3 as a constraint.
Jmse 07 00425 g002
Figure 3. Point of intersection of P’EVS curve and PEVS curve is the desired speed.
Jmse 07 00425 g003
Figure 4. The power involved in the calculation of energy efficiency design index (EEDI).
Jmse 07 00425 g004
Figure 5. Open water diagram (courtesy of Shanghai Merchant Ship Design and Research Institute).
Jmse 07 00425 g005
Figure 6. System matching platform interface and matching results (Case 3).
Jmse 07 00425 g006
Figure 7. The relationship of EEDI and open water propeller efficiency with different pitch ratios.
Jmse 07 00425 g007
Figure 8. The framework of the study on system matching parameters with EEDI under consideration. 1‘a’ dashed line means that not in all cases SFCME is obtained from SFC curve at a specific engine power. 2‘b’ dashed line means that the ship effective power optimization, i.e., the ship hull optimization, is outside the scope of this paper.
Jmse 07 00425 g008
Figure 9. EEDI varies with deadweight tonnage (DWT) under different situations of ship speed, propeller diameter and ship effective power: (a) with ship speed as a variable; (b) with the propeller diameter as a variable and (c) with the ship effective power as a variable.
Jmse 07 00425 g009
Figure 10. Extent of variation of EEDI under different situations of ship speed, propeller diameter and ship effective power: (a) with ship speed as a variable; (b) with the propeller diameter as a variable and (c) with the ship effective power as a variable.
Jmse 07 00425 g010aJmse 07 00425 g010b
Figure 11. EEDI baseline referenced by the International Maritime Organization (IMO) and the attainable EEDI of the benchmark bulk carrier.
Jmse 07 00425 g011
Figure 12. The value of key system matching parameters satisfying EEDI of different phases. (a) ship speed and (b) propeller diameter.
Jmse 07 00425 g012
Figure 13. The required engine power and ship speed to satisfy EEDI: (a) engine power and (b) ship speed.
Jmse 07 00425 g013
Table 1. The combination of inputs and outputs in three matching cases.
CasesShip DataPropeller DataMachinery Data
ωtVS *R *Ae/AoηRD *nP/DηOPB *ηTRM
1IIIIIIIOOOOI
2IIIOIIIOOOII
3IIOIIIIOOOII
1 ‘I’ represents ‘input’ and ‘O’ represents ‘output’. 2 ‘*’ represents important and changeable inputs in matching.
Table 2. Reduction factors (in percentage) for the EEDI relative to the EEDI reference line.
Ship TypeSizePhase 0
1 Jan 2013–31 Dec 2014
Phase 1
1 Jan 2015–31 Dec 2019
Phase 2
1 Jan 2020–31 Dec 2024
Phase 3
1 Jan 2025
onwards
Bulk carrier≥20,000 DWT0102030
10,000–20,000 DWTn/a0–10 *0–20 *0–30 *
Tanker≥20,000 DWT0102030
4000–20,000 DWTn/a0–10 *0–20 *0–30 *
Containership≥15,000 DWT0102030
10,000–15,000 DWTn/a0–10 *0–20 *0–30 *
1 ‘*’ is the reduction factor linearly interpolated between the two values dependent upon vessel size. The lower value of the reduction factor is to be applied to the smaller ship size. 2 n/a means that no required EEDI applies.
Table 3. For determination of reference values for the different ship types.
Ship Typeabc
Bulk carrier961.79Capacity0.477
Tanker1218.80Capacity0.488
Containership174.22Capacity0.201
Table 4. Bulk carrier’s key design characteristics (courtesy of Shanghai Merchant Ship Design and Research Institute).
Principal particularsLength between perpendiculars (m)179.95Breadth molded (m)32
Scantling draught molded (m)9.5Ship Speed (kn)14
Deadweight at Scantling draught (t)38800
Main engineTypeWinGD 5 × 52Maximum continuous rating (MCR)6408 kW at 99 rpm
SFC at 75% MCR (g/kWh)160.75Number of set1
Fuel typeDiesel OilCF (t-CO2/t-Fuel)3.206
PropellerKind of propellerSpecialNumber of Blades3
Diameter (m)6.4Nominal Rotational Speed
(rpm)
99
Other coefficientsShaft Efficiency0.99Relative Rotation Efficiency1.046
Wake Factor0.342Thrust Deduction Factor0.21
Sea Margin15%Engine Margin28.6%
Table 5. Ship effective power (courtesy of Shanghai Merchant Ship Design and Research Institute).
V (kn)12.51313.51414.51515.5
PE (kW)22202508.32840.13227.53687.04240.94918.8
Table 6. The brake power and speed of continuous service rating (CSR) and maximum continuous rating (MCR) by a system matching platform (Case 1).
CharacteristicActual ValueCalculated ValueError
Power of Engine CSR (kW)457547072.89%
Rotational speed of Engine CSR (rpm)88.589.91.58%
Power of Engine MCR (kW)640862762.06%
Rotational speed of Engine MCR (rpm)99103.14.14%
Table 7. Ship speed of CSR and MCR (actual) by a system matching platform (Case 3).
CharacteristicActual ValueCalculated ValueError
Ship speed of CSR (kn)14.014.21.4%
Ship speed of MCR (kn)-15.2-
Table 8. Values involved in EEDI calculation (courtesy of Shanghai Merchant Ship Design and Research Institute).
Basic valuesType of ShipBulk Carrier
Capacity (DWT)38800Ship Speed (kn)14
Main engineMCRME (kW)6408SFCME (g/kWh)160.75
Fuel typeDiesel CF (t-CO2/t-Fuel)3.206
Auxiliary engineFuel typeDieselPAE0.05 × MCRME
CF (t-CO2/t-Fuel)3.206SFCME (g/kWh)215
Other coefficientsfj, feff(i), fc, fl, fi, fw1.0
Table 9. Validation of regression.
SSER-SquareAdjusted R-SquareDFERMSE
4.3 × 10−8111191.9 × 10−5

