Article

Experimental Investigation on Hydrodynamic Coefficients of a Column-Stabilized Fish Cage in Waves

1
State Key Laboratory of Coastal and Offshore Engineering, Dalian University of Technology, Dalian 116024, China
2
Pilot National Laboratory for Marine Science and Technology (Qingdao), Qingdao 266237, China
3
Qingdao Key Laboratory for Marine Fish Breeding and Biotechnology, Yellow Sea Fisheries Research Institute, Chinese Academy of Fishery Sciences, Qingdao 266071, China
*
Author to whom correspondence should be addressed.
J. Mar. Sci. Eng. 2019, 7(11), 418; https://doi.org/10.3390/jmse7110418
Submission received: 18 October 2019 / Revised: 2 November 2019 / Accepted: 7 November 2019 / Published: 14 November 2019
(This article belongs to the Special Issue Modelling of Harbour and Coastal Structures)

Abstract

:
This study on hydrodynamic coefficients of a column-stabilized fish cage under wave action plays an important role in the anti-wave design of cages. The regular wave test was used to study the horizontal wave force of the jacket and column-stabilized fish cage under different wave heights, periods, and incident angles; the finite element model of the jacket and the column-stabilized fish cage was established according to the test model. On the basis of the calculation of the finite element model, combined with the wave force obtained from the experiment, the hydrodynamic coefficients of the structure was fitted by the least squares method, and then the drag force, inertial force, and total force of the structure under different conditions were calculated. The results show that the hydrodynamic coefficients of the jacket and netting under the wave condition were more obvious with the change of the KC number and wave incident angles. And as the wave height increased, the drag force, the inertial force, and the proportion of the drag force to the horizontal wave force both increased. When the wavelength was large, the same trend occured as the wave period increased. When the wave incident angles were different, the forces of the jacket and the column-stabilized fish cage were always small in lateral low-frequency waves, which is consistent with the change law of hydrodynamic coefficients of the jacket and netting.

1. Introduction

There are developments made almost daily in marine aquaculture equipment in China. One such development is that of column-stabilized fish cages, which have gradually been recognized because of their structure safety, steadfast and reliable, and convenient integration with other marine jacket platforms. A typical column-stabilized fish cage mainly consists of the main jacket structure and the netting structure surrounding the culture space. As the coastal environment is deteriorating, aquaculture is gradually developing into more open sea; there are a large number of abandoned or newly developed jacket platforms, such as developing oil and wind energy. Combining this jacket structure with the netting structure not only improves the capacity of anti-storm of the deep sea cage, but also effectively solves the power supply problem of the breeding equipment, and facilitates the automation and intelligence of the deep sea aquaculture industry. However, the jacket platform combined with the netting has a complex response under the action of the marine environment, such as waves and currents, and the netting structure also faces more serious hydroid-fouled problems [1]. Therefore, it is necessary to carry out relevant experiments to study the force and hydrodynamic coefficients law of the column-stable cage under regular waves.
In previous research, estimation of hydrodynamic forces and hydrodynamic coefficients on isolated slender cylinders and pile groups is not new. Sarpkaya [2] carried out extensive experiments, and found that both CD and CM correlated with KC number reasonably well, while absolutely no correlation was found between the Reynolds number and CD and CM. Sundar et al. [3] used the least squares method to analyze the force of the pile column under the action of regular waves, and obtained the relationship between the hydrodynamic coefficients and the KC number of the pile column with different inclination angles. Bushnell [4] studied the mutual interaction and influence of array cylinders by means of a pulsating water tunnel. It was pointed out that this interference increases with the increase of the flow orbit length, and the maximum resistance of the shielded cylinder can be reduced to half of the single cylinder. Chakrabarti [5,6] studied the variation of hydrodynamic coefficients of group piles with KC number and pile spacing under regular wave action. Kurrian et al. [7] studied the comparison of hydrodynamic forces and force coefficients for the effects of spacing between the cylinders, shape, and arrangement of arrays, and found that the hydrodynamic force and force coefficients of the cylinders have similar trends when the KC number is the same. Besides, the measurements were compared with numerical predictions by Santo et al. [8] using computational fluid dynamics (CFD), with the actual jacket represented in a three-dimensional numerical wave tank as a porous tower model, simulating a uniformly distributed Morison stress field. Good agreement was achieved, both in terms of incident surface elevation as well as total force time histories, all using a single set of CD and CM. Palm et al. [9] studied the scale effects between a model scale and a prototype scale device, and compared inviscid Euler simulations with RANS results to quantify the viscous contribution to the loads and responses of the wave energy converter (WEC). Amaechi et al. [10] developed a coupled dynamic models with both buoys and hoses using Orcaflex to investigate the effects of hose hydrodynamic loads and flow angles on the structural behavior of the hoses. Gadelho et al. [11] presented an numerical analysis on determining the hydrodynamic coefficients of an oscillating two-dimensional rigid cylindrical body, using a time domain Navier–Stokes model. However, as of now, only a very limited number of studies have addressed the determination of hydrodynamic coefficients for large-span jacket structure.
As for the netting cage, Norwegian scholars Lader et al. [12] studied the deformation and water resistance of circular gravity cage with different weights under different flow rates by using a flume model experiment, and the experimental results were compared with the calculated results of the water resistance of the net using the empirical formula. It was found that the water resistance and deformation of the flexible net are highly dependent on each other. Decew et al. [13] conducted a flume towing test on the hydrodynamic characteristics of a single-point anchored harbor cage under the action of water flow according to Froude criterion. Zhao et al. [14] used a porous media model to simulate the netting, and established a three-dimensional numerical flume model to simulate the interaction between netting and water flow. Based on this numerical model, they studied the law of velocity attenuation after the interaction of netting and compared it with the experimental results of a physical model. Bi et al. [15,16] established a fluid–structure coupled model between flow and flexible nets, and simulated drag force and flow through the hydroid-fouled nets in currents. Based on the structural characteristics of floating aquaculture cages, Cui et al. [17] used the finite element method to simulate the motion and force of the cage under the action of wave–current interaction; they also did a comparative analysis of the numerical simulation results and tank model experiment results. Dong et al. [18] conducted a series of experiments on different types of mesh plates in wave flume to study the hydrodynamic force of the net panel under the wave action. Based on the fluid dynamics of the cylinder in wave, they proposed the wave force model of the net panel and compared it with existing experimental measurements. Zhao et al. [19] conducted a wave test on hydrodynamic responses of a semi-submersible offshore fish farm. Huang et al. [20] proposed a numerical model based on the lumped-mass method to analyze the dynamic characteristics of a net–cage system in waves and currents. Xu et al. [21] developed a numerical model based on the lumped-mass method and the principle of rigid body kinematics to predict the hydrodynamic response of a fish cage and mooring grid system in regular.
Previous studies have done some research on simple group piles and floating cages, but research on the hydrodynamic forces and hydrodynamic coefficients of the long-span jacket structure and the jacket–netted structure has not been reported. In this study, a new cage form of combining jacket and netting was designed. The hydrodynamics of the structure with or without the additional netting were studied, respectively, and the least squares method was used to fit the hydrodynamic coefficients based on the calculation of the finite element model, which provided support for the numerical simulation and engineering design of the column-stabilized fish cages. The comparison between the calculated and measured values of the horizontal wave force verifies the effectiveness of the research method.

2. Materials and Methods

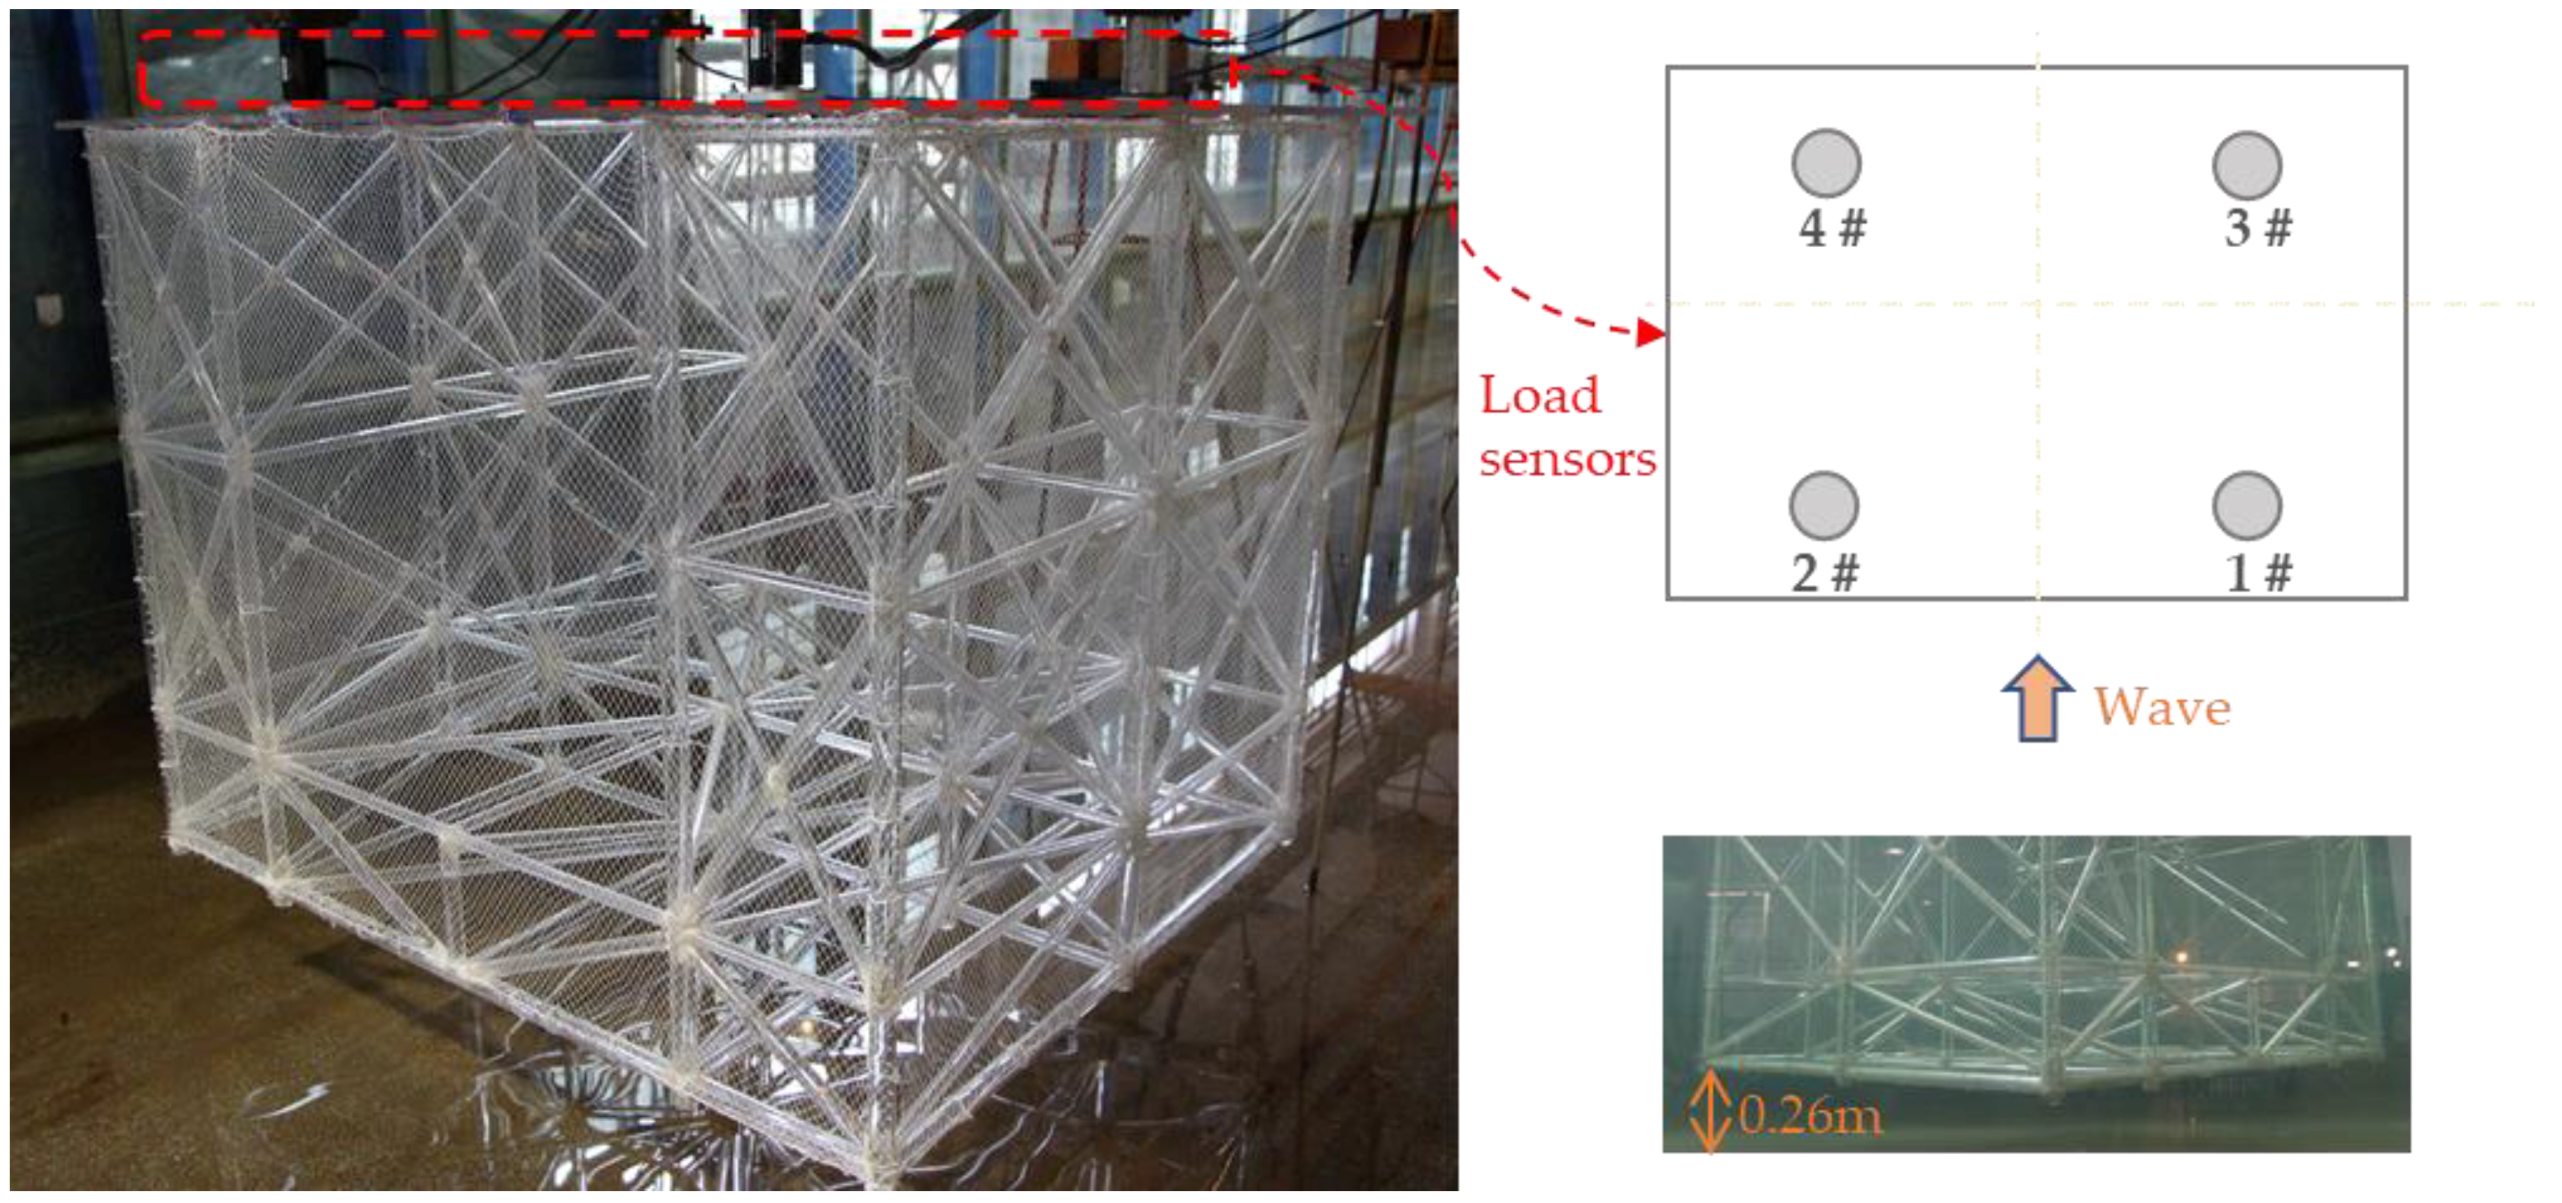
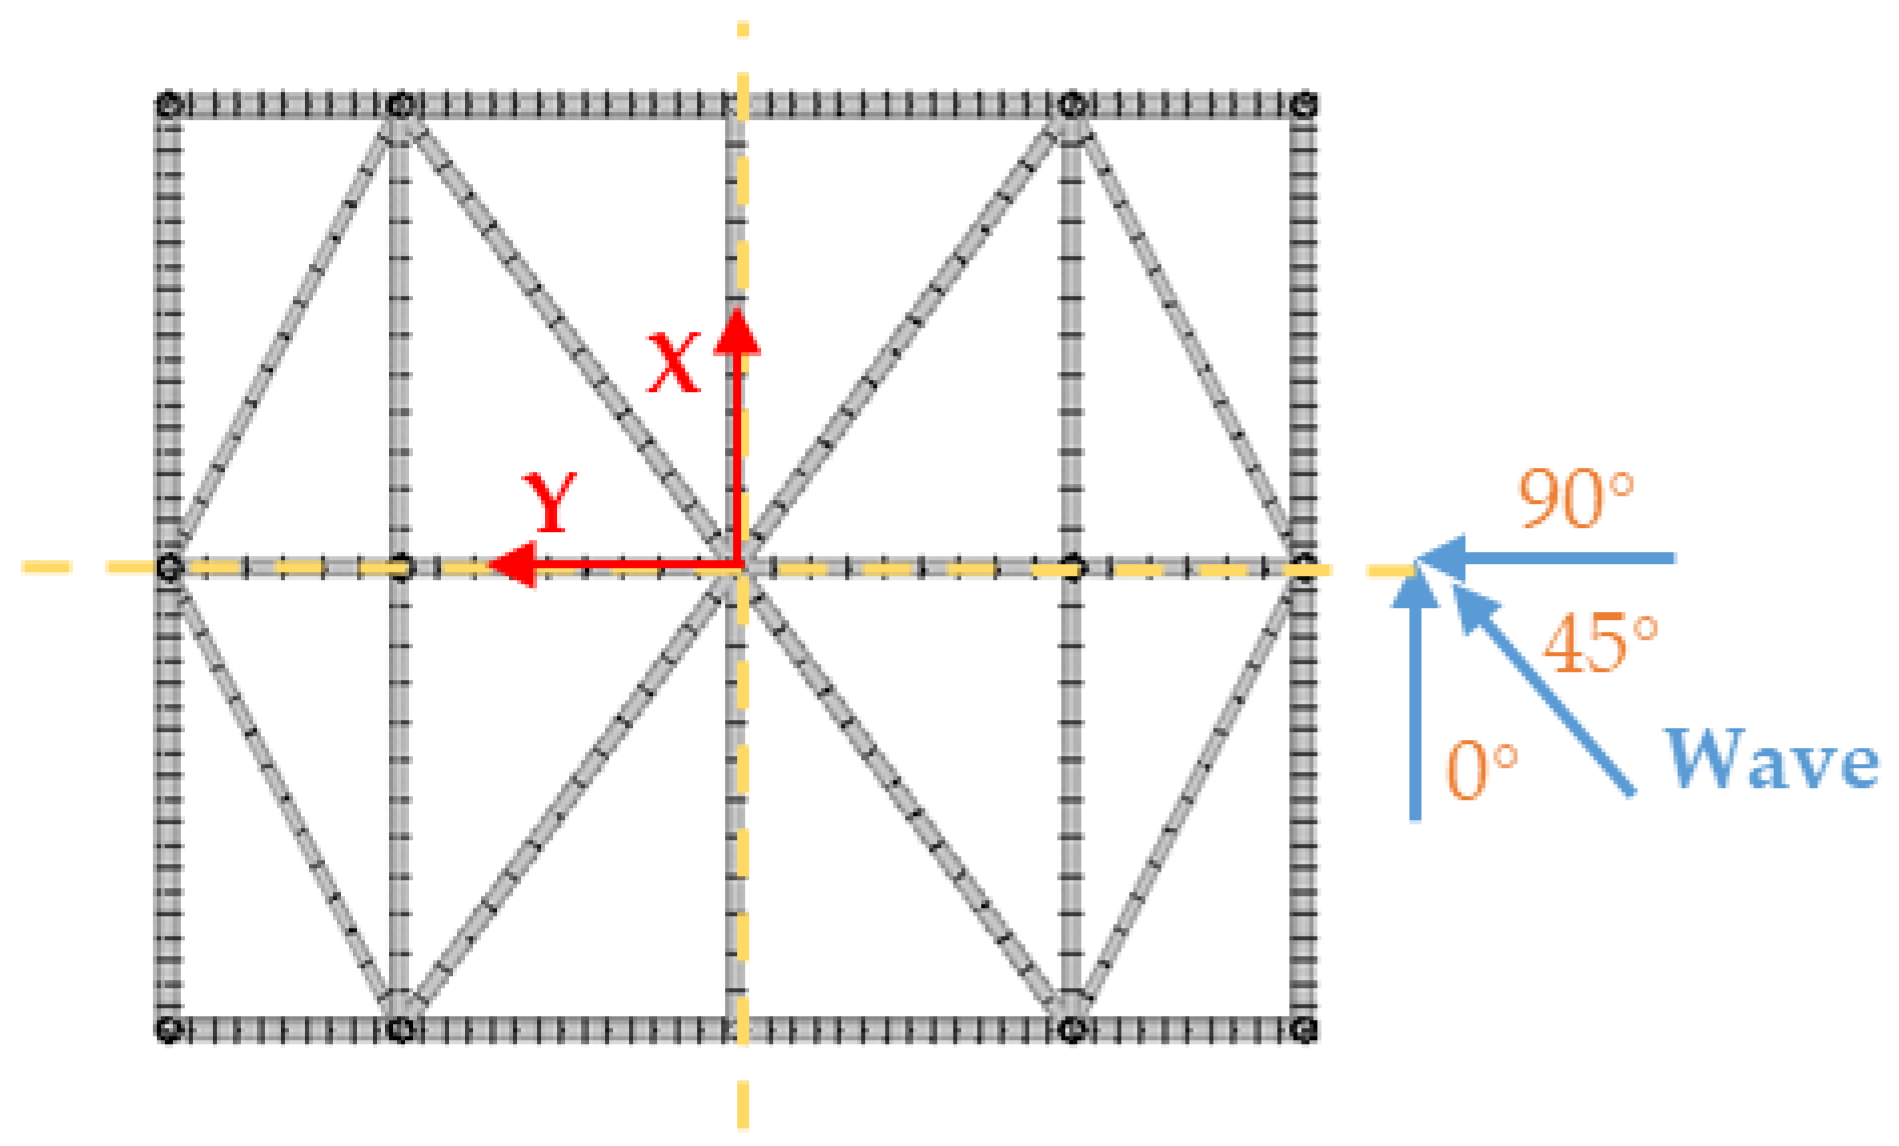
2.1. Experimental Model

The experiments were carried out in a wave and current flume at the State Key Laboratory of Coastal and Offshore Engineering, Dalian University of Technology, Dalian, China. The flume was 60 m in length, 4 m in widthm and 2.5 m in depth, and had a maximum working water depth of 2.0 m. The arrangement of the experimental model is shown in Figure 1.
The tested model was placed 23 m away from the wave paddle. One wave gage was arranged 1 m before, and three wave gages arranged 1, 1.6, and 3.2 m behind the structure, respectively. In order to collect the hydrodynamic forces on the structure easily, the model was suspended from the carriage with dynamometers, such that the bottom of the structure was 0.26 m above the bottom of the tank. In this study, the real and effective horizontal wave forces were obtained by model experiments, which was the basis for studying the hydrodynamic coefficients CD and CM. Other forces were not considered for the time being. Due to the large structure frame, four dynamometers were used symmetrically to obtain the horizontal wave force. The measurement range of the four dynamometers in the horizontal direction was 50 N, and the positive direction remained consistent with the direction of wave propagation. As shown in Figure 2, the hydrodynamic data collected under the action of a certain working condition, the phase of each dynamometer was always consistent, and present periodic variation consistent with the action of regular wave, which also reflected the rationality of the dynamometer arrangement of the experiment.
The column-stabilized fish cage test model mainly consisted of the main jacket and the additional netting structure. To analyze the hydrodynamic characteristics of this particular structure, the test was divided into two parts, one was the hydrodynamic test of the main jacket (M1), and the other was the hydrodynamic test of the column-stabilized fish cage (M2). The jacket was the basic part of an offshore electrical platform, which was assembled by polymethyl methacrylate (PMMA) tubes for this test. The length and outer diameter of the pipes were designed according to the gravity similarity criterion, and the geometric scale λ was 60; the wall thickness of the pipes was designed according to the hydroelasticity similarity criterion, and the inertia radius scale λr was 64.027. According to λ and λr, the prototype structure of the jacket was equivalent to the model structure. The specific parameters are shown in Table 1. The outer contour of the jacket was 1.47 m long, 1.2 m wide, and 1.18 m heigh; 12 large cylindrical hollow pipes with a diameter of 32 mm and a wall thickness of 3 mm formed the jacket legs, and thin round pipes with a diameter of 25 mm and a wall thickness of 2 mm were distributed from the top to 0.62 m under the water surface as diagonal braces and cross braces. Water depth below 0.62 m was a bottom structure.
Considering that the netting force was mainly the water flow resistance, the equivalent netting can be used instead of the theoretical model netting. The geometric scale of the netting was 60, and the mesh size and diameter refer to the study of Tsukrov [22]. The netting part of the test adopted the knotted nylon netting with diamond mesh, with a mesh size of 12 mm and a mesh diameter of 0.82 mm. The horizontal and vertical shrinkage coefficients were 0.6 and 0.8, respectively, and the compactness was 0.137.
A typical column-stabilized cage consists of the jacket structure and the netting structure. During the test, we tied the netting and the jacket together with strings, and tensioned the mesh as evenly as possible while maintaining the mesh shape. So that the environmental load received by the mesh is transmitted to the surrounding piles through the strings, and the data obtained by the dynamometers were the total force of the jacket and the netting.
During the test, three arrangement angles (0°, 45°, 90°) were realized by rotating the model to simulate the hydrodynamic response of the structure under different wave incident directions (see Figure 3). The water depth was 1.13 m. Considering the actual marine environment, nine regular wave conditions with different wave heights and periods were applied. They were used in the design for each incident angle. The parameters of the regular wave are shown in Table 2.
M1 and M2 were exposed as two structures to all of the above regular wave conditions, which would help us to have a deeper understanding of the hydrodynamic characteristics of the column-stabilized fish cage structure. It is worth noting that the regular wave generated by the wave paddle is strongly nonlinear. After comparison, it was found to be in good agreement with the fifth order Stokes wave surfer elevation. Figure 4 shows the time histories of the wave height and horizontal force on M1 and M2 in A5, both on the measurement and the calculation. This provided a basis for the selection of the wave theory applied during the numerical analysis.

2.2. Hydrodynamic Coefficient

Since the jacket structure and the fishing net structure can be regarded as consisting of a series of cylinders, the force is the sum of the forces of the formed cylinders. Based on the fluid dynamics of a small-scale cylindrical member in wave, the Morison equation can be used to calculate the wave force (F) on a column of unit length, including the drag force (Fd) and the inertial force (Fi) [23]. The formula is as follows:
F = F d + F i = 0.5 ρ C D D U | U | + ρ C M A U ·
where U and U · are the velocity and acceleration of the water particles, D is the diameter of the cylinder, A is the cross-sectional area of the cylinder, ρ is the fluid density, CD is the velocity force coefficient, and CM is the inertial force coefficient.
Based on the fifth order Stokes wave theory, the horizontal velocity ux and the horizontal acceleration ax of water particles at any position of the structure are:
u x = c n = 1 5 n λ n cosh [ n k ( z + d ) ] cos [ n ( k x ω t ) ] ( d z η )
a x = ω c n = 1 5 n 2 λ n cosh [ n k ( z + d ) ] sin [ n ( k x ω t ) ] ( d z η )
The coefficients are as follows:
λ 1 = λ ; λ 2 = λ 2 B 22 + λ 4 B 24 ; λ 3 = λ 3 B 33 + λ 5 B 35 ; λ 4 = λ 4 B 44 ; λ 5 = λ 5 B 55
where ω, h, k are angular frequency, water depth, wave number, definite c = c o s h k d , s = s i n h k d . Equation (1) can be written as follows:
F c ( t ) = C D X ( t ) + C M Y ( t )
Among them, X ( t ) = 0.5 ρ D u ( x , z , t ) | u ( x , z , t ) | d z d x ,   Y ( t ) = ρ A a ( x , z , t ) d z d x .
Setting the measured wave force Fm(i), then the sum of the squared error is:
Q = i = 1 n [ F c ( i ) F m ( i ) ] 2 = i = 1 n [ C D X ( i ) + C M Y ( i ) F m ( i ) ] 2
Using the least squares method to make Q / C D = Q / C M = 0 .Thus, the solution for CD and CM can be obtained as follows:
A 1 C D + A 2 C M = A 4 A 2 C D + A 3 C M = A 5
where A 1 = X 2 ( i ) , A 2 = X ( i ) Y ( i ) , A 3 = Y 2 ( i ) , A 4 = F m ( i ) X ( i ) , A 5 = F m ( i ) Y ( i ) .
We can finally find the results:
C D = | A 4 A 2 A 5 A 3 | / | A 1 A 2 A 2 A 3 | C M = | A 1 A 4 A 2 A 5 | / | A 1 A 2 A 2 A 3 |

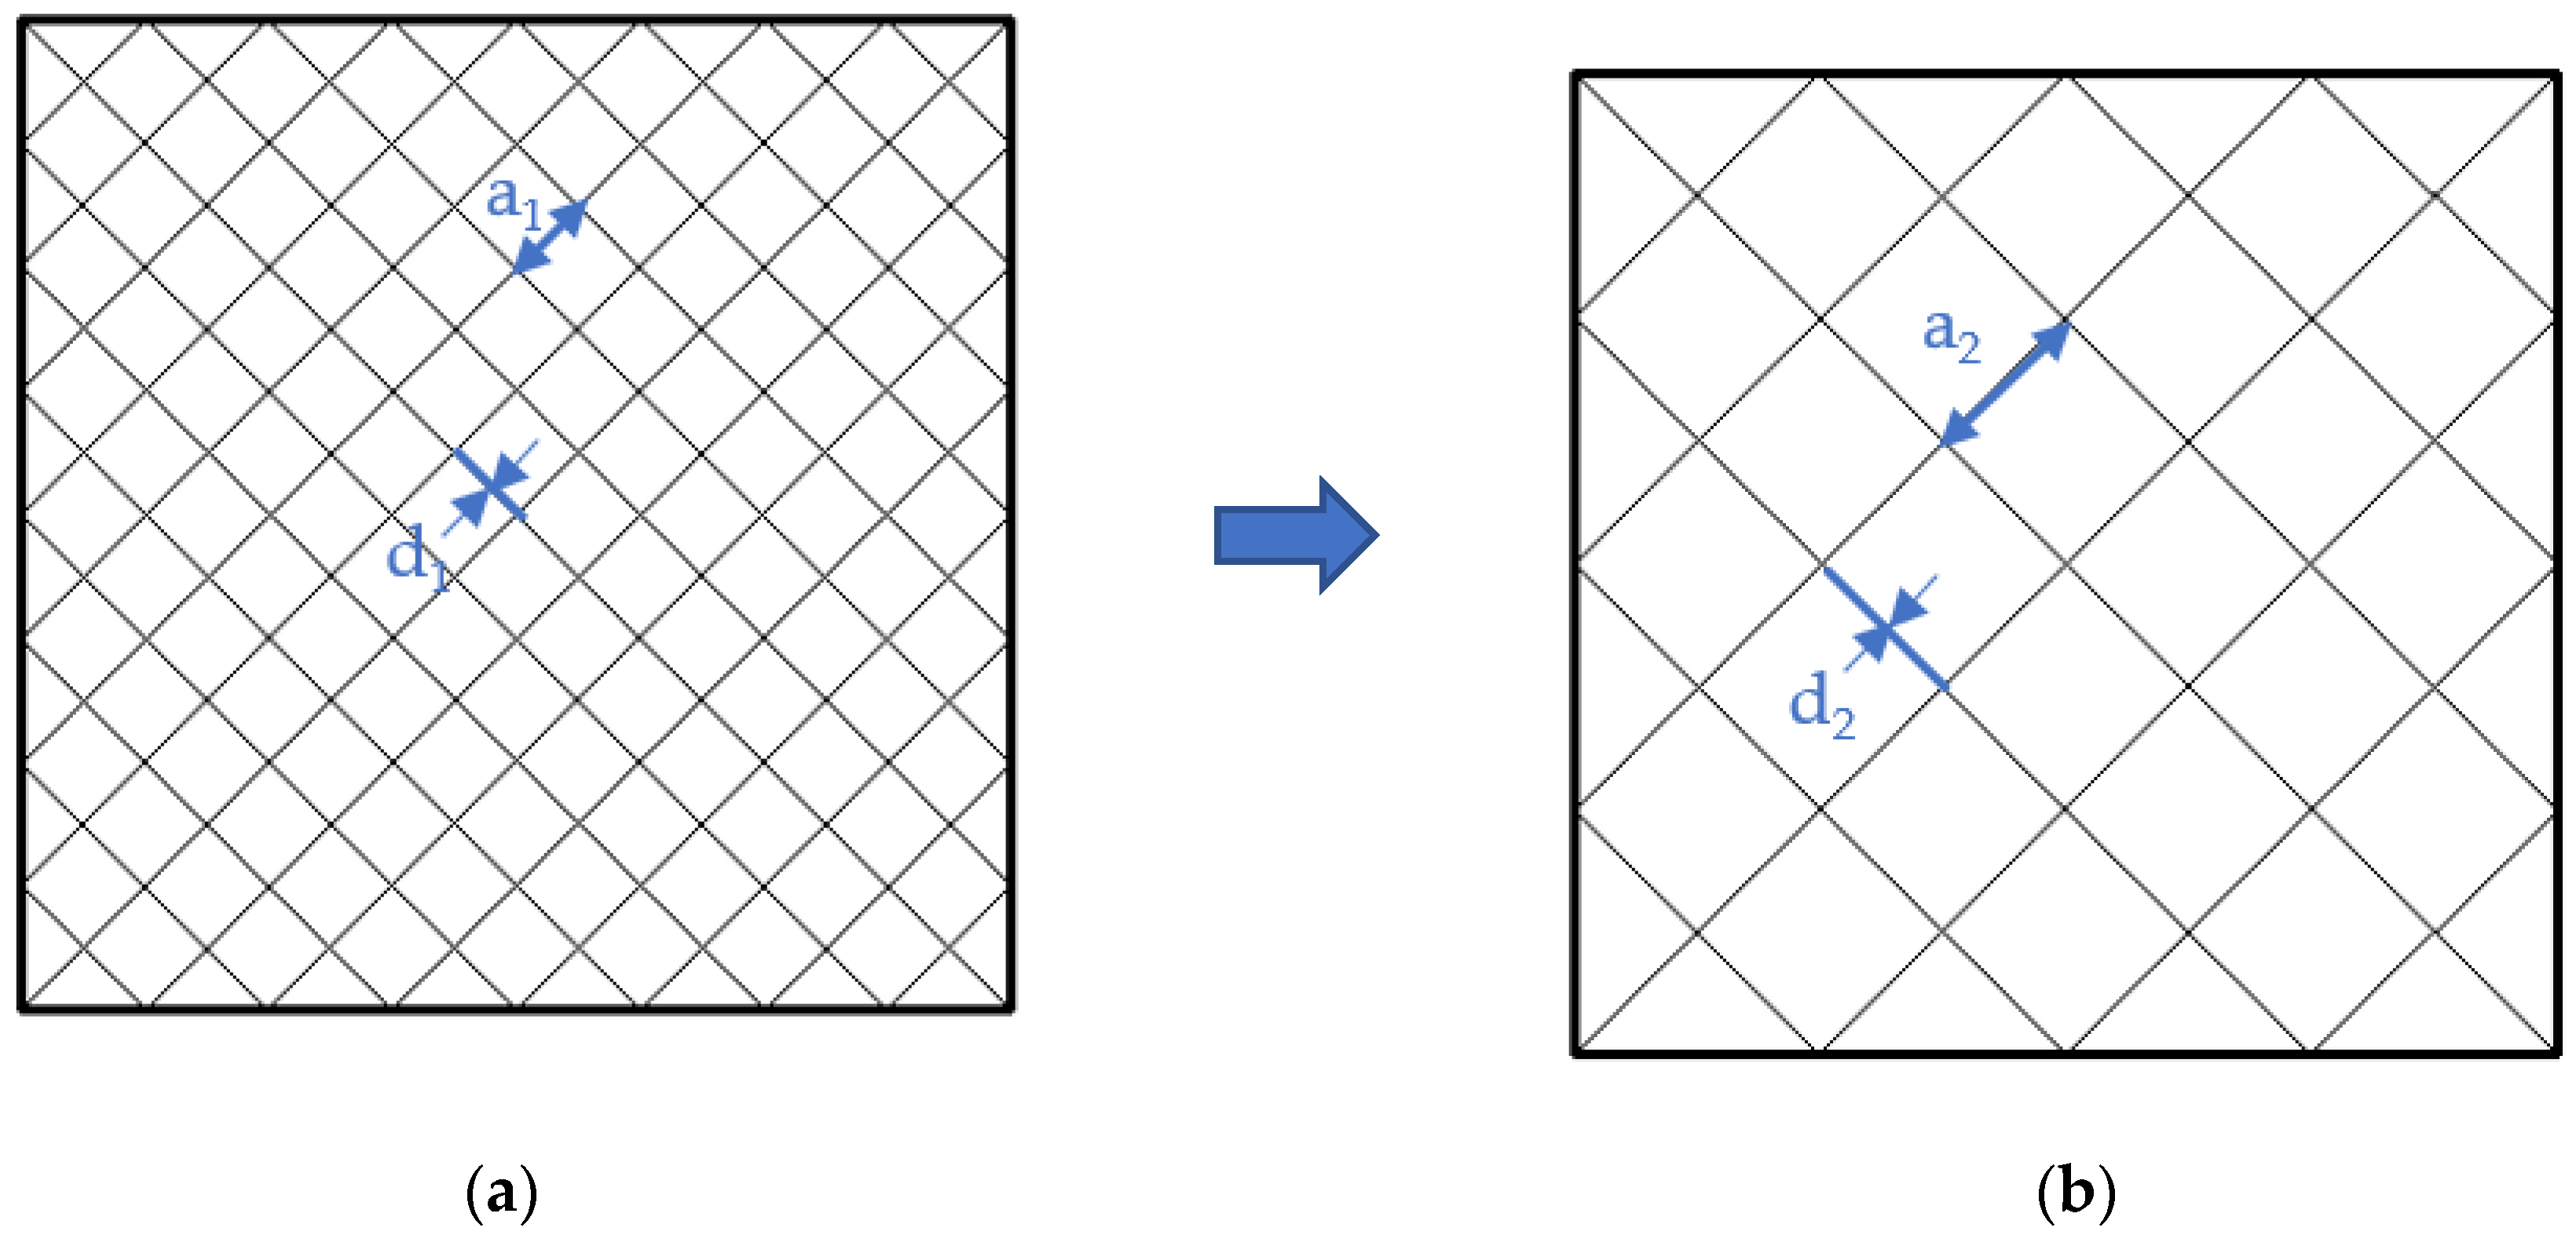
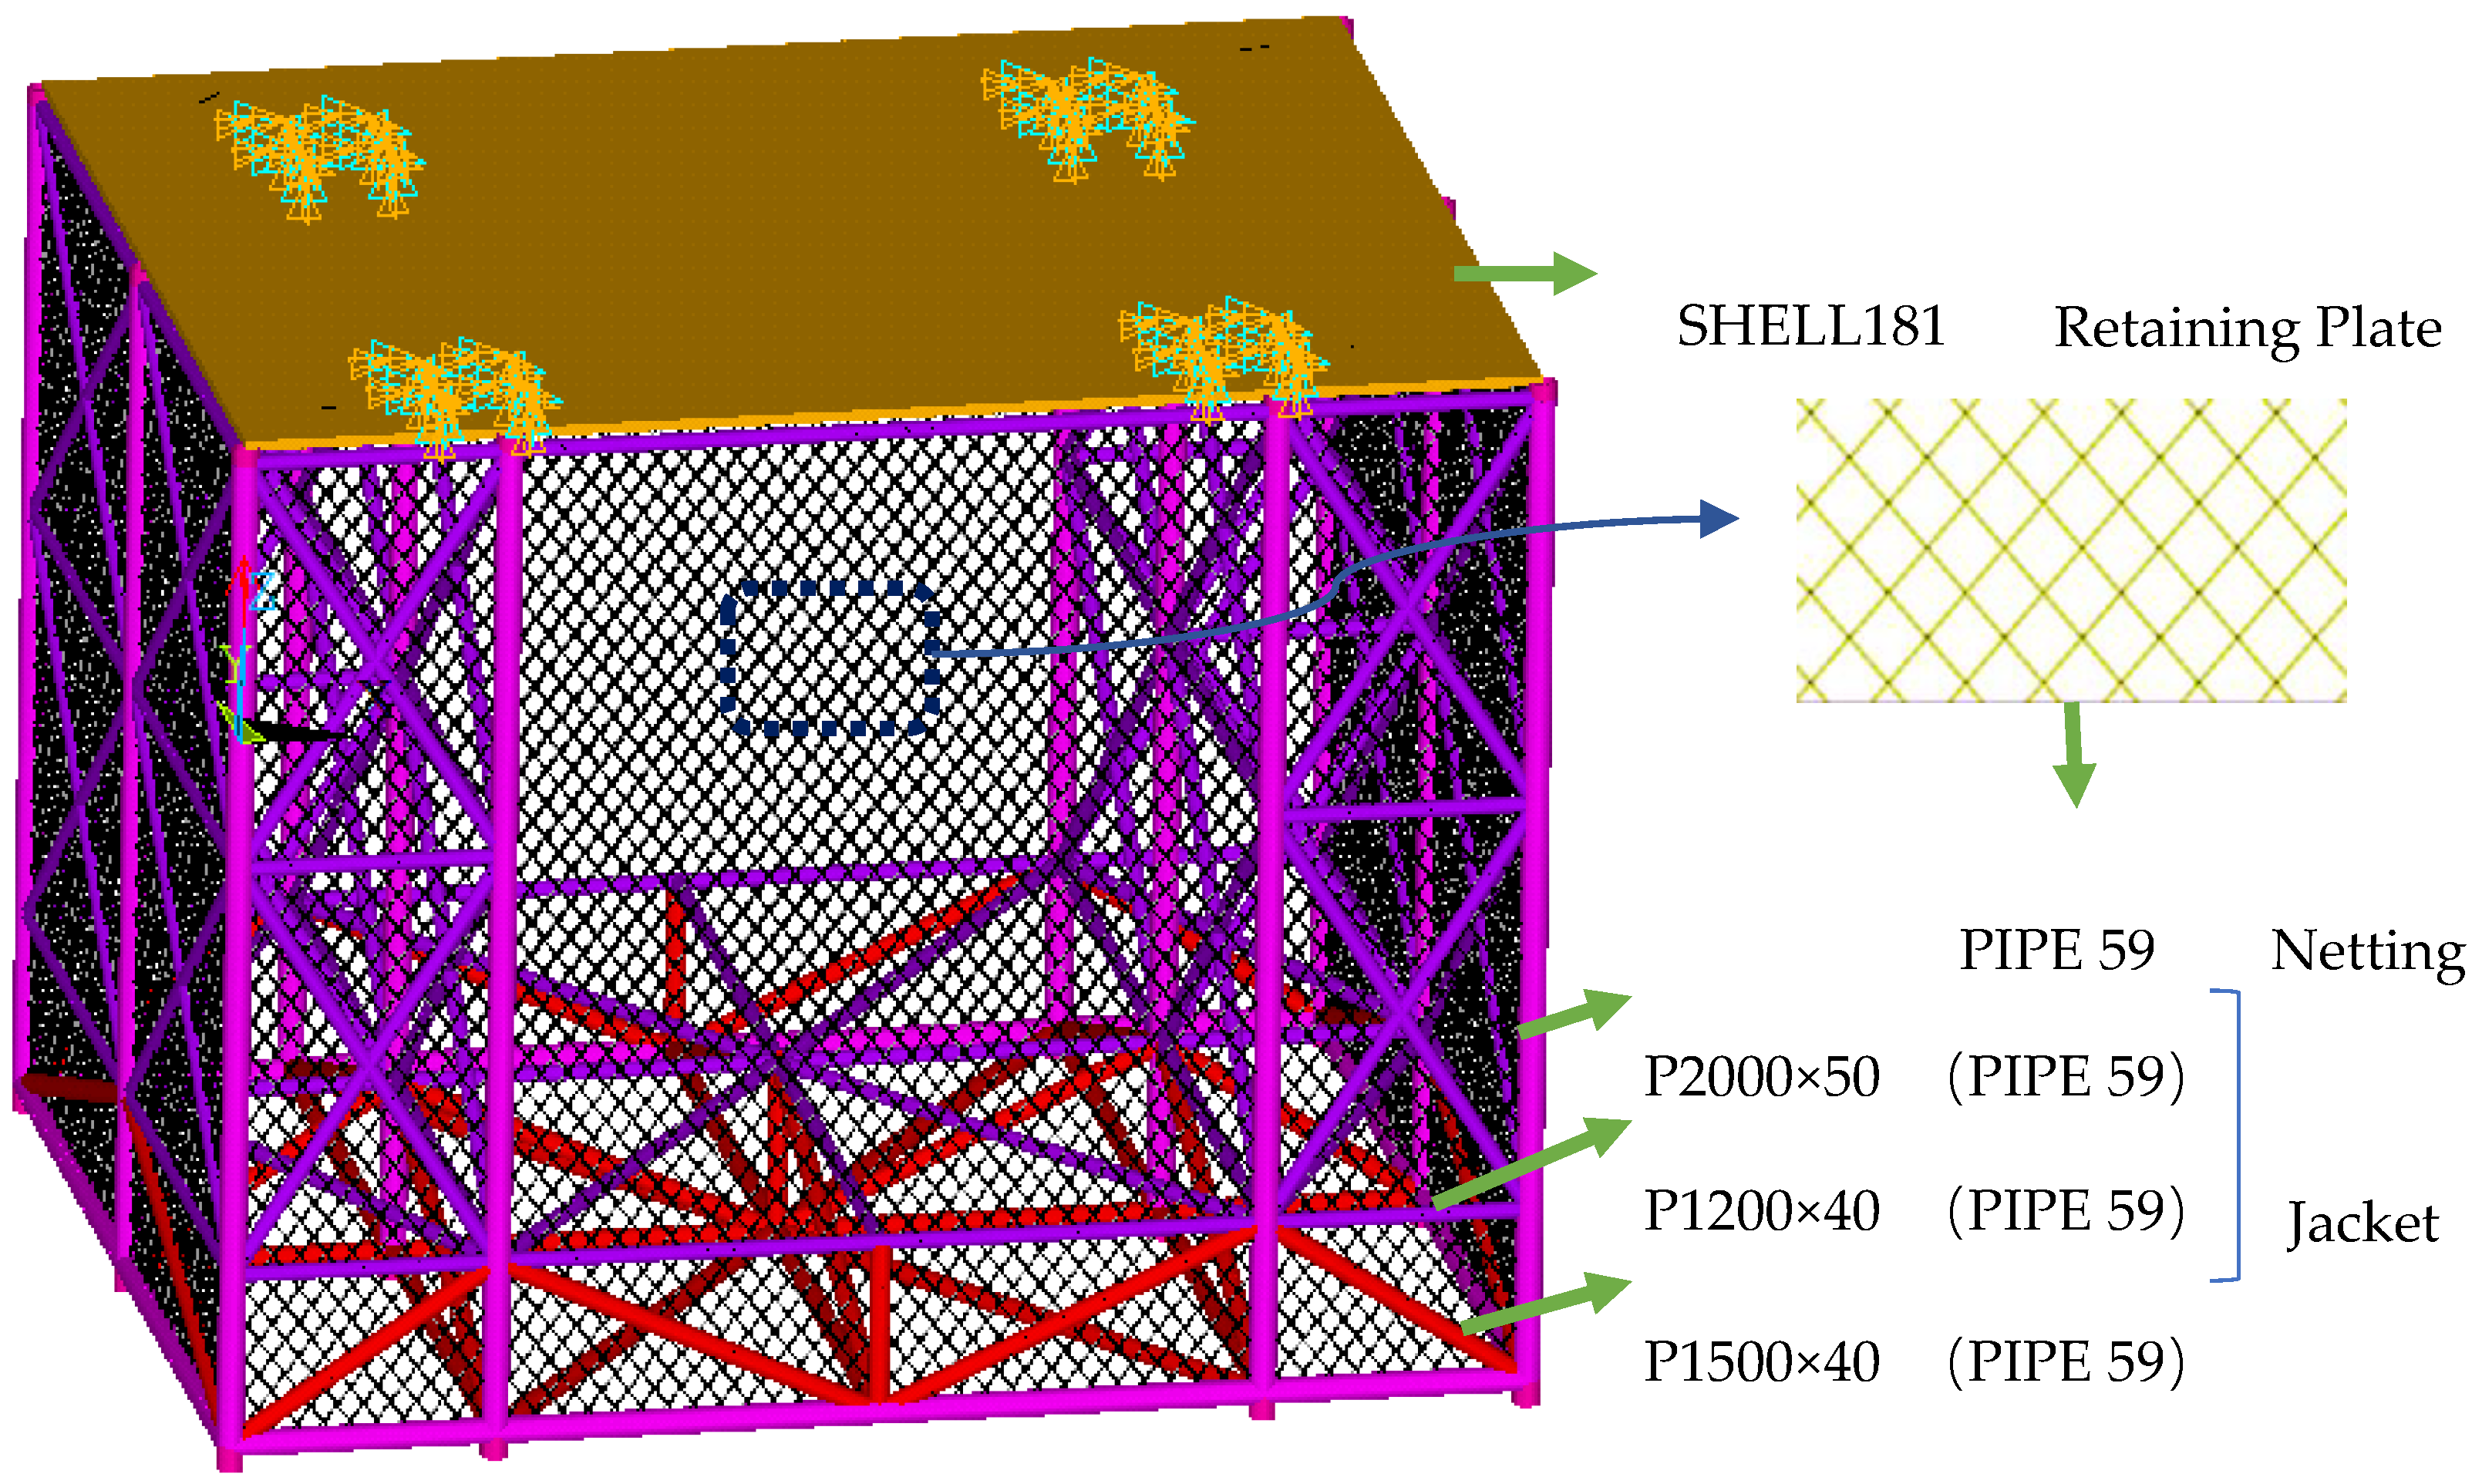
2.3. Numerical Model

The simulation was carried out using the finite element software ANSYS APDL 18.2, Ansys, Inc.; America. The test model used the equivalent nylon netting. In order to improve the calculation efficiency, the netting model for numerical simulation in this paper was simplified by the “mesh grouping” method (see Figure 5). Under the condition that the total mass and the total wave load of the netting were unchanged, four meshes in the test model were grouped into one mesh in the numerical model, and the parameters of the original and mesh-grouped net pen are shown in Table 3.
Furthermore, the finite element model of testing model was built as shown in Figure 6. In order to ensure that the results of numerical simulation can better reflect the test data, the main settings in the numerical calculations were as follows:
For the jacket structure, the PIPE59 element was used to establish a finite element model consistent with the experimental model. In the test, plexiglass plate with 1.2 cm thickness was attached to the top of the jacket, which was used to connect the jacket and the dynamometer to form a stable test force model. The numerical model was also fixed at the top of the jacket with the same plexiglass plate (SHELL181). To simulate the real dynamometer and board constraints, there were four fixed points at each position of the dynamometer, as shown in Figure 6.
The netting was also simulated with the PIPE59 element. Unlike the jacket, the element of the netting simulated its flexibility by eliminating the bending stiffness, and set its inner diameter to zero. In order to ensure the load transfer between the netting and the jacket, the two must be coupled together. Since they were of the same element type, it was only necessary to establish a common node between the netting and the jacket to achieve the connection.
The hydrodynamic calculation for the PIPE59 element in ANSYS was based on the Morison equation shown in Equation (1). CD and CM were obtained by the least square method described above. In addition, the origin of the global coordinate system of the numerical model must be located at stilling water surface, and the vertical axis was the Z axis, the positive direction of the Z axis was upward.

3. Results

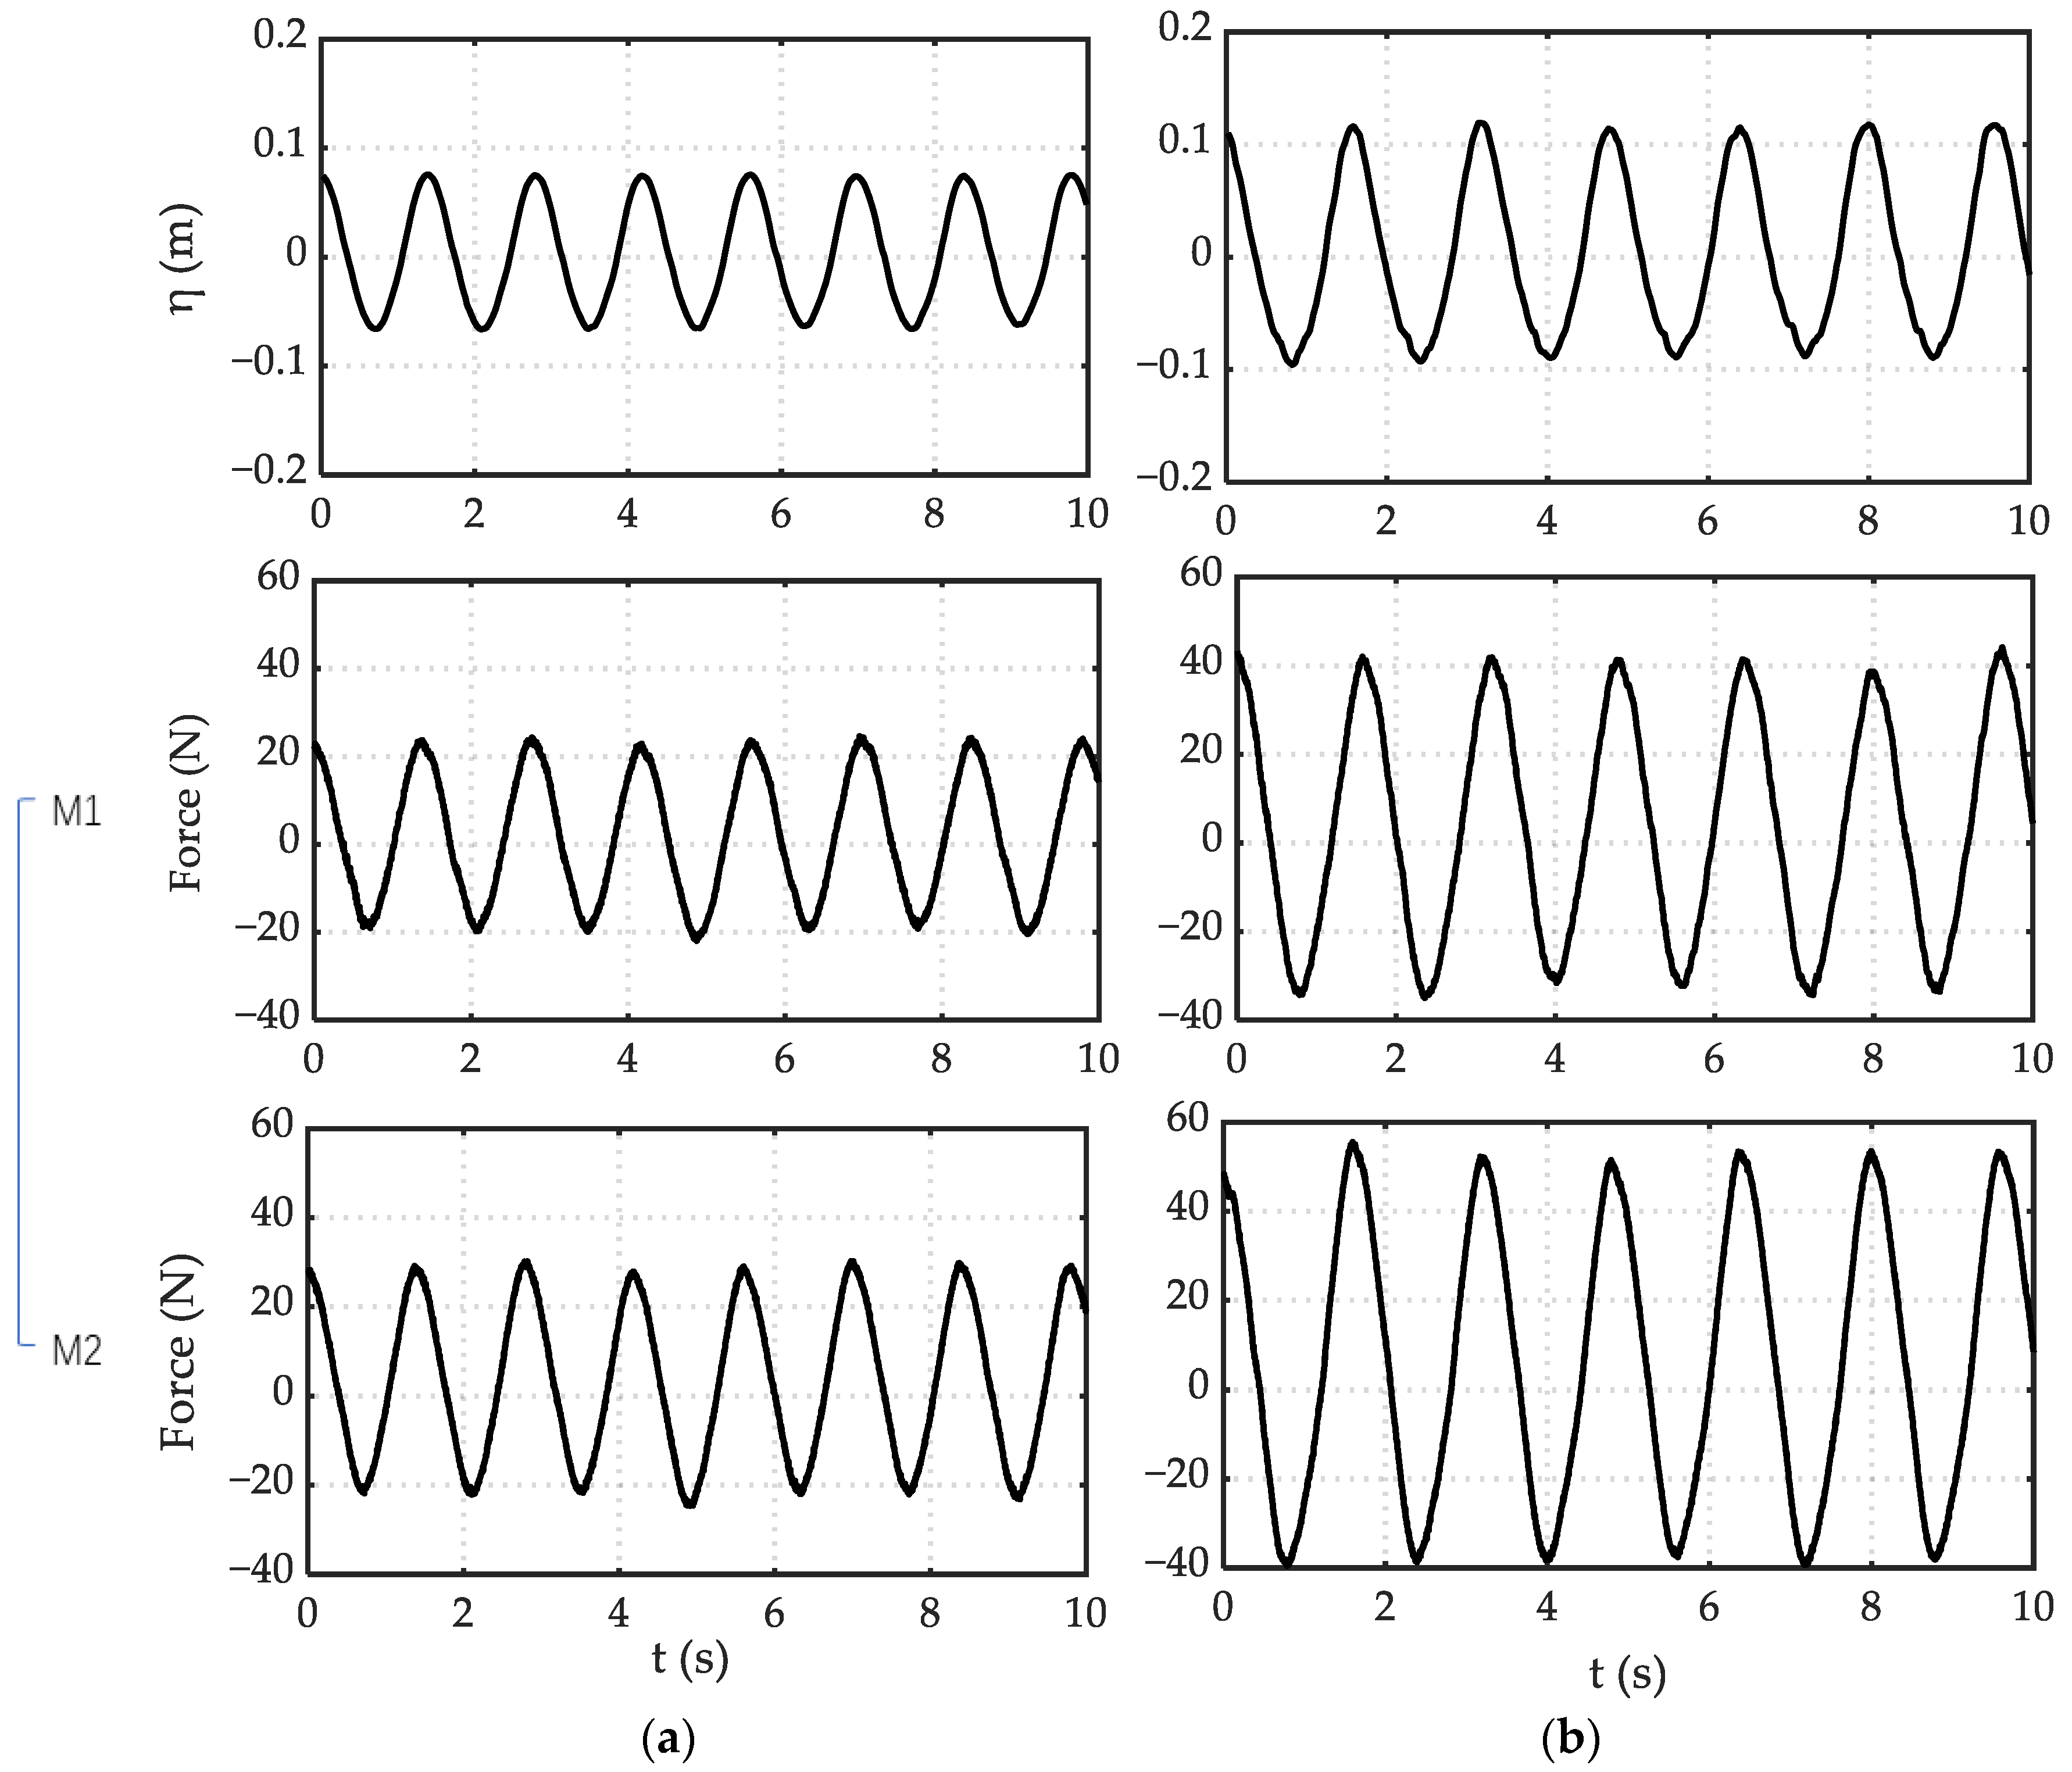
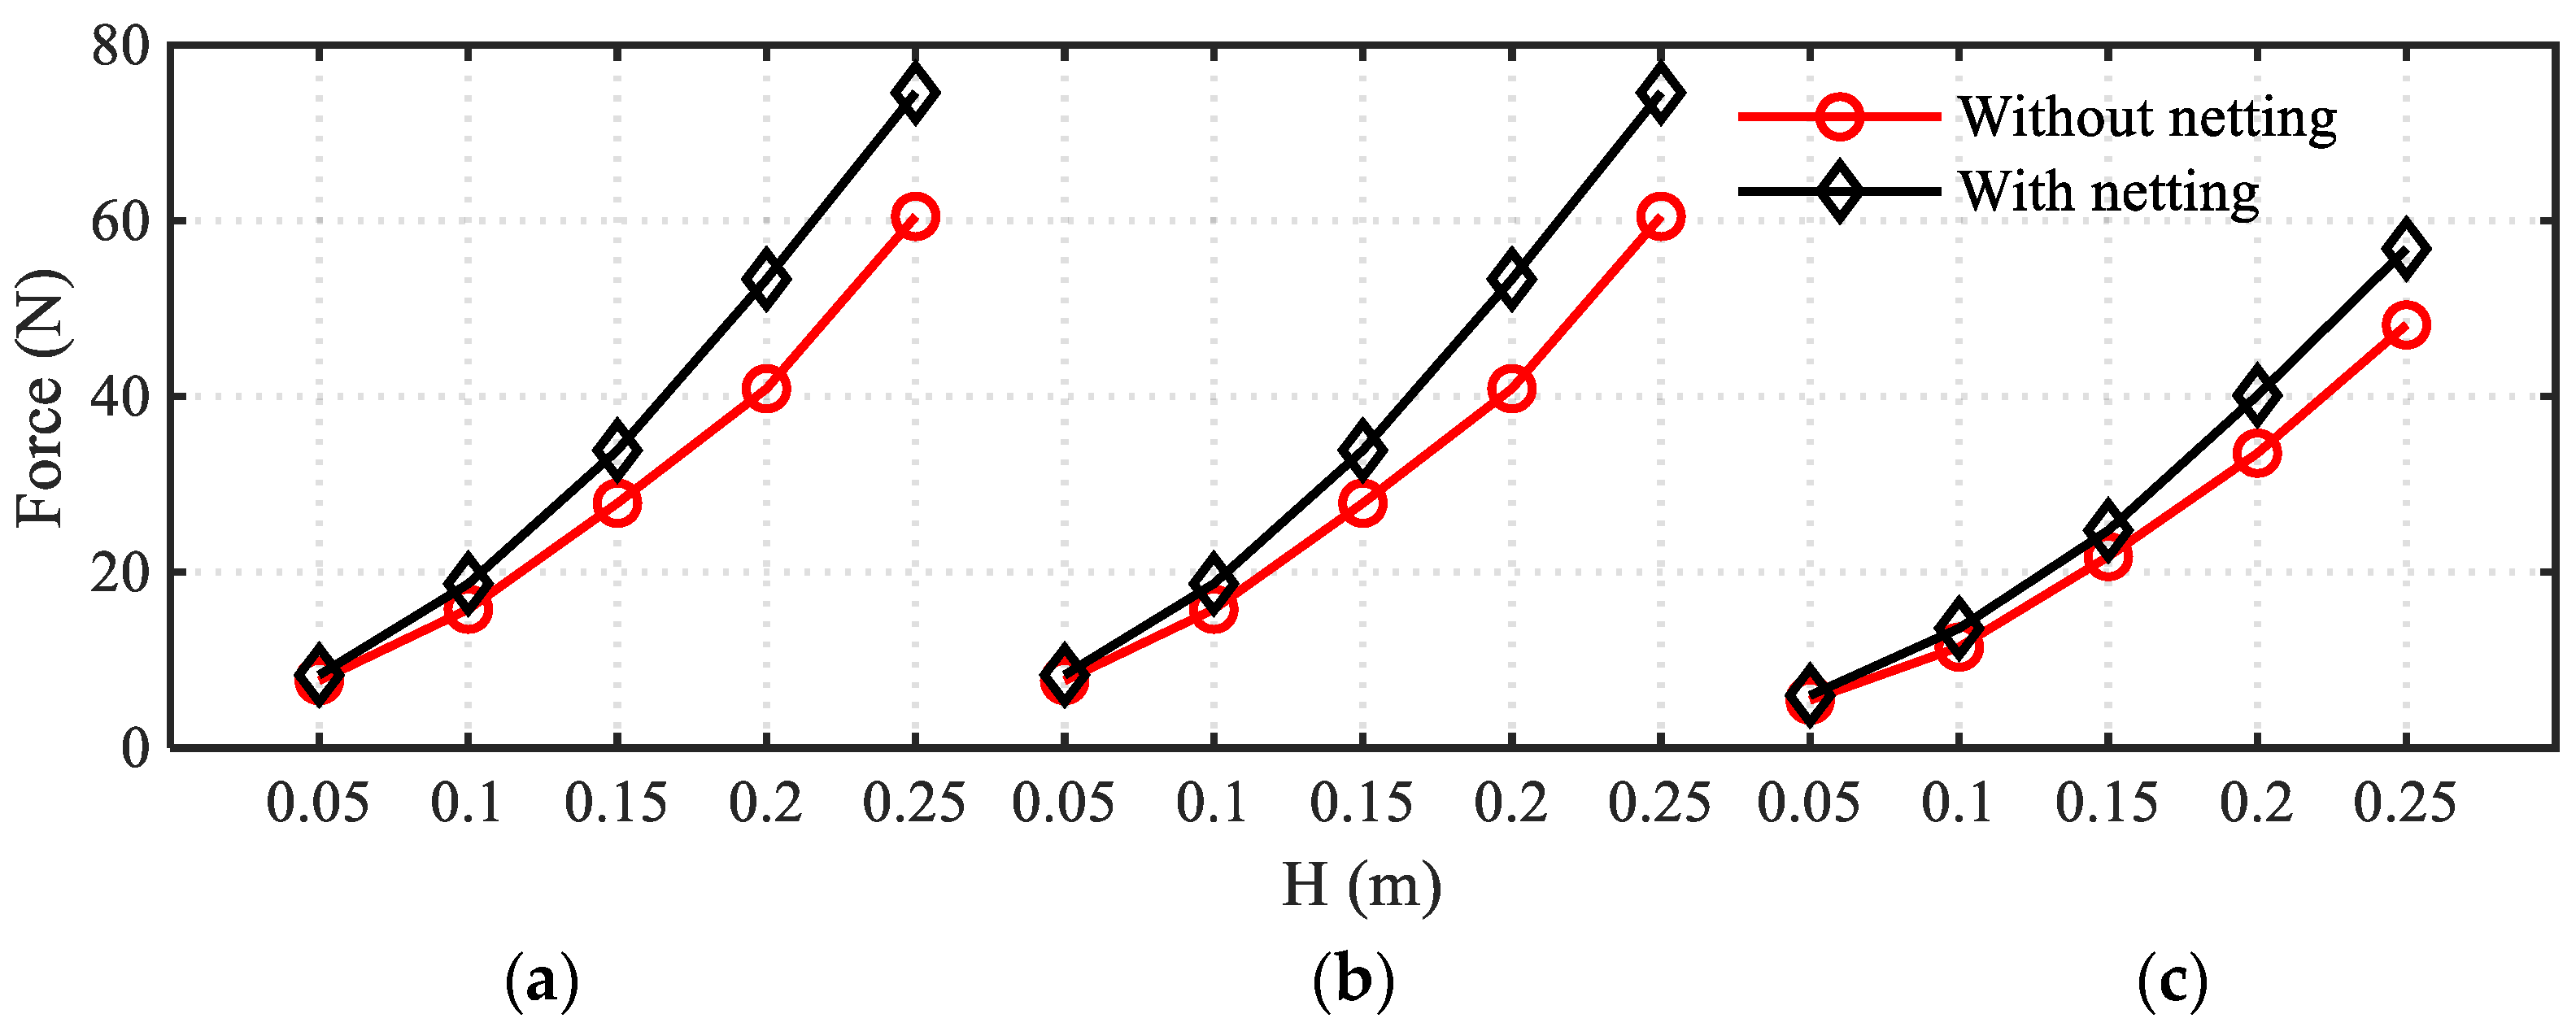
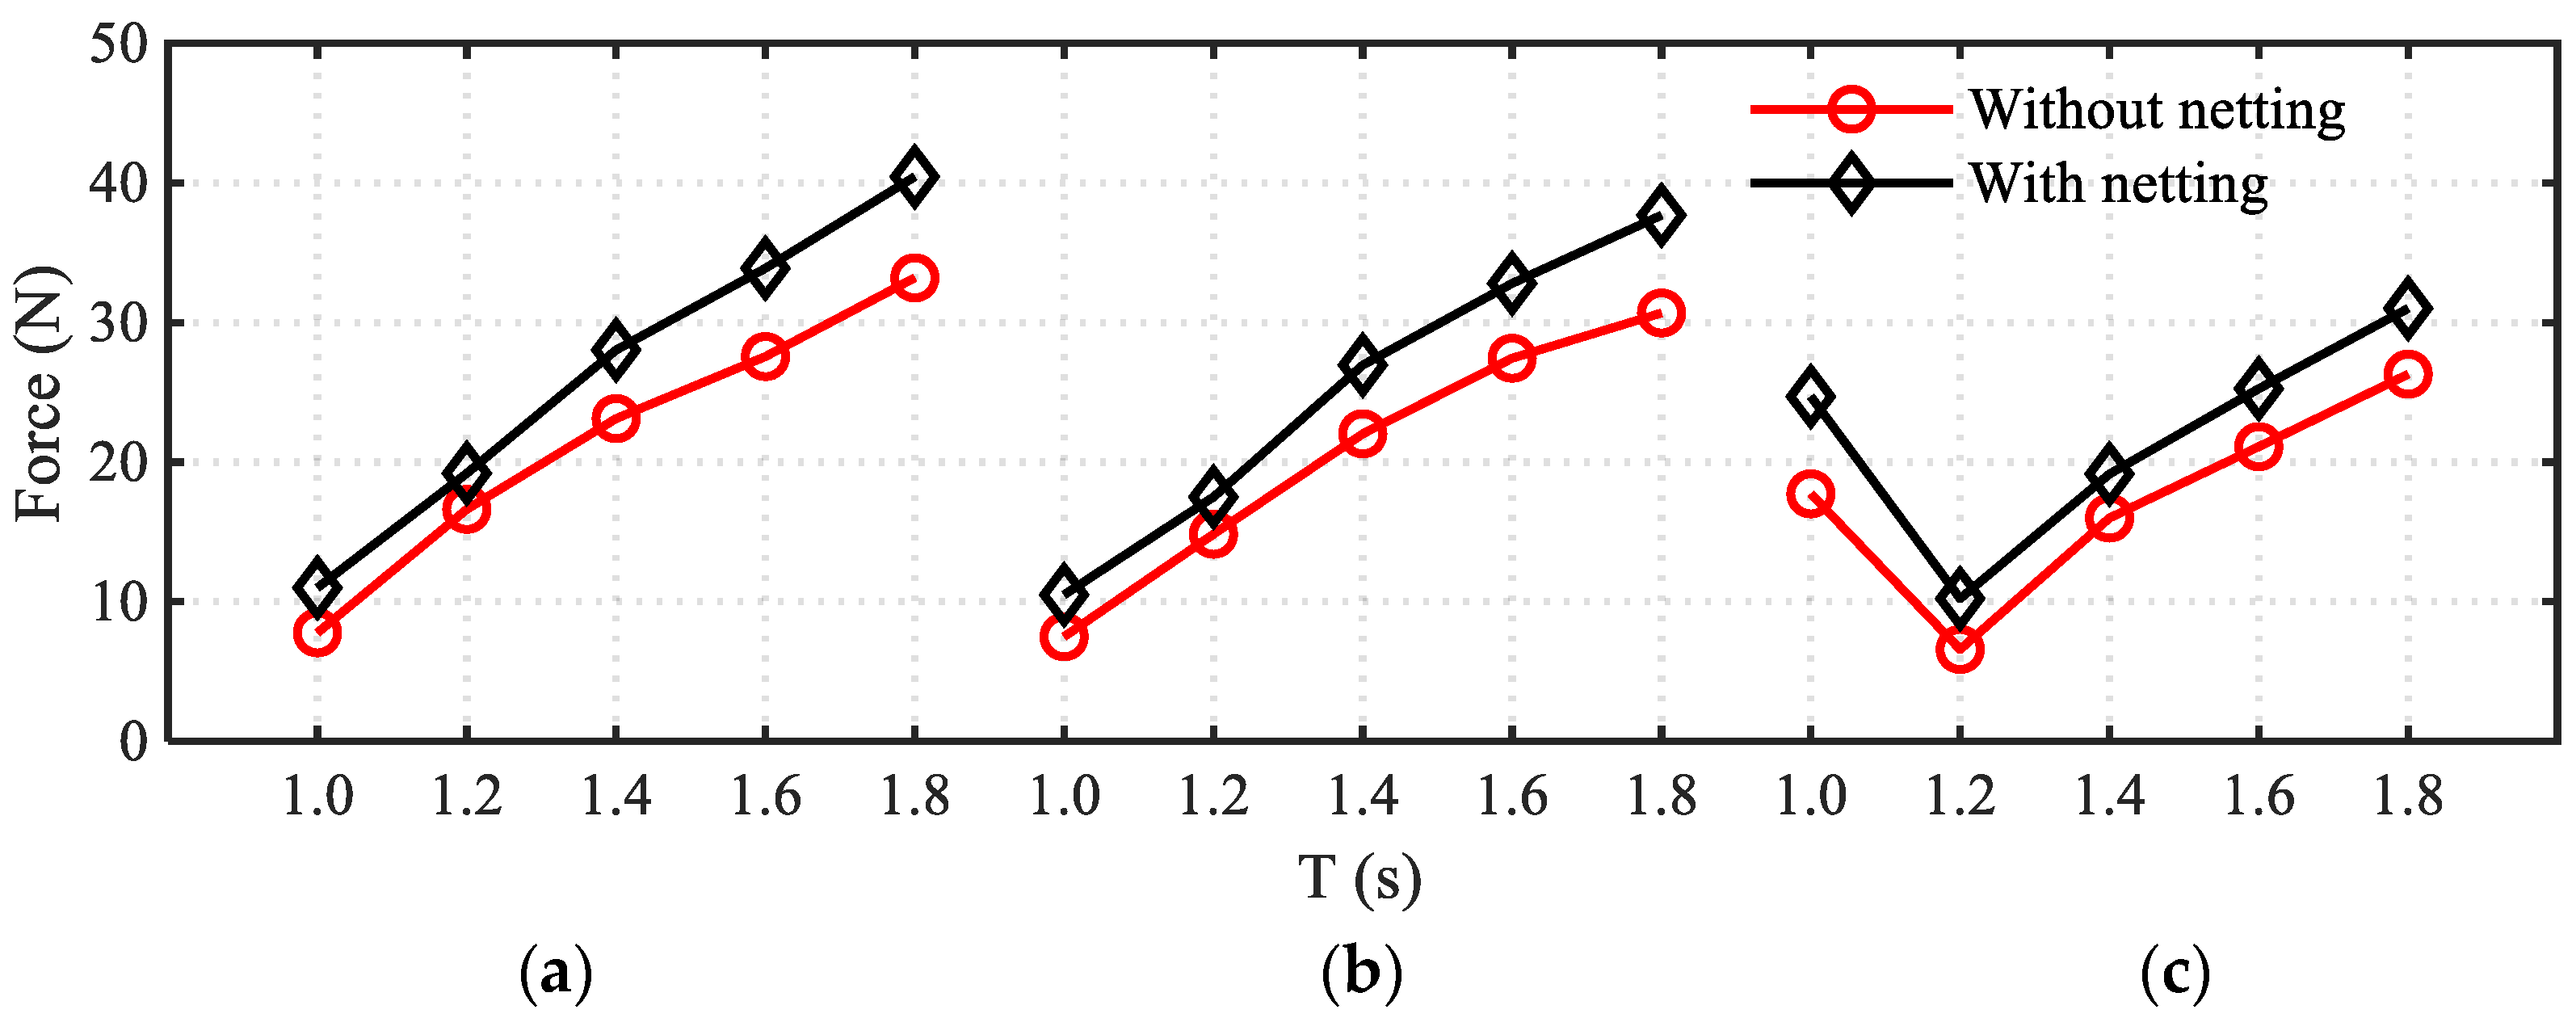
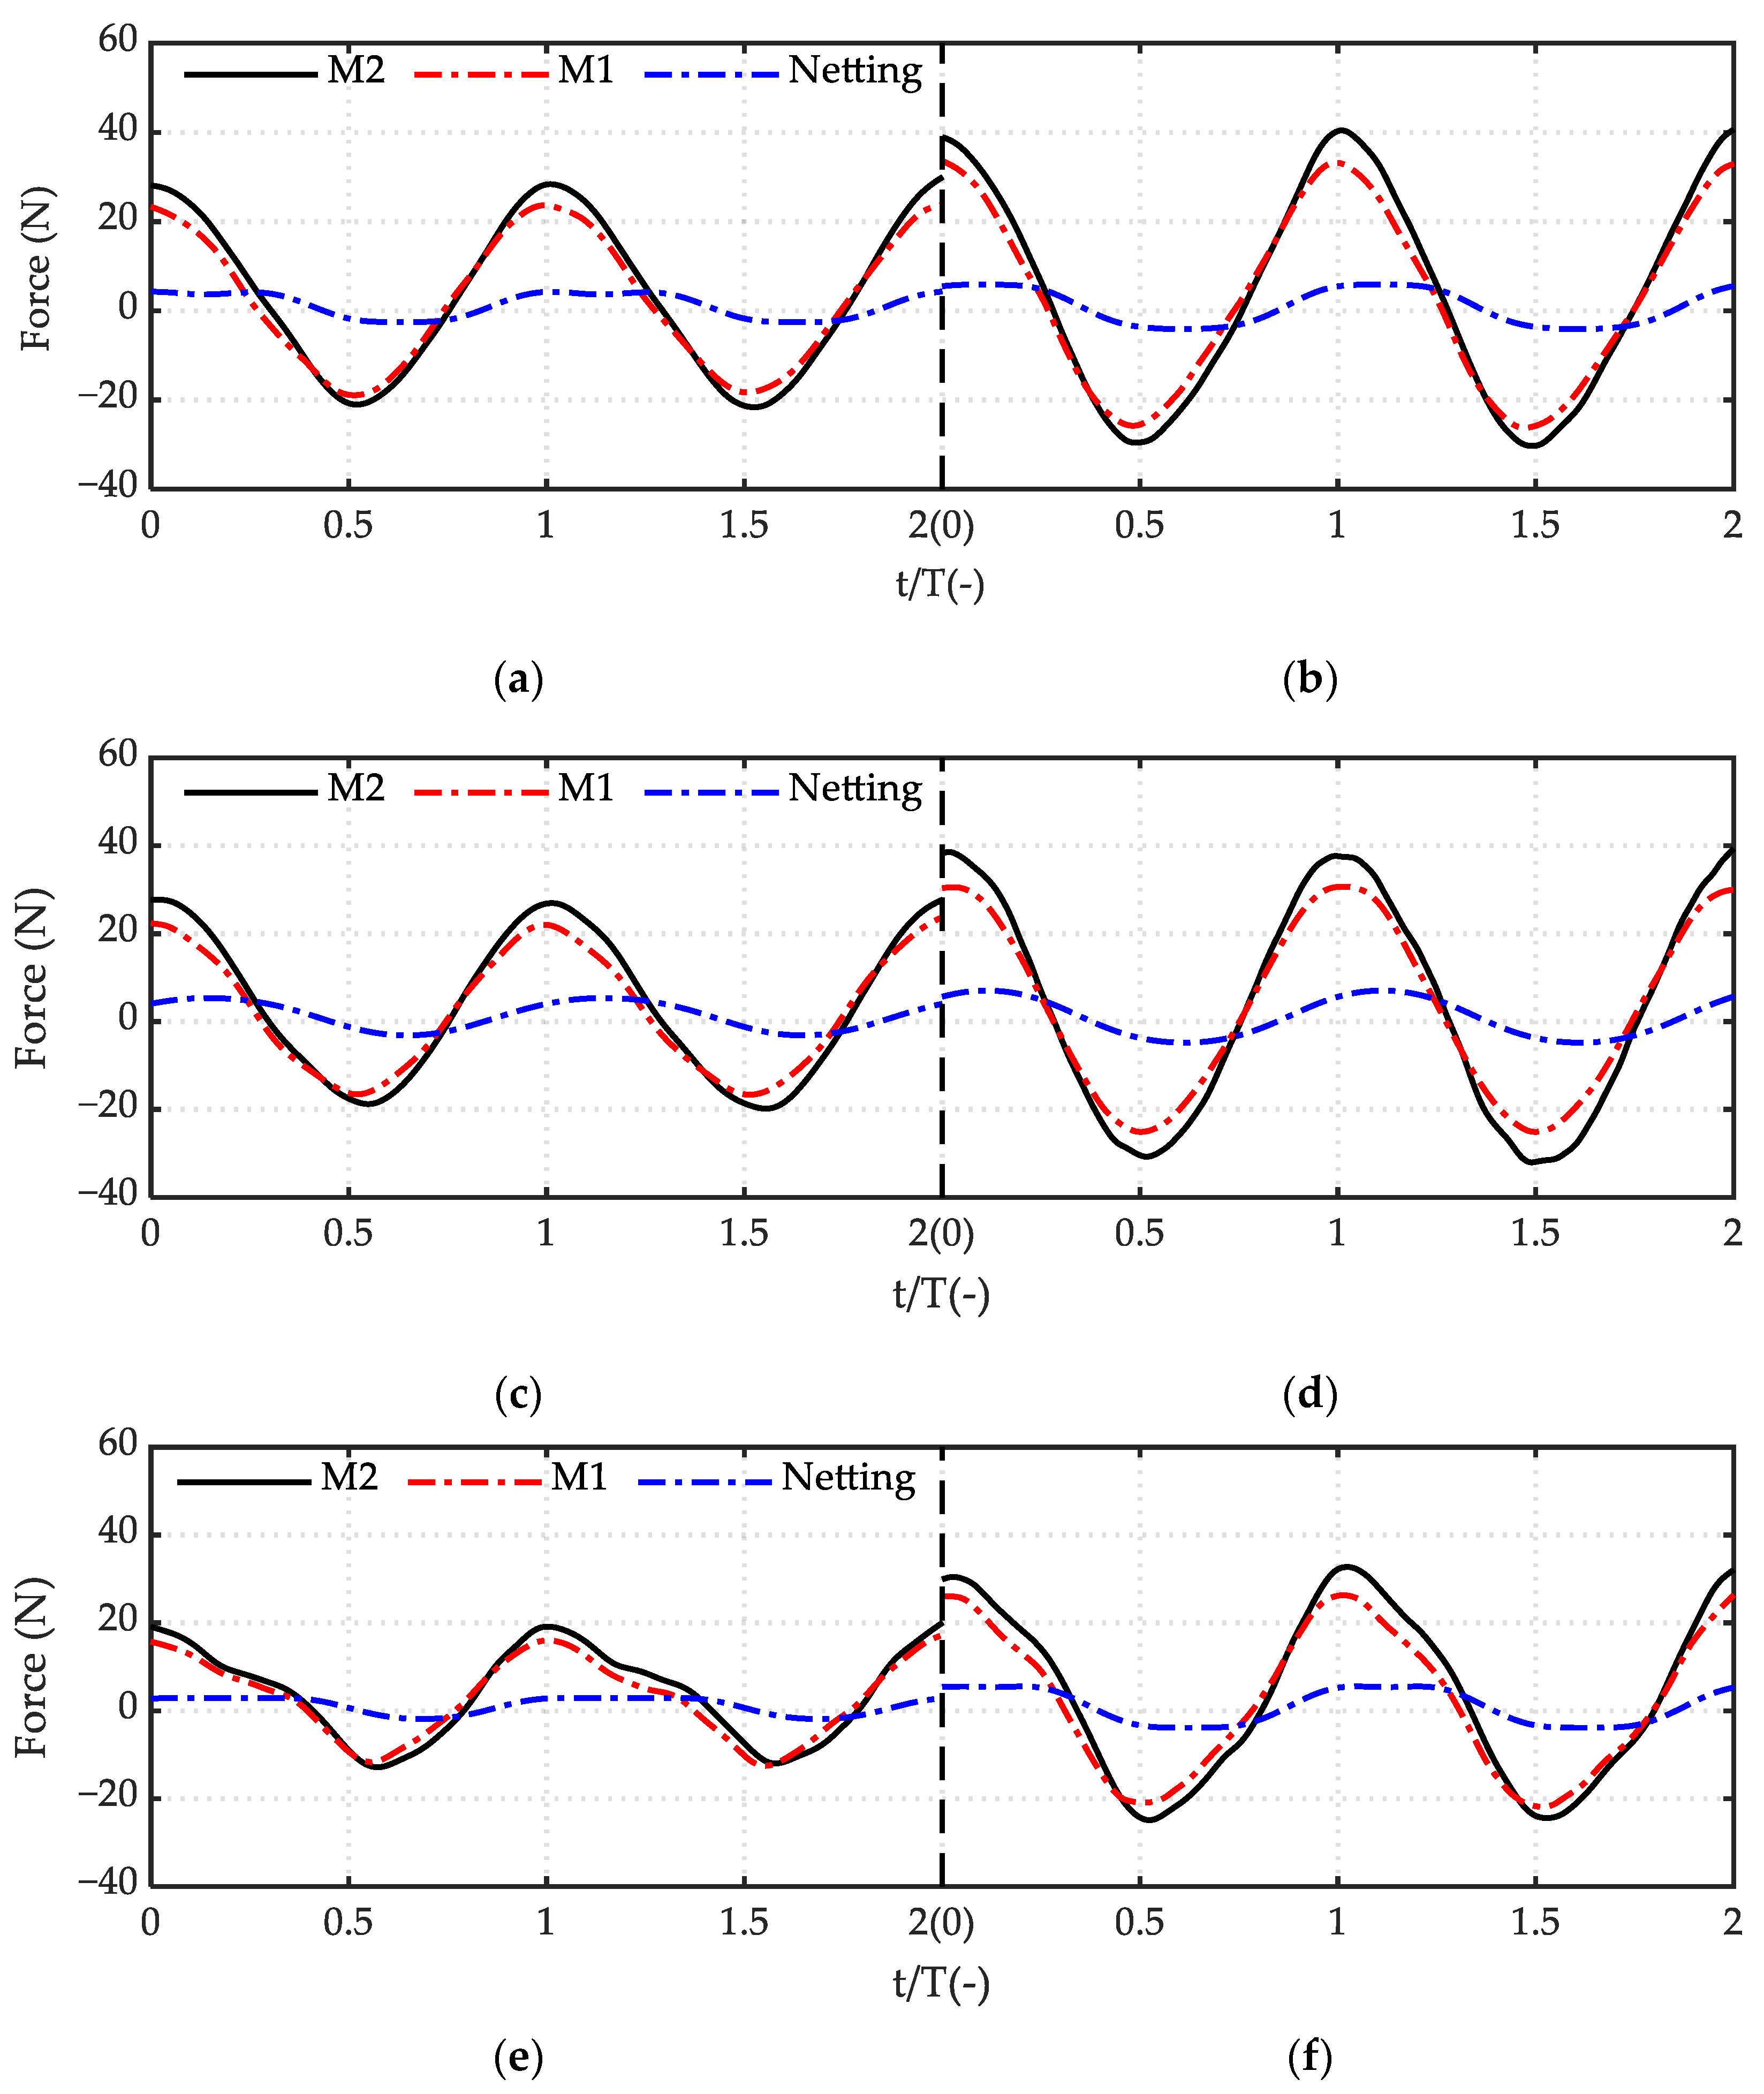
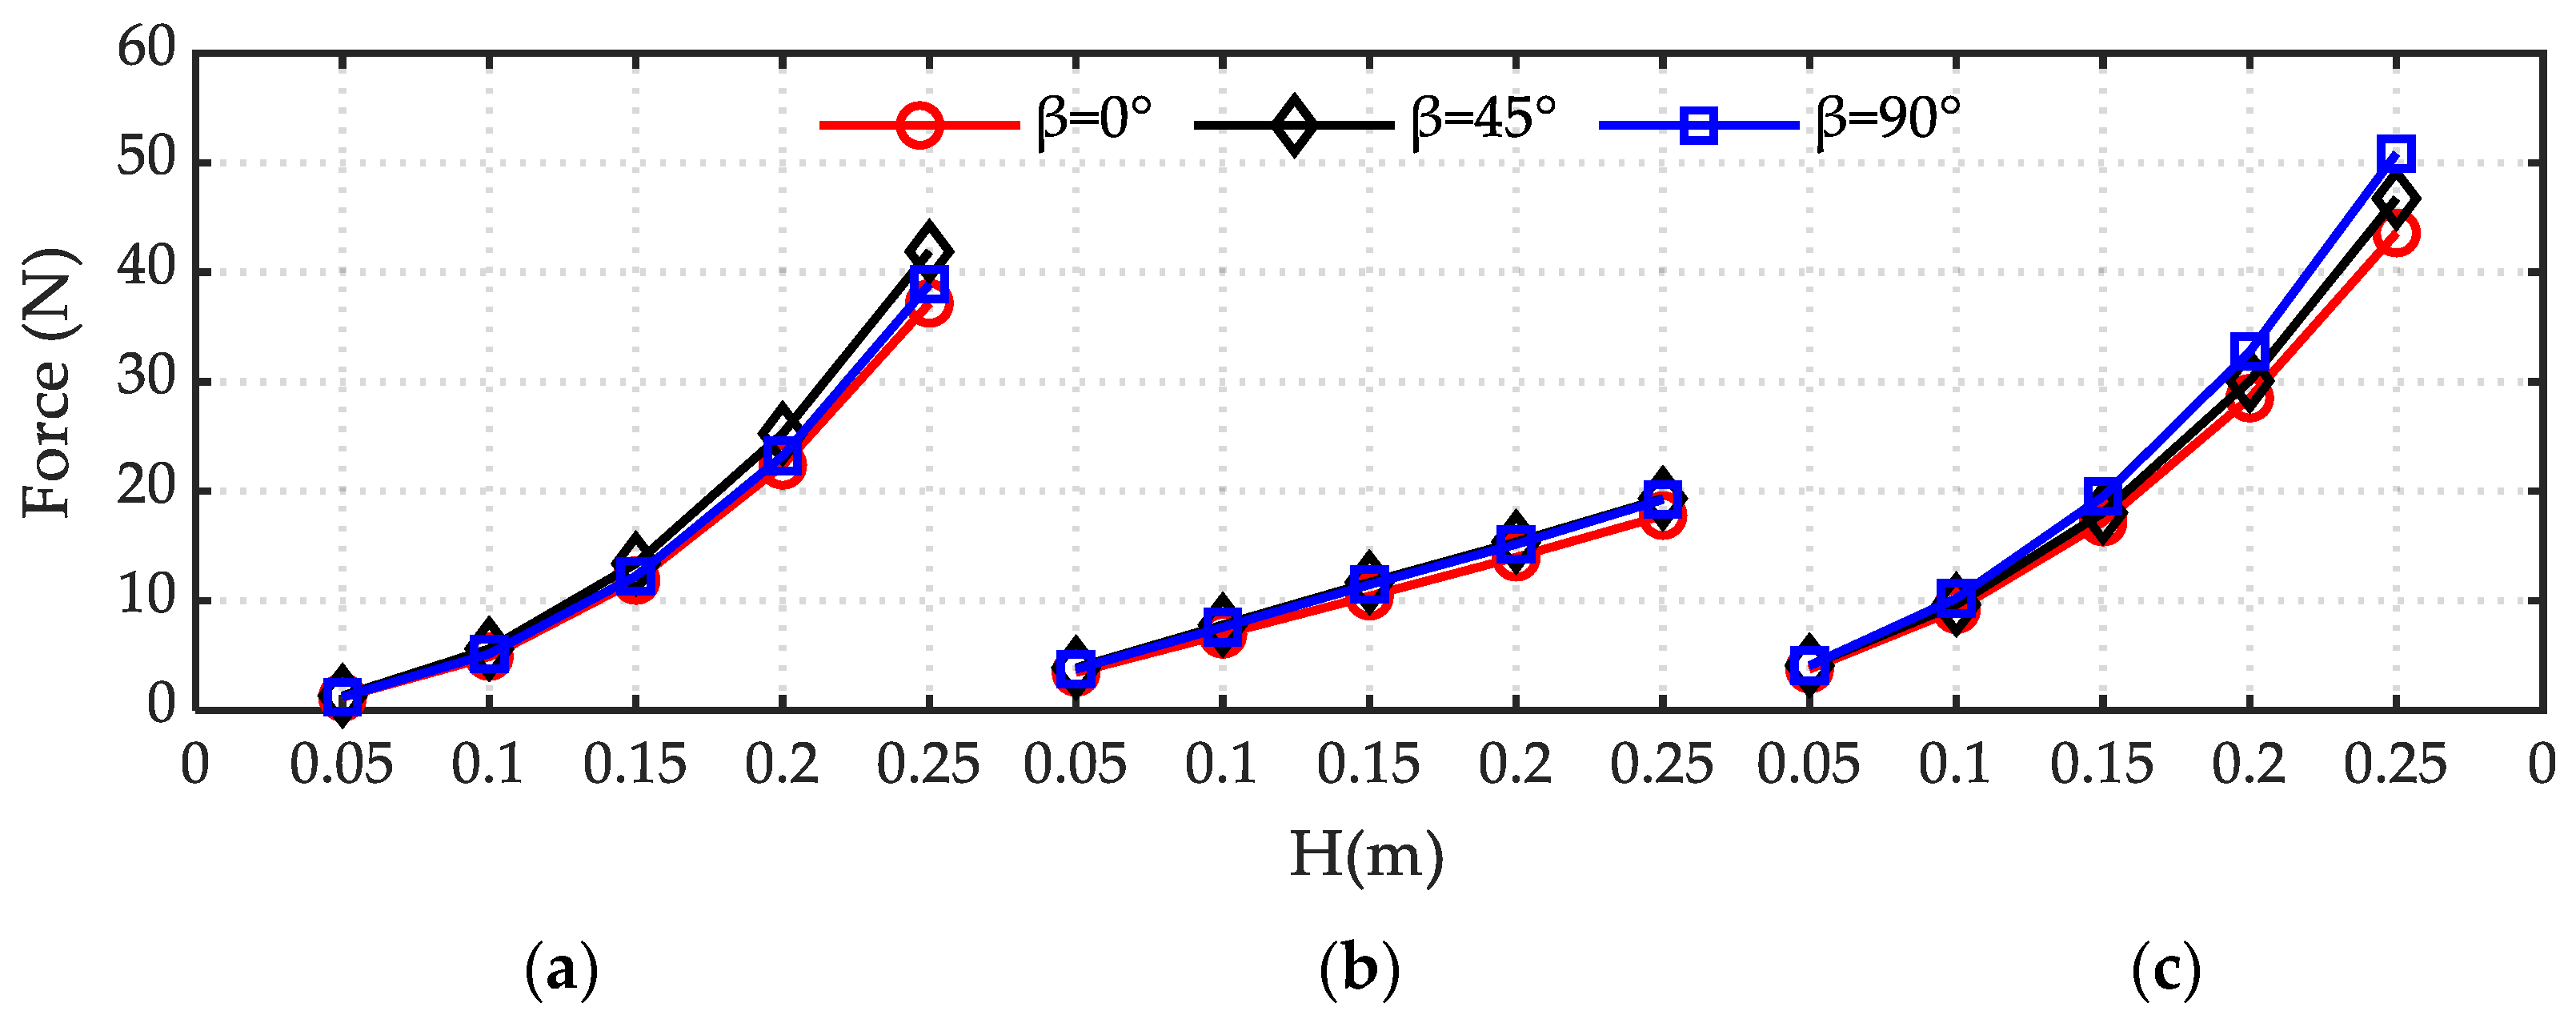
3.1. Horizontal Force on Various Models in Waves

For each set of wave conditions, the component vector of each dynamometer was added along the wave direction to obtain the total horizontal wave force of M1 and M2. The time histories of the wave height and horizontal forces on M1 and M2 in A3-3 and A4 are shown in Figure 7. The result showed a steady state in the range of 10 s, and the time history of the force and the wave height were basically synchronous, while the peak and valley values had the same asymmetry.
The relationship between the peak value of the horizontal wave force on the test model and the wave conditions is shown in Figure 8 and Figure 9. Since the presence of the netting increased the flow area of the structure, the wave forces on the structure were increased to some extent. Comparing the horizontal wave force data of all test conditions, it can be found that the horizontal force of M2 was greater than M1. When the period was 1.6 s, the peak of the horizontal wave force on the structure increased with the increment of the wave height, and the contribution of the additional netting to the horizontal wave force of the structure became more and more obvious. When the wave height was 0.15 m, the wave force of the structure increase with the increment of the period and step diameter was decreased except C3-1, where the peaks of the wave forces on M1 and M2 were all abnormally large; 17.73 N for M1 and 24.7 N for M2.

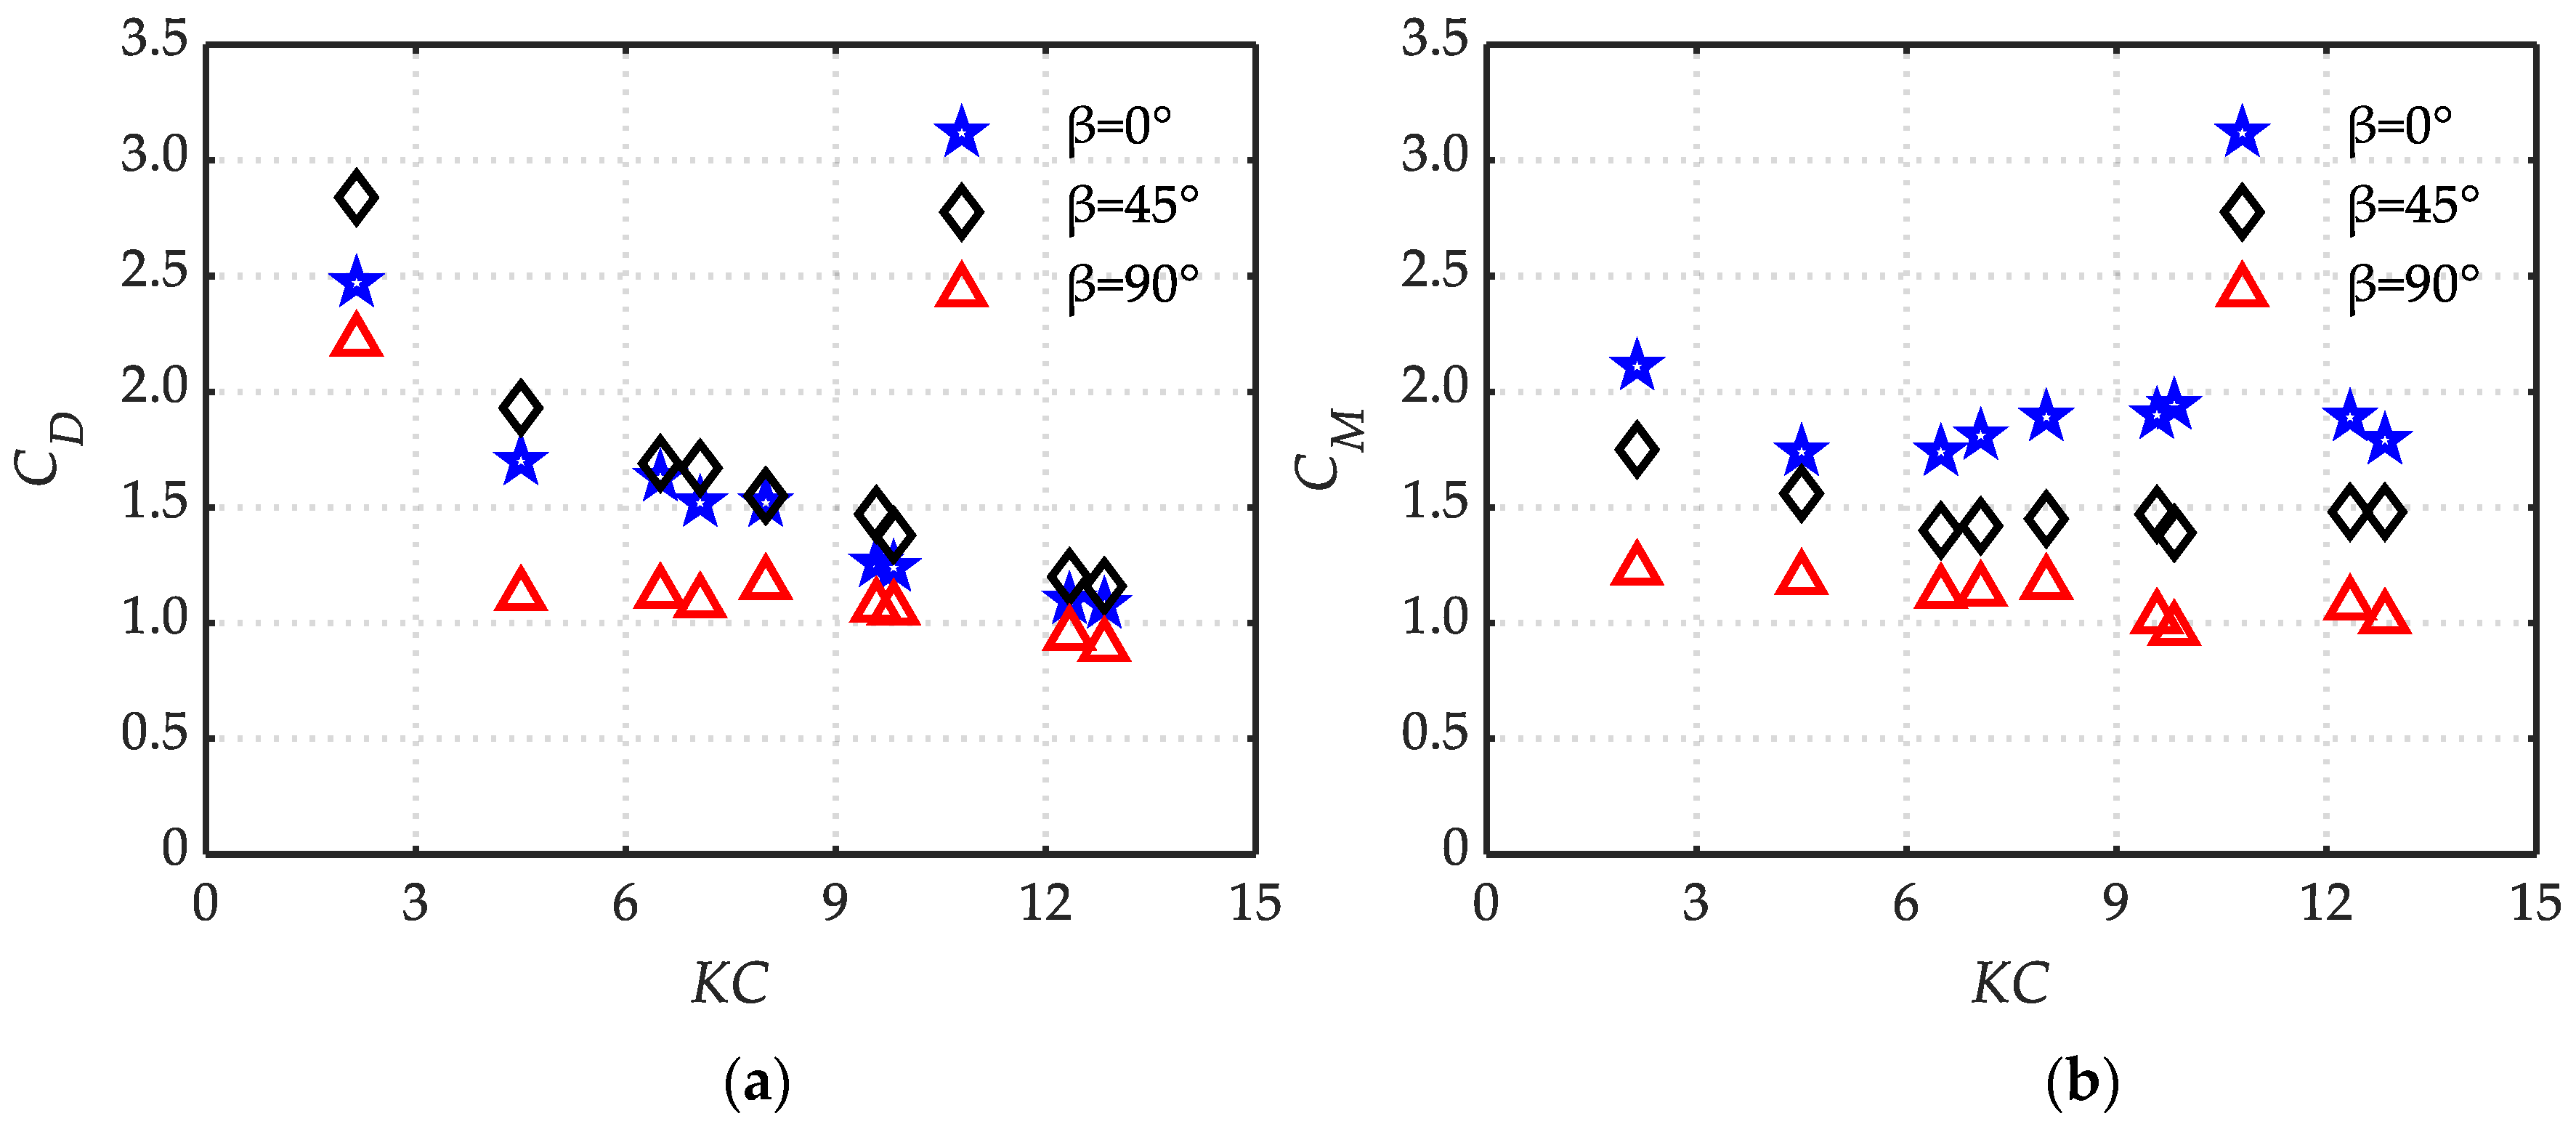
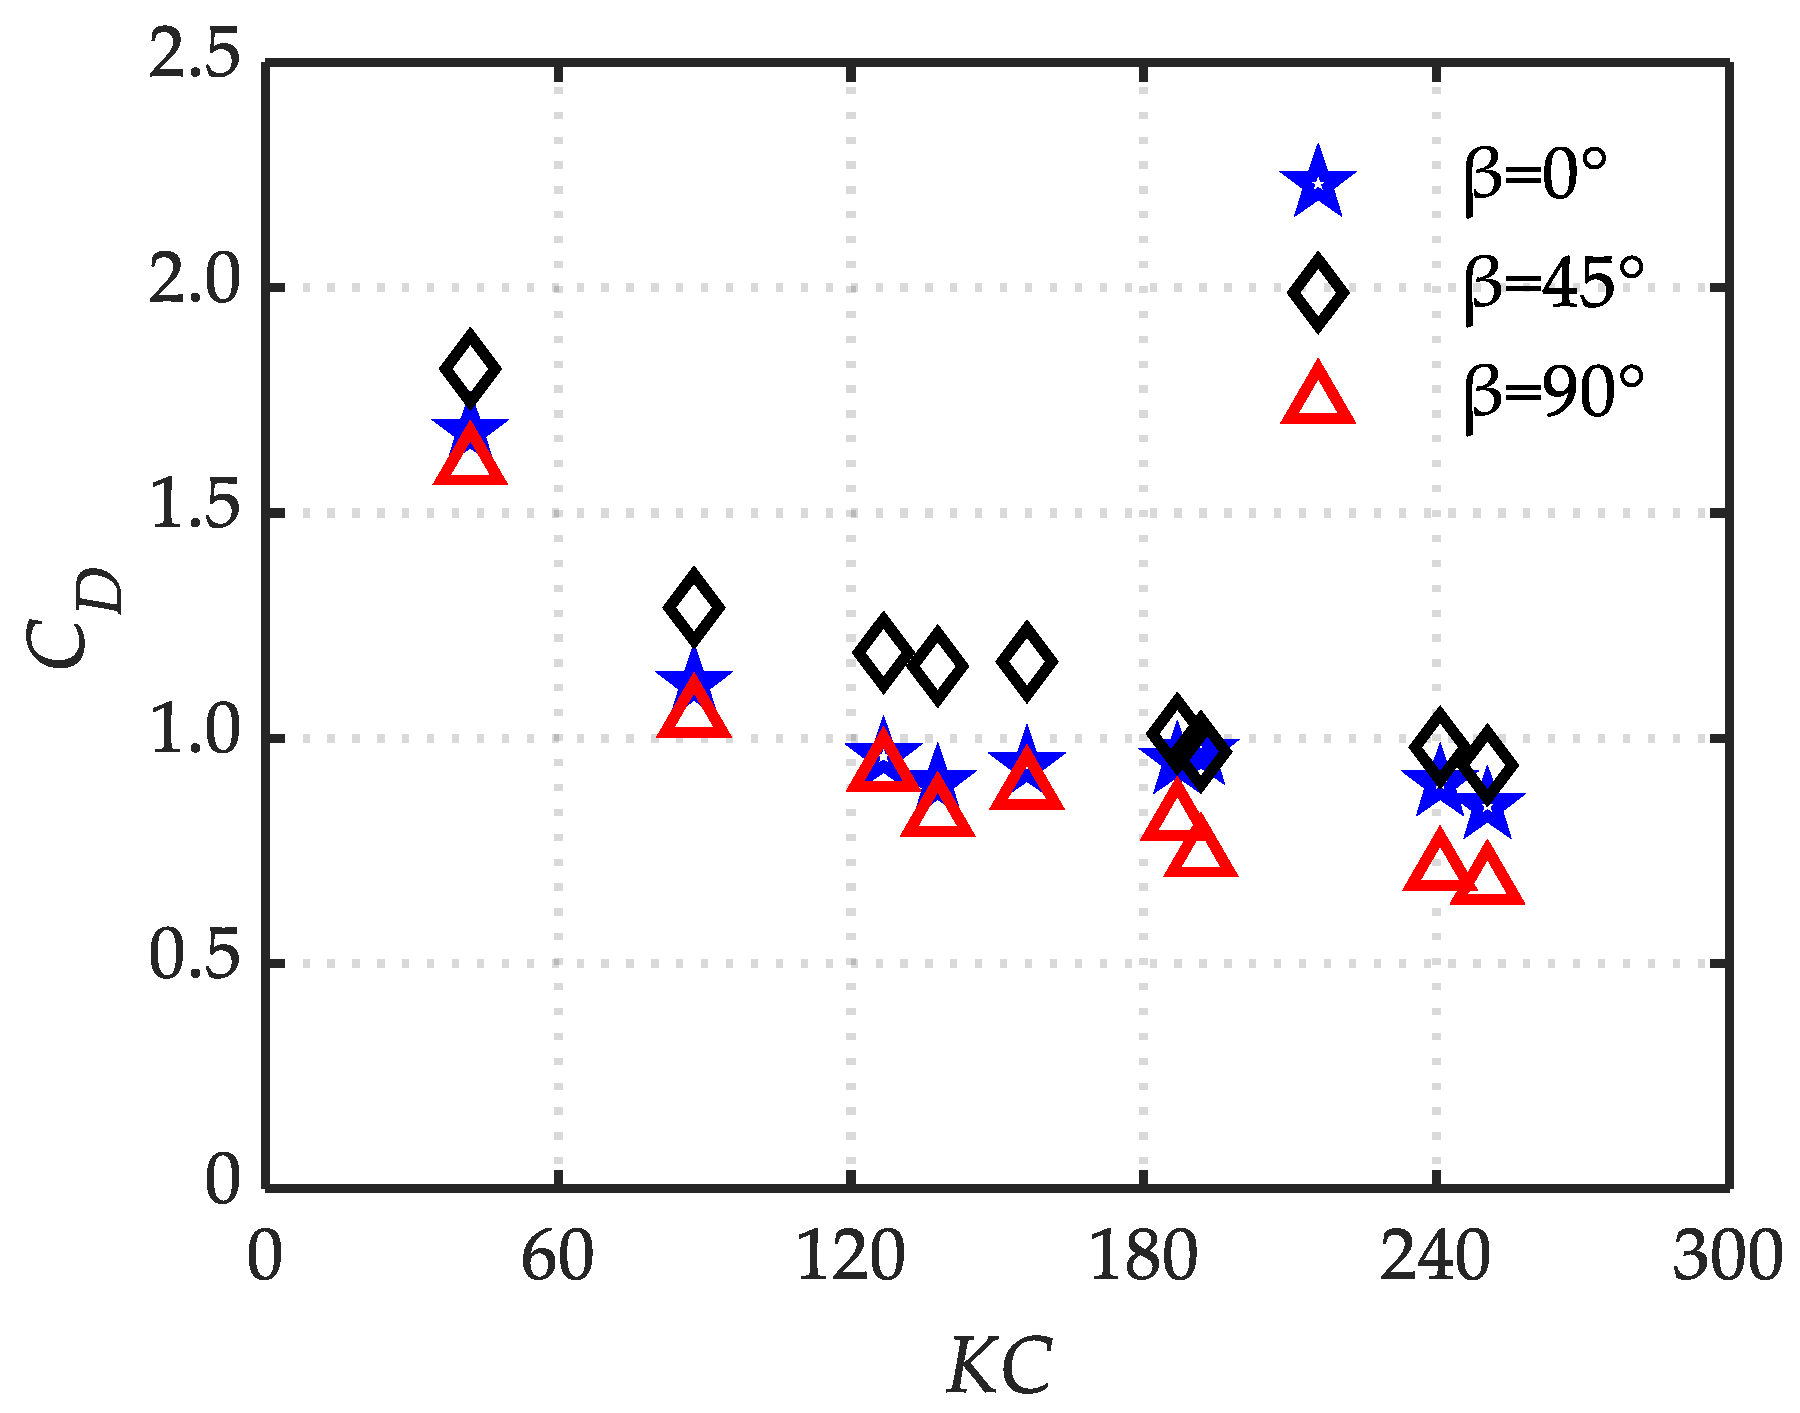
3.2. Hydrodynamic Coefficients of Various Models in Waves

The effects of the KC number (KC = UmaxT/D; Umax: The maximum velocity of the wave; D: The maximum diameter of the jacket member) and the incident angle on the hydrodynamic coefficients of the two models in the wave are shown in this section. For the two models in each wave condition, we calculated the drag coefficient CD and the inertia coefficient CM by Equation (7) with the least square method using fifth order Stokes wave.
The variation of the jacket hydrodynamic coefficients with the KC number in waves is shown in Figure 10. The results indicate that the drag coefficient CD decreased gradually with the increase in KC number, and the step diameter was decreased as the KC number increased; CD got the maximum value in oblique wave (β = 45°), and the minimum value in lateral wave (β = 90°). The effect of KC number on CM was insignificant for the jacket, but the effect of wave incident angle was distinct; CM got the maximum value in forward wave (β = 0°), and the minimum value in lateral wave (β = 90°). For M2, it was considered that the jacket and the netting were two independent parts; that is, the horizontal wave force of the netting can be obtained by the force of M2 minus the force of M1, and the composition of the horizontal wave force of the netting was based on the study of Zhao et al. [24], whom conducted wave tests on a variety of densities of netting, and concluded that the value of the inertial force of the netting was much smaller than the value of the wave force it received, can be ignored. Therefore, it was considered that the horizontal wave force of the netting can be expressed by only the drag force. The variation of the netting drag coefficient CD with the KC number in waves is shown in Figure 11, which had consistent regularity compared with CD of jacket.

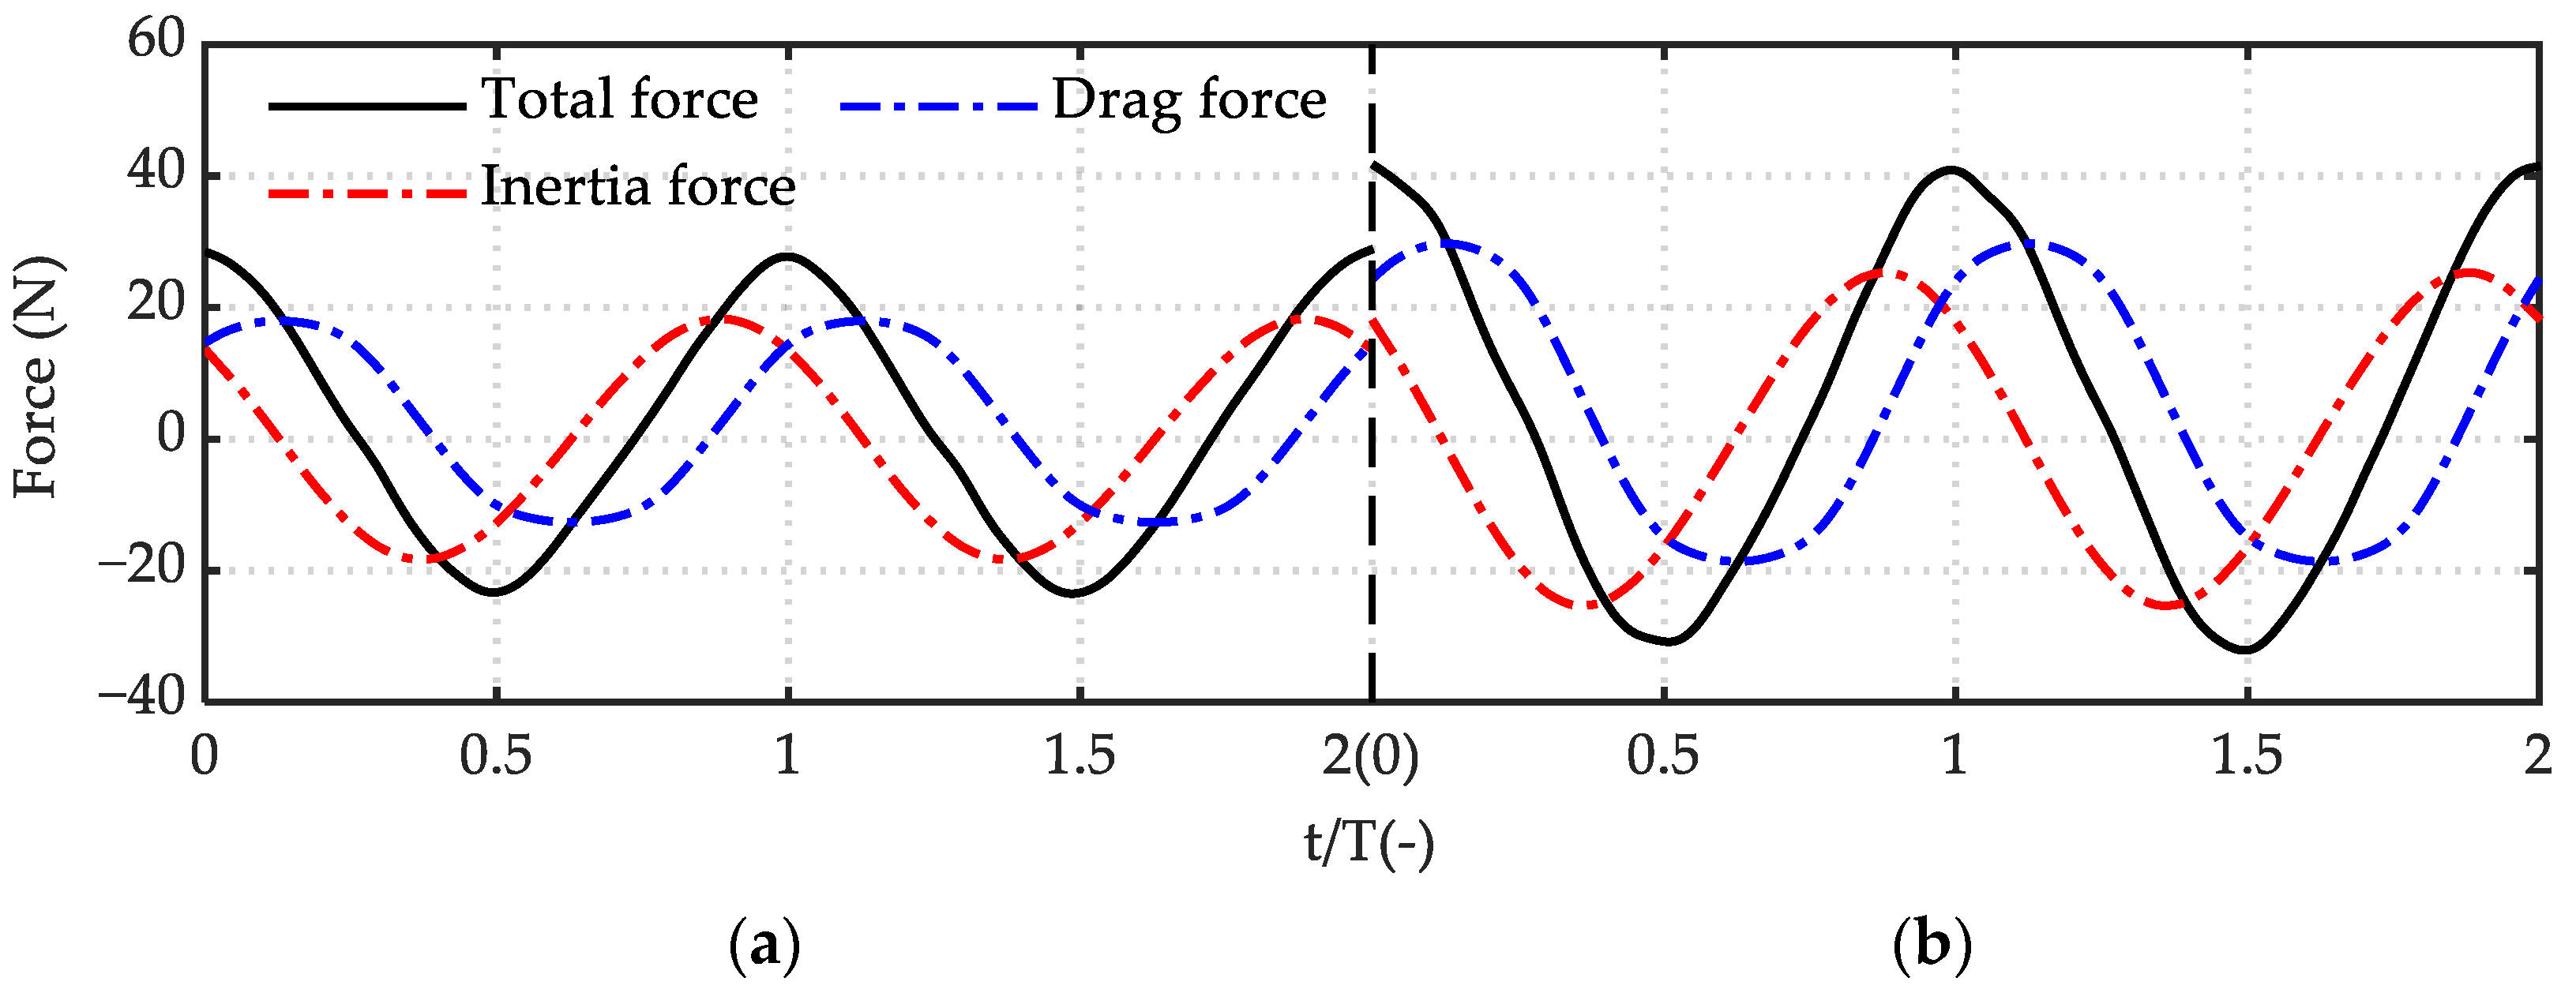
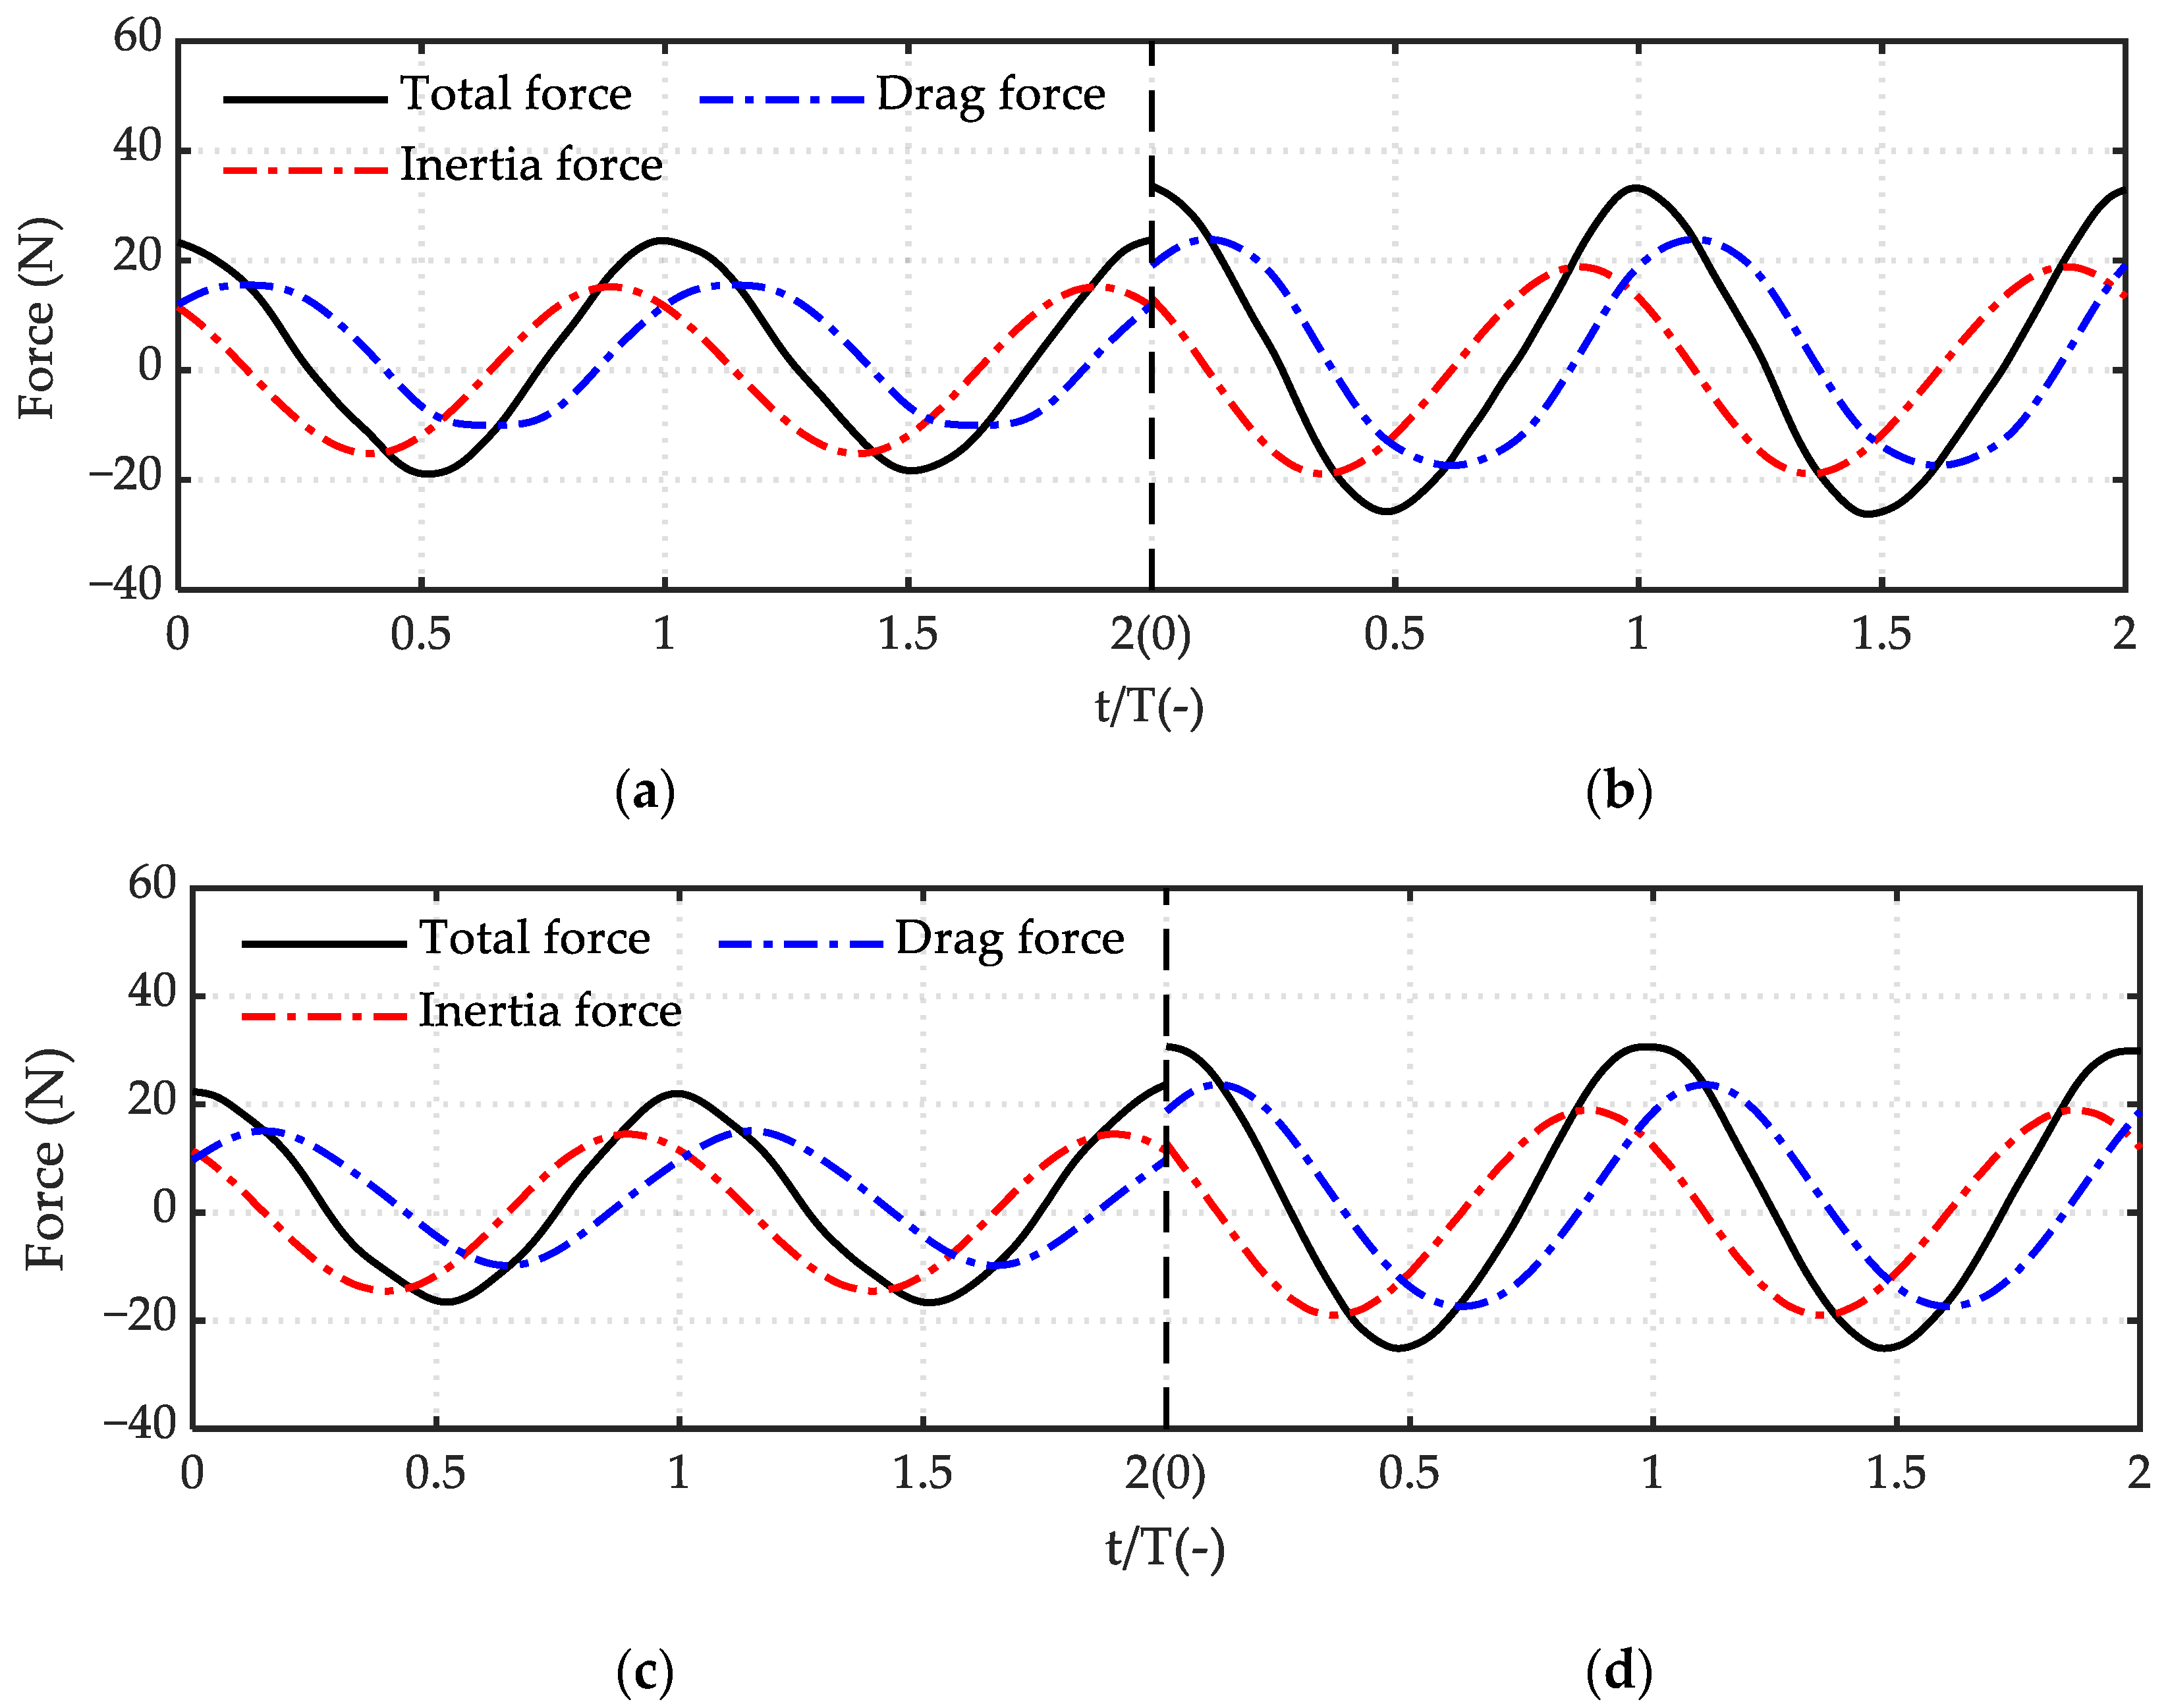
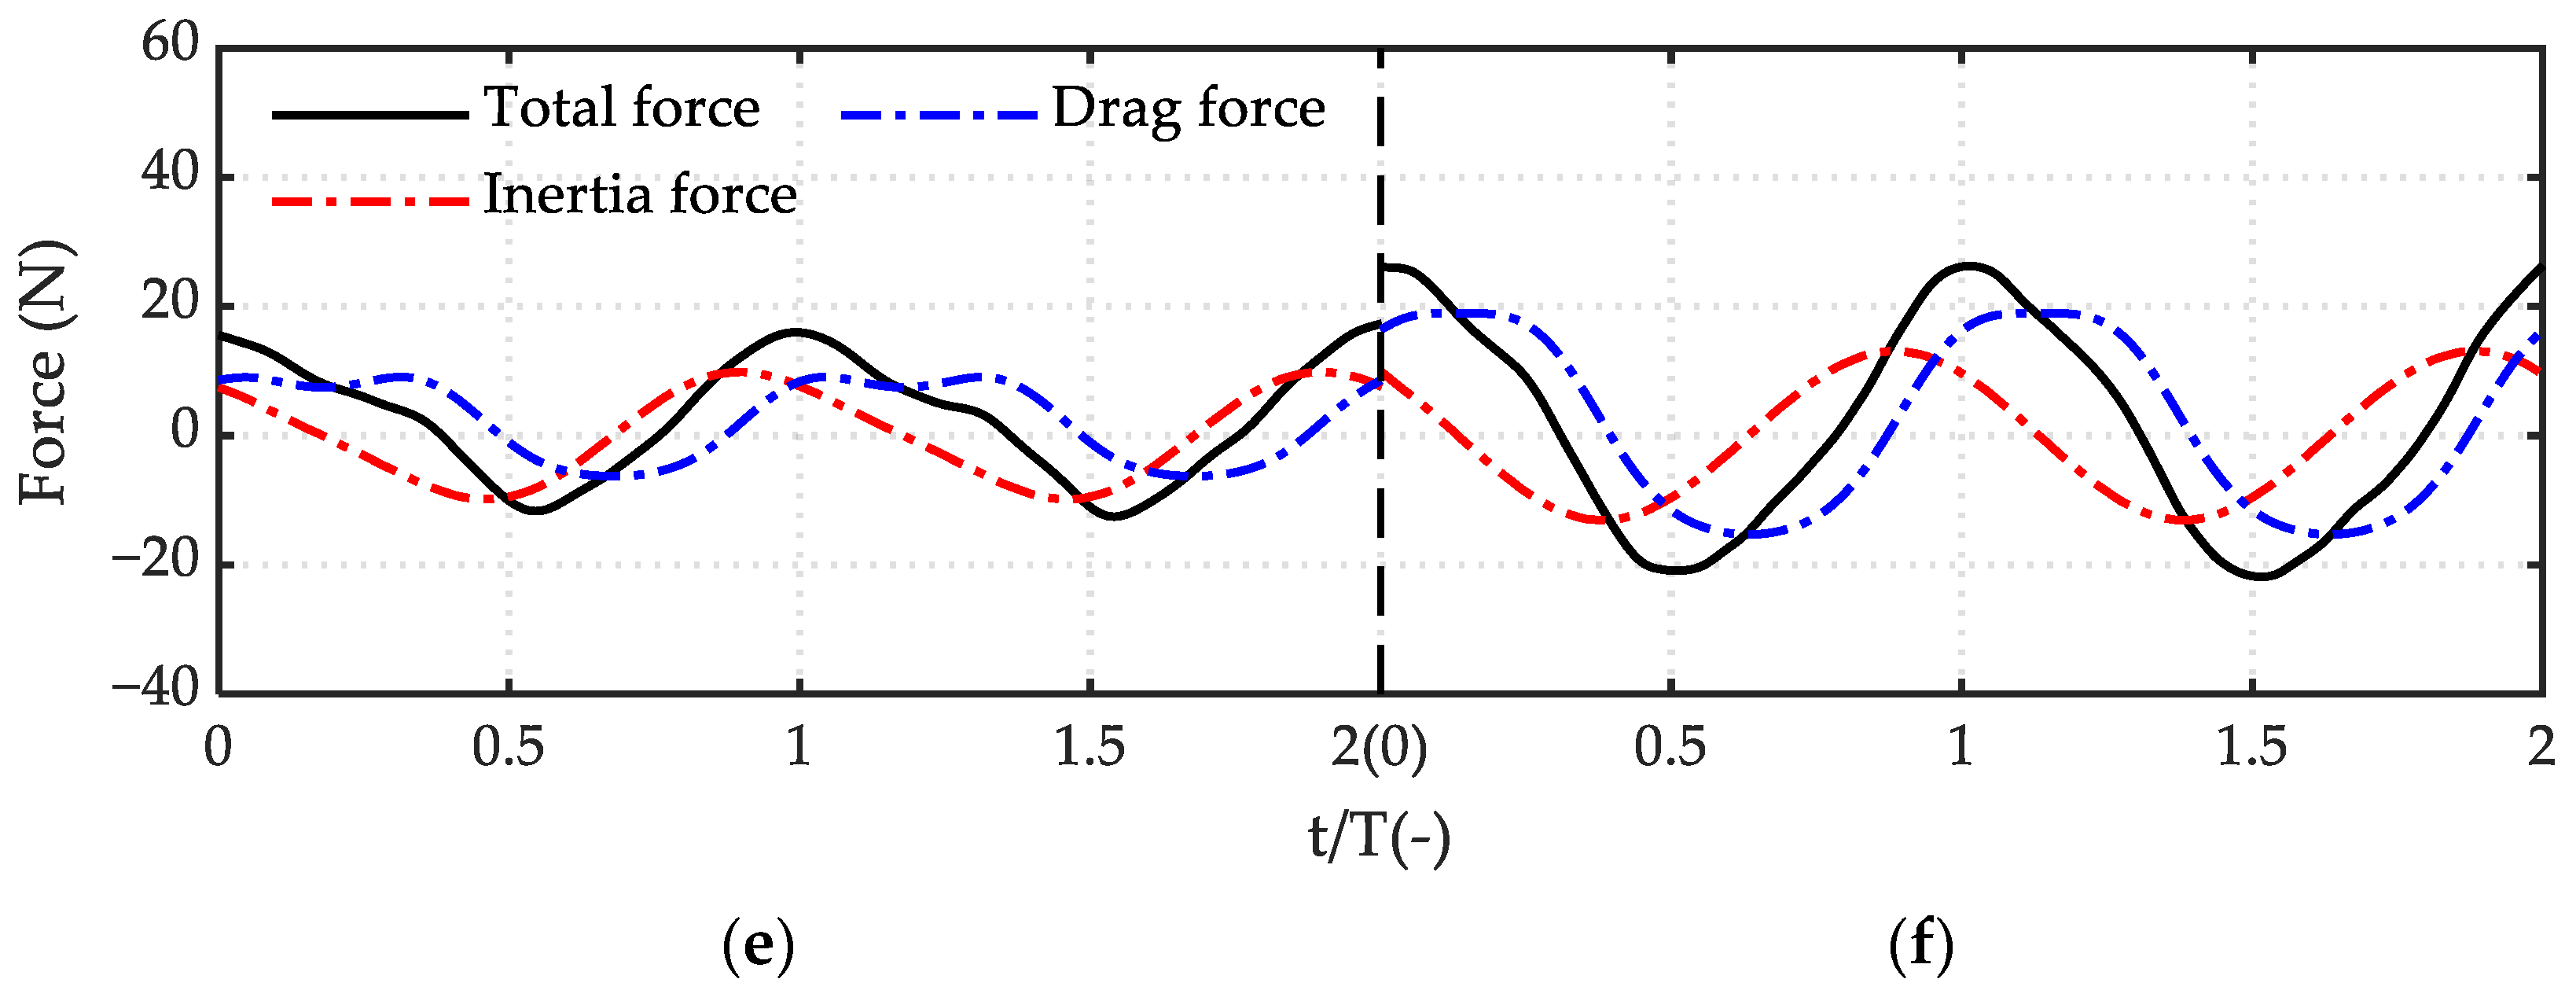
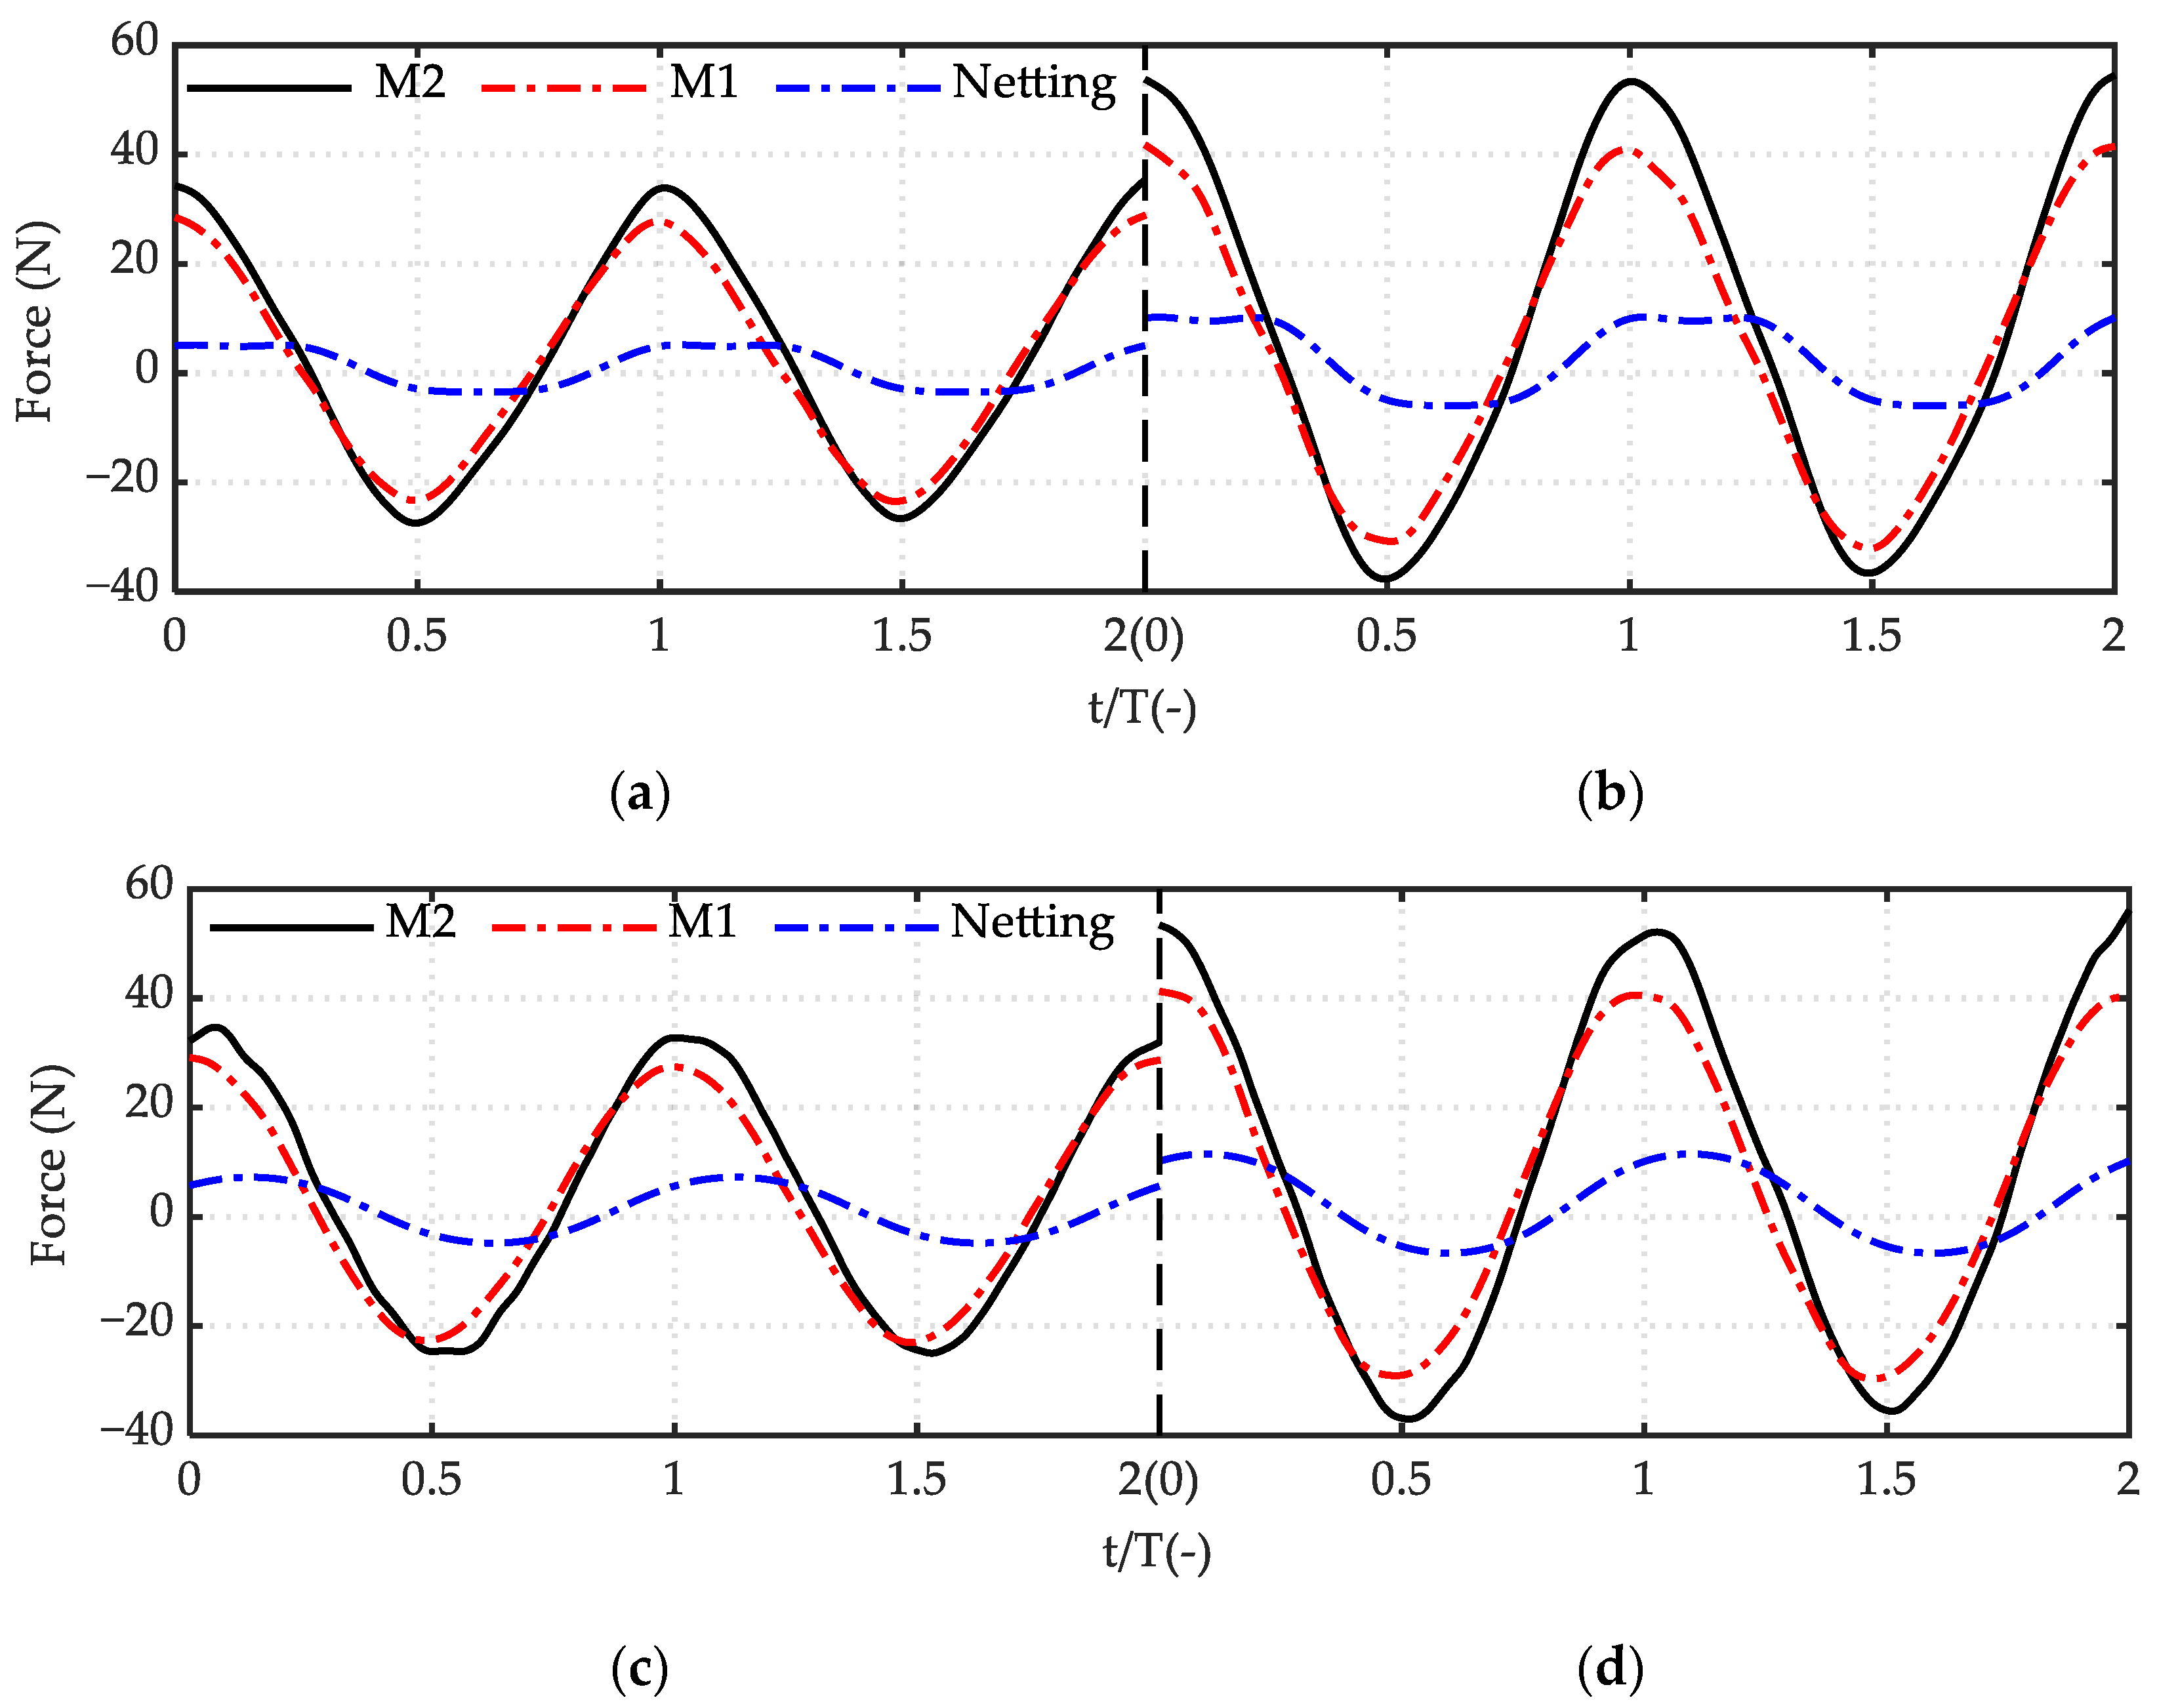
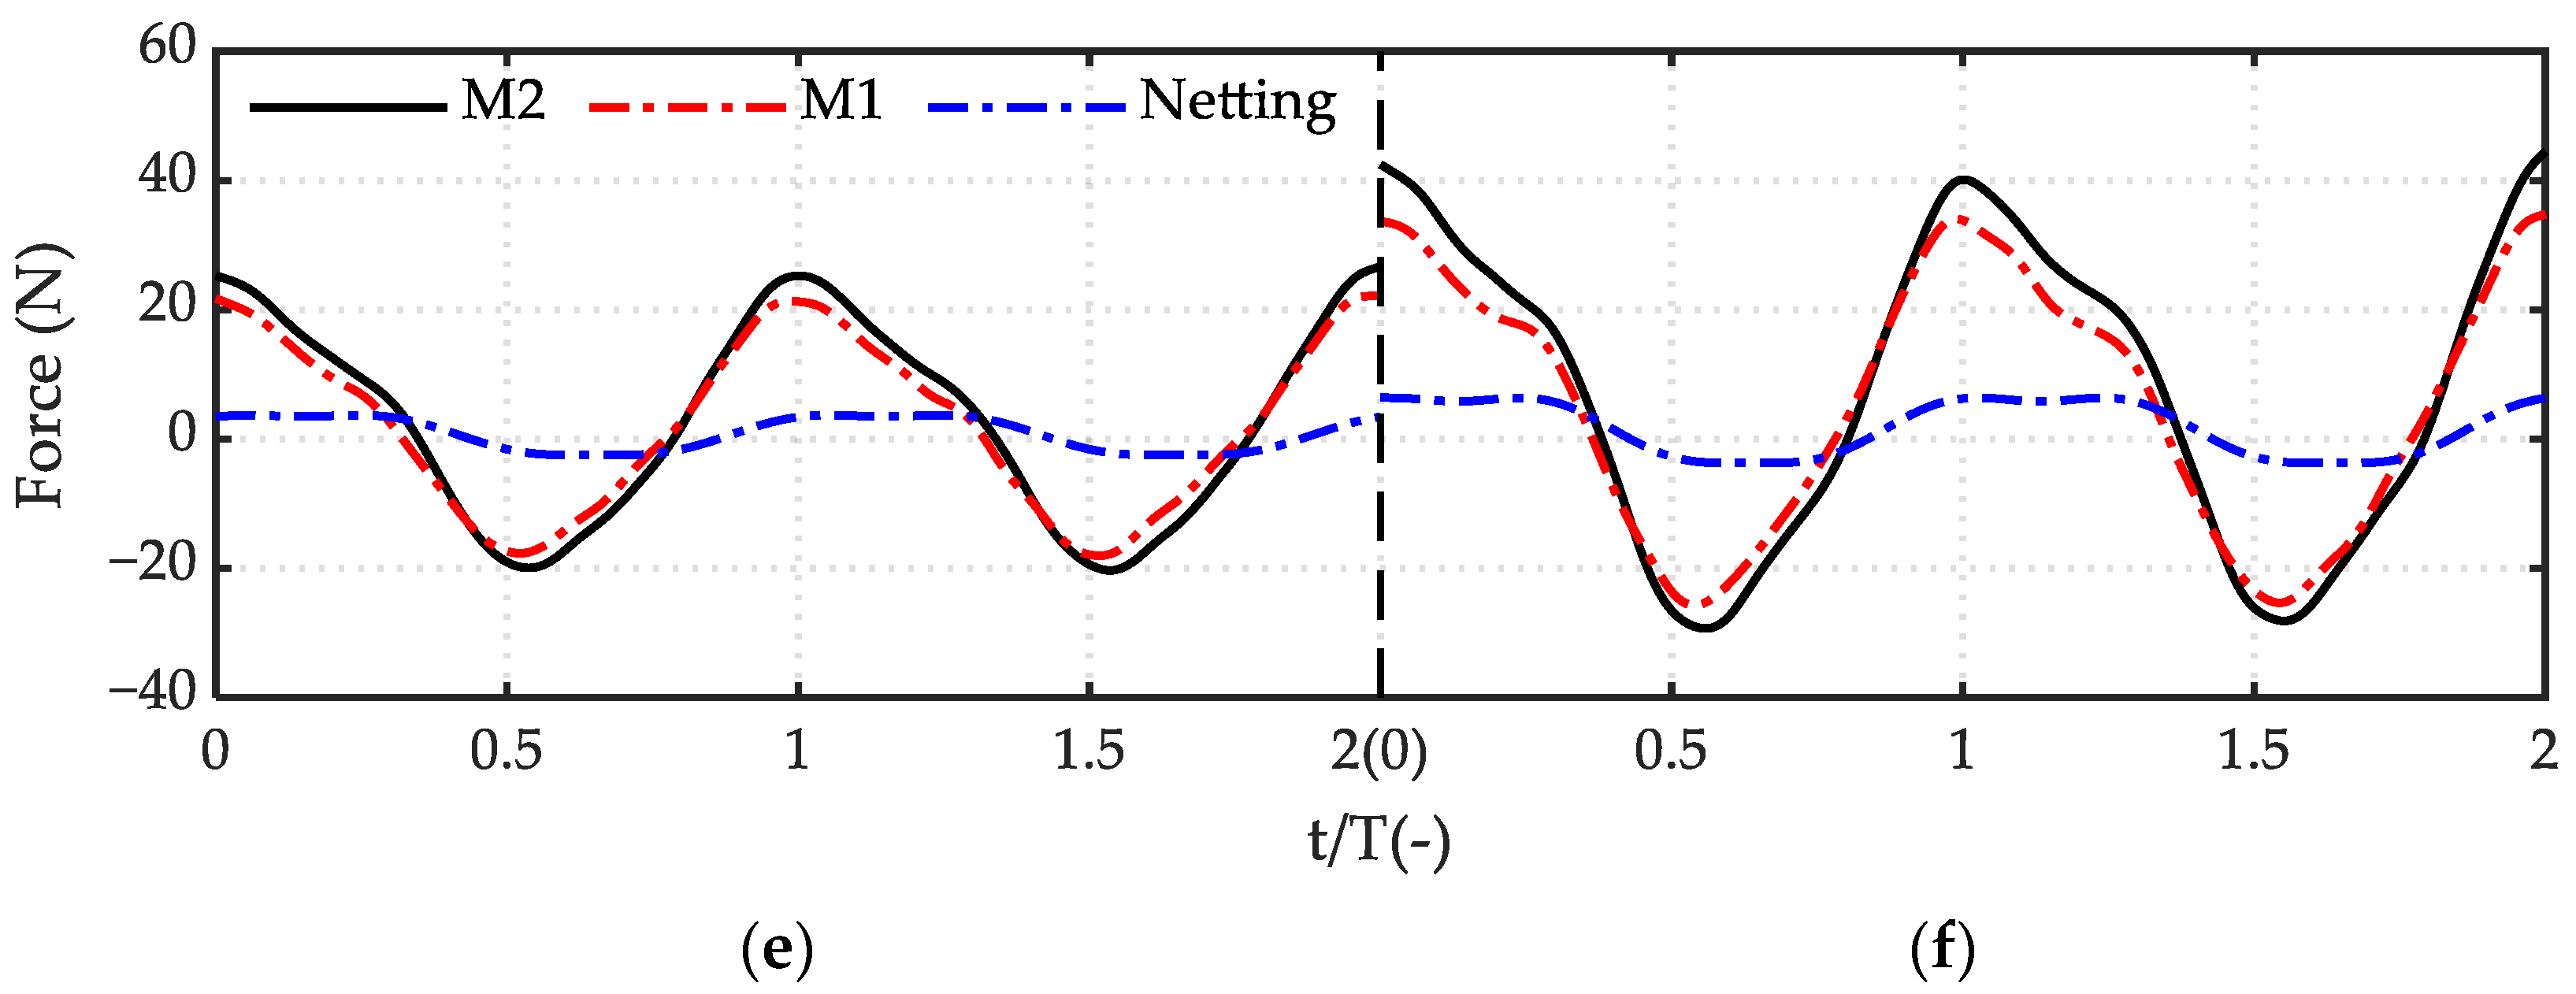
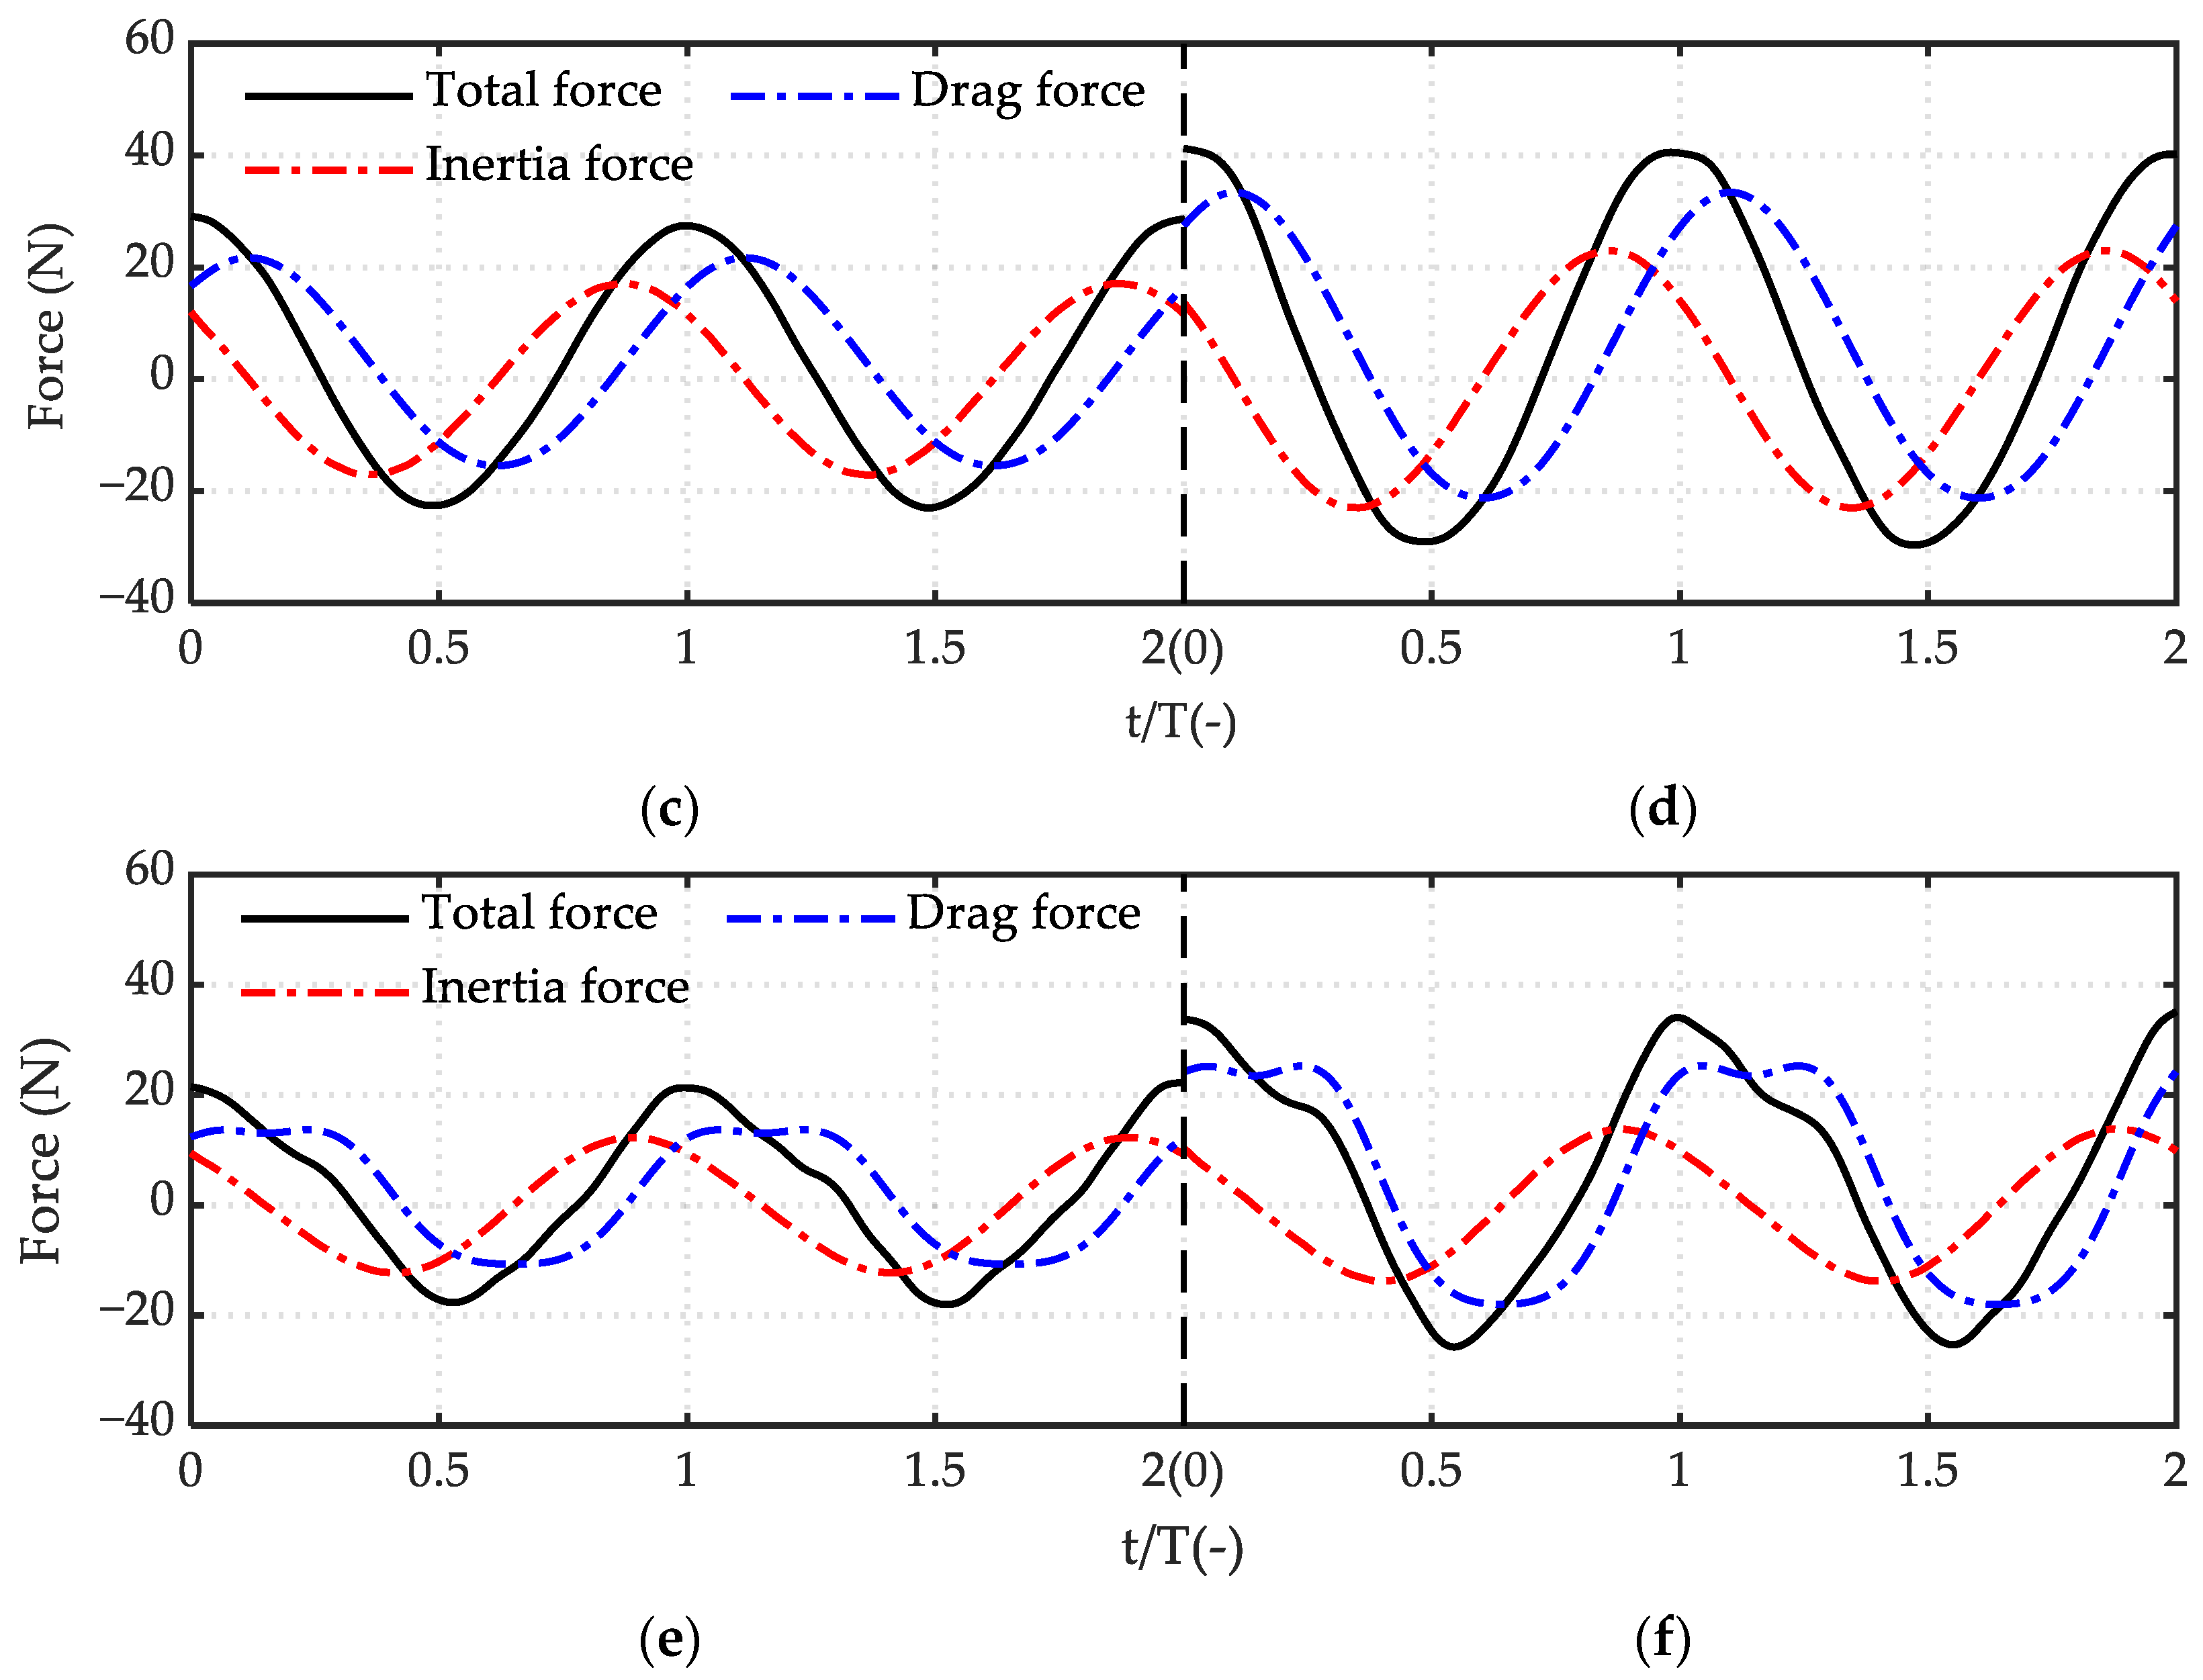
3.3. Components of Horizontal Force in Waves

3.3.1. Components of Horizontal Force of the Jacket Structure

For M1, in order to deeply study the horizontal force variation caused by the change of wave height, period, and incident angle, the horizontal force of the test was decomposed into the drag force and the inertial force according to the Morison equation, as shown in Figure 12 and Figure 13.
The results indicate that there was a peak phase difference between the drag force and the inertial force that make up the wave force, and the peak phase of the inertial force was before the total force, while the peak phase of the drag force was after the total force, which were determined by Equations (2) and (3). Comparing the peak and valley values of the inertial force and the drag force, it can be found that the peak and valley values of the inertial force are equal, while the peak value of the drag force is significantly larger than the valley value. When the period was constant (T = 1.6 s) and the wave heights were large, the inertial force and the drag force increased with the increment of the wave height in different incident angles. Similarly, when the wave height was constant (H = 0.15 m) and the periods were large, the inertial force and the drag force increased with increasing period in different incident angles. In addition, the proportion of the drag force in the total force increased with the increment of the wave height and period, which was considered to be caused by the drag force being proportional to the square of the water point speed.

3.3.2. Components of Horizontal Force of the Fish Cage Structure

Considering that the wave force of M2 was composed of the wave force of M1 and the netting, respectively, in order to explore the influence of the netting on M2, time histories of the wave force on M1, M2, and netting are shown in the Figure 14 and Figure 15. Figure 14 is for the fixed period (T = 1.6 s), while Figure 15 is for the fixed wave height (H = 0.15 m). The wave force of M1 and M2 are taken from the test data, and the wave force of netting, considering only the drag force, taken from the numerical calculation data.
It can be seen from the Figure 14 and Figure 15 that the peak phase of the drag force of the netting is behind the peak phase of the wave force of M2, which is consistent with the law of the peak phase of the drag force of M1. When the period was constant (T = 1.6 s) and the wave height was large, the drag force of the netting increased with the increase of the wave height; similarly, when the wave height was constant (H = 0.15 m) and the period was large, the drag force of the netting increased with the increment of the period.

4. Discussion

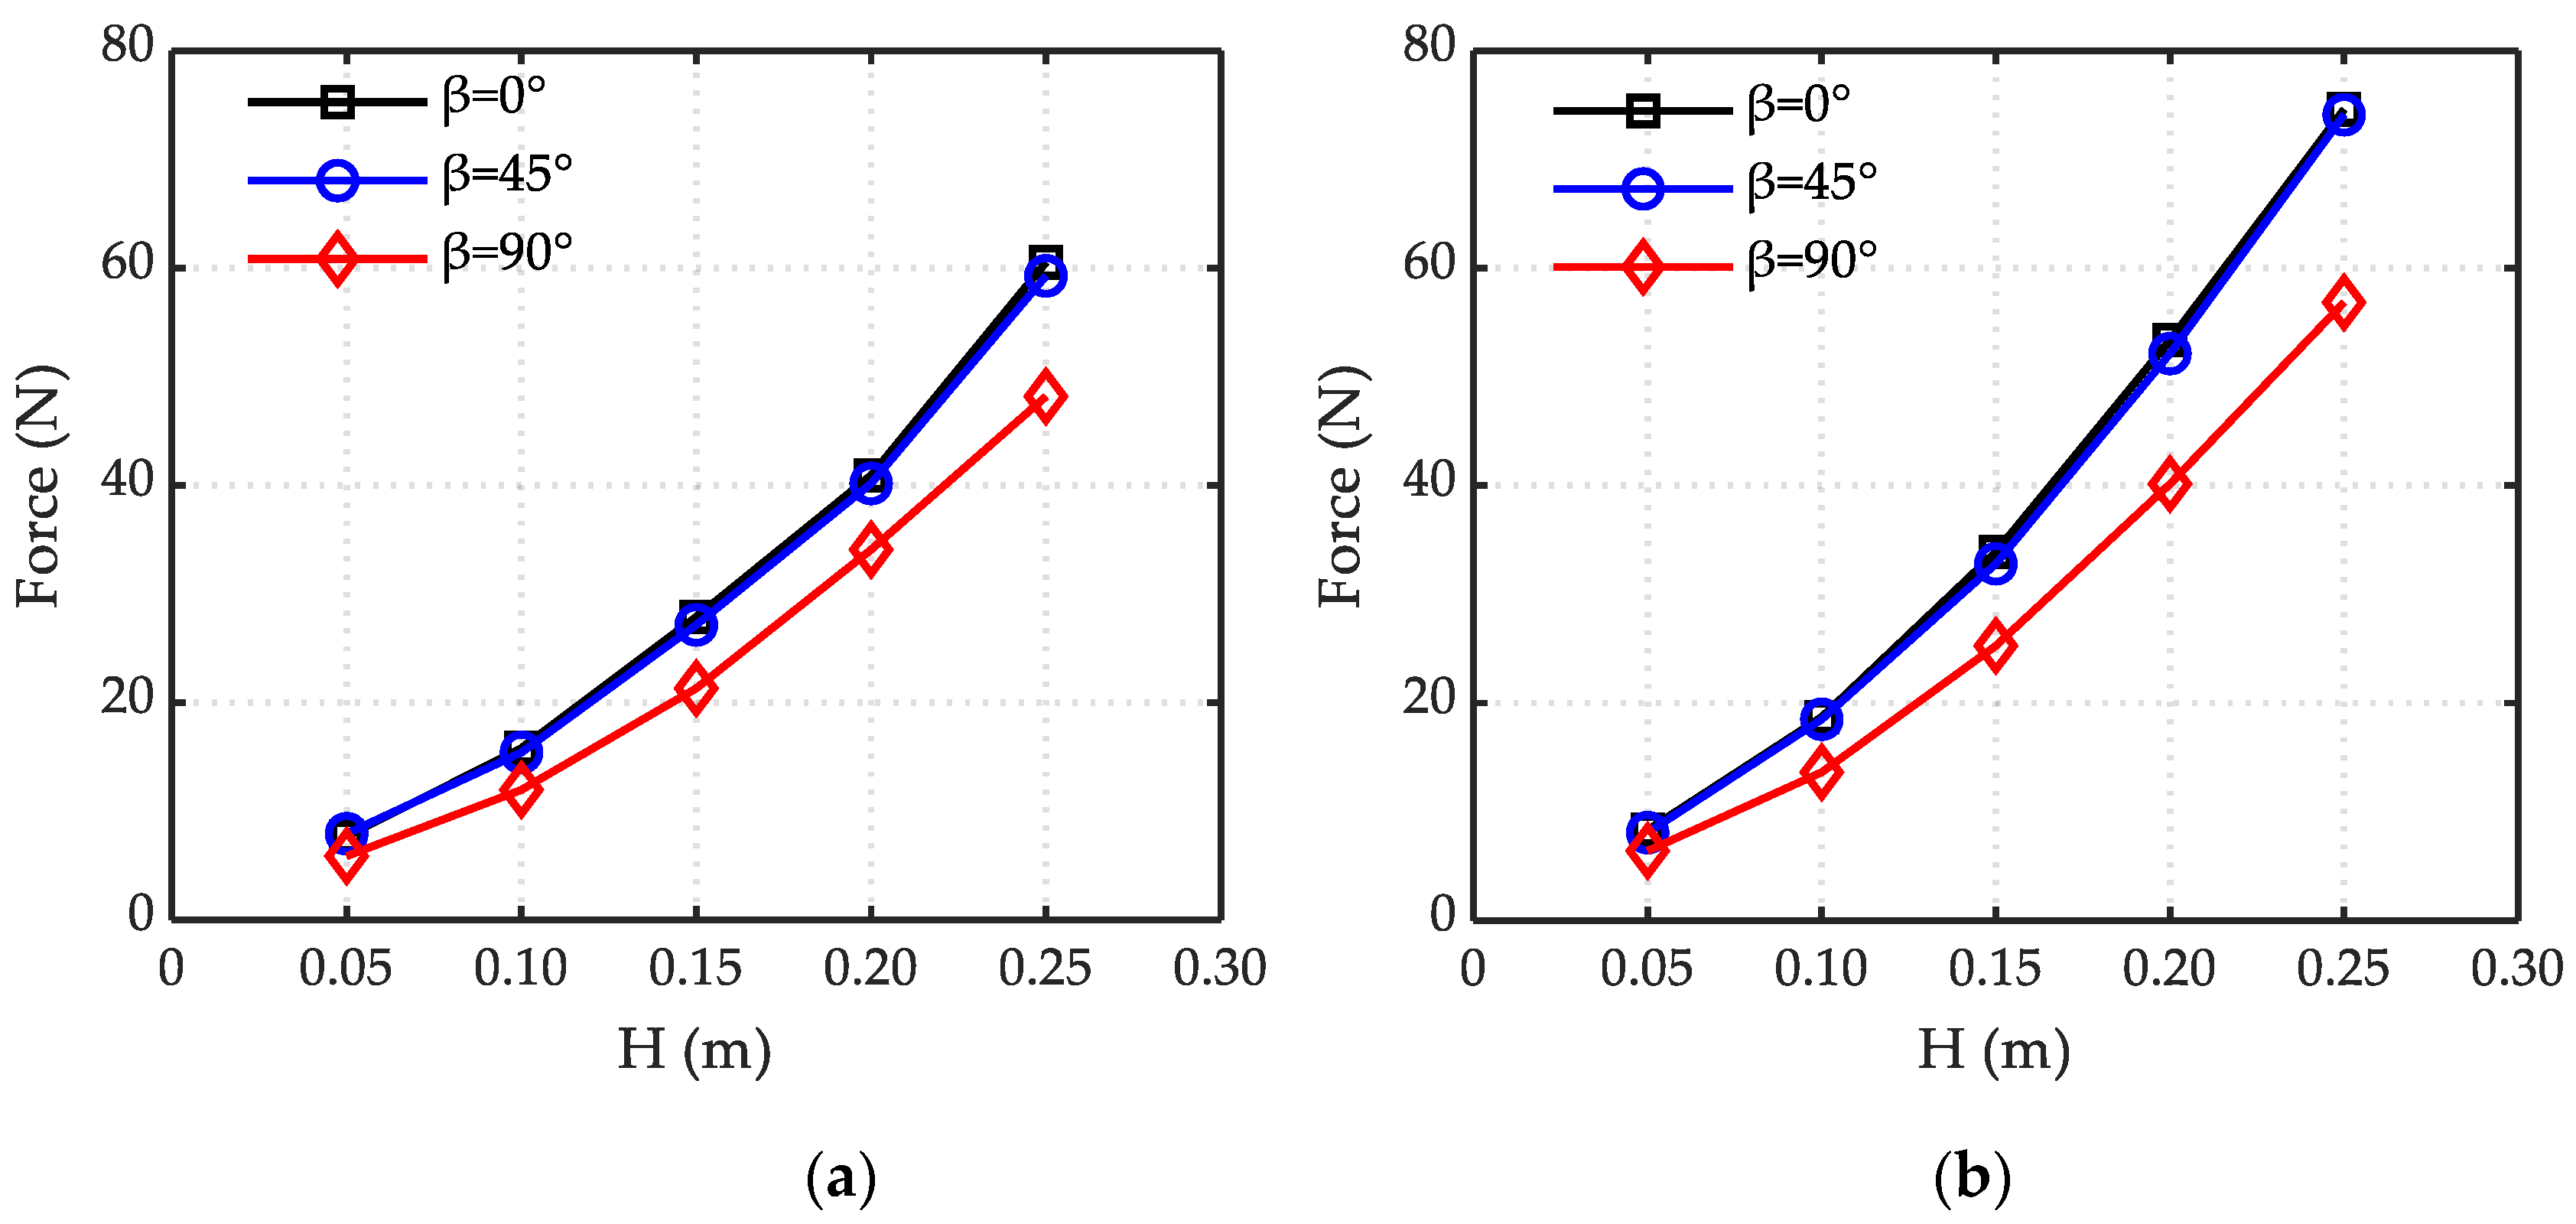
4.1. The Effect of Incident Angles on Wave Force

The influence of different incident angles on the structural stress were shown in Figure 16 and Figure 17. The force of the jacket and column-stabilized fish cage was basically the same in forward and oblique waves (see Figure 16), while the horizontal wave force under the lateral wave was smaller. It was worth noting that the force were slightly bigger in the positive low-frequency wave (see Figure 17). In the lateral wave, the structural members were densely distributed along the wave propagation direction, resulting in an obvious shielding effect between the members. Although the total upstream area was large, due to the severe shielding of the members on the meeting-wave side, the force of the subsequent members was significantly reduced, which also directly led to the reduction of the total wave force of the structure, which was consistent with the law of hydrodynamic coefficients reflected in Figure 10 and Figure 11.
In Figure 17, the short-period wave force on both M1 and M2 were obviously abnormal under the action of the lateral wave. Since the fundamental frequency of the structure was much larger than the frequency of the test wave condition, the abnormal wave force here almost excluded the possibility of structural resonance. Considering this direction, there was a gap with a large span in the middle of the structure, and the modal components were symmetrically distributed in a small area on both sides. Analyzing on the wave phase corresponding to the maximum wave force of the structure, when the wavelength was slightly larger than the lateral span of the structure (C3-1), the wave trough acted on the gap, which caused a large value of the wave force; and when the wavelength continued to increase (C3 -2), the wave trough moved away from the gap and inevitably acted on one side of the jacket to reduce the wave force. Thereafter, as the wavelength continued to increase, the wave trough gradually left the structure, causing the wave force to increase, and when the effect of the wave trough was gradually reduced, the increased amplitude of wave force also slowed down. While the structure had no gaps in the direction of forward and oblique wave propagation, the effect of the trough under the short period was obvious, and the structural stress was small.

4.2. The Effect of Incident Angles on Hydrodynamic Coefficients

Since the jacket model in this experiment was a large space frame structure, the density of the model component was significantly different in any wave propagation direction, which seriously affected the drag coefficient and inertial coefficient in all directions. It can be seen from Figure 10 that the drag coefficient CD and the inertial coefficient CM showed obvious differences at different incident angels: CD got the maximum value in the oblique wave, while got the minimum value in the lateral wave; CM got the maximum value in the forward wave, while got the minimum value in the lateral wave.
For M1, the drag force, inertial force, and horizontal total force calculated by the numerical model are shown in Figure 18 and Figure 19. When the wave length was long enough, the wave force got the maximal value in the lateral wave; we thought that there was a larger flow area along the incident direction of the lateral wave. Considering that most of the members were symmetrically distributed on both sides of the gap, the shielding effect of the front members was obvious and the structural force was reduced, so the drag coefficient and the inertial coefficient were small (see Figure 10). For M2, the wave force of the netting was obviously affected by the jacket, so the drag coefficient of the netting was basically kept consistent with the drag coefficient of M1.

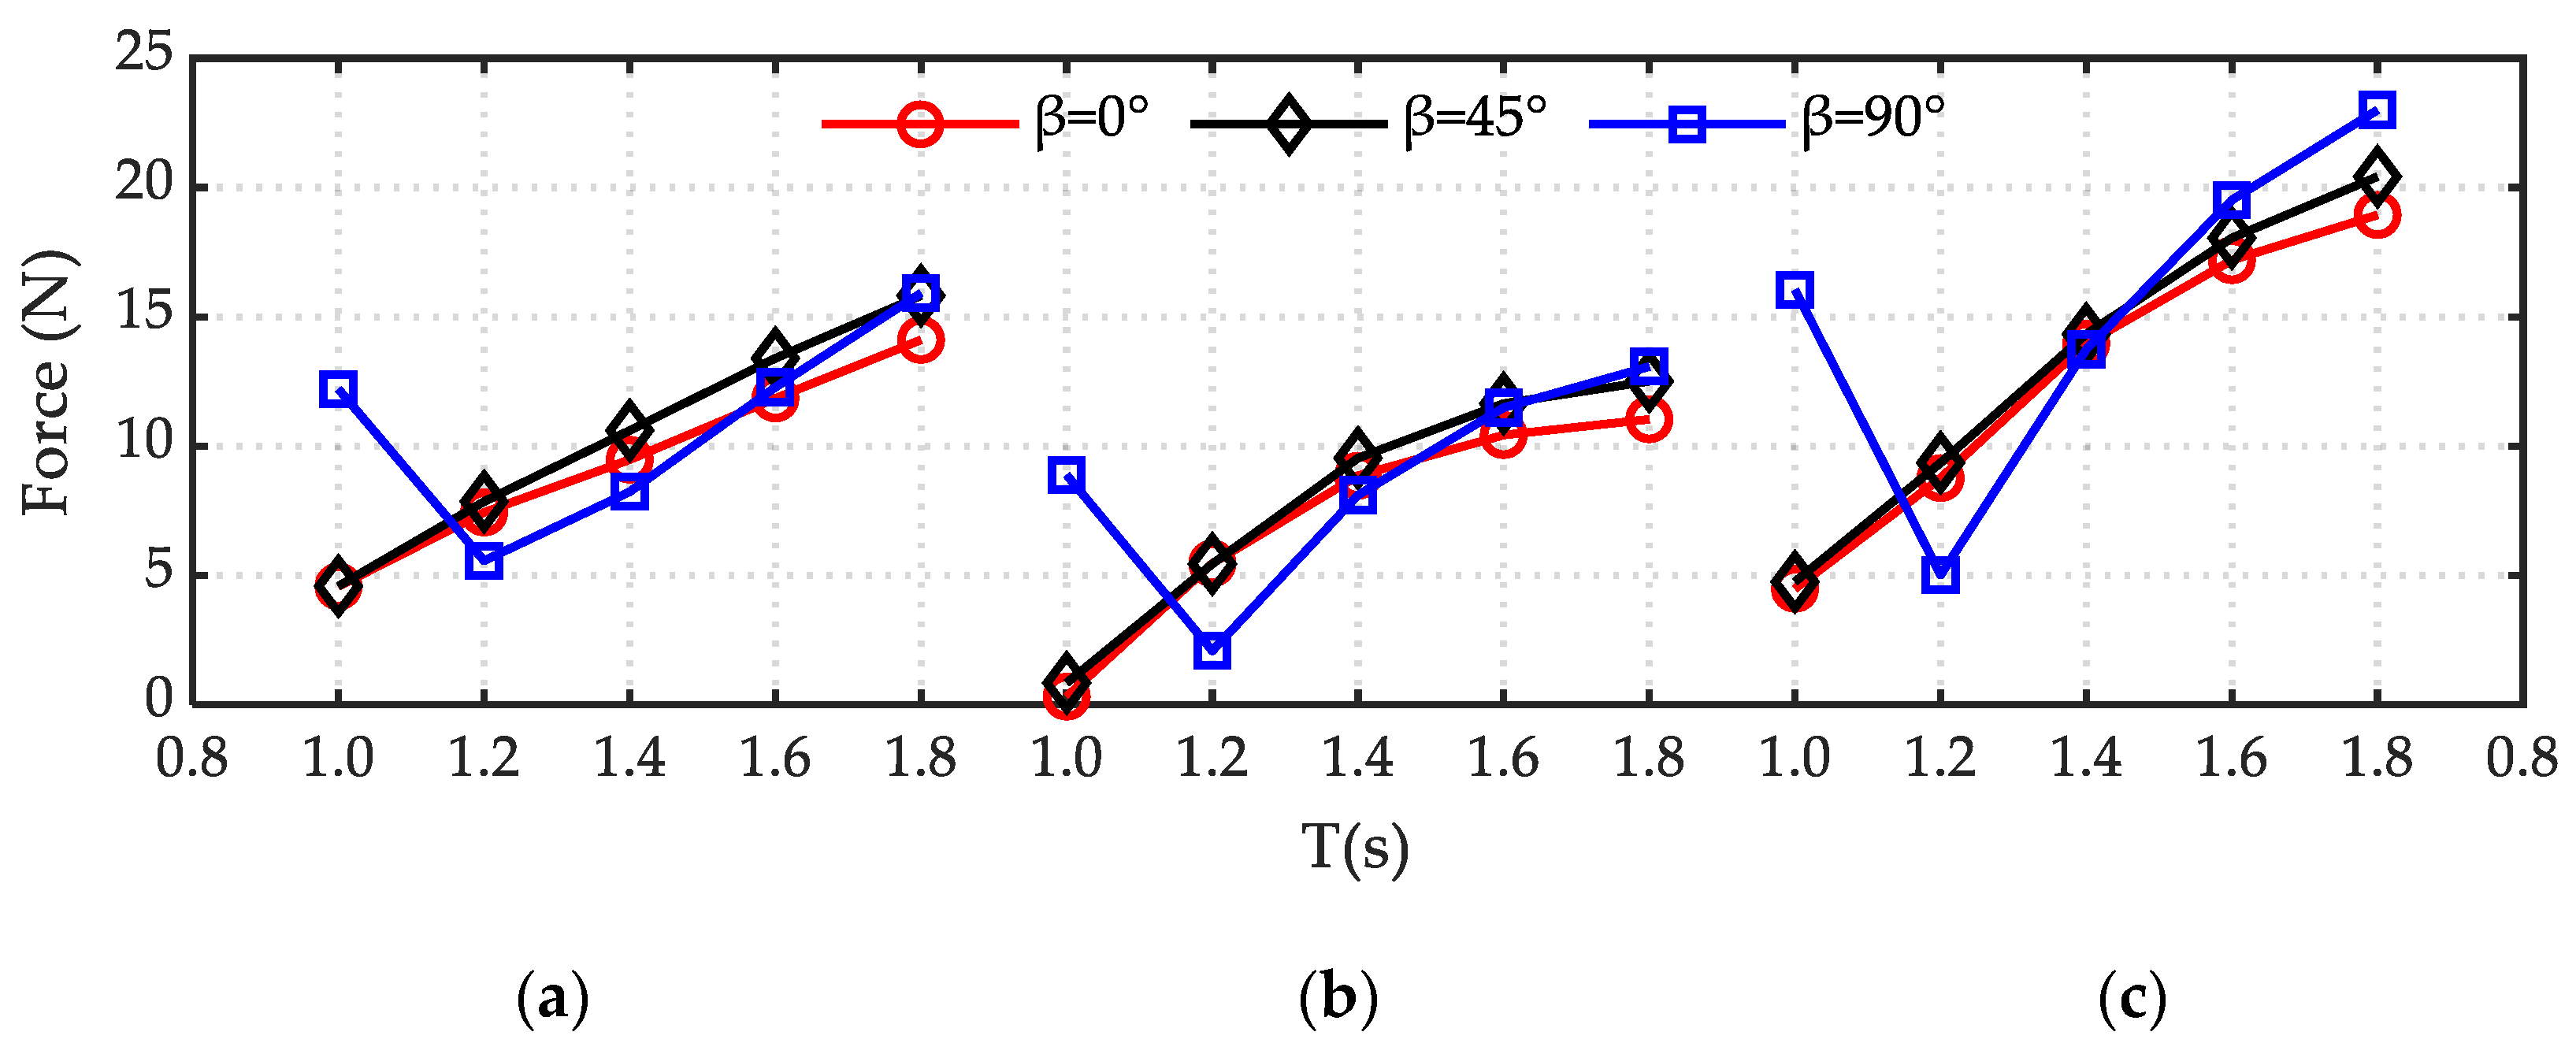
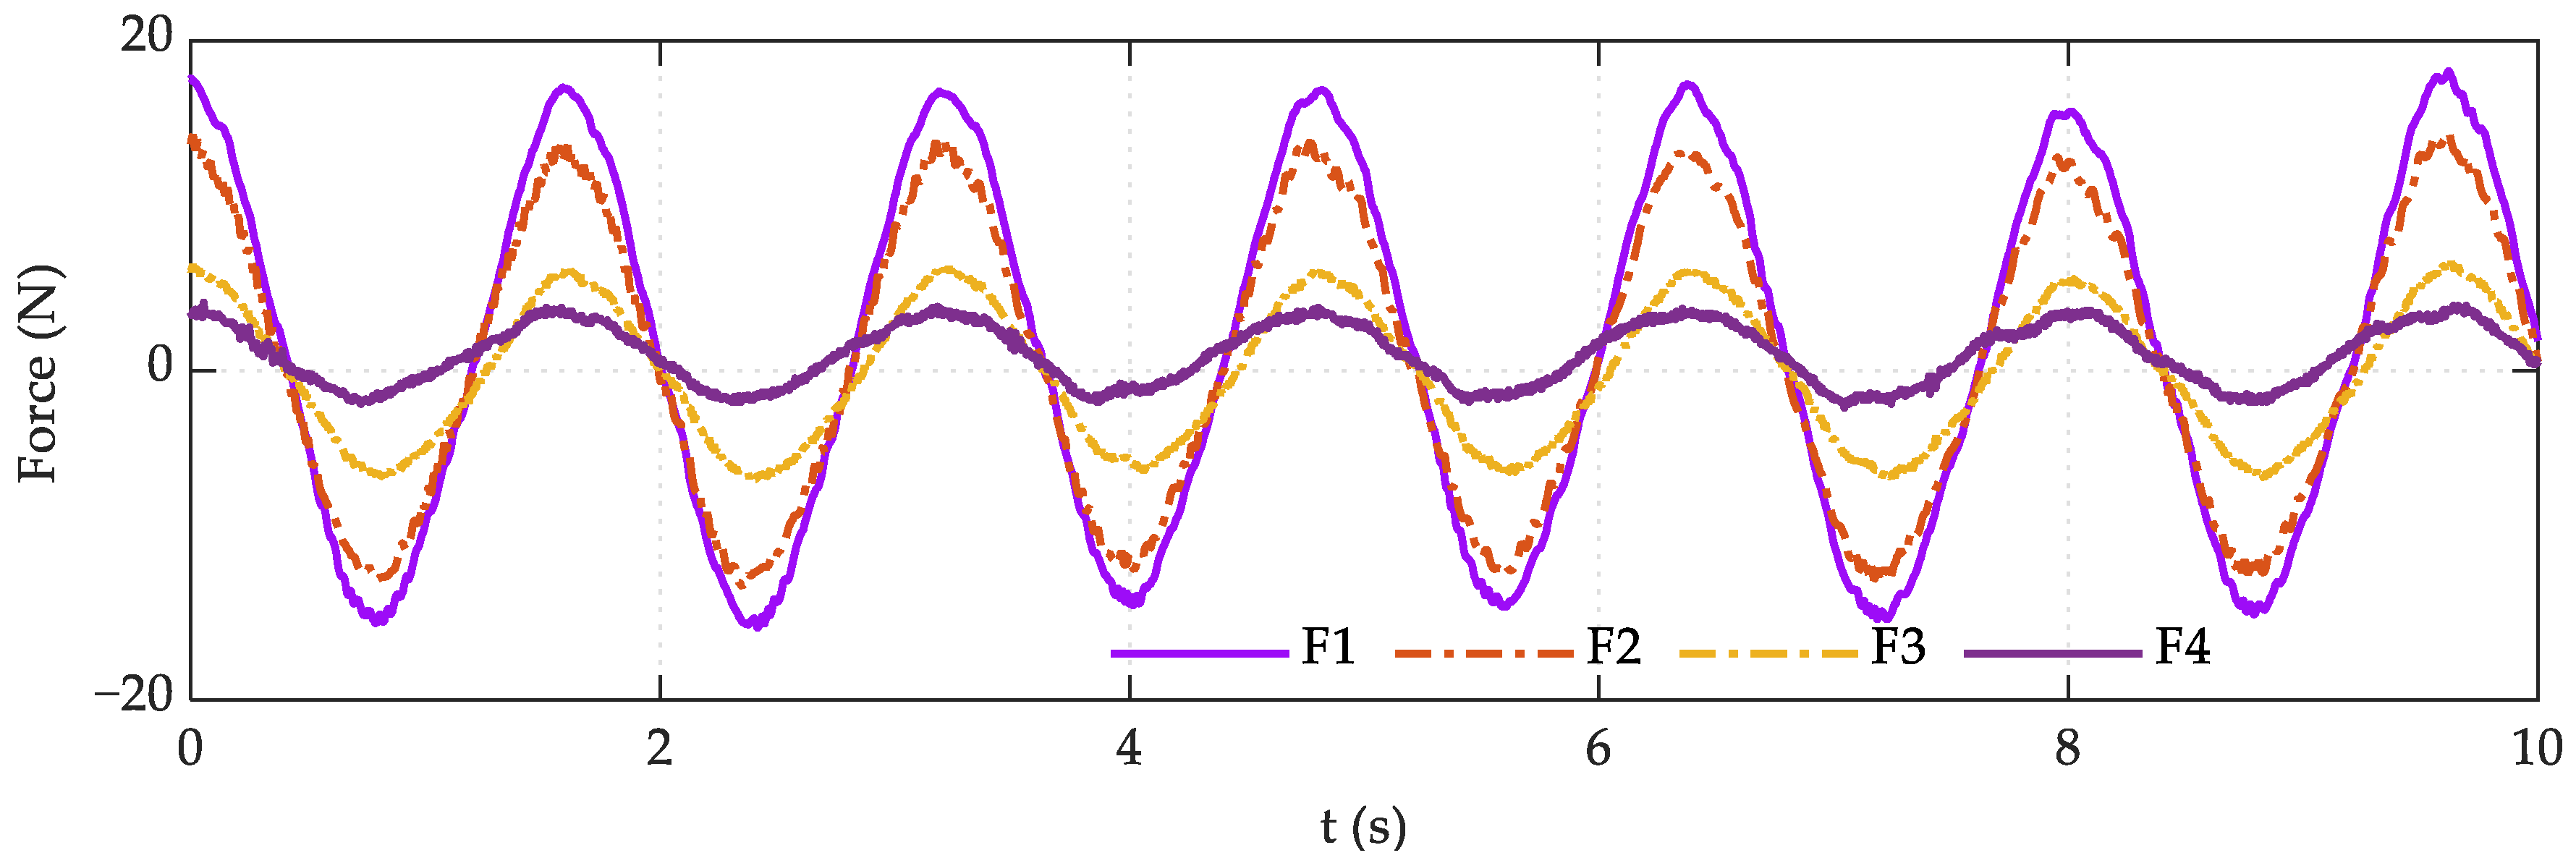
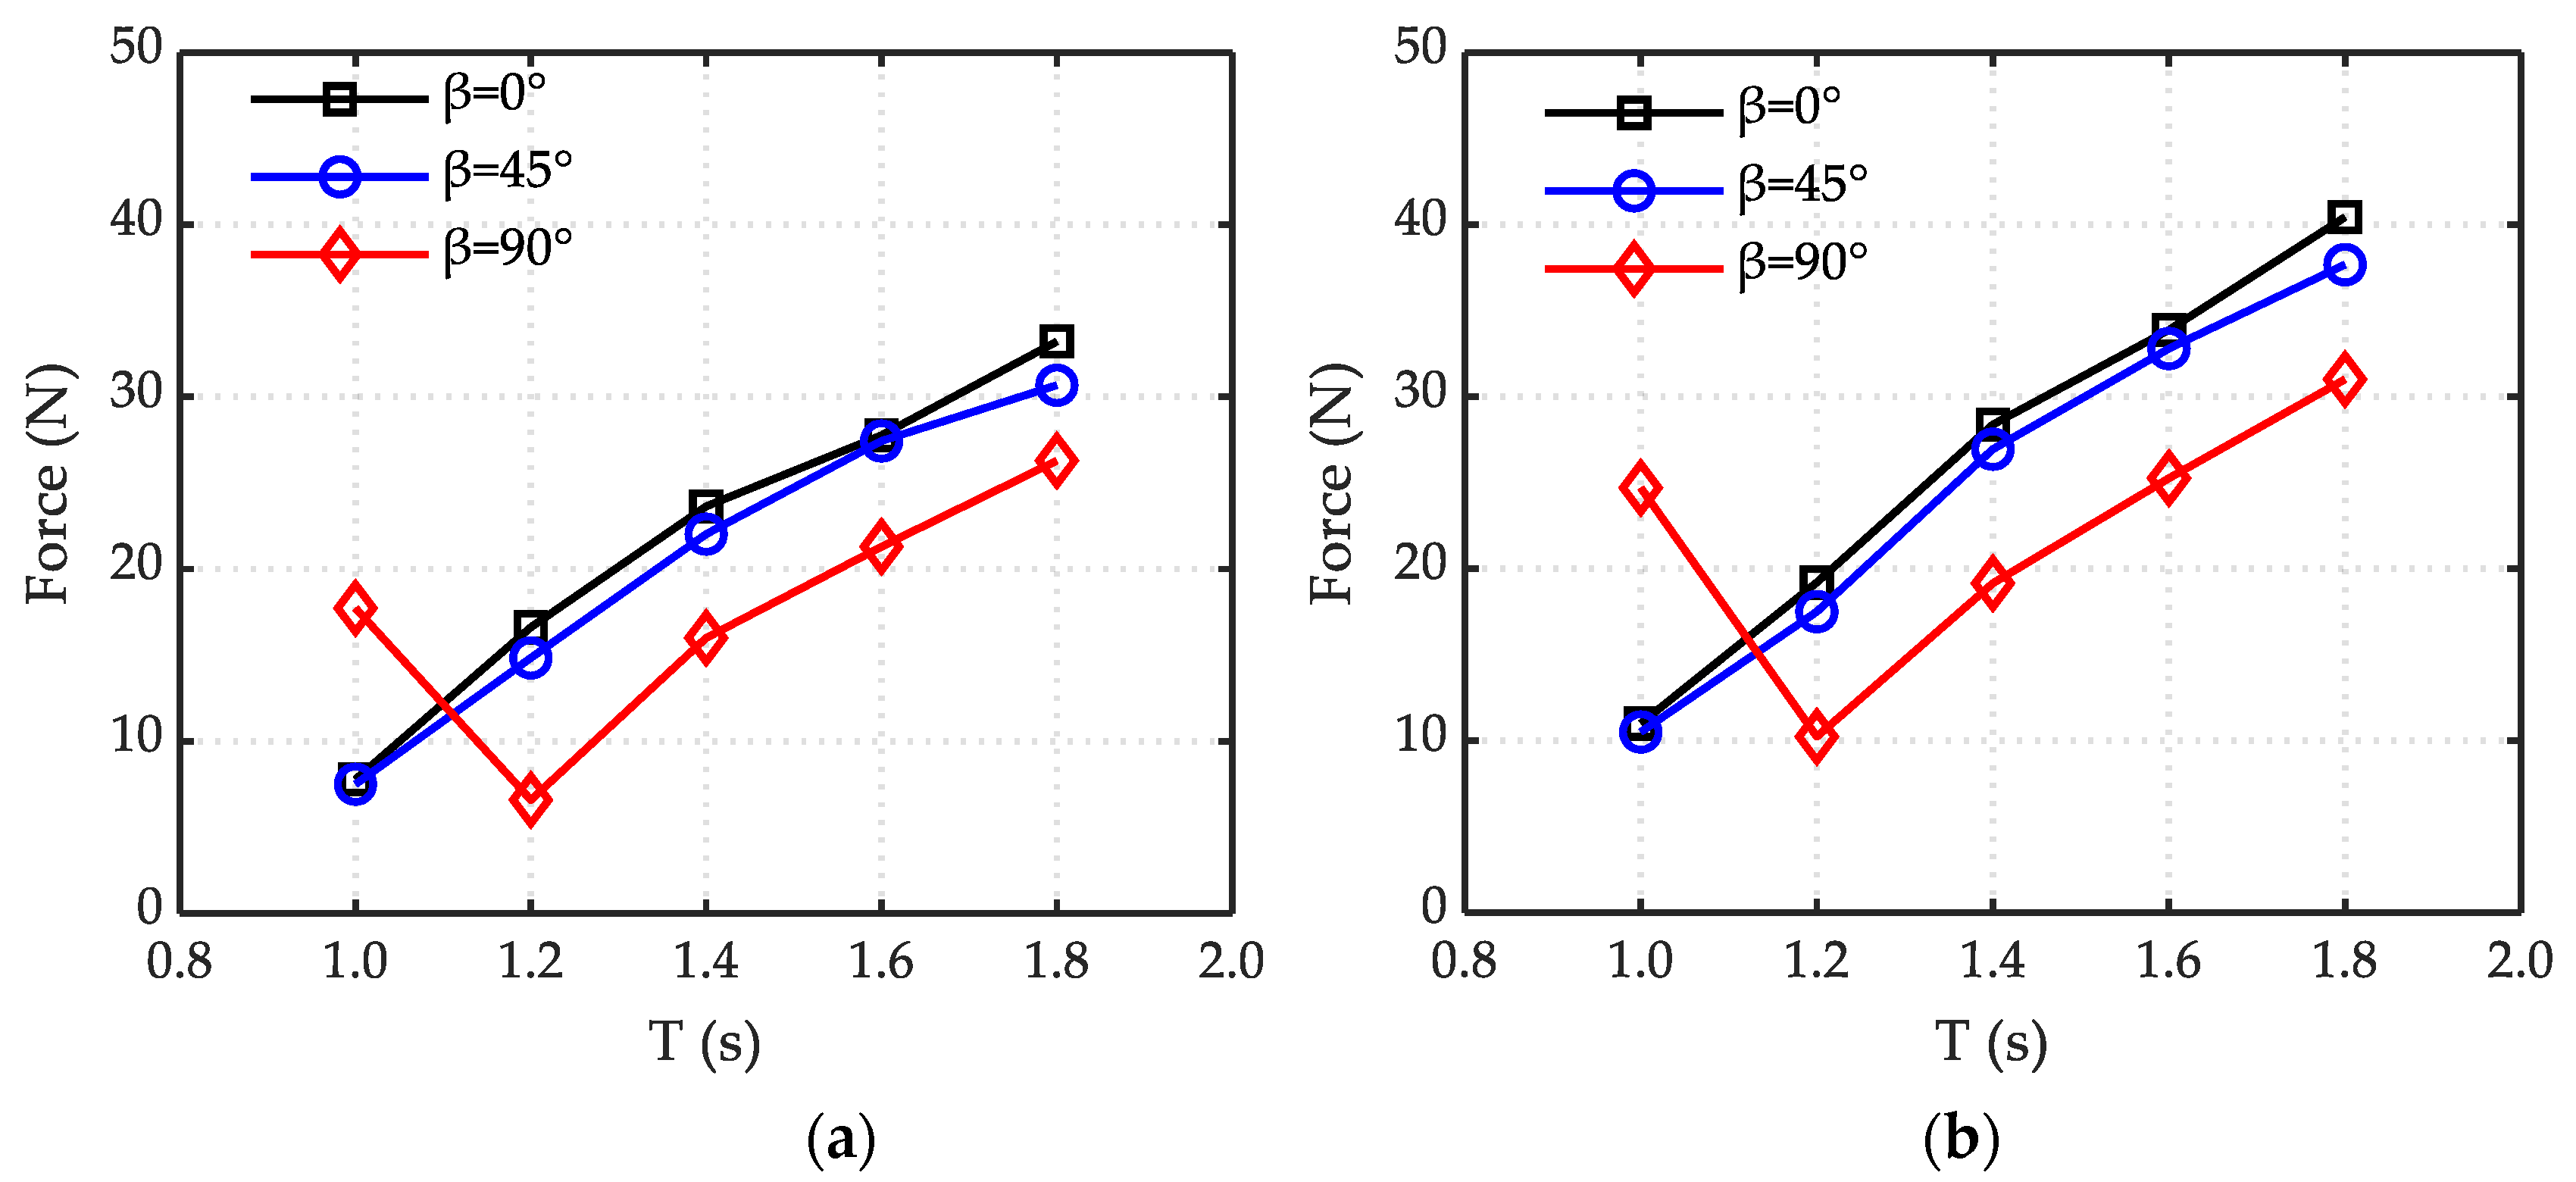
4.3. The Effect of Wave Parameters on Wave Force Components

Equation (1) showed that the drag force was a function of the water point velocity and the structural flow area, and the inertial force was a function of the water point acceleration and the structural flow volume. It can be seen from Figure 12 that when the period was constant, the velocity and acceleration of water particles gradually became larger, and the structure flow area and volume affected by the water point movement also gradually increased, resulting in an increase in the drag force and the inertia force of the structure. The proportion of the drag force in horizontal wave force increased as the wave height increased, which was caused by the drag force being proportional to the square of the water particles’ velocity. Similarly, when the wave height was constant, the magnitude of the drag and inertial force of the jacket increase with the increment of the period in Figure 13 (except for high frequency waves, see Figure 19), considering that the velocity and acceleration of water particles decreased with the increase of the period, and did not contribute to the structural force, but the span of the structure along the wave propagation direction was relatively large. When the wave period increased, the wavelength increased, resulting in an increase in the number of structural members affected by the movement of the water particles at the same time, which offset the effects of reduced velocity and acceleration of water particles, making the drag and inertia forces of the entire structure larger. For M2, the change law of the drag force of the netting was the same as M1, as shown in Figure 14 and Figure 15.
Comparing the horizontal wave force composition of M1 under the positive and lateral wave (Figure 12 and Figure 13), it can be found that the drag force of the jacket appears a regular double peak under the lateral wave, considering that there was a large gap in this direction, and the structures on both sides were symmetrically distributed with respect to the gap (see Figure 6). When the peak was in the middle of the gap, the wave force was small; when the peaks were respectively located at the two sides of the structure, the wave force was larger; and while the wave peak passed through the two sides of the structure, the wave surface and the model component were affected by wave surface symmetrical changes, so the drag force appeared as a symmetric double peak. In addition, the valley value of the drag force was wide and flat, considering that the water surface was lower, so that the force of the members in the middle position of the bottom structure compensate for the fluctuation of the force caused by the upper gap, together with the nonlinearity of the incident wave, the wave force valley was flattened. Due to the phase difference between the inertial force and the drag force, two peaks of different magnitudes appeared in the horizontal wave force after the superposition. For M2 (Figure 14 and Figure 15), the drag force of the netting was not significantly different between the two angles, and both the peak and the valley were broad and flat, considering that the wave continued to act on the netting on both sides parallel to the direction of wave propagation after passing through the first layer of the netting, until the peak of the wave passed through the second layer, the amplitude of the drag was attenuated, and the wave trough had the same effect.

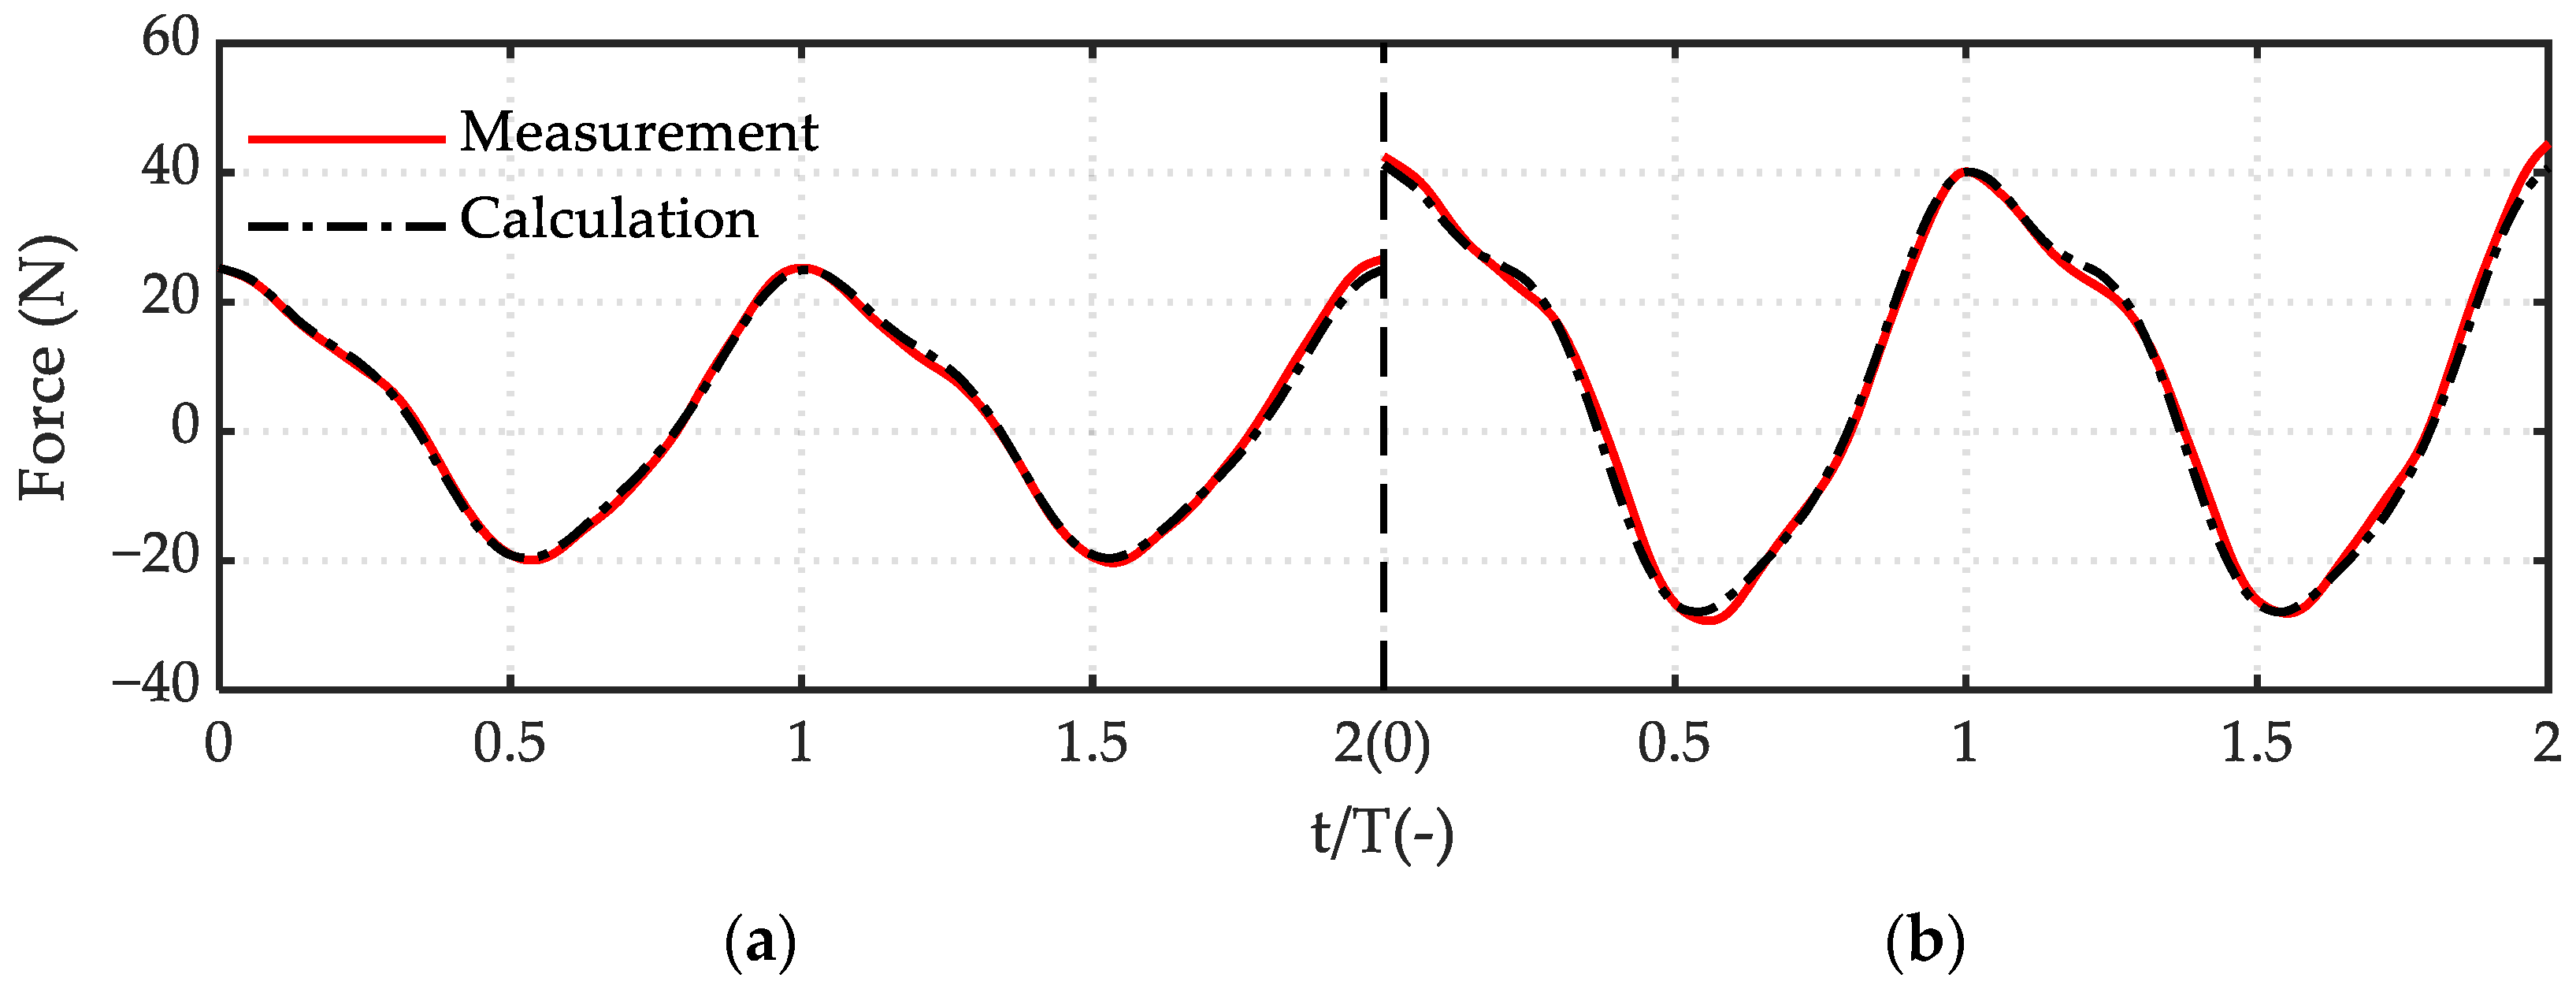
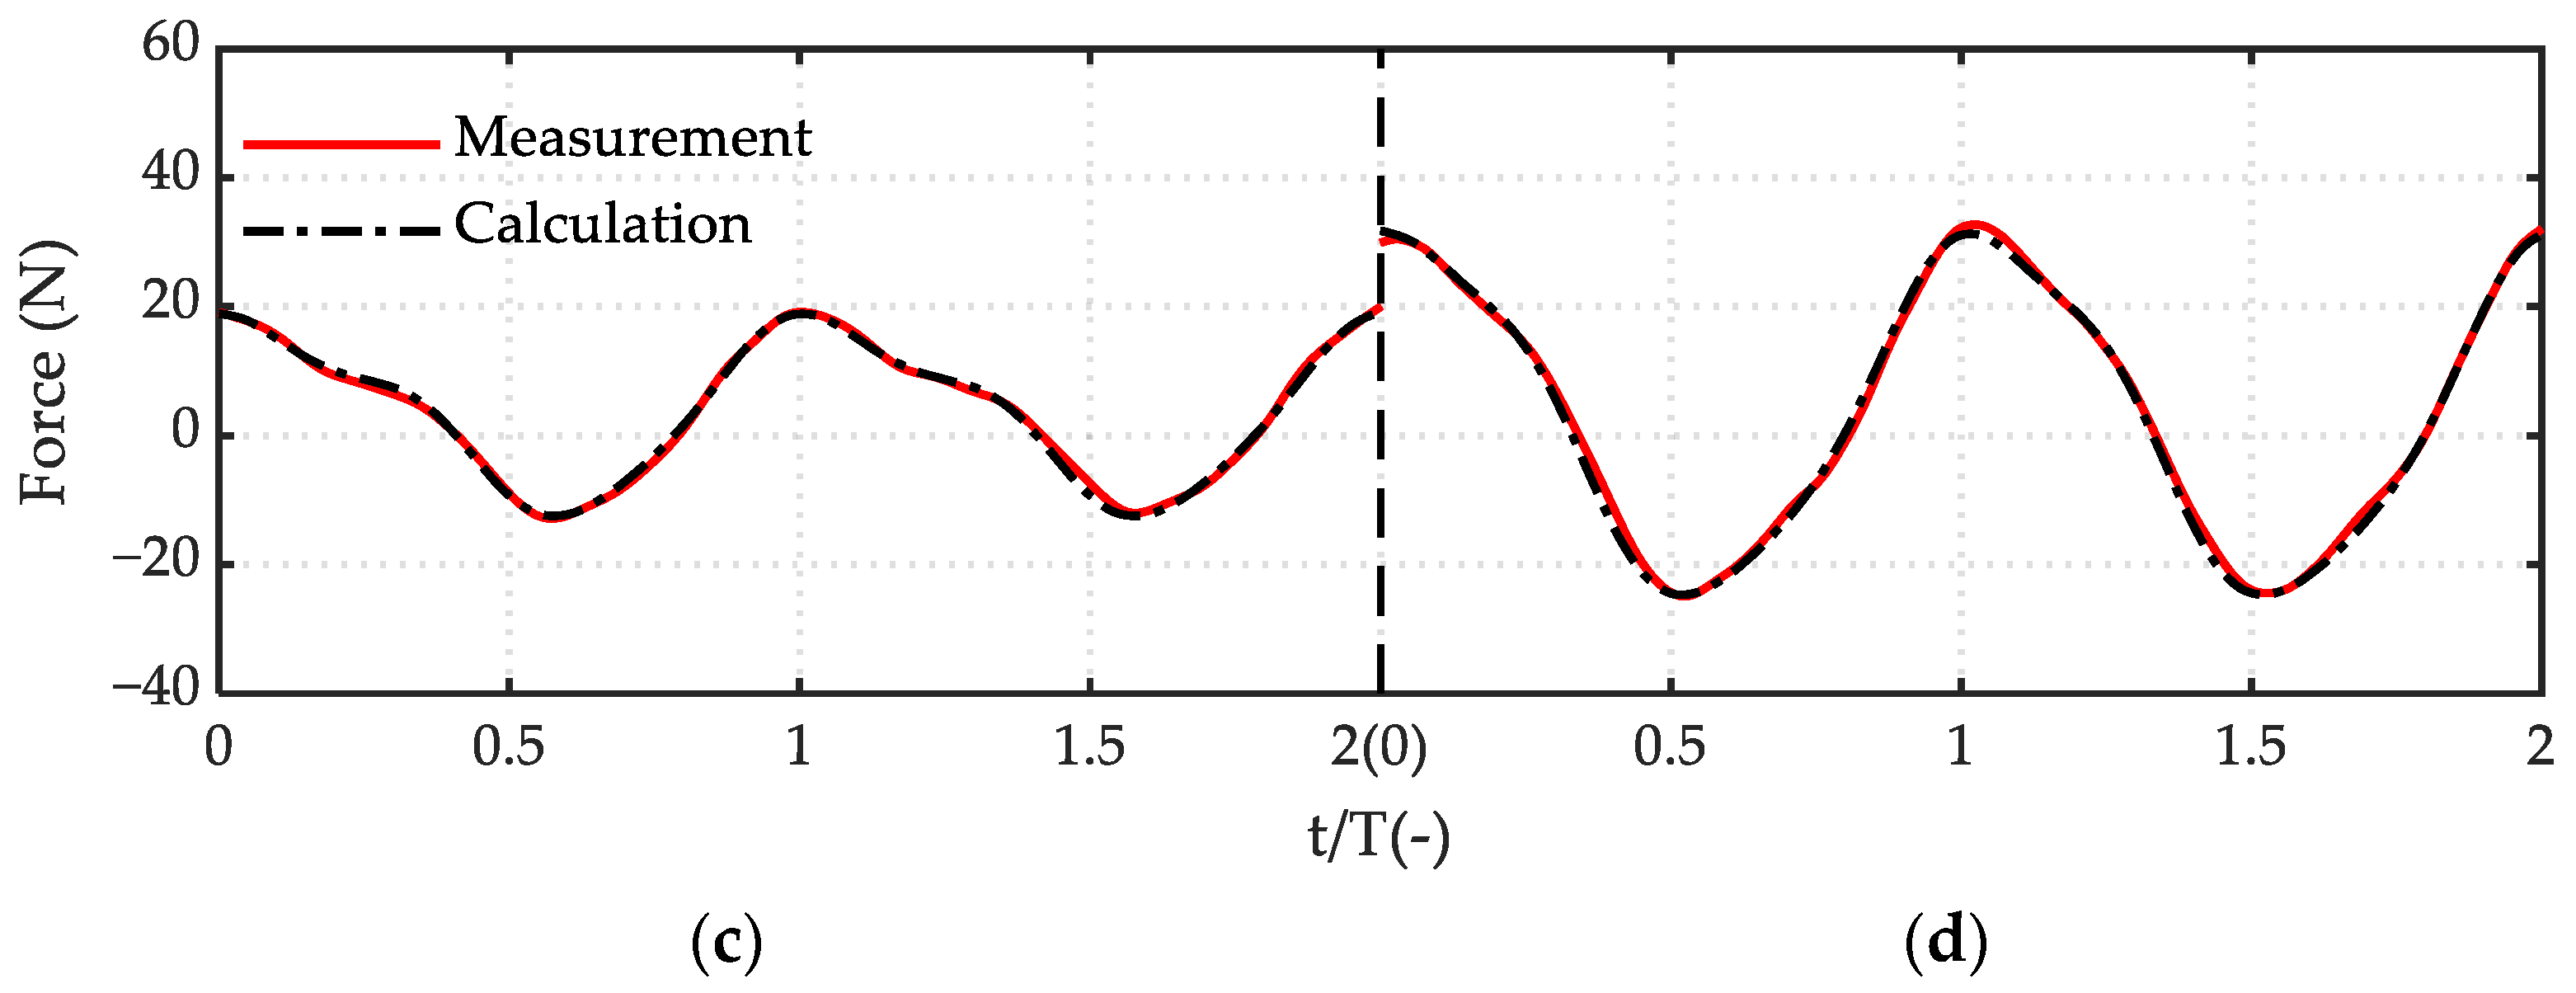
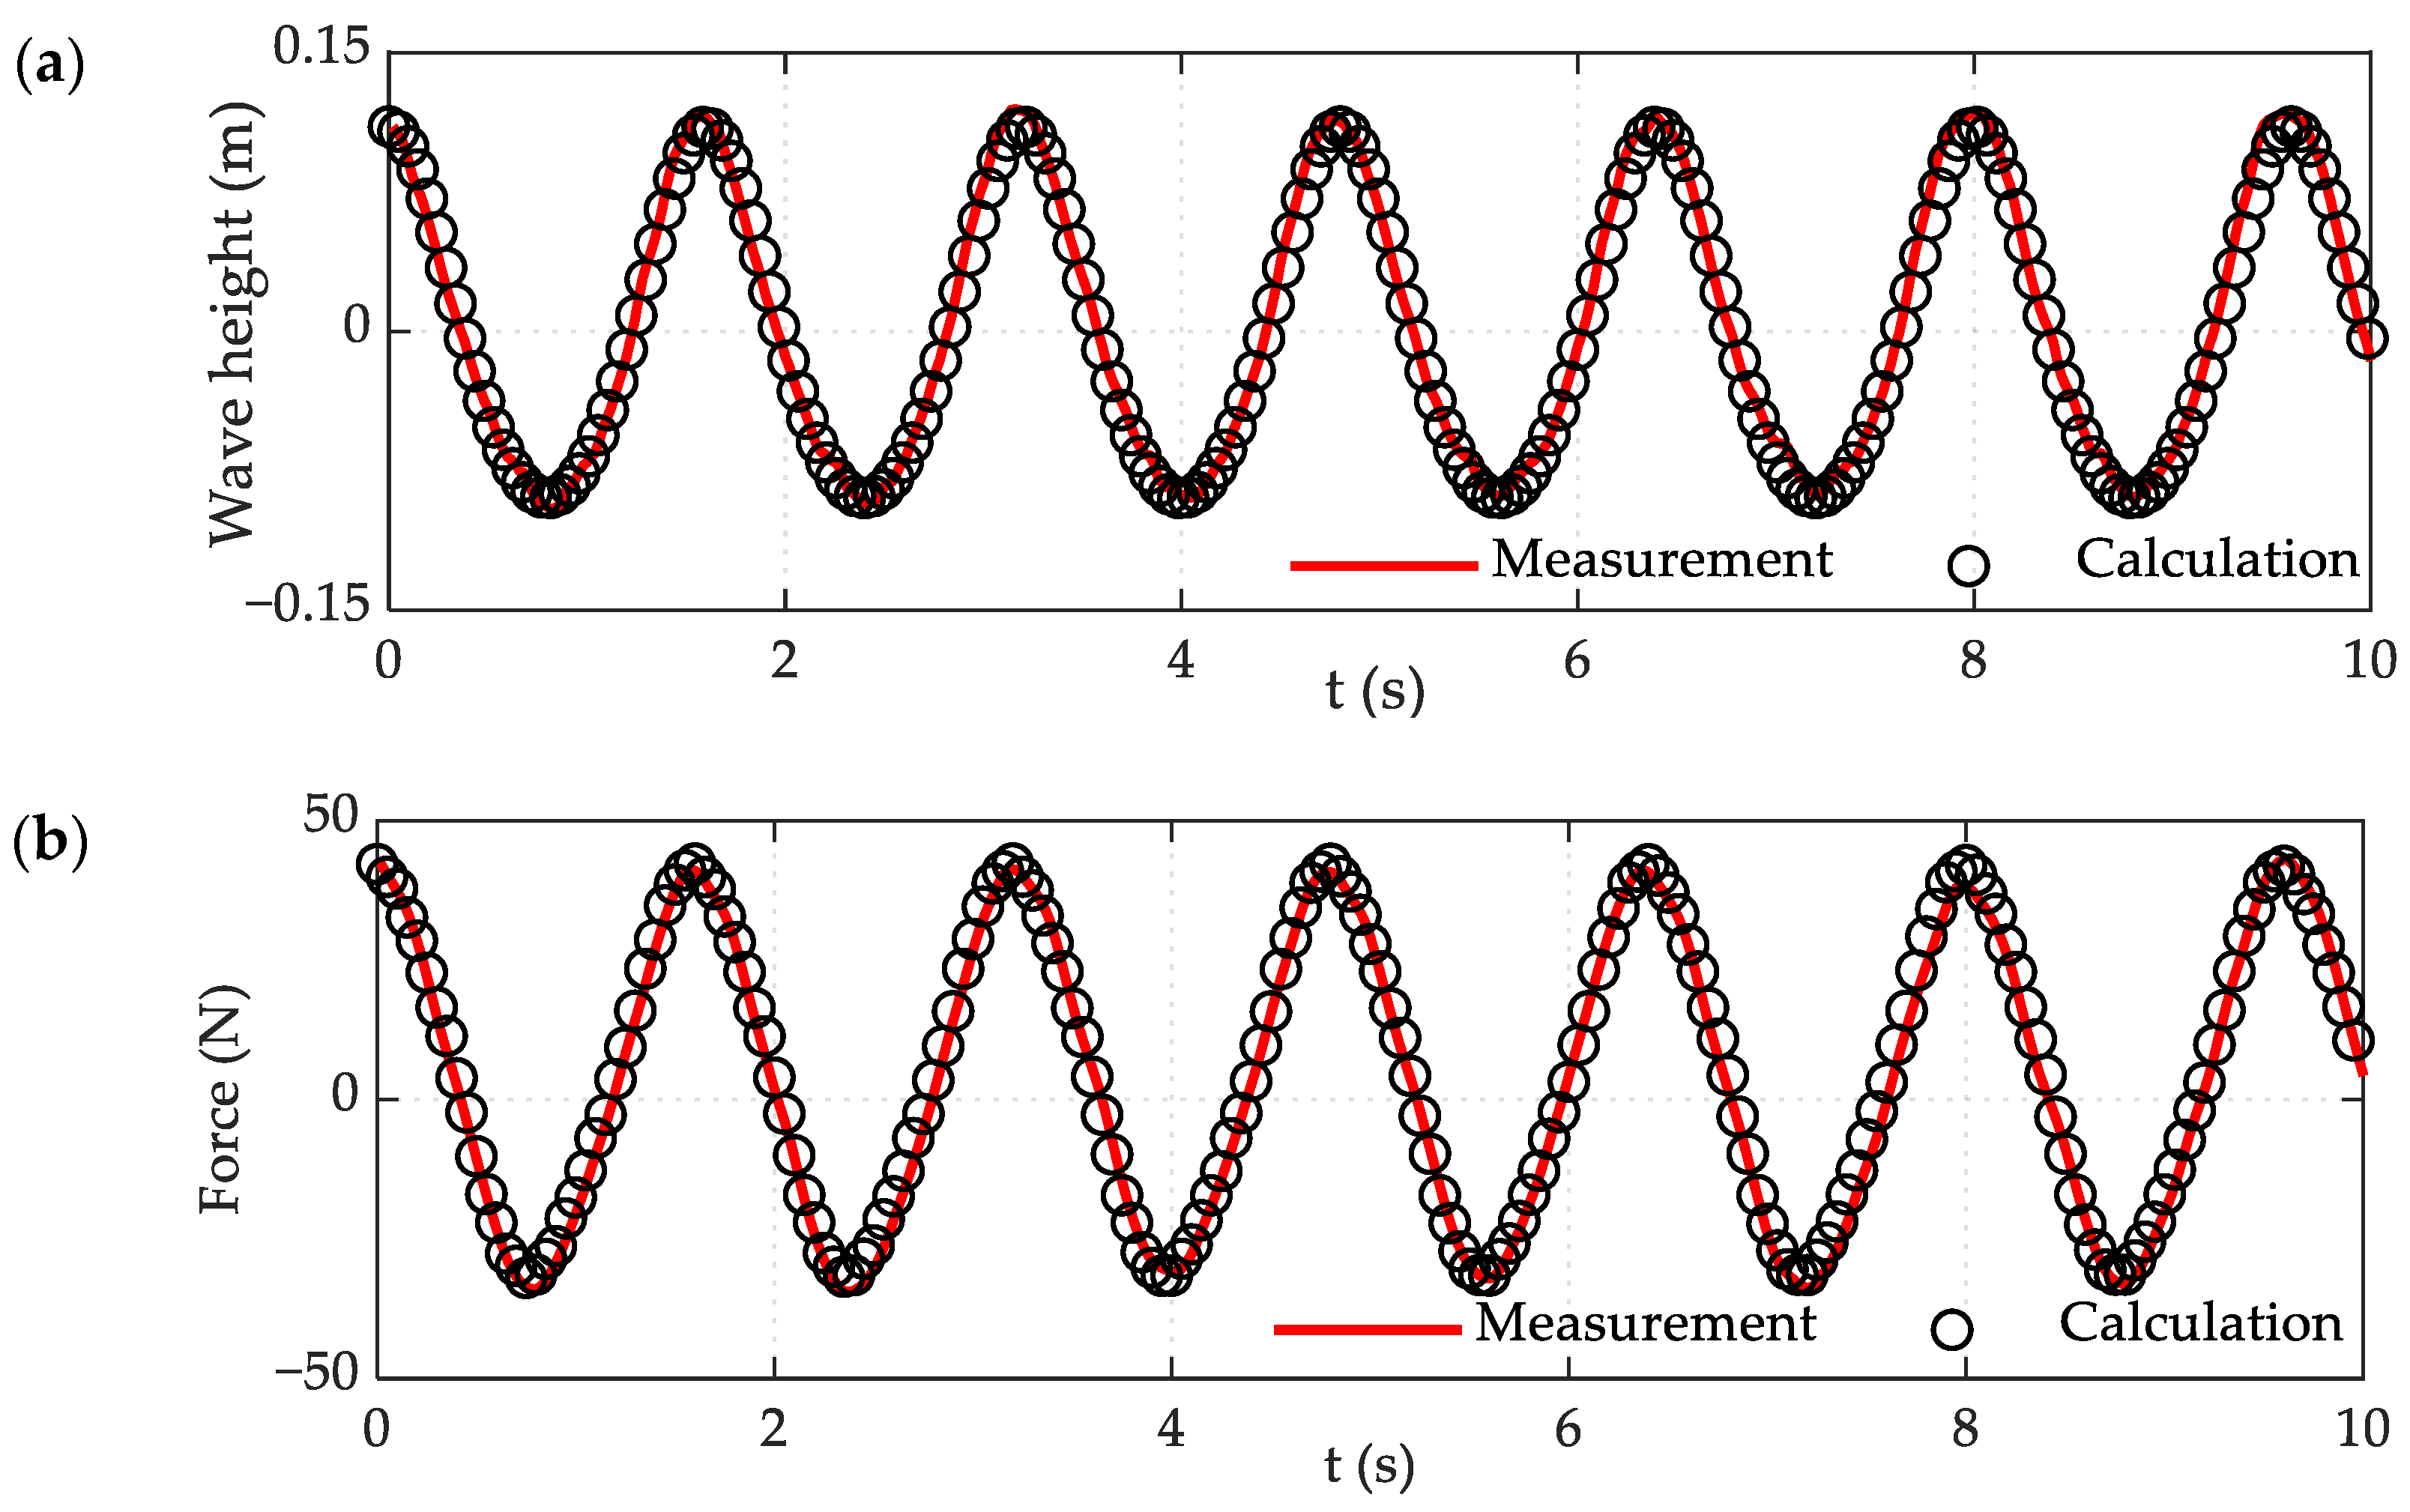
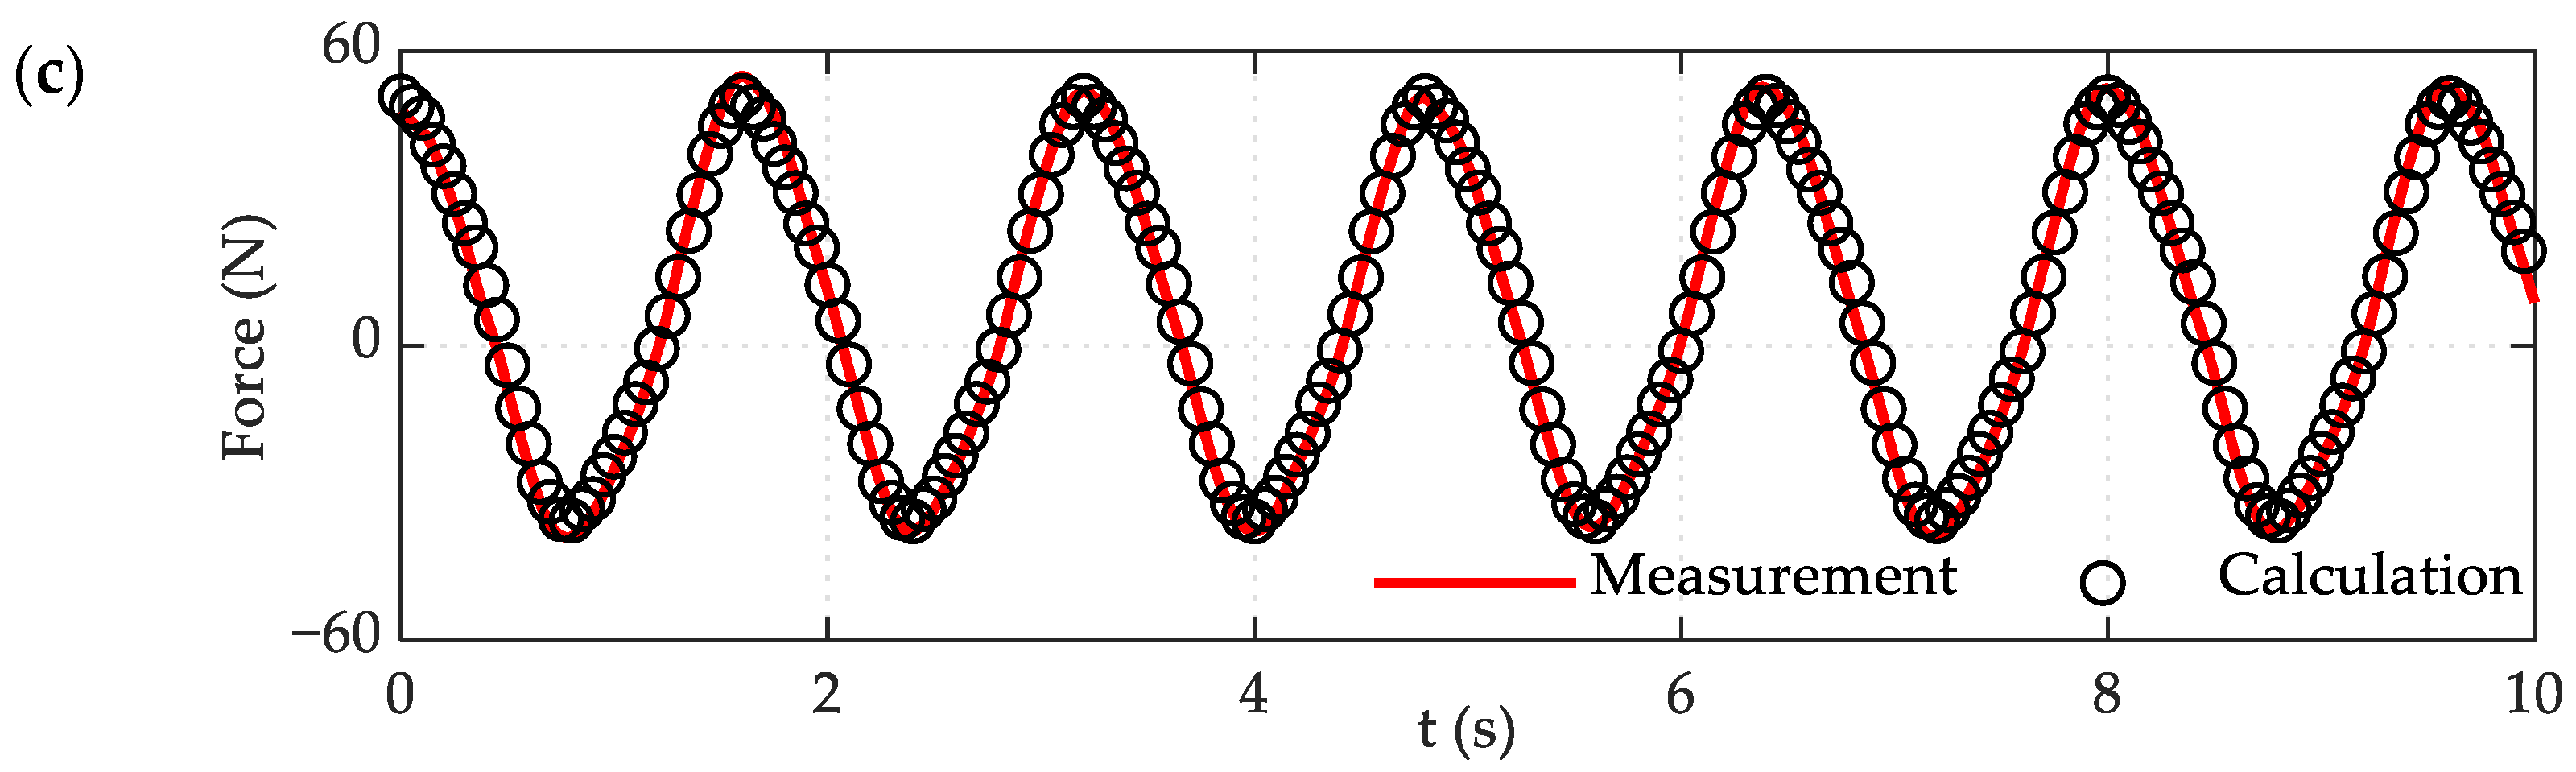
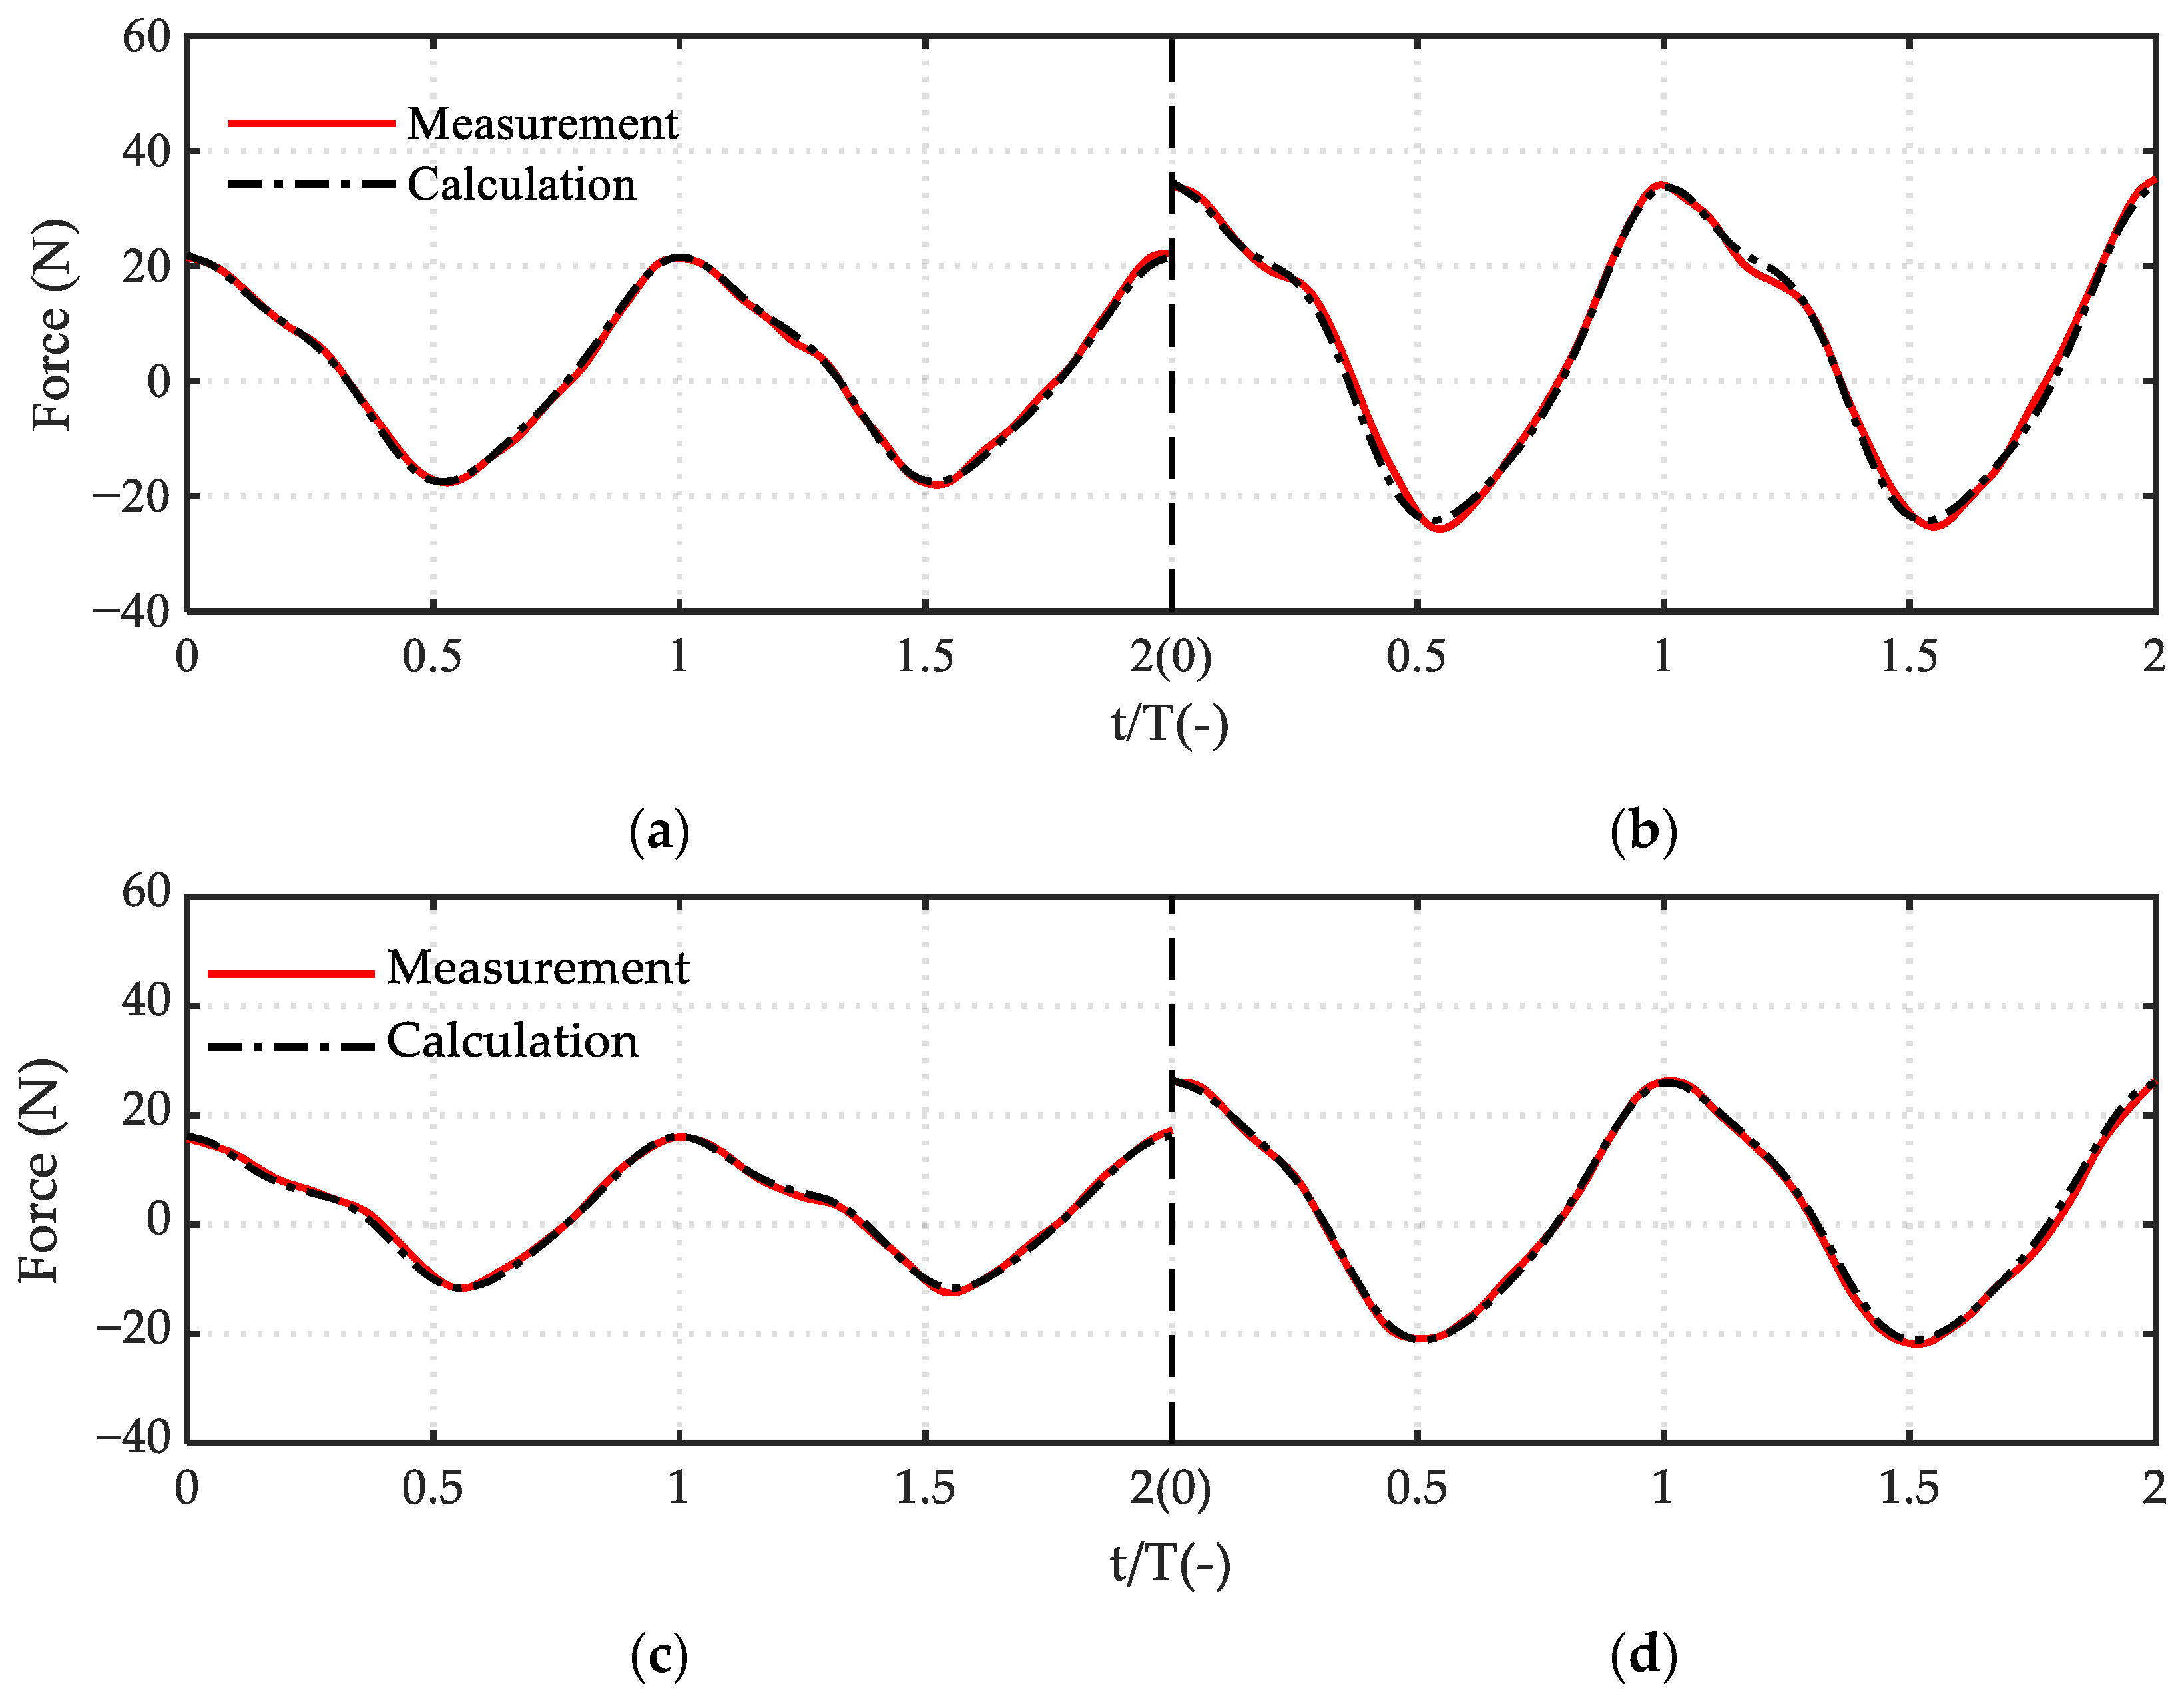
4.4. Results Comparison between Calculation and Measurement

In order to better demonstrate the accuracy of CD and CM obtained by the least square method above, the four groups of test conditions were taken as examples in the lateral wave. Using Equation (1), the horizontal wave forces of the two models were calculated and compared with the horizontal wave force of the test (see Figure 20 and Figure 21). The comparison results indicate that the prediction error of the present model was lower than 2%. Of course, only two periods with relatively stable experimental data were selected for comparison, which was inconsistent with the results of using the complete data, but the prediction deviation in most cases was lower than 5%, which can be acceptable. In addition, only the drag force of the netting was considered and the inertial force was ignored, although the calculation error was introduced, and the approximate solution can be achieved. In summary, the calculated values agreed very well with the time histories of the measurement values, and it can be considered that the hydrodynamic coefficients calculated by the FEM results was effective.

5. Conclusions

In this paper, two models (the jacket model and the column-stabilized fish cage model) were designed according to the similarity theory, and the wave force under different wave height, period, and incident angle were studied, respectively. According to both the experimental and the numerical results, the horizontal wave force composition and corresponding hydrodynamic coefficients of each part of the column-stabilized fish cage were analyzed. The models had high research value because of their large span and typical structure form. The main conclusions are as follows:
(1) The force of the jacket and column-stabilized fish cage increased rapidly with the increment of the wave height, as we all know, while the variation of the forces was quite different from that of most offshore structures: with the variation of wave period, the force can be increased several times in different periods due to the large span of the structure.
(2) The force of the jacket and the column-stabilized fish cage were basically the same in forward and oblique waves, while smaller in lateral waves, as the wave period was constant. In addition, the force was large in the positive low-frequency wave, and small in the lateral low-frequency wave, as the wave height was constant. The lateral high-frequency waves had a great influence on the wave forces, due to the special structural form of the jacket.
(3) The presence of the netting increased the flow area of the structure, so the force of the column-stabilized fish cage was greater than the force of the jacket, and the variation of the wave force of column-stabilized fish cage was consistent with the jacket.
(4) The variation of the drag coefficient of the jacket and the netting was heavily depend on the change in the KC number and the incident angle. The variation of the inertial force coefficient of the jacket mainly depended on the change of the incident angle, and the hydrodynamic coefficient was small in the lateral wave, which was due to the shielding effect between the components.
(5) The drag and inertial force increased with the increment of the wave height and period (except for high frequency waves), and the proportion of the drag force gradually increased.

Author Contributions

Data curation, Q.-P.C.; formal analysis, C.-W.B.; funding acquisition, Y.-P.Z. and Y.C.; investigation, Q.-P.C. and Y.C.; methodology, C.-W.B.; supervision, Y.-P.Z.; writing—original draft, Q.-P.C.; writing—review and editing, Y.-P.Z. and C.-W.B.

Funding

This research was funded by the National Natural Science Foundation of China (NSFC), project nos. 51939002, 51822901, 31872610, 31972843; and the Maritime S&T Fund of Shandong Province for Pilot National Laboratory for Marine Science and Technology (Qingdao), project no. 2018SDKJ0303-4.

Acknowledgments

The authors acknowledge the support from the National Natural Science Foundation of China and the Maritime S&T Fund of Shandong Province for Pilot National Laboratory for Marine Science and Technology (Qingdao).

Conflicts of Interest

The authors declare no conflicts of interest.

References

  1. Klebert, P.; Lader, P.; Gansel, L.; Oppedal, F. Hydrodynamic interactions on net panel and aquaculture fish cages: A review. Ocean Eng. 2013, 58, 260–274. [Google Scholar] [CrossRef]
  2. Sarpkaya, T. Forces on cylinders and spheres in a sinusoidally oscillating Fluid. J. Appl. Mech. 1975, 42, 32–37. [Google Scholar] [CrossRef]
  3. Sundar, V.; Vengatesan, V.; Anandkumar, G.; Schlenkhoff, A. Hydrodynamic coefficients for inclined cylinders. Ocean Eng. 1998, 25, 277–294. [Google Scholar] [CrossRef]
  4. Bushnell, M.J. Forces on cylinder arrays in oscillating flow. In Proceedings of the Offshore Technology Conference, Houston, TX, USA, 2 May 1977. [Google Scholar]
  5. Chakrabatri, S.K. Hydrodynamic coefficients for a vertical tube in array. Appl. Ocean Res. 1981, 3, 121–128. [Google Scholar]
  6. Chakrabatri, S.K. In-line and transverse forces on a tube array in tandem with waves. Appl. Ocean Res. 1982, 4, 25–32. [Google Scholar] [CrossRef]
  7. Kurian, V.J.; Al-Yacouby, A.M.; Sebastian, A.A.; Liew, M.S.; Idichandy, V.G. Hydrodynamic coefficients for array of tubular cylinders. In Proceedings of the Twenty-fourth International Ocean and Polar Engineering Conference, Busan, Korea, 15–20 June 2014; pp. 641–648. [Google Scholar]
  8. Santo, H.; Taylor, P.H.; Day, A.H.; Nixon, E.; Choo, Y.S. Current blockage and extreme forces on a jacket model in focussed wave groups with current. J. Fluids Struct. 2018, 78, 24–35. [Google Scholar] [CrossRef]
  9. Palm, J.; Eskilsson, C.; Bergdahl, L.; Bensow, R. Assessment of scale effects, viscous forces and induced drag on a point-absorbing wave energy converter by CFD simulations. J. Mar. Sci. Eng. 2018, 6, 124. [Google Scholar] [CrossRef]
  10. Amaechi, C.V.; Wang, F.C.; Hou, X.N.; Ye, J.Q. Strength of submarine hoses in Chinese-lantern configuration from hydrodynamic loads on CALM buoy. Ocean Eng. 2018, 171, 429–442. [Google Scholar] [CrossRef]
  11. Gadelho, F.M.; Rodrigues, J.M.; Lavrov, A.; Guedes Soares, C. Determining hydrodynamic coefficients of a cylinder with Navier-Stokes equations. In Maritime Technology and Engineering; Guedes, S., Santos, T.A., Eds.; Taylor & Francis Group: London, UK, 2014; ISBN 978-1-138-02727-5. [Google Scholar]
  12. Lader, P.F.; Enerhaug, B. Experimental investigation of forces and geometry of a net cage in uniform. IEEE J. Ocean. Eng. 2005, 30, 79–84. [Google Scholar] [CrossRef]
  13. Decew, J.; Tsukrov, I.; Risso, A.; Swift, M.R.; Celikkol, B. Modeling of dynamic behavior of a single-point moored submersible fish cage under currents. Aquac. Eng. 2010, 43, 38–45. [Google Scholar] [CrossRef]
  14. Zhao, Y.P.; Bi, C.W.; Dong, G.H.; Gui, F.K.; Cui, Y.; Guan, C.T.; Xu, T.J. Numerical simulation of the flow around fishing plane nets using the porous media model. Ocean Eng. 2013, 62, 25–37. [Google Scholar] [CrossRef]
  15. Bi, C.W.; Zhao, Y.P.; Dong, G.H.; Xu, T.J.; Gui, F.K. Numerical simulation of the interaction between flow and flexible nets. J. Fluids Struct. 2014, 45, 180–201. [Google Scholar] [CrossRef]
  16. Bi, C.W.; Zhao, Y.P.; Dong, G.H.; Wu, Z.M.; Zhang, Y.; Xu, T.J. Drag on and flow through the hydroid-fouled nets in currents. Ocean Eng. 2018, 161, 195–204. [Google Scholar] [CrossRef]
  17. Cui, Y.; Guan, C.T.; Wan, R.; Huang, B.; Li, J. Dynamic analysis of hydrodynamic behavior of a flatfish cage system under wave conditions. China Ocean Eng. 2014, 28, 215–226. [Google Scholar] [CrossRef]
  18. Dong, G.H.; Tang, M.F.; Xu, T.J.; Bi, C.W.; Guo, W.J. Experimental analysis of the hydrodynamic force on the net panel in wave. Appl. Ocean Res. 2019, 87, 233–246. [Google Scholar] [CrossRef]
  19. Zhao, Y.P.; Guan, C.T.; Bi, C.W.; Liu, H.F.; Cui, Y. Experimental investigations on hydrodynamic responses of a semi-submersible offshore fish farm in waves. J. Mar. Sci. Eng. 2019, 7, 238. [Google Scholar] [CrossRef]
  20. Huang, C.C.; Tang, H.J.; Liu, J.Y. Dynamical analysis of net cage structures for marine aquaculture: Numerical simulation and model testing. Aquac. Eng. 2006, 35, 258–270. [Google Scholar] [CrossRef]
  21. Xu, T.J.; Dong, G.H.; Zhao, Y.P.; Li, Y.C.; Gui, F.K. Numerical investigation of the hydrodynamic behaviors of multiple net cages in waves. Aquac. Eng. 2012, 48, 6–18. [Google Scholar] [CrossRef]
  22. Tsukrov, I.; Eroshkin, O.; Fredriksson, D.W.; Swift, M.R.; Celikkol, B. Finite element modeling of net panels using a consistent net element. Ocean Eng. 2003, 30, 251–270. [Google Scholar] [CrossRef]
  23. Morison, J.R.; Johnson, J.W.; Schaaf, S.A. The force exerted by surface waves on piles. J. Pet. Technol. 1950, 2, 149–154. [Google Scholar] [CrossRef]
  24. Zhao, Y.P.; Li, Y.C.; Dong, G.H.; Gui, F.K.; Wu, H. An experimental and numerical study of hydrodynamic characteristics of submerged flexible plane nets in waves. Aquac. Eng. 2008, 38, 16–25. [Google Scholar] [CrossRef]
Figure 1. Experimental set-up of the column-stabilized fish cage.
Jmse 07 00418 g001
Figure 2. Comparison of the time history of the four measurements (A4).
Jmse 07 00418 g002
Figure 3. Wave incident angles and top view of the model (0°, 45°, and 90° were incident direction. Thereafter, they were denoted respectively as forward wave, oblique wave, and lateral wave).
Jmse 07 00418 g003
Figure 4. Time histories of the wave height and horizontal force on M1 and M2 for A5. (a)Wave height, (b) force of M1 and (c) force of M2.
Jmse 07 00418 g004aJmse 07 00418 g004b
Figure 5. Mesh grouping method. (a) The original netting and (b) The mesh-grouped netting.
Jmse 07 00418 g005
Figure 6. Finite element model of the testing model.
Jmse 07 00418 g006
Figure 7. Time histories of the wave height and horizontal forces on M1 and M2. (a) A3-3 and (b) A4.
Jmse 07 00418 g007
Figure 8. Horizontal forces of the structure under the action of wave (T = 1.6 s). (a) β = 0°, (b) β = 45° and (c) β = 90°.
Jmse 07 00418 g008
Figure 9. Horizontal forces of the structure under the action of wave (H = 0.15 m). (a) β = 0°, (b) β = 45° and (c) β = 90°.
Jmse 07 00418 g009
Figure 10. Variation of hydrodynamic coefficients of jacket, along with the change of KC number. (a) Relationship between CD and KC number and (b) relationship between CM and KC number.
Jmse 07 00418 g010
Figure 11. Variation of hydrodynamic coefficient (CD) of the netting, along with the change of KC number.
Jmse 07 00418 g011
Figure 12. Composition of measured horizontal wave force of M1 (T = 1.6 s). (a) β = 0°, H = 0.15 m, T = 1.6 s, (b) β = 0°, H = 0.20 m, T = 1.6 s, (c) β = 45°, H = 0.15 m, T = 1.6 s, (d) β = 45°, H = 0.20 m, T = 1.6 s, (e) β = 90°, H = 0.15 m, T = 1.6 s and (f) β = 90°, H = 0.20 m, T = 1.6 s.
Jmse 07 00418 g012aJmse 07 00418 g012b
Figure 13. Composition of measured horizontal wave force of M1 (H = 0.15 m). (a) β = 0°, T = 1.4 s, H = 0.15 m, (b) β = 0°, T = 1.8 s, H = 0.15 m, (c) β = 45°, T = 1.4 s, H = 0.15 m, T = 1.6 s, (d) β = 45°, T = 1.8 s, H = 0.15 m, (e) β = 90°, T = 1.4 s, H = 0.15 m and (f) β = 90°, T = 1.8 s, H = 0.15 m.
Jmse 07 00418 g013aJmse 07 00418 g013b
Figure 14. Composition of measured horizontal wave force of M2 (T = 1.6 s). (a) β = 0°, H = 0.15 m, T = 1.6 s, (b) β = 0°, H = 0.20 m, T = 1.6 s, (c) β = 45°, H = 0.15 m, T = 1.6 s, (d) β = 45°, H = 0.20 m, T = 1.6 s, (e) β = 90°, H = 0.15 m, T = 1.6 s and (f) β = 90°, H = 0.20 m, T = 1.6 s.
Jmse 07 00418 g014aJmse 07 00418 g014b
Figure 15. Composition of measured horizontal wave force of M2 (H = 0.15 m). (a) β = 0°, T = 1.4 s, H = 0.15 m, (b) β = 0°, T = 1.8 s, H = 0.15 m, (c) β = 45°, T = 1.4 s, H = 0.15 m, (d) β = 45°, T = 1.8 s, H = 0.15 m, (e) β = 90°, T = 1.4 s, H = 0.15 m and (f) β = 90°, T = 1.8 s, H = 0.15 m.
Jmse 07 00418 g015
Figure 16. Horizontal force of structure under different incident angles (T = 1.6 s). (a) M1 and (b) M2.
Jmse 07 00418 g016
Figure 17. Horizontal force of structure under different incident angles (H = 0.15 m). (a) M1 and (b) M2.
Jmse 07 00418 g017
Figure 18. Forces under the action of waves (T = 1.6 s). (a) Drag force (CD = 1), (b) Inertia force (CM = 1) and (c) Total force (CD = 1, CM = 1).
Jmse 07 00418 g018
Figure 19. Forces under the action of waves (H = 0.15 m). (a) Drag force (CD = 1), (b) Inertia force (CM = 1) and (c) Total force (CD = 1, CM = 1).
Jmse 07 00418 g019
Figure 20. Time histories of measured and calculated wave forces on M1 in the lateral wave (β = 90°). (a) β = 90°, H = 0.15 m, T = 1.6 s, (b) β = 90°, H = 0.20 m, T = 1.6 s, (c) β = 90°, T = 1.4 s, H = 0.15 m and (d) β = 90°, T = 1.8 s, H = 0.15 m.
Jmse 07 00418 g020
Figure 21. Time histories of measured and calculated wave force on M2 in the lateral wave (β = 90°). (a) β = 90°, H = 0.15 m, T = 1.6 s, (b) β = 90°, H = 0.20 m, T = 1.6 s, (c) β = 90°, T = 1.4 s, H = 0.15 m, (d) β = 90°, T = 1.8 s, H = 0.15 m.
Jmse 07 00418 g021aJmse 07 00418 g021b
Table 1. Geometric dimension parameters of the prototype and model.
MemberModel NumberSection for
Prototype
Section for
Model
(mm)(mm)
Jacket (Outside diameter * Thickness)P2000 × 502000 * 5032 * 3
P1500 × 401500 * 4025 * 2
P1200 × 401200 * 4020 * 2
Table 2. Wave conditions.
Test NumberWave Height
H/m
Wave Period
T/s
Wave Incident Angle
β (°)
A10.051.60(A), 45(B),
90(C)
A20.11.6
A30.151.0, 1.2, 1.4, 1.6, 1.8
A40.21.6
A50.251.6
Table 3. Parameters of the netting.
Parameter
Type
Experimental
Values
Numerical
Values
Mesh size (mm)1224
Twine diameter (mm)0.821.64
Horizontal shrinkage coefficient0.60.6
Vertical shrinkage coefficient0.80.8
Solidity ratio0.1370.137

