Categorization and Analysis of Relevant Factors for Optimal Locations in Onshore and Offshore Wind Power Plants: A Taxonomic Review

 ,
,  ,
,  and
and 
Abstract
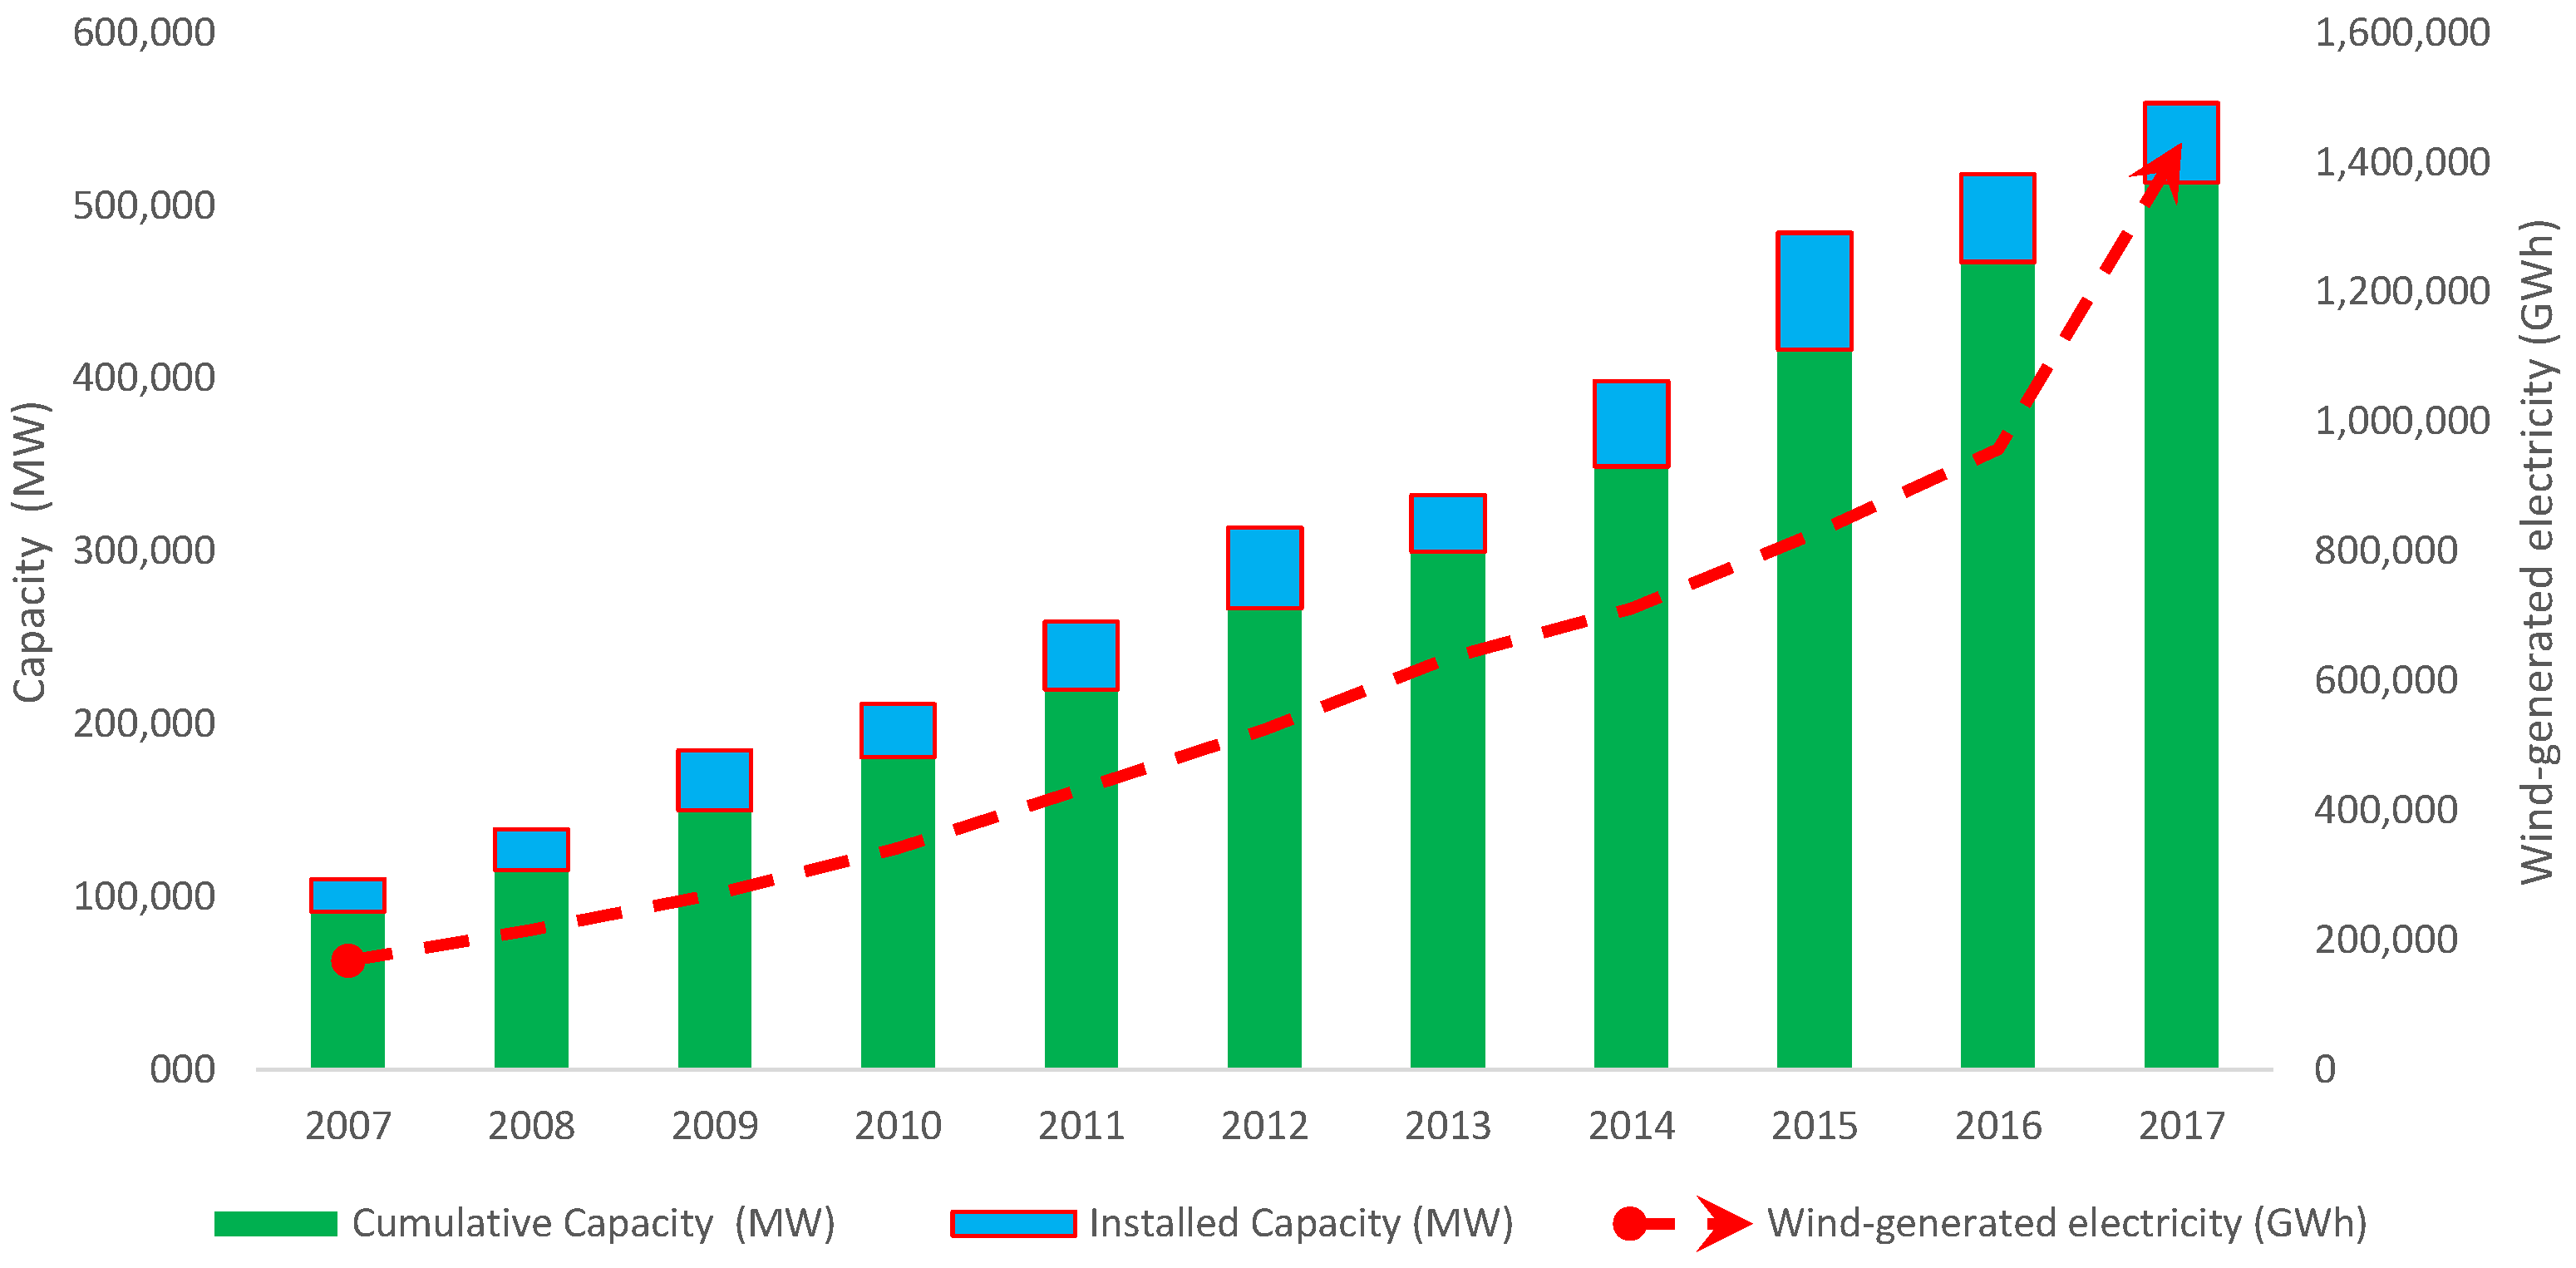
1. Introduction
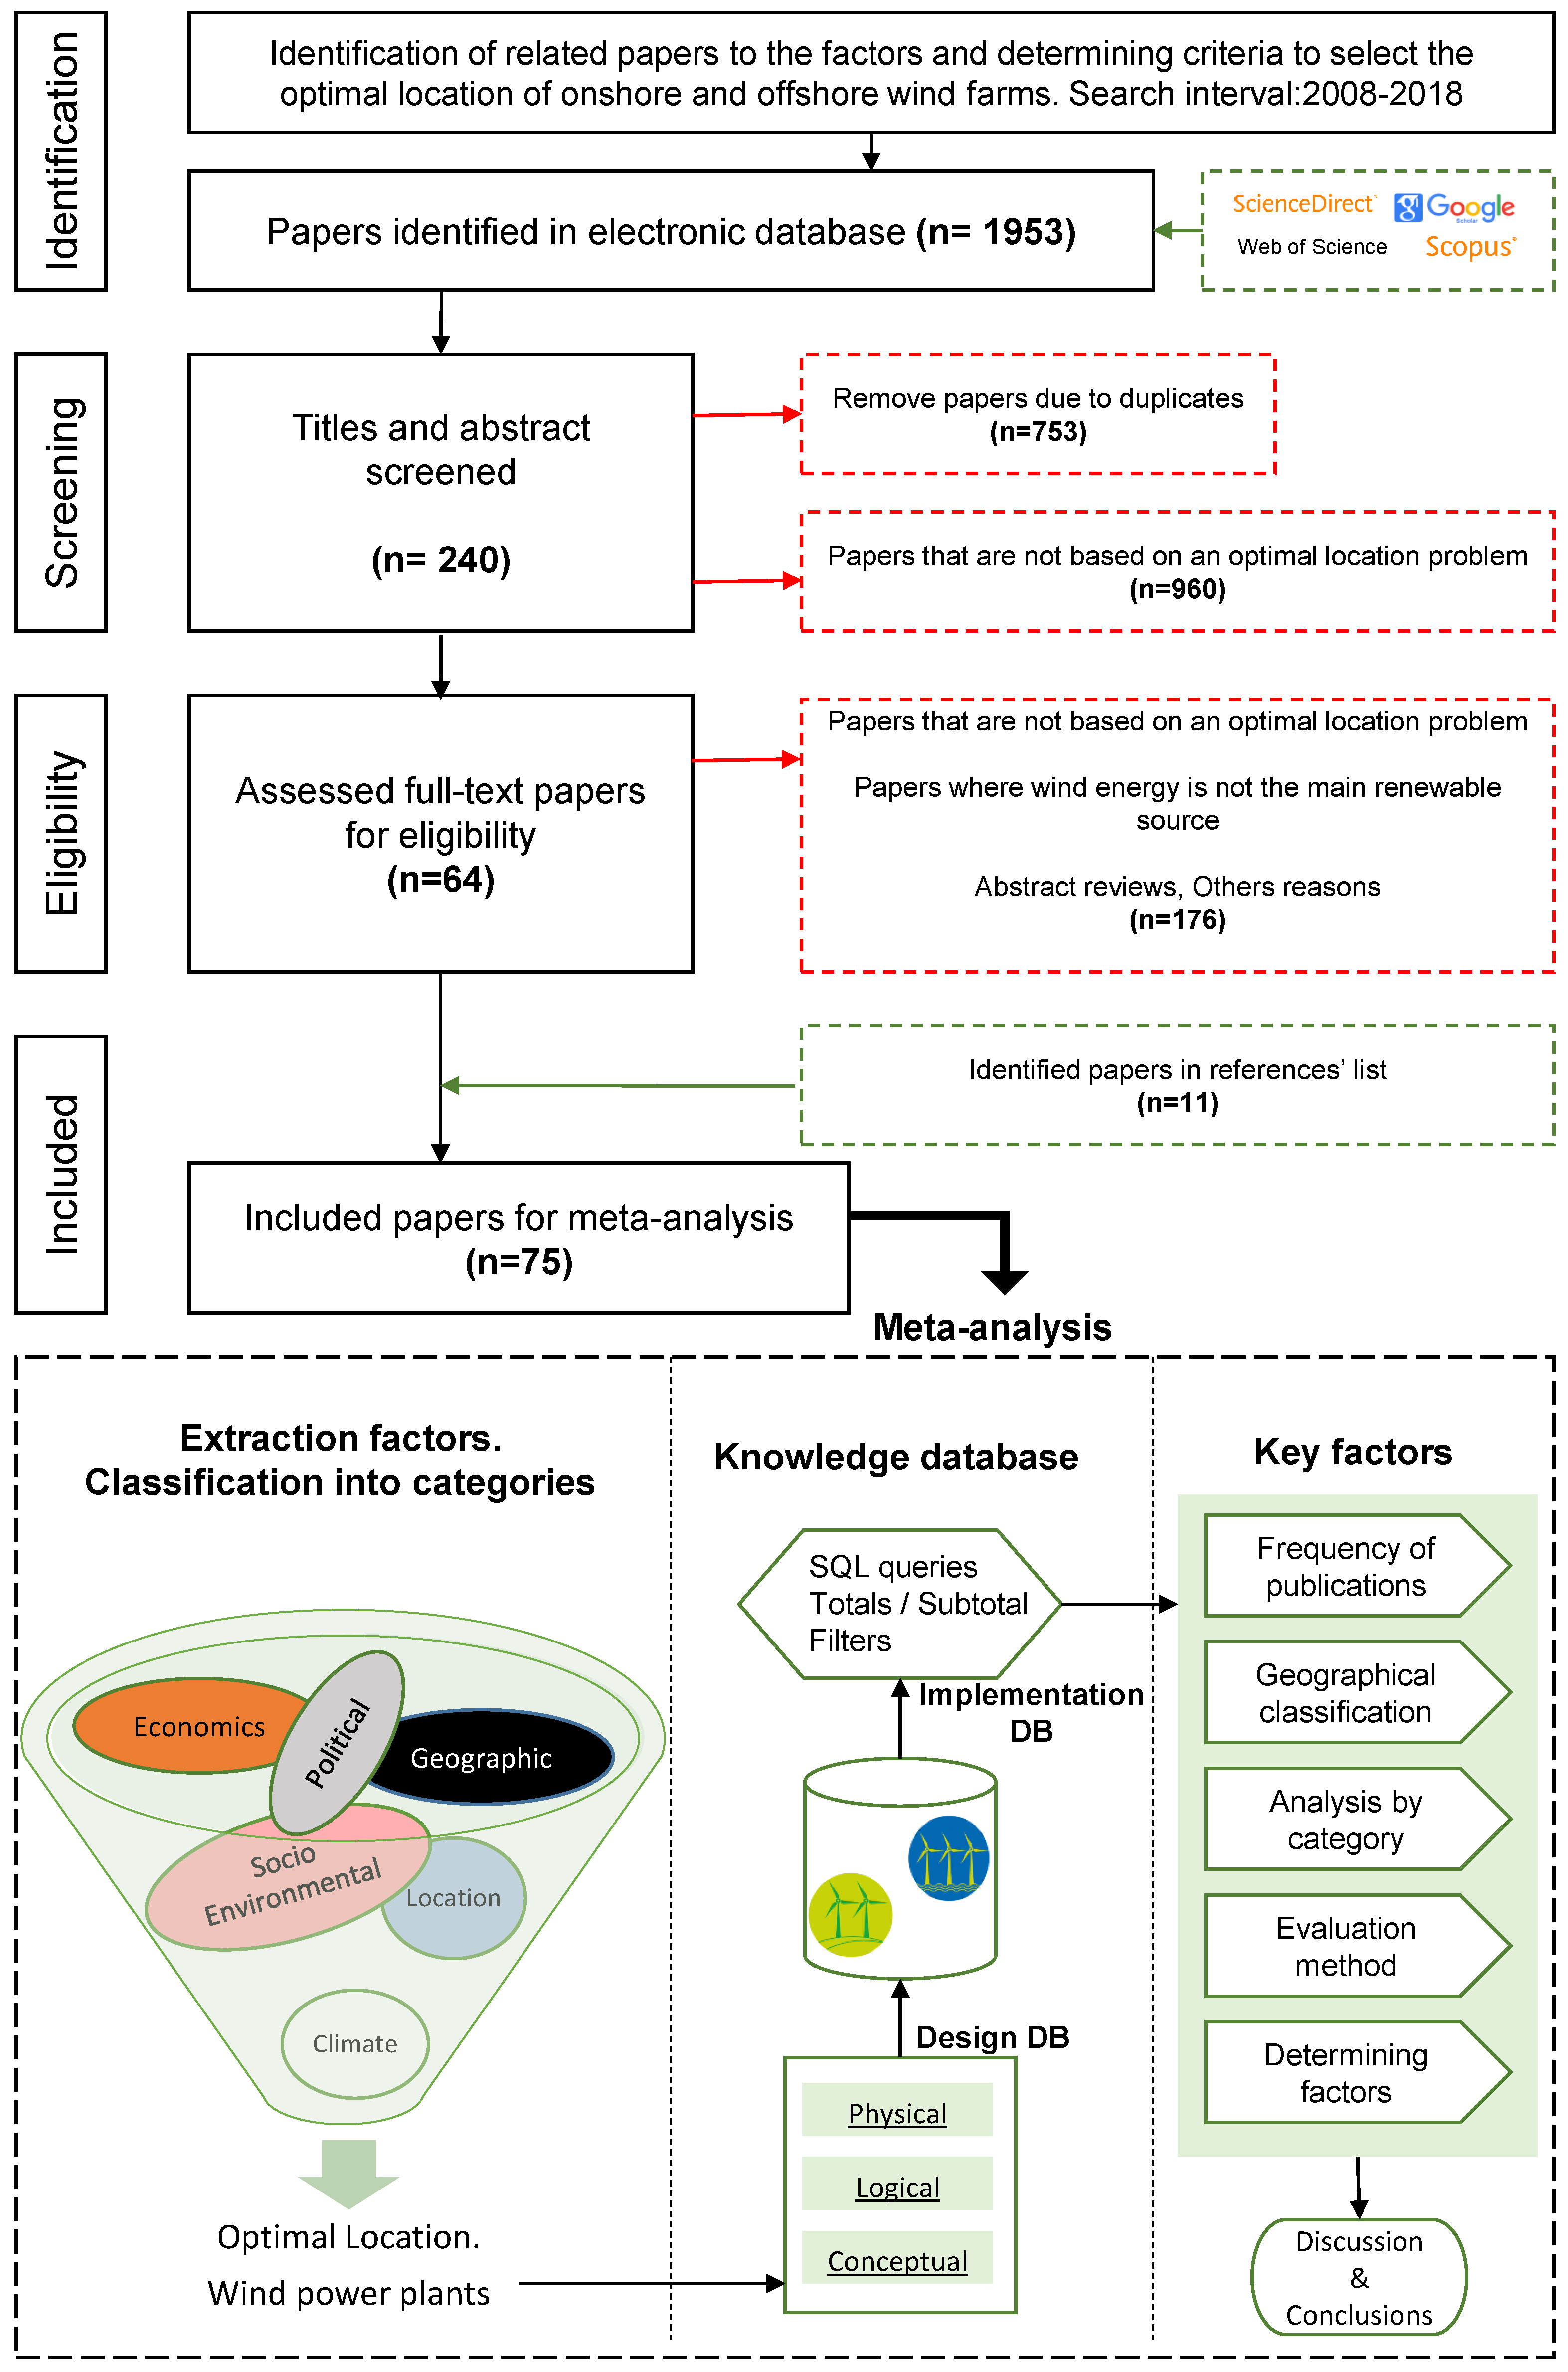
2. Proposed Methodology
2.1. Systematic Review
2.2. Meta-Analysis
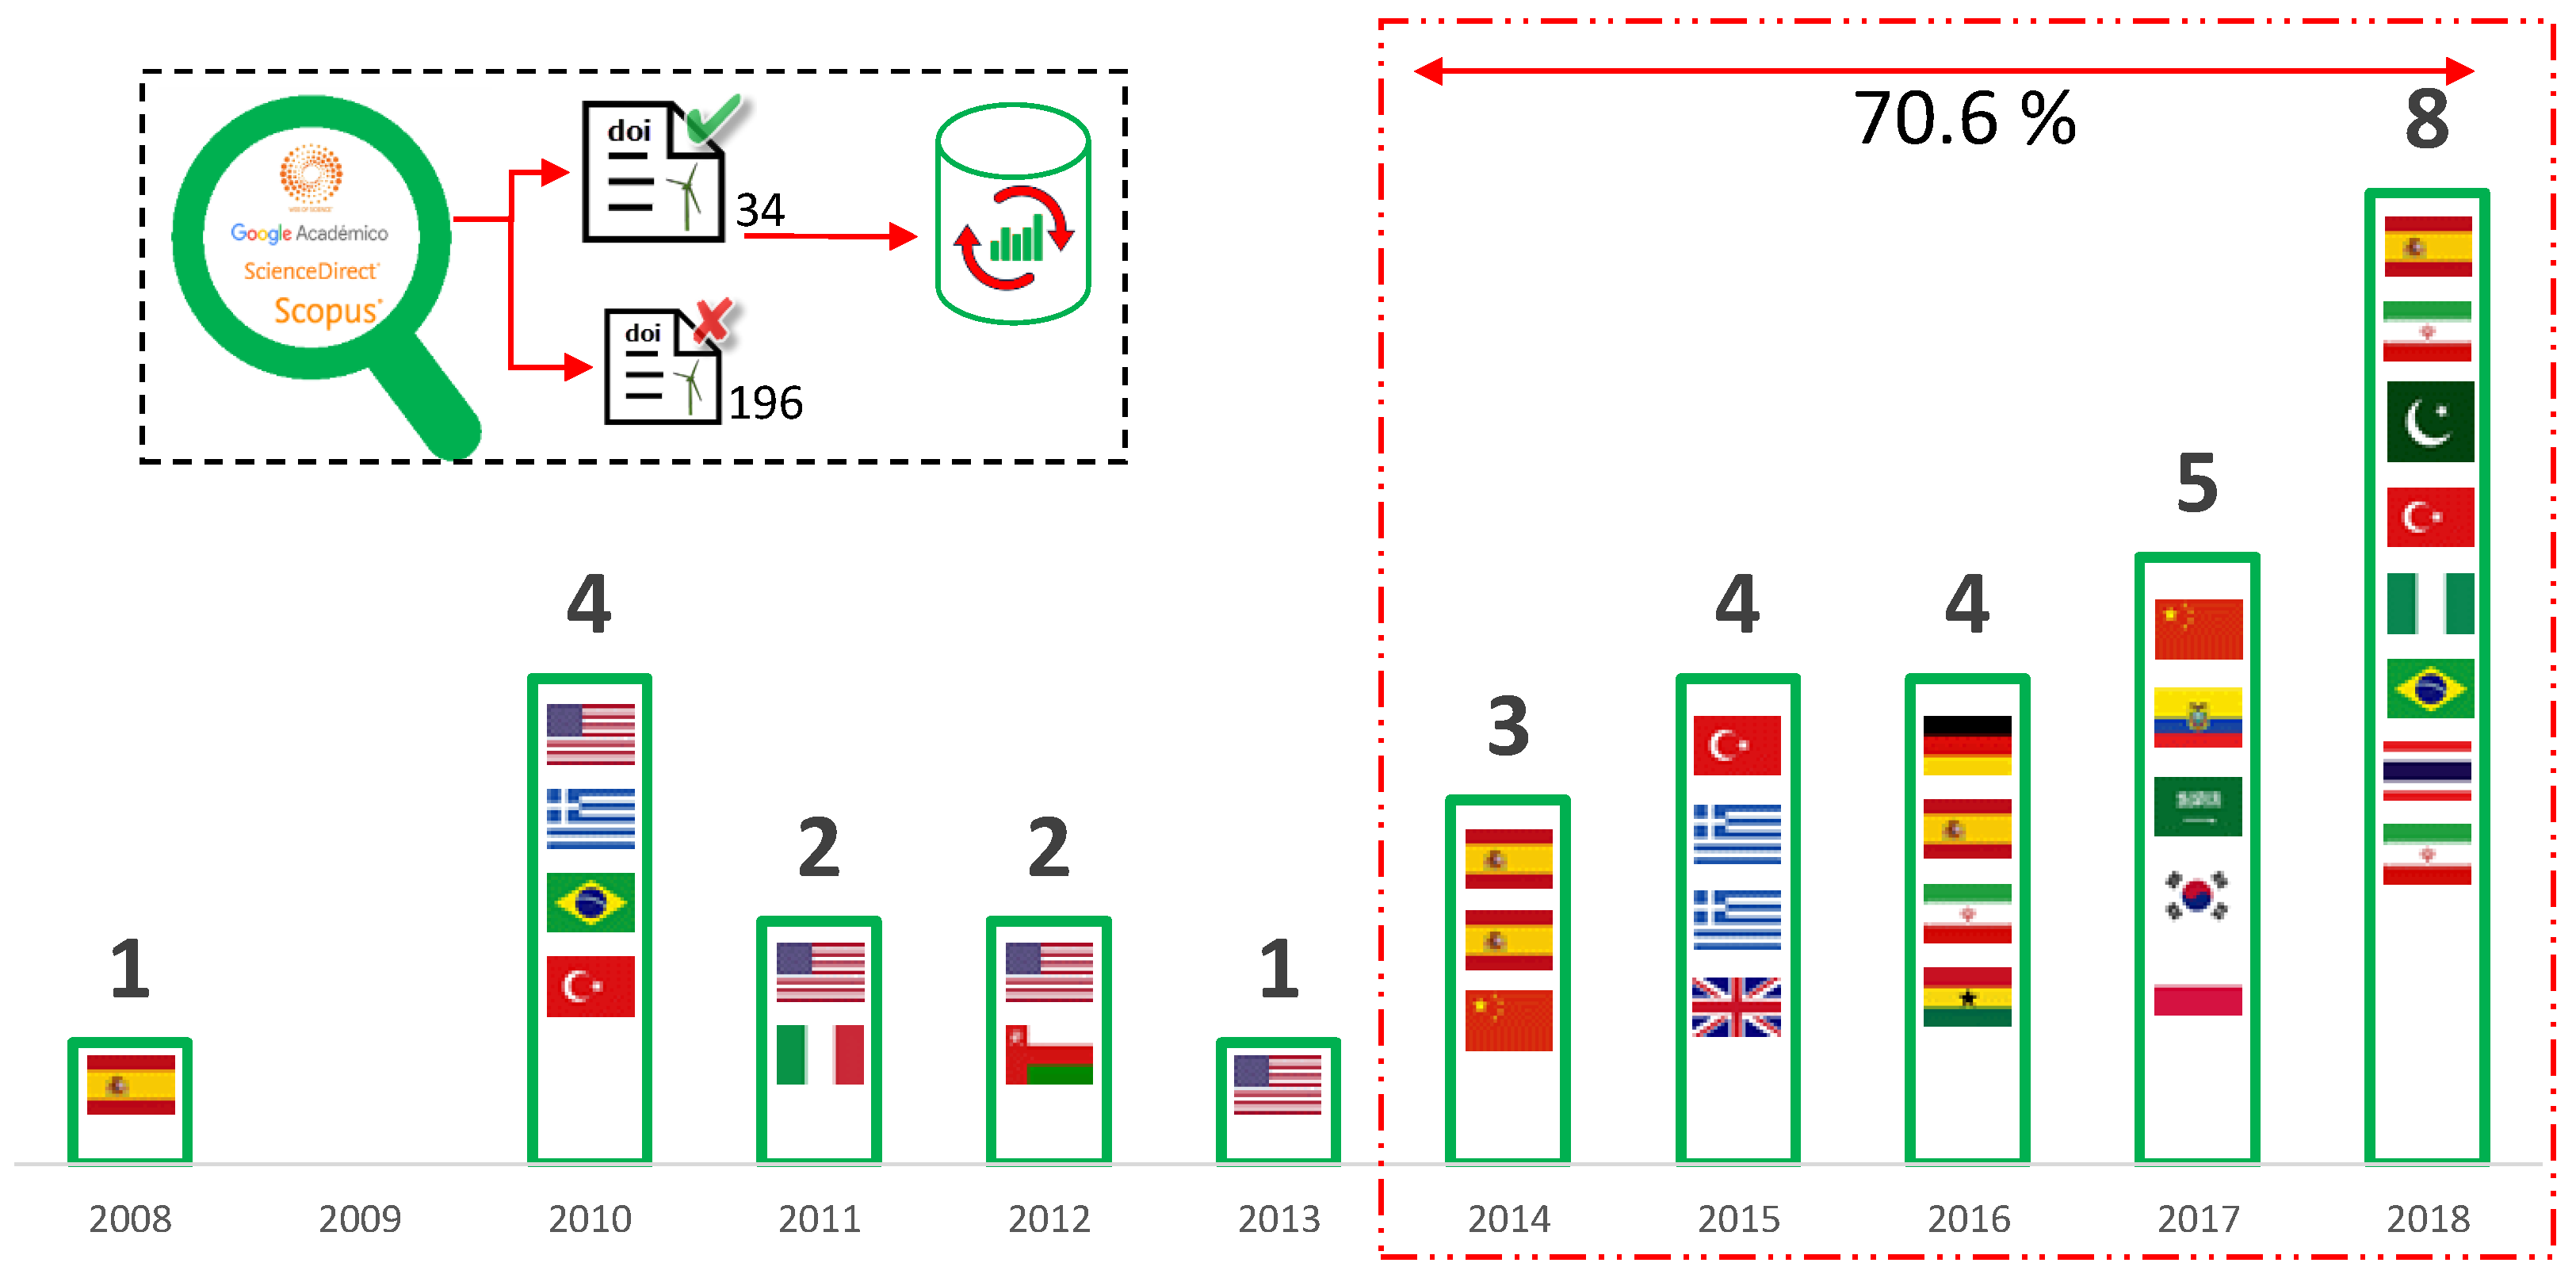
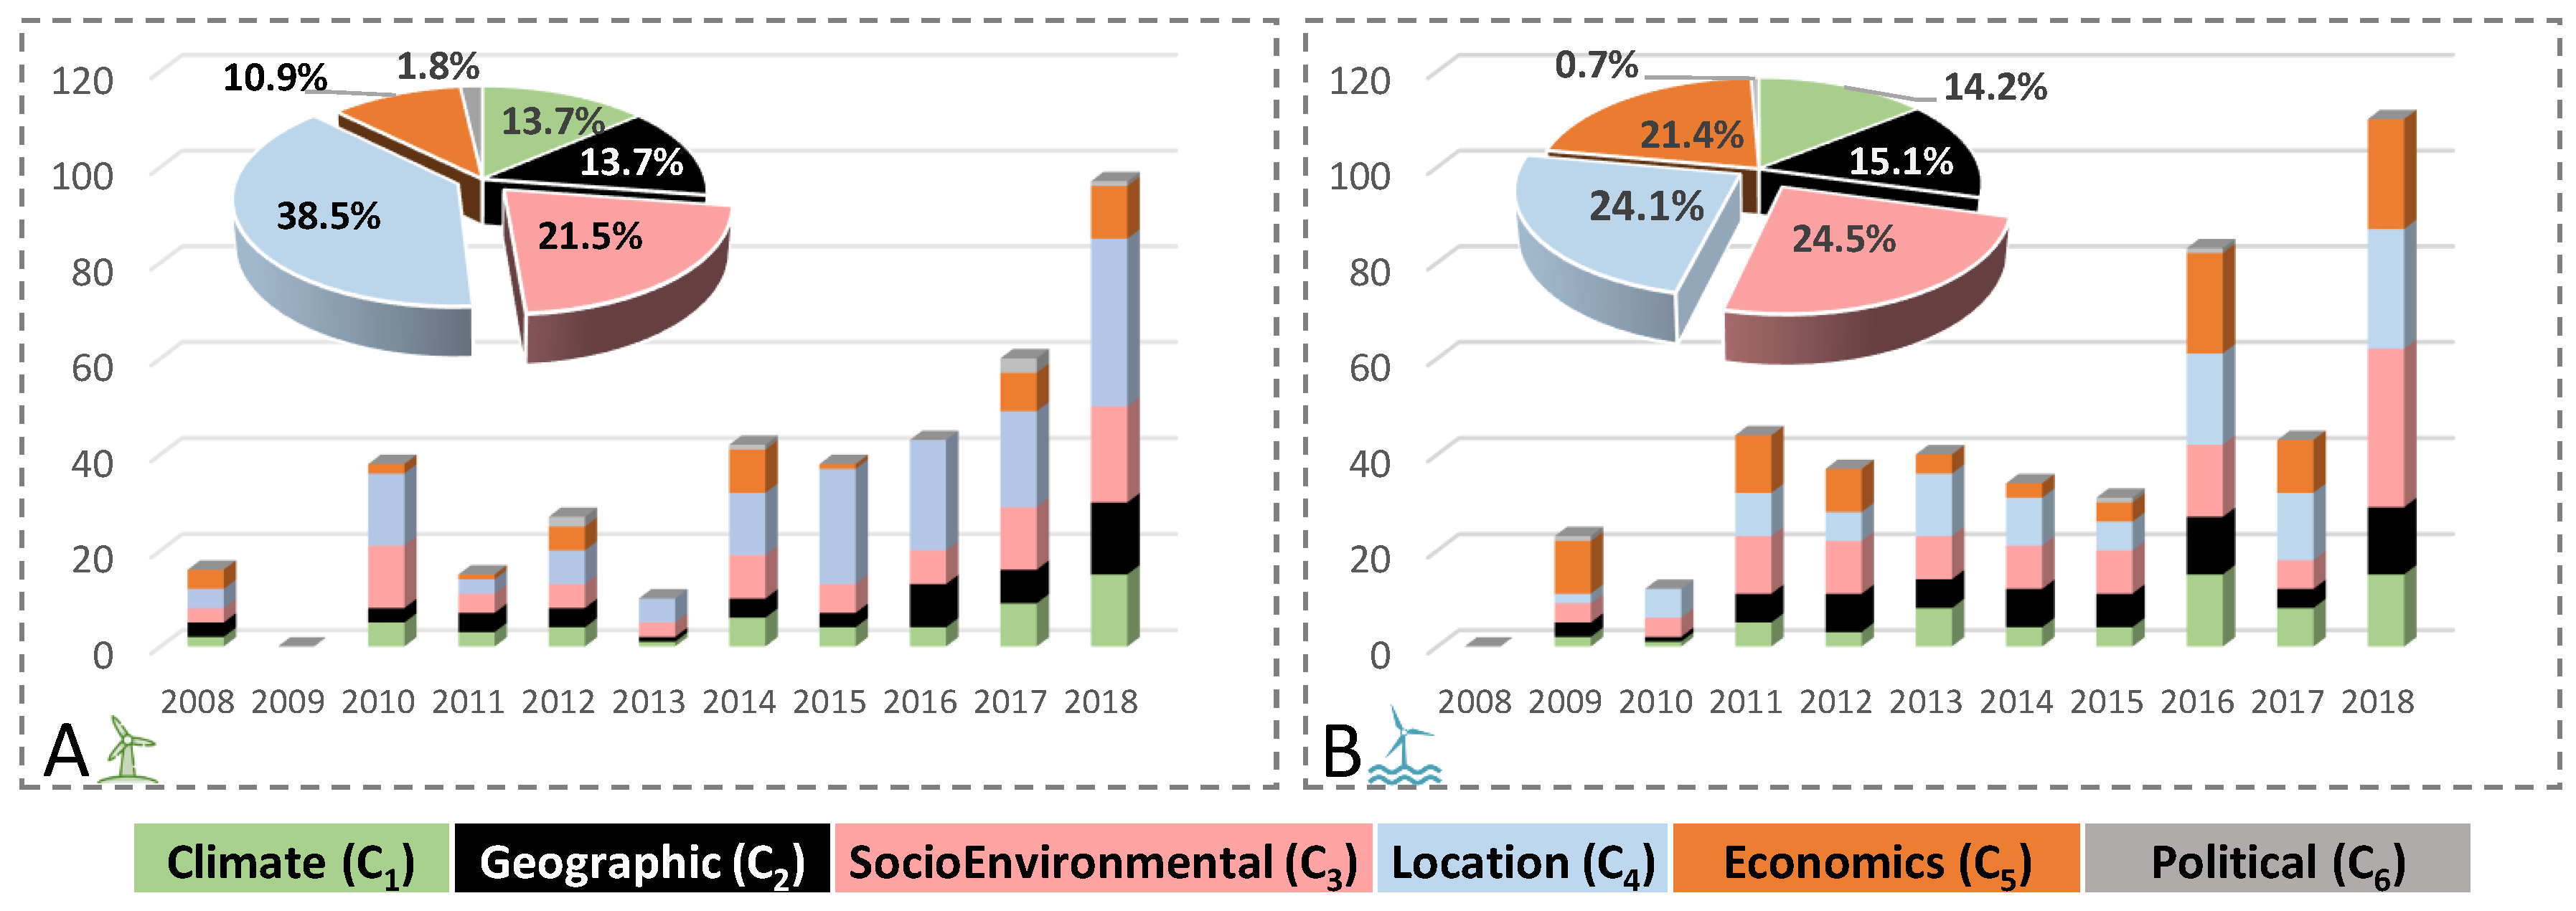
- Frequency of publications: a first analysis of the frequency of annual publications is analyzed to identify the period in which these studies became more relevant.
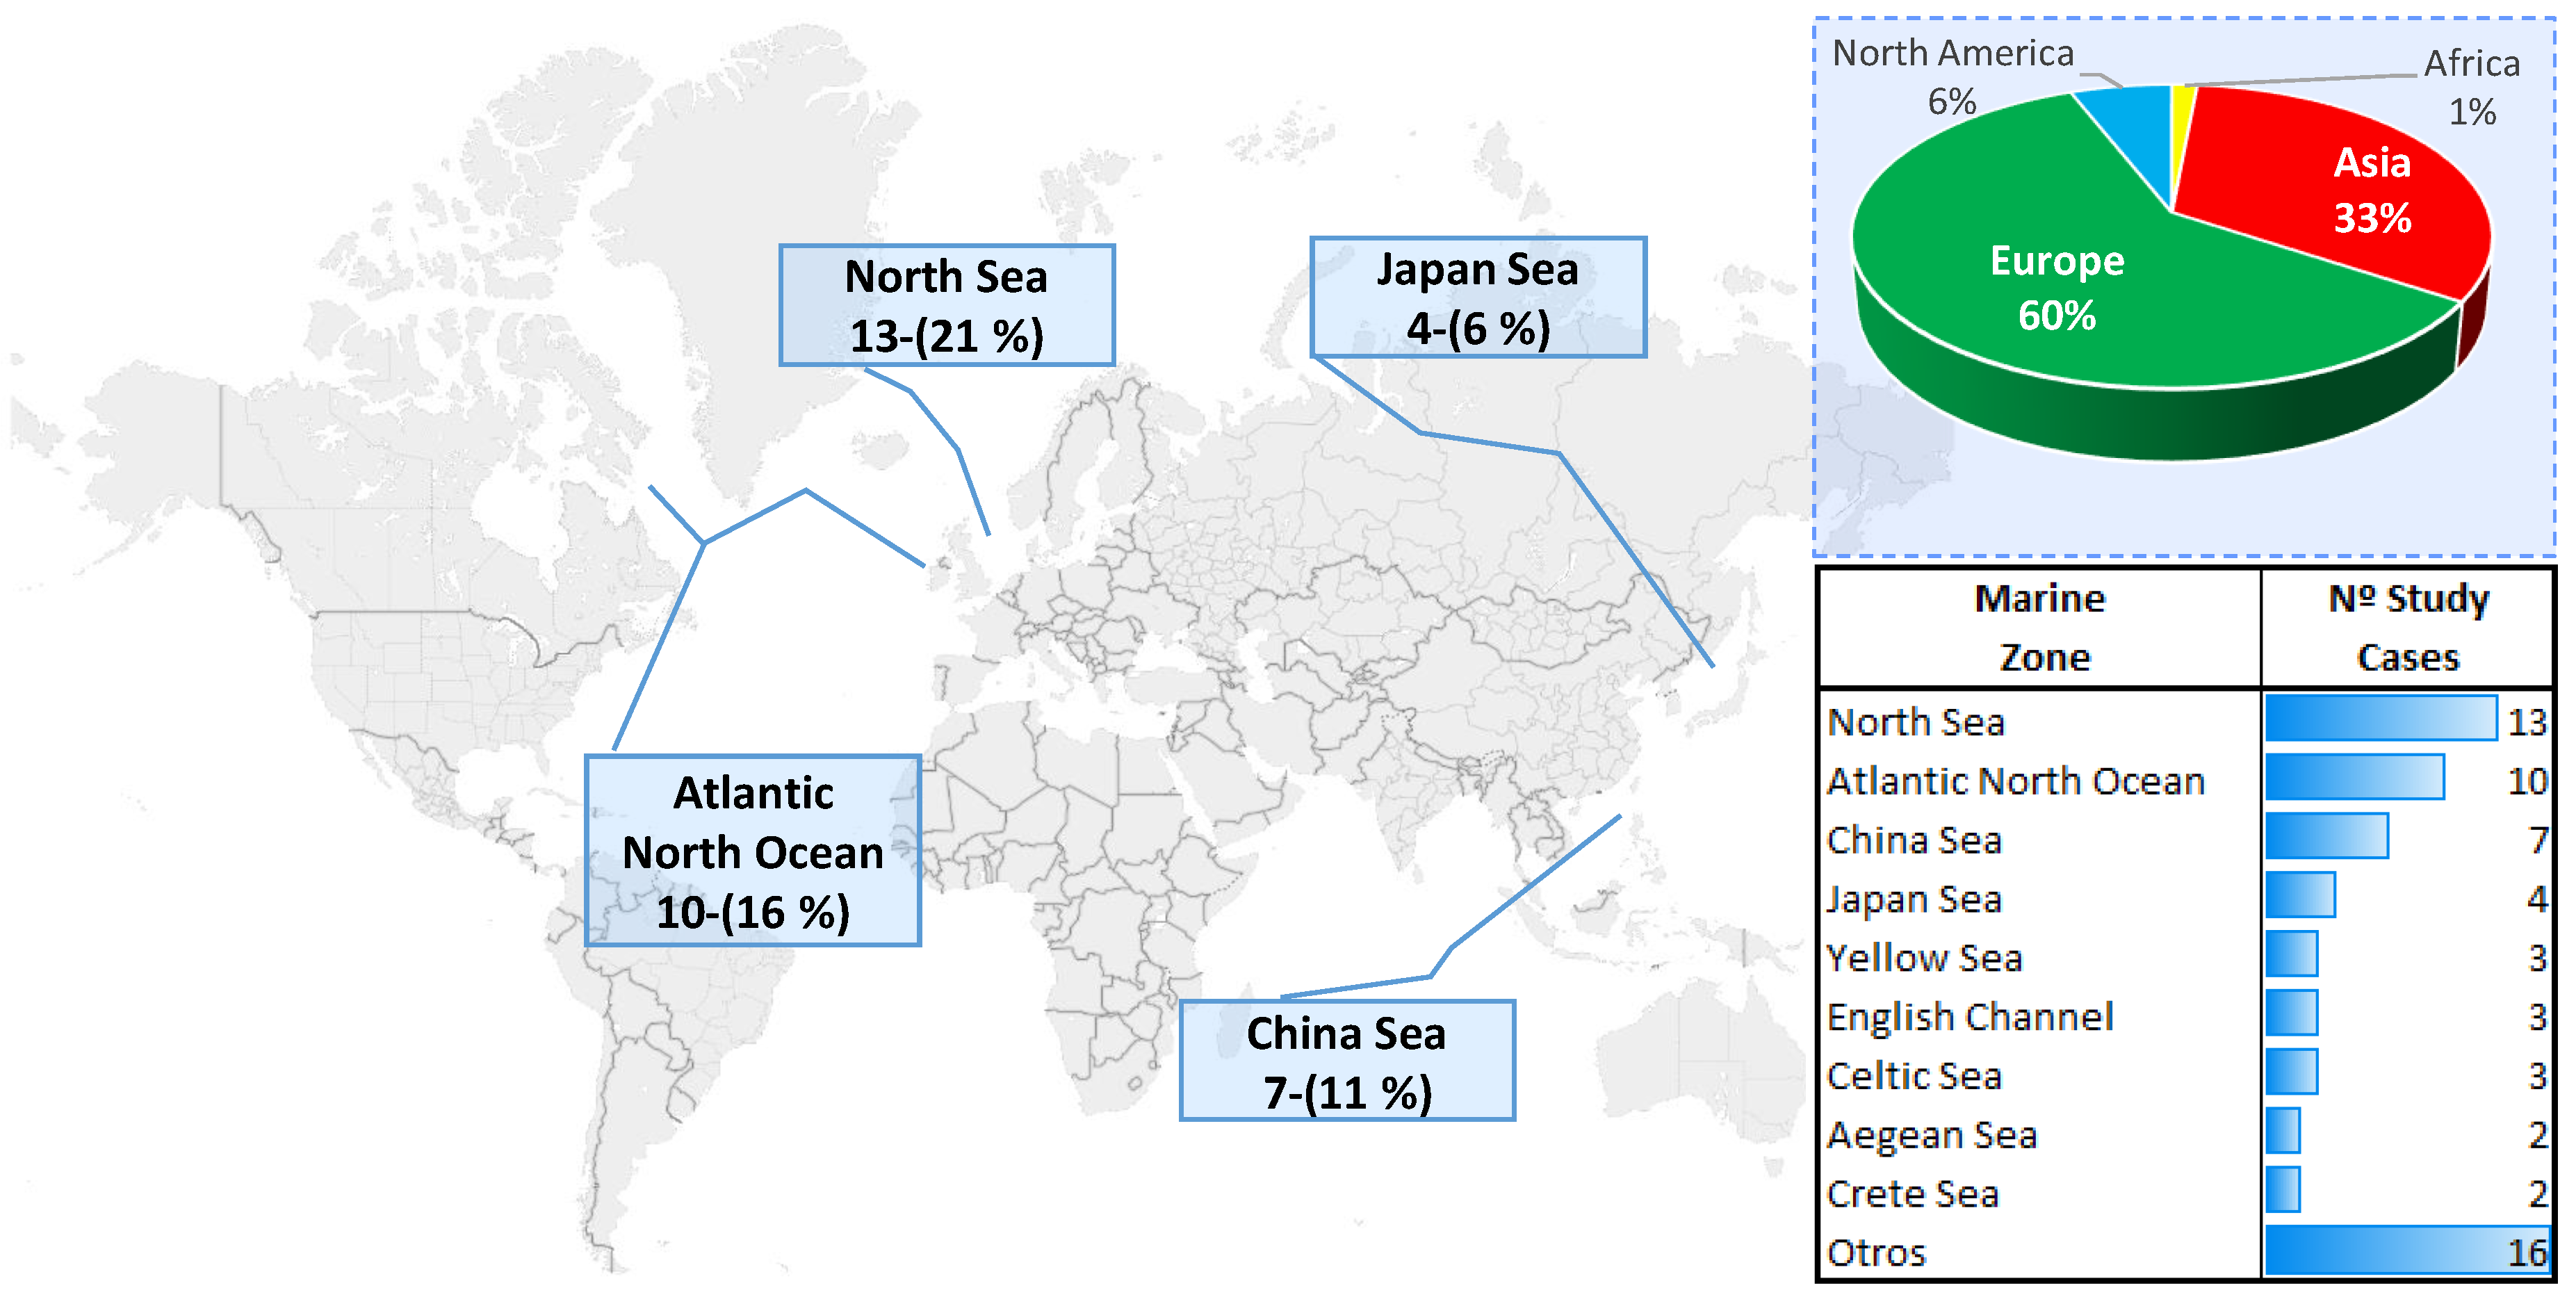
- Geographical classification: to identify the geographical areas with the greatest impact of publications and their possible association with indicators from different fields (governmental measures in favor of renewable energy, social acceptance, etc.) a study is carried out by country, marine area and continent.
- Quantitative analysis: to quantitatively analyze the categories and their associated factors, it is calculated by each contribution the following aspects: the number of times such factors are used in the contributions of each technology (onshore and offshore), and their percentage of use with respect to those contributions.
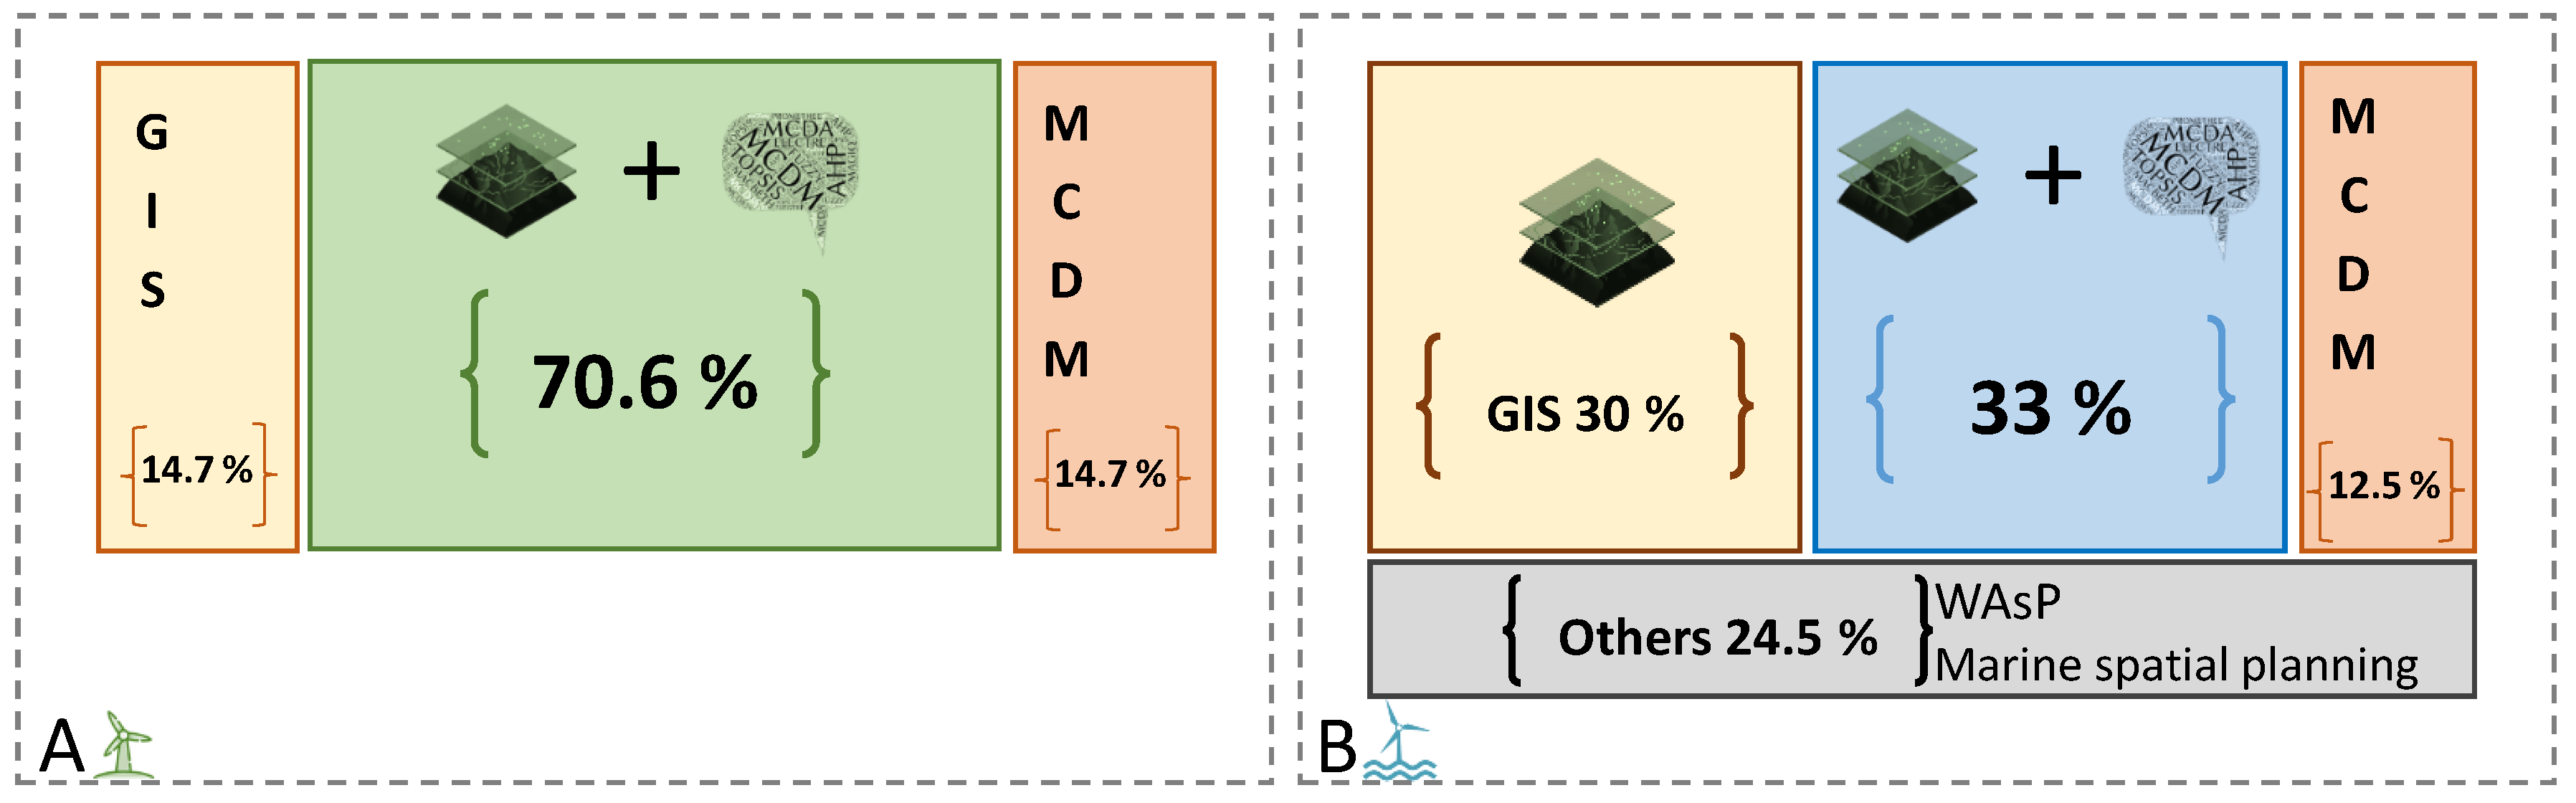
- Evaluation method: in the process of searching for and selecting such optimal locations for wind power plants, it is possible to identify (i) a large amount of spatial information, and (ii) the need to cluster factors and criteria from varied nature which influence with different intensities in the multicriteria decision-making. Many researchers who tried to address the complexity of these investigations have proposed to use Geographic Information System (GIS) tools and/or Multicriteria Decision-Making (MCDM) methods. Given the importance of the methodological development of these contributions, a third indicator can be identified focused on analyzing the percentage of the researchers providing a methodology that combines geographical information systems and MCDM, or they use any of them individually.
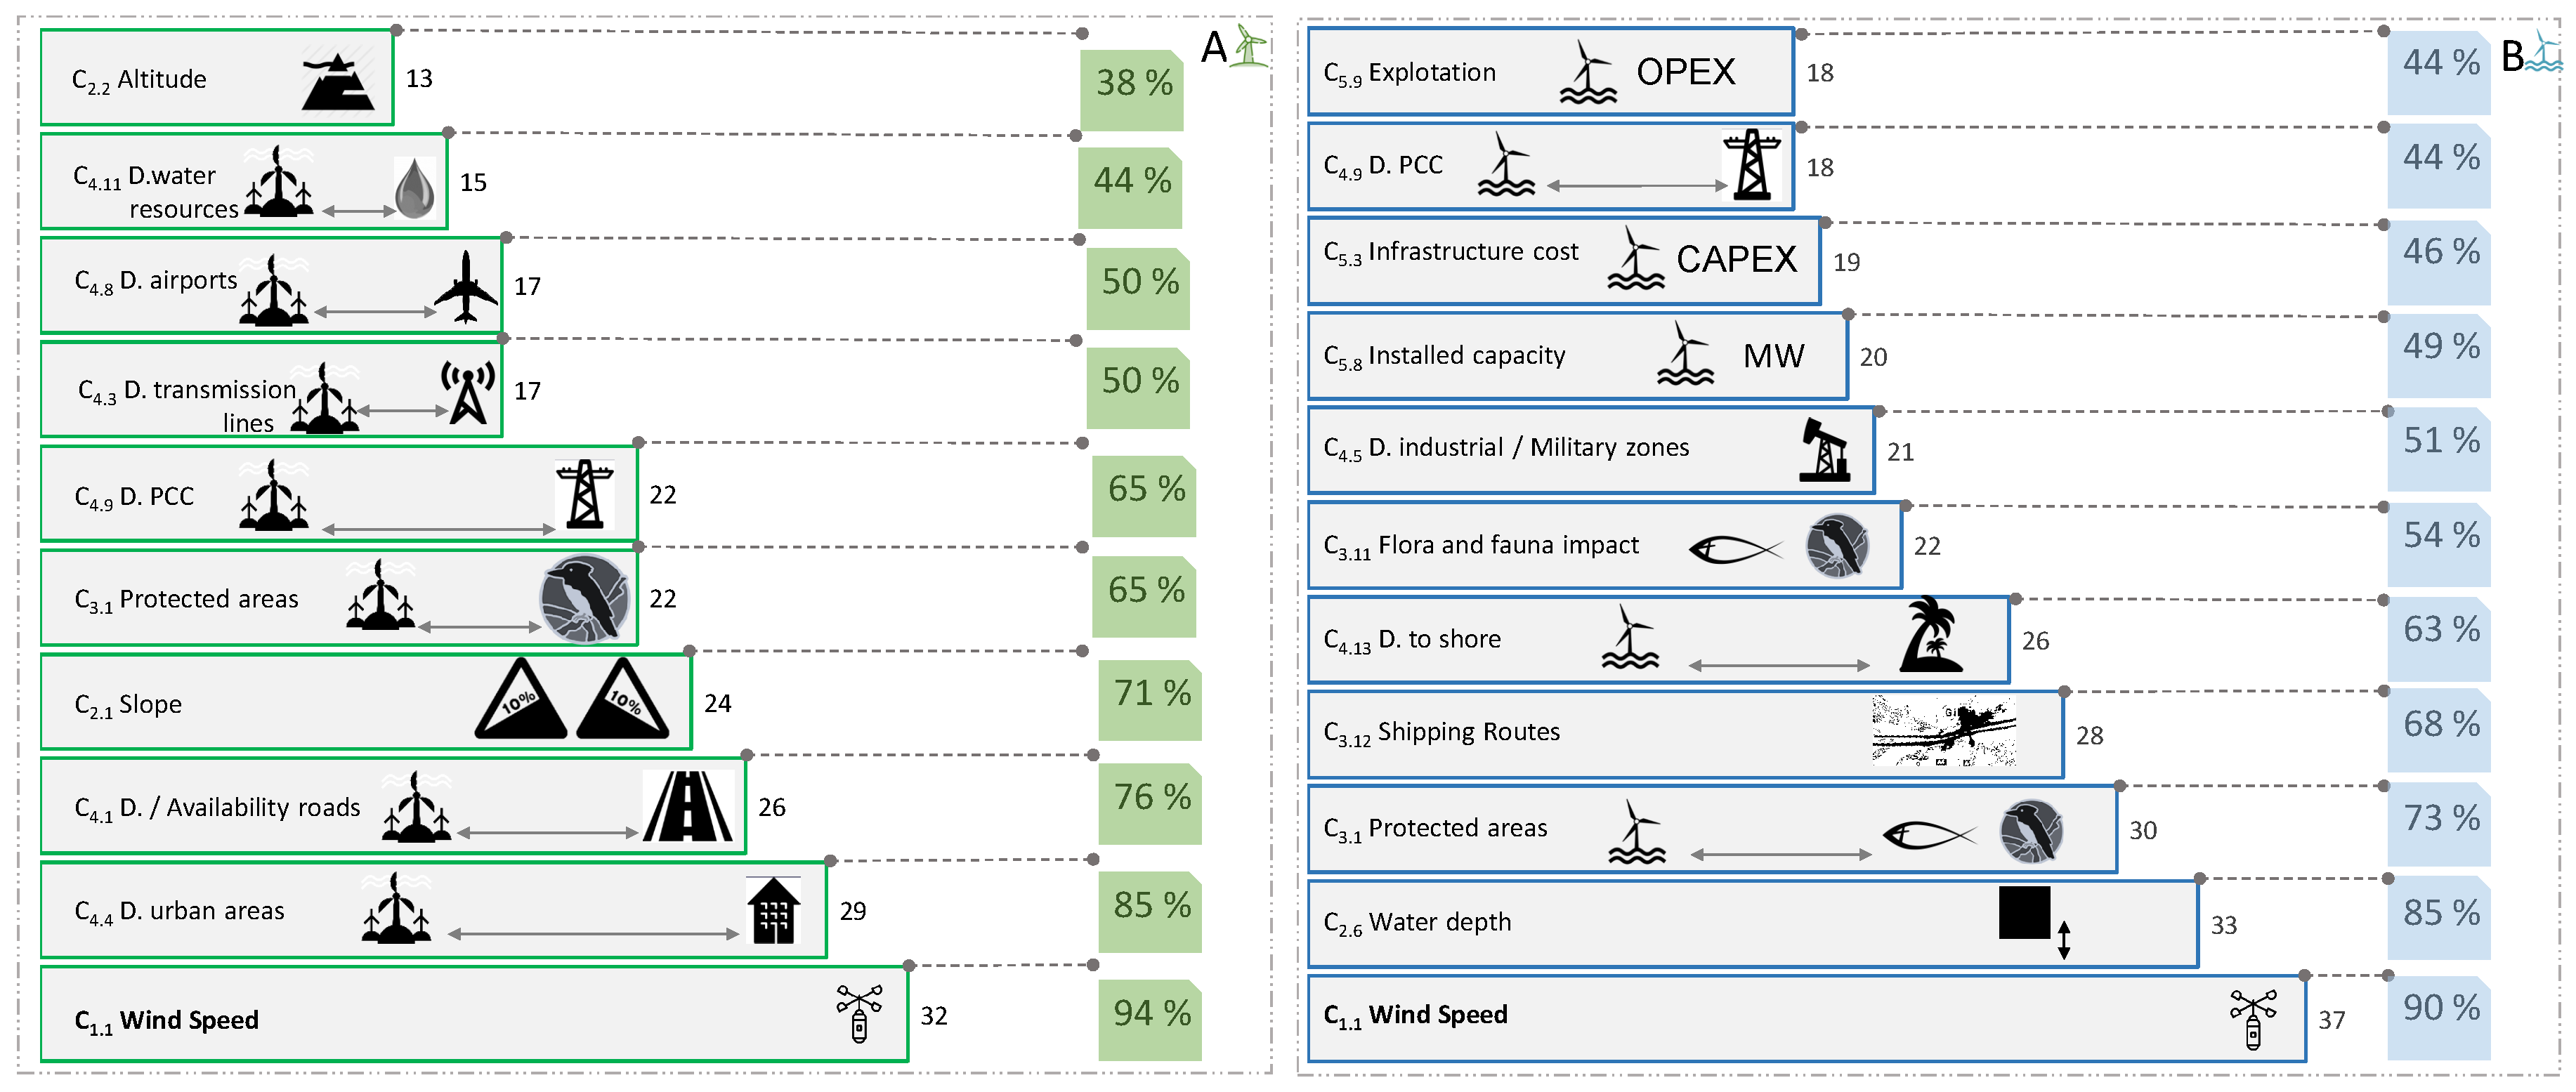
- Determining factors: they are based on the previous analysis. The first ten most relevant determining factors are identified for each onshore and offshore technology.
3. Results and Discussion
3.1. Onshore Analysis. Categorization and Factors
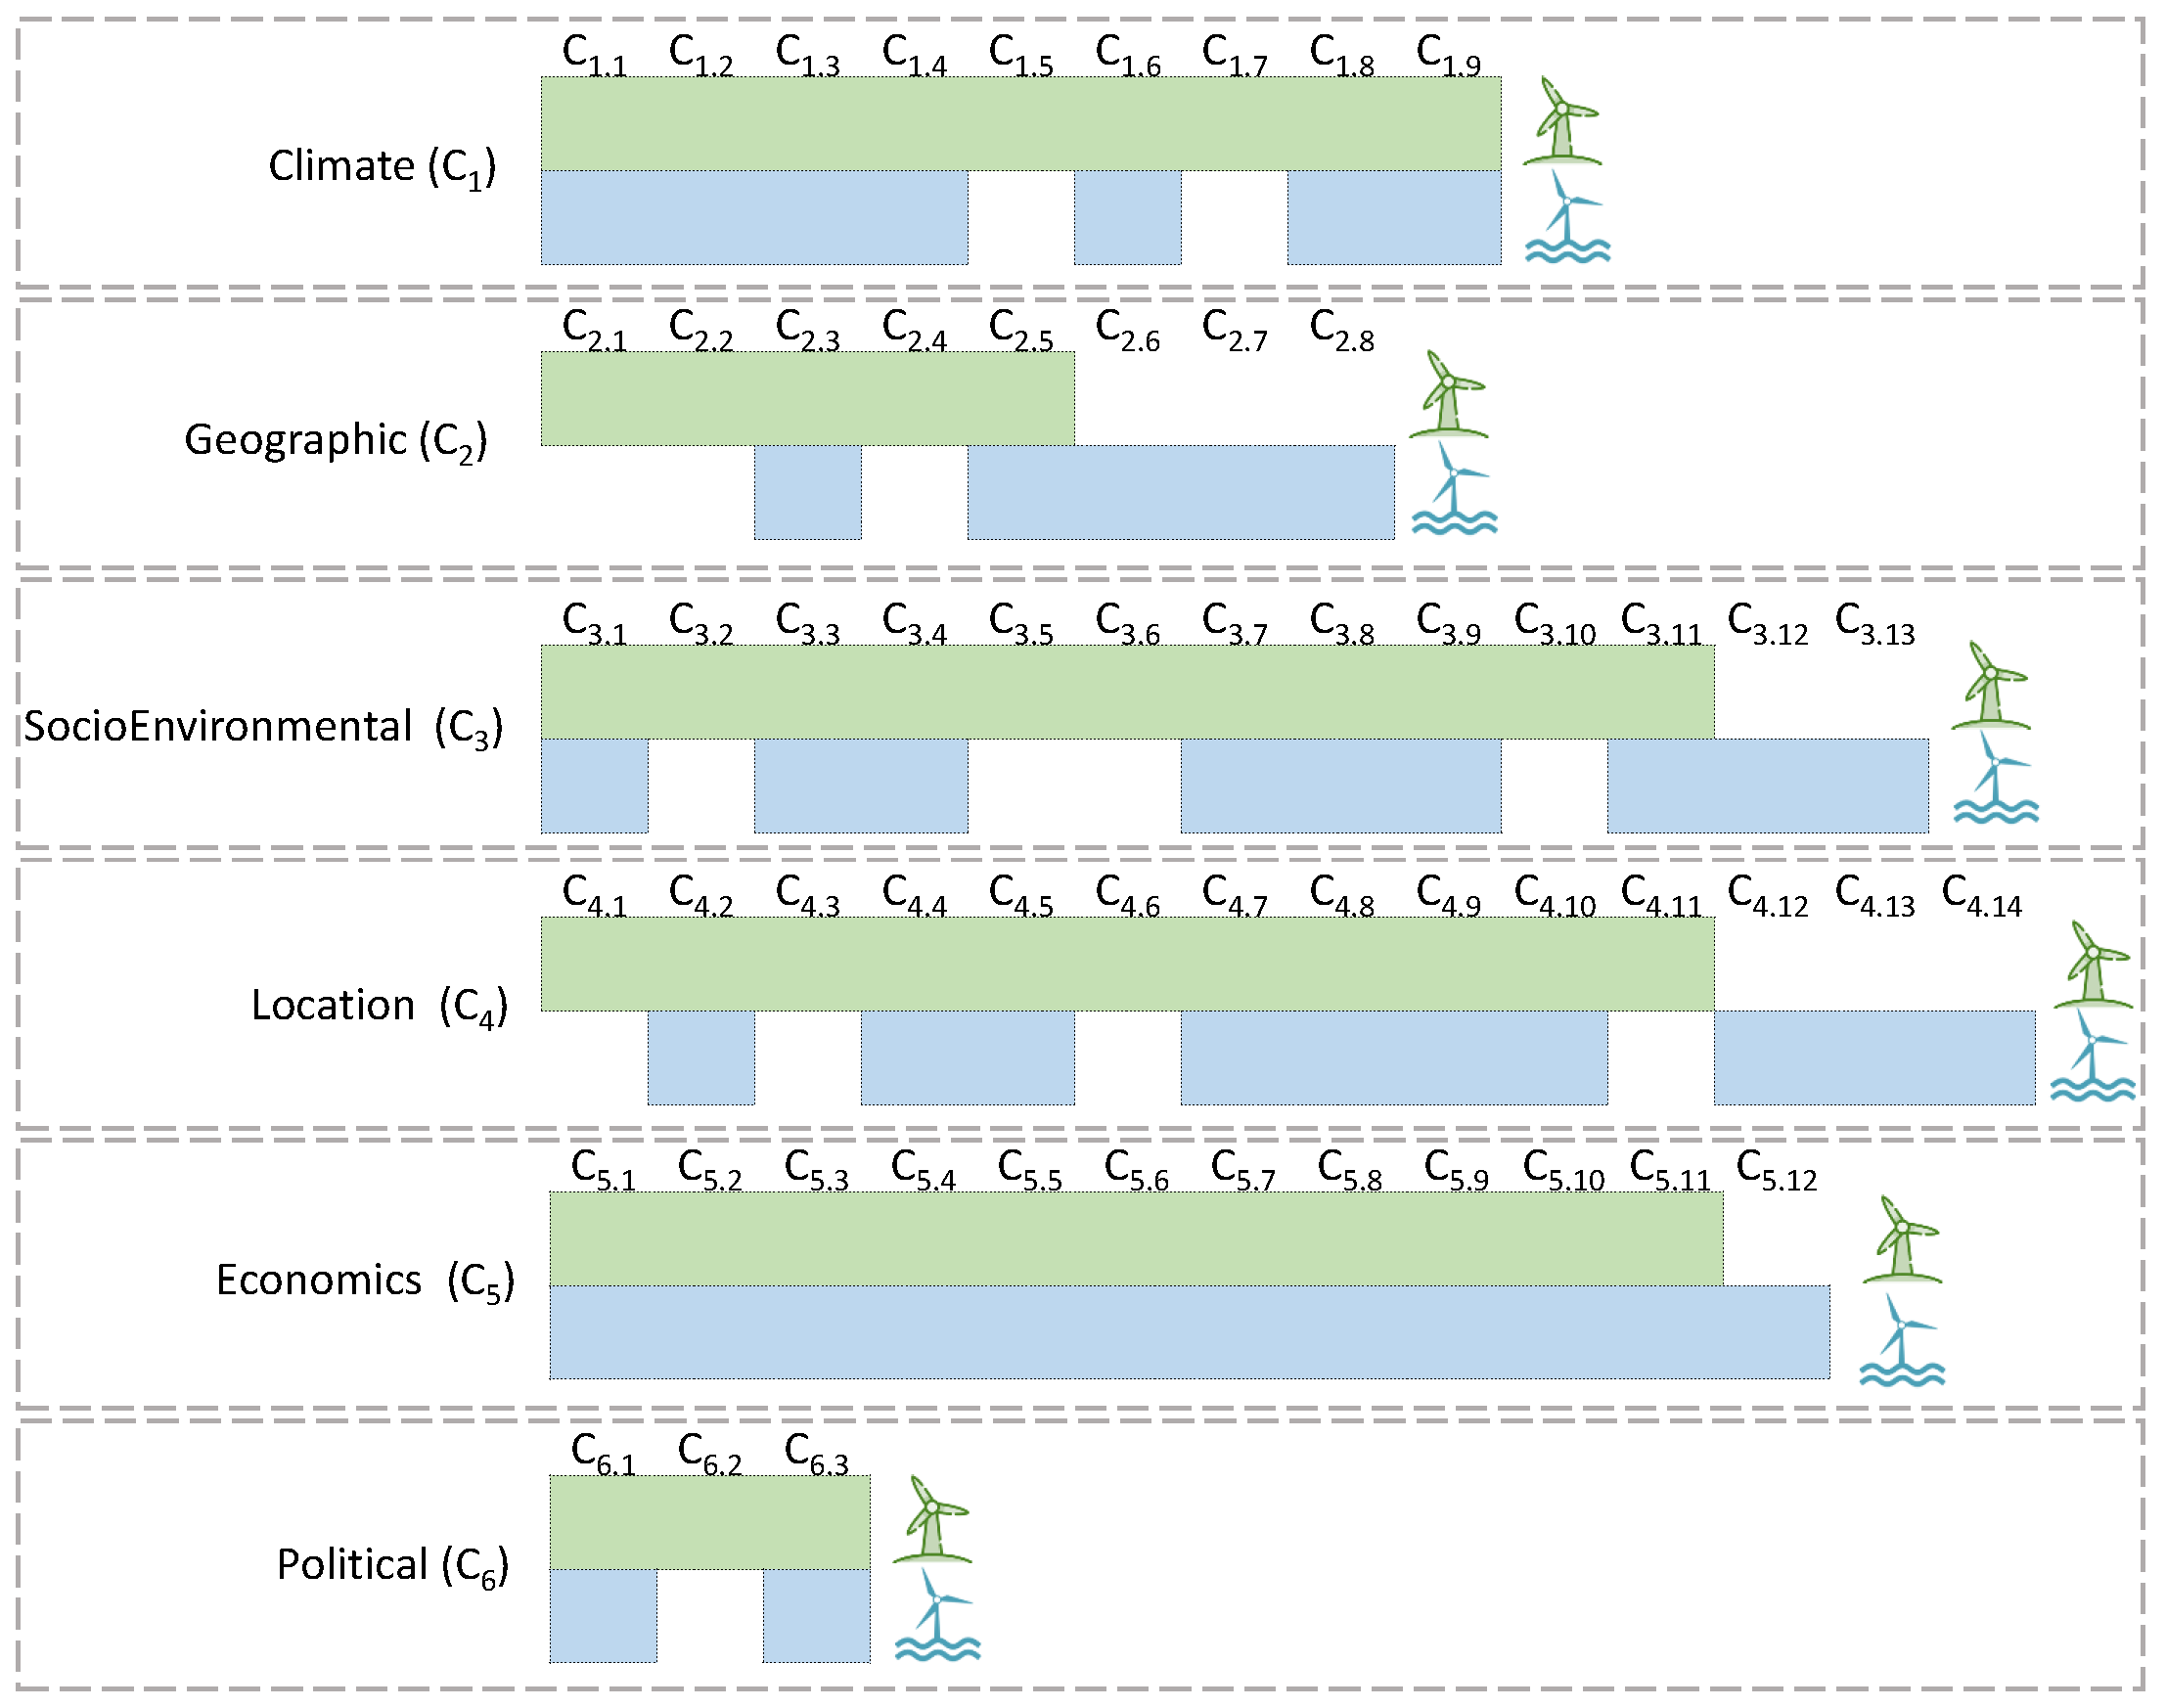
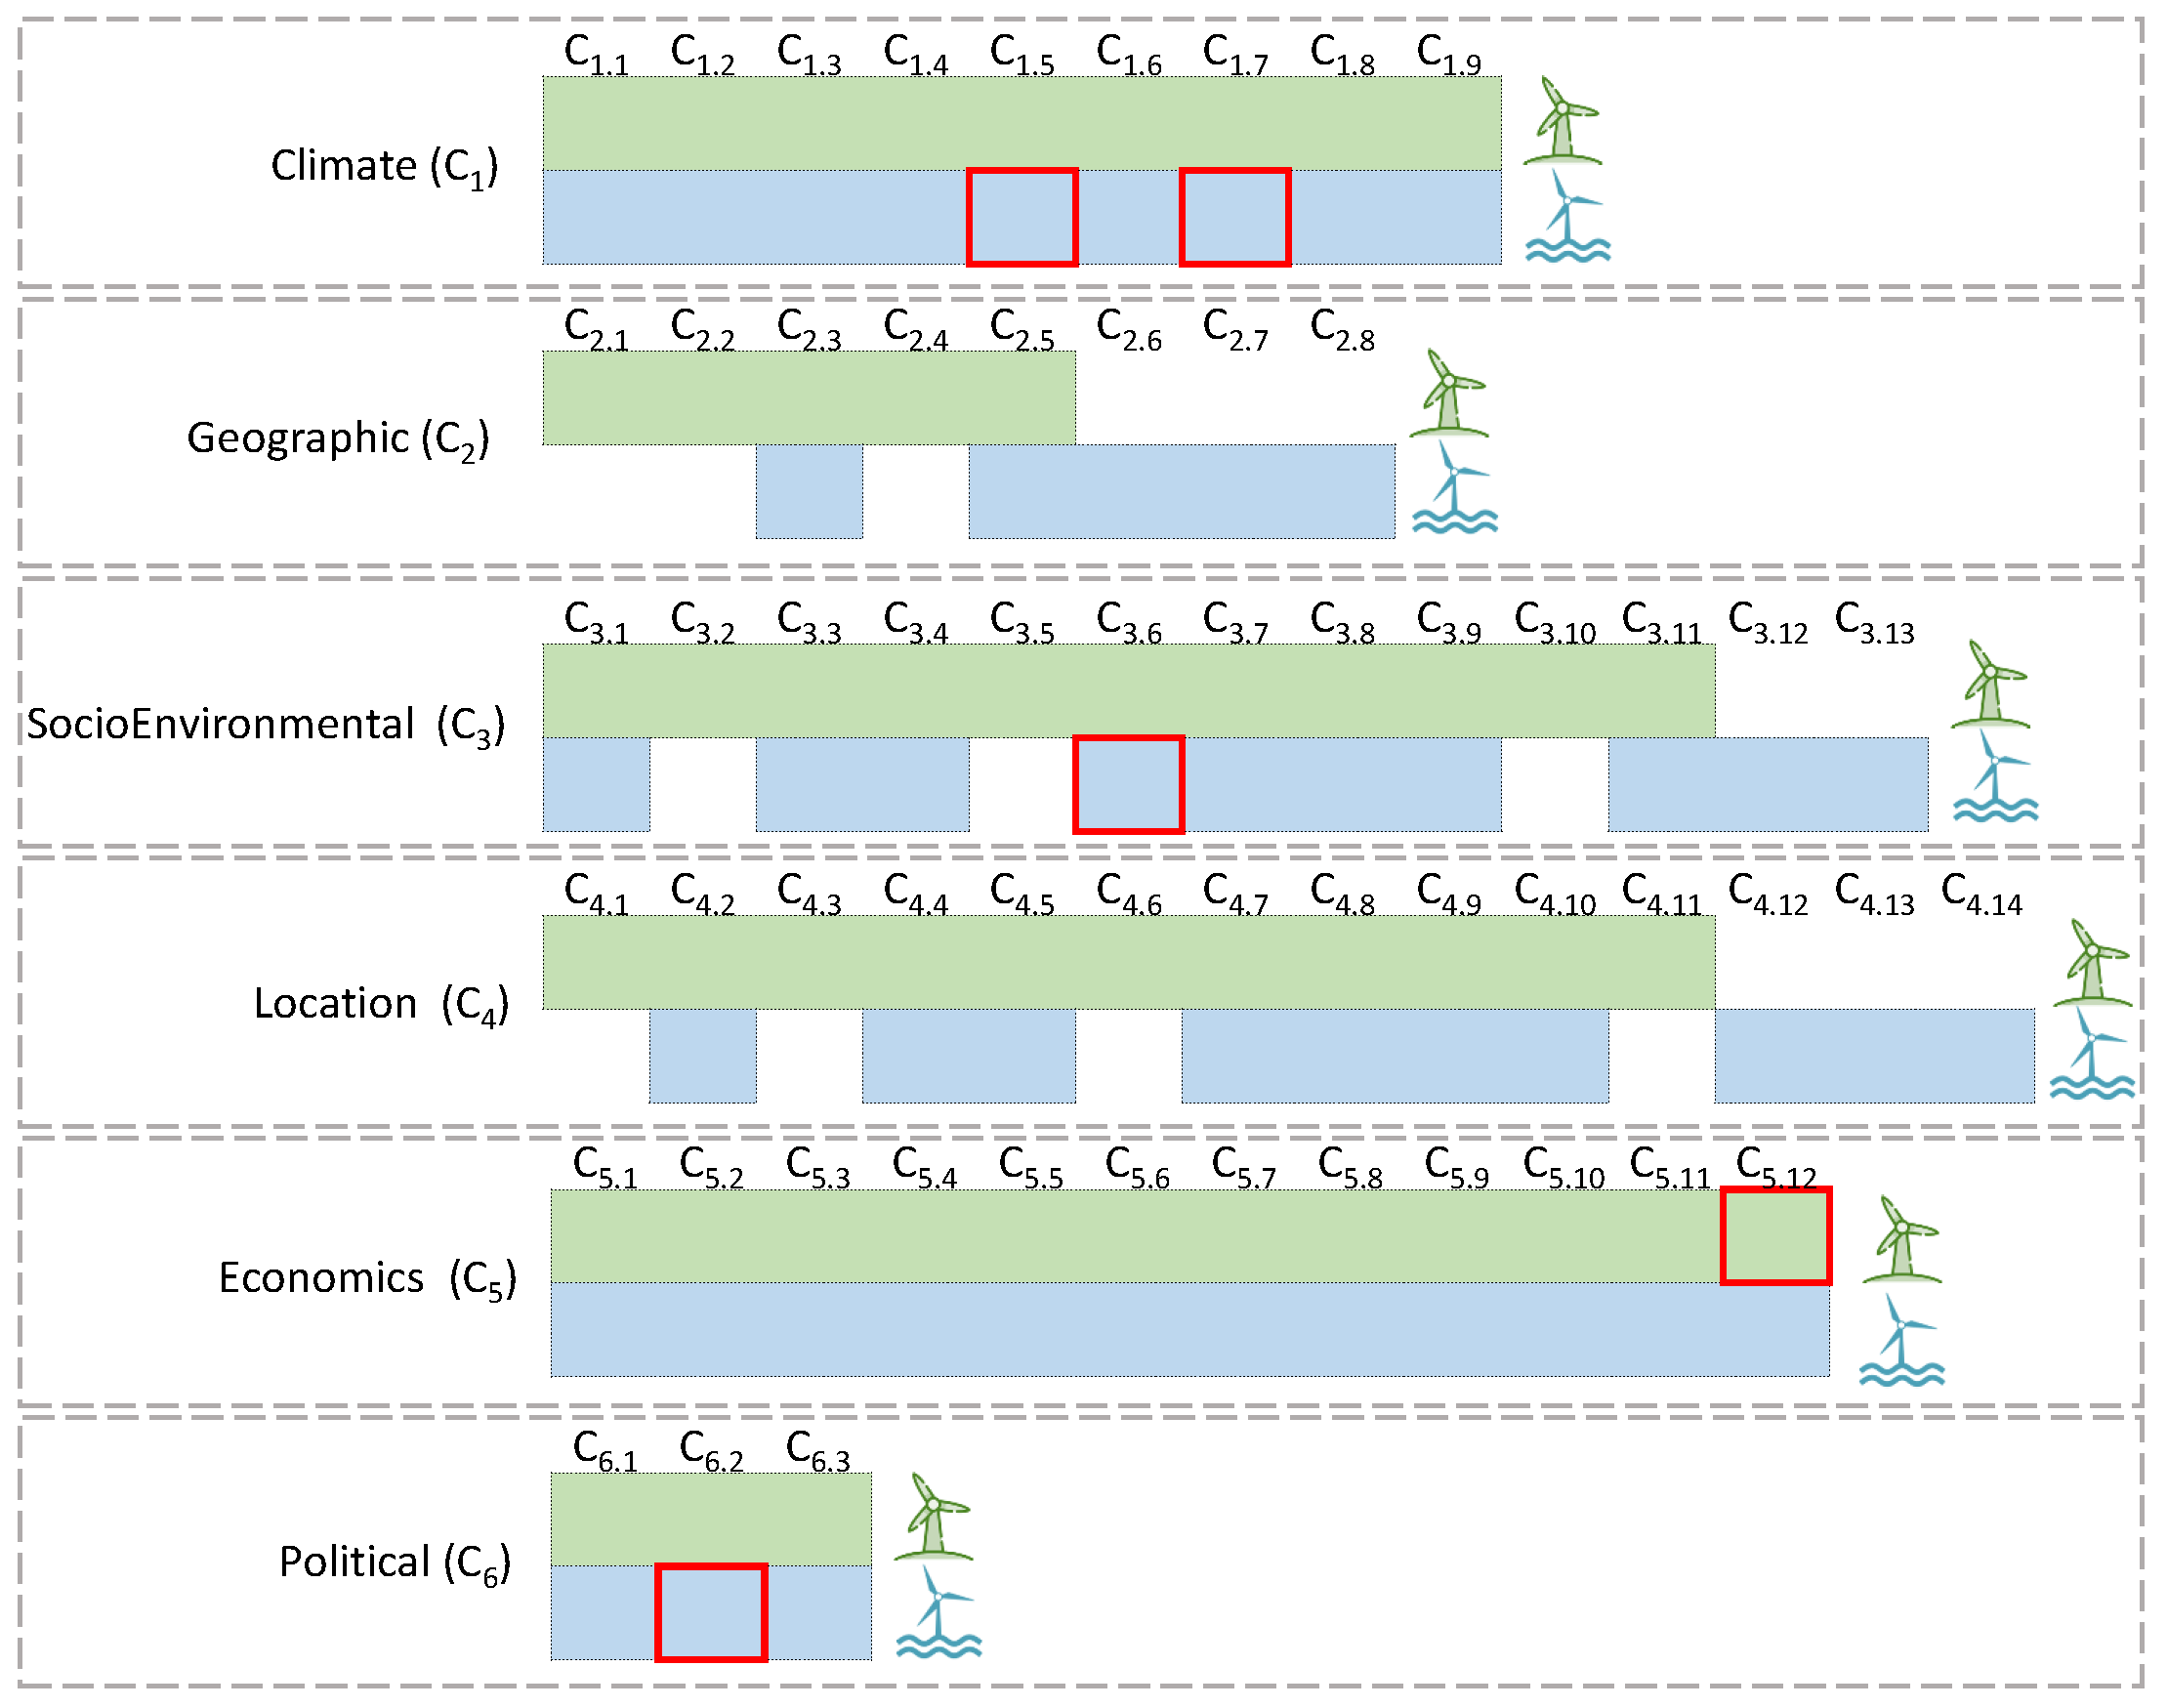
3.1.1. Climate Category ()
3.1.2. Geographic Category ()
3.1.3. Socio-Environmental Category ()
3.1.4. Location Category ()
3.1.5. Economic Category ()
3.1.6. Political Category ()
3.2. Offshore Analysis. Categories and Factors
3.2.1. Climate Category ()
3.2.2. Geographic Category ()
3.2.3. Socio-Environmental Category ()
3.2.4. Location Category ()
3.2.5. Economic Category ()
3.2.6. Political Category ()
3.3. Final Discussion
3.3.1. Categories: Comparison and Statistics
3.3.2. Methodologies: Comparison and Statistics
3.3.3. Relevant Factors: Comparison and Statistics
4. Conclusions
Author Contributions
Funding
Acknowledgments
Conflicts of Interest
Abbreviations
| AHP | Analytic Hierarchy Process |
| DSS | Decision Support System |
| FAHP | Fuzzy Analytic Hierarchy Process |
| GIS | Geographic Information System |
| OWA | Ordered Weighted Average |
| MCDM | Multicriteria Decision-Making |
| MCE | Multicriteria Evaluation |
| PCC | Point of Common Coupling |
| PRISMA | Preferred Reporting Items for Systematic Reviews and Meta-Analyses |
| SDSS | Spatial Decision Support Systems |
| SMAA | Stochastic Multicriteria Acceptability Analysis |
| SMCA | Spatial Multicriteria Analysis |
| WLC | Weighted Liner Composition |
References
- Hoehne, C.G.; Chester, M.V. Greenhouse gas and air quality effects of auto first-last mile use with transit. Transp. Res. Part D Transp. Environ. 2017, 53, 306–320. [Google Scholar] [CrossRef]
- Zerta, M.; Schmidt, P.R.; Stiller, C.; Landinger, H. Alternative World Energy Outlook (AWEO) and the role of hydrogen in a changing energy landscape. Int. J. Hydrog. Energy 2008, 33, 3021–3025. [Google Scholar] [CrossRef]
- Nicolini, M.; Tavoni, M. Are renewable energy subsidies effective? Evidence from Europe. Renew. Sustain. Energy Rev. 2017, 74, 412–423. [Google Scholar] [CrossRef]
- Adib, R. Renewable Energy Policy Network for the 21st Century (REN21); Renewables 2018 Global Status Report; REN21 Secretariat: Paris, France, 2018. [Google Scholar]
- La Camera, F. Global Energy Transformation: A Roadmap to 2050, International Renewable Energy Agency; Technical Report; International Renewable Energy Agency (IRENA): Abu Dhabi, UAE, 2018. [Google Scholar]
- Moher, D.; Liberati, A.; Tetzlaff, J.; Altman, D.G. Preferred reporting items for systematic reviews and meta-analyses: The PRISMA statement. Int. J. Surg. 2010, 8, 336–341. [Google Scholar] [CrossRef] [PubMed]
- Mardani, A.; Zavadskas, E.K.; Streimikiene, D.; Jusoh, A.; Khoshnoudi, M. A comprehensive review of data envelopment analysis (DEA) approach in energy efficiency. Renew. Sustain. Energy Rev. 2017, 70, 1298–1322. [Google Scholar] [CrossRef]
- Nicolson, M.L.; Fell, M.J.; Huebner, G.M. Consumer demand for time of use electricity tariffs: A systematized review of the empirical evidence. Renew. Sustain. Energy Rev. 2018, 97, 276–289. [Google Scholar] [CrossRef]
- Şener, Ş.E.C.; Sharp, J.L.; Anctil, A. Factors impacting diverging paths of renewable energy: A review. Renew. Sustain. Energy Rev. 2018, 81, 2335–2342. [Google Scholar] [CrossRef]
- Johnson, D.; Horton, E.; Mulcahy, R.; Foth, M. Gamification and serious games within the domain of domestic energy consumption: A systematic review. Renew. Sustain. Energy Rev. 2017, 73, 249–264. [Google Scholar] [CrossRef]
- Mardani, A.; Zavadskas, E.K.; Khalifah, Z.; Zakuan, N.; Jusoh, A.; Nor, K.M.; Khoshnoudi, M. A review of multi-criteria decision-making applications to solve energy management problems: Two decades from 1995 to 2015. Renew. Sustain. Energy Rev. 2017, 71, 216–256. [Google Scholar] [CrossRef]
- International Energy Agency Wind (IEA WIND). Task 31. Wakebench. 2019. Available online: https://community.ieawind.org/home (accessed on 2 November 2019).
- Ramírez-Rosado, I.J.; García-Garrido, E.; Fernández-Jiménez, L.A.; Zorzano-Santamaría, P.J.; Monteiro, C.; Miranda, V. Promotion of new wind farms based on a decision support system. Renew. Energy 2008, 33, 558–566. [Google Scholar] [CrossRef]
- Tiba, C.; Candeias, A.; Fraidenraich, N.; de S. Barbosa, E.; de Carvalho Neto, P.; de Melo Filho, J. A GIS-based decision support tool for renewable energy management and planning in semi-arid rural environments of northeast of Brazil. Renew. Energy 2010, 35, 2921–2932. [Google Scholar] [CrossRef]
- Aydin, N.Y.; Kentel, E.; Duzgun, S. GIS-based environmental assessment of wind energy systems for spatial planning: A case study from Western Turkey. Renew. Sustain. Energy Rev. 2010, 14, 364–373. [Google Scholar] [CrossRef]
- Janke, J.R. Multicriteria GIS modeling of wind and solar farms in Colorado. Renew. Energy 2010, 35, 2228–2234. [Google Scholar] [CrossRef]
- Tegou, L.I.; Polatidis, H.; Haralambopoulos, D.A. Environmental management framework for wind farm siting: Methodology and case study. J. Environ. Manag. 2010, 91, 2134–2147. [Google Scholar] [CrossRef]
- Mari, R.; Bottai, L.; Busillo, C.; Calastrini, F.; Gozzini, B.; Gualtieri, G. A GIS-based interactive web decision support system for planning wind farms in Tuscany (Italy). Renew. Energy 2011, 36, 754–763. [Google Scholar] [CrossRef]
- Van Haaren, R.; Fthenakis, V. GIS-based wind farm site selection using spatial multi-criteria analysis (SMCA): Evaluating the case for New York State. Renew. Sustain. Energy Rev. 2011, 15, 3332–3340. [Google Scholar] [CrossRef]
- Grassi, S.; Chokani, N.; Abhari, R.S. Large scale technical and economical assessment of wind energy potential with a GIS tool: Case study Iowa. Energy Policy 2012, 45, 73–85. [Google Scholar] [CrossRef]
- Gorsevski, P.V.; Cathcart, S.C.; Mirzaei, G.; Jamali, M.M.; Ye, X.; Gomezdelcampo, E. A group-based spatial decision support system for wind farm site selection in Northwest Ohio. Energy Policy 2013, 55, 374–385. [Google Scholar] [CrossRef]
- Sánchez-Lozano, J.; García-Cascales, M.; Lamata, M. Identification and selection of potential sites for onshore wind farms development in Region of Murcia, Spain. Energy 2014, 73, 311–324. [Google Scholar] [CrossRef]
- Yunna, W.; Geng, S. Multi-criteria decision making on selection of solar-wind hybrid power station location: A case of China. Energy Convers. Manag. 2014, 81, 527–533. [Google Scholar] [CrossRef]
- Schallenberg-Rodríguez, J.; del Pino, J.N. Evaluation of on-shore wind techno-economical potential in regions and islands. Appl. Energy 2014, 124, 117–129. [Google Scholar] [CrossRef]
- Atici, K.B.; Simsek, A.B.; Ulucan, A.; Tosun, M.U. A GIS-based Multiple Criteria Decision Analysis approach for wind power plant site selection. Util. Policy 2015, 37, 86–96. [Google Scholar] [CrossRef]
- Tsoutsos, T.; Tsitoura, I.; Kokologos, D.; Kalaitzakis, K. Sustainable siting process in large wind farms case study in Crete. Renew. Energy 2015, 75, 474–480. [Google Scholar] [CrossRef]
- Watson, J.J.; Hudson, M.D. Regional Scale wind farm and solar farm suitability assessment using GIS-assisted multi-criteria evaluation. Landsc. Urban Plan. 2015, 138, 20–31. [Google Scholar] [CrossRef]
- Latinopoulos, D.; Kechagia, K. A GIS-based multi-criteria evaluation for wind farm site selection. A regional scale application in Greece. Renew. Energy 2015, 78, 550–560. [Google Scholar] [CrossRef]
- Noorollahi, Y.; Yousefi, H.; Mohammadi, M. Multi-criteria decision support system for wind farm site selection using GIS. Sustain. Energy Technol. Assess. 2016, 13, 38–50. [Google Scholar] [CrossRef]
- Hofer, T.; Sunak, Y.; Siddique, H.; Madlener, R. Wind farm siting using a spatial Analytic Hierarchy Process approach: A case study of the Städteregion Aachen. Appl. Energy 2016, 163, 222–243. [Google Scholar] [CrossRef]
- Sánchez-Lozano, J.; García-Cascales, M.; Lamata, M. GIS-based onshore wind farm site selection using Fuzzy Multi-Criteria Decision Making methods. Evaluating the case of Southeastern Spain. Appl. Energy 2016, 171, 86–102. [Google Scholar] [CrossRef]
- Sarpong, D.; Baffoe, P.E. Selecting Suitable Sites for Wind Energy Development in Ghana. Ghana Min. J. 2016, 16, 8–20. [Google Scholar] [CrossRef][Green Version]
- Chen, W.; Zhu, Y.; Yang, M.; Yuan, J. Optimal Site Selection of Wind-Solar Complementary Power Generation Project for a Large-Scale Plug-In Charging Station. Sustainability 2017, 9, 1994. [Google Scholar] [CrossRef]
- Ali, S.; Lee, S.M.; Jang, C.M. Determination of the Most Optimal On-Shore Wind Farm Site Location Using a GIS-MCDM Methodology: Evaluating the Case of South Korea. Energies 2017, 10, 2072. [Google Scholar] [CrossRef]
- Villacreses, G.; Gaona, G.; Martínez-Gómez, J.; Jijón, D.J. Wind farms suitability location using geographical information system (GIS), based on multi-criteria decision making (MCDM) methods: The case of continental Ecuador. Renew. Energy 2017, 109, 275–286. [Google Scholar] [CrossRef]
- Baseer, M.; Rehman, S.; Meyer, J.; Alam, M.M. GIS-based site suitability analysis for wind farm development in Saudi Arabia. Energy 2017, 141, 1166–1176. [Google Scholar] [CrossRef]
- Kazak, J.; van Hoof, J.; Szewranski, S. Challenges in the wind turbines location process in Central Europe – The use of spatial decision support systems. Renew. Sustain. Energy Rev. 2017, 76, 425–433. [Google Scholar] [CrossRef]
- Lotfi, R.; Mostafaeipour, A.; Mardani, N.; Mardani, S. Investigation of wind farm location planning by considering budget constraints. Int. J. Sustain. Energy 2018. [Google Scholar] [CrossRef]
- Díaz-Cuevas, P. GIS-Based Methodology for Evaluating the Wind-Energy Potential of Territories: A Case Study from Andalusia (Spain). Energies 2018, 11, 2789. [Google Scholar] [CrossRef]
- Ayodele, T.; Ogunjuyigbe, A.; Odigie, O.; Munda, J. A multi-criteria GIS based model for wind farm site selection using interval type-2 fuzzy analytic hierarchy process: The case study of Nigeria. Appl. Energy 2018, 228, 1853–1869. [Google Scholar] [CrossRef]
- Weiss, C.V.C.; Tagliani, P.R.A.; Espinoza, J.M.A.; de Lima, L.T.; Gandra, T.B.R. Spatial planning for wind farms: Perspectives of a coastal area in southern Brazil. Springer 2018, 20, 665–666. [Google Scholar] [CrossRef]
- Sofuoglu, S.D.F.B.S.C. MCDM analysis of wind energy in Turkey: Decision making based on environmental impact. Environ. Sci. Pollut. Res. 2018, 25, 19753–19766. [Google Scholar] [CrossRef]
- Solangi, Y.A.; Tan, Q.; Khan, M.W.A.; Mirjat, N.H.; Ahmed, I. The Selection ofWind Power Project Location in the Southeastern Corridor of Pakistan: A Factor Analysis, AHP, and Fuzzy-TOPSIS Application. Energies 2018, 11, 1940. [Google Scholar] [CrossRef]
- Ali, S.; Taweekun, J.; Techato, K.; Waewsak, J.; Gyawali, S. GIS based site suitability assessment for wind and solar farms in Songkhla, Thailand. Renew. Energy 2018, 132, 1360–1372. [Google Scholar] [CrossRef]
- Al-Yahyai, S.; Charabi, Y.; Gastli, A.; Al-Badi, A. Wind farm land suitability indexing using multi-criteria analysis. Renew. Energy 2012, 44, 80–87. [Google Scholar] [CrossRef]
- Rezaei, M.; Mostafaeipour, A.; Qolipour, M.; Tavakkoli-Moghaddam, R. Investigation of the optimal location design of a hybrid wind-solar plant: A case study. Int. J. Hydrog. Energy 2018, 43, 100–114. [Google Scholar] [CrossRef]
- Ntoka, C. Offshore Wind Park Sitting and Micro-Sitting in Petalioi Gulf, Greece. Ph.D. Thesis, Aalborg University, Aalborg, Denmark, 2013. [Google Scholar]
- Waewsak, J.; Landry, M.; Gagnon, Y. Offshore wind power potential of the Gulf of Thailand. Renew. Energy 2015, 81, 609–626. [Google Scholar] [CrossRef]
- Argin, M.; Yerci, V. Offshore wind power potential of the Black Sea region in Turkey. Int. J. Green Energy 2017, 14, 811–818. [Google Scholar] [CrossRef]
- Cavazzi, S.; Dutton, A. An Offshore Wind Energy Geographic Information System (OWE-GIS) for assessment of the UK’s offshore wind energy potential. Renew. Energy 2016, 87, 212–228. [Google Scholar] [CrossRef]
- Wu, B.; Yip, T.L.; Xie, L.; Wang, Y. A fuzzy-MADM based approach for site selection of offshore wind farm in busy waterways in China. Ocean Eng. 2018, 168, 121–132. [Google Scholar] [CrossRef]
- Chaouachi, A.; Covrig, C.F.; Ardelean, M. Multi-criteria selection of offshore wind farms: Case study for the Baltic States. Energy Policy 2017, 103, 179–192. [Google Scholar] [CrossRef]
- Fetanat, A.; Khorasaninejad, E. A novel hybrid MCDM approach for offshore wind farm site selection: A case study of Iran. Ocean Coast. Manag. 2015, 109, 17–28. [Google Scholar] [CrossRef]
- Wu, Y.; Zhang, J.; Yuan, J.; Geng, S.; Zhang, H. Study of decision framework of offshore wind power station site selection based on ELECTRE-III under intuitionistic fuzzy environment: A case of China. Energy Convers. Manag. 2016, 113, 66–81. [Google Scholar] [CrossRef]
- Kim, J.Y.; Oh, K.Y.; Kang, K.S.; Lee, J.S. Site selection of offshore wind farms around the Korean Peninsula through economic evaluation. Renew. Energy 2013, 54, 189–195. [Google Scholar] [CrossRef]
- Kim, T.; Park, J.I.; Maeng, J. Offshore wind farm site selection study around Jeju Island, South Korea. Renew. Energy 2016, 94, 619–628. [Google Scholar] [CrossRef]
- Cradden, L.; Kalogeri, C.; Barrios, I.M.; Galanis, G.; Ingram, D.; Kallos, G. Multi-criteria site selection for offshore renewable energy platforms. Renew. Energy 2016, 87, 791–806. [Google Scholar] [CrossRef]
- Vasileiou, M.; Loukogeorgaki, E.; Vagiona, D.G. GIS-based multi-criteria decision analysis for site selection of hybrid offshore wind and wave energy systems in Greece. Renew. Sustain. Energy Rev. 2017, 73, 745–757. [Google Scholar] [CrossRef]
- Punt, M.J.; Groeneveld, R.A.; van Ierland, E.C.; Stel, J.H. Spatial planning of offshore wind farms: A windfall to marine environmental protection? Ecol. Econ. 2009, 69, 93–103. [Google Scholar] [CrossRef]
- Yue, C.D.; Yang, M.H. Exploring the potential of wind energy for a coastal state. Energy Policy 2009, 37, 3925–3940. [Google Scholar] [CrossRef]
- Government, T.S. Draft Plan for Offshore Wind Energy in Scottish Territorial Waters. 2010. Available online: https://www2.gov.scot/resource/doc/312147/0098586.pdf (accessed on 2 November 2019).
- Moore, A.; Price, J.; Zeyringer, M. The role of floating offshore wind in a renewable focused electricity system for Great Britain in 2050. Energy Strategy Rev. 2018, 22, 270–278. [Google Scholar] [CrossRef]
- Vagiona, D.G.; Kamilakis, M. Sustainable Site Selection for Offshore Wind Farms in the South Aegean—Greece. Sustainability 2018, 10, 749. [Google Scholar] [CrossRef]
- Mytilinou, V.; Lozano-Minguez, E.; Kolios, A. A Framework for the Selection of Optimum Offshore Wind Farm Locations for Deployment. Energies 2018, 11, 1855. [Google Scholar] [CrossRef]
- Nagababu, G.; Kachhwaha, S.S.; Savsani, V. Estimation of technical and economic potential of offshore wind along the coast of India. Energy 2017, 138, 79–91. [Google Scholar] [CrossRef]
- Mederos, A.M.; Padrón, J.M.; Lorenzo, A.F. An offshore wind atlas for the Canary Islands. Renew. Sustain. Energy Rev. 2011, 15, 612–620. [Google Scholar] [CrossRef]
- Kim, C.K.; Jang, S.; Kim, T.Y. Site selection for offshore wind farms in the southwest coast of South Korea. Renew. Energy 2018, 120, 151–162. [Google Scholar] [CrossRef]
- Pillai, A.C.; Chick, J.; Khorasanchi, M.; Barbouchi, S.; Johanning, L. Application of an offshore wind farm layout optimization methodology at Middelgrunden wind farm. Ocean Eng. 2017, 139, 287–297. [Google Scholar] [CrossRef]
- Schillings, C.; Wanderer, T.; Cameron, L.; van der Wal, J.T.; Jacquemin, J.; Veum, K. A decision support system for assessing offshore wind energy potential in the North Sea. Energy Policy 2012, 49, 541–551. [Google Scholar] [CrossRef]
- Astariz, S.; Iglesias, G. Selecting optimum locations for co-located wave and wind energy farms. Part I: The Co-Location Feasibility index. Energy Convers. Manag. 2016, 122, 589–598. [Google Scholar] [CrossRef]
- Schallenberg-Rodríguez, J.; Montesdeoca, N.G. Spatial planning to estimate the offshore wind energy potential in coastal regions and islands. Practical case: The Canary Islands. Energy 2018, 143, 91–103. [Google Scholar] [CrossRef]
- Abudureyimu, A.; Hayashi, Y.; Nagasaka, K. Analyzing the Economy of Off-shore Wind Energy using GIS Technique. APCBEE Procedia 2012, 1, 182–186. [Google Scholar] [CrossRef][Green Version]
- Möller, B. Continuous spatial modelling to analyse planning and economic consequences of offshore wind energy. Energy Policy 2011, 39, 511–517. [Google Scholar] [CrossRef]
- Sheridan, B.; Baker, S.D.; Pearre, N.S.; Firestone, J.; Kempton, W. Calculating the offshore wind power resource: Robust assessment methods applied to the U.S. Atlantic Coast. Renew. Energy 2012, 43, 224–233. [Google Scholar] [CrossRef]
- Madsen, J.; Bates, A.; Callahan, J.; Firestone, J. Geospatial Techniques for Managing Environmental Resources. Use of Geospatial Data in Planning for Offshore Wind Development; Springer-Verlag GmbH: Berlin/Heidelberg, Germany, 2011. [Google Scholar] [CrossRef]
- Gao, X.; Yang, H.; Lu, L. Study on offshore wind power potential and wind farm optimization in Hong Kong. Appl. Energy 2014, 130, 519–531. [Google Scholar] [CrossRef]
- Veigas, M.; Carballo, R.; Iglesias, G. Wave and offshore wind energy on an island. Energy Sustain. Dev. 2014, 22, 57–65. [Google Scholar] [CrossRef]
- Jongbloed, R.; van der Wal, J.; Lindeboom, H. Identifying space for offshore wind energy in the North Sea. Consequences of scenario calculations for interactions with other marine uses. Energy Policy 2014, 68, 320–333. [Google Scholar] [CrossRef]
- Gimpel, A.; Stelzenmüller, V.; Grote, B.; Buck, B.H.; Floeter, J.; Núñez-Riboni, I.; Pogoda, B.; Temming, A. A GIS modelling framework to evaluate marine spatial planning scenarios: Co-location of offshore wind farms and aquaculture in the German EEZ. Mar. Policy 2015, 55, 102–115. [Google Scholar] [CrossRef]
- Mekonnen, A.D.; Gorsevski, P.V. A web-based participatory GIS (PGIS) for offshore wind farm suitability within Lake Erie, Ohio. Renew. Sustain. Energy Rev. 2015, 41, 162–177. [Google Scholar] [CrossRef]
- Nie, B.; Li, J. Technical potential assessment of offshore wind energy over shallow continent shelf along China coast. Renew. Energy 2018, 128, 391–399. [Google Scholar] [CrossRef]
- Schweizer, J.; Antonini, A.; Govoni, L.; Gottardi, G.; Archetti, R.; Supino, E.; Berretta, C.; Casadei, C.; Ozzi, C. Investigating the potential and feasibility of an offshore wind farm in the Northern Adriatic Sea. Appl. Energy 2016, 177, 449–463. [Google Scholar] [CrossRef]
- Satir, M.; Murphy, F.; McDonnell, K. Feasibility study of an offshore wind farm in the Aegean Sea, Turkey. Renew. Sustain. Energy Rev. 2018, 81, 2552–2562. [Google Scholar] [CrossRef]
- Mahdy, M.; Bahaj, A.S. Multi criteria decision analysis for offshore wind energy potential in Egypt. Renew. Energy 2018, 118, 278–289. [Google Scholar] [CrossRef]
- Hong, L.; Möller, B. Offshore wind energy potential in China: Under technical, spatial and economic constraints. Energy 2011, 36, 4482–4491. [Google Scholar] [CrossRef]
- Magar, V.; Gross, M.; González-García, L. Offshore wind energy resource assessment under techno-economic and social-ecological constraints. Ocean Coast. Manag. 2018, 152, 77–87. [Google Scholar] [CrossRef]
- Depellegrin, D.; Blažauskas, N.; Egarter-Vigl, L. An integrated visual impact assessment model for offshore windfarm development. Ocean Coast. Manag. 2014, 98, 95–110. [Google Scholar] [CrossRef]


| Factor | Description |
|---|---|
| Wind speed | The wind speed that measures its kinetic energy in the site (m/s) |
| Power density | Power density, consider wind speed and air density (W/m) |
| Wind direction | Side where the wind blows (sexagesimal degrees) |
| Effective time | Occurrence of wind speed |
| Availability data | Accurate measurement campaign data |
| Turbulence | Ratio between the standard deviation of the values wind speed and its average speed, for each set of ten-minute measurements (dimensionless) |
| Frost periods | Duration of frost periods |
| Natural disasters | Probability of natural disasters |
| Air density | Relationship between mass and air volume (kg/m). Influences the kinetic energy of the air |
| Factor | Description |
|---|---|
| Slope | The higher the percentage of the slope of the land, the less likely it is to install the wind farm |
| Altitude | At higher altitude, installation difficulties increase |
| Type of terrain | Soft or hard consistency |
| Roughness | Roughness of the terrain caused by both natural elevation and human development |
| Area | Area contained within the perimeter of the wind farm (m) or limit of the external ocean, legal marine areas of the country |
| Water depth | Bathymetry. Water depth in selected area of the sea (m). It is a key technical factor to decide the type of structure (fixed or floating) |
| Wave height | Wave height in selected area of the sea (m). It is a key technical factor to determine the effects of waves on the structure (balancing, dragging) |
| Water quality | It includes some properties of water such as dissolved oxygen (mg/L) to exclude areas destined for aquaculture or study co-location |
| Factor | Description |
|---|---|
| Protected areas or distance | Completely protected areas from a legal standpoint (National and natural parks, Integral and special Natural Reserves, Special Areas of Conservation, etc.) |
| Agrological capacity | Suitability of the soil for certain crops |
| Visual impact | Visual impact according to regulations |
| Reduction emissions CO and others | Pollution avoided compared to conventional power generation technology |
| Stroboscopic effect | Blinking shadow effect caused by the sun’s incidence on the blades of the wind turbine |
| Energy-dependence contribution | Energy savings |
| Noise | The noise impact in quality of life |
| Population | The level and regularity of demand for energy in the site |
| Demand electricity | Sufficient electricity demand that justifies the installation |
| Land use | Use of land for agricultural, governmental, etc. Purposes |
| Flora and fauna impact | Mainly influence in birds, marine species, soil and vegetation |
| Shipping Routes | Ships/vessels movement routes |
| Fishing areas | Areas determine by the authorities for fishing |
| Factor | Description |
|---|---|
| Distance/Availability roads | Distance to roads, focused on decreasing installation and maintenance costs as well as safety in everyday transport |
| Distance to other wind farms | With the purpose of not exceeding the estimation of the carrying capacity of sustainable siting areas |
| Distance transmission lines (antennas) | Distance between any telecommunications infrastructure and the wind farm. In order to not affect the telecommunications infrastructure |
| Distant urban areas | Distance between urban areas, towns or cities, and location areas. In anticipation of future expansions and in compliance with the legislative framework of any country |
| Distances industrial/Military zones | Distance between military and industrial zones and location areas |
| Distance from the railway network | Distance between railway lines and possible locations. With the aim of taking advantage of the social acceptance of the zones |
| Distances to ports | Distance between ports and the possible sites, adaptation to the country’s regulatory framework |
| Distances airports | Distance between the nearest airport and the different possible sites with the objective of not affecting the airspace or the future expansion of airports and facilities. Airspace restricted by the Aviation Agency |
| Distance to Point of Common Coupling (PCC) | Distance between nearest network or power line and the different possible sites. While this distance is smaller, the cost of the electricity infrastructure is lower and therefore, the economic and financial indicators will be better |
| Distances entertainment areas—historical | Distance between entertainment, historical areas and the possible sites, adaptation to the country’s regulatory framework |
| Distance water resources (rivers, coast, lake) | Distance between water resources and the possible sites, adaptation to the country’s regulatory framework, depending on whether it is a lake, river etc. |
| Distance of underground cables or pipes | Distance or existence of underground cables or pipes |
| Distance to shore | Focused on the location of offshore wind farms by regulatory measures marked by the country |
| Distance other point | Distance to other point as wrecks, lighthouses |
| Factor | Description |
|---|---|
| Energy sale price | Energy sale price, very important since it is the only source of income for the installation |
| Energy put into the network | Energy put into the network eliminated all losses of gross energy |
| Infrastructure cost | Costs of the infrastructure associated with the initial investment (CAPEX) |
| NPV | Net present value, financial indicator |
| IRR | Internal rate of return, financial indicator |
| Payback | Recovery period in years |
| Interest loan | Interest of the loan requested in the initial investment |
| Installed capacity | Installed capacity (MW) |
| Exploitation | Cost focused on the exploitation phase (OPEX), example: cost of land (onshore), port activities (offshore) |
| Stability voltage | Voltage stability to achieve the planned energy |
| Economic contribution | Economic contribution focused on the creation of employment, payment of taxes in town halls etc. |
| Decommission cost | Include the removal of the turbines and foundations (DECEX) |
| Factor | Description |
|---|---|
| Incentives | Incentives received in compensation for producing electric power from renewable sources |
| Taxes | Taxes involved in the activity |
| Policy measures | Political measures established in favor of renewable energies |
| Nomenclature | Factor | References | AF | % |
|---|---|---|---|---|
| Wind speed | [13,14,15,16,17,18,19,20,21,22,23,24,25,26,27,28,29,30,31,32,33,34,35,36,37,38,39,40,41,42,43,44] | 32 | 94 | |
| Power Density | [23,33,45,46] | 4 | 12 | |
| Wind direction | [14,24] | 2 | 6 | |
| Effective time | [18,23,45] | 3 | 9 | |
| Availability data | [43] | 1 | 3 | |
| Turbulence | [45] | 1 | 3 | |
| Frost periods | [42] | 1 | 3 | |
| Natural disasters | [33,37,38,46] | 4 | 12 | |
| Air density | [13,35,40,42,43] | 5 | 15 |
| Nomenclature | Factors | References | AF | % |
|---|---|---|---|---|
| Slope | [13,17,18,19,20,22,24,25,28,29,30,31,32,33,34,35,37,38,39,40,41,43,44,45] | 24 | 71 | |
| Altitude | [13,19,24,25,29,32,35,37,39,40,42,43,44] | 13 | 38 | |
| Type of terrain | [16,17,19,21,30,40,42,45] | 8 | 24 | |
| Roughness | [13,20,37] | 3 | 9 | |
| Area | [22,29,31,43,44] | 5 | 15 |
| Nomenclature | Factor | References | AF | % |
|---|---|---|---|---|
| Protected areas | [13,15,16,17,18,20,22,24,25,26,28,29,30,31,34,39,40,41,42,43,44,45] | 22 | 65 | |
| Agrological capacity | [14,17,20,22,30,31,35,37,43] | 9 | 26 | |
| Visual impact | [13,17,19,23,37,42,43] | 7 | 21 | |
| Reduction emissions | [23,33,38] | 3 | 9 | |
| Stroboscopic effect | [37] | 1 | 3 | |
| Energy-dependence contribution | [23,33] | 2 | 6 | |
| Noise | [13,15,19,23,36,37,42,43] | 8 | 24 | |
| Population | [14,16,21,46] | 4 | 12 | |
| Demand electricity | [17,24,45] | 3 | 9 | |
| Land use | [14,17,20,21,28,32,34,35,42,43,44,46] | 12 | 35 | |
| Flora and fauna impact | [15,19,21,23,26,27,30,33,37,40,42,43] | 12 | 35 |
| Nomenclature | Factor | References | AF | % |
|---|---|---|---|---|
| D. Availability roads | [16,19,20,21,22,24,25,26,27,28,29,30,31,32,33,34,36,37,38,39,40,41,42,43,44,45] | 26 | 76 | |
| D. to other wind farms | [26] | 1 | 3 | |
| D. transmission lines | [13,14,16,21,22,25,26,30,31,32,34,35,37,38,39,42,44] | 17 | 50 | |
| D. urban areas | [13,14,15,16,17,18,20,21,22,23,24,25,26,27,28,29,30,31,32,34,35,36,39,40,41,42,43,44,45] | 29 | 85 | |
| D. industrial/Military zones | [26,39] | 2 | 6 | |
| D.from the railway network | [13,20,25,29,30,34,35,39] | 8 | 24 | |
| D. to ports | [26,35] | 2 | 6 | |
| D. airports | [13,15,17,20,21,22,24,25,26,29,31,32,36,39,40,42,44] | 17 | 50 | |
| D. Point of Common Coupling (PCC) | [14,17,19,22,23,24,26,27,29,30,31,33,34,35,36,38,39,40,41,42,43,46] | 22 | 65 | |
| D. entertainment areas–historical | [16,17,23,26,27,28,29,30,34,39] | 10 | 29 | |
| D. water resources (rivers, coast, lake) | [14,17,20,21,24,25,26,28,29,30,34,39,40,41,44] | 15 | 44 |
| Nomenclature | Factor | References | AF | % |
|---|---|---|---|---|
| Energy sale price | [13,20,24,33] | 4 | 12 | |
| Energy put into the network | [13,14,18,20,23,24,25,33,41] | 9 | 26 | |
| Infrastructure cost | [13,20,23,24,33,38,43,46] | 8 | 24 | |
| NPV | [23] | 1 | 3 | |
| IRR | [23] | 1 | 3 | |
| Payback | [23,33] | 2 | 6 | |
| Interest loan | [20,23] | 2 | 6 | |
| Installed capacity | [33] | 1 | 3 | |
| Exploitation | [13,17,19,20,33,38,41,42,43,46] | 10 | 29 | |
| Stability voltage | [33] | 1 | 3 | |
| Economic contribution | [33,43,46] | 3 | 9 |
| Nomenclature | Factor | References | AF | % |
|---|---|---|---|---|
| Incentives | [20,33] | 2 | 6 | |
| Taxes | [20,33] | 2 | 6 | |
| Policy measures | [23,33,43] | 3 | 9 |
| Nomenclature | Factor | References | AF | % |
|---|---|---|---|---|
| Wind speed | [47,48,49,50,51,52,53,54,55,56,57,58,59,60,61,62,63,64,65,66,67,68,69,70,71,72,73,74,75,76,77,78,79,80,81,82,83] | 37 | 91 | |
| Power Density | [51,54,55,56,57,65,67,77,81,84,85,86] | 12 | 29 | |
| Wind direction | [47,66,68,70,76,77] | 6 | 15 | |
| Effective time | [51,54,76,82] | 4 | 10 | |
| Turbulence | [54,68,83] | 3 | 7 | |
| Natural disasters | [54,55] | 2 | 5 | |
| Air density | [70] | 1 | 2 |
| Nomenclature | Factor | References | AF | % |
|---|---|---|---|---|
| Type of terrain | [47,50,54,55,64,69,75,78,84,87] | 10 | 24 | |
| Area | [56,66,71,72,73,74,75,76,78,79,81,82,87] | 13 | 32 | |
| Water depth | [47,48,50,51,52,53,54,55,56,58,59,60,61,62,63,64,65,66,68,69,71,72,74,75,76,77,78,79,81,82,83,84,86] | 33 | 80 | |
| Wave height | [51,53,54,55,57,59,69,74,78,79,82] | 11 | 27 | |
| Water quality | [56,79] | 2 | 5 |
| Nomenclature | Factor | References | AF | % |
|---|---|---|---|---|
| Protected areas | [47,50,52,53,55,56,57,58,61,62,63,65,67,69,71,72,73,74,75,76,77,78,79,81,82,83,84,85,86,87] | 30 | 73 | |
| Visual impact | [55,62,63,73,81,85,87] | 7 | 17 | |
| Reduction emissions | [54,60,64] | 3 | 7 | |
| Noise | [53] | 1 | 2 | |
| Population | [80,87] | 2 | 5 | |
| Demand electricity | [63,71,85] | 3 | 7 | |
| Flora and fauna impact | [47,53,54,55,56,57,59,60,61,62,63,65,67,69,73,74,75,79,80,81,85,86] | 22 | 54 | |
| Shipping Routes | [47,49,50,51,54,55,56,57,58,60,61,62,63,67,69,71,72,73,74,75,76,78,80,81,82,84,85,86] | 28 | 68 | |
| Fishing areas | [50,51,55,56,61,62,67,69,71,72,74,76,78,80,84,86] | 16 | 39 |
| Nomenclature | Factor | References | AF | % |
|---|---|---|---|---|
| D. to other wind farms | [50,52,58,62,63,64,69] | 7 | 17 | |
| D. urban areas | [47,87] | 2 | 5 | |
| D. industrial/Military zones | [47,49,50,52,55,56,58,61,62,63,67,69,71,73,74,75,76,78,82,84,85] | 21 | 51 | |
| D. to ports | [47,50,51,54,56,57,58,61,64,77,78,84] | 12 | 29 | |
| D. airports | [49,71,75] | 3 | 7 | |
| D. Point of Common Coupling (PCC) | [48,50,52,53,54,55,56,57,58,61,64,67,75,78,80,82,84,86] | 18 | 44 | |
| D. entertainment areas—historical | [47,50,52,55,61,71,75,87] | 8 | 20 | |
| D. underground cables or pipes | [47,49,50,61,69,73,76,78,81,84,85,86] | 12 | 29 | |
| D. to shore | [47,48,49,50,52,53,54,55,56,57,58,59,60,61,62,64,69,71,72,73,76,77,80,83,84,87] | 26 | 63 | |
| D. other point | [47] | 1 | 2 |
| Nomenclature | Factor | References | AF | % |
|---|---|---|---|---|
| Energy sale price | [54,59,71,72,73,82,83,85] | 8 | 20 | |
| Energy put into the network | [50,52,53,54,55,59,71,74,82,83,85] | 11 | 27 | |
| Infrastructure cost | [50,52,53,54,55,59,60,62,64,65,68,69,71,72,73,78,82,83,85] | 19 | 46 | |
| NPV | [54,67,82,83] | 4 | 10 | |
| IRR | [54,82] | 2 | 5 | |
| Payback | [54,55,82,85] | 4 | 10 | |
| Interest loan | [50,59,60,85] | 4 | 10 | |
| Installed capacity | [50,51,52,59,60,62,64,65,66,67,68,69,71,72,73,74,76,83,85,86] | 20 | 49 | |
| Exploitation | [50,52,53,54,55,59,60,62,64,65,69,71,72,73,78,82,83,85] | 18 | 44 | |
| Stability voltage | [54] | 1 | 2 | |
| Economic contribution | [53,58,59] | 3 | 7 | |
| Decommission cost | [64,68,71,82] | 4 | 10 |
© 2019 by the authors. Licensee MDPI, Basel, Switzerland. This article is an open access article distributed under the terms and conditions of the Creative Commons Attribution (CC BY) license (http://creativecommons.org/licenses/by/4.0/).
Share and Cite
Gil-García, I.C.; García-Cascales, M.S.; Fernández-Guillamón, A.; Molina-García, A. Categorization and Analysis of Relevant Factors for Optimal Locations in Onshore and Offshore Wind Power Plants: A Taxonomic Review. J. Mar. Sci. Eng. 2019, 7, 391. https://doi.org/10.3390/jmse7110391
Gil-García IC, García-Cascales MS, Fernández-Guillamón A, Molina-García A. Categorization and Analysis of Relevant Factors for Optimal Locations in Onshore and Offshore Wind Power Plants: A Taxonomic Review. Journal of Marine Science and Engineering. 2019; 7(11):391. https://doi.org/10.3390/jmse7110391
Chicago/Turabian StyleGil-García, Isabel C., M. Socorro García-Cascales, Ana Fernández-Guillamón, and Angel Molina-García. 2019. "Categorization and Analysis of Relevant Factors for Optimal Locations in Onshore and Offshore Wind Power Plants: A Taxonomic Review" Journal of Marine Science and Engineering 7, no. 11: 391. https://doi.org/10.3390/jmse7110391
APA StyleGil-García, I. C., García-Cascales, M. S., Fernández-Guillamón, A., & Molina-García, A. (2019). Categorization and Analysis of Relevant Factors for Optimal Locations in Onshore and Offshore Wind Power Plants: A Taxonomic Review. Journal of Marine Science and Engineering, 7(11), 391. https://doi.org/10.3390/jmse7110391