The general differences in the wave impact and wave run-up for a plain slope and stepped revetments with two different step ratios are given in
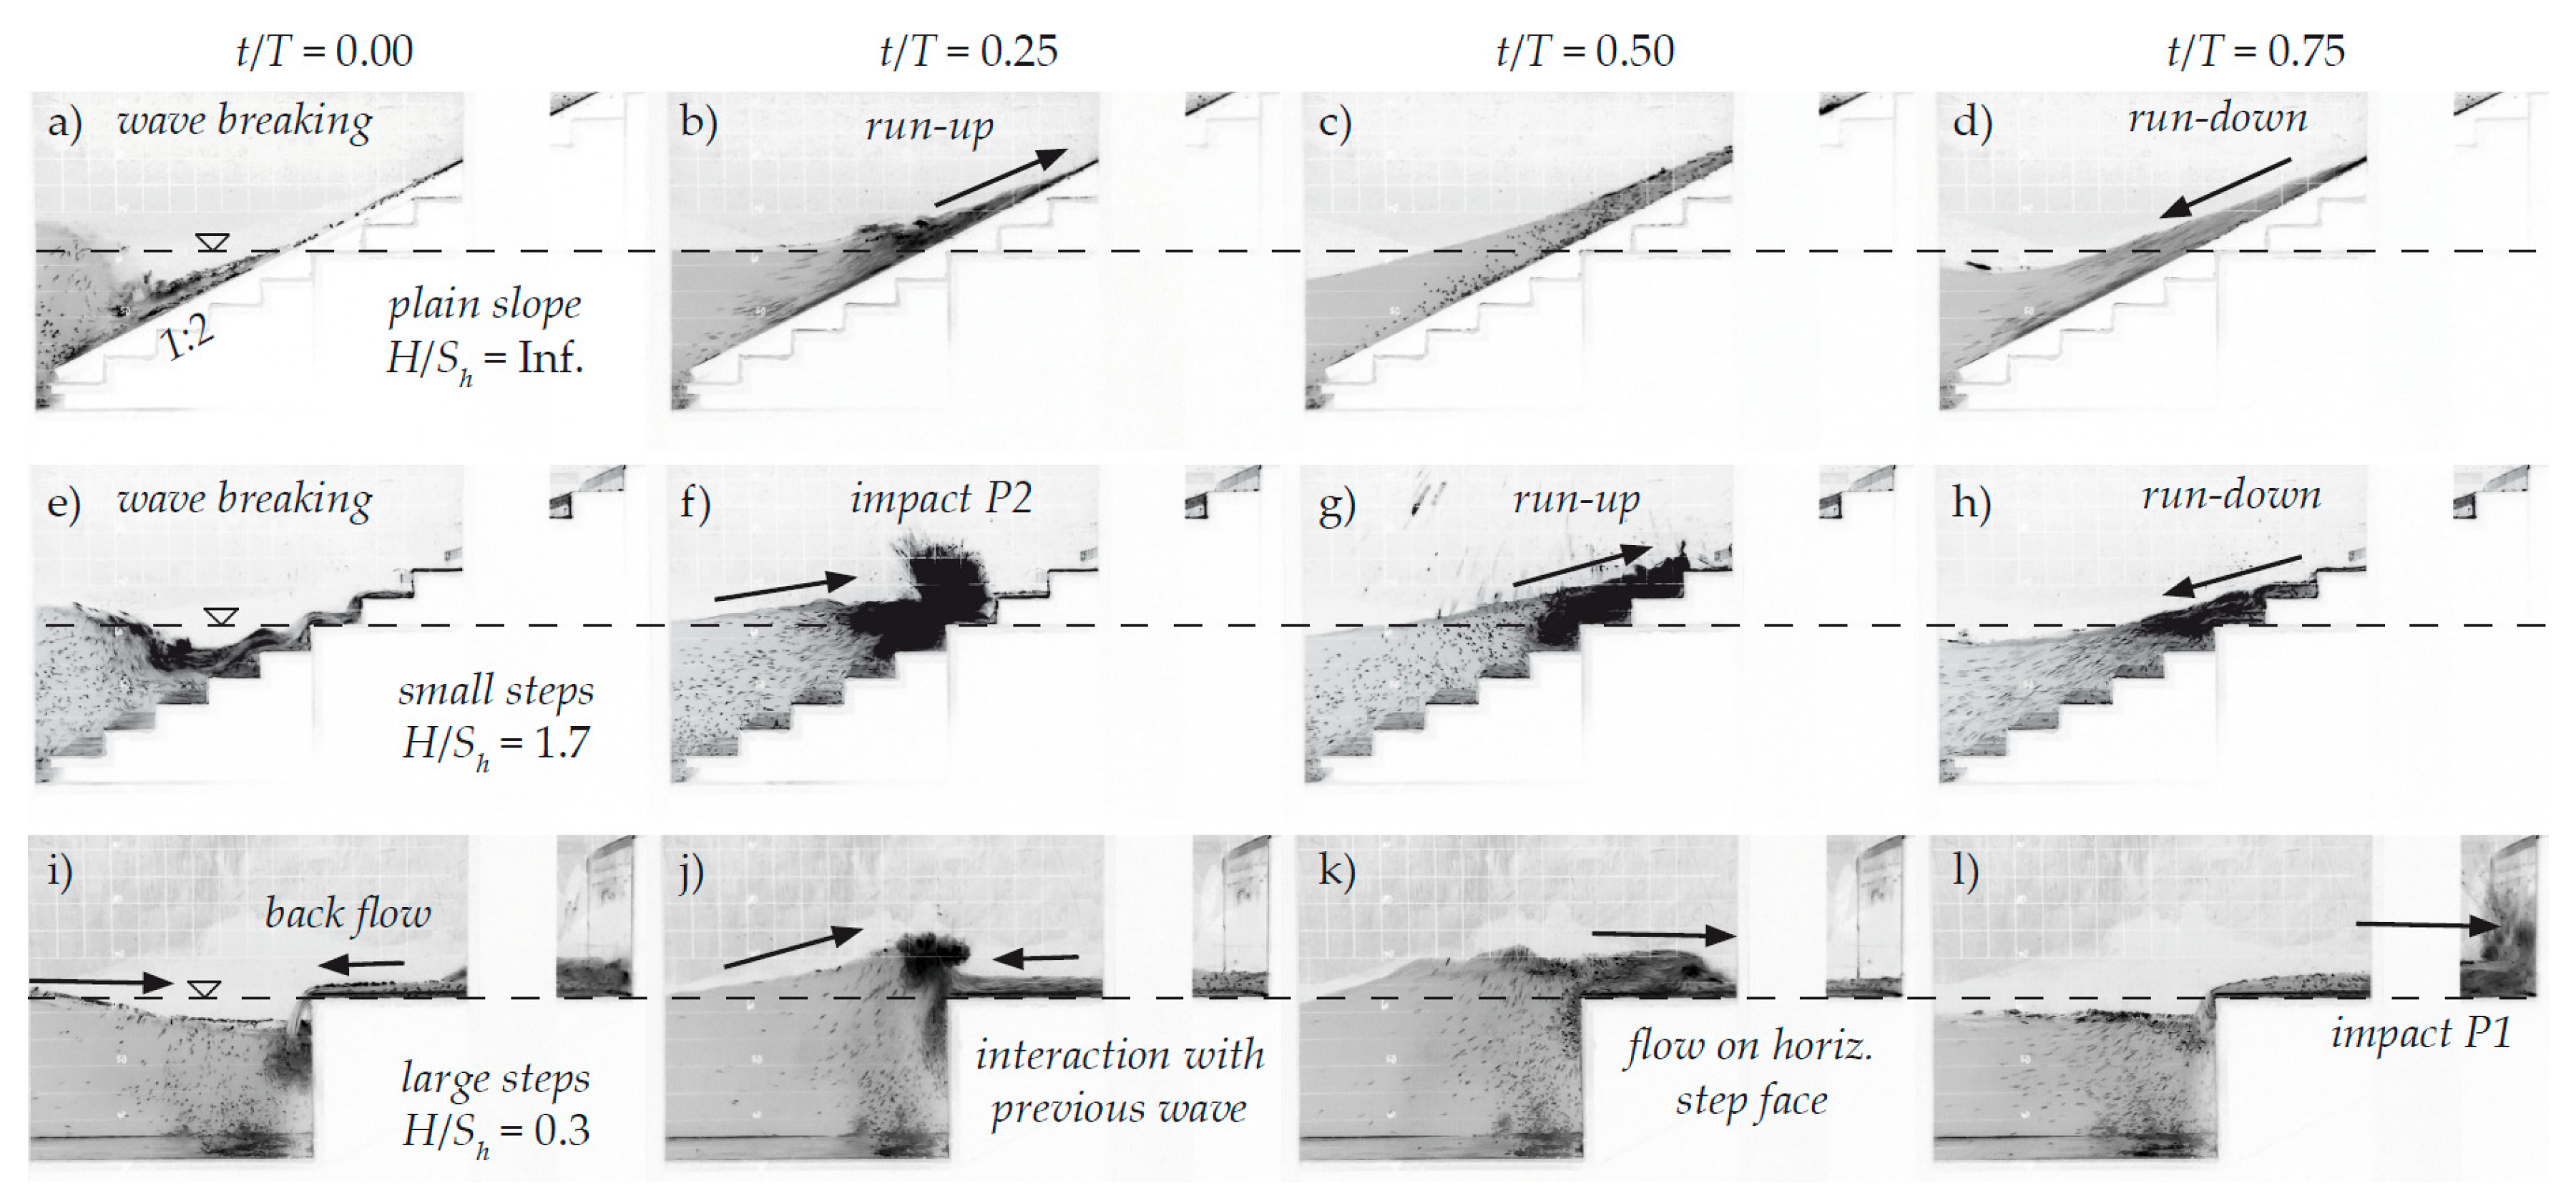
Figure 3 for a better comparison and understanding of the results presented in this section. The color-scheme of the initial black and white images recorded with a frame rate of 50 Hz is inverted for the sake of visual clarity. Small tracers (tiny black dots in the images) that follow the main flow field induced by the up-rushing wave are visible on each image. Intense dark areas represent a high amount of aeration due to wave breaking and wave-structure interaction, as such, a corresponding high flow velocity.
Figure 3 shows the wave-induced processes on a 1:2 sloped revetment with smooth impermeable surface in chronological order, i.e., the wave impact (a), the wave run-up (b,c), and finally, the wave run-down (d) of a breaking wave. The time step
t of each frame is given in relation to the wave period
T. In analogy,
Figure 3e–h shows the wave impact and wave run-up of a wave with the same boundary conditions over a revetment with small steps (
H/
Sh = 1.7) and
Figure 3i–l over a revetment with large steps (
H/
Sh = 0.3). For the two stepped configurations, the still water level
SLW is at the level of a step edge.
On a smooth plain slope, a breaking wave induces air in the water body. The wave run-up (b) contains water and air. At the maximum point of wave run-up excursion (c) the entire fraction of air is leaked from the water body, and in consequence, the wave run-down (d) contains only water. During the wave run-down the preceding wave then interacts with the next incoming wave and the described run-up and aeration process is repeated. For revetments with small steps (H/Sh = 1.7), the general flow processes of wave breaking, wave run-up and wave run down sequence is almost in analogy with the processes on a smooth slope. The main differences are: (1) The impact of the breaking wave causes a splash-up at the vertical step front (f) during the wave run-up process, (2) the aeration during the wave run-up is more intense during the run-up process caused by larger friction induced by the steps while interacting with the incoming waves, and (3) higher turbulence and continuous air intrusion (g). Yet, in contrast, the wave run-down induces air into the water body and is retarded compared to the smooth revetment (h). For large step heights (H/Sh = 0.3), the flow processes differ significantly from a normal wave run-up as shown in (a–h). The incident breaking wave interacts with the reflected backflow of a previous wave at the first step edge (i). The interaction leads to an impact on this first step edge, an upwards-directed flow and a wave breaking in very shallow waters over the step edge (j). Then, the wave is propagating as spilling breaker over the horizontal step front (k) until it impacts and resonates with the second vertical step front (l). The impact induces a second splash up.
The previous described processes during the wave run-up over a plain and stepped revetment resemble the major dissimilarities, namely (1) the higher volume of aeration, (2) the stronger interaction with and the influence of previous waves, and (3) the higher breaking wave impact characteristic (impact direct on the slope/step front, impact on a water cushion induced by the previous wave). In summary, these previously outlined effects feature the structure and functioning of stepped revetment by means of reflecting and dissipating incoming wave energy on a sloping beach leading to less wave run-up and, in consequence, to lower wave overtopping rates. In order to quantify the influence of the formerly described processes, the induced wave impact pressures on stepped revetments are analyzed. This examination focuses on (1) the probability distribution of impact pressures, (2) the temporal evolution and typical load cases of impact pressures, and (3) the spatial distribution of impact pressures. Attention is drawn to these three foci in reference to the step ratio. Recent literature on wave impacts on impermeable plain slopes, stepped revetments and vertical seawalls are presented to complement the findings of this research and ensure a comprehensive analysis of processes.
4.1. Probability Distribution of Impact Pressures
According to References [
12,
13], the probability distributions of wave impact pressures can be described in agreement with mathematical fitting approaches based log-normal functions. Additionally, it has been argued that these log-normal functions are valid in model scale and prototype.
Hence,
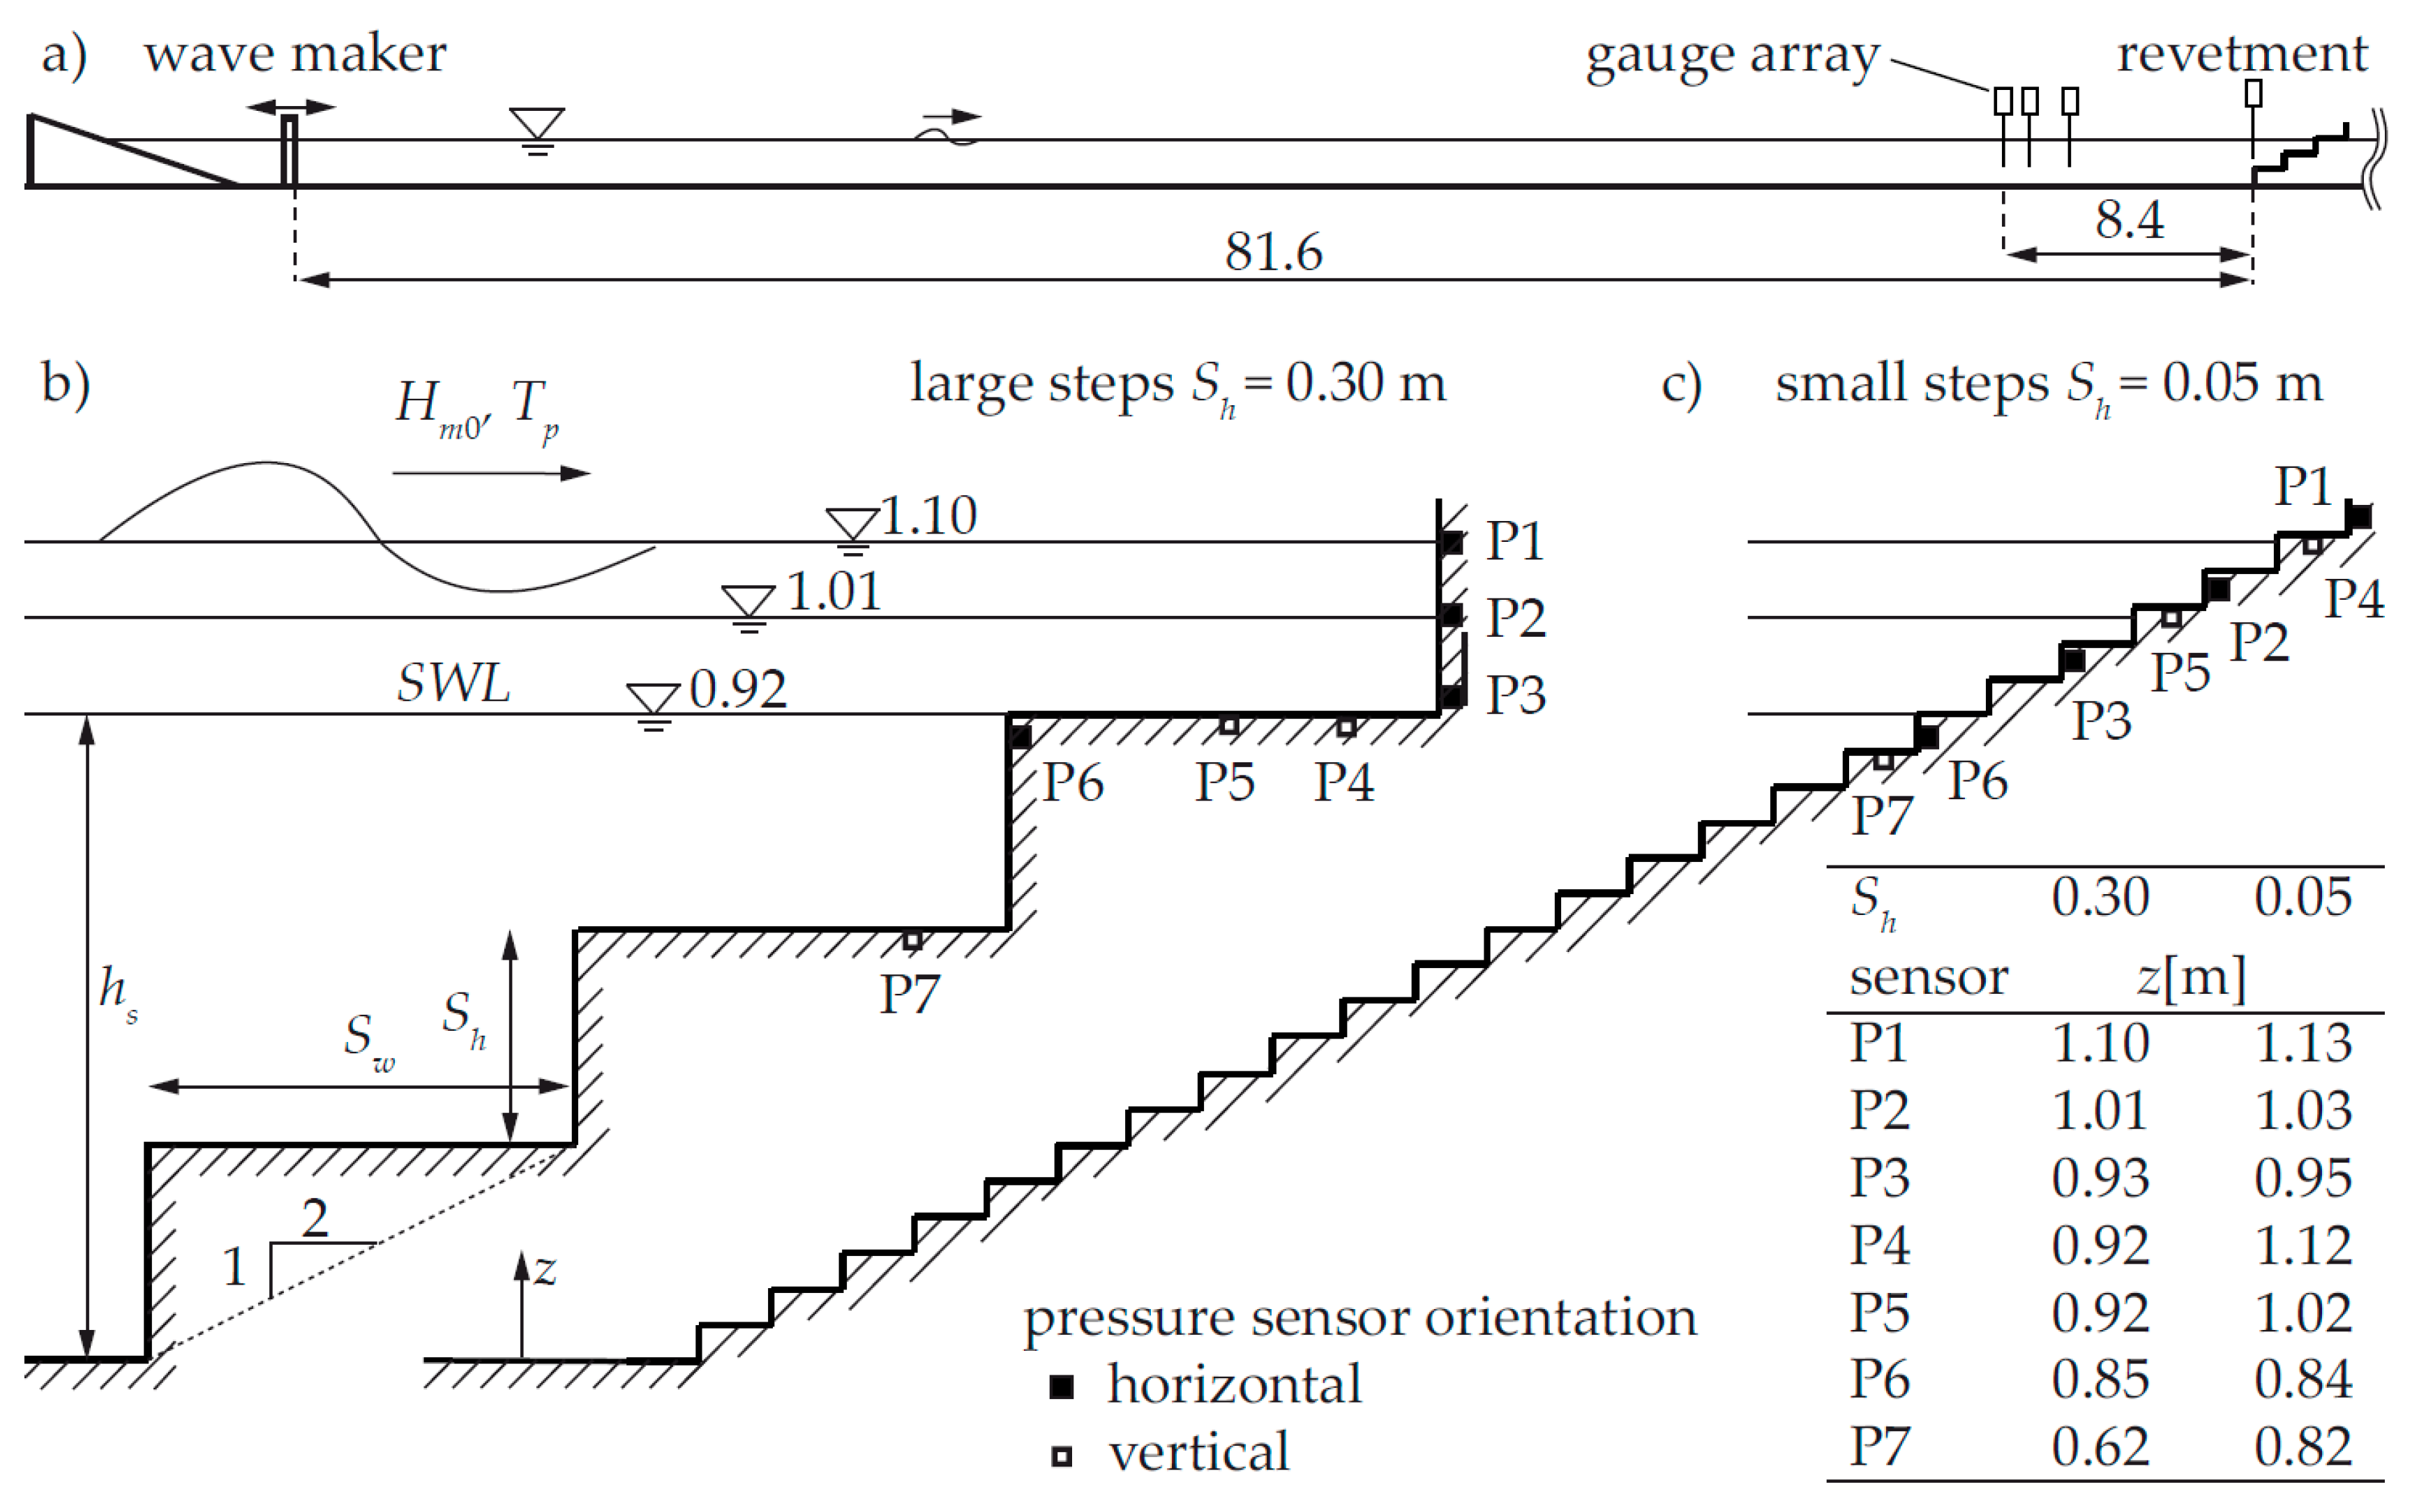
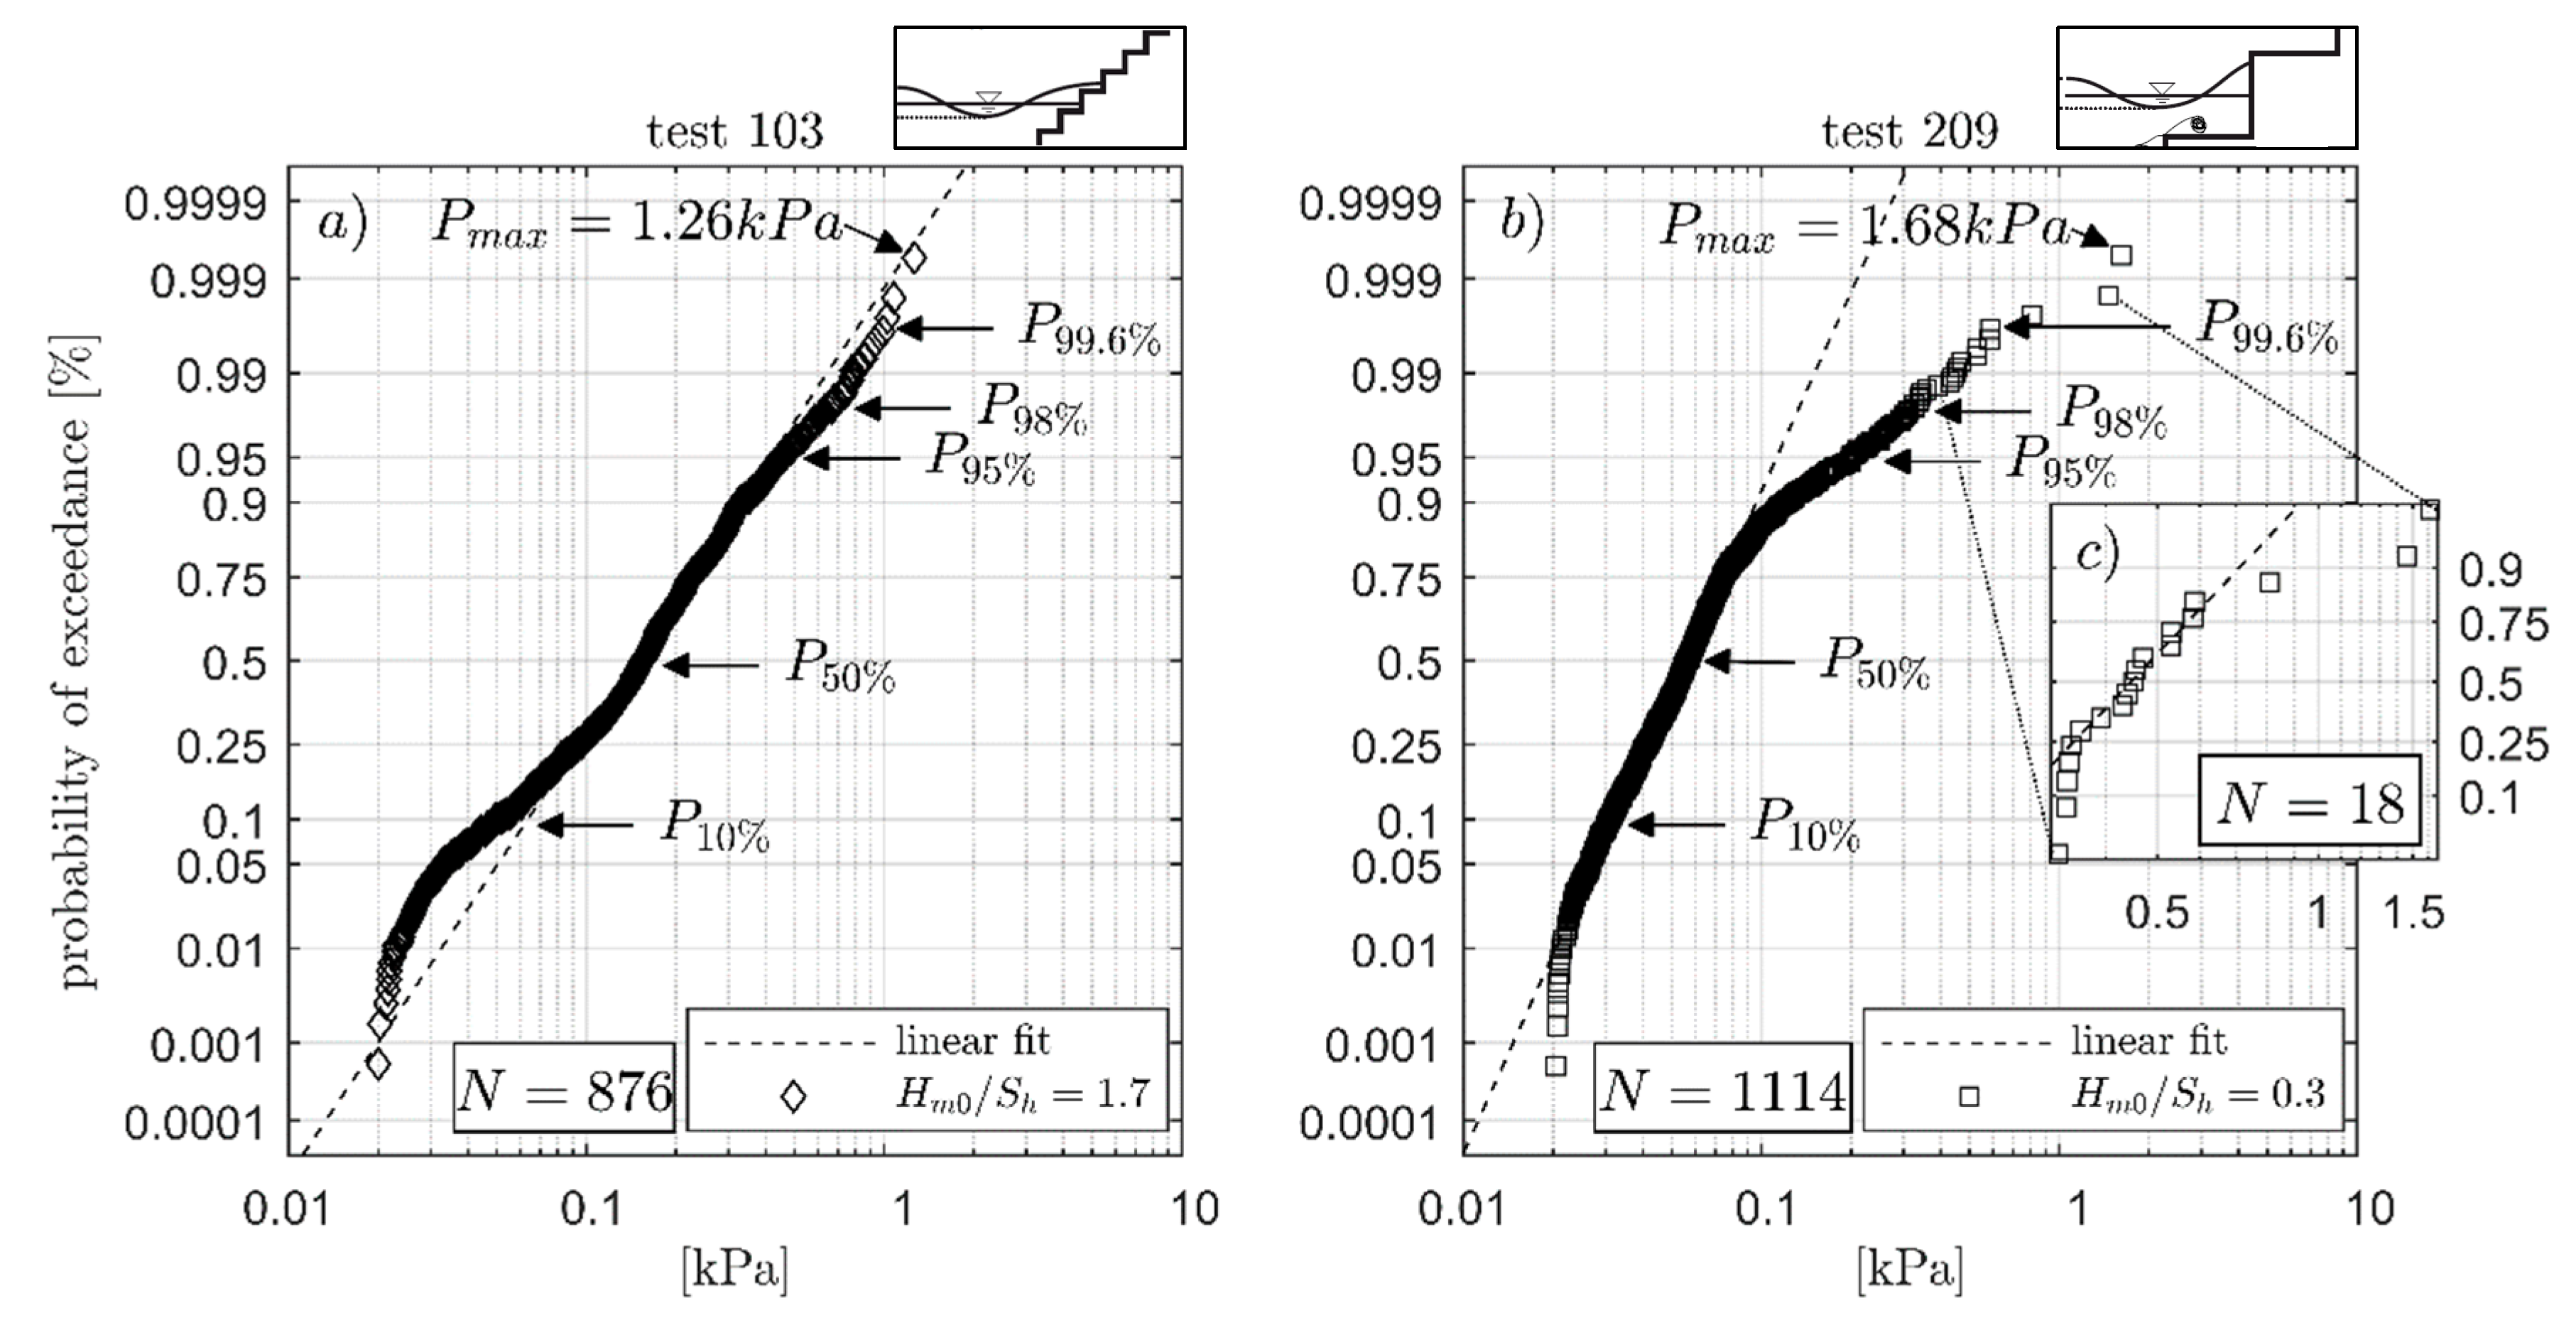
Figure 4 gives the log-normal probability distribution over the maximum impact pressure for two exemplary tests (test number 103 and 209 according to
Table 1). The tests were conducted with a spectral wave height of
Hm0 = 0.084 m and
Hm0 = 0.089 m (for test 103 and 209, respectively) and a corresponding Iribarren number of ξ = 2.9 (2.8 for test 209).
Figure 4a provides measurements of wave impacts on slopes with a small step height (
Hm0/
Sh = 1.68,
hs = 1.1 m, sensor
P1). A total of 876 individual wave impacts have been recorded with pressure sensor
P1 with a maximum recorded pressure impact of
Pmax = 1.26 kPa. The wave impacts are presented with a certain probability of exceedance. The figure presents an idealized normal-distribution, shown as a dashed line, as reference. As is evident from the presented figure, the wave impacts on this stepped revetment follow a log-normal distribution. Over and under predictions from the idealized normal-distribution given with the dashed line appear for impacts larger than
P95% and smaller than
P10%.
Figure 4b presents the log-normal distribution of wave impact pressures on a revetment with large steps (
Hm0/
Sh = 0.3,
hs = 0.921 m, sensor
P2) for the same hydraulic boundary conditions, as in
Figure 4a. The maximum pressure impact
Pmax of 1114 individual impacts is 1.68 kPa, which is about 35% larger when compared to the small steps. As for
Figure 3c, slight deviations from the ideal log-normal distribution are detected for impacts smaller than
P10%, while impacts larger than
P90% deviate significantly from this trend. These deviations indicate that the influence of the wave-interaction with large steps differs for high and low impact scenarios. The apparent difference in the wave breaking and wave run-up at these large steps compared to slopes with and without smaller steps (
Figure 3) is a significant transformation of the incident wave which breaks over the very shallow horizontal step front. Hence, the log-normal distribution of the induced pressures of incident wave heights is disturbed and transformed over large steps directly at the structure, and in analogy, the wave impact distribution is affected. The increase in the wave impacts for large steps can be explained by the fact that the vertical step fronts fall completely dry during the run-down process, whereas for small step heights, there is always a thin water flow remaining from the previous run-down. This thin water layer (often aerated) reduces the wave impact of the next breaking wave.
In parallel, the geometry of a wave front has a significant influence on its resulting wave impact. Generally, the wave height plays a dominant role. It is observed, that small wave heights in the spectrum lead to pulsating extreme loads, whereas the largest waves lead to impacting loads. Distribution of wave impacts deviate strongly from the log-normal distribution for less frequent waves indicating occasional extreme loads on the structure, which is most relevant for practical design attempts. Reference [
14] indicated that for vertical walls impacts smaller than 0.4
Pmax are based on pulsating loads and larger impacts on impacting loads. Reference [
15] found that often only a part of all impacts show a good agreement with the log-normal distribution according to the stochastic pattern of the pressures in the impact area. This observation is confirmed for the present experimental configuration. In contrast, when re-considering only the highest impacts during one wave impact event on the area, it turns out that measured data points follow an almost linear relation in a log-normal plot. Hence,
Figure 4c gives a detailed log-normal probability distribution of only the 18 largest impacts (>
P98%) of test 209, confirming evaluations stemming from Reference [
15] to be also valid for stepped revetments.
It can be seen from the left-hand side of this diagram that only a part of them show good agreement with the log-normal function according to the stochastic pattern of the pressures in the impact area. However, if the highest pressure on the area during one wave impact event is selected and plotted in log-normal scale the measured points nearly fall on a straight line which verifies the log-normal distribution.
4.2. Temporal Evolution and Load Cases of Impact Pressures
The temporal evolution of wave impact pressures on vertical structures was initially categorized by Reference [
6] and analyzed in depth by Reference [
16]. According to Reference [
16], impacting loads on vertical structures are defined as impact peaks that are minimum 2.5 times larger than the subsequent quasi-static peak
Pq. Partially breaking waves induce peaks in a range of 1.0 <
Pmax/
Pq < 2.5. Pulsating impacts due to standing waves occur when the impact peak and its subsequent quasi-static peak
Pq are in the same order of magnitude.
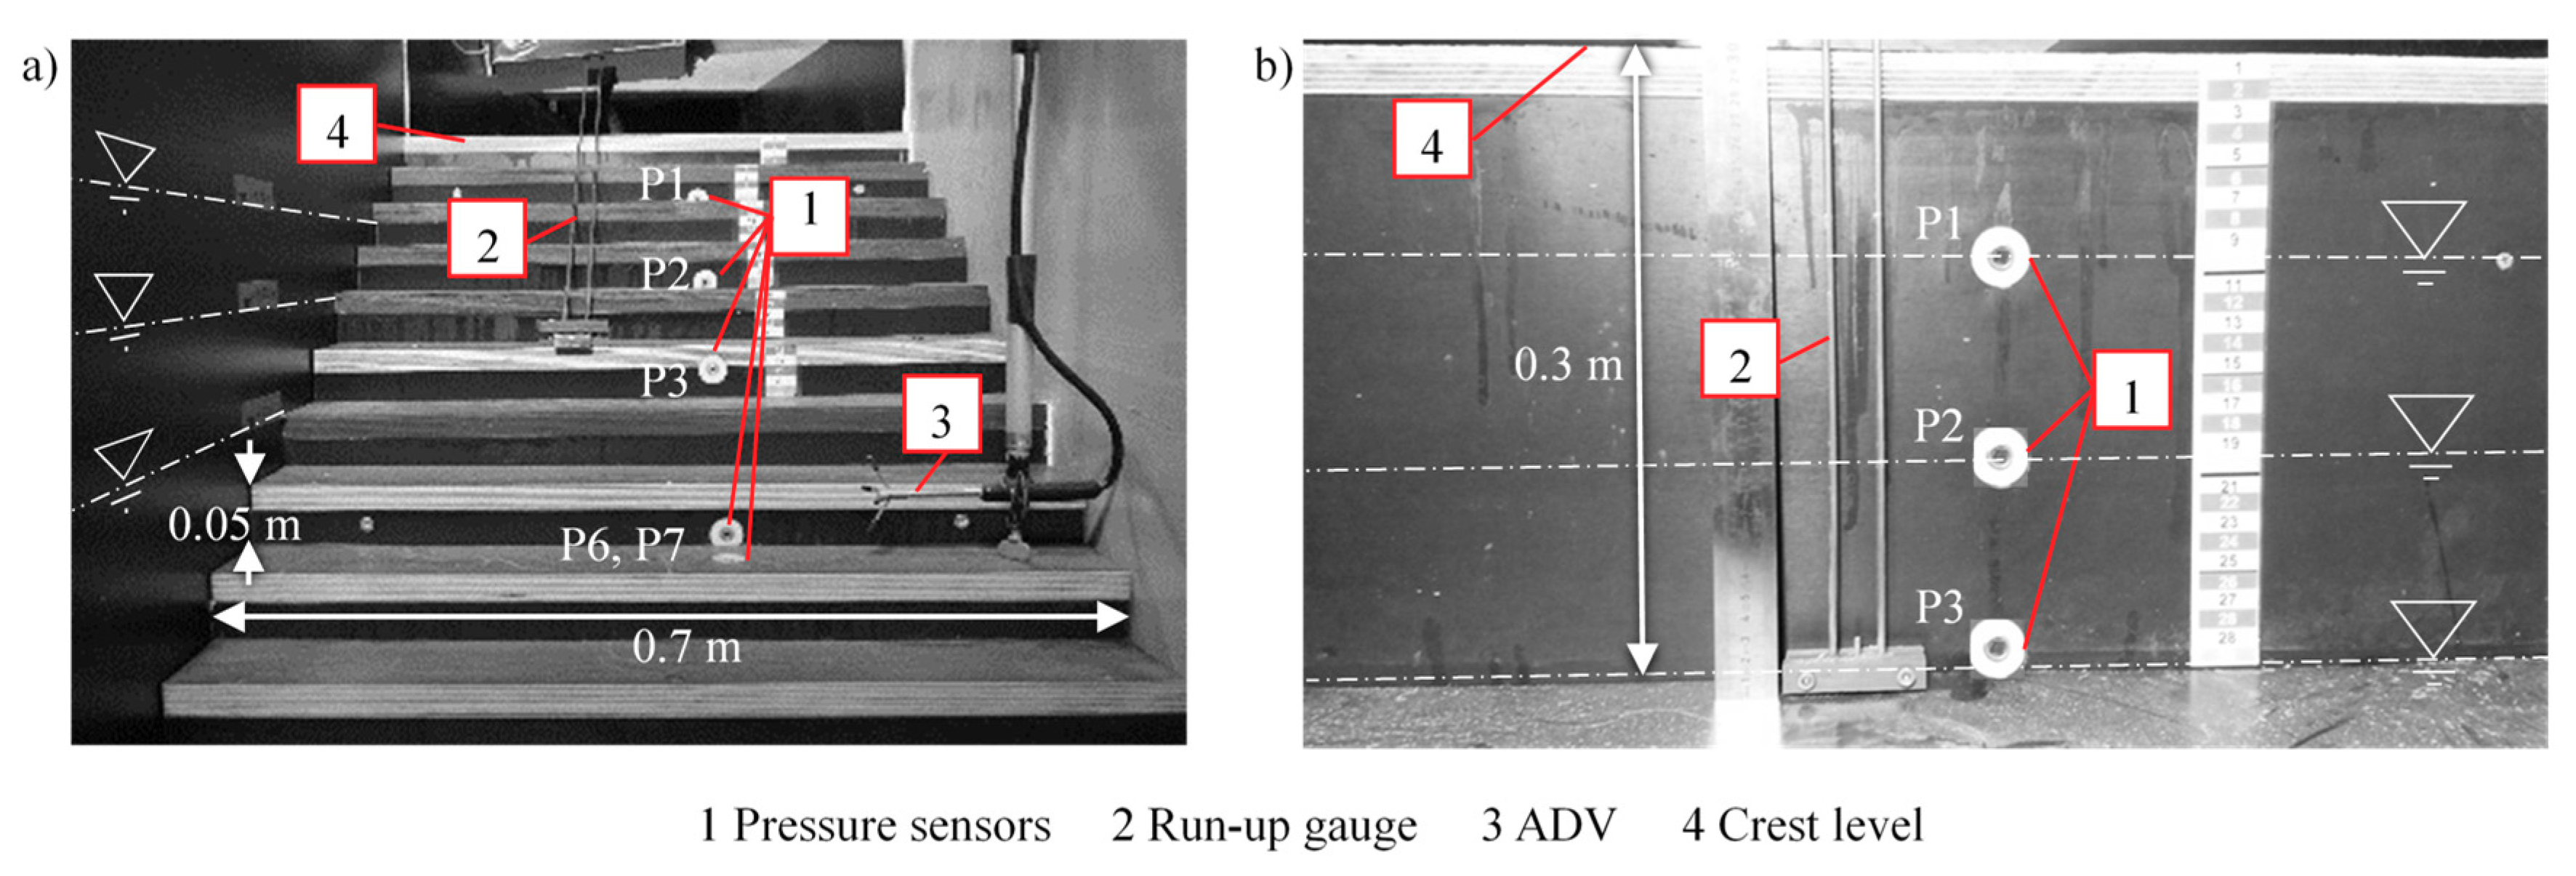
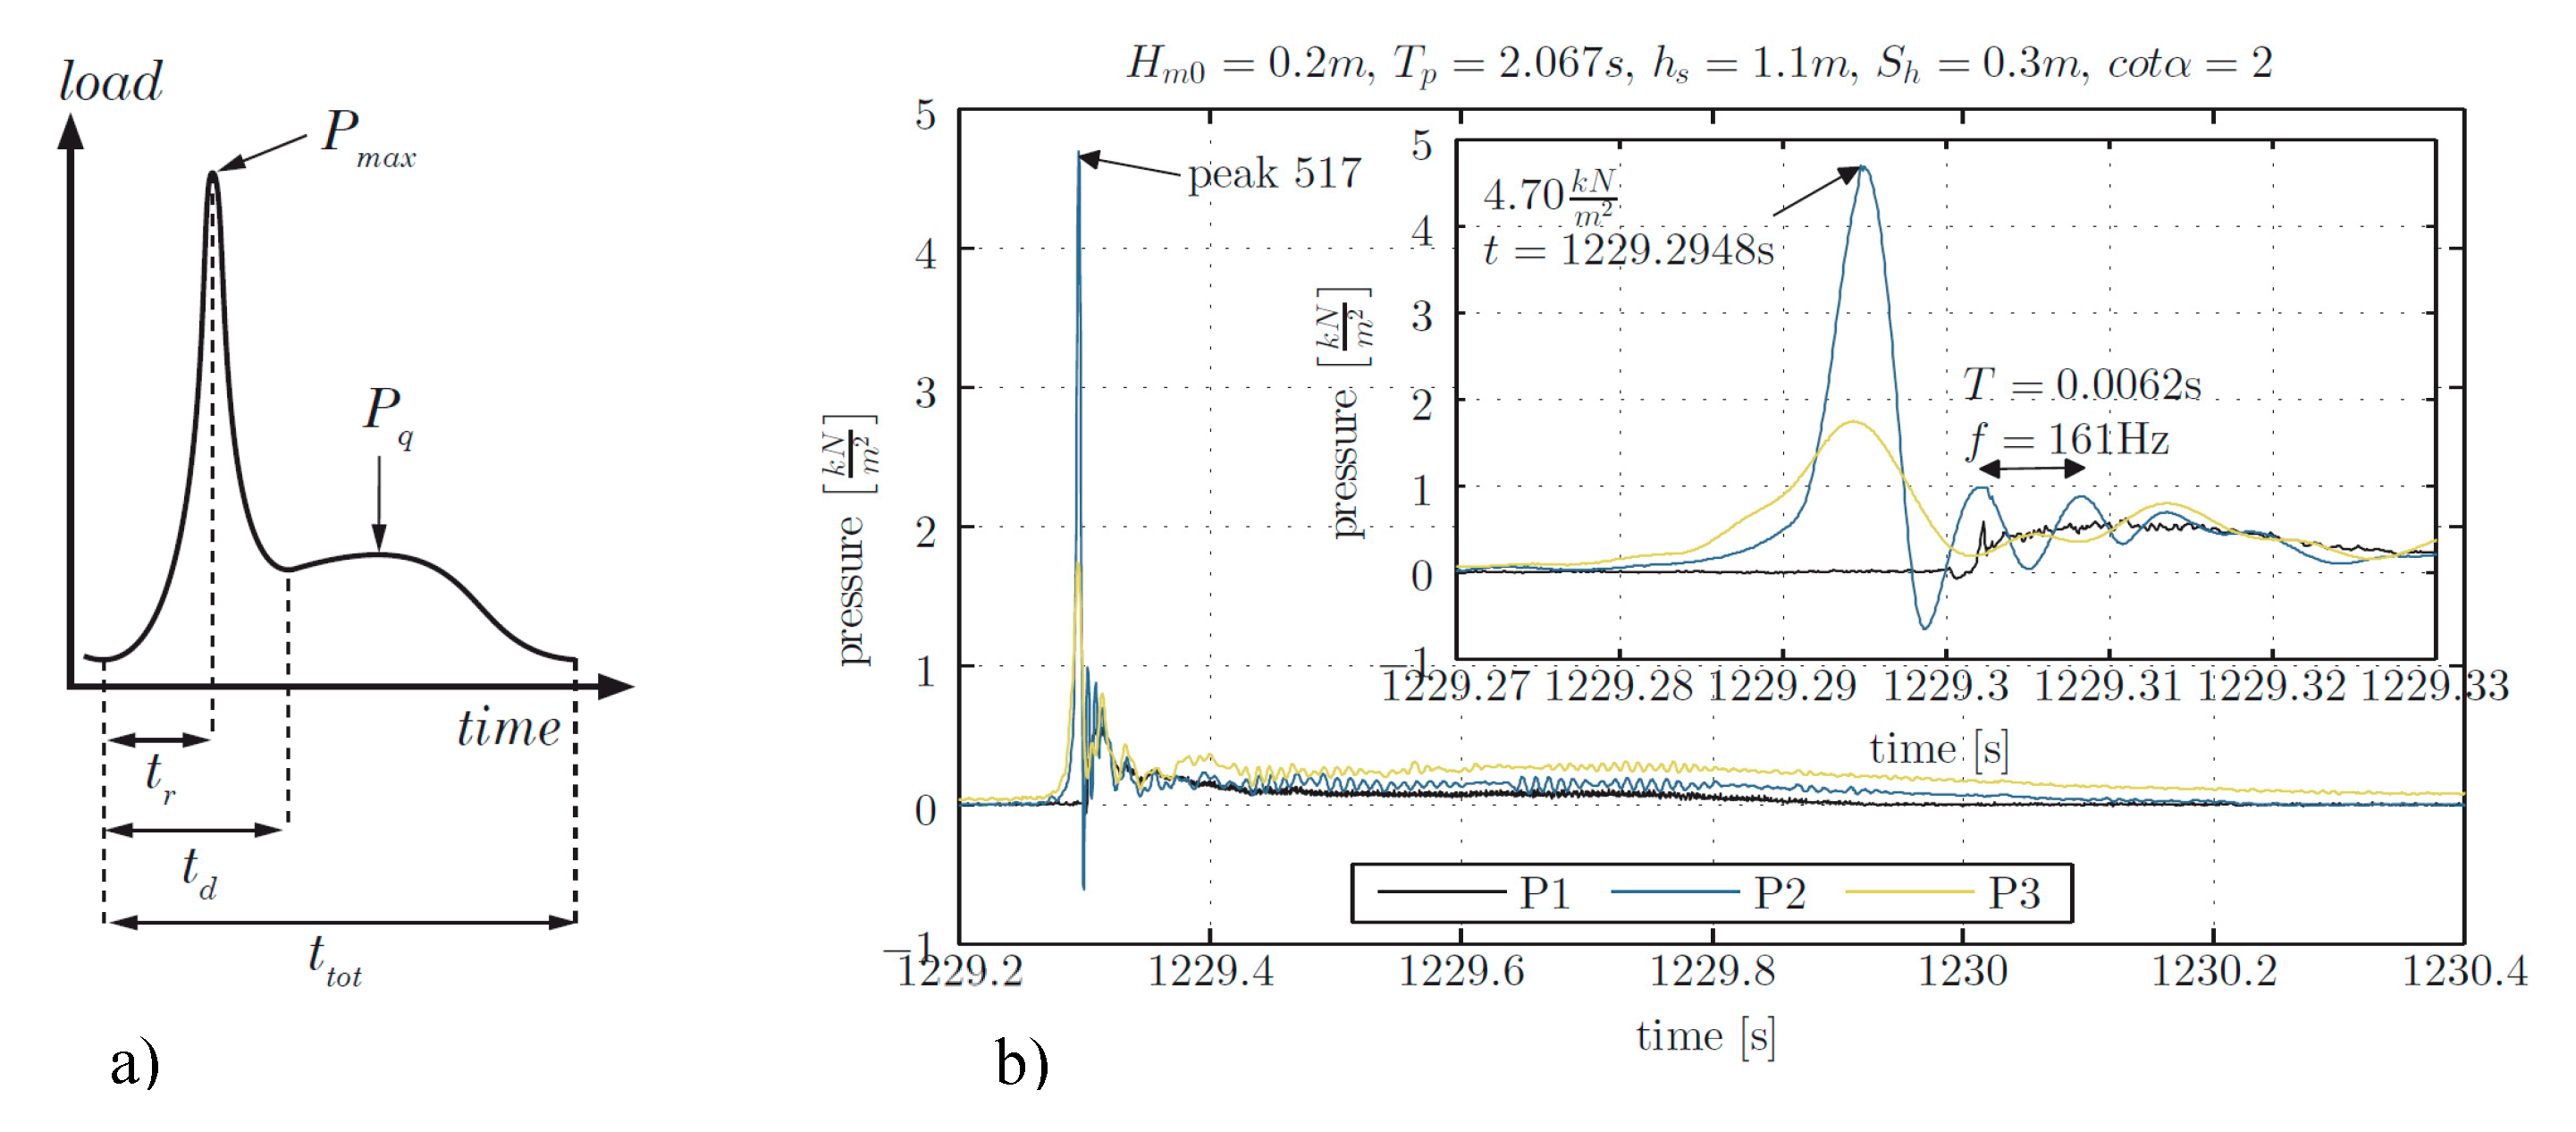
Figure 5 sketches a parameter definition describing both a pressure impact event (a), and an exemplary time series of the maximum impact event during test 204 for horizontal oriented pressure sensors
P1,
P2, and
P3 (b). A typical time evolution with an impact and subsequent quasi-static peak is observed. The highest impact is recorded by sensor
P2, which is located near the still water level
SWL. The oscillation of the signal and negative pressures, as also observed by Reference [
8], are interpreted as characteristically mimicking physical processes of turbulence and air entrainment occurring at the base of each revetment step. With increasing distance to the
SWL, the impact amplitude decreases (
P1 and
P3). While sensor
P2 recorded a violently impacting load,
P1 was impacted by a slightly breaking wave and
P3 experienced a pulsating impact.
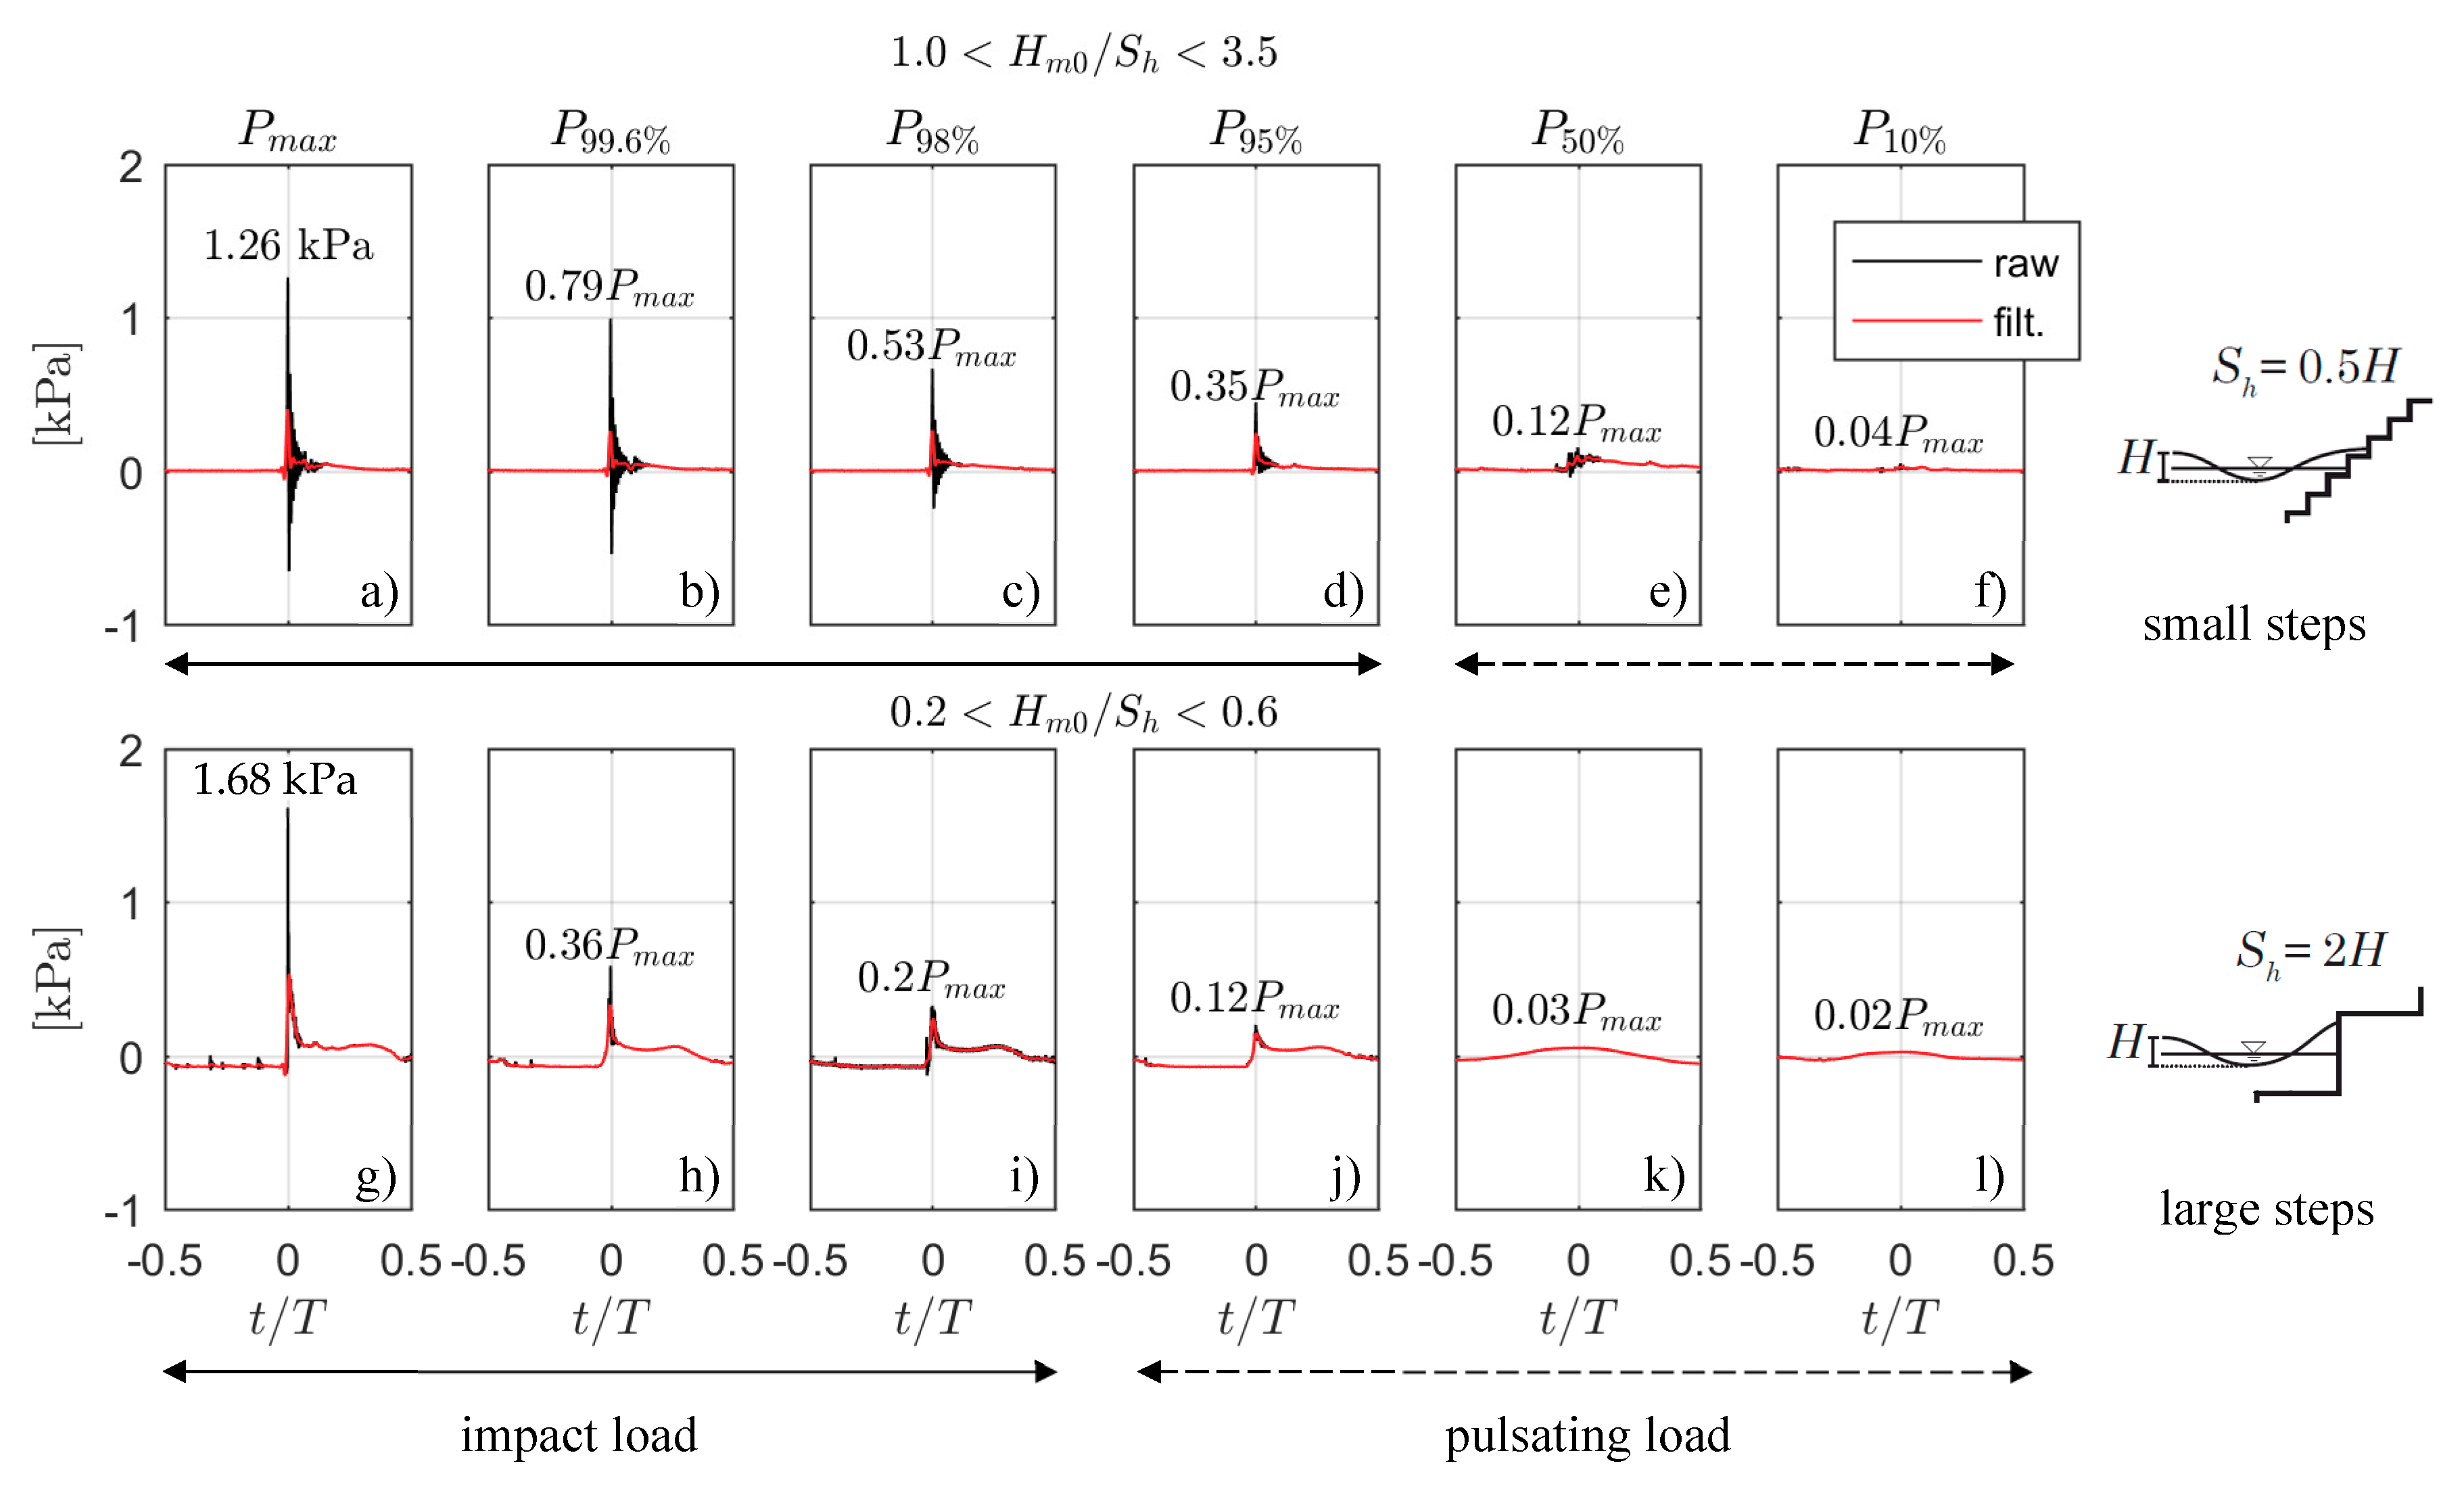
Figure 6 presents the normalized time evolution of impact events with a certain probability of exceedance for a 1:2 stepped slope with large (test 103) and small step heights (test 209). These tests were conducted with a similar spectral wave height and wave steepness (
Table 1). Raw data (black line) are given to indicate the largest impact. A filtered time series (red line, 6th order low pass filter with 38.4 Hz cut-off frequency) is superimposed in order to highlight a clearer temporal progress. Subfigures (a–f) correspond to step ratios of
Hm0/
Sh = 1.7 (small steps) and subfigures (g–l) to step ratios of
Hm0/
Sh = 0.3 (large steps). Each subfigure displays the measured impact event of a certain probability of exceedance (
Pmax to
P10%) over the relative time. The time
t is normalized by the wave period
Tm–1,0. Time step
t/T = 0 is set at the time of maximum impact. Each peak impact (based on the raw data) is given proportionally to the maximum measured peak
Pmax of the entire test duration.
The maximum measured impact for the small steps (a) was 1.26 kPa, which is about 30% lower than the maximum impact for large steps (g). For the large steps the maximum peak amplitude decays more rapidly with increasing probability of exceedance than for the small steps. In the case with smaller steps, a peak amplitude of about 35% of the maximum impact Pmax is reached by 5% of all impact events (P95%) (d), whereas in the case of the large steps (h), it is only 0.4% (P99.6%) of all impact events.
A comparison of the occurring load cases defined by Reference [
16] elucidates that large steps (
Hm0 <
Sh) demonstrate a behavioral function like vertical walls in reflecting incoming wave energy. Functional processes are mimicked in two distinct phases: A clear initial impact followed by a quasi-static peak
Pq. For small steps (
Hm0 >
Sh) the impact peak is also clearly visible, but the subsequent quasi-static peak
Pq is not as prominent as for large steps or vertical walls. These differences are caused due to different flow principles. At large steps, the water level in front of the step front is constantly rising after the initial impact, thus inducing the quasi-static load. At small steps, which dissipate energy from the up-rushing wave tongue, a highly aerated flow emerges after the initial impact (
Figure 3f,g) and the absolute depth under the wave crest is evidently lower. This leads in general to smaller quasi-static peaks. For the specific case presented in
Figure 6, impacting loads are observed in the range of about 5% of all impacts at the small steps and 2% of all impacts at the large steps. The initial violent impact dissipates more energy than a pulsating load induced by wave run-up. As a result, it can thus be deduced that the overall energy dissipation at small step heights is larger, i.e., more effective. Furthermore, the impact-mitigating effect due to the practically permanent existence of a thin water layer on top of the individual small steps of the revetment during the wave run-down phase stemming from the preceding wave (
Figure 3) plays a dominant role in impact reduction.
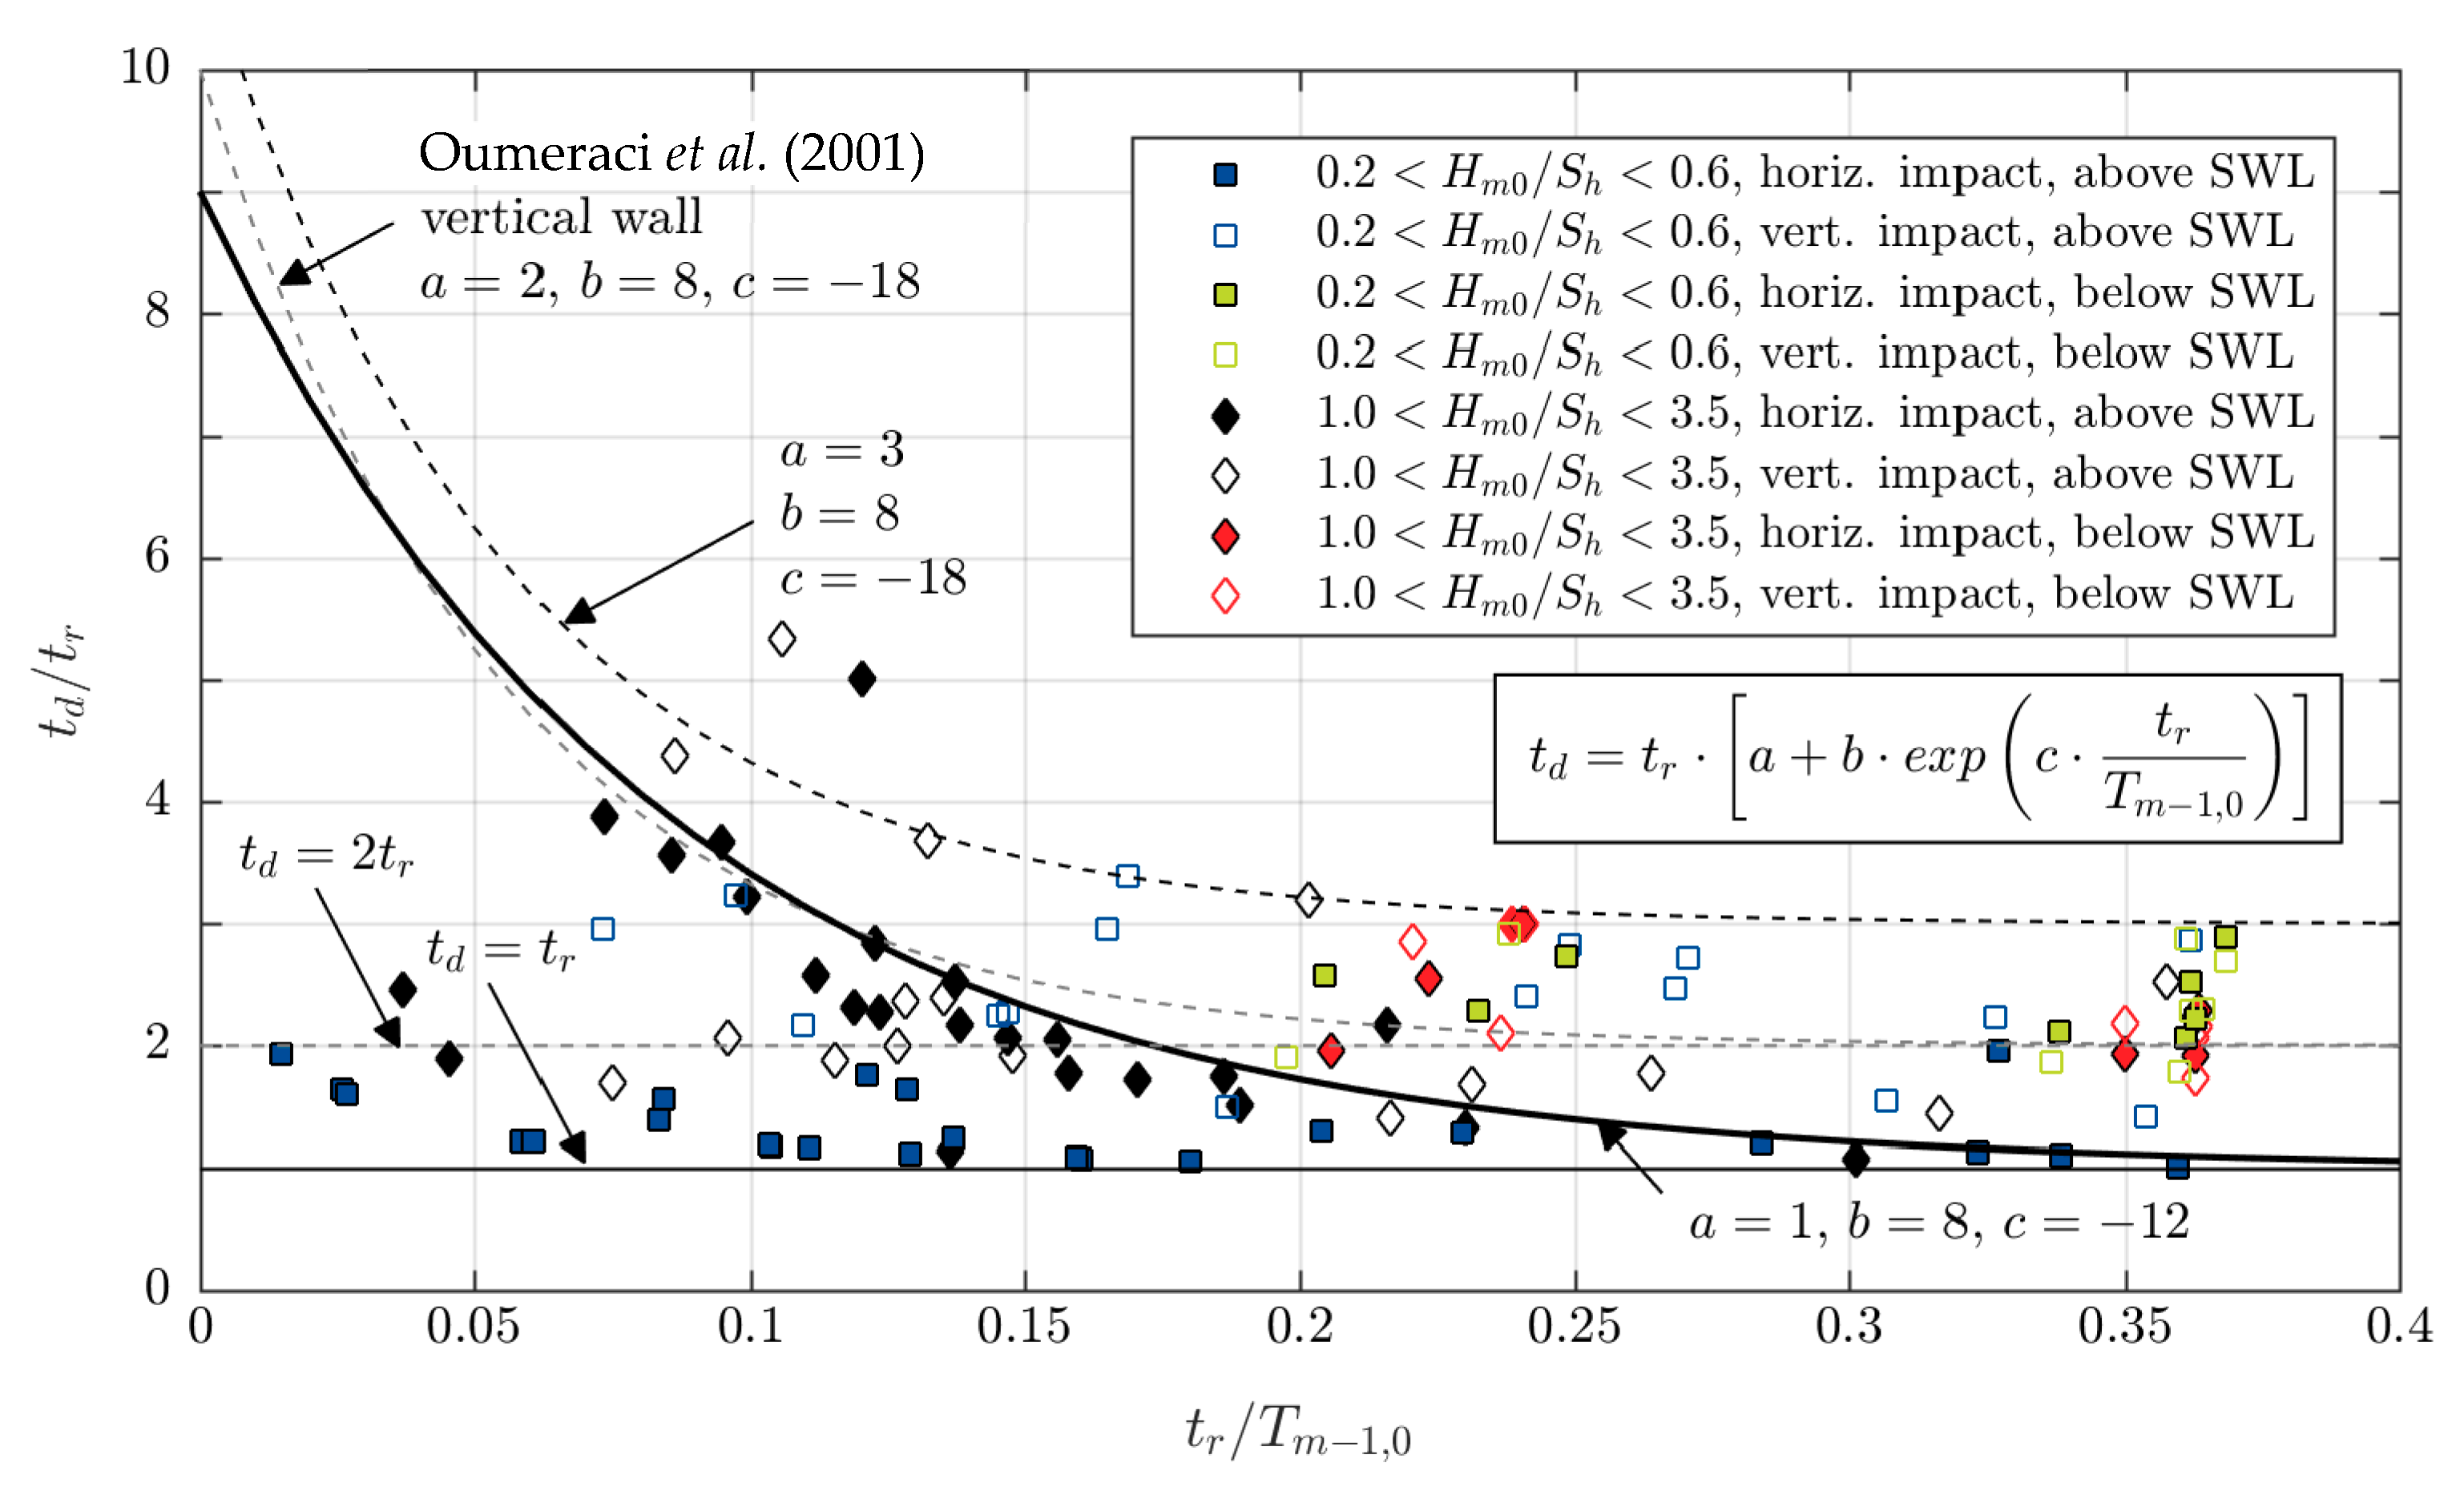
The characteristics of an impact pressure on stepped revetments can be described by the rising time
tr and impact pressure duration
td, as defined in
Figure 7 and depicts the correlation between the dimensionless impact duration
td/
tr and the dimensionless impact rising time
tr/
Tm–1,0. The data are grouped in terms of the step ratios
Hm0/
Sh, the direction of the measured wave impact (horizontal or vertical with respect to gravity) and the position of the impact (above or below the still water level
SWL). As a meaningful reference,
Figure 7 presents the empirical projections for rising times and durations of impacts at vertical walls provided by Reference [
16]. Impacting load cases (
Pmax > 2.5
Pq) are characterized by a short relative rising time (0.02 <
tr/
Tm–10 < 0.2), while pulsating loads are distinguished by their longer peak durations (
tr/
Tm–10 > 0.2). The dominance of a peak is characterized by the relative impact duration
td/
tr. The highest impact loads (e.g.,
Pmax or
P99.6%) correspond to short relative impact durations
td/
tr in combination with a short relative rising time
tr/
Tm–10. The larger the relative impact duration
td/
tr, the more critical the impact gets in terms of causing damage or instability of the revetment.
Impacts measured on stepped revetments below the SWL (green and red markers) show relative rising times of tr/Tm–10 > 0.2. Horizontal impacts (filled marker) or vertical impacts (empty marker) have comparable impact rising times and impact durations. Below the SWL, no impacting load case was detected for either small or large steps. The recorded loads have a pure hydrostatic nature induced due to the water level changes induced by wave run-up and run-down over the pressure sensors. Stronger impacts are mitigated by means of a sufficient water layer (“cushion”) effectively sheltering the submerged steps’ fronts from more violent impacts. The stepped shape of the slope retards the wave run-down leading to a permanent water cover of the revetment below the SWL.
The relative impact rising time of horizontal impacts above the
SWL (filled blue squares for large steps 0.2 <
Hm0/
Sh < 0.6 and filled black diamonds for small steps 1.0 <
Hm0/
Sh < 3.5) ranges from very short impacts (
tr/
Tm–10 < 0.05) up to long load cases (
tr/
Tm–10 > 0.3). The latter ones represent a full run-up and run-down phase inducing pulsating loads. While the impacts at small steps show an increase in the peak duration for decreasing relative peak rising times up to
td = 4
tr, the maximum duration of
td = 2
tr is observed for large steps. This finding can be explained with the fact that impacts at large steps are often caused by breaking waves that directly hit the step front, whereas for small steps, the step fronts are covered by thin water layers. Rising times and peak durations of vertical impacts above
SWL (empty blue squares for large steps 0.2 <
Hm0/
Sh < 0.6) and empty black diamonds for small steps 1.0 <
Hm0/
Sh < 3.5) scatter significantly and do not follow a clear, yet visual trend. The formation and progression of an aerated water layer over the horizontal step front influences the recorded impact significantly and explains the scattering in the data. Pulsating loads can be explained by the water layer thickness during the wave run-up and run-down. Impacting conditions occur only very close to the
SWL. The impact rising times for vertical walls and stepped revetments are in the same range. Reference [
16] found a minimum peak duration of
td = 2
tr for vertical walls, whereas the minima for stepped revetments is
td =
tr. These differences may be due to the differences in the sampling frequency of the impact pressure sensors (0.6 to 1.0 kHz at [
16] and 19.2 kHz in the present study). Lines of best fit for the different load cases are calculated according to Equation (5) with corresponding regression coefficients
a,
b and
c given in
Table 2.
4.3. Spatial Distribution of Impact Pressures
For sloping structures the maximum wave impact resulting from depth-induced wave breaking occurs slightly below the
SWL [
12]. This section presents the maximum wave impacts on stepped revetments at different locations relative to the
SWL.
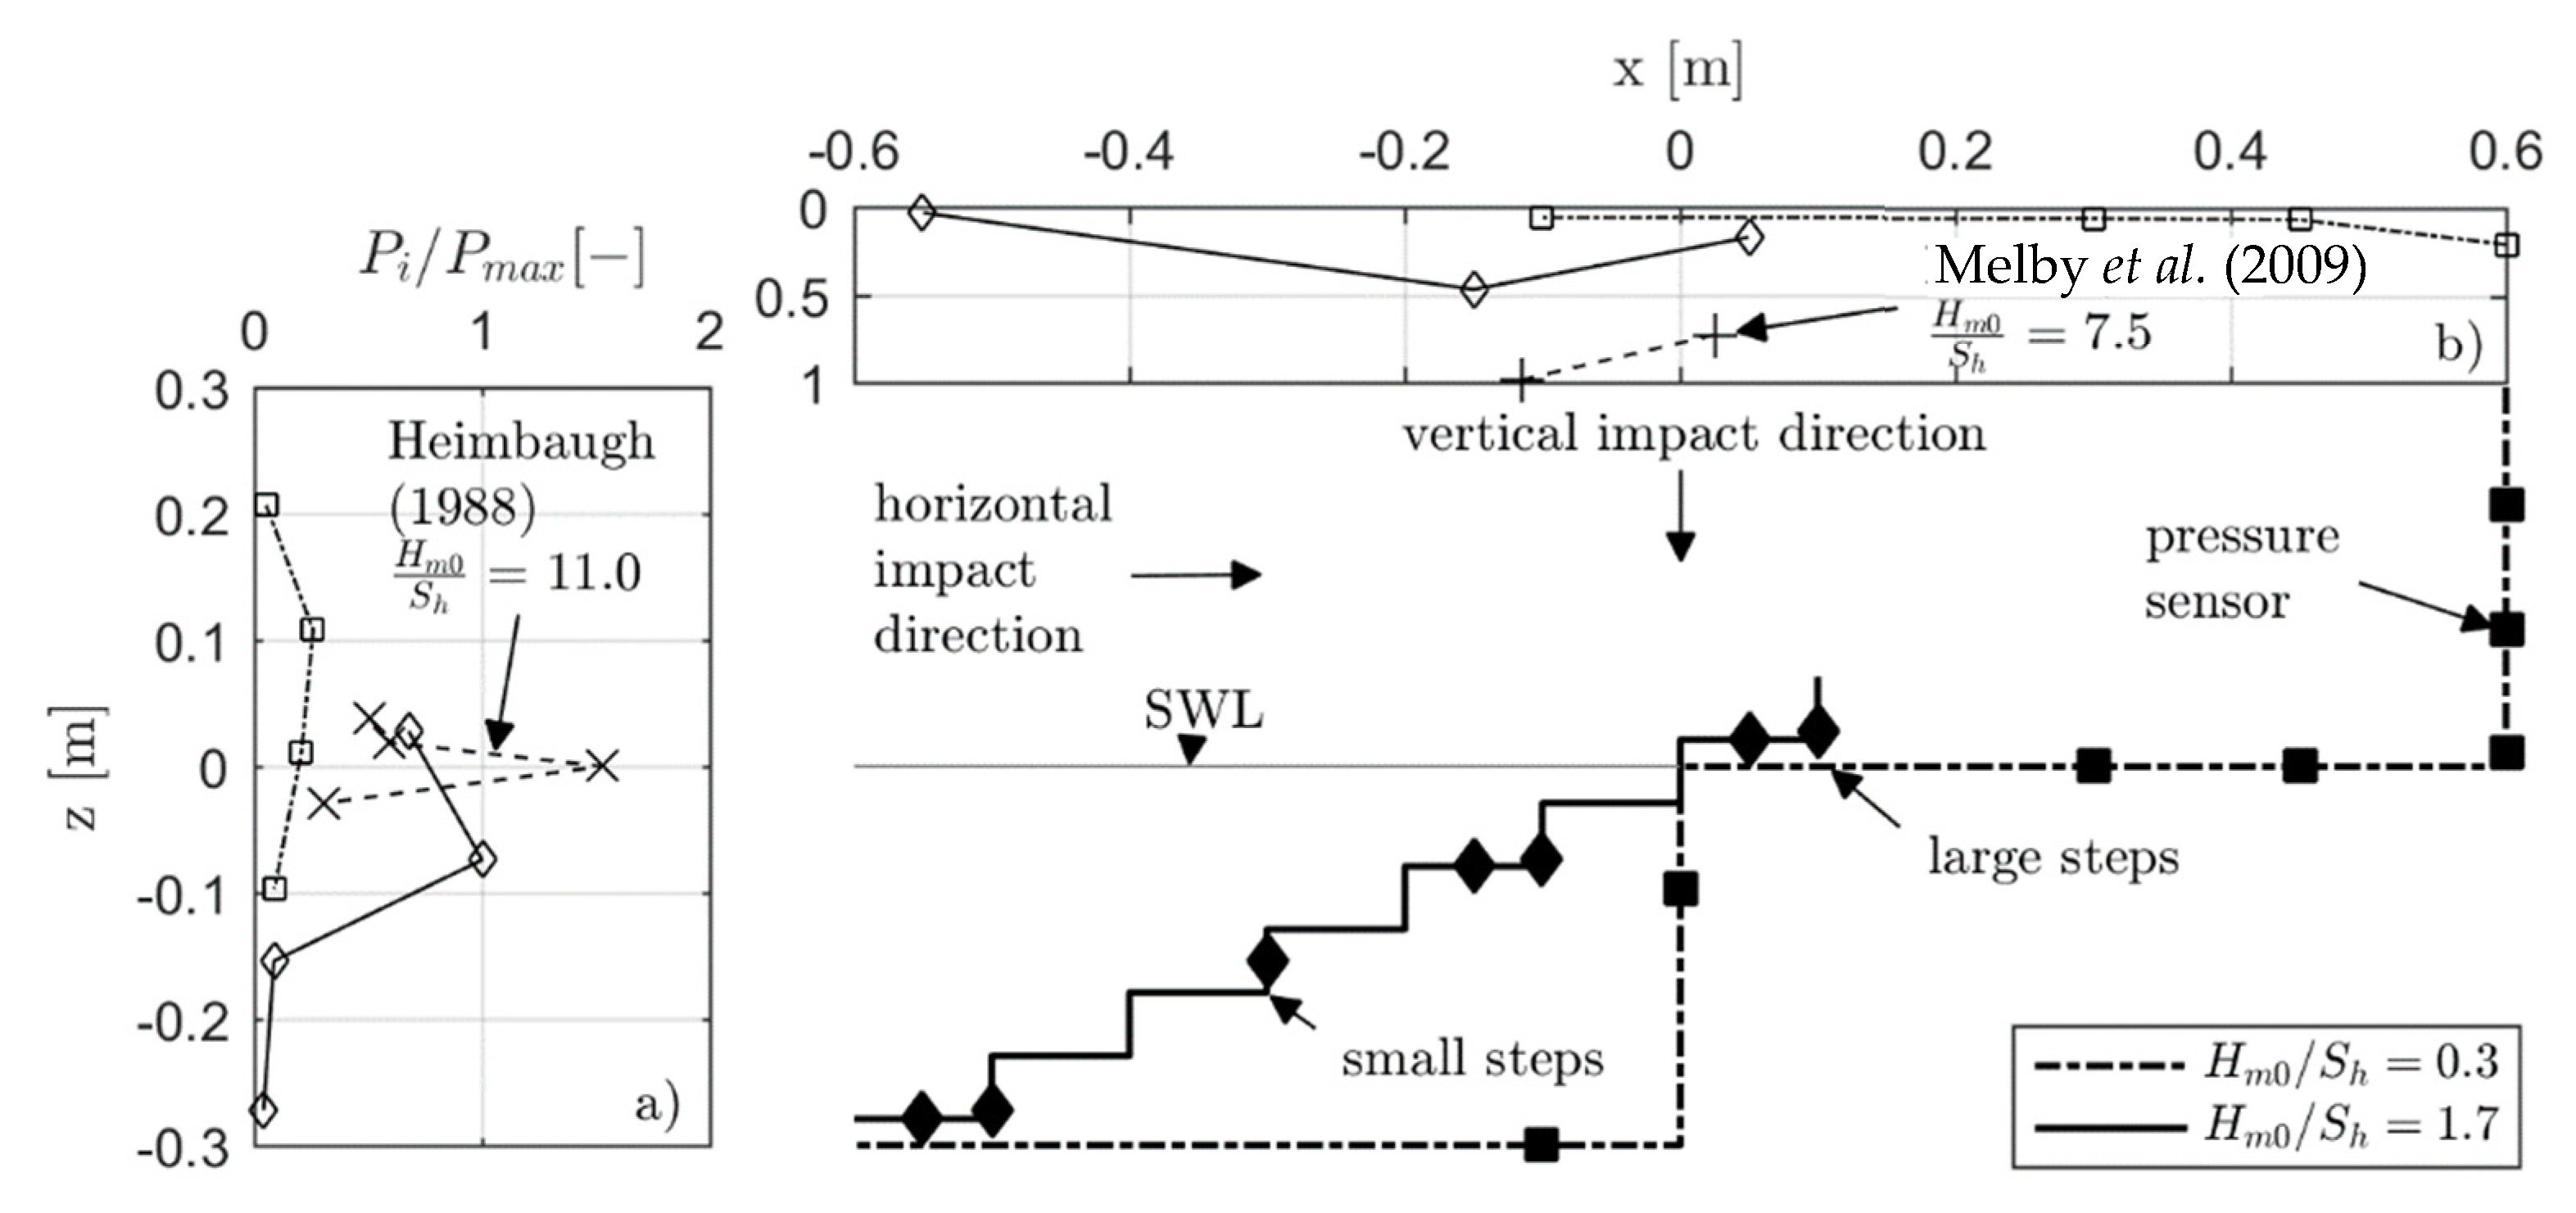
Figure 8 gives the horizontal (a) and vertical (b) relative maximum pressure impact distribution over large (dashed, Test 209) and small (solid, Test 103) stepped revetments. For each pressure sensor
Pj, the maximum impact
Pj,max is normalized by the maximum pressure impact of all compared sensors (
Pmax = max{
Pj,max}). For this case, the absolute maximum was recorded by sensor
P2 of the revetment with the small steps (compare
Figure 1).
The vertical distribution of horizontal wave impacts (
Figure 8a) shows that the maximum wave impact for all configurations occurs close to the
SWL. The impact loads decrease with increasing distance to the
SWL . Below the
SWL, the pressures are reduced by the presence of the water body, which mitigate the impact of a breaking wave. Above the
SWL the energy of the breaking wave is less due to the decrease of the potential energy (reduced drop height). Impacts above the SLW are often caused by the secondary impact of the breaking wave during the wave run-up or due to splashes induced by the primary wave impact close the
SWL. For Test 209 the
SWL is directly located at the edge of the large step (
Hm0/
Sh = 0.3), while the maximum horizontal impact is about four times lower than at the small steps (Test 103,
Hm0/
Sh = 1.7). Additionally, data from Reference [
8] are shown. These data represent very small step heights (
Hm0/
Sh = 11) and indicate a maximum horizontal wave impact of about 1.5 times larger than for the steps with a step ratio of
Hm0/
Sh = 1.7. The smaller the step height in relation to the wave height, the higher the recorded horizontal loads become. The reduced impact for an increasing step height can be ascribed to the delayed run-down of the previous wave impact (compare
Figure 3a,e). This run-down causes a constant water layer on the revetment, which buffers the wave impact. Moreover, the plunging wave breaking at a 1:2 slope with small steps (
Hm0/
Sh ≥ 1.7) triggers impacting wave loads whereas the transformation of the breaking wave by large dominant step edges (
Hm0/
Sh = 0.3) leads to the formation of spilling wave breaking over the horizontal step front and triggers, thereby pulsating wave impacts.
The horizontal distribution of vertical wave impacts (
Figure 8b) shows that the maximum vertical wave impact for the small steps is located slightly below the
SWL. The maximum vertical impact has an amplitude of about 50% of the maximum horizontal impact (
Pmax,vertical = 0.5
Pmax,horizontal). Note that, in the context of the onshore-orientated wave propagation and wave breaking process, this finding is reasonable for design and constructional purposes in any practical applications of stepped revetments. The vertical impact for the large steps is negligible as it represents only the hydrostatic pressure induced by the overflow of the incident wave. Additionally, data from Reference [
10] are given. The relative step height of
Hm0/
Sh = 7.5 is comparable to the data set provided by Reference [
8] for horizontal wave impacts. The maximum presented impact is about two times larger than for the steps with a step ratio of
Hm0/
Sh = 1.7. An increase in the vertical impact loads is observed for decreasing step heights and is explained analogous to the horizontal wave impact.
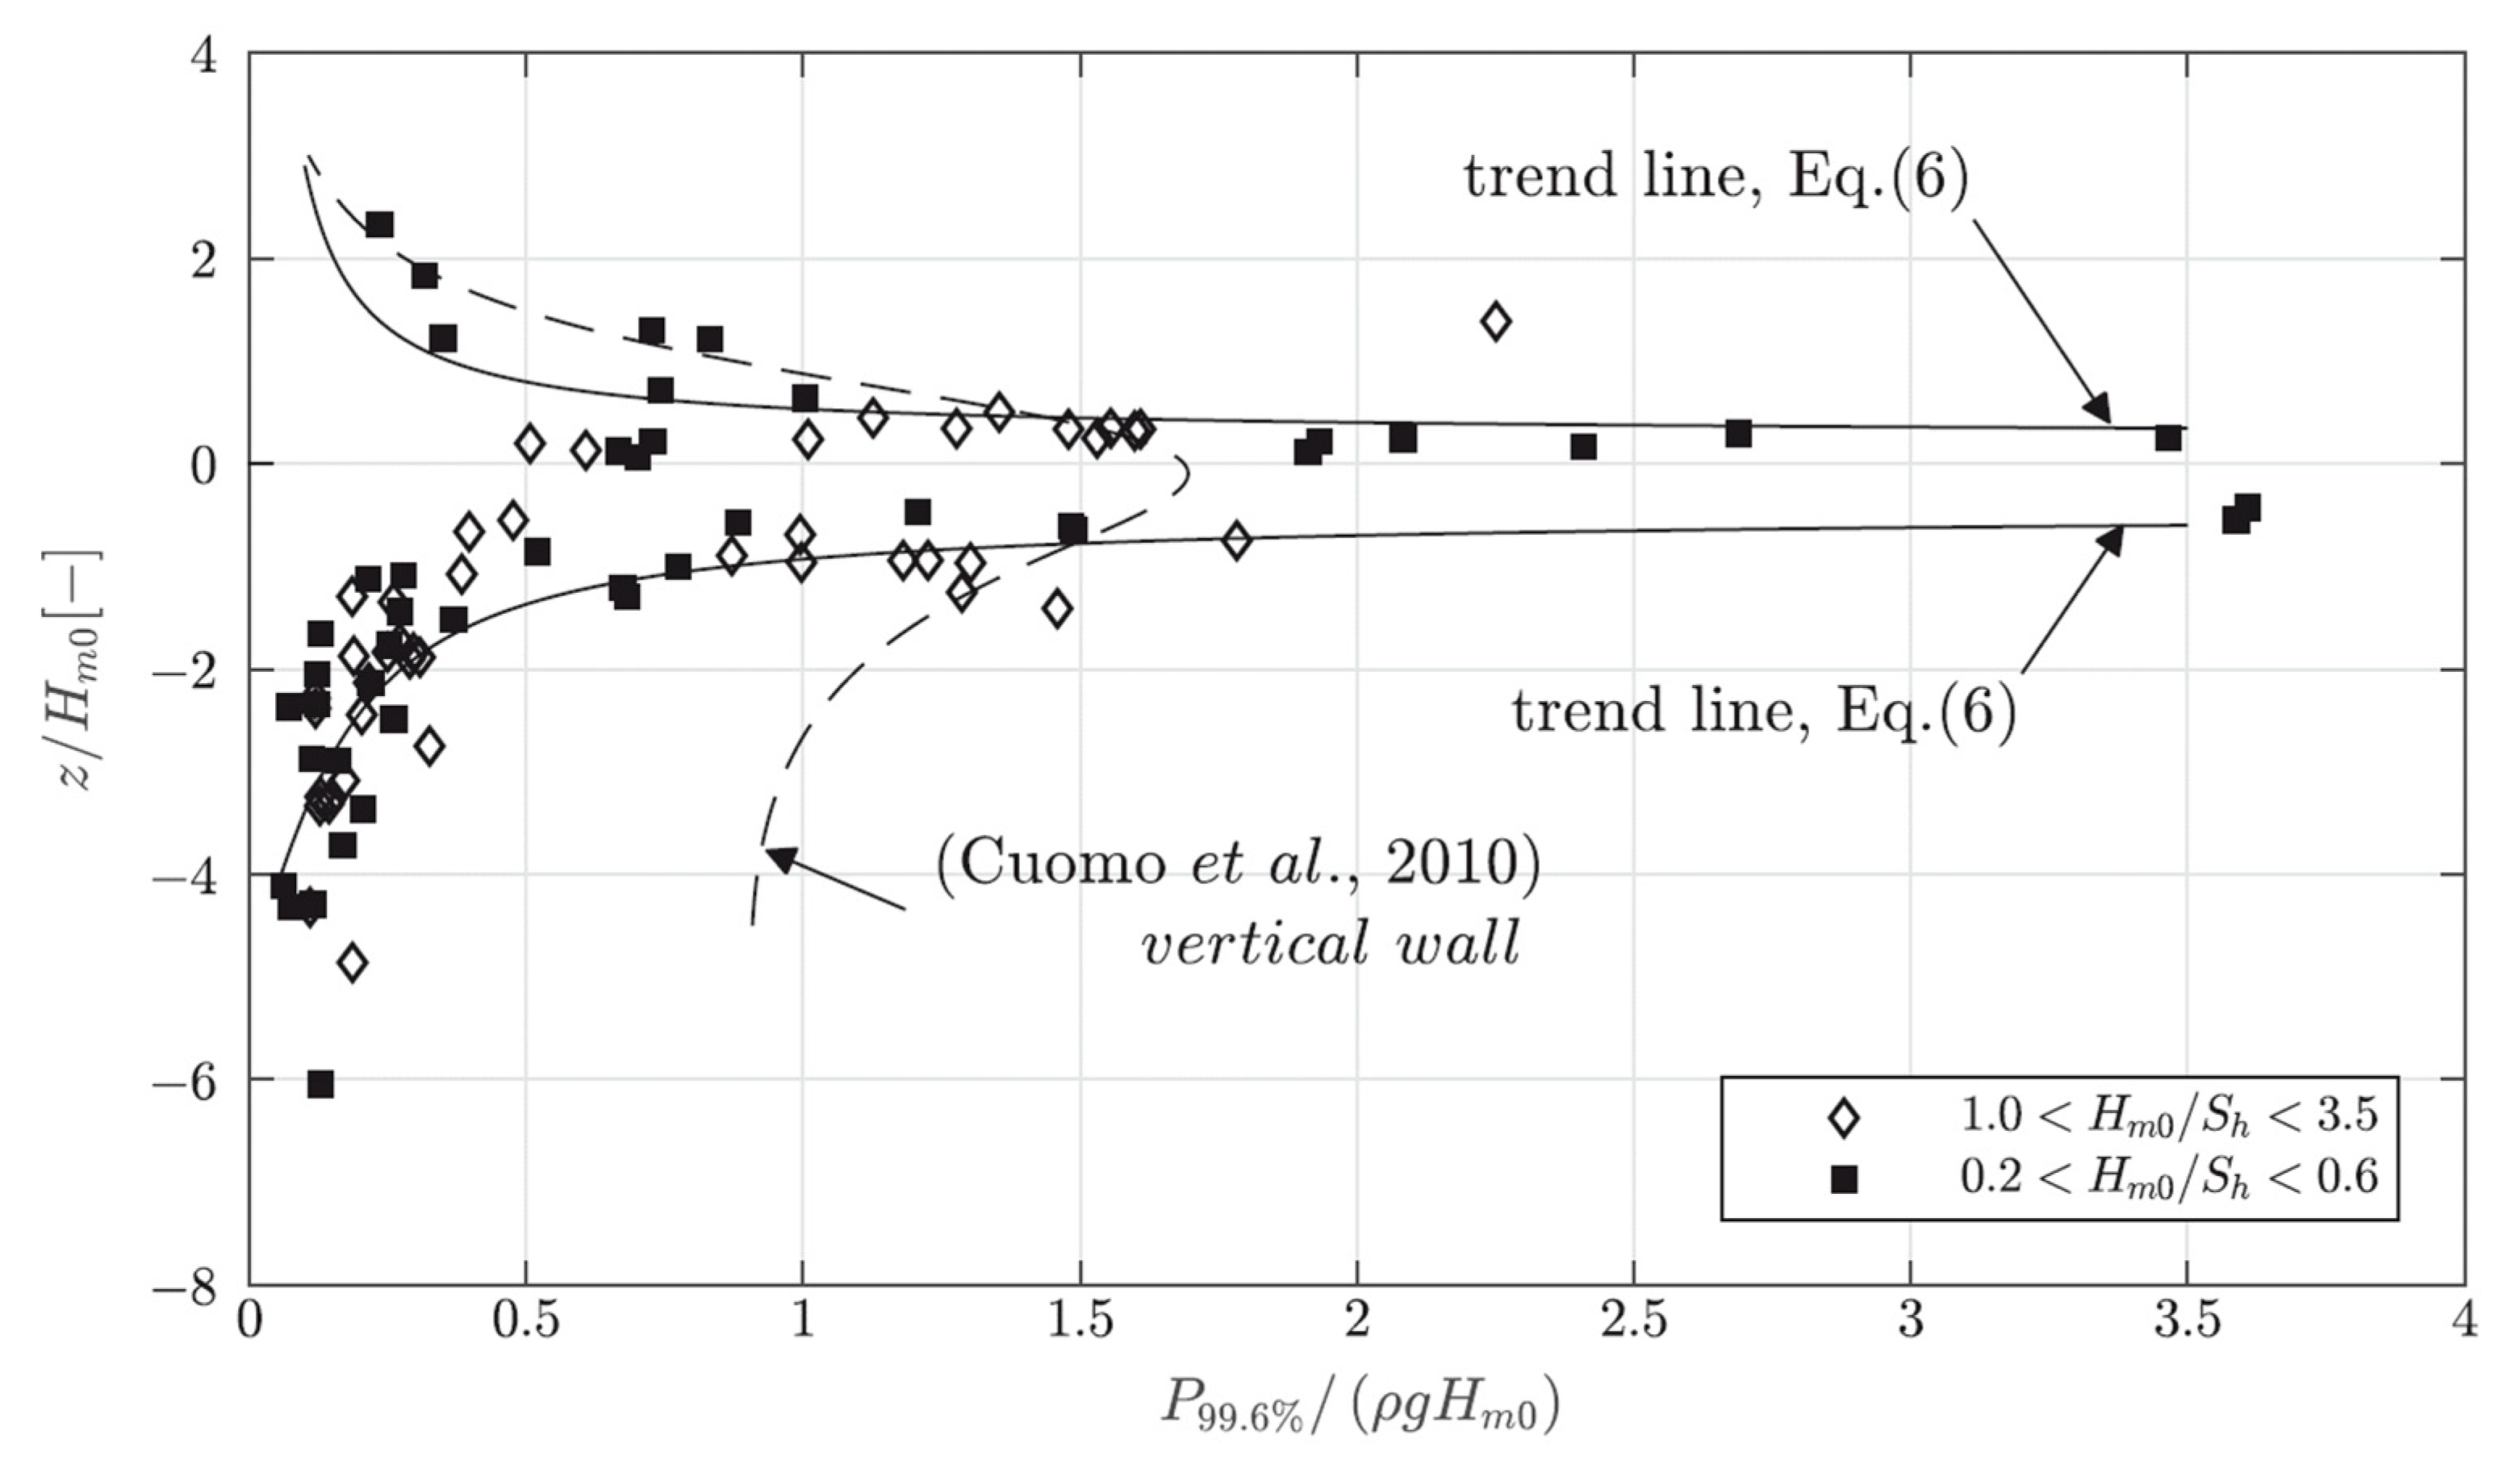
Figure 9 provides a non-dimensional relation between the pressure impact normalized by water density ρ, gravity
g, and spectral wave height to
P99.6%/(ρ
gHm0) on the abscissa and the relative position to the
SWL (
z/
Hm0) on the ordinate. The probability wave impact
P99.6% is selected following the approach of Reference [
11] to allow a comparison with the underlying data for wave impacts on vertical walls. For both examined step heights, the maximum pressure impact is close to the
SWL. The maximum pressure decreases significantly within a range of ±
z/
Hm0 around the SWL. Within a range of ±2
z/
Hm0, the normalized pressure impact becomes low. The
P99.6% wave loads measured over the stepped revetment tend to be about 50% smaller than those measured at a vertical wall. On the contrary, the impacts on the steps around the
SWL exhibit pressures peak impacts which are comparable to those measured on vertical walls by Reference [
11] (data points of single impacts not given in this figure scatter significantly along the abscissa). A dual-sided envelope curve (Equation (6)) with coefficients
a,
b and
c according to
Table 3 representing the best fit of data (coefficient of determination:
R2 = 0.62,
STD = 0.189) is given to describe the correlation of the vertical distribution
z/
Hm0 of horizontal impacts 0.01 <
P99.6%/(ρ
gHm0) ≤ 3.6.
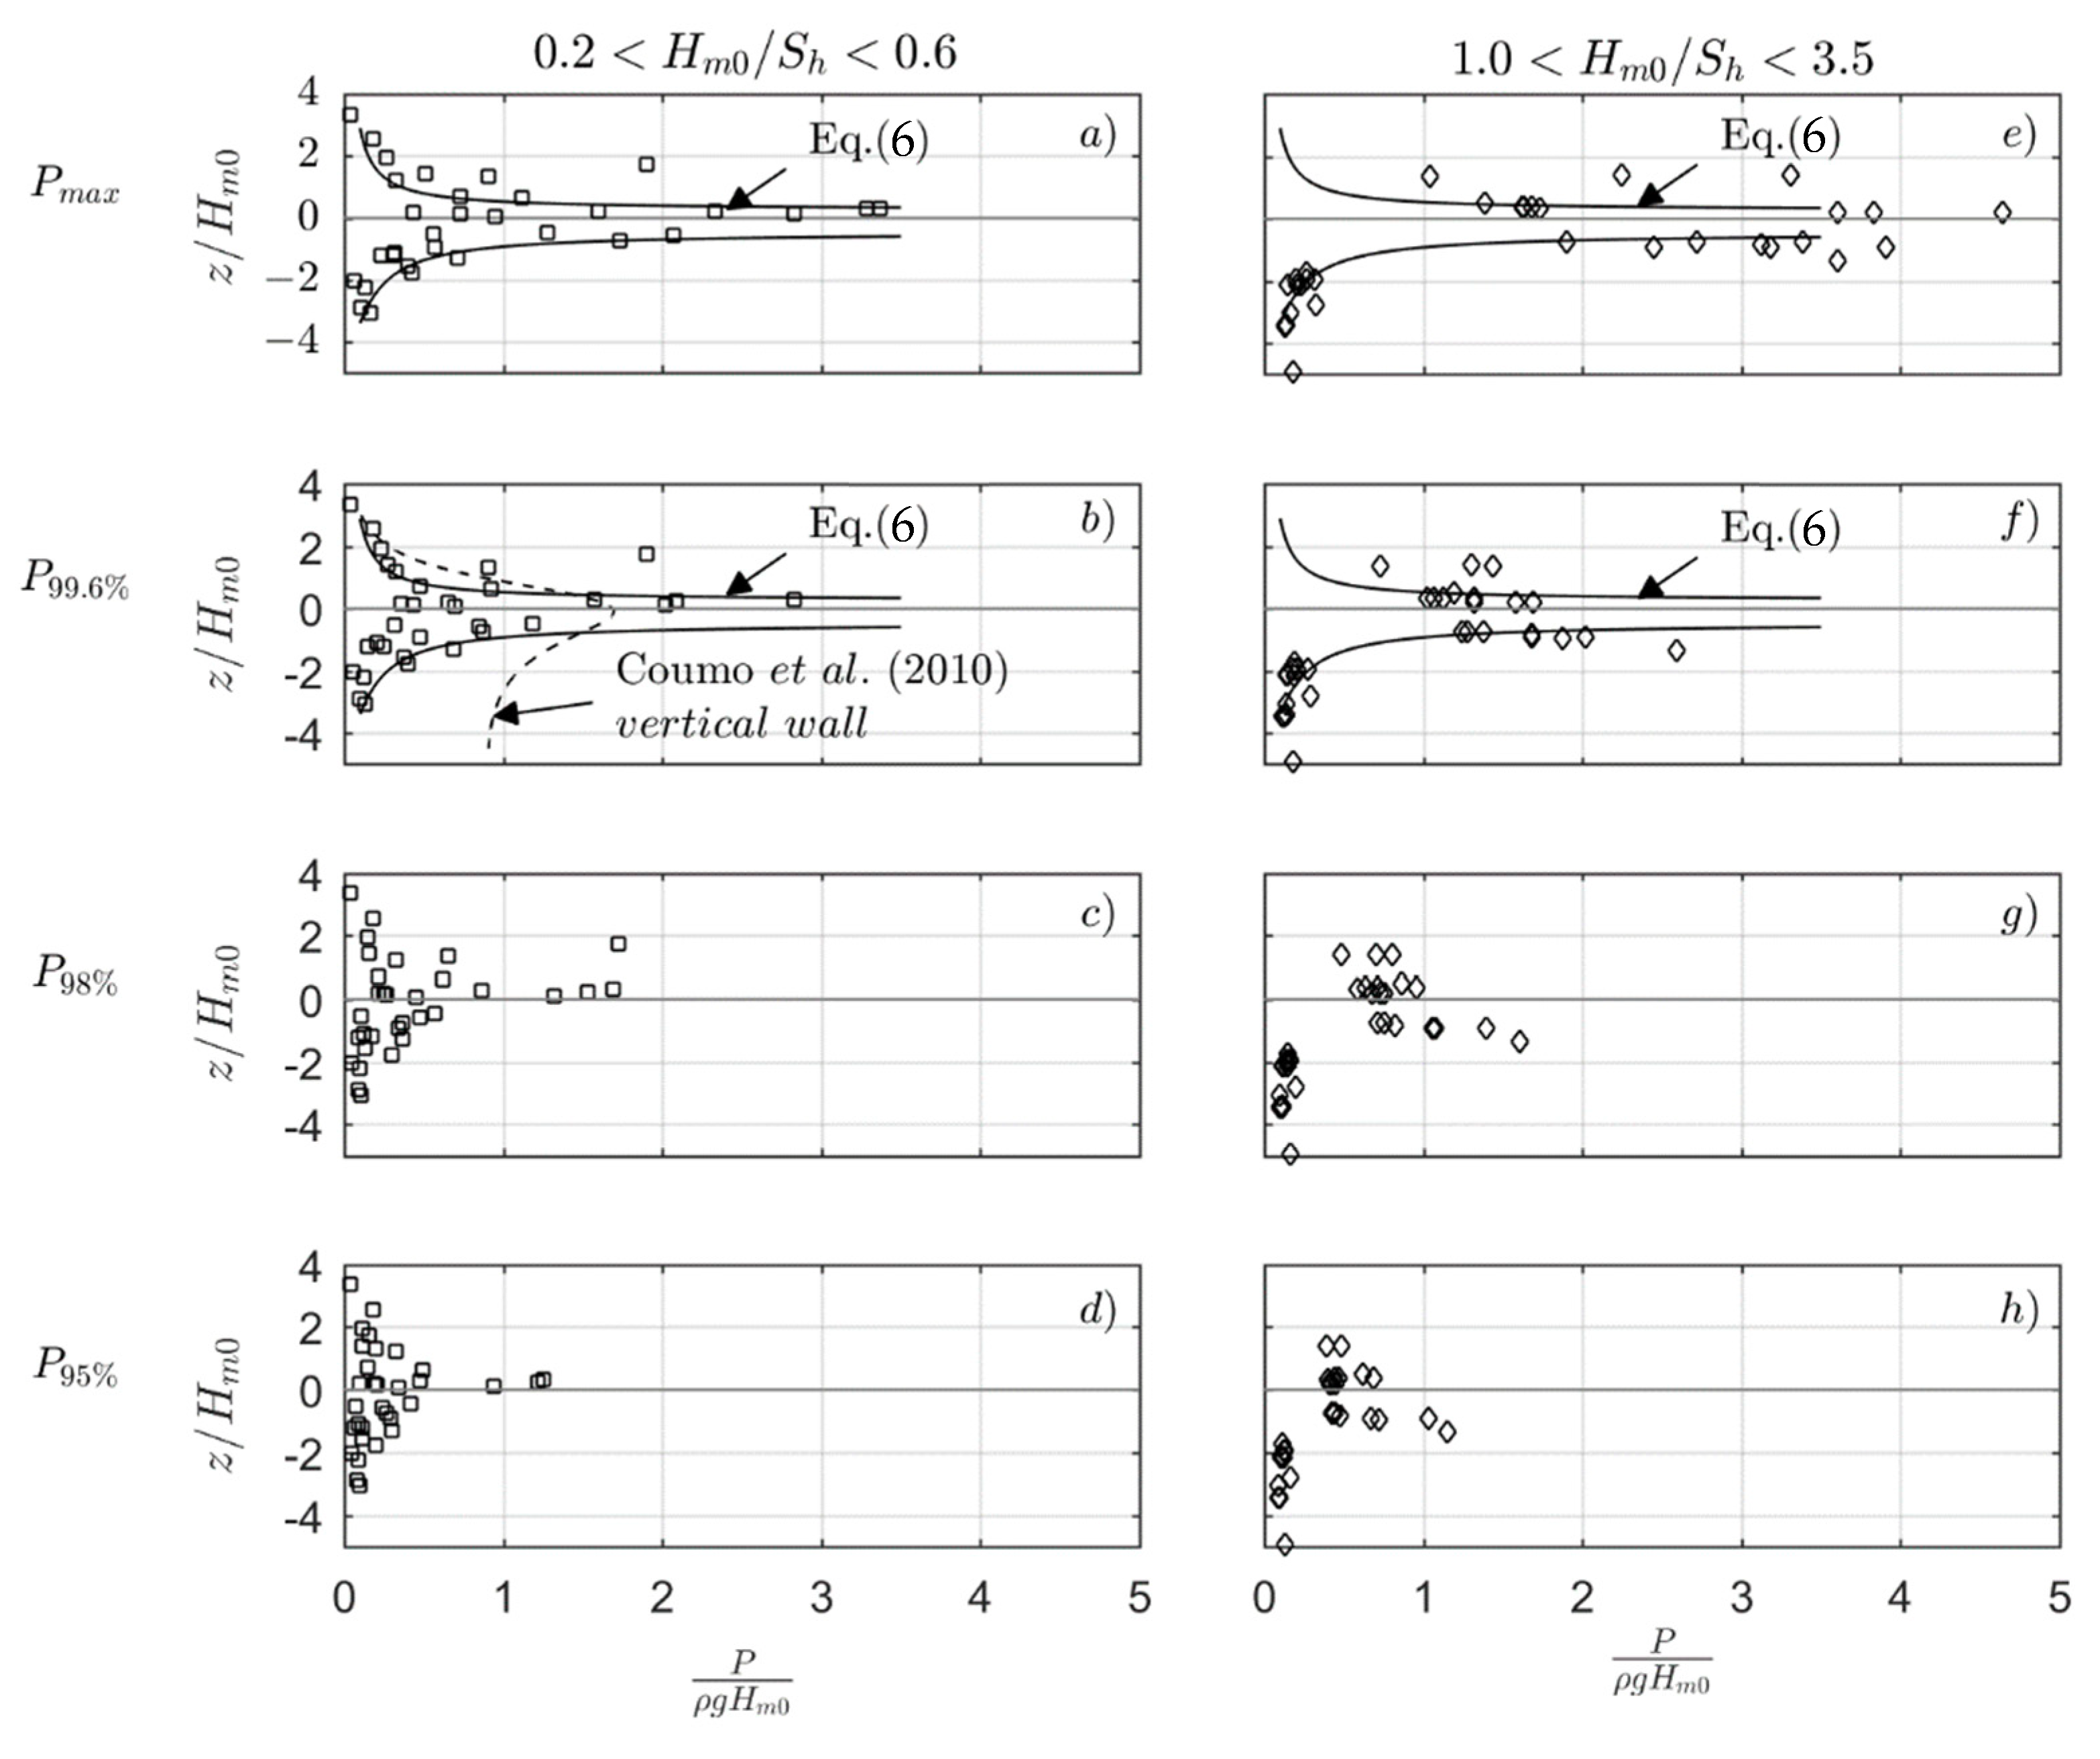
Normalized horizontal pressure impacts with varying probability of exceedance and corresponding relative water depth
z/
Hm0 for revetments with large (0.2 <
Hm0/
Sh < 0.6,
Figure 10a–d) and small (1.0 <
Hm0/
Sh < 3.5,
Figure 10e–h) steps are shown. Each row represents data with a certain probability of exceedance, as described in
Section 4.1. For comparison, the reference line for the horizontal impact forces [
11] and the trend line according to Equation (6) are given. The pressure distribution predicted for
P99.6% values by Equation (6) also shows a good agreement for
Pmax values, if the step height is larger than the wave height (a).
Pmax values for revetments with step heights smaller than the wave height (e) show higher impacts, which scatter in a range of ±2
z/
Hm0. The higher and more variable distributed impacts for small steps compared to large steps can again be ascribed to the influence of higher aeration [
8,
9]. With increasing probability of exceedance ((c,d) for large steps and (g–h) for small steps) the peaks around the
SWL become less prominent, although the peaks are still visible. This trend is reasonable as the statistical distribution of the individual wave heights in a wave spectrum follows a Rayleigh distribution and the mean wave height of all waves, exceeding a certain threshold, decreases significantly with increasing probability of exceedance. Additionally, the shape of the front of a breaking wave governs the subsequent wave impact as the wave’s asymmetry has a secondary importance on the resulting impact. The overall distribution over the water depth becomes more homogeneous with the decreasing probability of exceedance for reasons discussed in
Section 4.2.
It has to be clarified that Equation (6) is based on experimental data by means of mathematical fitting routines. Each data-point represents the average of the four maximum impact values recorded by all implemented pressure sensors during a test. Hence, these four impacts do not necessarily correspond to or stem from the same wave or wave train. Furthermore, Equation (6) is based on a fitting through all data points. Individual under-estimations larger than the given mean standard deviation (up to factor 3) are present for single measurements. Similar observations are stated by Reference [
11]. Despite these constrains, the approach is applicable to reliably estimate the location, magnitude and trend of impact pressures on stepped revetments. Further, the formula enables an estimation of the wave-induced local impacts and loads on a stepped revetment, and thus provides the first robust estimate in the practical design and dimensioning of adequate foundations and anchoring systems.


