Article

On Air-Cavity Formation during Water Entry of Flexible Wedges

by
Riccardo Panciroli
1,*,
Tiziano Pagliaroli
1 and
Giangiacomo Minak
2
1
Niccolò Cusano University, Engineering Faculty, via don Carlo Gnocchi 3, 00166 Rome, Italy
2
Alma Mater Studiorum—Università di Bologna, DIN, via Fontanelle 40, 47121 Forlì, Italy
*
Author to whom correspondence should be addressed.
J. Mar. Sci. Eng. 2018, 6(4), 155; https://doi.org/10.3390/jmse6040155
Submission received: 18 October 2018 / Revised: 23 November 2018 / Accepted: 3 December 2018 / Published: 12 December 2018
(This article belongs to the Special Issue Engineering Mathematics in Ship Design)

Abstract

:
Elastic bodies entering water might experience fluid–structure interaction phenomena introduced by the mutual interaction between structural deformation and fluid motion. Cavity formation, often misleadingly named cavitation, is one of these. This work presents the results of an experimental investigation on the water entry of deformable wedges impacting a quiescent water surface with pure vertical velocity in free fall. The experimental campaign is conducted on flexible wedges parametrically varying the flexural stiffness, deadrise angle, and drop height. It is found that, under given experimental conditions, cavity pockets form beneath the wedge. Their generation mechanism might be ascribed to a differential between structural and fluid velocities, which is introduced by structural vibrations. Results show that the impact force during water entry of stiff wedges are always opposing gravity, while, in case flexible wedges temporarily reverse their direction, with the body that is being sucked into the water within the time frame between the cavity formation and its collapse. Severe impact might also generate a series of cavity generation and collapses.

1. Introduction

The impulsive nature of the hydrodynamic loading experienced by structures impacting the water might induce mechanical vibrations [1,2,3]. These introduce a series of so-called fluid–structure interaction (FSI) phenomena, such as air inclusions [4], ventilation, and cavitation [5], which are encountered in a wide range of water-entry problems, from naval [6,7,8,9] to aerospace applications [10,11,12]. In the literature, many experimental works investigated the hydrodynamic pressure at the fluid–structure interface during the water entry of rigid or very stiff bodies, showing that established analytical formulations [13,14] can be used with very high confidence [15]. However, in the case of FSI, theoretical formulations capable of predicting the hydrodynamic impact load developed for the water entry of rigid bodies become inaccurate. Due to the mutual coupling between the fluid motion and the structural deformation, the hydrodynamic loads that elastic bodies are subjected during the water entry might differ from the loads acting on rigid bodies [16]. The evolution of the wetted body area in time is an important characteristic of the impact, and variations of the structural shape due to its flexibility might affect the loads [17]. Such problems are still difficult to analyze and compute. Predicting structural deformations and stresses during the water entry of flexible structures is a major challenge, and a deep understanding of these FSI phenomena is direly needed. Most of the analytical and numerical works found in the literature [18,19,20,21] do not account for such FSI phenomena, since these can be neglected in cases where structural deformations are small, and hydrodynamic pressure is similar to the one experienced by a rigid body (see, e.g., References [22,23,24,25,26,27]).
The occurrence of cavitation during the water entry of flexible bodies has been predicted in the literature (e.g., References [7,28]). Hydroelasticity might facilitate cavitation [6,29], since pressure becomes subatmospheric during the second half of the first wet natural oscillation period. Reinhard [30] analytically predicted that there are conditions for which a wedge entering the water in free fall might form a cavity localized at its apex. Therein, the authors also mention that structure elasticity might enhance such a phenomenon. In the literature, the term cavitation is often misused, as many works relative to water-entry problems use this term to define the generation of cavity formation, rather than effective cavitation in its original meaning [31,32]. Korobkin [28] predicted that, in blunt bodies subjected to a sudden velocity drop, the liquid may separate from the entering body surface with the formation of a cavity. He defined this phenomenon as interface cavitation. In his model, which is based on Wagner’s [13] theory, cavitation is supposed to happen when local pressure goes below the atmospheric. During the water entry of flat-bottom bodies, or geometries presenting a low deadrise angle, air can be trapped between the fluid and the structure during the early stage of the impact [33,34,35,36,37]. In such an occurrence, an air cushion is entrapped below the structure, lowering the hydrodynamic loading. Furthermore, the presence of entrapped air in the fluid is supposed to inhibit cavitation.
In this work, we report on experimental evidence about cavity formation during the water entry of flexible structures. Many experimental campaigns on the water impact of compliant bodies can be found in the literature [38,39,40,41], but to the authors’ best knowledge, none of these reported on cavity formation for flexible wedges. The following sections report the most important experimental findings. First, we give insight on the analytical prediction of cavitation during the water entry of rigid bodies, showing the actual possibility of such effect. We then present the experimental setup, followed by details about the experimental results. The effects of cavity formation on impact dynamics are presented hereafter.

2. Cavitation Onset in Rigid Bodies’ Water Entry as Predicted by Analytical Formulations

The dynamics of the water entry of rigid bodies can be accurately predicted by utilizing Wagner’s model [13]. Such a solution relies on the concept of added mass (or virtual mass), where an increasing mass m of water is considered to move with the body as it penetrates the water. In this framework, the velocity and acceleration of the impacting wedge are predicted by Wagner’s model as [13]:
ξ ˙ = M V 0 M + m = V 0 1 + π 2 ρ ( π / 2 ) 2 ξ 2 M tan 2 ( β ) ξ ¨ = d d t M V 0 M + m = π ρ ( π / 2 ) 2 M V 0 tan 2 ( β ) ξ ξ ˙ 3 ,
ξ being the entry depth, M the mass of the wedge per unit depth, V 0 the initial entry velocity, and β the deadrise angle. Figure 1 shows a sketch of the problem. Wagner’s model further allows to compute the pressure distribution along the wet portion of the body as:
p ρ = ξ ¨ r 2 x 2 + π 2 ξ ˙ 2 r tan ( β ) r 2 x 2 1 2 ξ ˙ 2 x 2 r 2 x 2 ,
where r is the horizontal projection of the wet length of the wedge, which reads π 2 ξ tan β . Factor π 2 accounts for the water pile-up along the wetting edge due to the displaced water. Such value has been later found not to be a constant, as it actually varies with the deadrise angle [42]. Here, we utilize π 2 as this does not qualitatively alter the solution.
In case of water entry at a constant speed, the solution is self-similar in time. Otherwise, the component related to the acceleration may overcome the component associated to the velocity in Equation (2), with pressure eventually going subatmospheric at some locations.
Figure 2 shows an example Wagner’s pressure-distribution prediction at several impact times. The location of peak pressure is constant, and the minimum pressure is always located at the keel of the wedge ( x = 0 ), and equals
p keel = 1 2 ρ ξ ˙ 2 π cot ( β ) + ξ ¨ ρ r .
We can therefore express the cavitation-onset condition in terms of dynamics components as
ξ ˙ 2 + ξ ¨ ξ < ( p v p a ) 2 tan ( β ) π ρ ,
p a being atmospheric pressure and p v the vapor pressure. Using Equation (1), the left-hand side of the formula can only be written in terms of ξ and equals
4 tan 4 β M 2 V 0 2 π ρ γ 2 ξ 2 + 2 M tan 2 β 2 M tan 2 β + π ρ γ 2 ξ 2 3 ,
showing a minimum at entry depth ξ * = 4 π ρ M tan β π 2 ρ which, substituted in Equation (4), predicts that the minimum pressure at the keel is
ξ ˙ 2 + ξ ¨ ξ ξ * = 1 27 V 0 2 .
It is noticeable that penetration depth ξ * might not be reached during impact due to insufficient initial-entry velocity. Wagner’s solution thus predicts that cavitation during the water entry of a rigid wedge occurs if:
1 27 V 0 2 < ( p v p a ) tan ( β ) π 2 ρ .
Notably, ξ * is independent from impact velocity but is only a function of the geometrical data. Figure 3 (left) shows the normalized pressures versus the entry depth for various deadrise angles.
If we concentrate on the minimum value of the normalized pressure, we see that this increases with the deadrise angle, as displayed in Figure 3 (right). Here, only deadrise angles higher than 10 ° are shown, as lower values are known to lead to the so-called air-trapping phenomenon [4], that is, air is entrapped between the structure and the fluid during water entry to form an air cushion, decreasing the impact load and inhibiting cavitation.

3. Preliminary Experimental Evidences

The analytical solution presented in the previous section shows that cavitation (intended in its original meaning) might appear during the water entry of rigid bodies. However, such occurrence is extremely difficult to be attained as, to reach pressure lower than the vapor pressure, we need the combination of very high velocity and extremely lightweight bodies. Similar results were found by Reinhard in [30] for different body shapes. Further, all these solutions are 2D approximations and do not take into account the effects at the front and rear faces of the wedge (but are indeed valid for axial-symmetric bodies). We now discuss such issues by only referring to the keel edge, which is the location where minimum pressure is attained. The keel is always wet, being the first portion of the wedge touching the water. However, as the wedge enter the water, it digs a hole into it, pushing the water sideways. The front and back sides of the wedge actually remain dry and always “see” atmospheric pressure. The hole in the water will eventually collapse, but it takes a time way longer than the impact duration. Therefore, pressure at the keel varies from the theoretical one at its midspan to the atmospheric one at its vertexes. As the pressure at the keel goes below atmospheric, its effect forces some air to enter from the sides, forming a cavity beneath the wedge.
We performed some experiments on rigid wedges on this. In our experience, such an occurrence never happens in free-fall impact, but was indeed found when the deceleration of the wedge was imparted mechanically through a pneumatic actuator, or by a mechanic end-run forcing the wedge to suddenly decelerate. A schematic of the experimental apparatus with a mechanical stop is presented in Figure 4. Therein, the falling sledge holding the rigid wedge is forced to stop its motion by an end-run cable. The end-run cable is necessary to prevent the wedge to hit the water-tank floor. Cavity formation was observed as soon as the end-run cable stopped the wedge motion.
Figure 5 shows the evolution of a cavity formation in the neighborhood of the vertex at the keel of the wedge. The images were acquired through a phantom camera capturing the event from the side. The cavity-formation mechanisms is equally generating on both the wedge vertexes and only one of these is reported in the images for convenience. The images are presented here with the sole intent of explaining the mechanism of cavity formation during water entry, as these do not refer to the present experimental campaign, since the experimental apparatus utilized in this work does not allow to capture images from the side, only from the front side.
Results about cavity formation during the water entry of rigid body are to be considered artificial and are not presented here. We therefore never encountered cavity formation in the free-fall water entry of rigid bodies, whereas we indeed found it in the case of free-fall impact of flexible bodies. The following sections introduce the most important results about cavity formation during the water entry of flexible wedges.

4. Experimental Setup

Experiments were conducted on a drop-weight apparatus appositely assembled for the experimental campaign. The falling body was comprised of a sledge holding two panels joined together by a tunable hinge to form a V-shaped object. Deadrise angle β may range smoothly from 0 ° to 50 ° . The hinge held the panels in a cantilever configuration in a clamped-free boundary condition. Experiments were conducted on bodies with a sufficiently large deadrise angle (> 10 ° ) to avoid air-bubble inclusion [4].
The experimental setup was the same utilized by Panciroli [43]. Impact acceleration was measured by a Microstrain (Williston, VT) V-Link wireless accelerometer (± 100 g) located at the tip of the wedge. All reported accelerations are referenced to 0 g for the free-falling phase. Sampling frequency was set to its maximum of 4 kHz. Entering velocity was recorded by a laser sensor ILS 1402 ( μ ϵ , Ortenburg, Germany) capturing the sledge position over 350 mm of ride at a frequency of 1.5 kHz with a resolution of 0.2 mm. Entry velocity was obtained through the central difference of the position signal.
The dynamics of the impact was captured through a high-speed camera looking through a window on the water tank. As mentioned before, only frontal views could be captured through the high-speed camera in the present experimental apparatus. Capturing frequency was set to 4 kHz with a definition of 1280 × 800 px. A vertical clear screen was placed inside the water tank just before the wedge preventing fluid spraying in the axial direction. The clearance between the screen and the falling body was about 2 mm, but it slightly varied during water entry due to varying fluid pressure moving and deforming the screen. The use of the screen was necessary to see the evolution of the fluid jet (pile-up) rising on the sides of the wedge, and to prevent fluid spraying through the camera that would affect the visibility of the image.

Specimens

Hydroelastic effects are influenced by the ratio between wetting time and the panel’s lower natural frequency [6,44]. To vary the fundamental natural frequency of the panels, different stiffness to area-density ratios were utilized: Aluminum (A), E-glass (mat)/vinylester (V), and E-Glass (woven)/epoxy (W) 2 and 4 mm thick were used. All wedges were made of two panels 300 mm long and 250 mm wide. Aluminum and composite-panel material properties are listed in Table 1. Composite panels were produced by VARTM (vacuum assisted resin transfer molding) by infusion of vinylester resin on an E-Glass fiber mat, while the E-glass (woven 0 ° / 90 ° )/epoxy panels were produced in autoclave. The first three dry vibration frequencies of the panels are listed in Table 2.
All panels were equipped with two strain gauges per side, located at 25 and 120 mm from the reinforced tip. The reinforced tip was 27 mm long and used to connect the two panels to the aluminum sledge.
A very high number of drop tests were conducted [45,46], but high-speed imaging was performed on selected configurations only at the end of the experimental campaign, when the camera was rented for the purpose. Here, we therefore report on a limited number of experiments that are considered to be sufficient to qualitatively describe the effect of cavity formation on impact dynamics.

5. Experimental Results

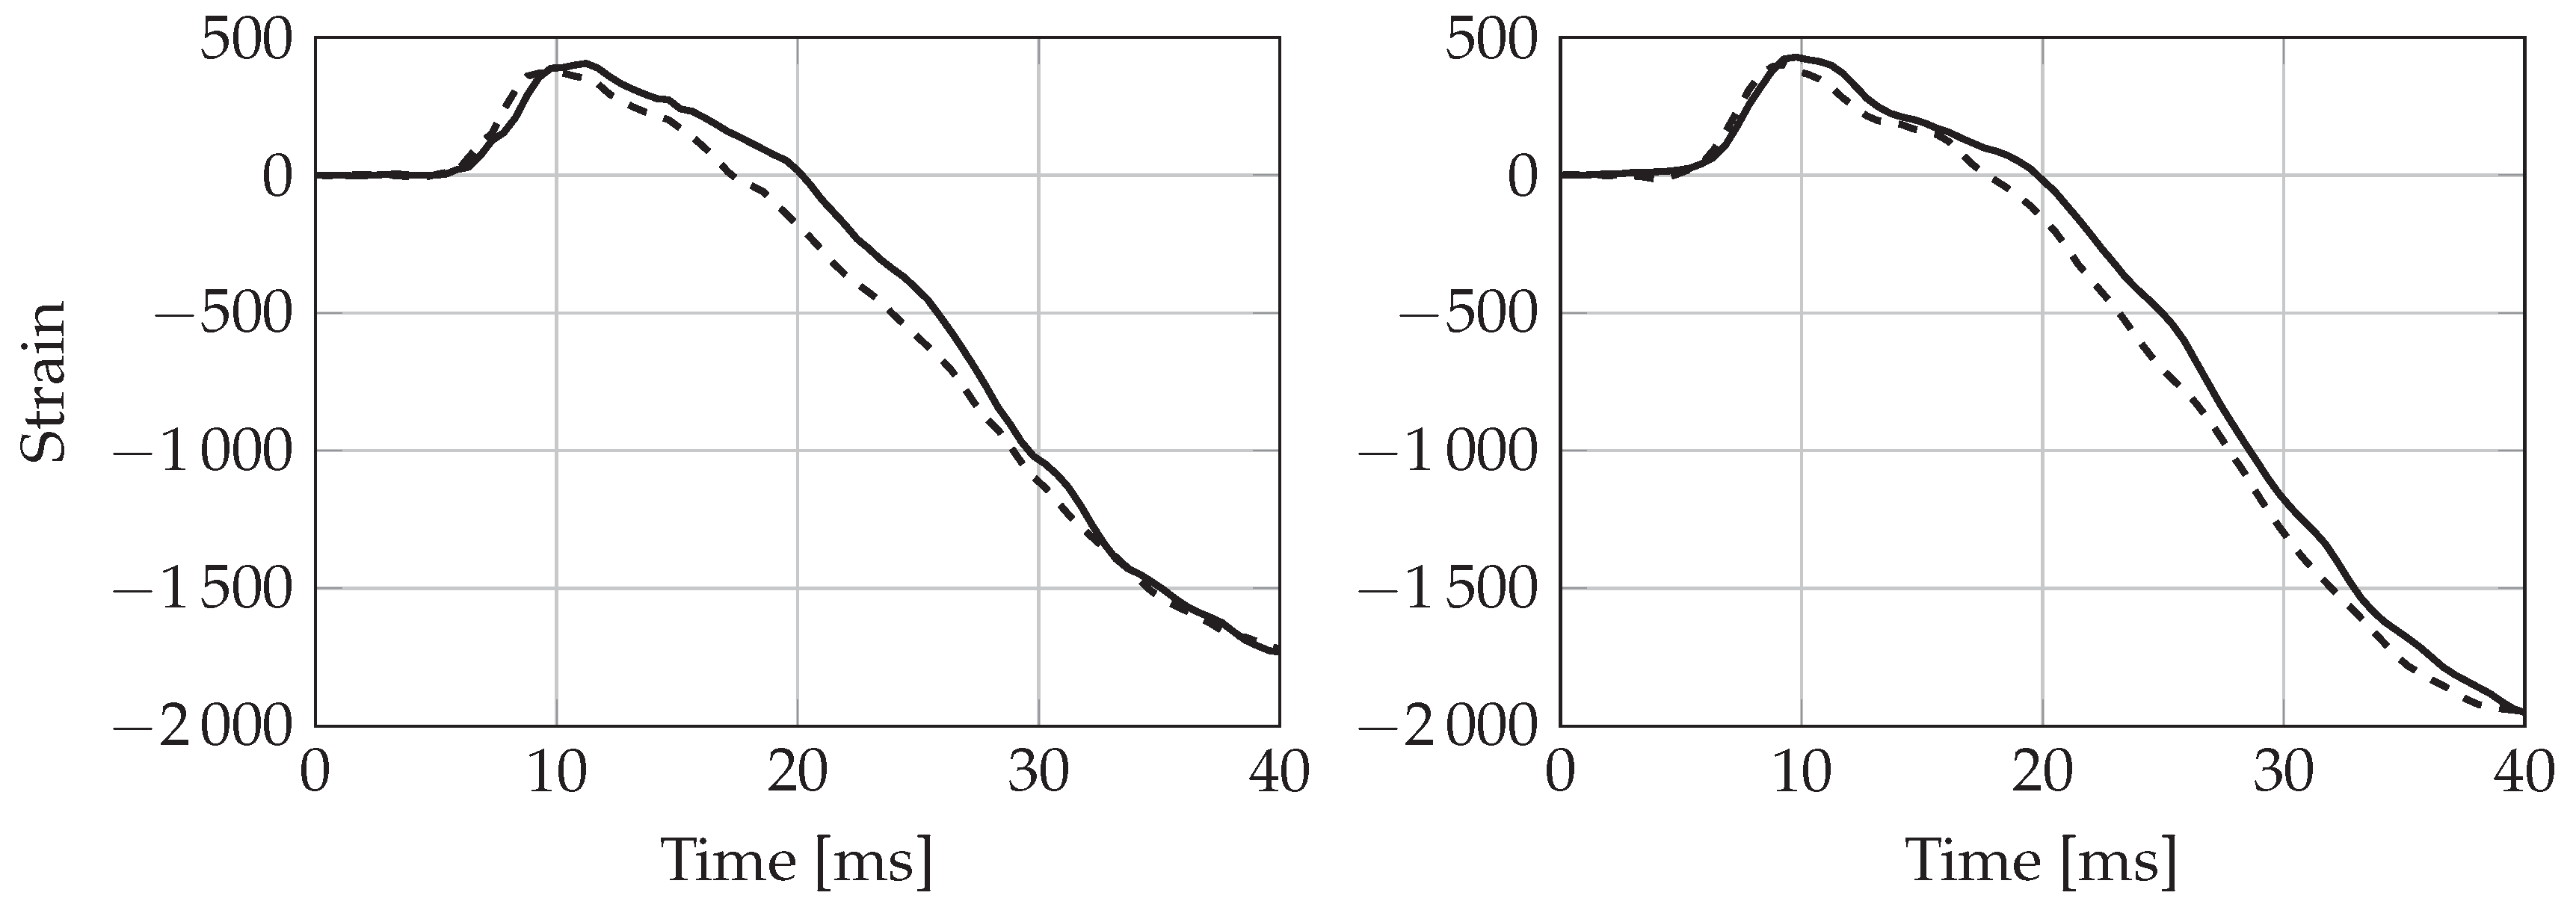
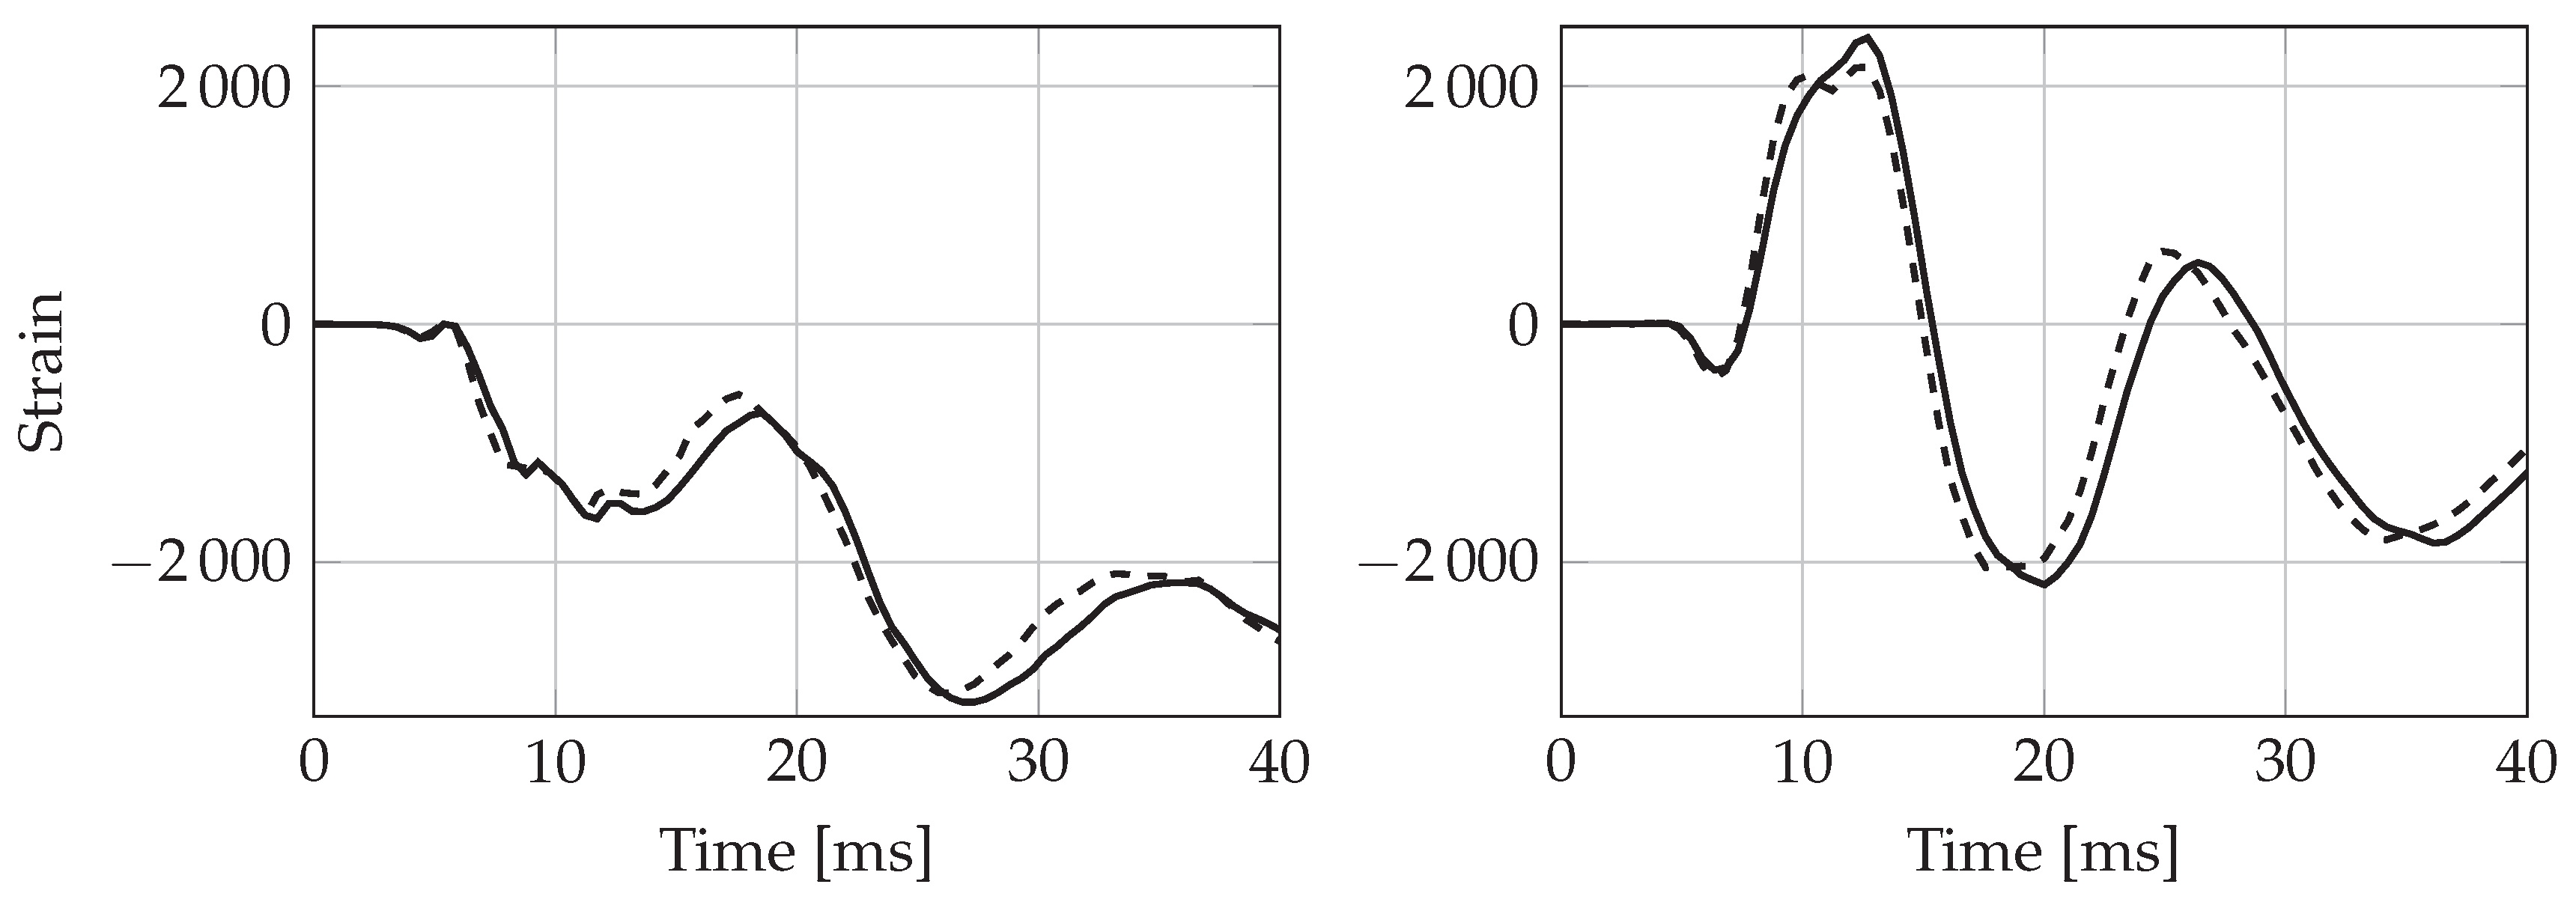
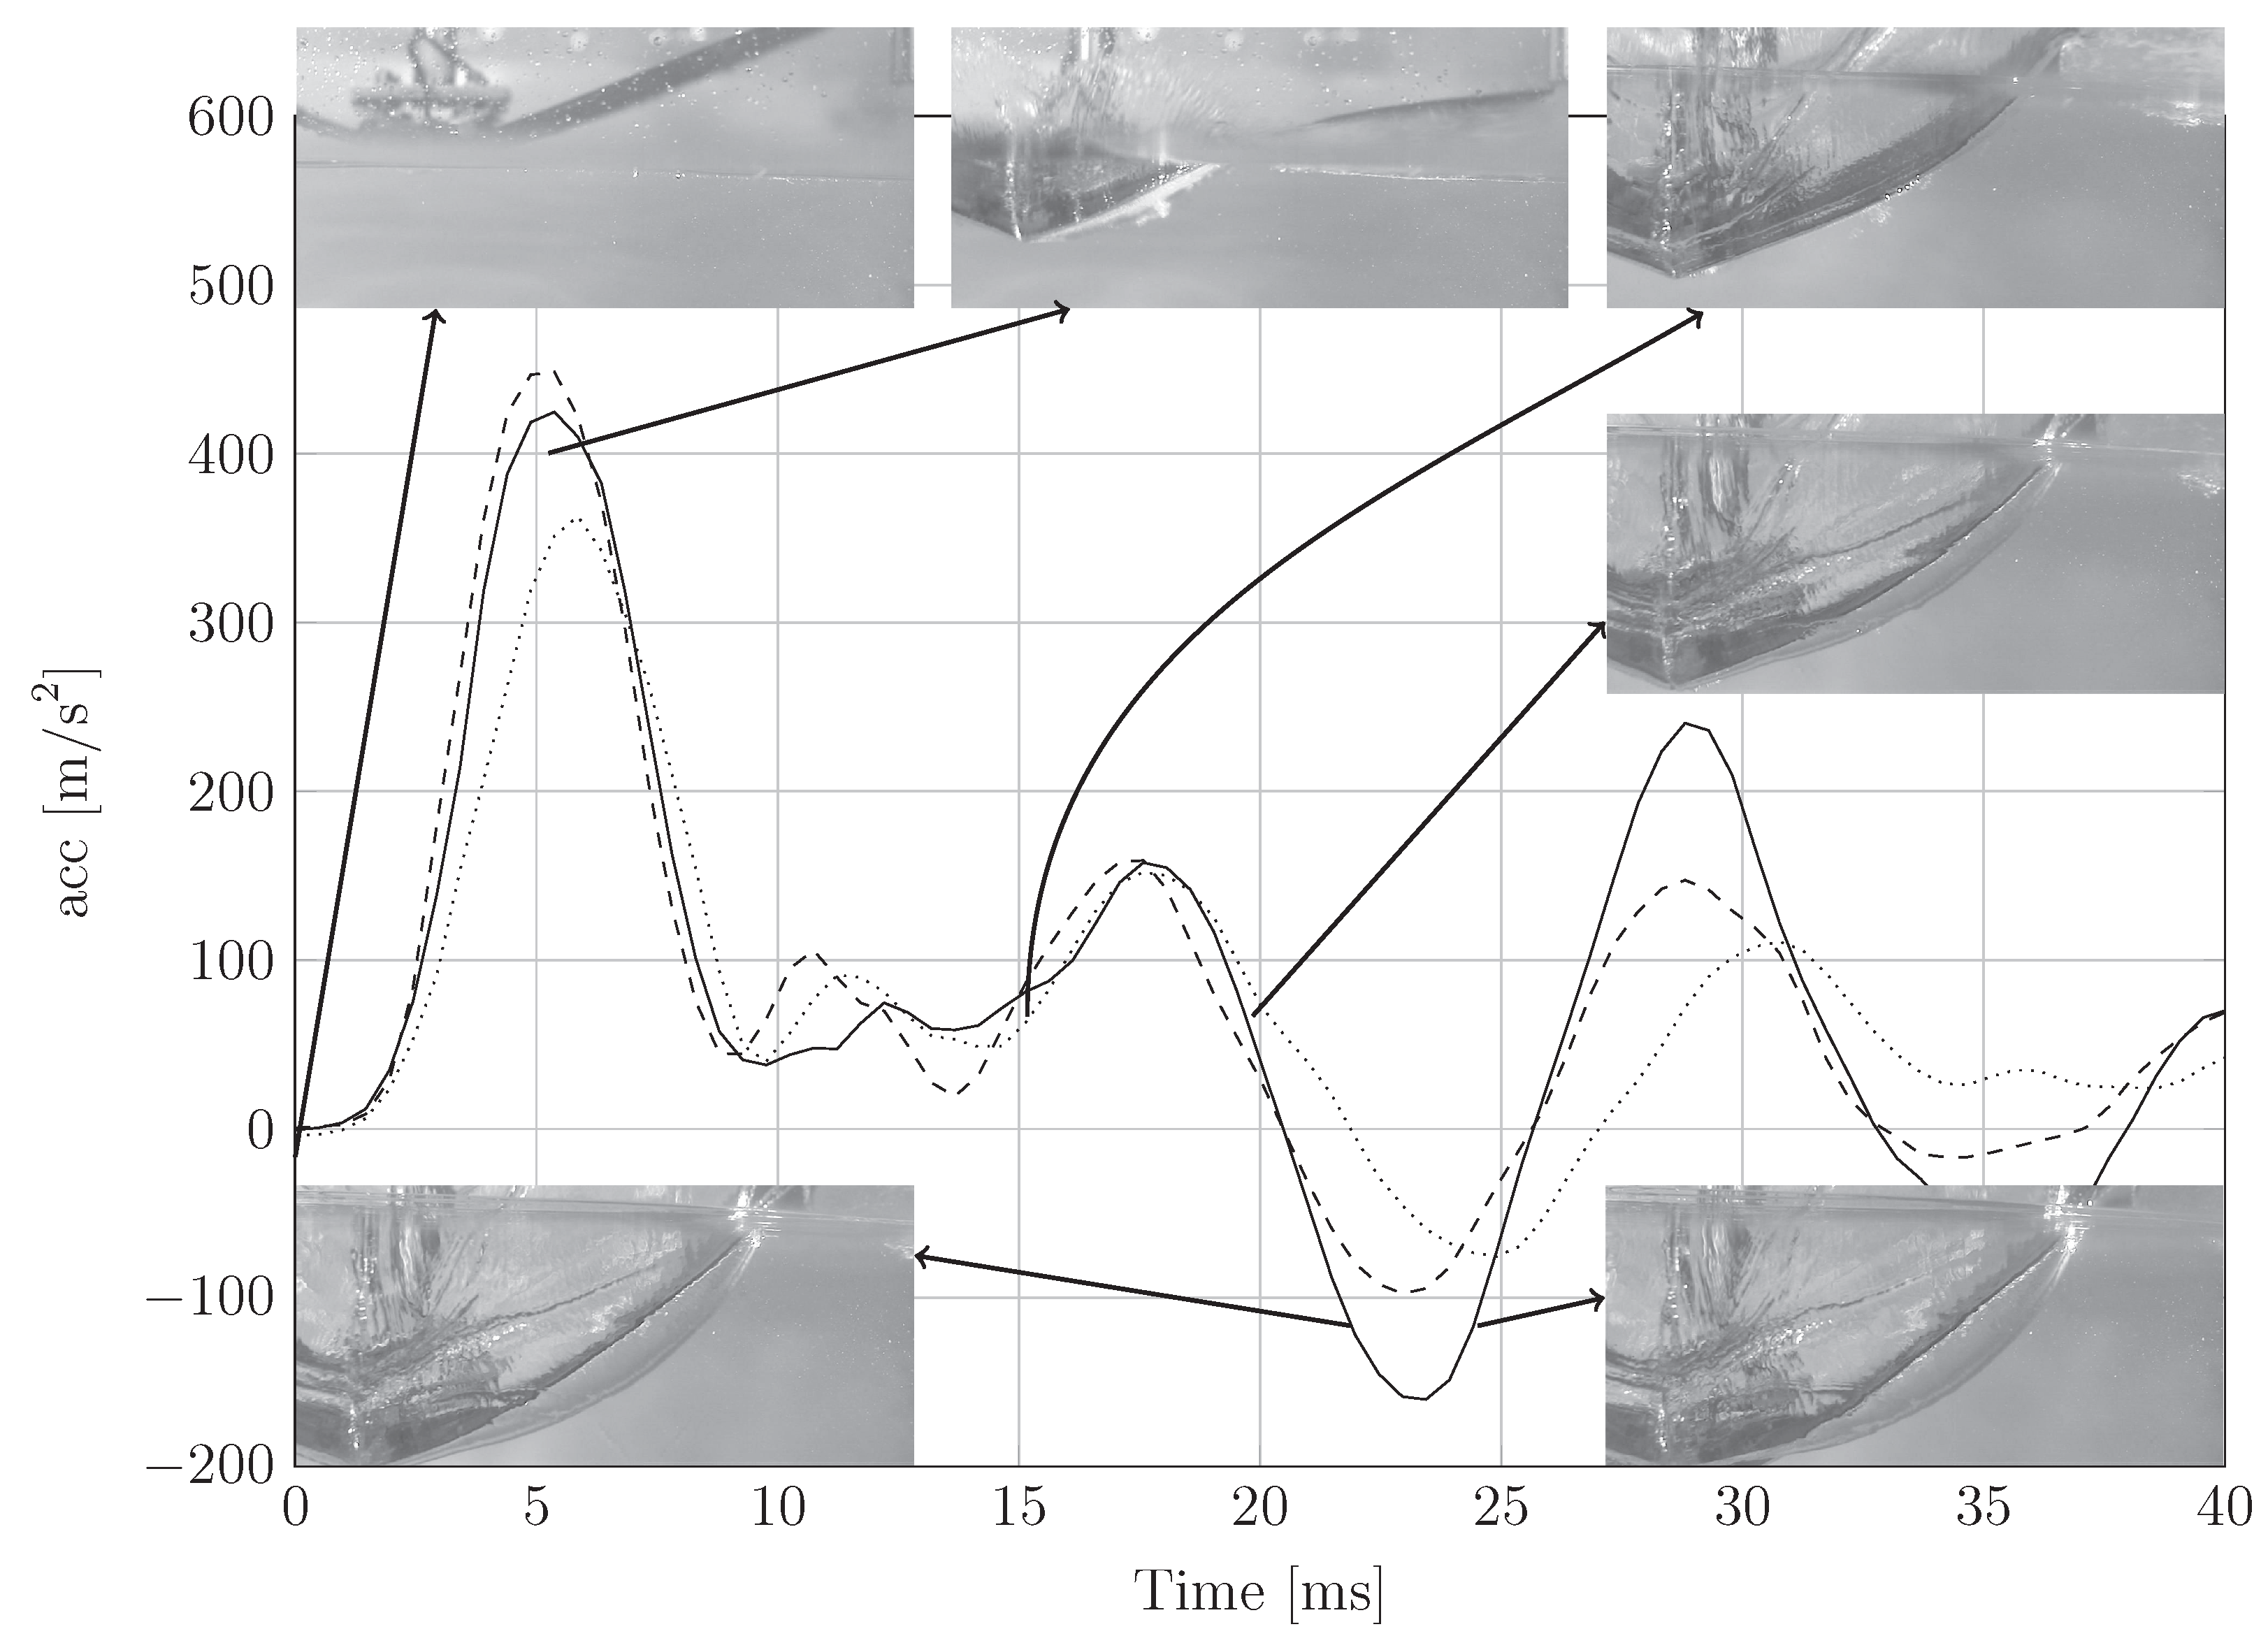
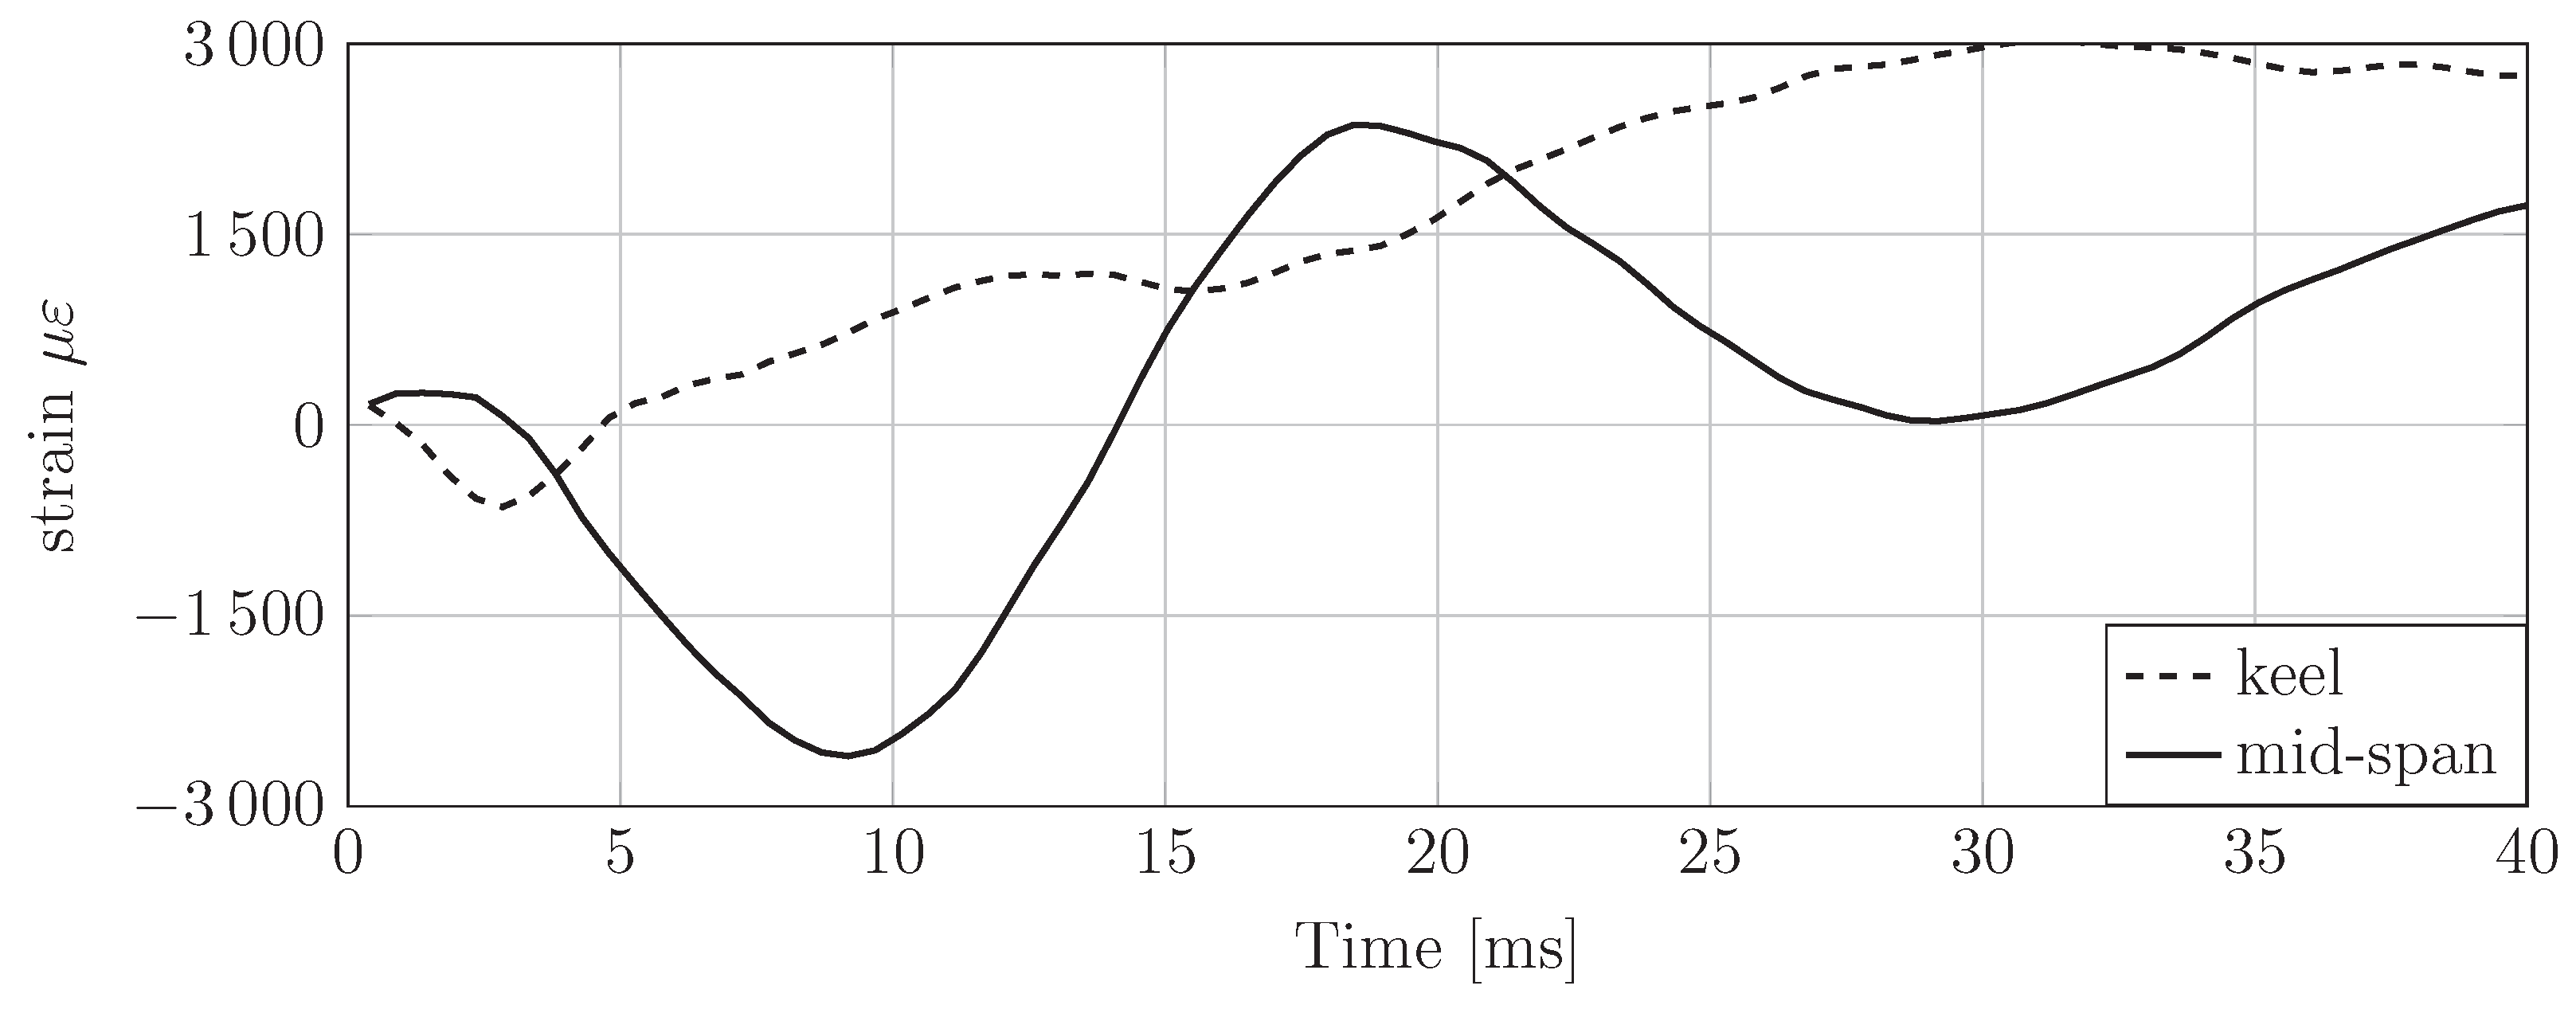
5.1. Wedge Deformation during Water Entry

In a previous study by the authors [44], it was shown that hydroelastic effects in the present experiments are ruled by a parameter R, which is proportional to the ratio between impact time and the first structural natural period. Results showed that the maximum impact-induced stress decreased if compared to the theoretical quasistatic solution when R was lower than 100. Above this value, the structural response could be accurately predicted by a quasistatic approach. However, for values of R lower than 100, interesting fluid–structure interaction phenomena might appear, such as ventilation and cavity formation.
Experiments on elastic wedges with a high deadrise angle entering the water at low velocity (R > 100) show that the panels initially slightly deform downward (thus showing a convex shape), to later deform upward due to hydrodynamic pressure.
This initial convex deformation has to be attributed to the effect of inertia: the hydrodynamic load acts on the wedge apex at first, leading the free edge to deform downward. As the wedge enters the water, the hydrodynamic load covers a larger area, and deformation due to pressure exceeds the deformation due to inertia, leading the panel to deform upward. As an example, Figure 6 shows deformation in time of a flexible wedge ( β = 30 ° ) entering the water at 4.2 m / s .
The strains at the vertex and at the middle of the panel assume a shape similar to those presented in Figure 7, which shows the example of a fiberglass/polyester wedge 4 mm thick with deadrise angle of 35 ° impacting from an impact height of 1.5 m. Generally speaking, in all these cases the panels are deforming downward for a very short portion of the total impact time, and the maximum positive strain (hence the stress) is way lower than the maximum negative strain reached later, revealing that, in case of “soft” impact, the influence of plate inertia is negligible.
Conversely, moving to a stronger impact (R < 100, by lowering deadrise angle and panel stiffness, and increasing the impact velocity), the dynamic response showed very different results. Figure 8 shows the deformation in time of a flexible wedge entering the water from an impact height of 2.5 m. Due to the flexibility of the wedge and the very severe impact load, the panel was largely deforming downward at the beginning of impact. At its maximum deformation (top-right subfigure) the panel was almost horizontal at its free edge.
The overall deformation of the panels can be better caught by looking at the recordings of the strain gauges, reported in Figure 9. The two graphs show that the strain acquired by the gauge close to the wedge tip (left graph) is always negative, indicating a local convex deformation, while the strain gauge at the middle of the panel (right graph) is initially positive (suggesting that the deformation is locally concave), thus leading the panel free edge to deform downward at first. Note that, in this case, the maximum tensile stress, which is ruled by inertia, is in the same order of magnitude of the compressive stress, which is ruled by hydrodynamic load. It is thus necessary to consider the effect of inertia in the initial stages of the impact.

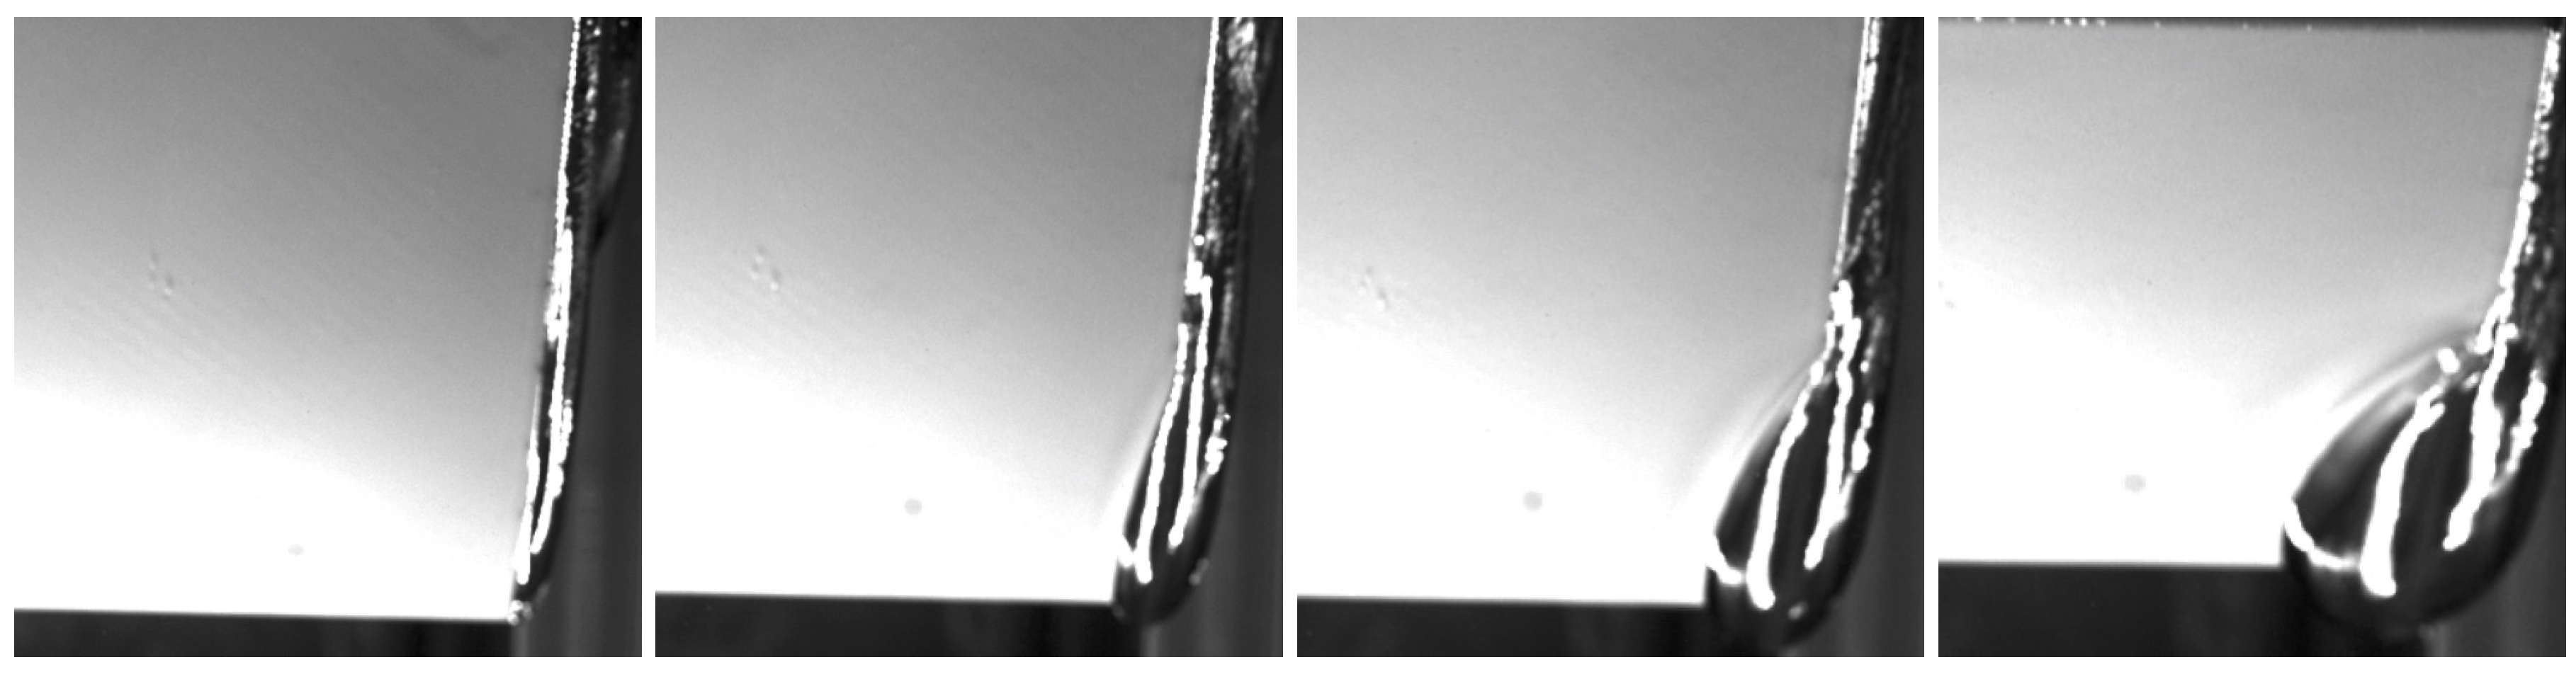
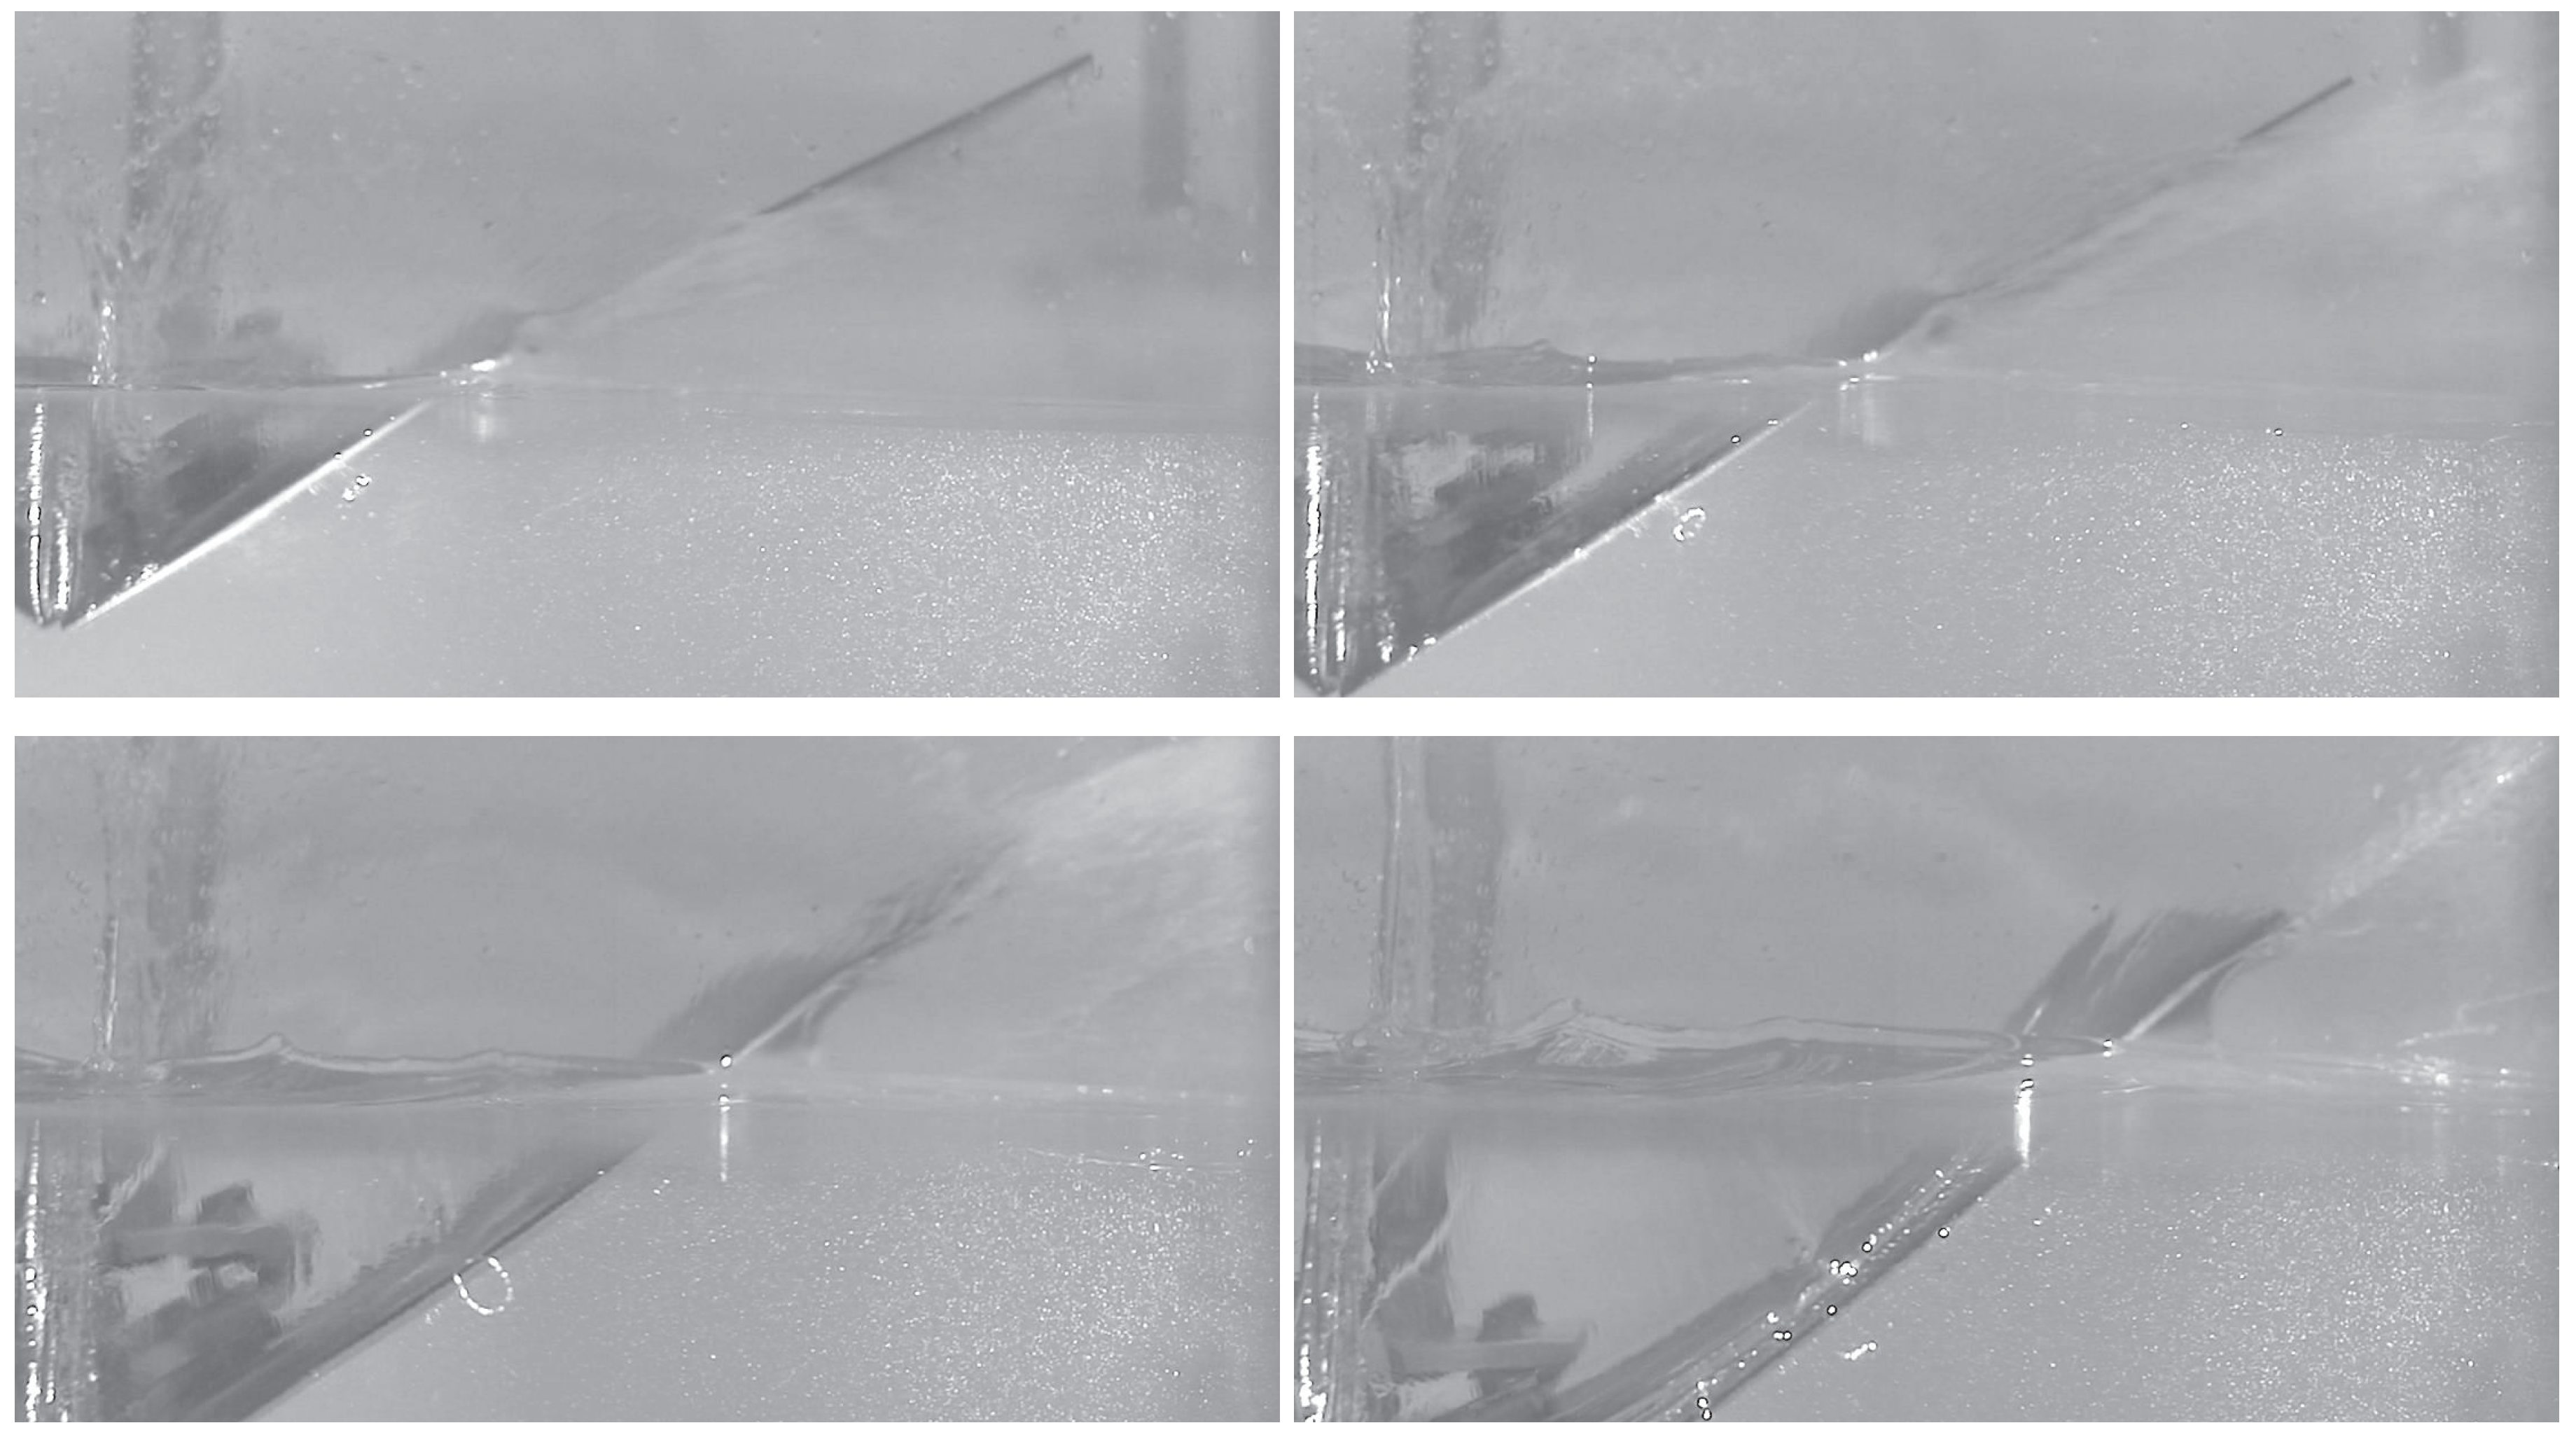
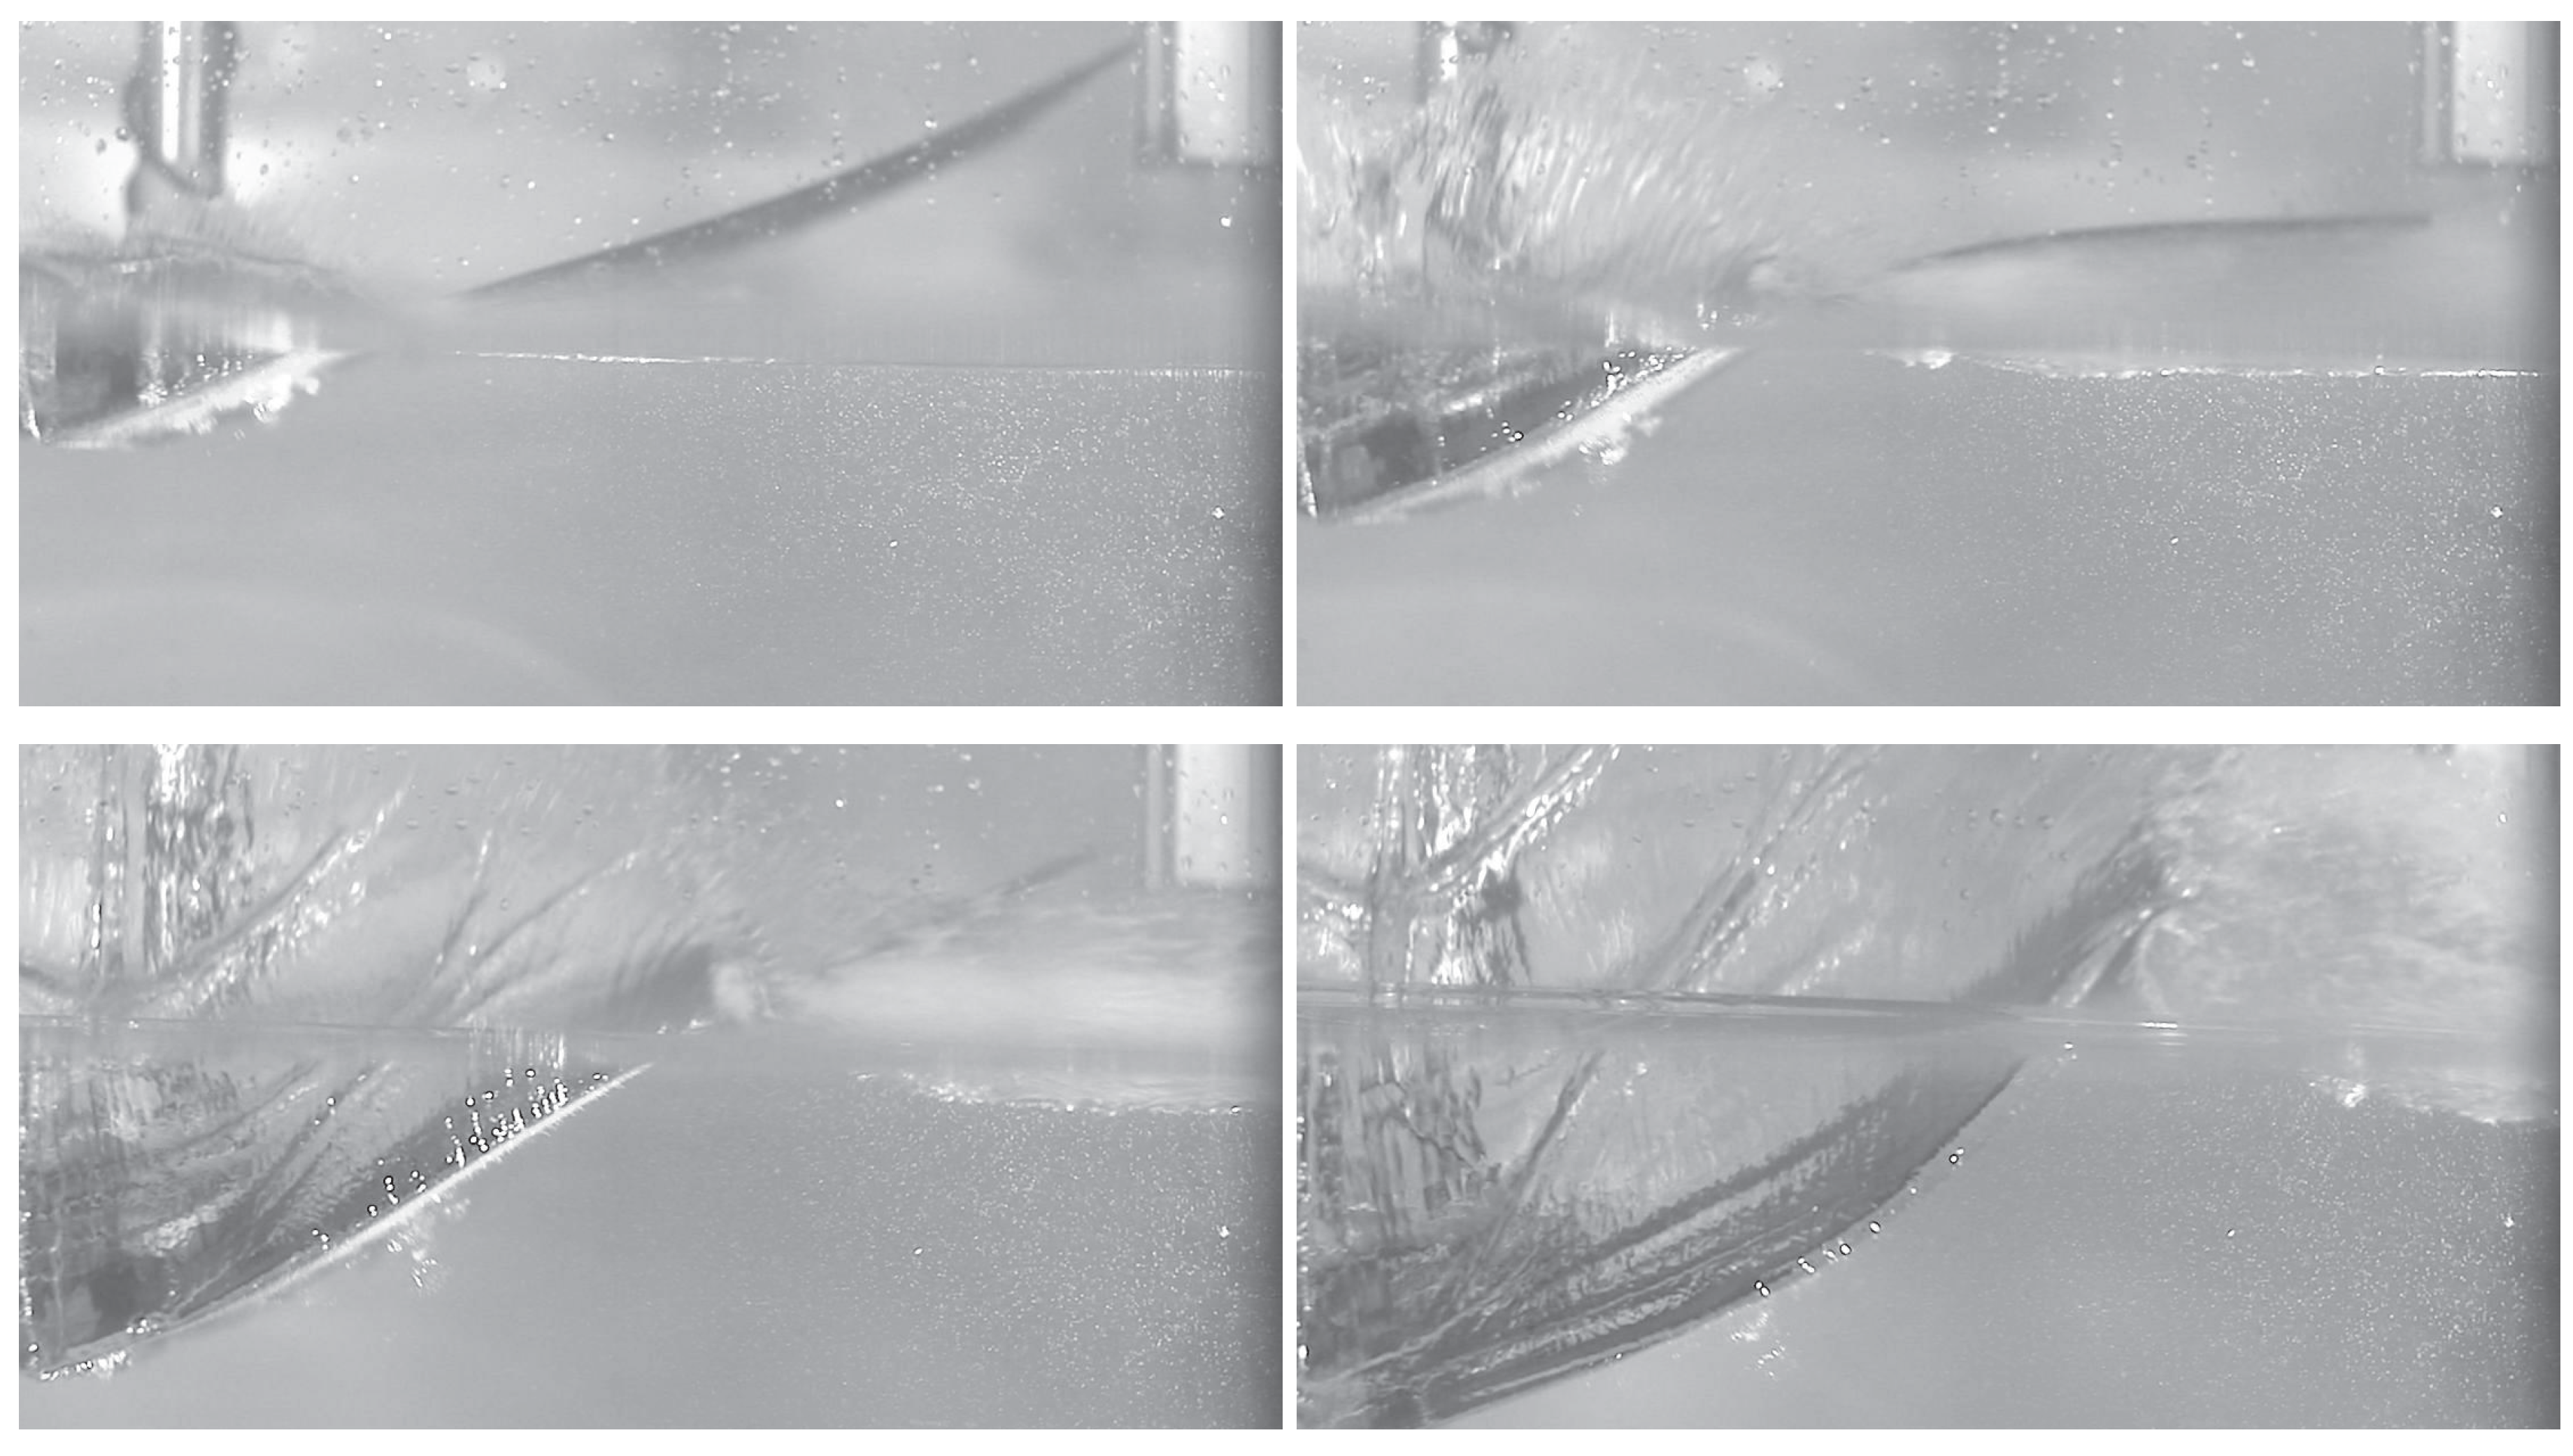
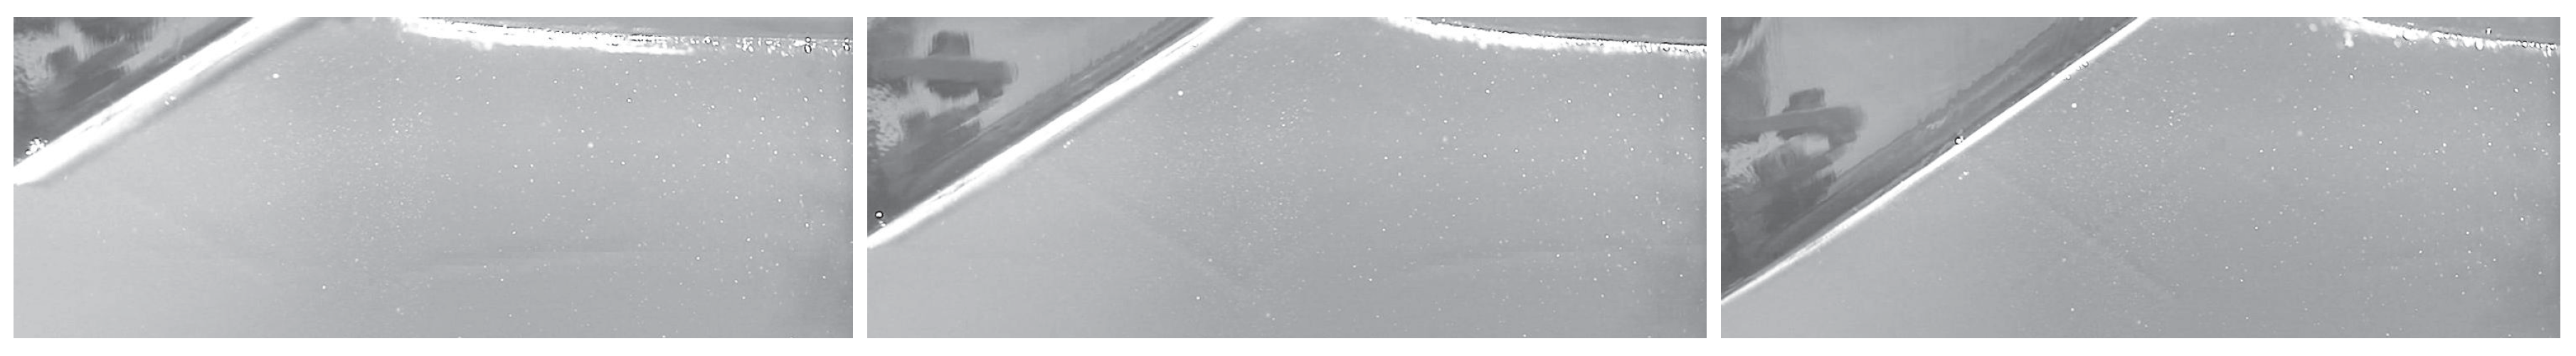
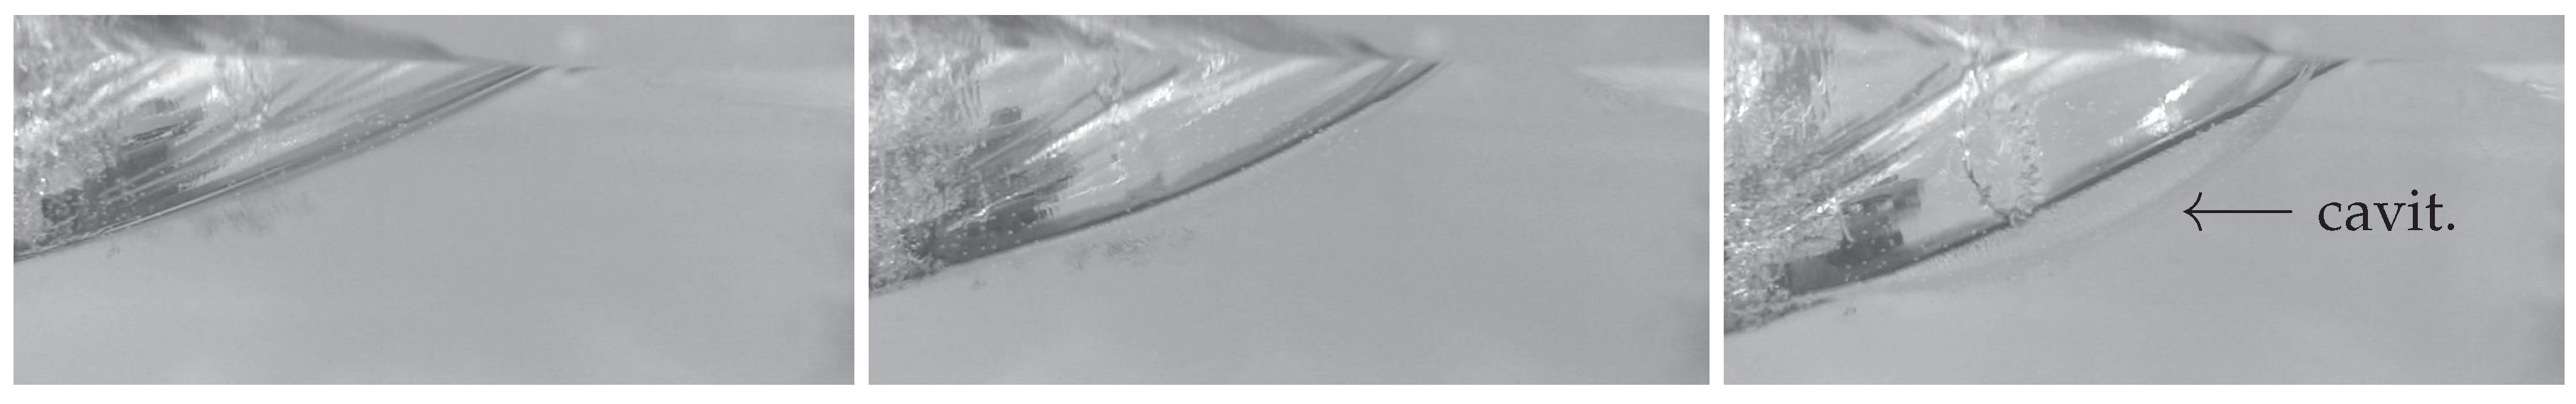
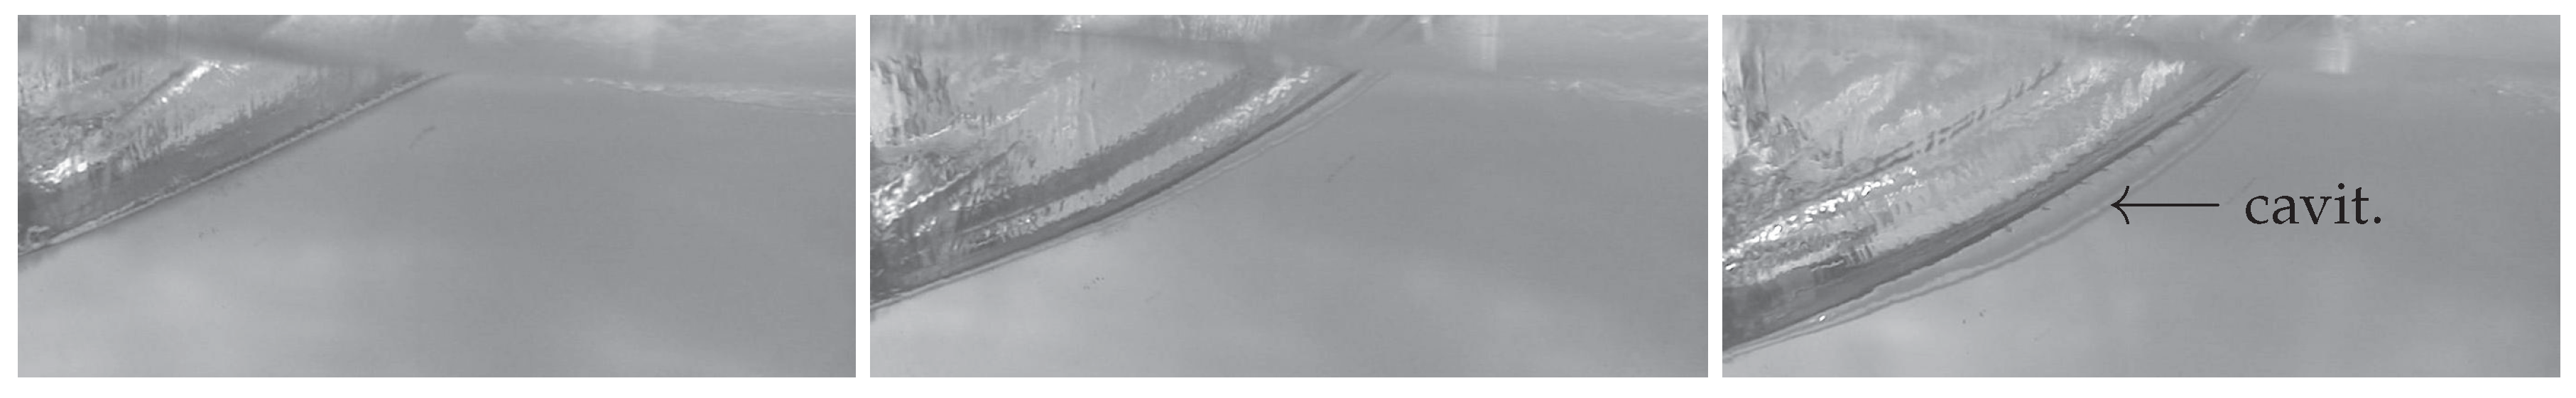
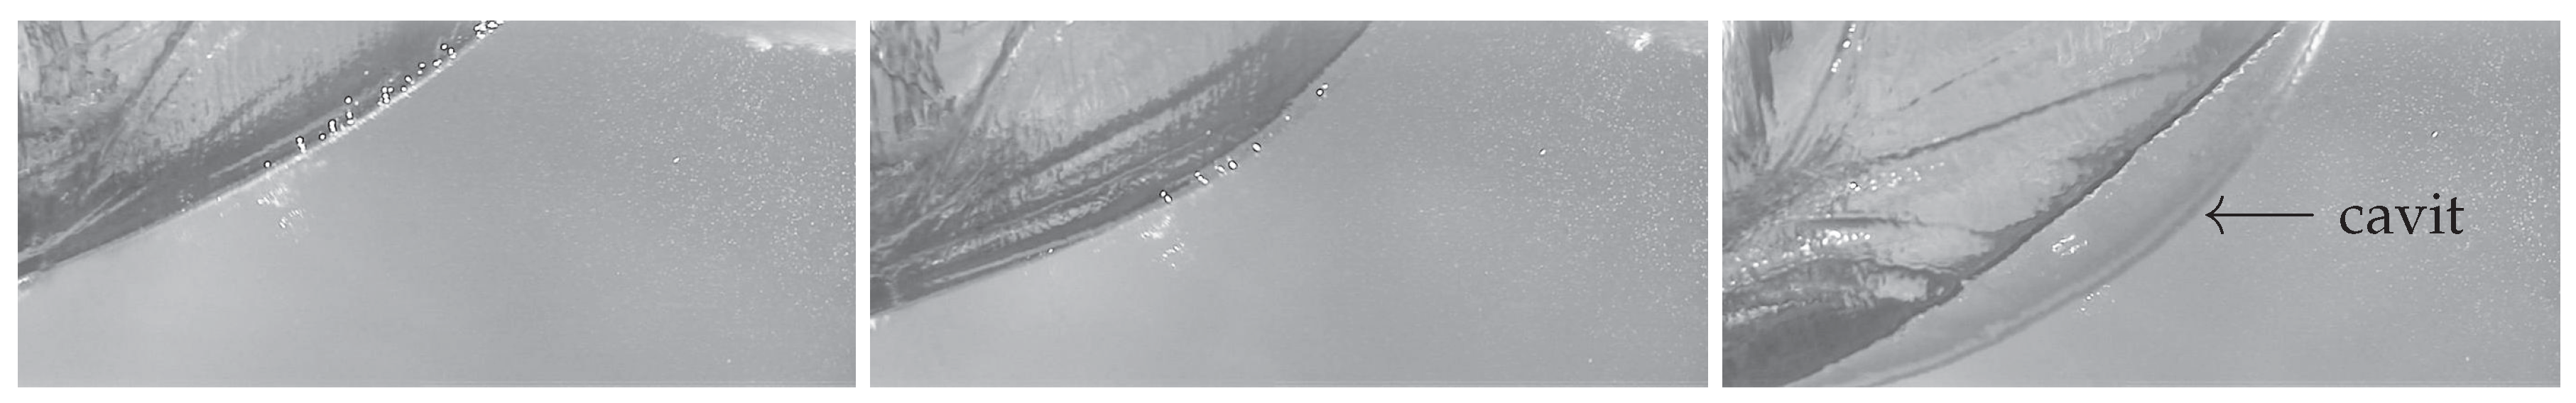
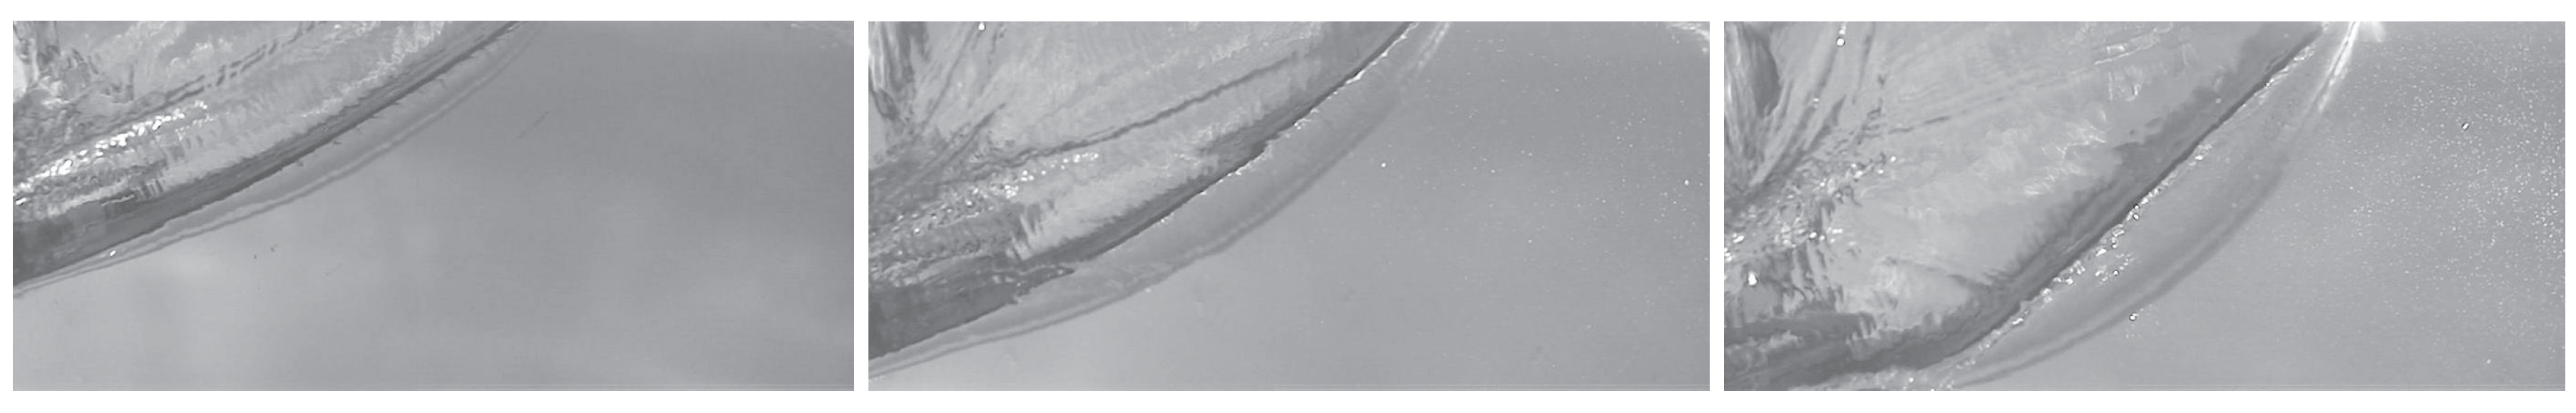
5.2. Evidence of Cavity Formation from High-Speed Images

It was mentioned before that increasing the severity of the impact increases panel deformation. The high-speed images captured during the impact showed that the increasing deformation serves as onset for the generation of cavities within the liquid. It was found that in the most severe impacts, after maximum concave deformation is reached, a clearly visible cylindrical front of cavitating fluid is formed. Figure 10, Figure 11, Figure 12 and Figure 13 show some examples of this phenomenon. Please note that the cylindrical cavity does not extend along the entire width of the wedge, but is only concentrated at the front and back edges, as shown in Section 3.
Figure 10 is taken as reference. It shows a wedge with a 30 ° deadrise angle entering the water at 4.3 m/s. In this case, the deformation of the panels is very low, and all the pictures showed a smooth and uniformly colored water region. As the severity of the impact increased, it was found that a fluid region with a cylindrical waveform front was generated in the fluid (right pictures in Figure 12 and Figure 13). Such a phenomenon is always found developing after maximum concave deformation is attained (central pictures). We comment that the cavity shape is not in line with the analytical predictions, as it does not seem to originate at the keel, which is the location of the minimum pressure. The cavity eventually collapses during water entry. In the most severe impact cases, successive pockets (with decreasing amplitude) might generate and collapse.
Figure 14 shows that, for a given wedge (V) ( β = 20 ° ), the maximum dimension of the wavefront increases with impact velocity, as does maximum deformation. Please note that the images in Figure 14 correspond to the same impact time. In fact, as mentioned before, the cavity-formation phenomena initiate after the maximum deformation of the wedge is reached; such deformation is ruled by the first natural frequency of the panel, which is not influenced by entry velocity.
It was previously shown that the cavity cross-sectional area increases with impact velocity and structural compliance. Here, we provide insight on its effect on the acceleration of the body during the impact.
Figure 15 shows the time traces of acceleration recorded during the water entry of a composite wedge (V2) with β = 20 ° entering the water at 5.6 m/s. Three repetitions of the same experiment are shown (solid, dashed, and dotted lines). Images from the high-speed camera at characteristic time instants of the impact were superimposed to the graph to get a better overview of the impact dynamics. Notably, acceleration suddenly turns negative at about 20 ms from the impact (positive acceleration in the plot is opposite to gravity, and free fall is referenced as 0). Such behavior is very uncommon in water entry, as it represents a body being sucked into the water. The analysis of the high-speed images showed that acceleration starts its decreasing trend to eventually attain negative values after the cavity is generated within the fluid. It was further found that acceleration turns positive as the cavity pockets collapse. Results thus evidence strong relation between cavity evolution and impact dynamics. The lower graph in Figure 15 further shows the time trace of the strain during the impact. Strain signals are acquired by two strain gauges located at 30 mm and 130 mm from the keel (which is almost at the mid-span). Results show that the negative acceleration initiates as the maximum concave deformation is attained, that is, when the strain gauge at the midspan reaches its peak, approximately 18 ms after impact. By comparing the images from the high-speed camera with the time trace of the strains, it appears that the cavity starts as the maximum concave deformation of the panel is reached.

6. Conclusions

Experimental drop tests of flexible wedges were performed to study the fluid–structure interaction phenomena that generate during water entry, with particular attention to the cavity-formation process and its effect on impact dynamics. It was found that, when the deflection of the wedge is small, no fluid–structure interaction phenomena appear and established analytical formulations for rigid bodies can be used to evaluate the impact force and the hydrodynamic pressure. However, large structural deformations were found to have strong effects on the fluid motion. In particular, large deformations might introduce air pockets characterized by a cylindrical wavefront originating at the fluid/structure interface. Such a cavity is found to equally originate from the front and rear faces of the structure, and their shape is not in line with analytical predictions, as it seems to not originate from the keel, where pressure is supposed to be the lowest, but along the entire wet length of the structure. The cavity eventually collapses during water entry, and, in the most severe impact cases, successive pockets (with decreasing amplitude) might repetitively generate and collapse. The pockets are found to increase with the impact velocity and the flexibility of the wedge. The largest cavities were further found to strongly affect impact dynamics, up to the cases where the overall acceleration of the body turns negative within the timeframe between cavity formation and its collapse. The analysis of the panel’s deformation suggests that the cavity initiates as the maximum concave deformation of the panel is reached, further confirming that cavity formation is led by structural vibrations.

Author Contributions

Conceptualization, G.M.; data curation, R.P.; funding acquisition, R.P. and G.M.; resources, T.P.; supervision, G.M.; visualization, T.P.; writing—original draft, R.P.; writing—review & editing, T.P.

Funding

This research received no external funding.

Conflicts of Interest

The authors declare no conflict of interest.

References

  1. Qin, Z.; Batra, R.C. Local slamming impact of sandwich composite hulls. Int. J. Solids Struct. 2009, 46, 2011–2035. [Google Scholar] [CrossRef]
  2. Carcaterra, A.; Ciappi, E. Prediction of the Compressible Stage Slamming Force on Rigid and Elastic Systems Impacting on the Water Surface. Nonlinear Dyn. 2000, 21, 193–220. [Google Scholar] [CrossRef]
  3. Carcaterra, A.; Ciappi, E. Hydrodynamic shock of elastic structures impacting on the water: Theory and experiments. J. Sound Vib. 2004, 271, 411–439. [Google Scholar] [CrossRef]
  4. Panciroli, R.; Minak, G. Experimental evaluation of the air trapped during the water entry of flexible structures. Acta Imeko 2014, 3, 63–67. [Google Scholar] [CrossRef]
  5. Kapsenberg, G.K. Slamming of ships: where are we now? Philos. Trans. R. Soc. A Math. Phys. Eng. Sci. 2011, 369, 2892–2919. [Google Scholar] [CrossRef] [PubMed] [Green Version]
  6. Faltinsen, O.M. Hydroelastic slamming. J. Mar. Sci. Technol. 2000, 5, 49–65. [Google Scholar] [CrossRef]
  7. Faltinsen, O.M.; Landrini, M.; Greco, M. Slamming in marine applications. J. Eng. Math. 2004, 48, 187–217. [Google Scholar] [CrossRef]
  8. Fragassa, C. Engineering Design Driven by Models and Measures: The Case of a Rigid Inflatable Boat. Preprints 2018. [Google Scholar] [CrossRef]
  9. Fragassa, C.; Minak, G. Measuring Deformations in a Rigid-Hulled Inflatable Boat. Key Eng. Mater. 2017, 754, 295–298. [Google Scholar] [CrossRef]
  10. Seddon, C.; Moatamedi, M. Review of water entry with applications to aerospace structures. Int. J. Impact Eng. 2006, 32, 1045–1067. [Google Scholar] [CrossRef]
  11. Campbell, J.C.; Vignjevic, R. Simulating structural response to water impact. Int. J. Impact Eng. 2012, 49, 1–10. [Google Scholar] [CrossRef] [Green Version]
  12. Hughes, K.; Vignjevic, R.; Campbell, J.; De Vuyst, T.; Djordjevic, N.; Papagiannis, L. From aerospace to offshore: Bridging the numerical simulation gaps–Simulation advancements for fluid structure interaction problems. Int. J. Impact Eng. 2013, 61, 48–63. [Google Scholar] [CrossRef]
  13. Wagner, H. {Ü}ber Sto{ß}- und Gleitvorg{ä}nge an der Oberfl{ä}che von Fl{ü}ssigkeiten. ZAMM Z. Angew. Math. Mech. 1932, 12, 193–215. [Google Scholar] [CrossRef]
  14. Chuang, S.L. Investigation of Impact of Rigid and Elastic Bodies with Water; NSRDC Report No. 3248; David Taylor Model Basin Reports; PN: Bethesheda, MA, USA, 1970. [Google Scholar]
  15. Panciroli, R.; Porfiri, M. Evaluation of the pressure field on a rigid body entering a quiescent fluid through particle image velocimetry. Exp. Fluids 2013, 54, 1630. [Google Scholar] [CrossRef]
  16. Korobkin, A.; Parau, E.I.; Vanden-Broeck, J.M. The mathematical challenges and modelling of hydroelasticity. Philos. Trans. Ser. A Math. Phys. Eng. Sci. 2011, 369, 2803–2812. [Google Scholar] [CrossRef] [PubMed] [Green Version]
  17. Korobkin, A.; Guéret, R.; Malenica, Š. Hydroelastic coupling of beam finite element model with Wagner theory of water impact. J. Fluids Struct. 2006, 22, 493–504. [Google Scholar] [CrossRef]
  18. Das, K.; Batra, R.C. Local water slamming impact on sandwich composite hulls. J. Fluids Struct. 2011, 27, 523–551. [Google Scholar] [CrossRef]
  19. Zhao, R.; Faltinsen, O.; Aarsnes, J. Water entry of Arbitrary Two-Dimensional sections with and without flow separation. In Twenty-First Symposium on Naval Hydrodynamics; The National Academies Press: Washington, DC, USA, 1997. [Google Scholar]
  20. Scolan, Y. Hydroelastic behaviour of a conical shell impacting on a quiescent-free surface of an incompressible liquid. J. Sound Vib. 2004, 277, 163–203. [Google Scholar] [CrossRef]
  21. Wu, G.X.; Sun, H.; He, Y.S. Numerical simulation and experimental study of water entry of a wedge in free fall motion. J. Fluids Struct. 2004, 19, 277–289. [Google Scholar] [CrossRef]
  22. Von Karman, T. The Impact on Seaplane Floats, during Landing; NACA-TN-321; National Advisory Committee for Aeronautics: Washington, DC, USA, 1929.
  23. Backer, G.D.; Vantorre, M.; Beels, C.; Pré, J.D.; Victor, S.; Rouck, J.D.; Blommaert, C.; De Backer, G.; Vantorre, M.; Beels, C.; et al. Experimental investigation of water impact on axisymmetric bodies. Appl. Ocean Res. 2009, 31, 143–156. [Google Scholar] [CrossRef]
  24. El Malki Alaoui, A.; Nême, A.; Tassin, A.; Jacques, N.; Alaoui, A.E.M.; Nême, A.; Tassin, A.; Jacques, N. Experimental study of coefficients during vertical water entry of axisymmetric rigid shapes at constant speeds. Appl. Ocean Res. 2012, 37, 183–197. [Google Scholar] [CrossRef]
  25. Chuang, S.L.; Milne, D.T. Drop Tests of Cone to Investigate the Three-Dimensional Effect Of Slamming; NRDC Report No. 3543; Naval Ship Research and Development Center: Washington, DC, USA, 1971. [Google Scholar]
  26. Jalalisendi, M.; Shams, A.; Panciroli, R.; Porfiri, M. Experimental reconstruction of three-dimensional hydrodynamic loading in water entry problems through particle image velocimetry. Exp. Fluids 2015, 56, 1–17. [Google Scholar] [CrossRef]
  27. Jalalisendi, M.; Osma, S.J.; Porfiri, M. Three-dimensional water entry of a solid body: A particle image velocimetry study. J. Fluids Struct. 2015, 59, 85–102. [Google Scholar] [CrossRef] [Green Version]
  28. Korobkin, A. Cavitation in liquid impact problems. In Proceedings of the Fifth International Symposium on Cavitation (CAV2003), Osaka, Japan, 1 January 2003; Volume 2, pp. 1–7. [Google Scholar]
  29. Faltinsen, O.M. The effect of hydroelasticity on ship slamming. Philos. Trans. R. Soc. A Math. Phys. Eng. Sci. 1997, 355, 575–591. [Google Scholar] [CrossRef]
  30. Reinhard, M.; Korobkin, A.A.; Cooker, M.J. Cavity formation on the surface of a body entering water with deceleration. J. Eng. Math. 2015. [Google Scholar] [CrossRef]
  31. Bivin, Y.K.; Glukhov, Y.M.; Permyakov, Y.V. Vertical entry of solids into water. Fluid Dyn. 1986, 20, 835–841. [Google Scholar] [CrossRef]
  32. Yadong, W.; Xulong, Y.; Yuwen, Z. Natural Cavitation in High Speed Water Entry Process. In Proceedings of the 1st International Conference on Mechanical Engineering and Material Science, Shanghai, China, 28–30 December 2012; Atlantis Press: Paris, France, 2012; pp. 46–49. [Google Scholar] [CrossRef]
  33. Korobkin, A.A.; Khabakhpasheva, T.I.; Wu, G.X. Coupled hydrodynamic and structural analysis of compressible jet impact onto elastic panels. J. Fluids Struct. 2008, 24, 1021–1041. [Google Scholar] [CrossRef]
  34. Korobkin, A.; Ellis, A.S.; Smith, F.T. Trapping of air in impact between a body and shallow water. J. Fluid Mech. 2008, 611, 365–394. [Google Scholar] [CrossRef]
  35. Hicks, P.D.; Ermanyuk, E.V.; Gavrilov, N.V.; Purvis, R.; Mechanics, F. Air trapping at impact of a rigid sphere onto a liquid. J. Fluid Mech. 2012, 695, 310–320. [Google Scholar] [CrossRef]
  36. Cuomo, G.; Piscopia, R.; Allsop, W. Evaluation of wave impact loads on caisson breakwaters based on joint probability of impact maxima and rise times. Coast. Eng. 2011, 58, 9–27. [Google Scholar] [CrossRef]
  37. Ma, Z.H.; Causon, D.M.; Qian, L.; Mingham, C.G.; Mai, T.; Greaves, D.; Raby, A. Pure and aerated water entry of a flat plate. Phys. Fluids 2016, 28, 016104. [Google Scholar] [CrossRef] [Green Version]
  38. Panciroli, R.; Porfiri, M. Hydroelastic impact of piezoelectric structures. Int. J. Impact Eng. 2014, 66, 18–27. [Google Scholar] [CrossRef]
  39. Jalalisendi, M.; Porfiri, M. Water entry of compliant slender bodies: Theory and experiments. Int. J. Mech. Sci. 2018, 149, 514–529. [Google Scholar] [CrossRef]
  40. Panciroli, R.; Porfiri, M. Analysis of hydroelastic slamming through particle image velocimetry. J. Sound Vib. 2015, 347, 63–78. [Google Scholar] [CrossRef]
  41. Shams, A.; Zhao, S.; Porfiri, M. Water impact of syntactic foams. Materials 2017, 10. [Google Scholar] [CrossRef] [PubMed]
  42. Mei, R.; Luo, L.S.; Shyy, W. An Accurate Curved Boundary Treatment in the Lattice Boltzmann Method. J. Comput. Phys. 1999, 155, 307–330. [Google Scholar] [CrossRef] [Green Version]
  43. Panciroli, R.; Abrate, S.; Minak, G.; Zucchelli, A. Hydroelasticity in water-entry problems: Comparison between experimental and SPH results. Compos. Struct. 2012, 94, 532–539. [Google Scholar] [CrossRef]
  44. Panciroli, R.; Abrate, S.; Minak, G. Dynamic response of flexible wedges entering the water. Compos. Struct. 2013, 99, 163–171. [Google Scholar] [CrossRef]
  45. Panciroli, R. Hydroelastic Impacts of Deformable Wedges. Ph.D. Thesis, Alma Mater Studiorum Università di Bologna, Bologna, Italy, 2012. [Google Scholar] [CrossRef]
  46. Panciroli, R. Hydroelastic Impacts of Deformable Wedges. In Solid Mechanics and Its Applications; Abrate, S., Castanié, B., Rajapakse, Y.D.S., Eds.; Springer: Dordrecht, The Netherlands, 2013; Volume 192, pp. 1–45. [Google Scholar] [CrossRef]
Figure 1. Sketch of the problem of the water entry of a rigid wedge. The wedge enters the water surface at t = 0 (left) and penetrates the water by an entry depth ξ as time advances (right).
Jmse 06 00155 g001
Figure 2. Wagner’s predicted normalized pressure as a function of normalized wet length x / r at several instants. The solution was calculated for a wedge weighing 5 kg/m, with a 20 ° deadrise angle, entering the water at 2   m / s with pure vertical velocity.
Jmse 06 00155 g002
Figure 3. (Left) Normalized pressure versus entry depth for varying deadrise angles. (Right) Normalized minimum pressure versus deadrise angle.
Jmse 06 00155 g003
Figure 4. Schematics of a water-entry apparatus. The two possible locations (side and front) of the camera are showed. The sketch highlights the end-run cable used to stop the motion.
Jmse 06 00155 g004
Figure 5. Details of the vertex of the keel at several time instants, presenting the evolution of the cavity formation. Images are taken from the side.
Jmse 06 00155 g005
Figure 6. Deformation over time of a fiberglass/vinylester wedge with a deadrise angle of 30 ° entering the water at 4.2 m / s . Time advances left to right, top to bottom.
Jmse 06 00155 g006
Figure 7. Signal recorded by two strain gauges during the water entry of a fiberglass/polyester wedge 4 mm thick with a deadrise angle of 35 ° entering the water from an impact height of 1.5 m (approximately 5 m / s ). The graph on the right shows the strain measured at the center of the panel, while the graph on the left shows the strain close to the wedge tip. The full and the dashed lines represent two repetitions of the same experiment.
Jmse 06 00155 g007
Figure 8. Deformation over time of wedge (V) 2 mm thick ( β = 20 ° ) entering the water at 6.7 m / s . Time advances left to right, top to bottom.
Jmse 06 00155 g008
Figure 9. Signal acquired by two strain gauges during the water entry. The graph on the right shows the strain measured at the center of the panel, while the graph on the left shows the strain close to the wedge tip. Full and dashed lines are two repetitions of the same experiment.
Jmse 06 00155 g009
Figure 10. Evolution of the water entry of a wedge (W) ( β = 30 ° ) entering the water at ≈4.2 m/s at 25, 40, and 55 ms from the impact.
Jmse 06 00155 g010
Figure 11. Evolution of the water entry of a wedge (W) ( β = 15 ° ) entering the water at ≈6.7 m/s at 16.6, 20, and 23.3 ms from the impact. The arrow highlights the cylindrical front of the cavitating area.
Jmse 06 00155 g011
Figure 12. Evolution of the water entry of a wedge (V) ( β = 20 ° ) entering the water at ≈4.3 m/s at 40, 53.3, and 66.6 ms from the impact. The arrow highlights the cylindrical front of the cavitating area.
Jmse 06 00155 g012
Figure 13. Evolution of the water entry of a wedge (V) ( β = 20 ° ) entering the water at ≈6 m/s at 40, 53.3, and 66.6 ms from the impact. The arrow highlights the cylindrical front of the cavitating area.
Jmse 06 00155 g013
Figure 14. Maximum dimension of the wavefront during the water entry of a wedge (V) ( β = 20 ° ) entering the water at 4.3, 6, and 6.7 m/s.
Jmse 06 00155 g014
Figure 15. Graph of the recorded acceleration of a wedge (V) 2 mm thick ( β = 20 ° ) entering the water at 5.6 m/s, and high-speed camera images captured at 0, 5, 15, 20, 22.5, and 25 ms.
Jmse 06 00155 g015aJmse 06 00155 g015b
Table 1. Material properties.
MaterialAbbr.Elastic ModuliPoisson RatioDensity
E 1 = E 2 ν 12 ρ (kg/m 3 )
6068 T6A68.0 GPa0.322700
E-Glass/VinylesterV20.4 GPa0.282050
E-Glass/EpoxyW30.3 GPa0.282015
Table 2. First three theoretical dry natural frequencies of the panels composing the wedges.
Abbr.MaterialThickness ω 1 (Hz) ω 2 (Hz) ω 3 (Hz)
A2Aluminum2.0 mm18.0112.8316.1
A4Aluminum4.0 mm36.0225.7632.2
V2Fiberglass2.0 mm9.761.2171.4
V4Fiberglass4.0 mm19.7123.6346.2
W2Fiberglass2.2 mm19.6123.4345.5
W4Fiberglass4.4 mm37.8236.9663.4

