1. Introduction
Pollution that comes from a single source, like an oil or chemical spill, is known as
point source. In addition, nitrates and point-source pollution near estuaries and other water outlets can be catastrophic.
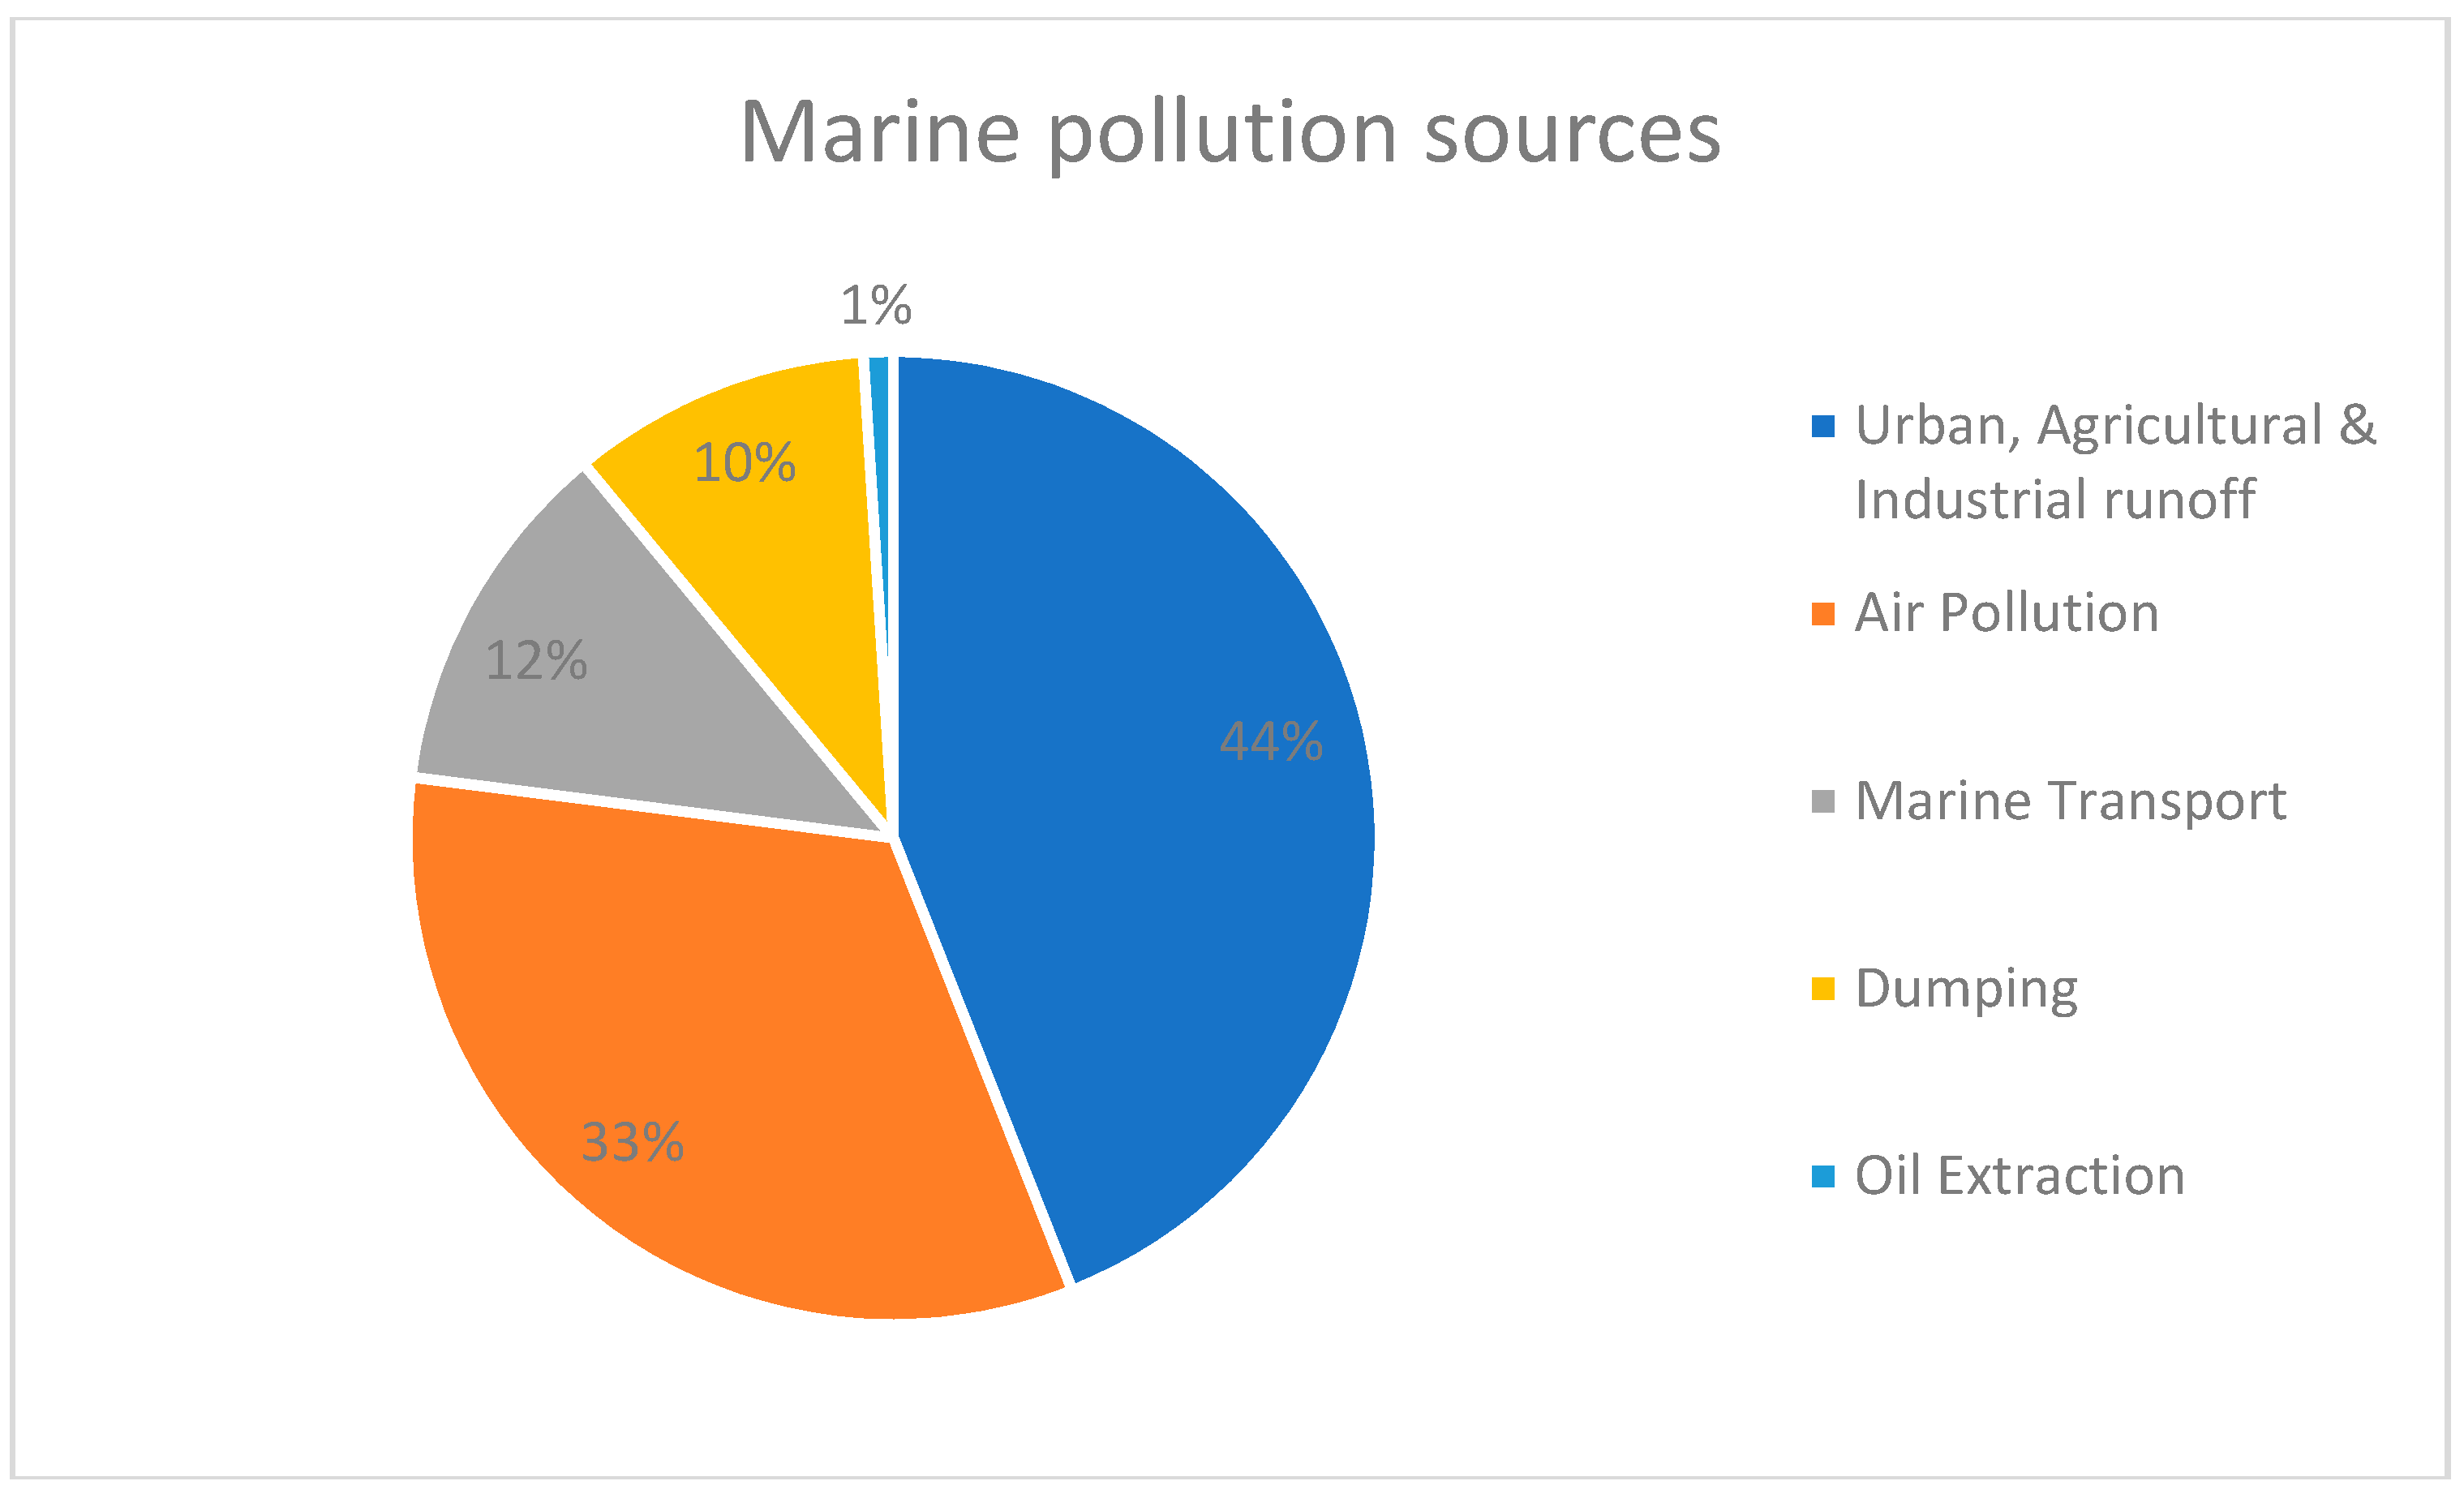
Figure 1 depicts clearly how pollution sources are distributed. Urban, agricultural and industrial runoff coincide with air pollution (namely non-point sources) to a very high 77% of marine pollution, whereas point sources such as marine transport, dumbing and oil extraction (when focusing only on oil pollution) contribute only by 23% [
1,
2]. In addition to that, discharge from malfunctioned or damaged factories, wastewater treatment plants and desalination facilities, is also considered point source pollution [
3].
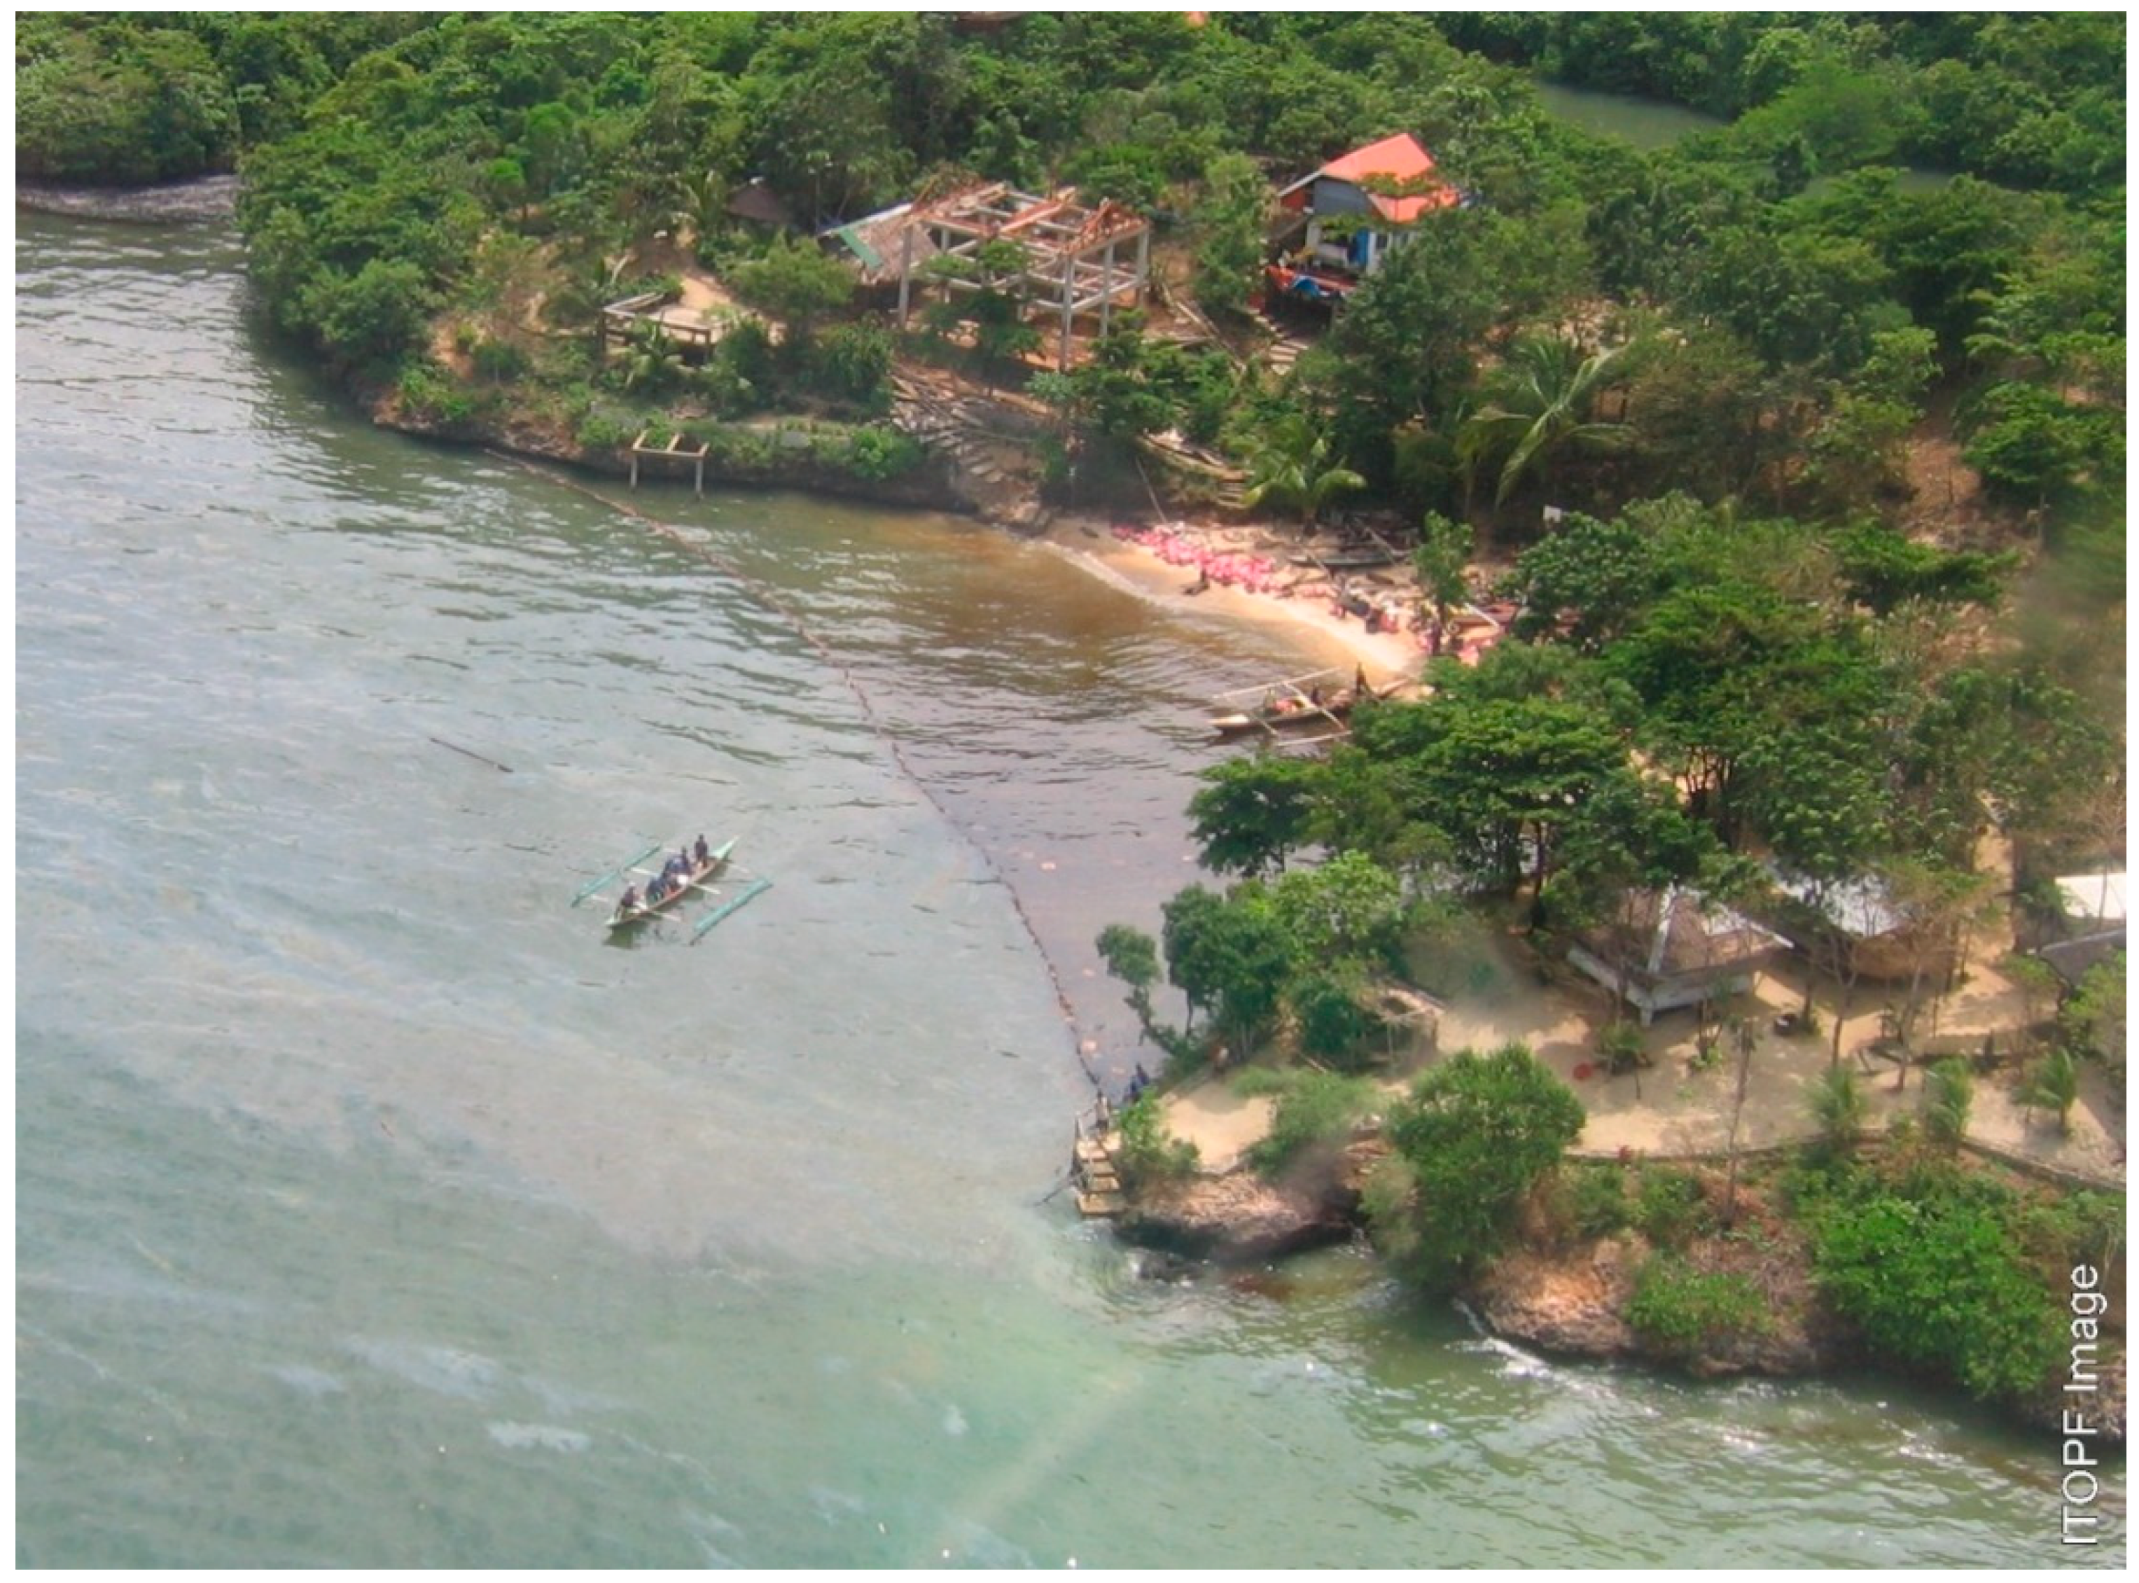
Ship collision or malfunction, or simply cleaning and sailing, can contribute to marine pollution by spreading garbage, black or grey water, sludge, water ballast, coatings or even air emissions, to the deep sea or at seashore. Oil spills occur after a collision and/or sinking of oil tankers, under bad weather conditions and are extremely hazardous in ports with dense maritime traffic. Ship malfunctions and accidents on-board are the main causes of ships running aground, or colliding contributing to the spreading of the spills. The most common nautical accidents occur due to sinking or foundering, grounding, structural failure, scuttling, by contact or collision, explosion or fire, or after disappearance or abandonment [
2]. The environmental impact of oil accidents is immense on both the water ecosystems and the coastal environment, including the urban and economic growth of the affected coastal zones (
Figure 2) but only for a set period of time, as some areas have natural oil cleaning ability.
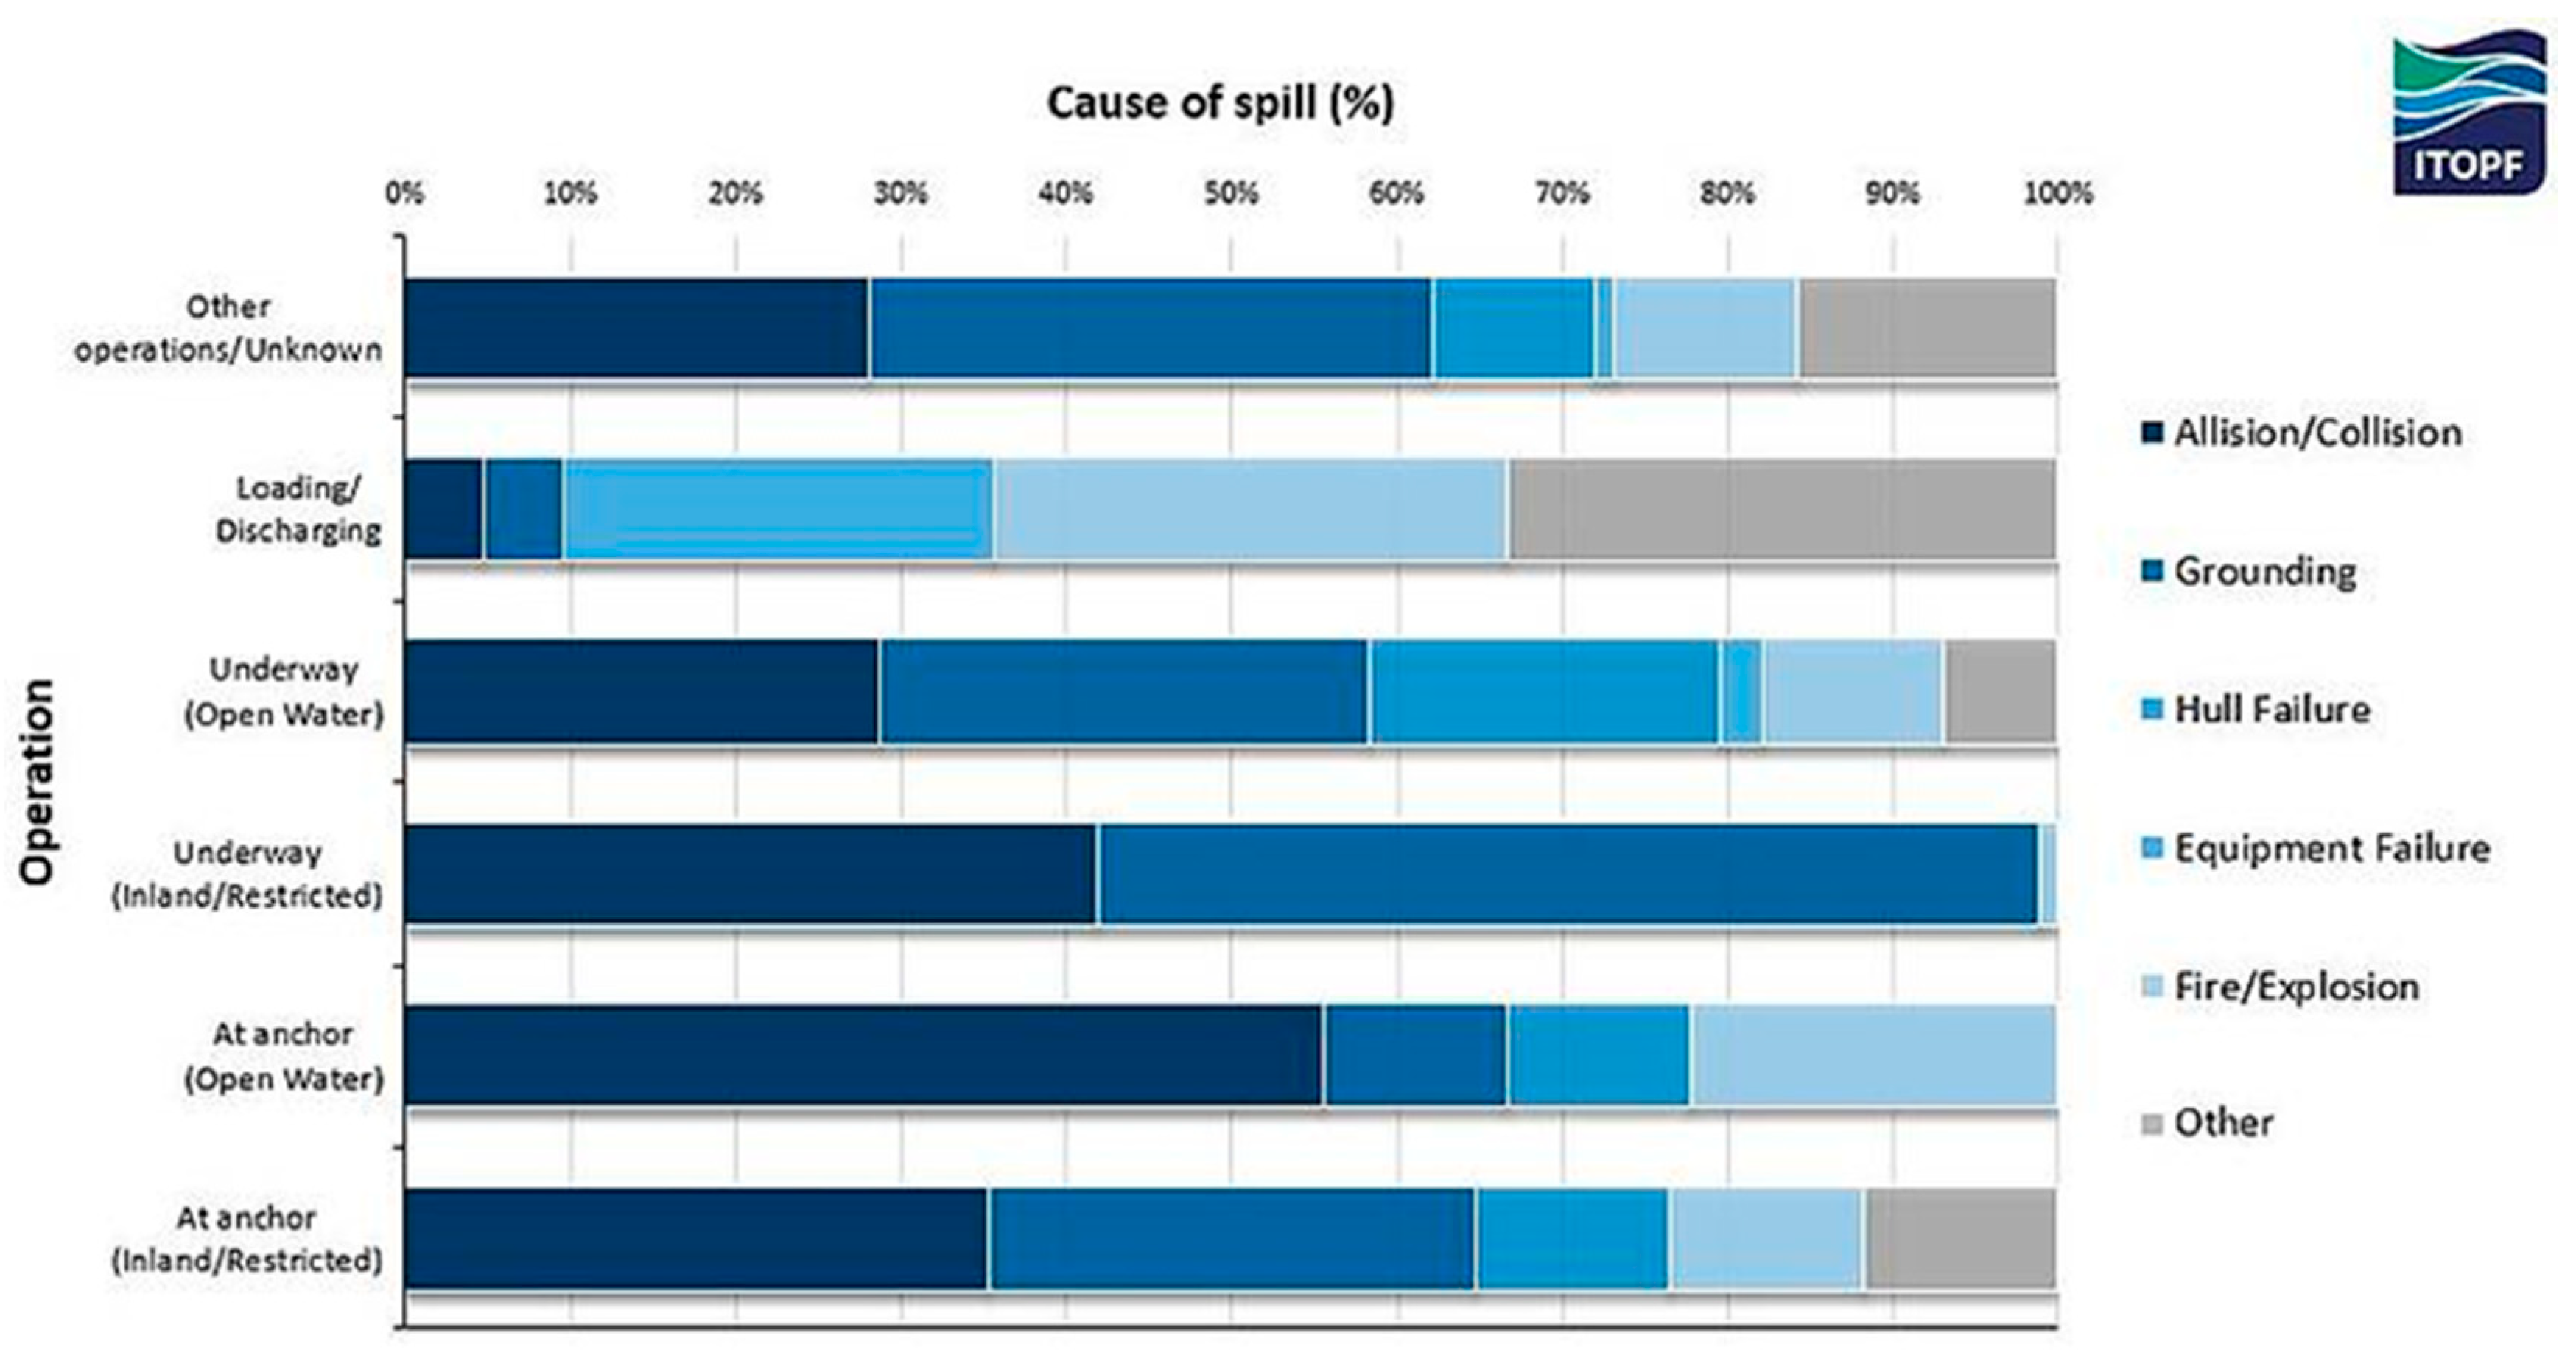
According to the International Tanker Owners Pollution Federation (ITOPF), oil spills can be attributed to allision/collision, grounding, hull or equipment failure, fire/explosion, while ships are at anchor (inland/restricted or in open waters), underway (inland/restricted or in open waters), or during loading/discharging or other operations, in the following percentages (
Figure 3).
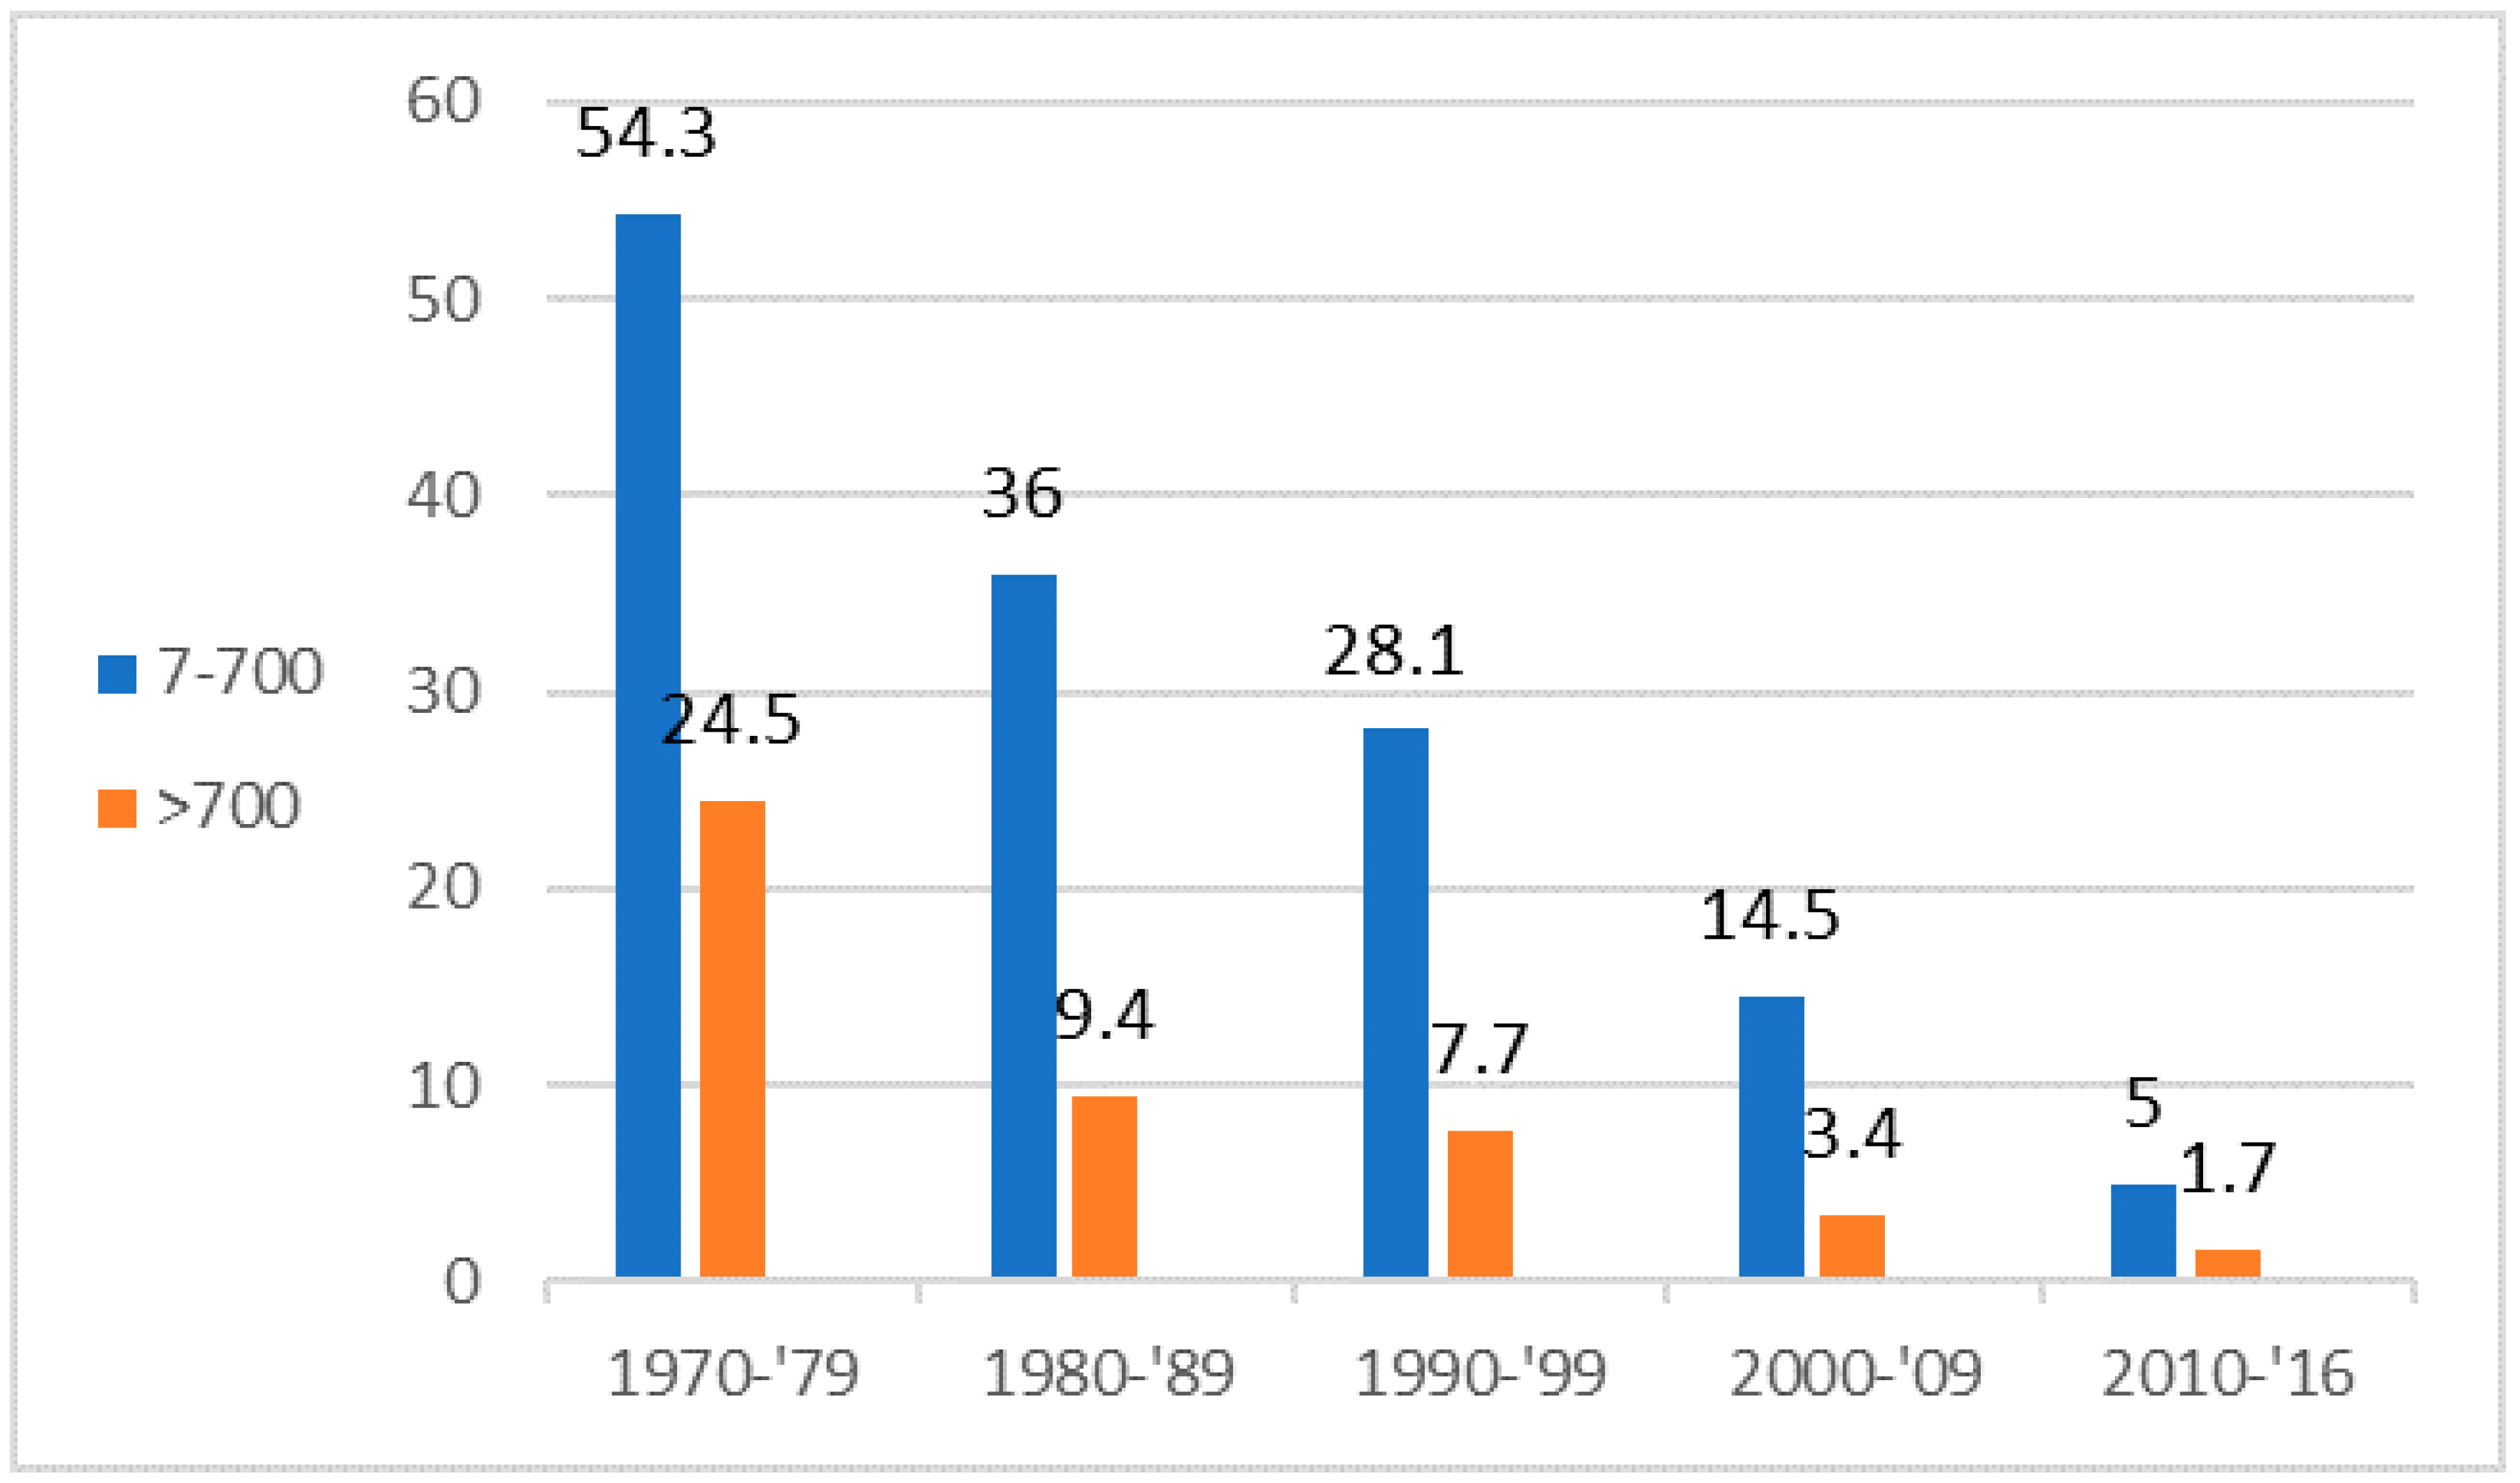
For historical reasons, spills are generally categorized by size: below 7 tn, between 7–700 tn and above 700 tn. Information is now available on over 10,000 incidents; luckily most of the spills are below 7 tn. According to the International Tanker Owners Pollution Federation (ITOPF) the average number of recorded small and large-scale oil spills worldwide is remarkably decreasing [
2], as graphically depicted in
Figure 4. This is mainly due to the fact that illegal discharges are being increasingly monitored and ship owners punished by doing such discharges.
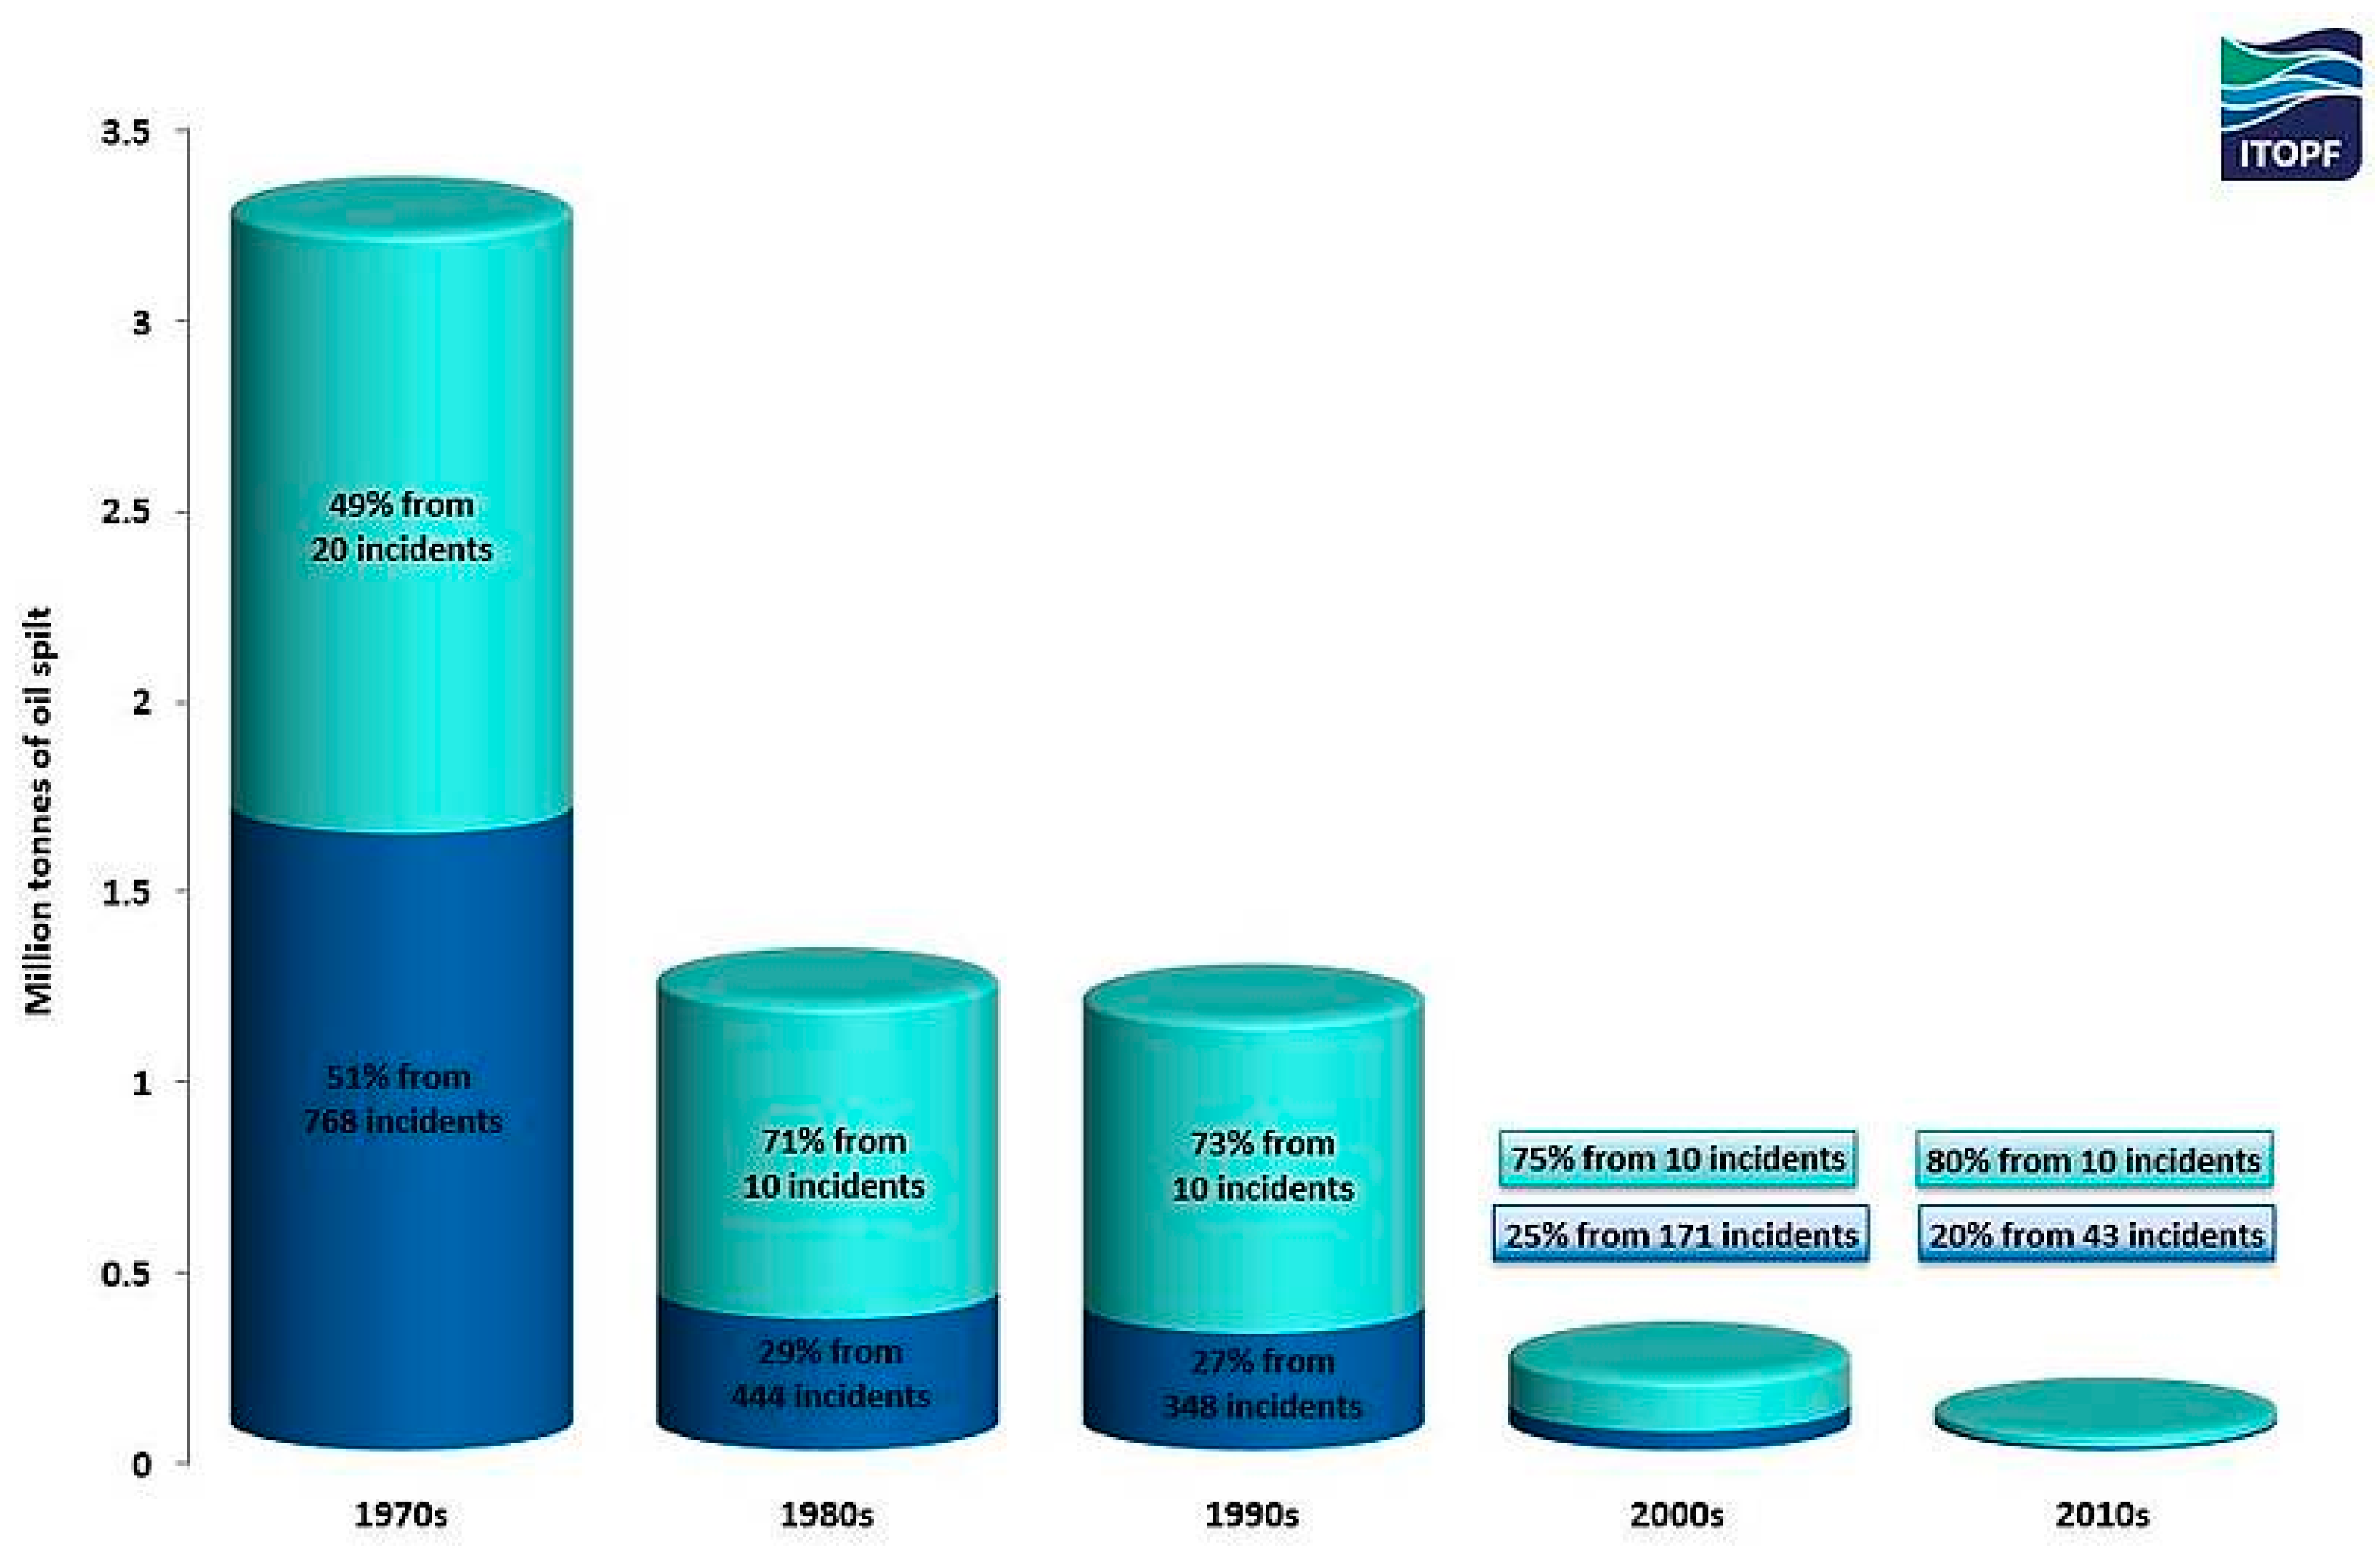
When looking at the frequency and quantities of oil spilled, it should be noted that a few very large spills are responsible for a high percentage of the oil spilled. For example, in more recent decades the following can be seen [
5]:
In the 1990s, there were 358 spills of more than 7 tn, resulting in 1,134,000 tn of oil lost; 73% of this amount was spilled in just 10 incidents.
In the 2000s, there were 181 spills of more than 7 tn, resulting in 196,000 tn of oil lost; 75% of this amount was spilled in just 10 incidents.
In the period 2010–2017 there have been 53 spills of more than 7 tn, resulting in 47,000 tn of oil lost; 80% of this amount was spilled in just 10 incidents.
In terms of the oil volume spilled, the statistics for a particular year may be severely distorted by a single large incident. This is clearly illustrated in
Figure 5 [
5].
Table 1 summarizes the top 10 oil spills accidents in history, in descending order of oil volume spilled, which were caused due to collision, fire, explosion or sinking. Two of the biggest oil spills in history, caused after a wellhead blowout, were Deepwater Horizon, on April 21st, 2010, in the Gulf of Mexico, with 633,116 tn, and IXTOC 1, on June 3rd, 1979, in the Gulf of Mexico, with 470,000 tn.
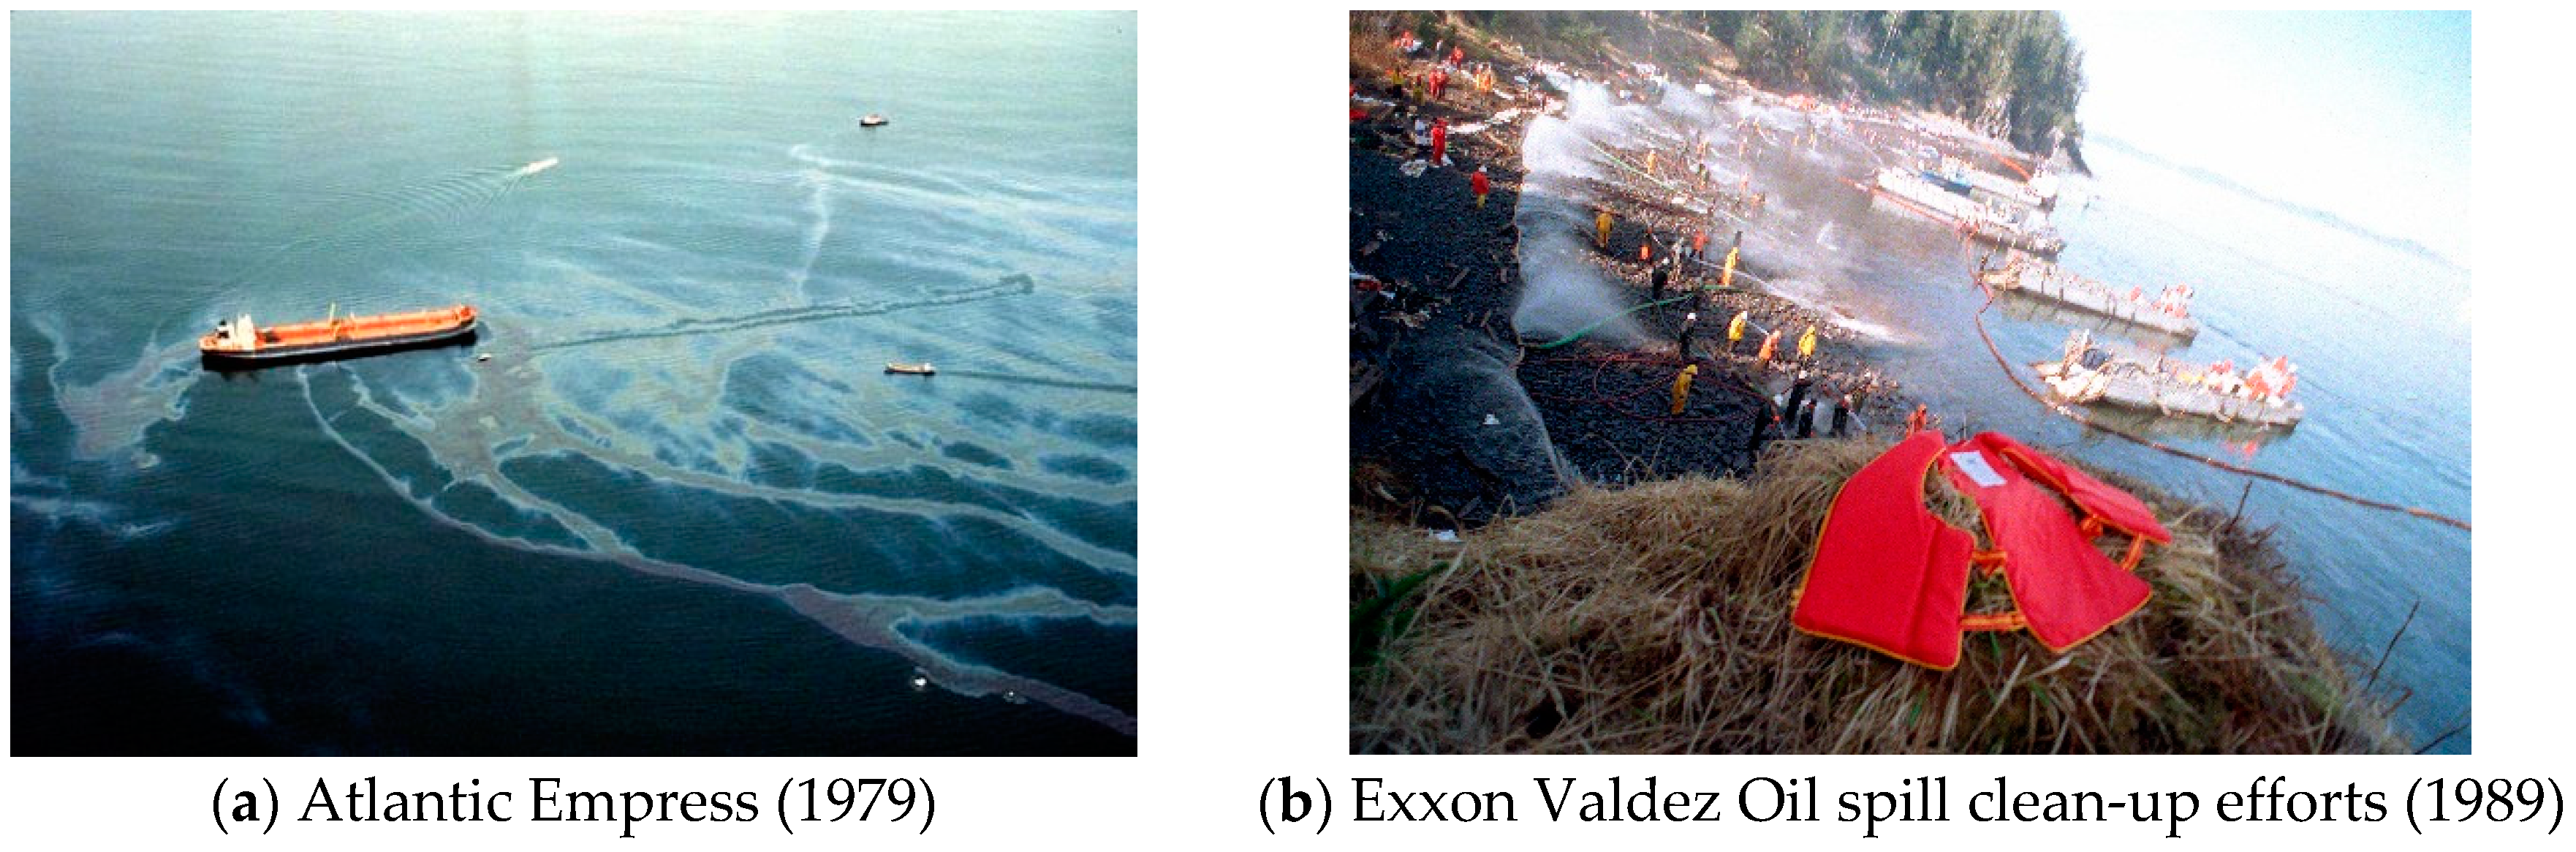
Figure 6 demonstrates two of the most renowned oil spills in history. The 1989 Exxon Valdez, the 1991 Gulf war, the 2010 Deepwater Horizon are few of the most renowned oil spills in history that alarmed the scientific community and directed all towards the management of anthropogenic environmental disasters in the marine environment. The TORREY CANYON (1967) was the first major tanker disaster to be brought to the notice of the general public due to enormous media coverage, and drew universal attention to the dangers of dispersants. The spill triggered the international Conventions, which form the basis for compensation for damage caused by tanker spills, and interim voluntary agreements to bridge the gap before the Conventions entered into force and became widely accepted [
5].
2. Oil Spill Contingency Plans and Relative Legislation
In the wake of global concerns, the Marine Environment Protection Committee of the International Marine Organization (IMO) developed the International Convention on Oil Pollution Preparedness, Response and Cooperation (OPRC) in 1990, to provide a framework for international cooperation for combating oil pollution incidents. It came into effect only after the ratification from the majority of the countries-members, in 1995. The OPRC Convention has 19 Articles and 10 Resolutions, covering both administrative and technical aspects. These call, among others, for parties’ oil exploration and production activities, shipyards, oil refineries, terminals and depot, ports, harbours and marinas, manufacturing plants and other establishments using oil, to develop and maintain oil spill response plans. Ships and vessels are also required to develop and maintain on board a Shipboard Oil Pollution Emergency Plan (SOPEP), while countries are required to develop and maintain a National Oil Spill Contingency Plan for major incidents. The parties to the OPRC Convention are required to establish measures for dealing with pollution incidents, either nationally or in cooperation with other countries [
6]. A contingency plan should comprise three parts:
A strategy/preparedness section to get ready for real action, which should describe the scope of the plan, the geographical coverage, the perceived risks and hazard assessment, the roles and responsibilities of those charged with implementing the plan, the available equipment, scenarios of oil spill incidents accompanied by oil slick simulation and identification of combating options.
A response action, to deal with the spilled oil, which should set out the emergency procedures that will allow rapid assessment of the spill and the mobilization of appropriate response resources, as well as application of models upon request for prediction of oil spill movement.
A data directory, which should contain all relevant maps, resource lists and data sheets required to support an oil spill response effort and conduct the response according to an agreed strategy.
All countries with extremely important maritime traffic, are obliged, according to the legislation, to establish an oil contingency plan and next to them, every port authority, company and facility that handles oil products in coastal areas. Methodologically the development of a Port Contingency Plan (PCP) should include the following stages [
7]:
Recording of general information about the area and description of its basic morphological, economic, social and environmental characteristics.
Establishment of a catalogue of all the hazardous substances (name, characteristics, properties) handled by the port facilities and mapping of the handling locations in the port area.
Identification of all the incidents/scenarios that could lead to emergency situations.
Qualitative and quantitative risk assessment for the marine environment in any case of incident involving any of the dangerous substances.
Description of the equipment and the sequence of actions for the collection and disposal of the dangerous waste.
Definition and description of the preparedness exercises that the authorized-to handle emergency situations personnel should take.
Definition of rules and measures to be followed to preserve the personnel’s safety and health.
Prediction of the necessary procedures in the case of a plan’s revision.
It is easily derived that stages (e) and (f) are of utmost importance. The recognition of actions that should be taken in case of an accidental oil spill and the tools required to achieve the best marine protection comprise the operational activity needed to handle successfully an oil pollution emergency.
Besides the OPRC, the management of the maritime pollution from oil is further supported by a series of regulatory and legislative acts, such as the International Convention on Civil Liability for Oil Pollution Damage (1969), the International Convention for Marine Pollution MARPOL73/78, Bonn Agreement (1983) for cooperation in dealing with pollution by oil and other substances in the North Sea, Helsinki Convention (1992) on the protection of the marine environment of the Baltic Sea area, OSPAR Convention (1992) for the protection of the marine environment of the North-East Atlantic sea, the Protocol on Preparedness, Response and Co-operation to Pollution Incidents by Hazardous and Noxious Substances (2000), the International Convention on Civil Liability for Bunker Oil Pollution Damage (2001), the Directive 2013/30/EU on safety for offshore oil and gas operations and amending Directive 2004/35 EC, other regional/European initiatives, national laws and port regulations. The NEREIDS project [
8] provides an integrated vision of maritime policy and surveillance, aimed to enhance automatic and unsupervised ship monitoring capabilities for Maritime Situational Awareness (MSA) and to support advanced and efficient decision-making tools.
International research has focused on modelling the oil spills. The trajectory and the transport mechanism of the M/V Marathassa oil spill have been studied. The research results showed that the fraction of the oil on the water surface and on the shoreline, as well as the amount of oil recovered were affected by the time of the initial release, the overall duration of the discharge, wind and recovery actions [
9].
Another study compares the Department of Energy’s (DOE’s) National Energy Technology Laboratory’s (NETL’s) Blowout and Spill Occurrence Model (BLOSOM), with the National Oceanic and Atmospheric Administration’s (NOAA’s) General NOAA Operational Modelling Environment (GNOME). A complex approach was used for the comparison of the two models. This proposed methodology could be used to illustrate the approach an oil spill modeller would typically follow when trying to hindcast or forecast an oil spill, including detailed technical information on basic aspects [
10].
Detection of oil spills is another research challenge. In this context, an algorithm is developed to effectively analyse large-scale oil spill areas in SAR images. Furthermore, an ANN algorithm was used to generate probability maps of oil spills [
11]. In the same scientific area of the oil detection is also focusing the next study. Authors developed algorithms for oil spill detection using radar remote sensing. The algorithms take into account both the mathematical and the physical modelling of the sea surface covered by oil slicks [
12].
Modelling the “fate” of oil in shallow waters is extremely important. This is the aim of a study, where a model for the dynamics of oil in suspension, appropriate for shallow waters, including the nearshore environment is presented. The proposed model is capable of oil mass conservation and does so by evolving the oil on the sea surface as well as the oil in the subsurface [
13]. The theme of the following papers focuses on the treatment approaches of oil spills. This is field of research of the next study that describes a two-stage method for optimizing the location of marine oil spill combat forces and assessing the costs related to this action at the sea. Response time, cost and effectiveness of the means to treat multiple oil spills is the aim of the current paper. This translates into an optimization problem that relates to positioning the oil pollution combat ships in ports, in such a way that they are able combat the anticipated number of oil spills in certain positions in the Polish coast of the Baltic Sea area in the shortest possible time [
14].
Another step towards the treatment of oil spills is the use of novel methods and materials to prevent or slow the advancement of oil spills and remove them from the sea. Materials and techniques environmentally friendly are being developed. This is the goal of the following study. An environmentally friendly and degradable material, Poly (lactic acid) (PLA) ultrafine fibres is introduced, for the removal of oil from water. It is emphasized that this work is expected to promote the mass production and application of biodegradable PLA fibres in the treatment of marine oil spill pollution [
15].
Last but not least, is the contribution of the Aristotle University of Thessaloniki, to the development of oil spill transport models that can predict the fate and evolution of an oil spill and provide useful information to the authorities in order to apply the abovementioned measures [
16,
17,
18,
19,
20].
Research has focused on preventing and detecting oil spills, developing methods for treating the oil spills and removing them from the natural environment, assessing the impact that such accidents cause on the various forms of life and especially in the human health and nutrition. The current paper focuses on the treatment stage and highlights a methodological approach for prioritizing/ranking available treatment methods for oil spills based on the unique characteristics of the affected location.
3. Methodological Approach and Findings
In the present paper, the aim is to rank the alternative treatment approaches for dealing with the oil spill by means of a multicriteria method. The methodological steps included the following:
- ▪
Consideration of the alternative treatment approaches for the oil containment (please see
Table 2)
- ▪
Definition of selection parameters/scenarios for the alternative treatment approaches, namely:
- ✓
Coastal description
- ✓
Weather conditions
- ✓
Oil type
- ✓
Approach characterization
- ▪
Definition of corresponding selection criteria per parameter/scenario, for the alternative treatment approaches
- ▪
Creation and dissemination of a structured questionnaire to experts in order to assign weights to the considered criteria (please see
Table 3,
Table 4,
Table 5 and
Table 6)
- ▪
Creation and dissemination of a structured questionnaire to experts for assessing the performance-effectiveness of each alternative treatment approach against each criterion and within each scenario (please see
Table 7,
Table 8,
Table 9 and
Table 10)
- ▪
Application of Visual PROMETHEE per parameter/scenario
- ▪
The theoretical background of multicriteria methods was sought, necessary for understanding the ranking of the treatment approaches as well as for the subsequent findings based on the considered scenarios and criteria of the analysis.
The selected method for this evaluation is PROMETHEE (Preference Ranking Organization METHod for the Enrichment of Evaluations), by Brans and Marechal [
21]. In PROMETHEE methodology there are no specific instructions about how the weights will be assigned but instead each decision maker is capable of assigning priorities depending on the criteria [
22]. In this context, various approaches existed in international literature and Macharis et al. [
23] were the first to investigate potential synergies between European and American multicriteria methods. To understand PROMETHEE method, one should consider a decision problem with
n alternatives and
k criteria. For each criterion
fj (
j = 1, …,
k), a preference function
Pj(
a,
b) shall be adopted to translate the deviation between two alternatives a and b into Preference degree, with a range between 0 and 1. This function describes the difference d =
fj(
a) ‒
fj(
b) between the evaluations of the alternatives on each criterion.
A different preference function corresponds to each criterion, regardless if it is qualitative or quantitative. In Reference [
24] the following, six possible functions are proposed: U-Shape, V-Shape, Linear and Gaussian for quantitative criteria and Usual and Level for qualitative criteria. For qualitative criteria with no large rating scale, such as the 5-scale rating, Usual function appears as a decent choice, although for larger scales the most suitable function is Level. For some of the remaining functions, it is necessary to choose thresholds of Indifference (
Q) or Preference (
P) [
21,
25,
26,
27,
28,
29,
30,
31]. After choosing the most suitable function, criteria weights
wj are used to calculate the multicriteria preference index
π(
a,
b) taking into consideration all the criteria.
That index is used to calculate the positive preference flow (
Phi+,
φ+(
α)) and the negative preference flow (
Phi−,
φ−(
α)), where
The difference between the preference flows is the Net Preference flow (Phi, φ). Higher value of net preference flow represents higher appeal of the alternative solution. Therefore, in this paper the highest value of a net preference flow assigned to a treatment approach/alternative identifies the latter as the best choice among the available treatment methods for the examined scenario.
3.1. Choice of Alternative Approaches for the Oil Containment
In this particular study, the focus is on oil spill pollution and prevention. The alternative approaches in dealing with oil collection and removal can be ranked in terms of their effectiveness for the prevention and treatment of marine pollution from the oil spilled in case of an accident. The most common tools and methods for the spilled oil containment and removal in the sea are: (1) floating booms and barriers, (2) oil collecting materials, (3) oil collecting vessels, (4) absorbent materials, (5) chemical dispersants, (6) other chemicals, (7) physical degradation, (8) biodegradation and (9) on-site oil burning. These are recognized as the ‘alternatives’ (treatment approaches) in the multi-criteria analysis.
3.2. Selection of Scenarios and Corresponding Criteria
For the optimal choice among the alternatives some ‘criteria’ should be defined. Parameters (in the context of Visual PROMETHEE, they are called “scenarios”) that are critical for proper selection of responses to the oil spill, include: (a) coastal description (location - morphology), (b) weather conditions and (c) oil type. Coastal location and morphology, play a significant role in terms of economic, ecological or touristic value, as an even small oil spill would create multiple environmental and economic effects. The oil type that is spread after an accident and the weather conditions at the time of the accident, contribute correspondingly to the problem’s dimensions and its solution. For instance, light, medium and heavy fractions of oil, require different cleaning measures. More specifically, light products (e.g., gasoline, diesel) do not require costly and time-consuming applications to deal with, quite the opposite with heavy oil products. Lastly, the weather conditions, such as strong winds, can be prohibitive and disastrous during cleaning operations if they direct the spill towards a coast, or can be beneficial if they direct it towards the open seas where a mitigation plan can be applied.
The considered scenarios are assigned specific criteria. Therefore, the proposed scenarios along with the corresponding criteria include the following:
- ▪
Scenario 1: Coastal description
- ✓
Port
- ✓
Beach (Bathing waters—Touristic zones)
- ✓
Natura-Ramsar protected wetlands
- ✓
Fish/mussel-cultures
- ✓
Waterfront-urban area
- ▪
Scenario 2: Weather conditions
- ✓
Sunshine
- ✓
Rain
- ✓
Wind
- ✓
Snow
- ✓
Fog
- ▪
Scenario 3: Oil type
- ✓
Light fractions
- ✓
Medium fractions
- ✓
Heavy fractions
- ▪
Scenario 4: Approach characterization
- ✓
Effective
- ✓
Required (to apply)
- ✓
Time consuming
- ✓
Economical
- ✓
Well-known
- ✓
Environmentally friendly
3.3. Determination of Weights for the Criteria
PROMETHEE multi-criteria analysis method was chosen to rank the approaches than can be used to deal with oil spills, based on the criteria already mentioned. The Visual PROMETHEE Academic Edition program was used. As with any multicriteria method, it is imperative to define alternatives as well as the evaluation criteria. The following tables show in detail the alternatives (Ai) and the criteria (Cj) to be used along with their codification to facilitate data input in the Visual PROMETHEE application.
Weights are required according to the PROMETHEE methodology. This was pursued by collecting questionnaires and following a statistical analysis through the SPSS program (Statistical Package for Social Sciences). These questionnaires were distributed to scientists of various disciplines, who were asked to rank, according to their knowledge, the criteria that should play a significant role in the decision making of an oil spill containment. The scale was defined in such a way that 1 denotes the minimum significance of each criterion examined and 5 the maximum significance, respectively. The average weights for each criterion were ultimately used as the final weight-value for each criterion.
Table 3,
Table 4,
Table 5 and
Table 6 below, present the weights assigned to the criteria per scenario and serve as the entry data in the Visual PROMETHEE application.
Visual PROMETHEE software used the average weights as seen in the criteria tables and the performance/effectiveness assessment according to experts for each alternative per criterion. The application succeeded in assessing which alternatives are considered best with respect to the aforementioned criteria per scenario.
3.4. Determination of Treatment Approaches’ Effectiveness Against Each Criterion
The Visual PROMETHEE application additionally needs as inputs the effectiveness/performance of each treatment approach against each criterion. This was made possible through a structured questionnaire survey towards a number of selected experts. The questionnaires were completed through interviews. The following
Table 7,
Table 8,
Table 9 and
Table 10, present the mean values of the effectiveness for each treatment approach per criterion as recorded through the survey.
4. Results
The results of Visual PROMETHEE software for the four scenarios (coast description, weather conditions, oil type and approach characterization), are presented herein based on net, positive and negative flows. Higher value of net preference flow, as mentioned before, represents higher appeal of the alternative solution. The net preference flow (Phi) is calculated by adding the positive (Phi+) and negative (Phi-) flows.
Table 11 presents the ranking of the alternative solutions, based on net, positive and negative flows. It seems that the best four approaches to deal with oil spills, with respect to the coastal description, are, in descending order: floating booms and barriers, oil collecting materials and vessels and absorbent materials. The remaining five techniques were not ranked as important.
Table 12 shows the ranking of alternative solutions to deal with oil spills with net, positive and negative flows. It depicts that the best five ways to deal with oil spills, with respect to the weather conditions, are, in descending order: floating booms and barriers, absorbent materials, chemical dispersants, oil collecting materials and other chemicals. The remaining four show a negative flow, so they are not considered as best approaches, when dealing with the weather conditions.
Table 13 shows the ranking of approaches with net, positive and negative flows. It seems that the best five ways to deal with oil spills, with respect to the oil type spread, are in descending order: floating booms and barriers, oil collecting materials, on-site oil burning, oil collecting vessels and absorbent materials. The remaining four show a negative flow, so they are not accounted for best approach, when the oil type is considered.
Table 14 presents the ranking of approaches with net, positive and negative flows for each alternative in relation to the features examined. It depicts that the best four ways to deal with oil spills are, in descending order: floating booms and barriers, oil collecting materials and vessels and absorbent materials. The remaining five show a negative flow, so they are not considered as best approaches, with respect to the characterization of these approaches.
Taking into consideration all results, it is noticed that for the four examined scenarios, the alternative methods preferred by the participants of the survey, are the floating booms and barriers, the oil collecting vessels and the absorbent materials, which all show a positive net flow. Next, the oil collecting materials show a positive net flow in three of the four scenarios (only in the case of the weather conditions they show a negative net flow). The opposite is noticed for the treatment approaches of natural degradation and biodegradation, which always present a negative net flow. In addition, chemical dispersants and other chemicals exhibit a negative net flow in three out of four cases (only in the scenario of weather conditions a positive net flow is presented) and the on-site oil burning exhibits a negative net flow in three out of the four cases (only because of the criteria for the type of oil present a positive net flow).
Finally,
Table 15 was created to illustrate and summarize the ranking of the alternatives.
Table 15 highlights that in all four cases, the floating booms and barriers are in the 1
st place and in one of them (criteria related to the scenario: type of oil) together with the oil collecting materials are ranked 1st. In general, oil collecting vessels and absorbent materials occupy high positions in the ranking (2nd–5th) while other chemicals, chemical dispersants, natural degradation, biodegradation and on-site oil burning occupy mainly the last positions (with the exception of on-site burning which in one case occupies the 2nd position).
5. Conclusions
In the present study, the aim was to prioritize the actions (treatment approaches) that can be taken from local authorities and other relevant authorities, in the case of an oil spill accident, through a multicriteria methodology. Initially reference was made to point sources of marine pollution, such as oil accidents, which even though they contribute much less than the non-point sources of land runoff, their effect on the marine environment is direct, eminent and long-lasting. Both the environment and the economy of the affected areas suffer the consequences. Therefore, strict legislation exists, which requires mitigation plans readily available by the relevant authorities. The prioritization of these plans is very crucial, depending on the coastal characterization (port, beach, wetland etc.), the weather conditions at the time of the accident and the cleaning efforts and the oil type. With the use of Visual PROMETHEE application, the alternative cleaning methods were ranked with respect to the abovementioned criteria. The weight of each criterion and the performance of each treatment approach per criterion, were the subject of a questionnaire survey that took place, with the participation of expert scientists from various disciplines. The theoretical background of the multicriteria method is briefly presented, necessary for understanding the ranking of the treatment approaches. The alternative approaches to deal with an accidental oil spill were selected from among a wide variety. The most prominent are floating booms and barriers, oil collecting materials and vessels, absorbent materials, chemical dispersants and other chemicals, physical degradation and biodegradation and, finally, on-site oil burning.
Based on the weighting factors, provided by the questionnaires and the multicriteria analysis, the alternatives were ranked. The results have identified the floating booms and barriers, as the best oil spill containment approach, followed by the oil collecting vessels and the absorbent materials. Given the scenarios of oil type, weather conditions and the coastal characterization, as well as the opinion of the participants to the questionnaire on each alternative method, those three approaches are nominated as the most popular and effective. Even though the data sample was relatively small, PROMETHEE methodology is capable of completing the analysis and provide reliable results.
However, regarding future work, the same questionnaires could be distributed to a narrower range of disciplines on oil spill or marine pollution related fields, and/or to a greater number of participants. Moreover, additional criteria and scenarios could be considered and alternative multicriteria methods could be applied. Furthermore, the combined simultaneous consideration of all scenarios could be examined, in order to identify the optimum treatment approach or examine relevant combinations of treatment approaches. The criteria weights could be evaluated based on a more extensive body of experts. Finally, as part of the future research, the proposed model will be applied in real case studies and examine the effectiveness of a simulated application of the identified optimum treatment method. Limitations of the current research focus on the criteria weights and treatment approaches’ effectiveness, because these are evaluated by experts, bearing in mind the special conditions of Greece.
Conclusively, marine pollution created by oil spills is eminent and requires immediate action. Local authorities must obey the relevant legislation and provide the proper equipment and mitigation plans to deal with the containment of the spills. The needs and requirements for taking measures against pollution vary according to the nature and utilization of each site under consideration. Lack of pollution detection due to extreme weather conditions leads to unpleasant consequences. This study verifies that the allocation of oil spill combating stations, in the form of containers, where the necessary booms, pumps and dispersants are stored, to be transported to the oil spill accident site by special vessels and well-trained crews, in the least time, is an effective approach. Among other tools are the oil spill transport models that can predict the fate and evolution of an oil spill and provide useful information to the authorities in order to apply the abovementioned measures. These tools could be evaluated in another similar analysis.


