Frequency Analysis of Storm-Surge-Induced Flooding for the Huangpu River in Shanghai, China


Abstract
:1. Introduction
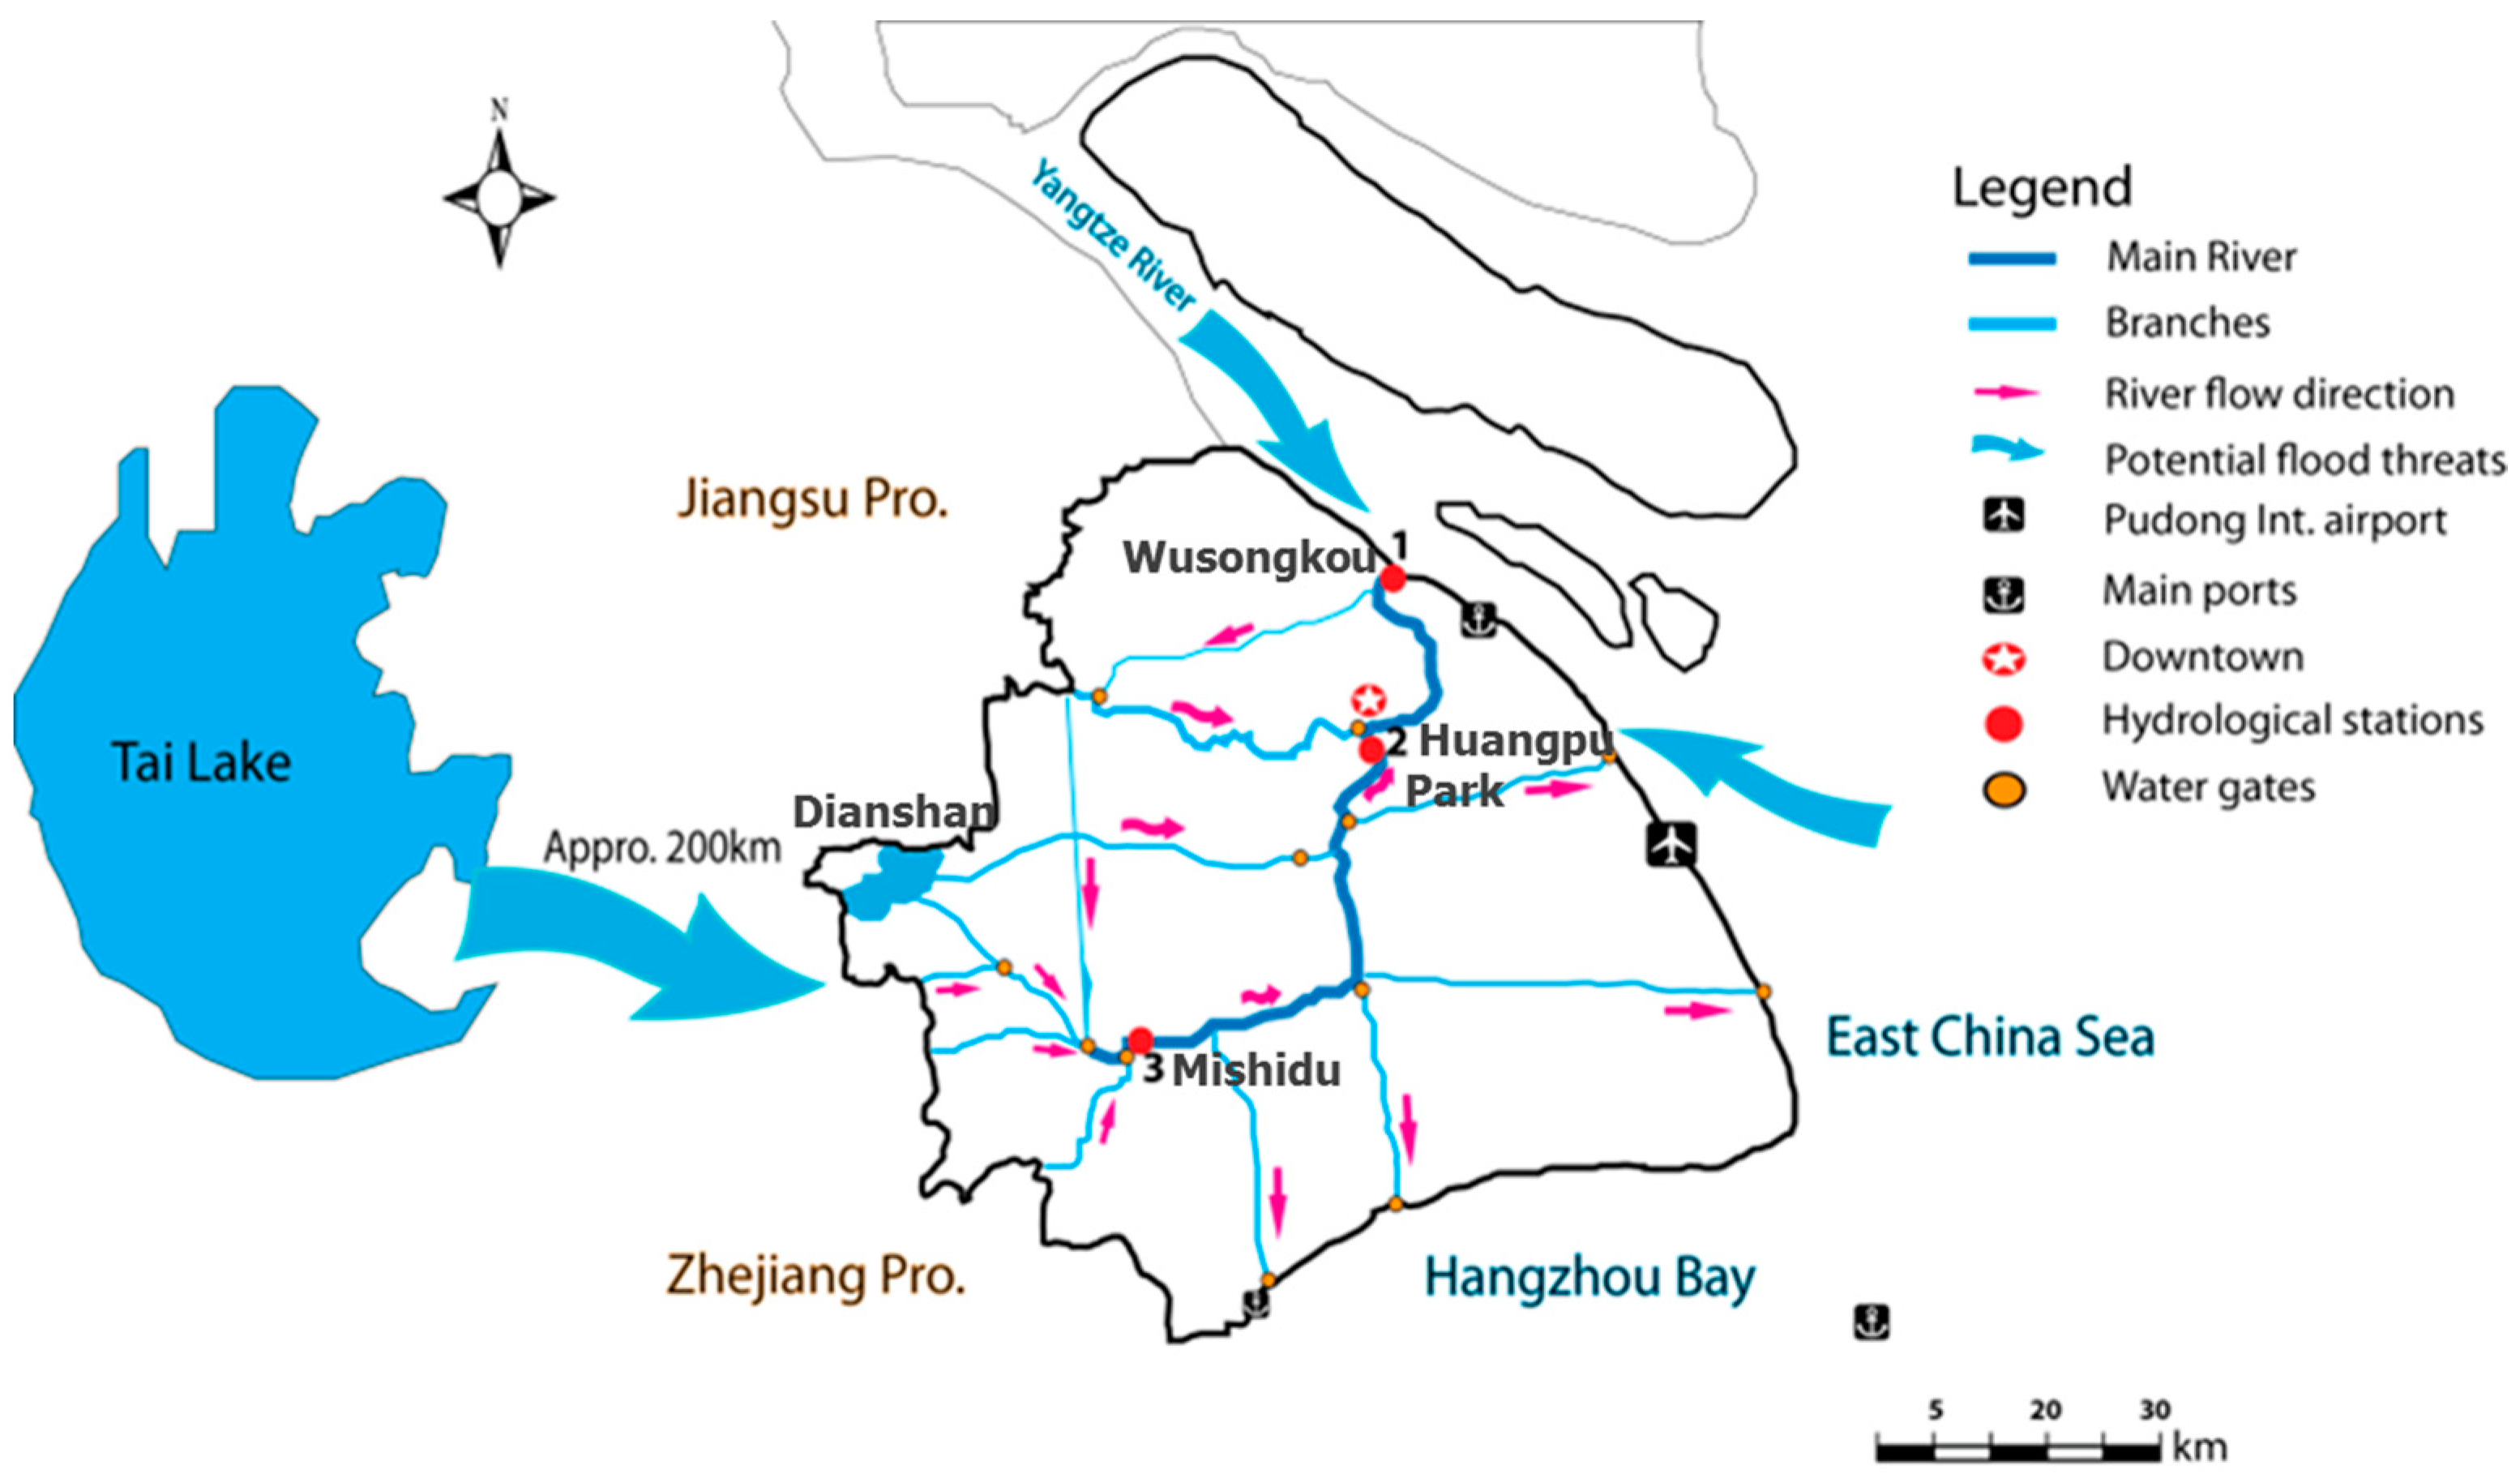
2. Study Area
3. Methods
3.1. Data
3.2. Statistical Methods
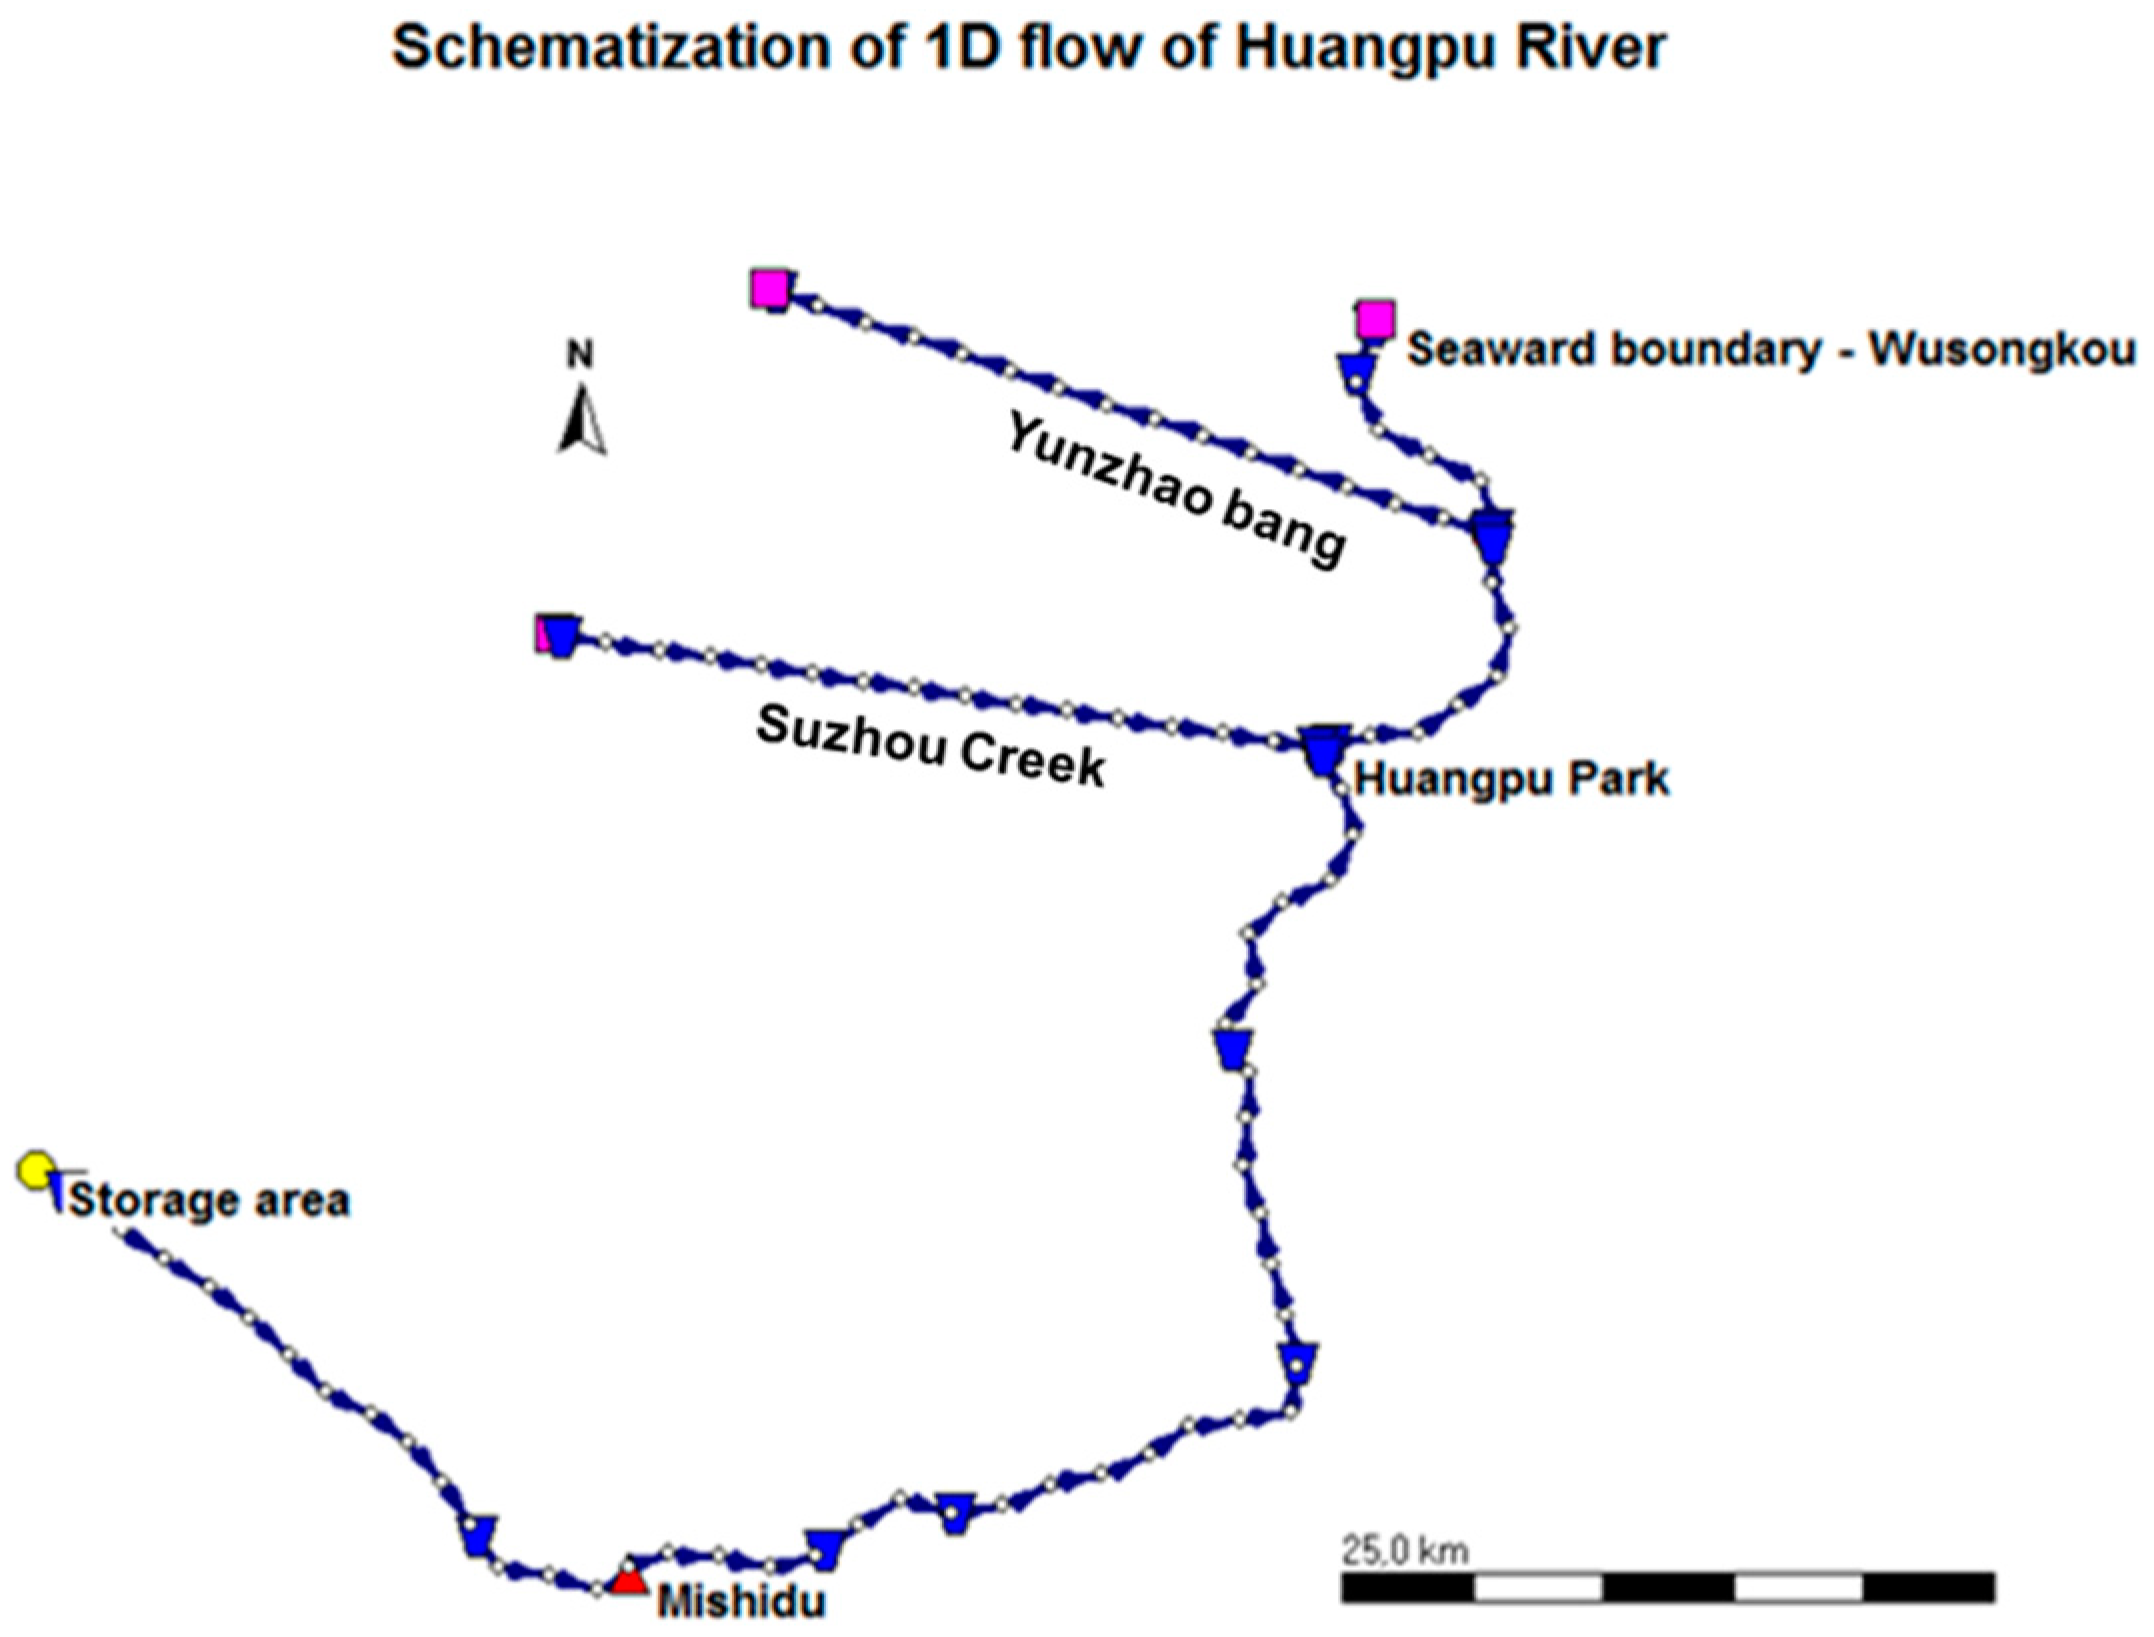
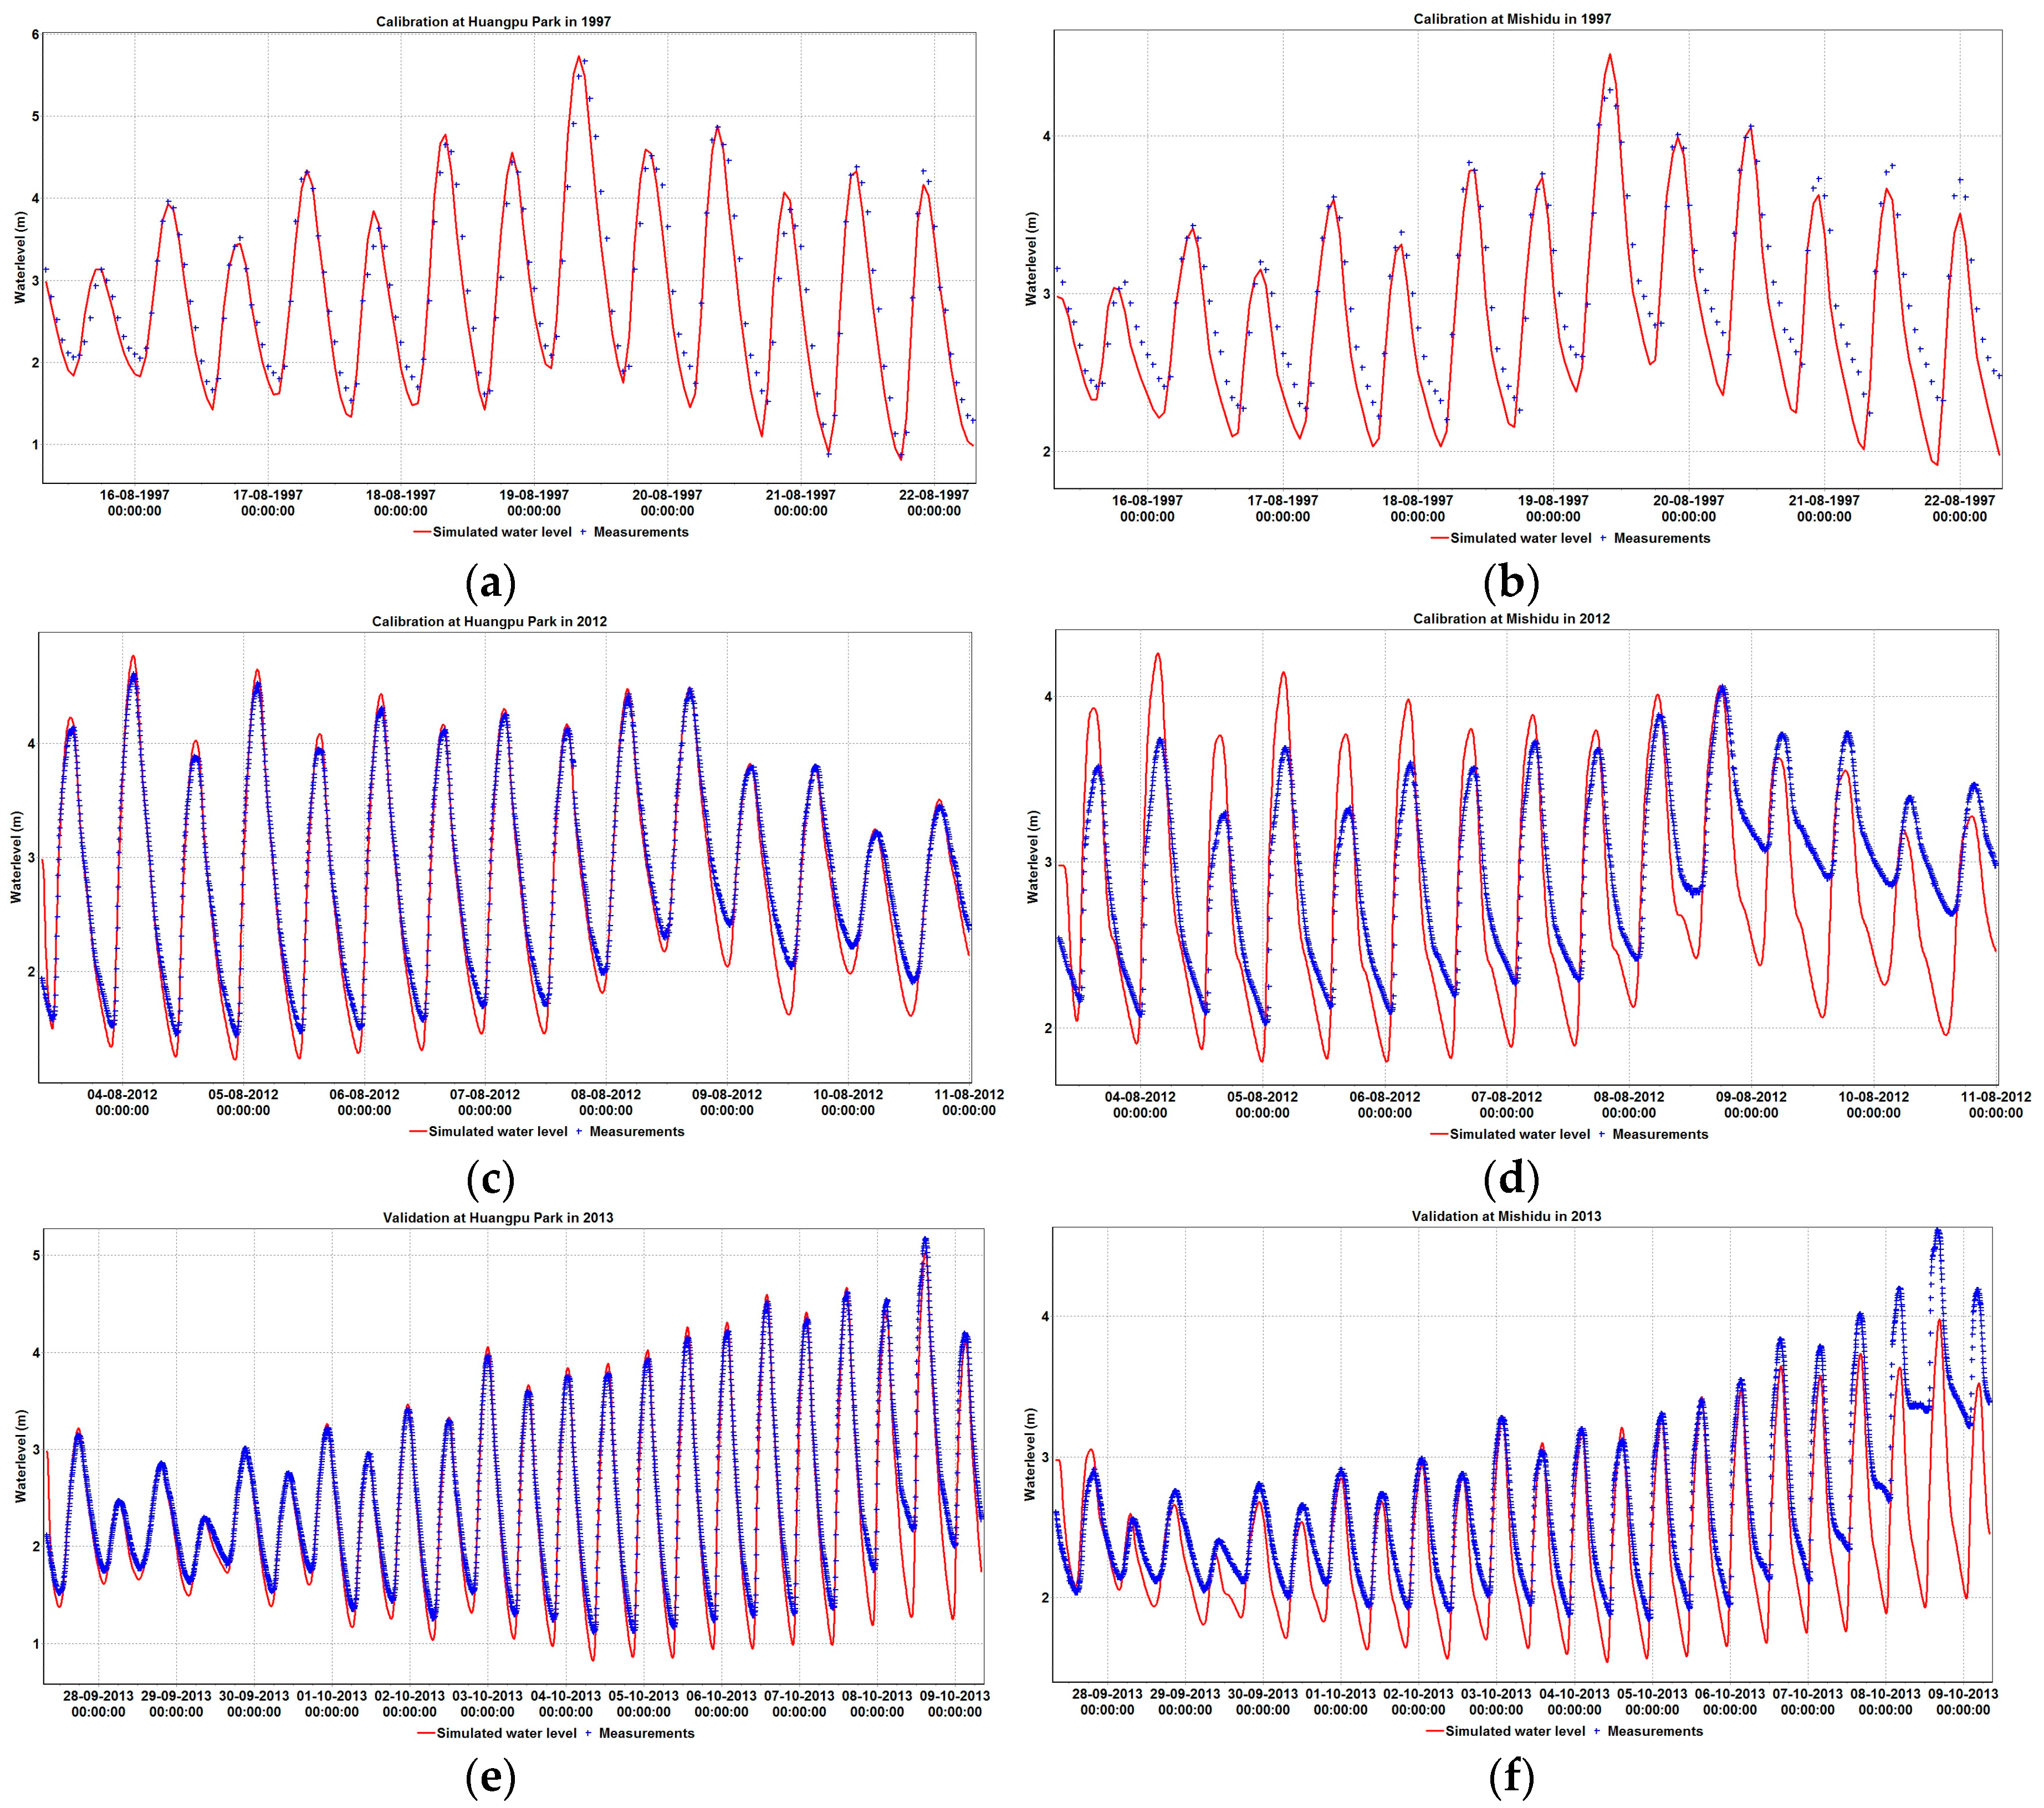
3.3. Hydraulic Model
- Seaward boundary (Wusongkou): time series of measured water levels, which represents the effects of storm surge and tide fluctuation.
- Boundary at Suzhou creek and Yunzhao bang: they are narrow (average width 58.6 m) and shallow (average depth 3.4 m) rivers with an annual average discharge of 10–30 m3/s each [29]; the discharge is not significant and mainly depends on the downstream tide level. Hence, a constant discharge of 20 m3/s for each river is assumed.
- Storage area: Dianshan Lake, with an area of 62 km2, is the biggest lake in Shanghai. In the SOBEK 1D model, the storage area was set as 1.5 times the area of Dianshan Lake, which represents the additional storage area of related creeks and canals in the inland reach of the Huangpu River. This boundary condition enables a realistic simulation of the tides and storm surge response in the upper reaches of the model domain, but does not account for precipitation-driven river discharge associated with a storm event. A sensitivity analysis (see Appendix C) shows that a 50% change of the size of the storage area does not largely affect water levels in the Huangpu River (only a few centimeters at most) at Wusongkou and Mishidu.
4. Results
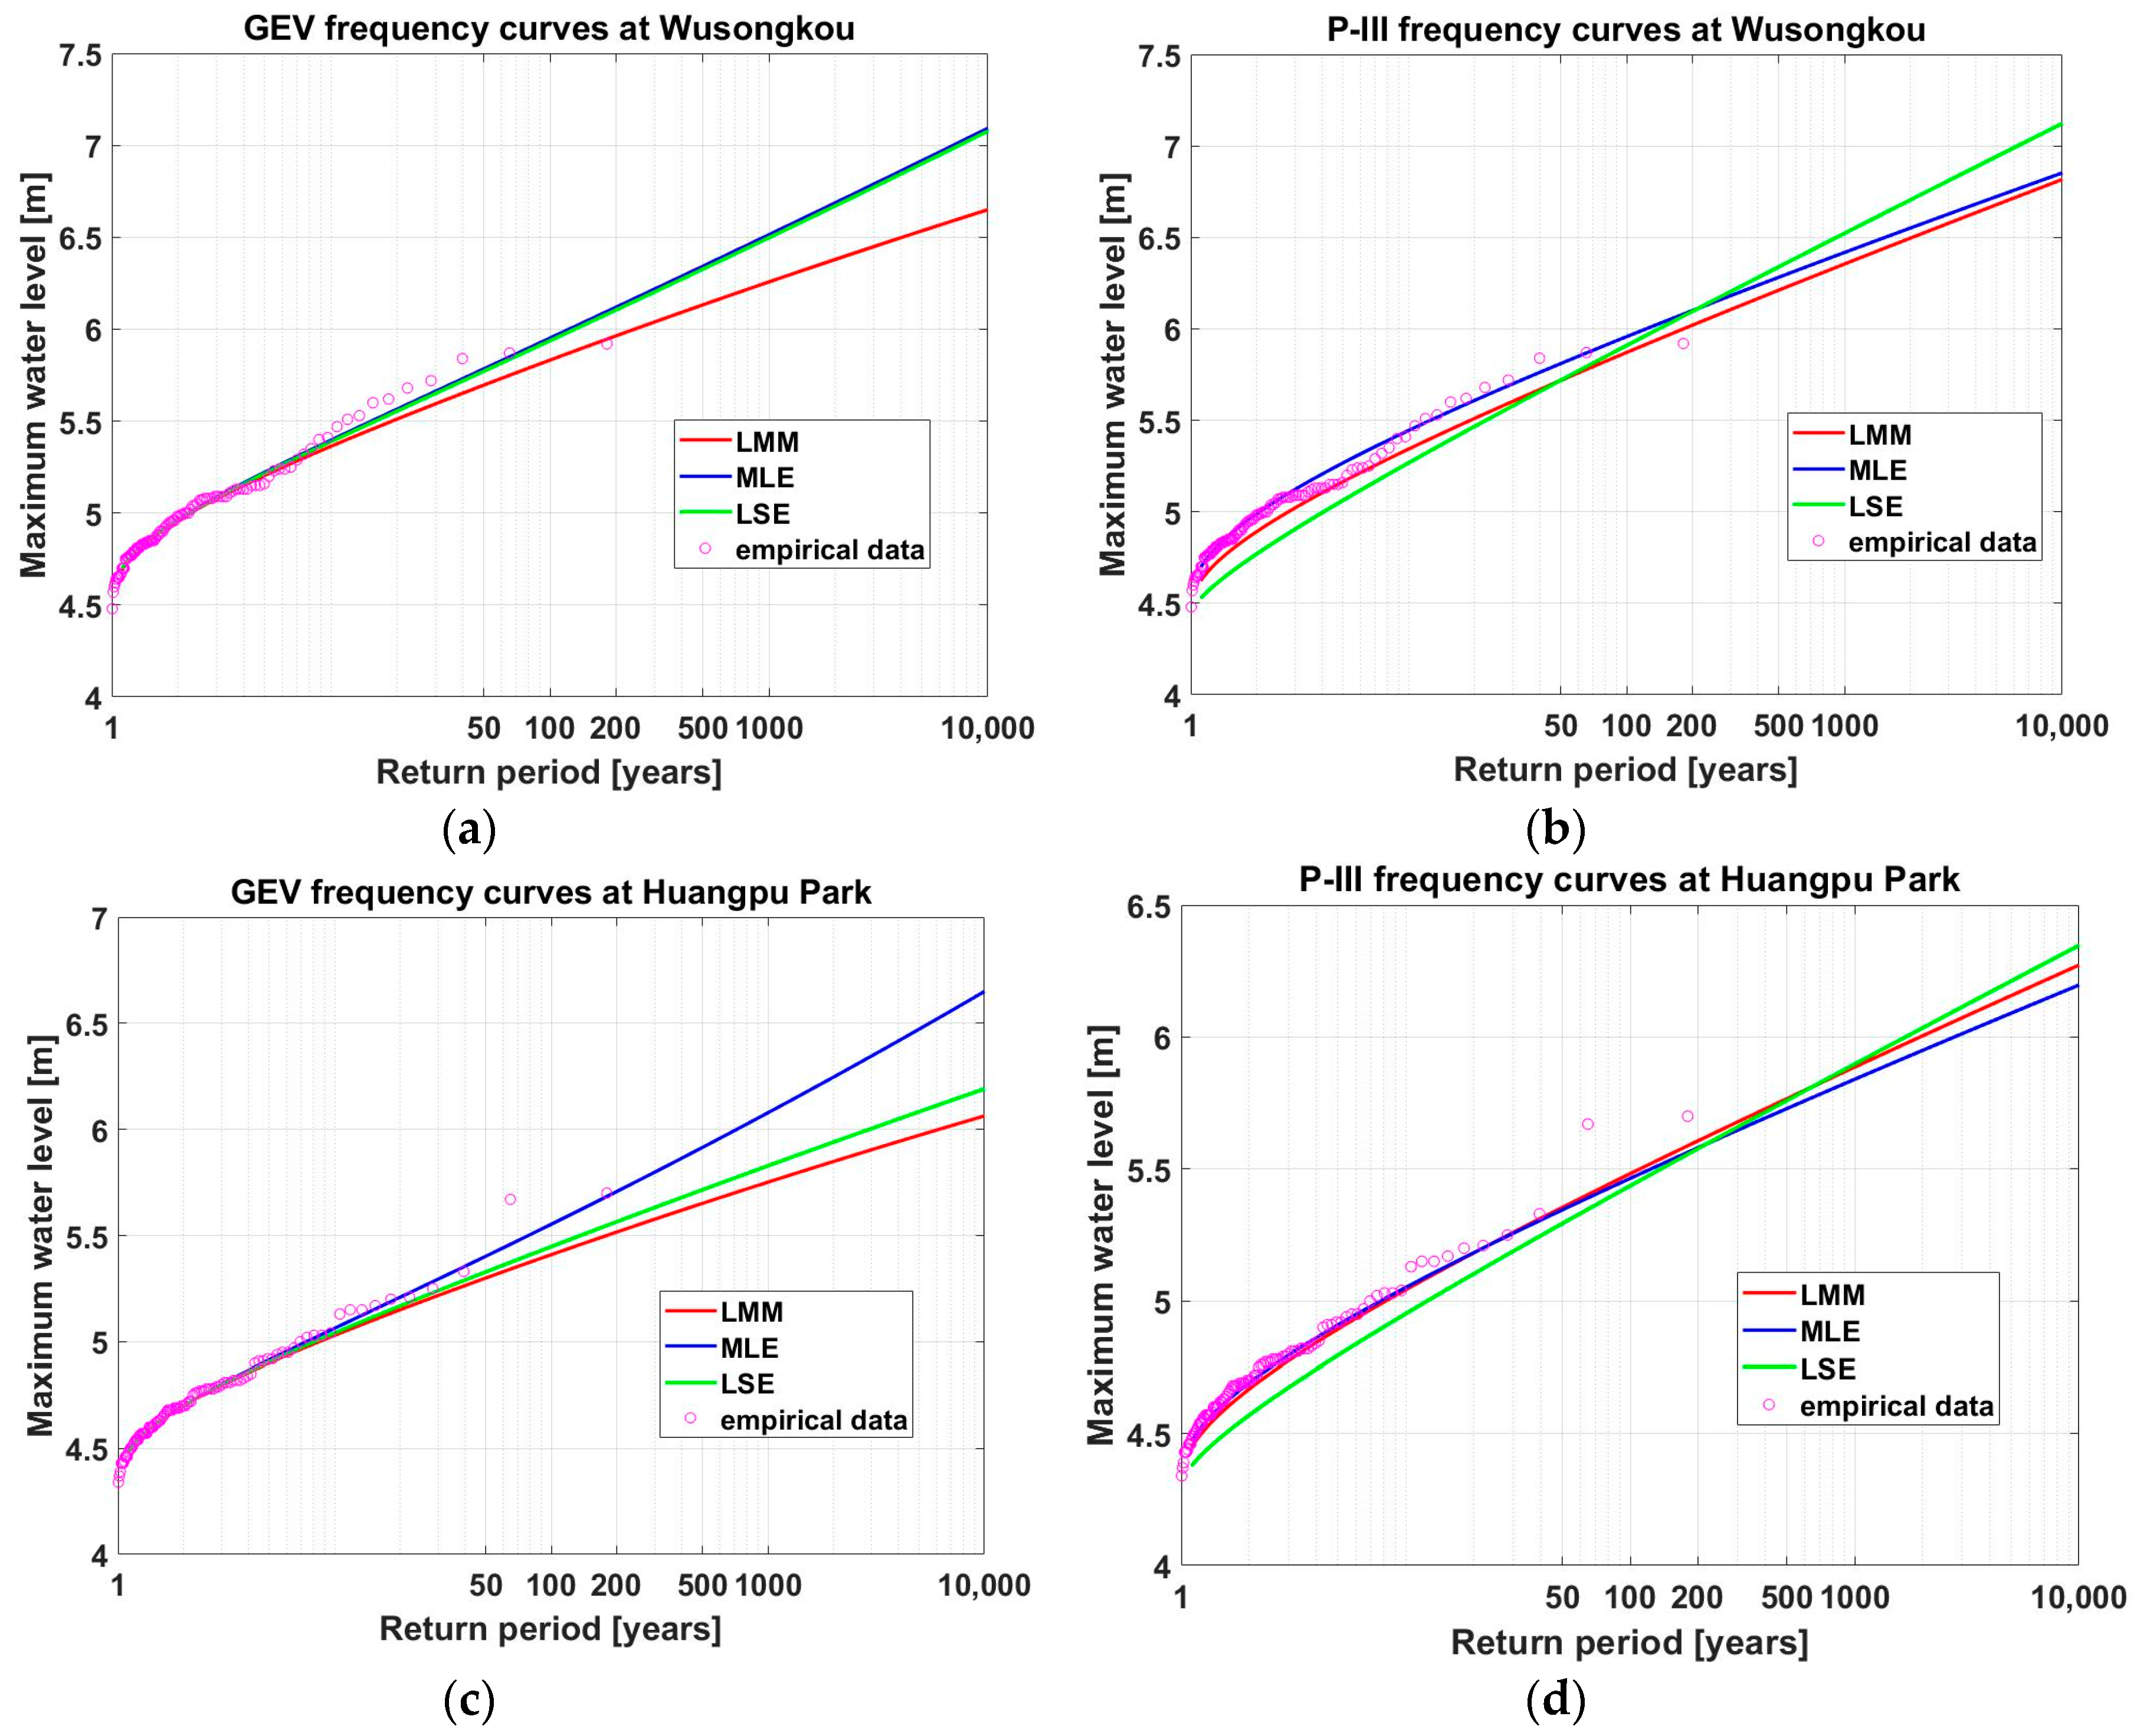
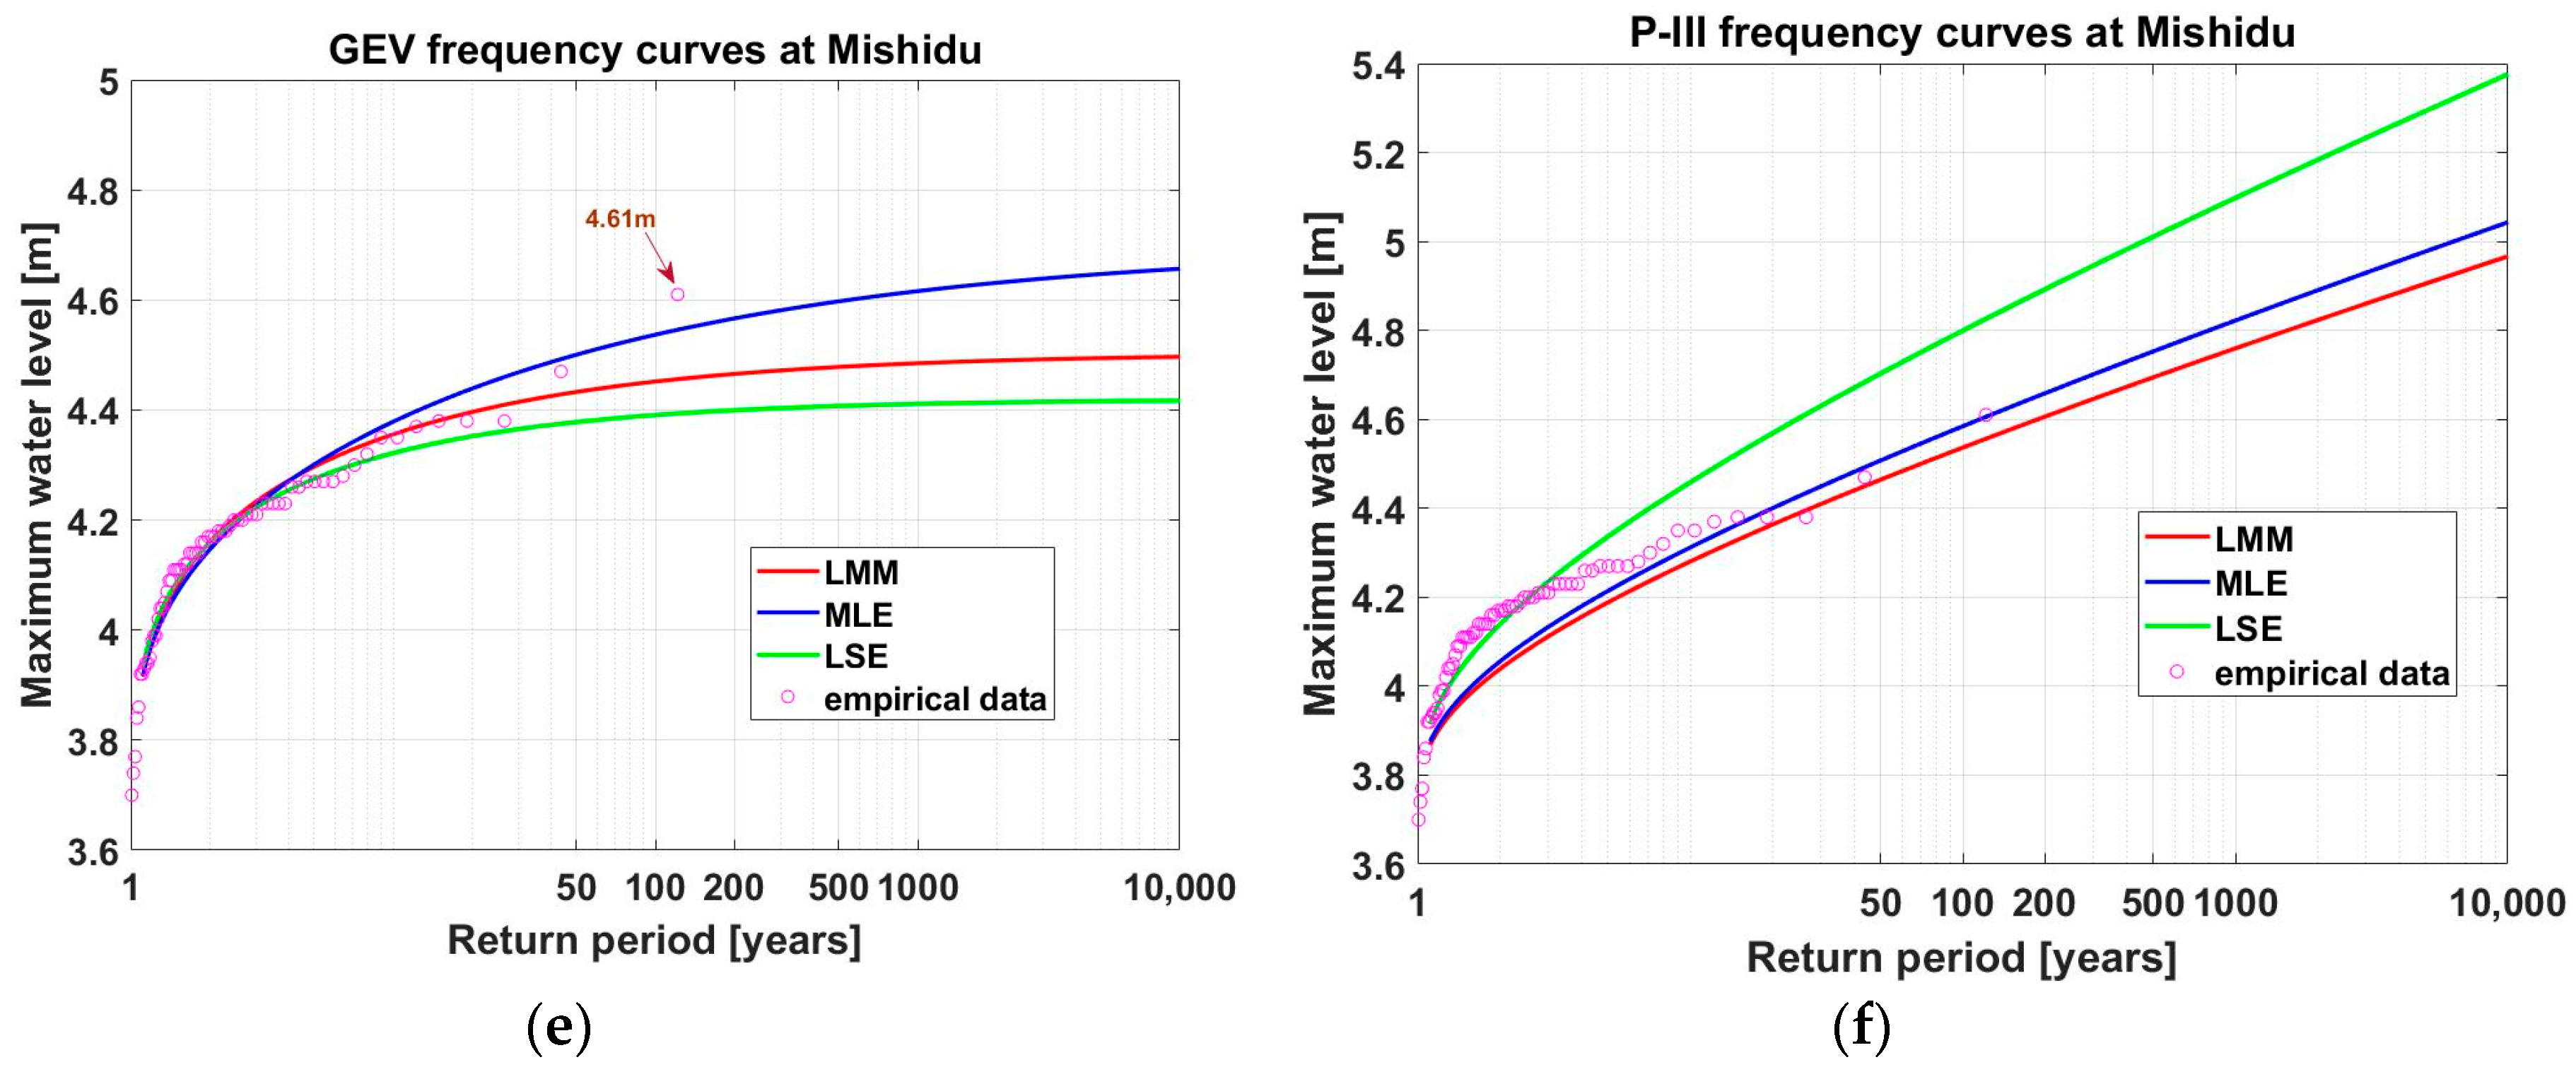
4.1. Comparison of Distributions
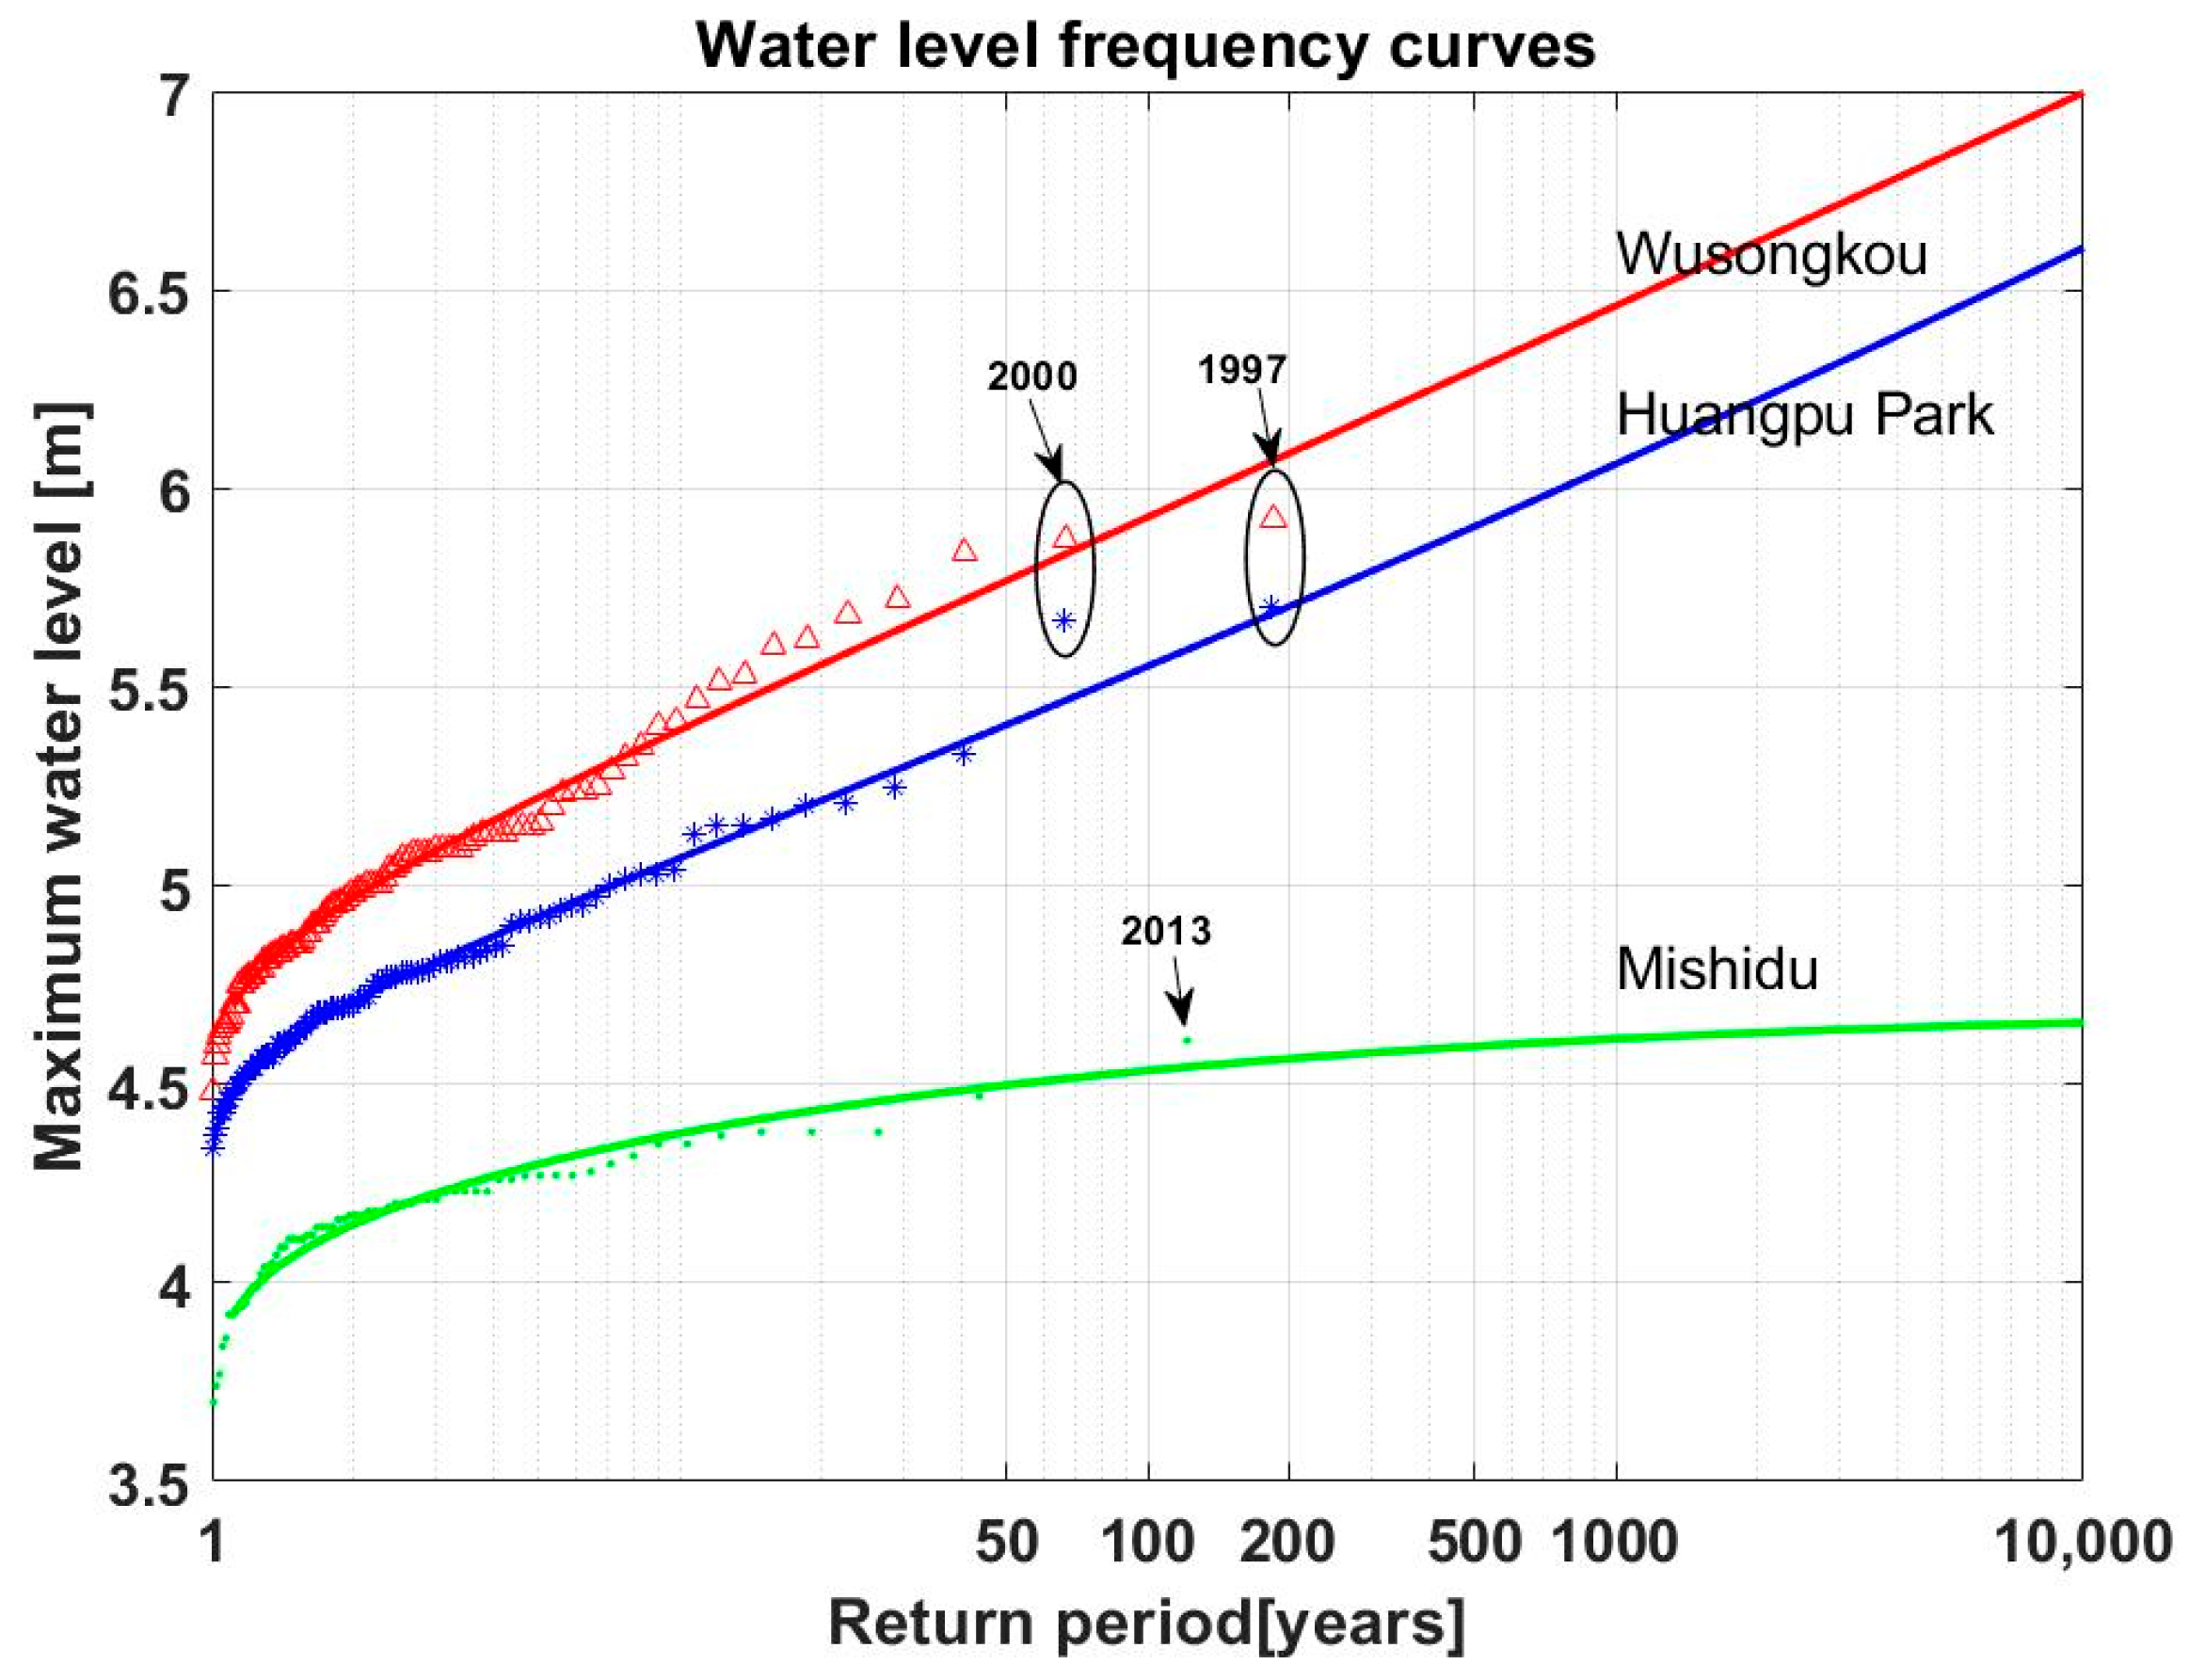
4.2. Water-Level Frequency Curves
4.3. Protection Levels of Floodwall
5. Discussion
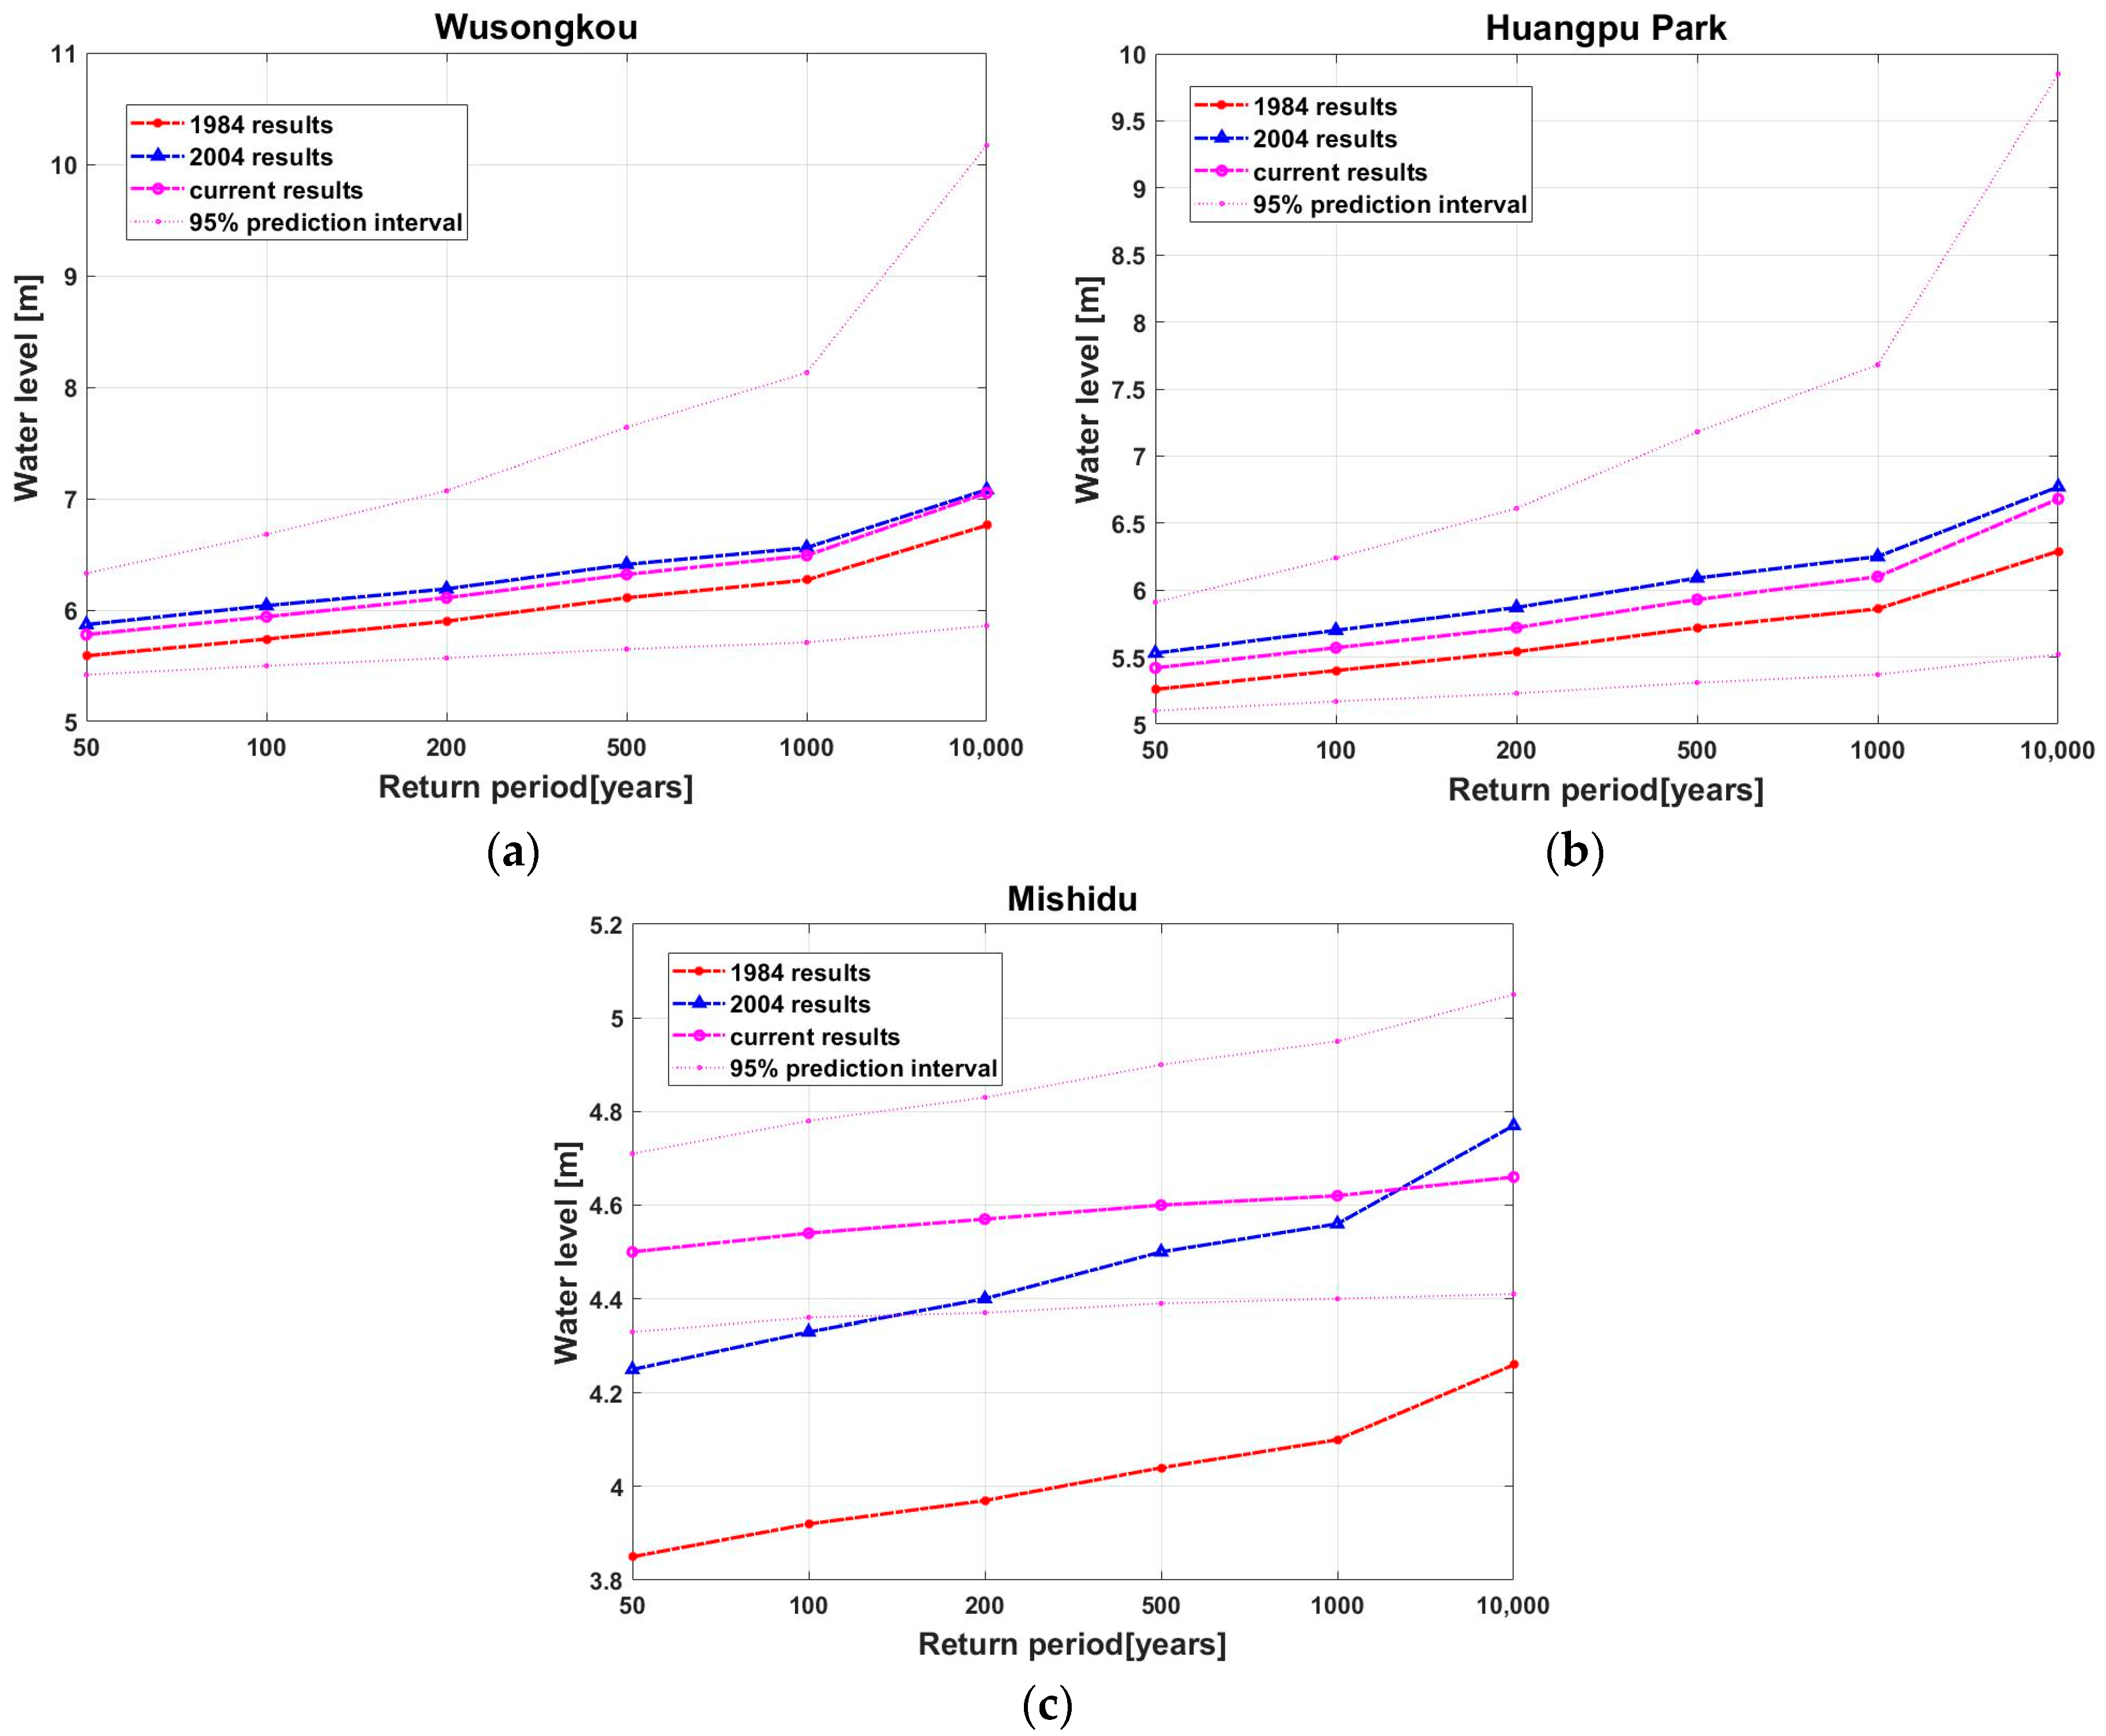
5.1. Comparison of the Historical Frequency Curves
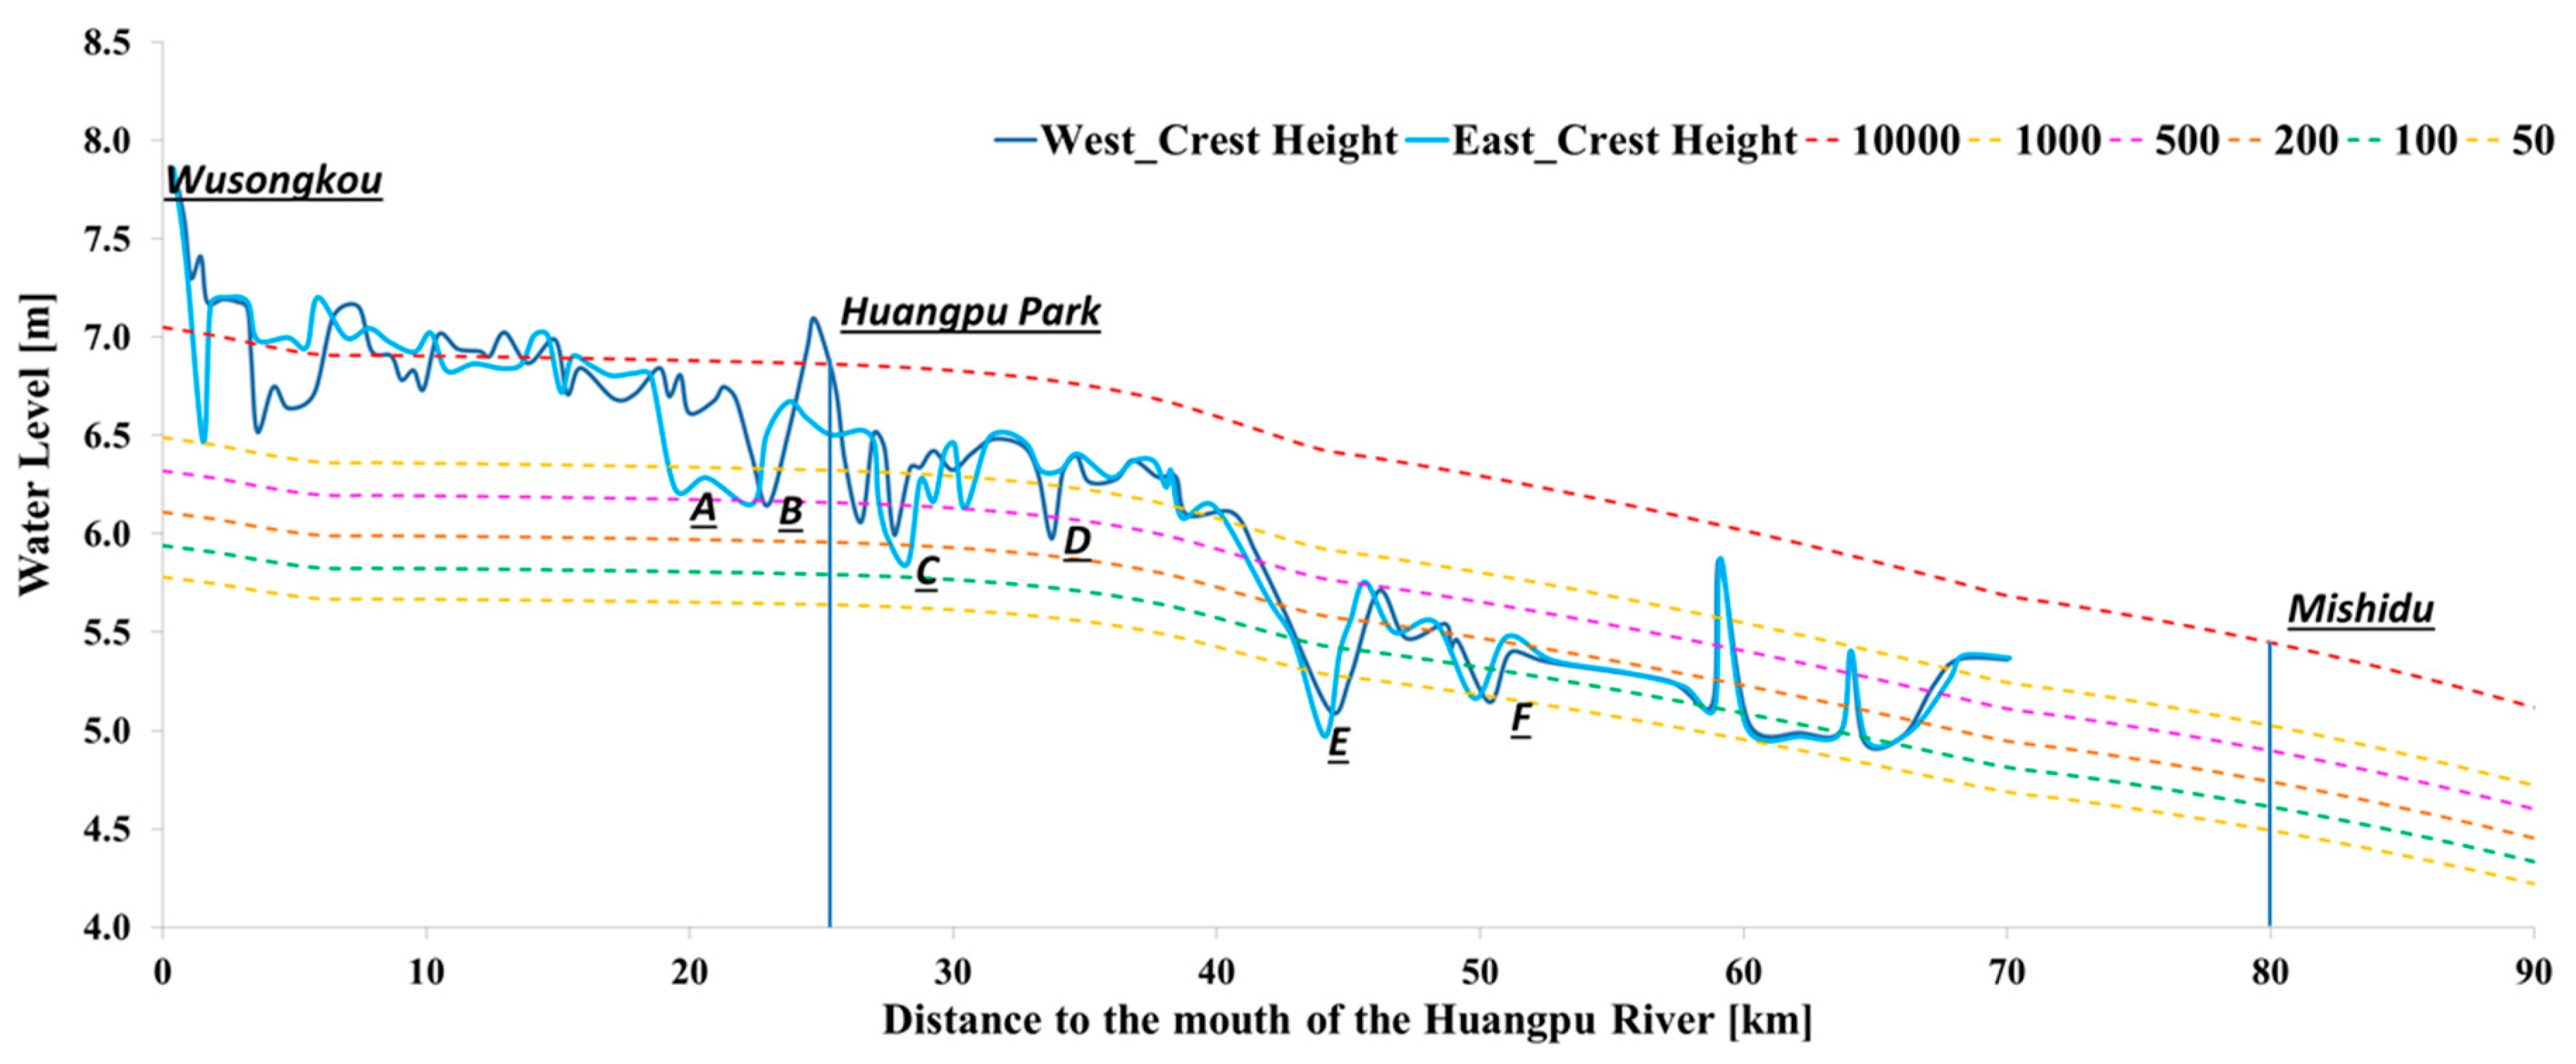
5.2. Water Level at Each Cross Section along the Huangpu River
6. Conclusions and Recommendations
- The flood frequency analysis showed that the GEV distribution provides the best characterization of flood frequencies for datasets at three hydrological locations of the Huangpu River.
- The derived water level frequency curves at Wusongkou and Huangpu Park were in line with the previous results of the 2004, but significantly higher than the results of a study from 1984—which still forms the basis for the design of floodwalls. A comparison of flood frequencies due to combined tides and storm surge with a floodwall elevation dataset shows that the weakest sections are expected to have a flood frequency higher than 1/50 per year, which is far higher than the safety standard of 1/1000 per year. Several other locations are also expected to have overflow/overtopping frequencies higher than the safety standard.
- In addition, it is also found that the current design water levels correspond to the exceedance probabilities of 1/500 per year in the near-sea and middle reaches, and no more than 1/50 per year in the inland area of the Huangpu River. Since this study neglects rainfall, the actual protection offered by floodwalls in the inland area of the river might be even weaker than the values determined here.
Author Contributions
Funding
Acknowledgments
Conflicts of Interest
Appendix A. Probability Distribution Functions
Appendix B. Statistical Performance Indicators
Appendix B.1. Chi-Square Test
Appendix B.2. K-S Test
Appendix B.3. MSD (Mean-Square Deviation)
Appendix C. Sensitivity Analysis of the Storage Area in the 1D Model

| Year | Station | Storage Area | Storage Area | ||
|---|---|---|---|---|---|
| 62 km2 | 91 km2 | 91 km2 | 124 km2 | ||
| RMSE [cm] | RMSE [cm] | ||||
| 1997 | Huangpu Park | 0.4 | 0.28 | ||
| Mishidu | 3.2 | 1.9 | |||
| 2012 | Huangpu Park | 0.7 | 0.4 | ||
| Mishidu | 2.7 | 1.5 | |||
| 2013 | Huangpu Park | 0.4 | 0.3 | ||
| Mishidu | 3.2 | 2.4 | |||
References
- Small, C.; Nicholls, R.J. A global analysis of human settlement in coastal zones. J. Coast. Res. 2003, 19, 584–599. [Google Scholar]
- Nicholls, R.J.; Hanson, S.; Herweijer, C.; Patmore, N.; Hallegatte, S.; Corfee-Morlot, J.; Chateau, J. Muir-Wood, Ranking of the World’s Cities Most Exposed to Coastal Flooding Today and in the Future—Executive Summary; OECD Project; OECD Publishing: Paris, France, 2007. [Google Scholar]
- Nicholls, R.J.; Hanson, S.; Herweijer, C.; Patmore, N.; Hallegatte, S.; Corfee-Morlot, J.; Chateau, J.; Muir-Wood, R.; Classification, J. Ranking Port Cities with High Exposure and Vulnerability to Climate Extremes: Exposure Estimates; OECD Environment Working Papers No.1; OECD Publishing: Paris, France, 2007. [Google Scholar]
- Hallegate, S.; Green, C.; Nicholls, R.J.; Corfee-Morlot, J. Future flood losses in major coastal cities. Nat. Clim. Chang. 2013, 3, 802–806. [Google Scholar] [CrossRef]
- Gong, S. Impact of land subsidence on urban flood defence of Shanghai city. Yangtze River 2008, 39, 1–4. (In Chinese) [Google Scholar]
- Shen, H.; Wei, Z.; Wu, J.; Cheng, W.; Zou, D. Subsidence features of Huangpu River floodwall and the analysis on its effects on flood control ability. Shanghai Geol. 2005, 4, 21–24. (In Chinese) [Google Scholar]
- Jia, R.H. Water level frequency analysis for the main hydrological stations in the Huangpu River. Shanghai Hydraul. Eng. 1984, 1, 1–10. (In Chinese) [Google Scholar]
- Hohai University. Tide Analysis for the Huangpu River; Hohai University: Nanjing, China, 2004. (In Chinese) [Google Scholar]
- Xu, S.; Huang, W. Estimating extreme water levels with long-term data by GEV distribution at Wusong station near Shanghai city in Yangtze Estuary. Ocean Eng. 2011, 38, 468–478. [Google Scholar] [CrossRef]
- SWA—Shanghai Water Authority. Public Report of Water Resources Information for Shanghai. 2013. Available online: http://222.66.79.122/BMXX/default.htm?GroupName=%CB%AE%D7%CA%D4%B4%B9%AB%B1%A8 (accessed on 3 February 2014). (In Chinese).
- Li, N.; Wang, J.; Wang, Y.Y. Flood Risk Mapping of Pudong Distrcit in Shanghai City; China Institute of Water Resources and Hydropower Research: Beijing, China, 2011. (In Chinese) [Google Scholar]
- Li, R. Floodwall Breach along the Huangpu River in Shanghai Suburb. 2013. Available online: http://news.xinhuanet.com/local/2013-10/08/c_117625658.htm (accessed on 9 October 2013). (In Chinese).
- Liu, X.L. Shanghai Laishi Lost 60 Million RMB during Typhoon Fitow. 2013. Available online: http://stock.sohu.com/20131011/n387995427.shtml (accessed on 11 October 2013). (In Chinese).
- NetEase. Fitow Led to 60 Million RMB Loss for Agriculture in Shanghai. 2013. Available online: http://news.163.com/13/1021/04/9BMBP3JB00014AEE.html (accessed on 21 October 2013). (In Chinese).
- Hohai University. Shanghai City Huangpu River Final Report on Flood Protection and Water Level Analysis, Huangpu River Storm Surge Barrier Study Volume 1; Hohai University: Nanjing, China, 2001. (In Chinese) [Google Scholar]
- NERC—Natural Environment Research Council. Flood Studies Reports; Natural Environmental Research Council: London, UK, 1975. [Google Scholar]
- WRC—Water Resources Council. Guidelines for Determining Floods Flow Frequency; Bulletin 17B of the Hydrology Subcommittee; Water Resources Council: Washington, DC, USA, 1981.
- MWR—Ministry of Water Resources. Standard Methods for Flood Quantile Estimation Procedure; SDJ 22-79; Water Resources Publishing House: Beijing, China, 1980. (In Chinese) [Google Scholar]
- MWR—Ministry of Water Resources. Regulation for Hydrological Computation of Water Resources and Hydropower Project; SL278-2002; The Ministry of Water Resources of the People’s Republic of China: Beijing, China, 2002. (In Chinese)
- Singh, V.P. Methods of Parameter Estimation. In Entropy-Based Parameter Estimation in Hydrology; Water Science and Technology Library; Springer: Dordrecht, The Netherlands, 1998; Volume 30, pp. 12–44. [Google Scholar]
- Myung, J. Tutorial on maximum likelihood estimation. J. Math. Psychol. 2003, 47, 90–100. [Google Scholar] [CrossRef]
- Hosking, J.R.M. L-moments: Analysis and Estimation of Distribution using Linear Combinations of Order Statistics. J. R. Stat. Soc. Ser. 1990, 52, 105–124. [Google Scholar]
- Di Salvo, F.; Ruggieri, M.; Plaia, A.; Agro, G. EOFs for gap filling in multivariate air quality data: A FDA approach. In Proceedings of the 19th International Conference on Computational Statistics, Paris, France, 22–27 August 2010. [Google Scholar]
- Yang, H.; Wu, Z.; Liu, S.; Sun, H. Research on Optimal Sensor Placement Based on Reverberation Matrix for Structural Health Monitoring. Int. J. Distrib. Sens. Netw. 2012, 8, 1–7. [Google Scholar] [CrossRef]
- Van Gelder, P.H.A.J.M. Statistical Methods for the Risk-Based Design of Civil Structures. Ph.D. Thesis, Dept of Hydraulic Engineering, TU Delft, Delft, The Netherlands, 2000. [Google Scholar]
- Gailmard, S. Statistical Modeling and Inference for Social Science; Cambridge University Press: Cambridge, UK, 2014; ISBN 978-1-107-00314-9. [Google Scholar]
- Chicheportiche, R.; Bouchaud, J.-P. Weighted Kolmogorov-Smirnov test: Accounting for the tails. Phys. Rev. 2012, 86, 1115. [Google Scholar] [CrossRef] [PubMed]
- Deltares, SOBEK—User Manual. Hydrodynamics, Rainfall Runoff and Real Time Control; Deltares: Delft, The Netherlands, 2015. [Google Scholar]
- Cui, Y.; Wu, Y.; Shao, L.; Zhang, G. Seasonal variations of organic matter and nutrients in Suzhou river and Huangpu River and its environmental effect. Environ. Chem. 2011, 30, 645–651. (In Chinese) [Google Scholar]
- Jongejan, R.B.; Maaskant, B. Quantifying flood risks in The Netherlands. Risk Anal. 2015, 35, 252–264. [Google Scholar] [CrossRef] [PubMed]
- Jonkman, S.N.; Vrijling, J.K.; Kok, M. Flood risk assessment in The Netherlands: A case study for dike ring South Holland. Risk Anal. 2008, 28, 1357–1373. [Google Scholar] [CrossRef] [PubMed]
- Snedecor, G.W.; Cochran, W.G. Statistical Methods, 8th ed.; Iowa State University Press: Ames, IA, USA, 1989. [Google Scholar]
- Dagnelie, P. A propos de l’emploi du test de Kolmgorov-Smirnov comme test de de normalite. Biom. Praxim. 1968, 1, 3–13. [Google Scholar]
- Molin, P.; Abdi, H. New Table and Numerical Approximations for Kolmogorov-Smirnov/Lilliefors/van Soest Normality Test; Technical Report; University of Texas at Dallas: Dallas, TX, USA, 1998. [Google Scholar]


| Water Level/Crest Height | Hydrological Station | ||
|---|---|---|---|
| Wusongkou | Huangpu Park | Mishidu | |
| Current height of flood wall [m] | 7.3 | 6.9 | 4.7 |
| Design water level [m] | 6.27 | 5.86 | 4.1 |
| Highest water level ever-recorded [m] | 5.99 | 5.72 | 4.61 |
| Warning level [m] | 4.8 | 4.55 | 3.5 |
| Hydrological Station | Observation Periods [Year] | Length [Years] | Distance to the Mouth of the River [km] |
|---|---|---|---|
| Wusongkou (1) | 1912–2013 | 102 | 0 |
| Huangpu Park (2) | 1913–2013 | 101 | 25.6 |
| Mishidu (3) | 1948–2013 | 66 | 79.8 |
| Probability Distribution | GEV | P-III | Critical Value | ||||||
|---|---|---|---|---|---|---|---|---|---|
| Stations | Methods | χ2 | K-S | MSD | χ2 | K-S | MSD | Chi-Square Test | K-S Test |
| Wusongkou | LMM | 7.66 | 0.0553 | 0.0438 | 16.74 | 0.15 | 4.5073 | 7.8 | |
| MLE | 6.45 | 0.0527 | 0.0345 | 7.28 | 0.092 | 4.4158 | 0.0873 | ||
| LSE | 6.43 | 0.0493 | 0.0354 | 59.08 | 0.34 | 4.6079 | |||
| Huangpu Park | LMM | 1.59 | 0.0525 | 0.0454 | 4.4 | 0.1120 | 4.3345 | 7.8 | |
| MLE | 1.36 | 0.0506 | 0.0257 | 1.69 | 0.0709 | 4.3156 | 0.0877 | ||
| LSE | 1.54 | 0.0502 | 0.0387 | 34.87 | 0.2816 | 4.4223 | |||
| Mishidu | LMM | 3.36 | 0.08 | 0.0276 | 34.13 | 0.3567 | 3.7325 | 5.99 | |
| MLE | 5.12 | 0.1106 | 0.0304 | 25.20 | 0.3147 | 3.7141 | 0.108 | ||
| LSE | 1.81 | 0.0705 | 0.0356 | 14.33 | 0.1366 | 3.6246 | |||
| Water level [m] | Hydrological Station | No. | Parameters in GEV | Return Period [Years] | |||||||
| k | σ | μ | 50 | 100 | 200 | 500 | 1000 | 10,000 | |||
| Wusongkou | Lower bound | −0.1327 | 0.1930 | 4.8340 | 5.42 | 5.50 | 5.57 | 5.65 | 5.71 | 5.86 | |
| Mean | 0.0083 | 0.2260 | 4.8833 | 5.78 | 5.94 | 6.11 | 6.32 | 6.49 | 7.05 | ||
| Upper bound | 0.1493 | 0.2646 | 4.9325 | 6.33 | 6.68 | 7.07 | 7.64 | 8.13 | 10.17 | ||
| Huangpu Park | Lower bound | −0.1062 | 0.1579 | 4.5946 | 5.10 | 5.17 | 5.23 | 5.31 | 5.37 | 5.52 | |
| Mean | 0.0374 | 0.1856 | 4.6354 | 5.42 | 5.57 | 5.72 | 5.93 | 6.10 | 6.68 | ||
| Upper bound | 0.1810 | 0.2181 | 4.6761 | 5.91 | 6.24 | 6.61 | 7.18 | 7.68 | 9.85 | ||
| Mishidu | Lower bound | −0.3885 | 0.1495 | 4.0384 | 4.33 | 4.36 | 4.37 | 4.39 | 4.40 | 4.41 | |
| Mean | −0.2891 | 0.1778 | 4.0845 | 4.50 | 4.54 | 4.57 | 4.60 | 4.62 | 4.66 | ||
| Upper bound | −0.1896 | 0.2116 | 4.1307 | 4.71 | 4.78 | 4.83 | 4.9 | 4.95 | 5.05 | ||
© 2018 by the authors. Licensee MDPI, Basel, Switzerland. This article is an open access article distributed under the terms and conditions of the Creative Commons Attribution (CC BY) license (http://creativecommons.org/licenses/by/4.0/).
Share and Cite
Ke, Q.; Jonkman, S.N.; Van Gelder, P.H.A.J.M.; Bricker, J.D. Frequency Analysis of Storm-Surge-Induced Flooding for the Huangpu River in Shanghai, China. J. Mar. Sci. Eng. 2018, 6, 70. https://doi.org/10.3390/jmse6020070
Ke Q, Jonkman SN, Van Gelder PHAJM, Bricker JD. Frequency Analysis of Storm-Surge-Induced Flooding for the Huangpu River in Shanghai, China. Journal of Marine Science and Engineering. 2018; 6(2):70. https://doi.org/10.3390/jmse6020070
Chicago/Turabian StyleKe, Qian, Sebastiaan N. Jonkman, Pieter H. A. J. M. Van Gelder, and Jeremy D. Bricker. 2018. "Frequency Analysis of Storm-Surge-Induced Flooding for the Huangpu River in Shanghai, China" Journal of Marine Science and Engineering 6, no. 2: 70. https://doi.org/10.3390/jmse6020070
APA StyleKe, Q., Jonkman, S. N., Van Gelder, P. H. A. J. M., & Bricker, J. D. (2018). Frequency Analysis of Storm-Surge-Induced Flooding for the Huangpu River in Shanghai, China. Journal of Marine Science and Engineering, 6(2), 70. https://doi.org/10.3390/jmse6020070