Article

Development Efficiency Assessment of Challenging Hydrates Under Reservoir Fracturing and Thermal Stimulation Using an XGBoost-SHAP Framework


1
College of Artificial Intelligence, China University of Petroleum (Beijing), Beijing 102249, China
2
School of Rail Transit, Chengdu Vocational & Technical College of Industry, Chengdu 610218, China
3
College of Construction Engineering, Jilin University, Changchun 130026, China
*
Author to whom correspondence should be addressed.
J. Mar. Sci. Eng. 2026, 14(9), 778; https://doi.org/10.3390/jmse14090778
Submission received: 30 March 2026 / Revised: 19 April 2026 / Accepted: 21 April 2026 / Published: 24 April 2026
(This article belongs to the Section Marine Energy)

Abstract

Reservoir fracturing combined with thermal stimulation is a highly promising strategy for the development of challenging hydrates. However, the synergistic influence mechanisms of multiple engineering parameters on productivity remain poorly understood. In this study, based on the geological condition of the SH2 site in the Shenhu Area of the South China Sea, a numerical model was built to investigate the development efficiency of challenging hydrates under fracturing and thermal co-stimulation. Using average gas production rates (m3/d) at recovery rates of 0.70 and 0.85 as assessment indicators, eXtreme Gradient Boosting (XGBoost) and SHapley Additive exPlanations (SHAP) algorithms were employed to quantitatively measure multivariable importance. The results indicated that enhancing the inter-well interaction through reservoir fracturing can increase development efficiency by 2 to 5 times; however, it is not the case that larger-scale fracturing is always preferable, as it can lead to more severe water flooding. Additionally, data-driven models revealed that fracture length (SHAP values of 15.55 and 9.19) was the primary factor influencing development efficiency, followed by the fracture conductivity (SHAP values of 6.65 and 6.32), whereas injection pressure (SHAP values of 2.90 and 2.17), injection temperature (SHAP values of 2.41 and 2.13), and production pressure (SHAP values of 2.37 and 1.82) had relatively limited influences. Most importantly, the positive interaction effect between fracture length and fracture conductivity cannot be ignored. In our simulation, the recommended fracture length and conductivity were 40 m and 100 D·cm, respectively. These findings provide important insights and guidance for implementing this novel co-stimulation method in challenging hydrates.

1. Introduction

Natural gas hydrate is a solid, ice-like crystalline substance formed when guest gas molecules—primarily methane—become trapped within hydrogen-bonded water cavities under low-temperature and high-pressure environments. In nature, methane hydrate (MH) is widely distributed in marine continental margin sediments and terrestrial permafrost regions. Owing to the enormous global reserves (containing 2.5–120 × 1015 STm3 of natural gas [1,2]) and clean combustion characteristics, MH has attracted considerable attention as a potential transitional energy source that could significantly contribute to future energy security and climate change mitigation.
Since the strategic importance of MH was recognized in the 1980s, a global boom in hydrate exploration and development has taken hold. Nevertheless, unique resource characteristics—such as deep-water drilling complexities, peculiar phase transitions, wellbore instability, multiphase flow, sand production, gas leakage, submarine slope failure, and low productivity—have severely limited its commercialization process [3,4,5]. Furthermore, the vast majority of deposits exhibit distinctive characteristics, including significant thermodynamic stability, low in situ temperatures, limited intrinsic permeability, and the absence of impermeable boundaries. These characteristics collectively define the category of so-called “challenging hydrates,” making extraction particularly challenging [6]. A representative case is the deposits in the Shenhu Area of the South China Sea, which consist of low-permeability bounded by permeable boundary layers, a configuration typical of this challenging category. Despite these unfavorable conditions, two recent pilot production trials conducted have demonstrated the technical feasibility of developing such challenging deposits, marking a notable advancement in the field [7,8].
The combination of depressurization and thermal stimulation (particularly those involving hot fluid injection) is widely regarded as a particularly promising hydrate extraction approach due to its capacity to supply the heat required for sustained hydrate dissociation [9,10,11,12]. Particularly, multi-well injection-production modes have demonstrated significant potential by improving mass and heat transfer efficiency, and have accordingly been suggested as a candidate strategy for commercial-scale hydrate development, notably in the Nankai Trough of Japan [13,14,15]. However, the direct transfer of this development mode to Shenhu hydrates may encounter significant obstacles. The fundamental difference lies in the fact that the permeability of sandy deposits in the Nankai Trough is 1 to 3 orders of magnitude higher than that of fine-grained silty deposits in the Shenhu Area. Such low permeability is extremely detrimental to inter-well mass and heat transfer. For instance, thermal stimulation effects are often confined to localized areas [16], and insufficient inter-well connectivity prevents the recovery of gas generated by hydrate thermal decomposition [13,17]. Furthermore, the absence of continuous impermeable boundaries leads to significant heat loss to adjacent formations, thereby reducing energy utilization efficiency [18]. Perhaps most critically, high injection pressures may drive gas upward, thereby elevating geo-environmental risks such as methane leakage [19,20,21]. Addressing these interrelated challenges is therefore essential for the application of injection-production modes in challenging hydrates.
Reservoir fracturing has been extensively employed as a key enabling technology for the development of low-permeability oil and gas resources. In light of its success in those applications, it has been proposed to enhance the recovery efficiency of challenging hydrates [22,23,24]. Although hydrate deposits are typically weakly consolidated and non-lithified, which presents considerable difficulties for fracturing operations—such as high initiation pressure, the need for high-viscosity fracturing fluids—a growing body of research, including our previous studies regarding fracability evaluation—has confirmed the feasibility of inducing fractures in such complex geomaterials [25,26,27,28,29]. Furthermore, the stimulation capability of the fractures has also been preliminarily demonstrated. Chen et al. [30] and Yang et al. [31] found that fractures can accelerate low-pressure propagation, reduce fluid flow resistance, thereby significantly improving both hydrate dissociation efficiency and gas production rates. Sun et al. [32] reported that horizontal fractures outperform vertical fractures in enhancing productivity. However, after 400 days of production, the stimulative effect diminishes due to insufficient reservoir sensible heat, a trend also observed by Guo et al. [33]. Li et al. [34] further proposed an optimal fracturing design featuring 4 to 6 horizontal fractures with a width of 5 cm, radius of 40 m, and permeability of 1 × 10⁻¹⁰ m2. Shen et al. [35] demonstrated that in permafrost-associated hydrate reservoirs, fracturing effectively mitigates the adverse effects of ice formation on gas production. Ju et al. [36] showed that fracturing enlarges the zone influenced by hot water injection, thereby promoting more extensive hydrate dissociation. Similarly, Zhong et al. [37,38], Ma et al. [39], and Nie et al. [40] reported that fracturing substantially enhances inter-well mass and heat transfer, and suggested that such improvements could enable commercially viable gas extraction from challenging hydrate. The aforementioned studies reveal that reservoir fracturing can greatly enhance the injection-production development potential of challenging hydrates. However, the ultimate effectiveness of this novel complex plan hinges upon multiple engineering factors, particularly fracture parameters and injection-production conditions. Furthermore, a systematic assessment of how these coupled parameters influence gas recovery efficiency remains lacking, leaving a gap in the reference framework for implementing engineering solutions.
This study aims to evaluate the development efficiency of challenging hydrates under the co-stimulation of fracturing and thermal, comprehensively considering multiple key engineering parameters. The unique contributions of this work include: (1) systematically investigating the production performance under the coupled effect of reservoir fracturing and thermal stimulation; (2) quantitatively ranking the importance of key parameters and identifying their synergistic effects using an interpretable machine learning approach, which offers new insights and practical guidance for the design and optimization of stimulation strategies in challenging hydrates.

2. Modeling

2.1. Conceptual Model

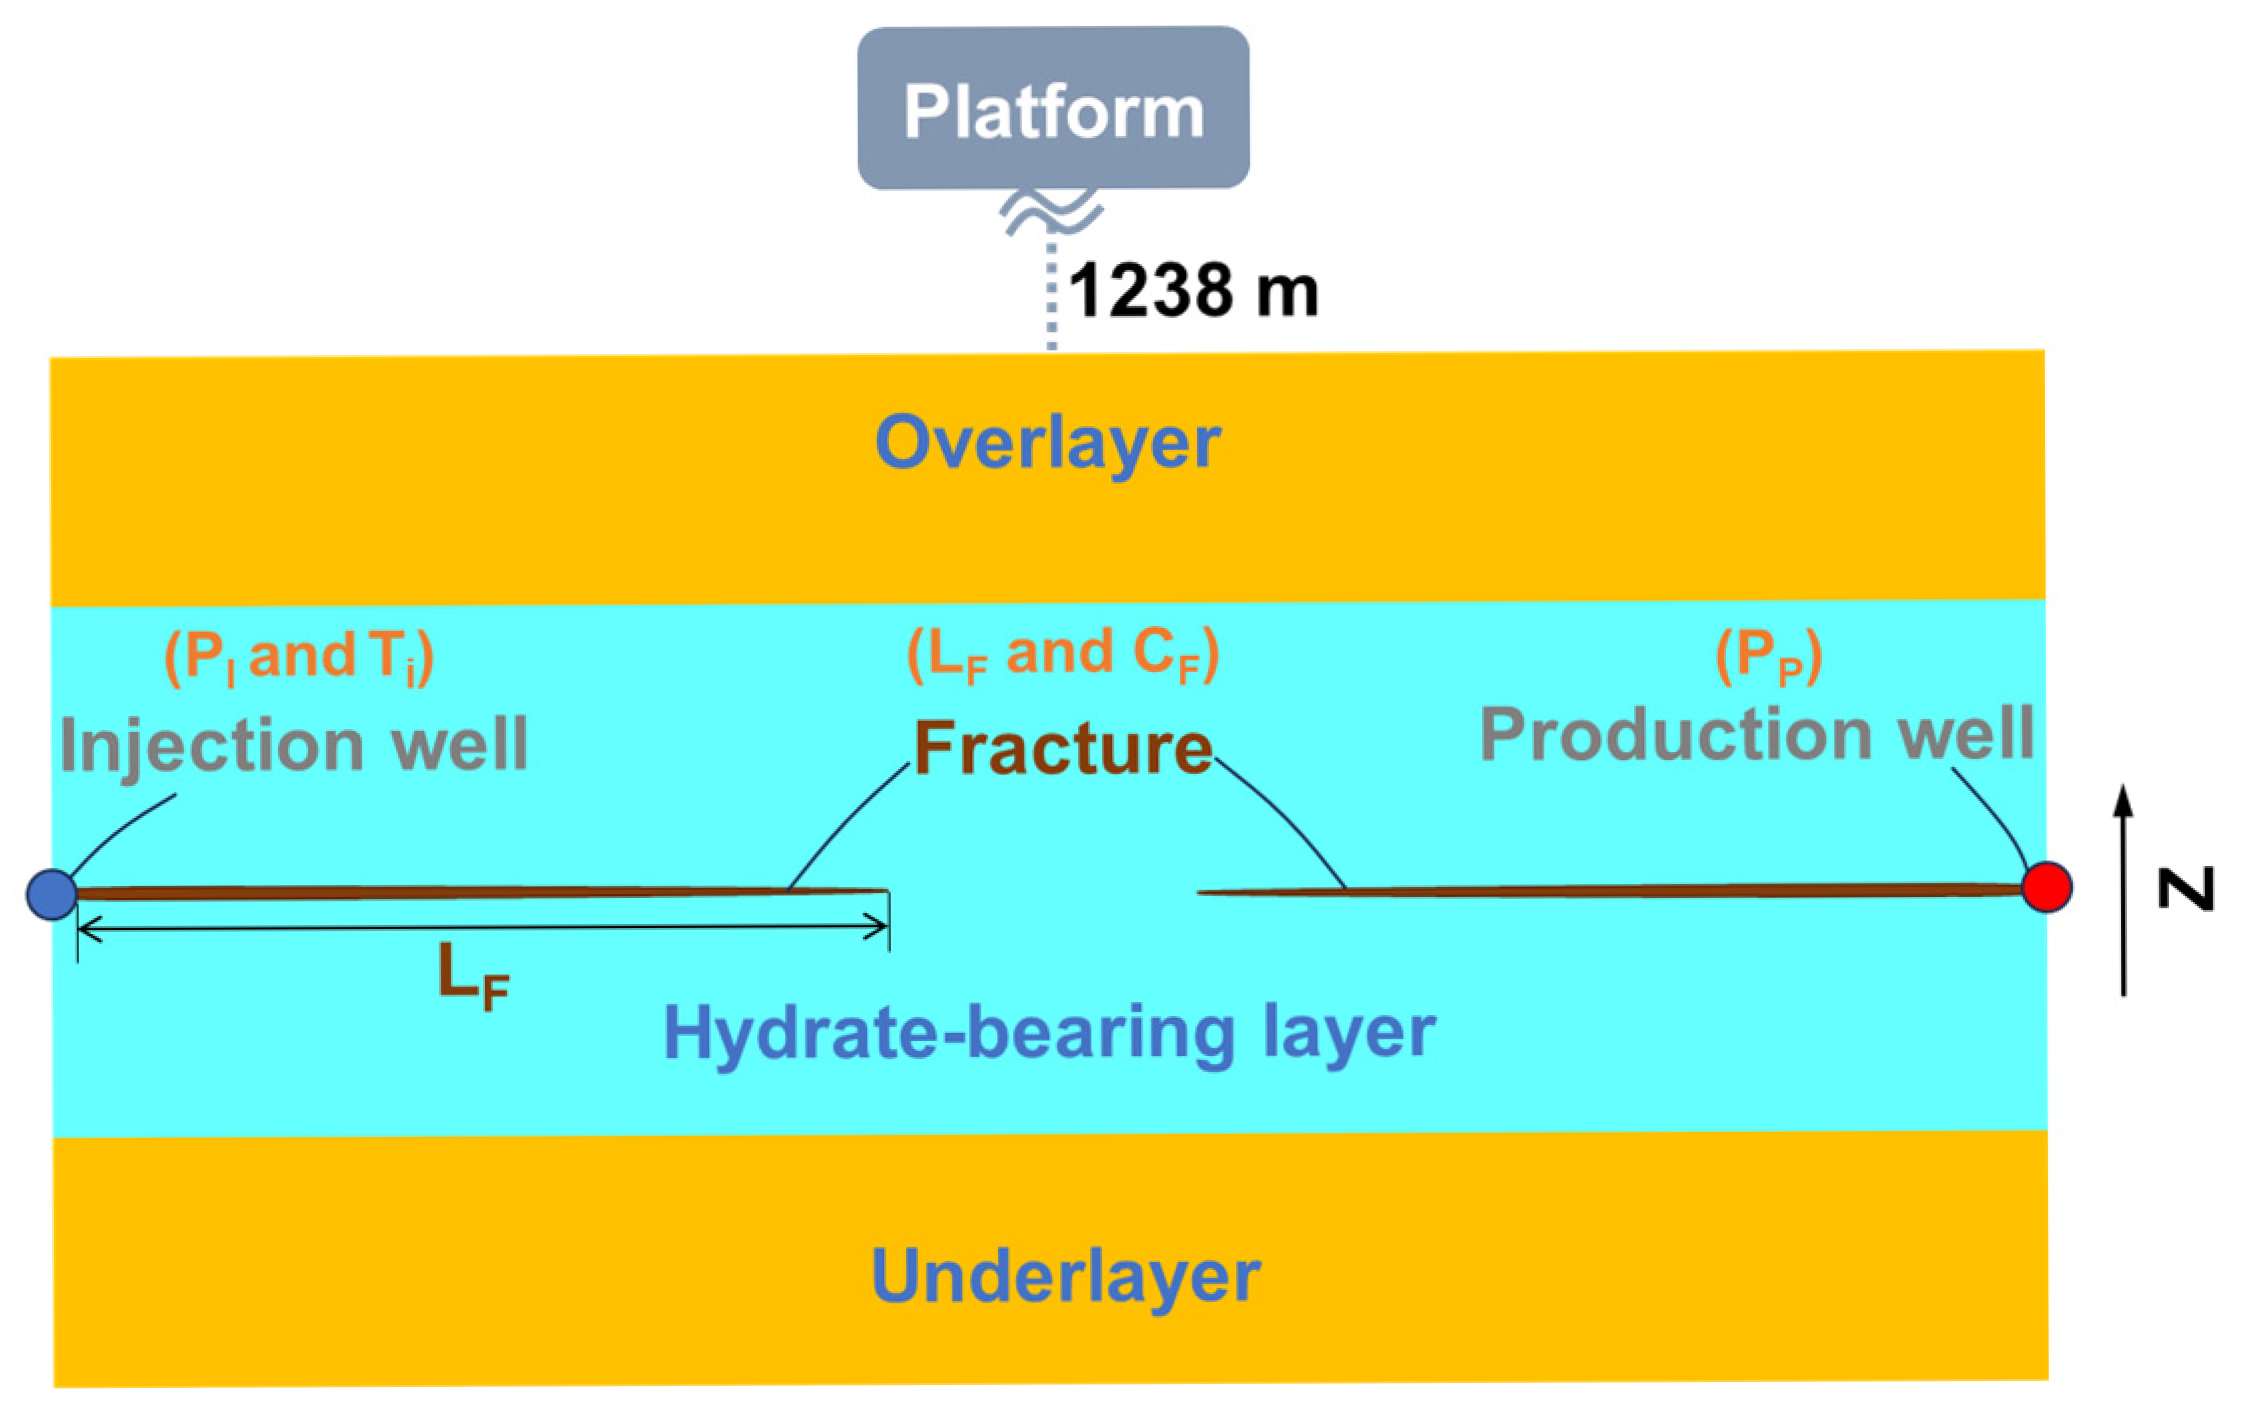
Figure 1 shows a schematic diagram of the proposed development plan for deep-sea hydrates. A horizontal well pattern is employed, with all horizontal sections located in the middle of the hydrate-bearing layer (HBL). The injection and production wells were arranged in an alternating configuration, and horizontal well fracturing technology was adopted to enhance inter-well connectivity, a widely used reservoir stimulation technique for low-permeability oil and gas reservoirs.
In this study, the challenging hydrate deposits at the SH2 site in the Shenhu Area of the South China Sea served as a typical case study, and the potential of this novel development plan was systematically evaluated. Additionally, assuming that the hydrate deposit is homogeneous along the wellbore axis and considering the symmetry of the development plan configuration, the simulation is based solely on a unit horizontal section length and a single injection-production unit.

2.2. Numerical Code

To investigate the injection-production behavior in fractured hydrate deposits, a modeling approach that incorporates hydrate reaction kinetics or thermodynamic equilibrium, mass and energy conservation, and multiphase fluid flow is required. The Tough + Hydrate simulator, a widely used numerical code in hydrate-related studies, provides a comprehensive framework for such simulations [41]. In this code, a finite-difference integration method is used in the spatial domain, and a fully implicit difference scheme—specifically, a forward-differencing scheme—is used in the temporal domain, which has the advantage of unconditional convergence. The Newton–Raphson method is employed for iterative solution. To ensure solution accuracy, the initial time step was set to 1 s, with a maximum of 10 days. In this model, reservoir fractures were conceptualized as porous media with enhanced permeability, and multiphase fluid flow within them is governed by Darcy’s law [42]. Additionally, its reliability has been rigorously validated through laboratory experiments and field-scale applications [43,44], supporting its suitability for the present study. Accordingly, this simulator is employed to conduct the numerical investigations presented herein.

2.3. Initial and Boundary Conditions

The initial reservoir temperature was reported as 14.87 °C, and a geothermal gradient of 0.047 °C/m was applied, allowing the temperature distribution throughout the domain to be determined [45]. The pressure field is derived from a reference reservoir pressure of 14.97 MPa and a hydrostatic pressure gradient [46]. Given the sufficient thickness of the overlayer and underlayer, constant temperature and pressure boundary conditions were applied to the top and bottom of the model. Detailed model parameters are provided in Table 1. Notably, all reservoir parameters listed in Table 1 are obtained from logging data of the SH2 site [46], thereby ensuring that the simulation effectively reflects the actual reservoir conditions. Additionally, the Van Genuchten capillary pressure model [47] and Stone relative permeability model [48] are used to characterize the gas–water flow behavior.

2.4. Simulation Scheme

To systematically evaluate the injection-production performance, a parametric analysis was conducted considering five key factors: fracture half-length (LF), fracture conductivity (CF), injection pressure (PI), injection temperature (TI), and production temperature (PP). The specific simulation scheme is summarized in Table 2.

2.5. Grid Independence Test

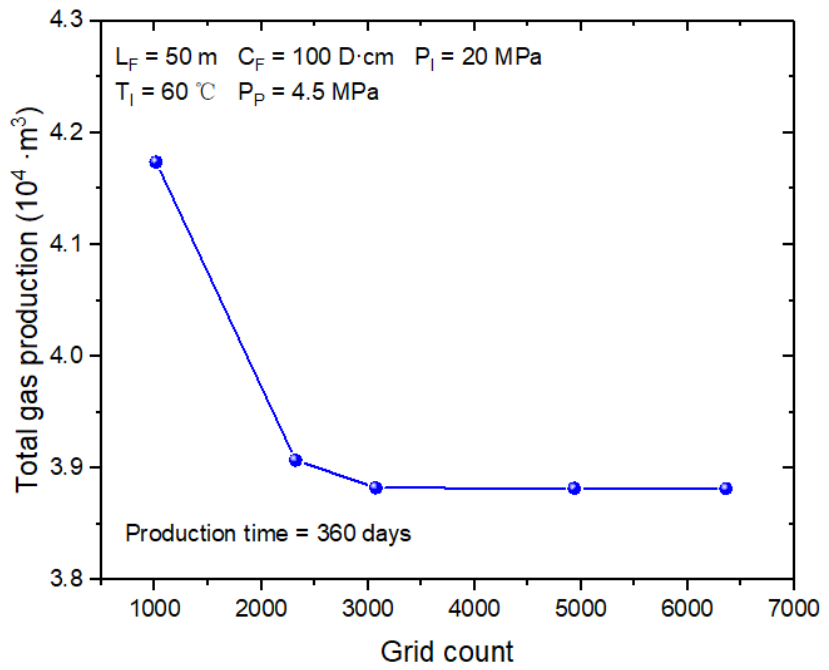
A grid independence test was conducted to determine the grid size, as shown in Figure 2. Notably, the grid density was increased progressively from the top and bottom of the model toward the center to accurately simulate heat and mass transfer within the fracture. The calculation results stabilized at a grid count of 3074, where the grid size in the reservoir ranges between 2 and 5 m. All subsequent simulations were conducted based on this grid scheme to ensure the reliability of the results.

3. Results

Gas production rate (QP, defined as the daily CH4 volume recovered, m3/d) and recovery rate (RE, defined as the ratio of the cumulative recovered gas mass to the gas mass contained in the hydrate deposits) served as the primary analytical indicator. Additionally, in accordance with China’s offshore development technical specifications, development effectiveness is categorized by RE, with RE reached 70% defined as Category I and 85% as Category II [49]. Given this, the average gas production rate (QAP, m3/d) at RE of 0.70 and 0.85 was employed to measure the development efficiency.

3.1. The Effect of Fracture Length

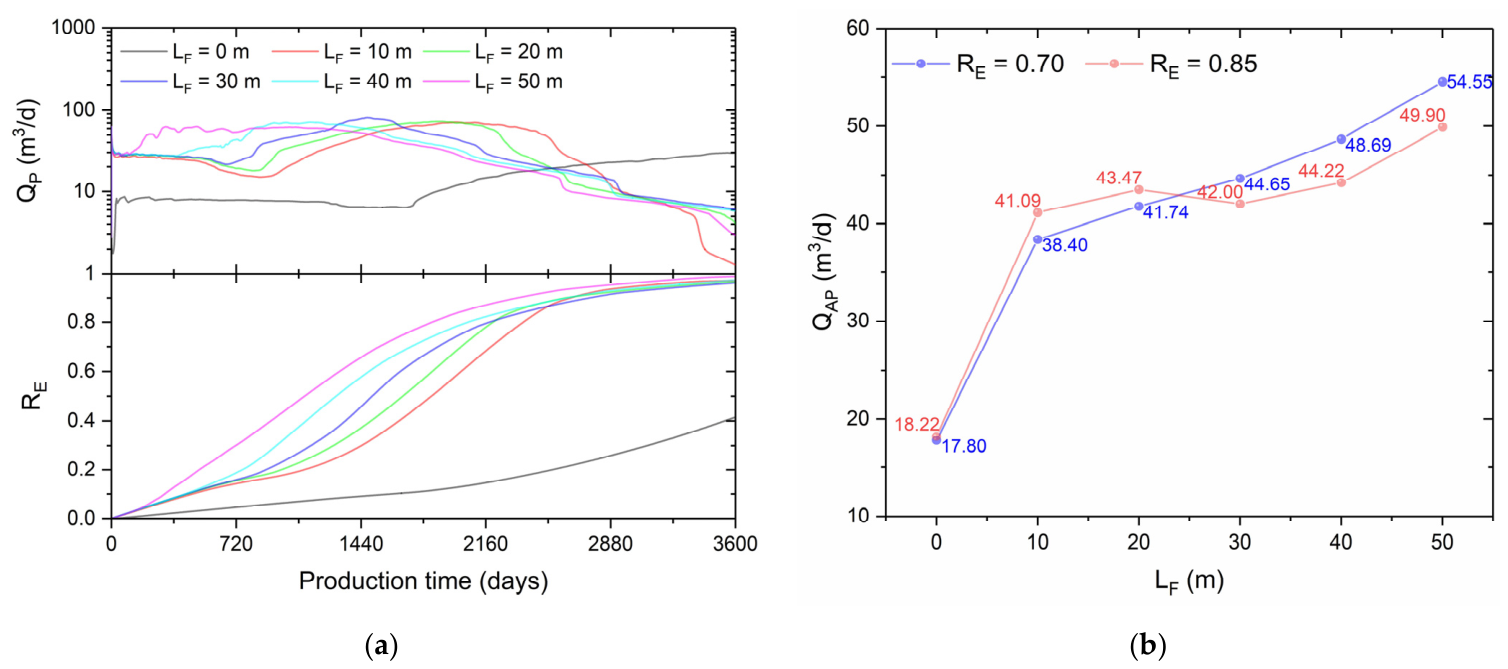
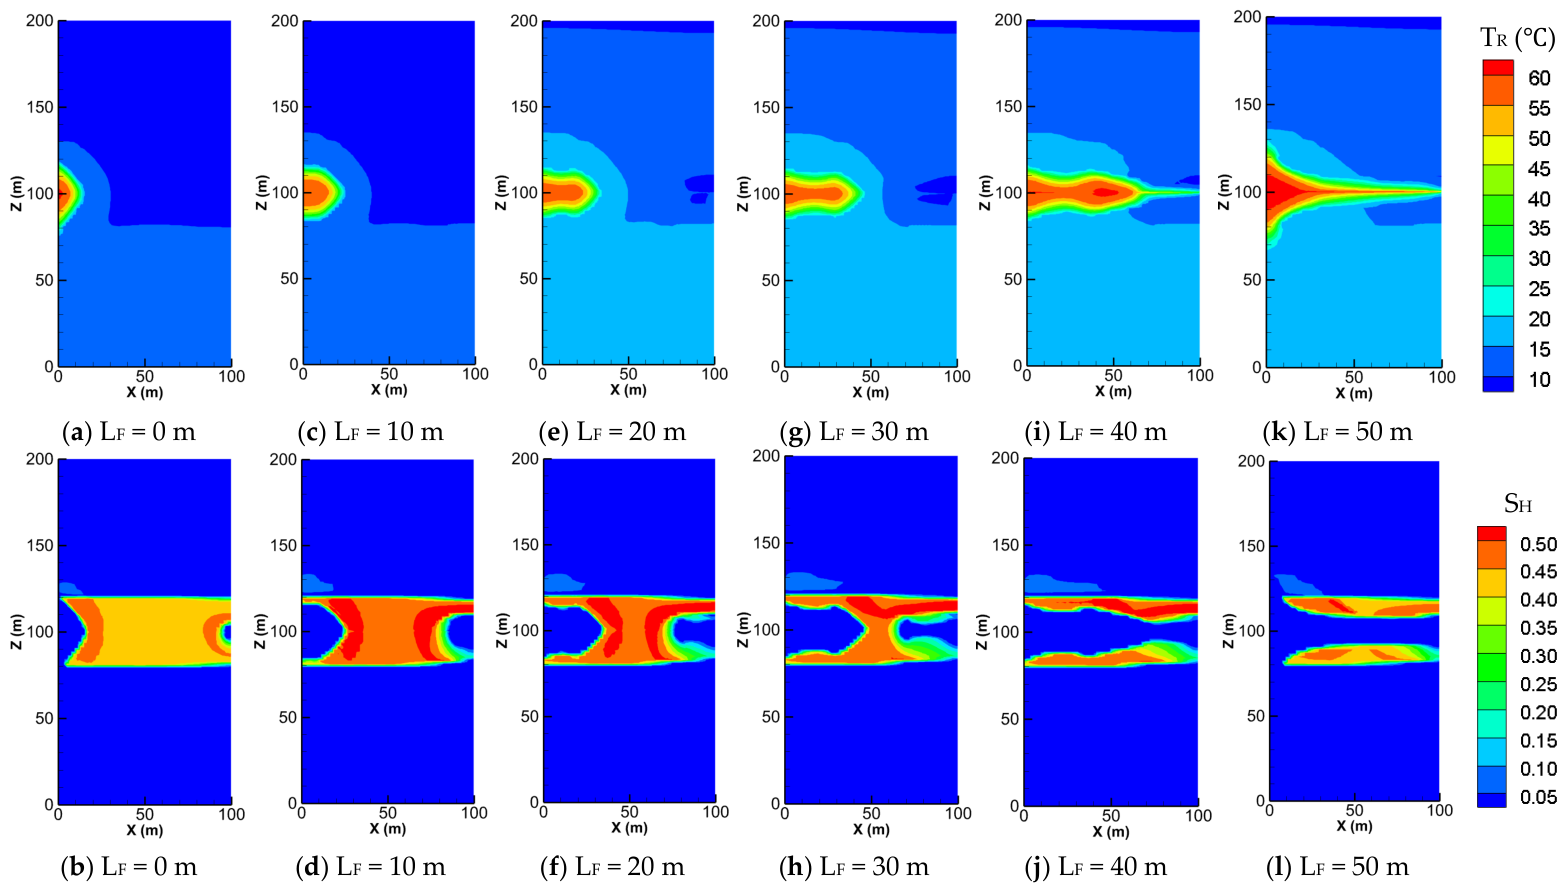
Figure 3 depicts the production performance at different LF values. For the unfractured scenario (LF = 0 m), the QP value remained below 10 m3/d during the initial 1800 days. This poor recovery efficiency stems from the ultra-low effective permeability of the deposits, which significantly impedes mass and heat transfer between the injection wells and production wells. As a result, this phase constitutes an ineffective thermal stimulation stage, with productivity entirely attributable to depressurization. The reservoir physical field in Figure 4a,b also confirmed this point. Following approximately 1900 days, the thermal stimulation gas was displaced into the production well, with QP value gradually increasing to eventually reach 29 m3/d at 3600 days. It is noteworthy that the growth trend of QP appears nearly linear on a logarithmic coordinate system, indicating it underwent a relatively stable exponential growth phase. Accordingly, the productivity contribution induced by thermal stimulation gradually became predominant during this phase. Additionally, increasing the LF value from 10 to 50 m results in a dramatic decrease in the ineffective thermal retardation period (from about 900 to 100 days). This demonstrates that fracturing is crucial for enhancing inter-well connectivity and strengthening inter-well interaction, as it can provide high-conductivity pathways for gas migration from injection wells to production wells. The reservoir physical field in Figure 4c–l can support this point. Furthermore, a distinct productivity depletion phase can be observed following the peak in QP. This results from the majority of methane gas having been recovered, leading to the water flooding of production wells. The research conducted by Ma et al. [50] and Zhong et al. [37] also observed this phenomenon in water-driven conditions. In fractured scenarios, the ultimate RE value ranges from 0.97 to 0.99, whereas in the non-fractured scenario, it is only 0.42. This demonstrates that reservoir reconstruction is crucial for productivity enhancement, even with a limited reconstruction area, which is consistent with the findings of the second pilot production test in the Shenhu Area.
As the LF value increases from 0 to 50 m, the QAP value at RE of 0.70 increases from 17.80 to 54.55 m3/d. The increase is most pronounced in the 0–10 m range, rising by a factor of 2.16, followed by an approximately linear increase thereafter. Differently, the QAP at RE of 0.85 does not always increase as LF increases; its value fluctuates between 41.09 and 44.21 when LF increases from 10 to 40 m. This indicates that the influence of LF on development effectiveness is not sensitive at this point. The mechanism behind this phenomenon is that under operating conditions where the vast majority of gas has been recovered and water flooding has occurred, LF has a negligible effect on residue gas recovery. In addition, the QAP reaches its maximum value of 49.90 m3/d when LF is 50 m. This does not imply that fully interconnected wells facilitate residual gas recovery, but rather that timely gas recovery during the initial production phase prevents gas escape. Another interesting phenomenon is that when LF is 0, 10, and 20 m, the values of QAP at RE of 0.70 are higher compared to those at RE of 0.85. However, when LF exceeds 30 m, the opposite is true. This is due to a more pronounced thermal stimulation effect when inter-well connectivity increases, resulting in an earlier peak gas production period. Overall, the recovery efficiency is most ideal when the wells are fully interconnected by fractures.

3.2. The Effect of Fracture Conductivity

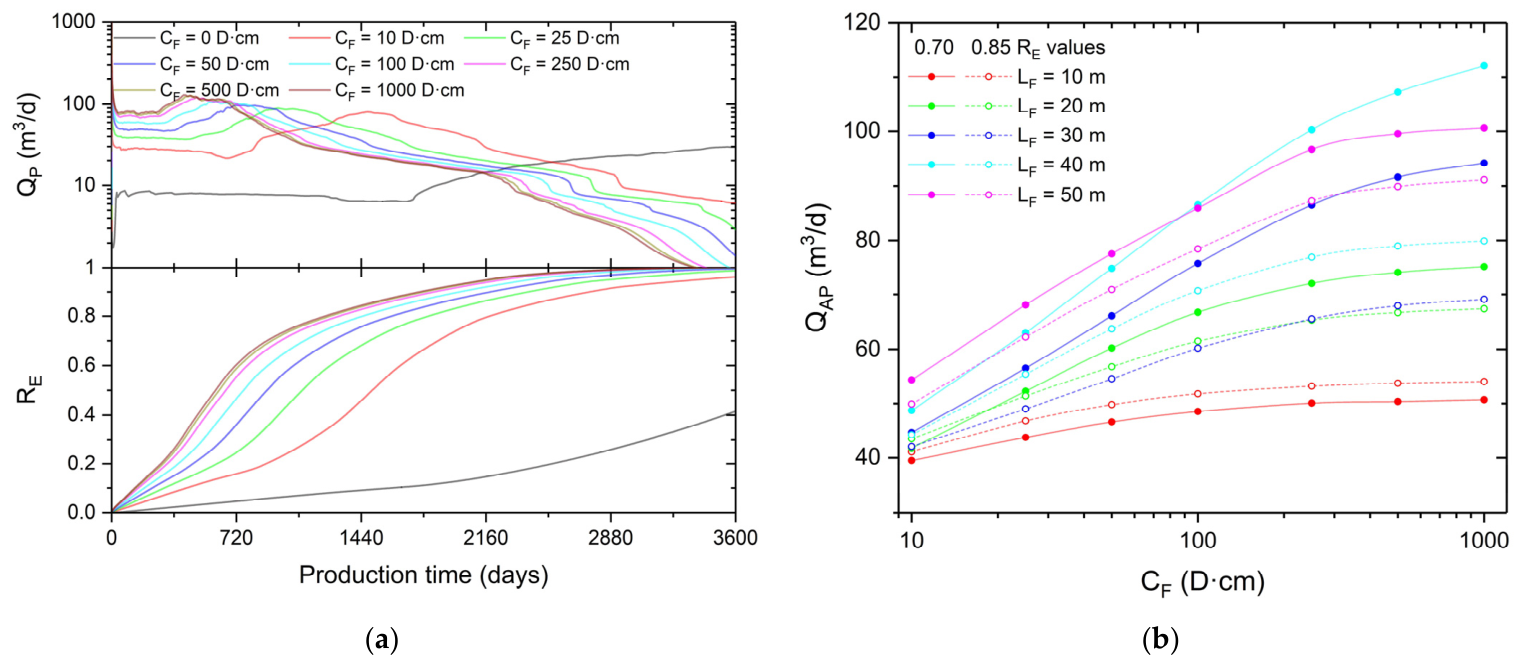
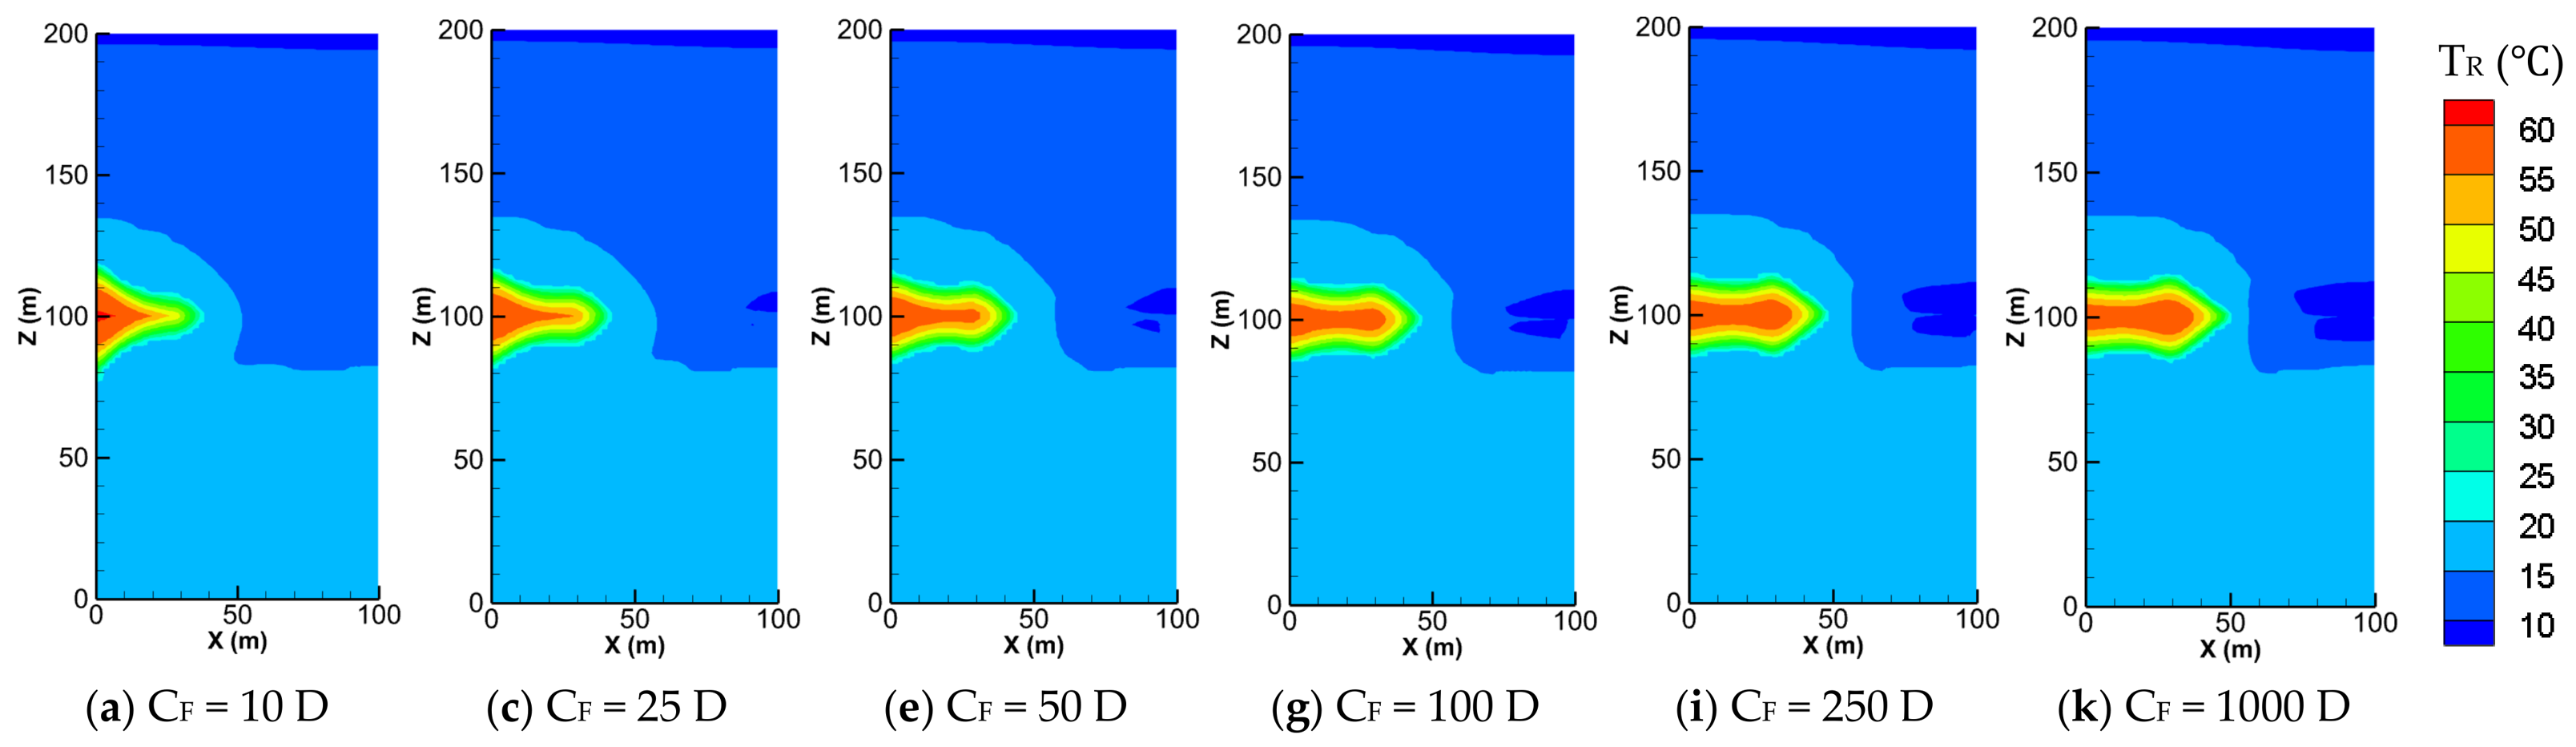
Figure 5 depicts the production performance at different CF values. With increasing CF from 0 to 250 D·cm, the initial QP value (illustrated at production time of 50 days) gradually increases from 8.14 to 70.04 m3/d, and the ineffective thermal stimulation period shortens from 1800 days to 360 days. This indicates that increasing CF not only enhances productivity by depressurization but also improves thermal stimulation effectiveness. The reservoir gas distribution in Figure 6 further corroborates this observation. However, when LF increases from 250 to 1000 D·cm, QP remains virtually unchanged. This indicates that there exists a critical CF value for enhancing mass and heat transfer efficiency. The changes in RE also confirmed this point. For QAP at RE of 0.70, its approximation exhibits exponential growth as CF increases from 10 to 250 D·cm, after which the growth rate diminishes progressively. Furthermore, the growth rate becomes more pronounced at LF ≥30 m. Interestingly, when the CF value exceeds 100 D·cm, the QAP at LF = 50 m is actually lower than that at LF = 40 m. This indicates that under entirely interconnected well conditions, an excessively high CF value exacerbates water flooding severity, rendering CF increases ineffective for enhancing productivity. For QAP at RE of 0.85, its variation trend with CF is similar. The difference lies in the fact that even at CF > 100 D·cm and LF = 50 m, QAP remains the most significant. This indicates that full interconnectivity between wells is more conducive to achieving Category III development effectiveness. Overall, scale-up reservoir fracturing is more conducive to enhancing injection-production development efficiency, and it is recommended that the CF value be no less than 100 D·cm. This fracture scale is highly feasible from an engineering perspective, as existing research has shown that significantly wide fractures can be generated within hydrate deposits [22,25,27,28,51,52].

3.3. The Effect of Injection Pressure

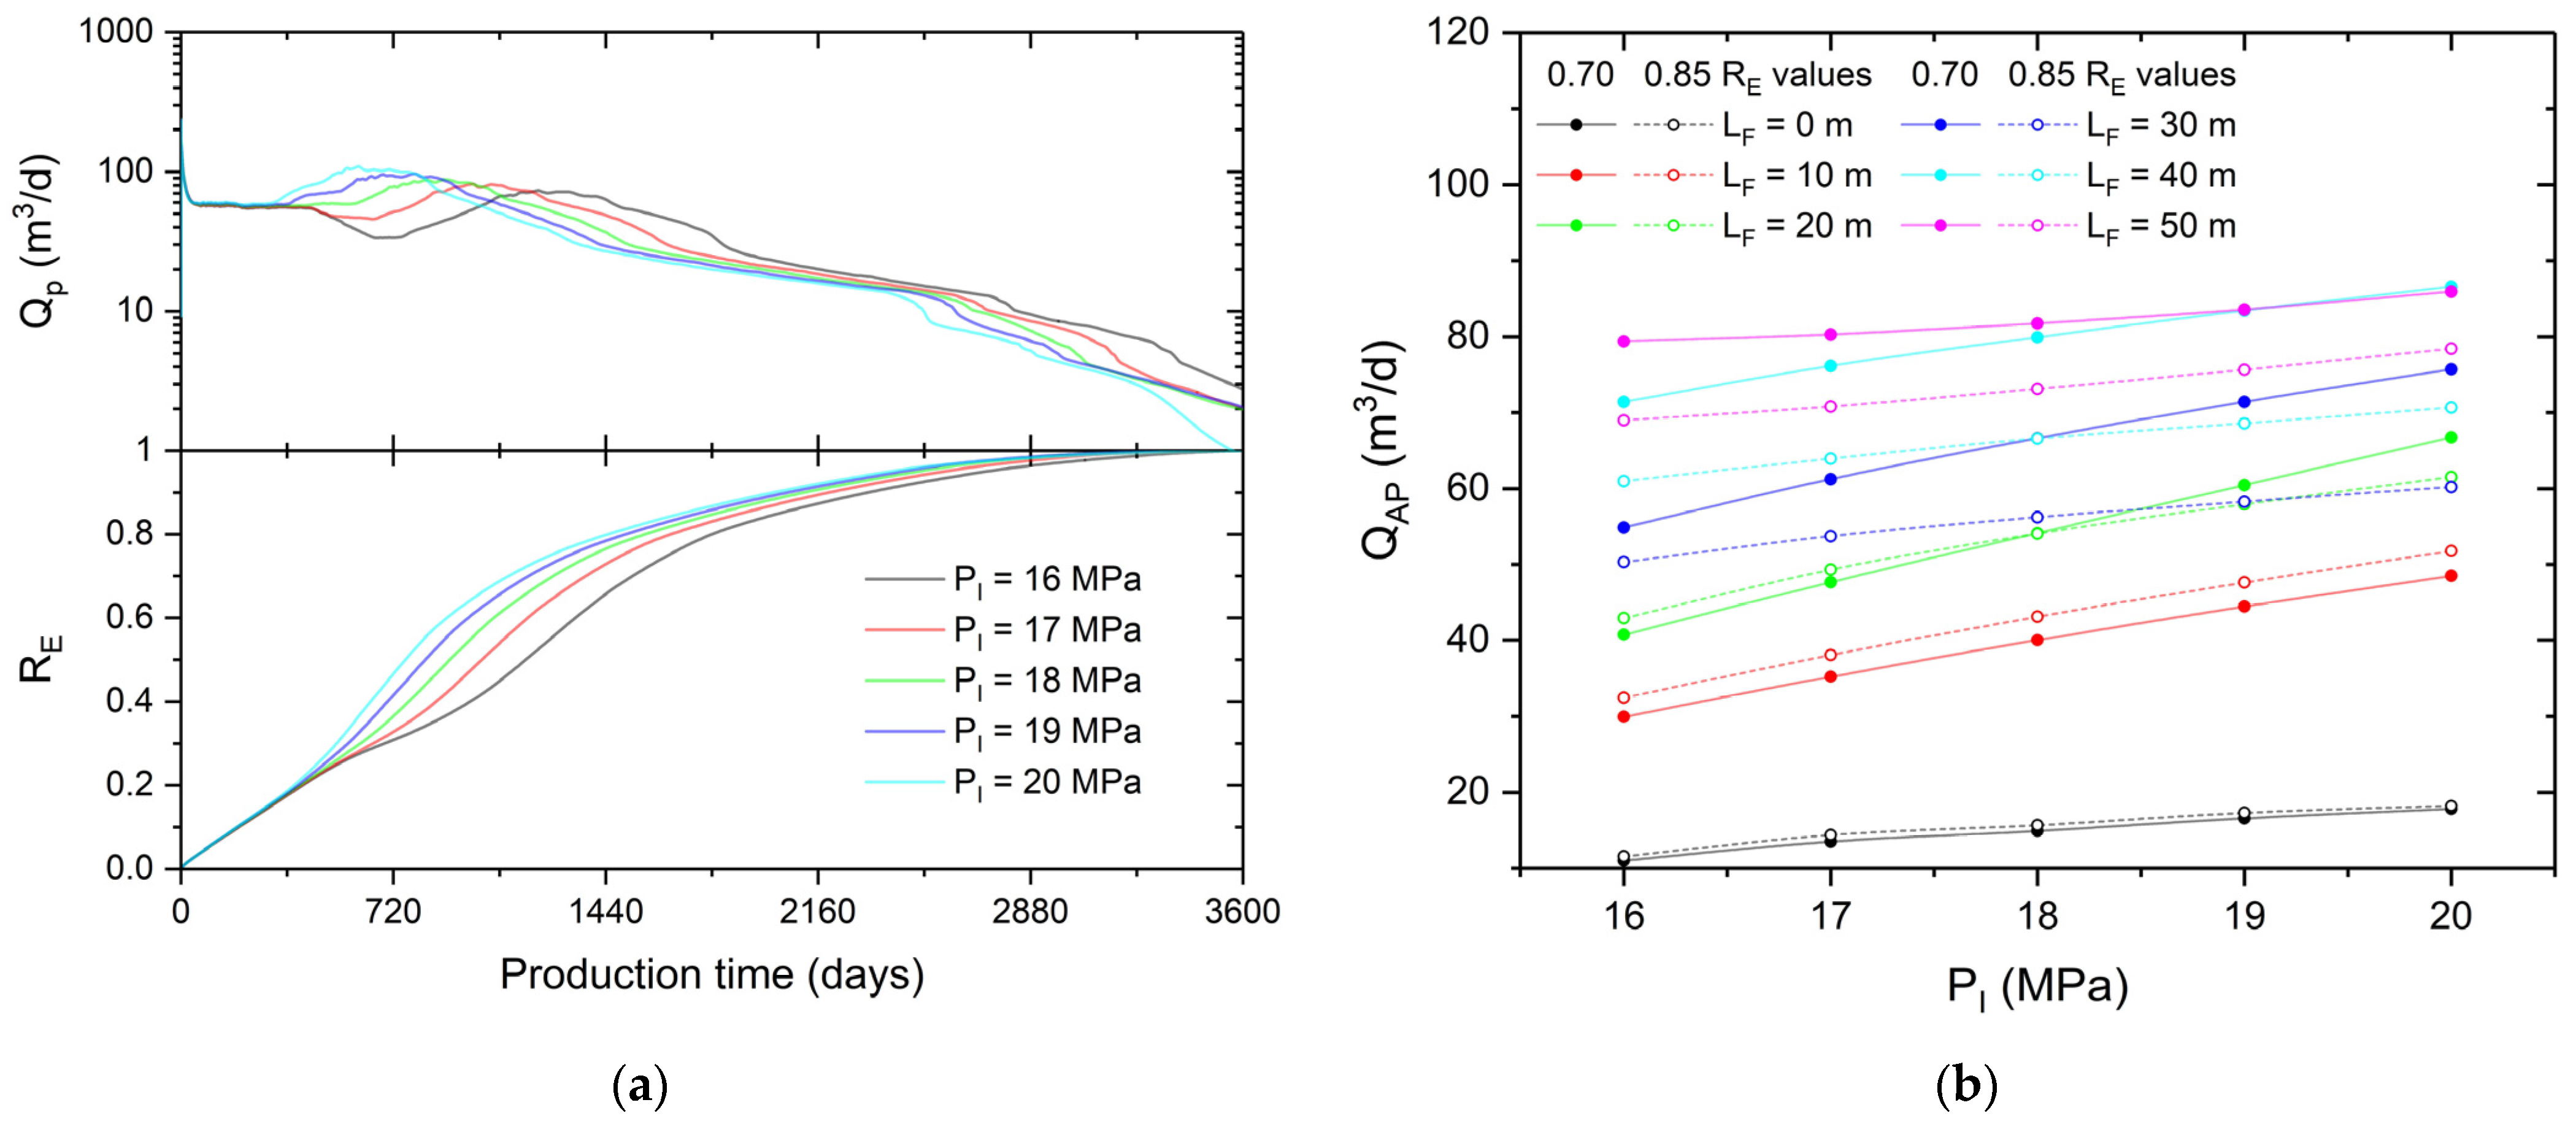
Figure 7 depicts the production performance at different PI values. Increasing PI shortens the ineffective thermal stimulation period significantly, specifically, from 800 to 300 days as PI increases from 16 to 20 MPa. Additionally, the peak QAP increased from 73.56 to 108.93 m3/d, and the peak occurrence time reduced from 1210 to 590 days. This indicates that increasing the PI can enhance production efficiency, as more hot water is injected and the displacement efficiency is improved.
The evolution of RE reveals that the primary influence zone of PI is distributed at RE of 0.35–0.75. The variation in QAP further corroborates this argument. It can be observed that QAP exhibits near-linear growth with increasing PI. Particularly when LF ≥ 20 m, its growth rate at RE = 0.70 is significantly higher than that at RE = 0.85. Additionally, we also found that increasing PI results in premature water flooding when the wells are fully interconnected, which leads to an insignificant improvement in QAP at RE = 0.70. For QAP at RE = 0.85, when LF exceeds 30 m, its improvement by increasing PI is also limited. Therefore, in practical applications, attention should be paid to optimizing the PI value according to production stages. During the initial production phase, PI can be increased to enhance the water-driven efficiency, while in the later production phase, PI should be reduced to control water intrusion.

3.4. The Influence of Injection Temperature

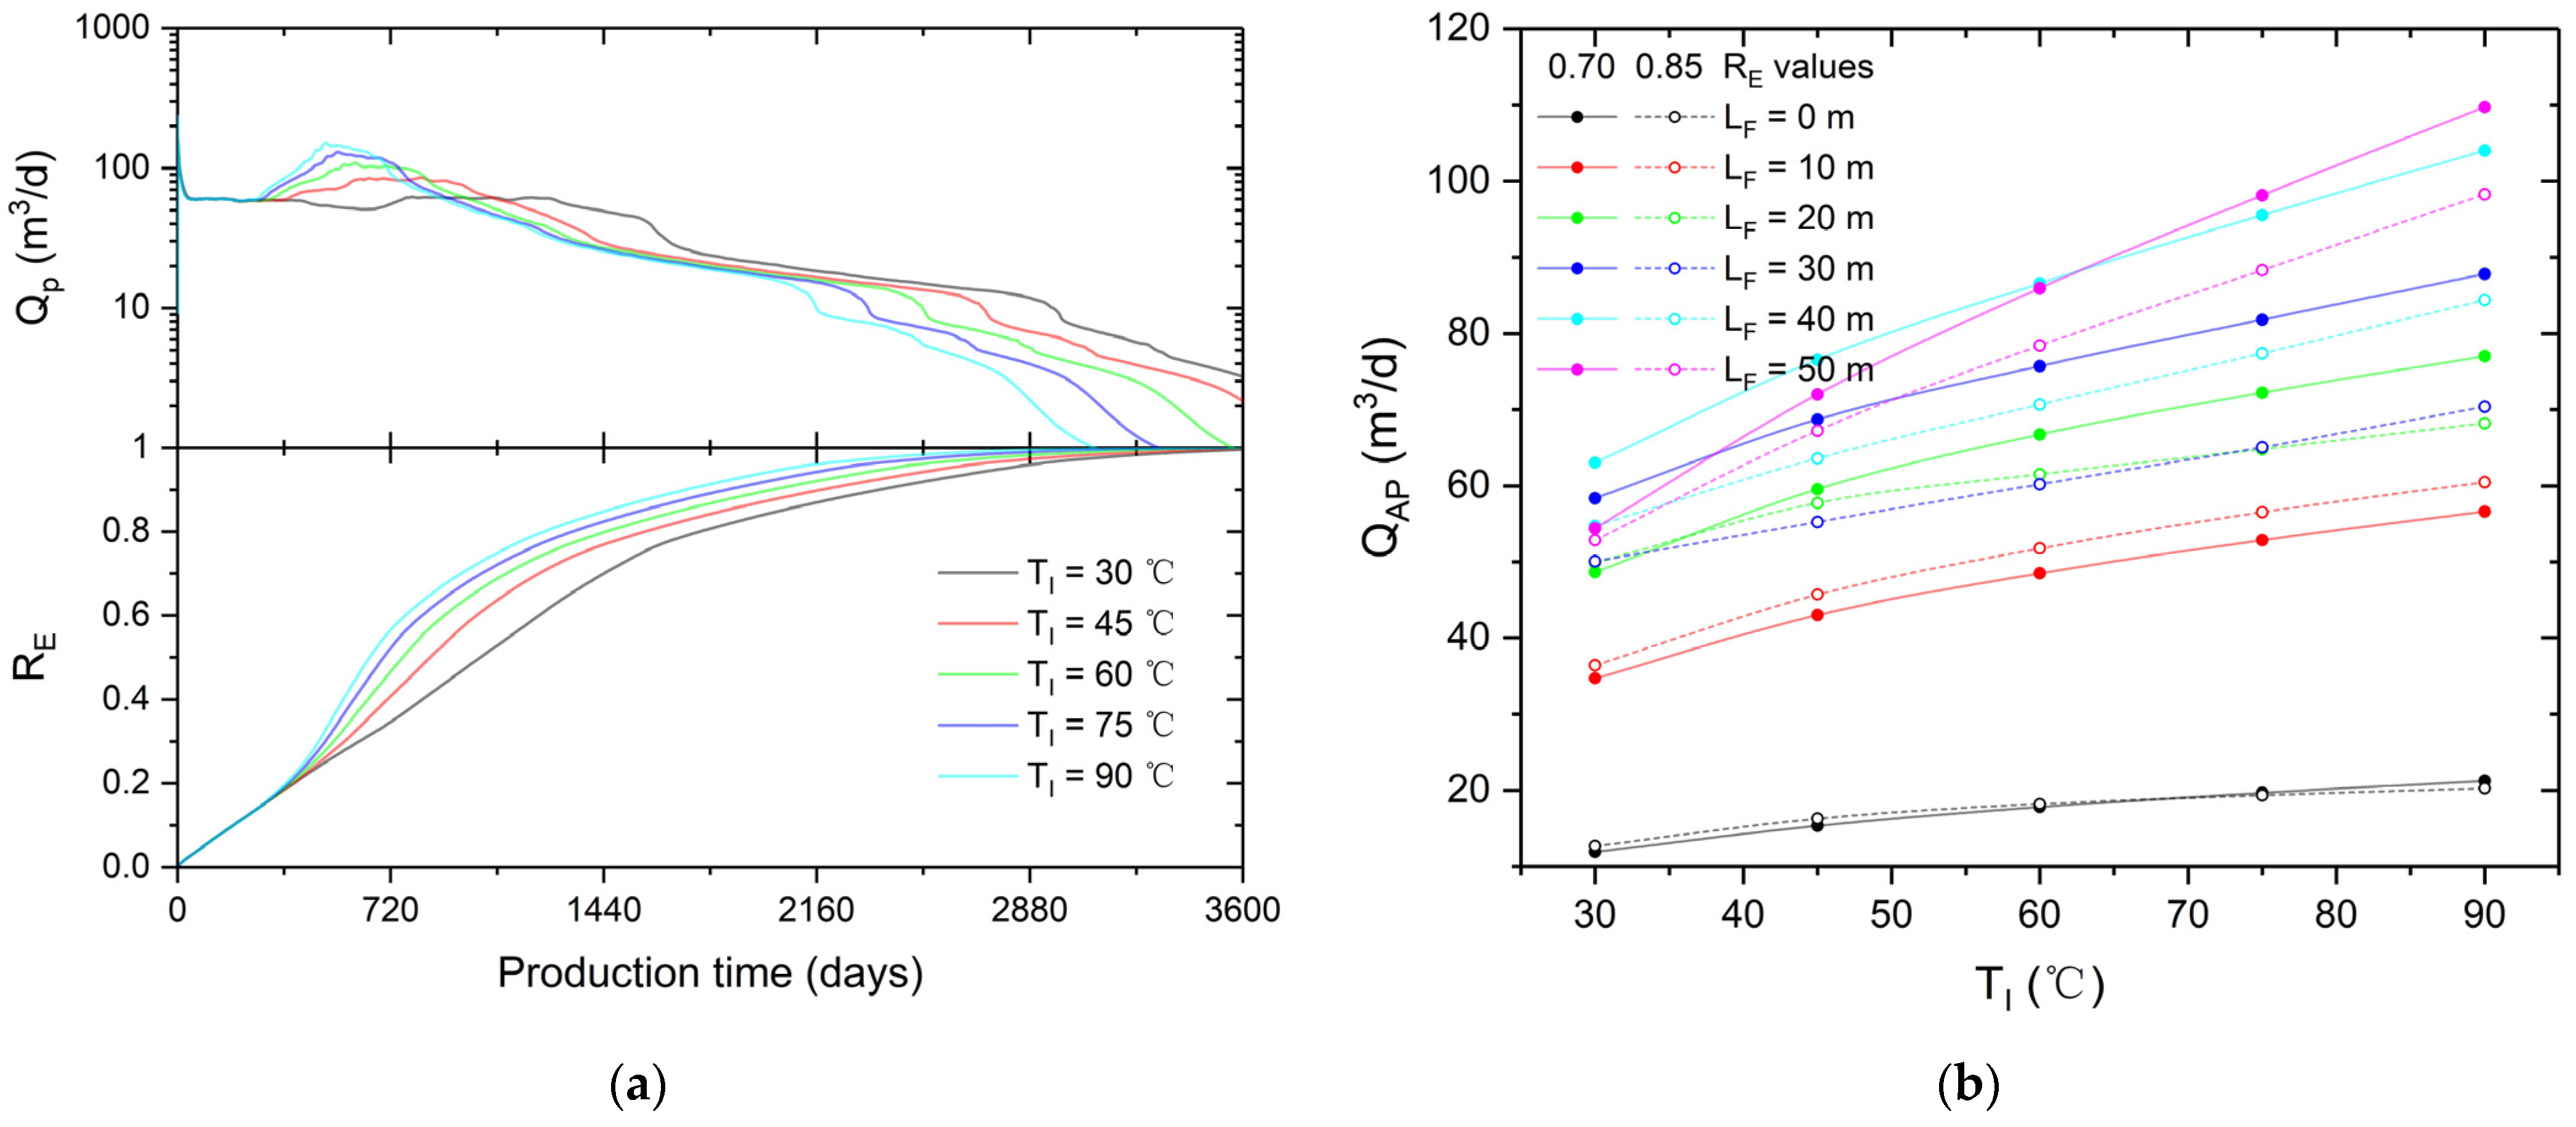
Figure 8 depicts the production performance at different TI values. It can be observed that increasing TI can enhance development efficiency, as the increased heating efficiency facilitates hydrate decomposition. Specifically, as TI increases from 30 to 90 °C, the ineffective thermal stimulation period shortens from 707 to 275 days (with the most significant reduction from 30 to 45 °C), the peak value of QAP increases from 61.37 to 151.90 m3/d, and the peak time is reduced from 1200 to 500 days. The evolution of RE indicates that TI exerts the most pronounced influence during the mid-mining phase (when RE ranges between 0.30 and 0.70). Additionally, QAP exhibits near-linear growth with increasing TI. Furthermore, as LF increases, TI shows a growing tendency to affect QAP. An unexpected phenomenon is that when RE is 0.70, and TI is lower than 60 °C, the QAP at LF = 50 m is actually lower than that at LF = 40 m. This is due to premature water flooding, greatly reducing energy utilization efficiency. Additionally, increasing TI can compensate for energy shortages caused by water flooding. As can be seen, when TI reaches 90 °C, the value of QAP is maximized at RE values of 0.70 and 0.85, corresponding to 109.73 and 98.28 m3/d, respectively, resulting in the most ideal development efficiency.

3.5. The Effect of Production Pressure

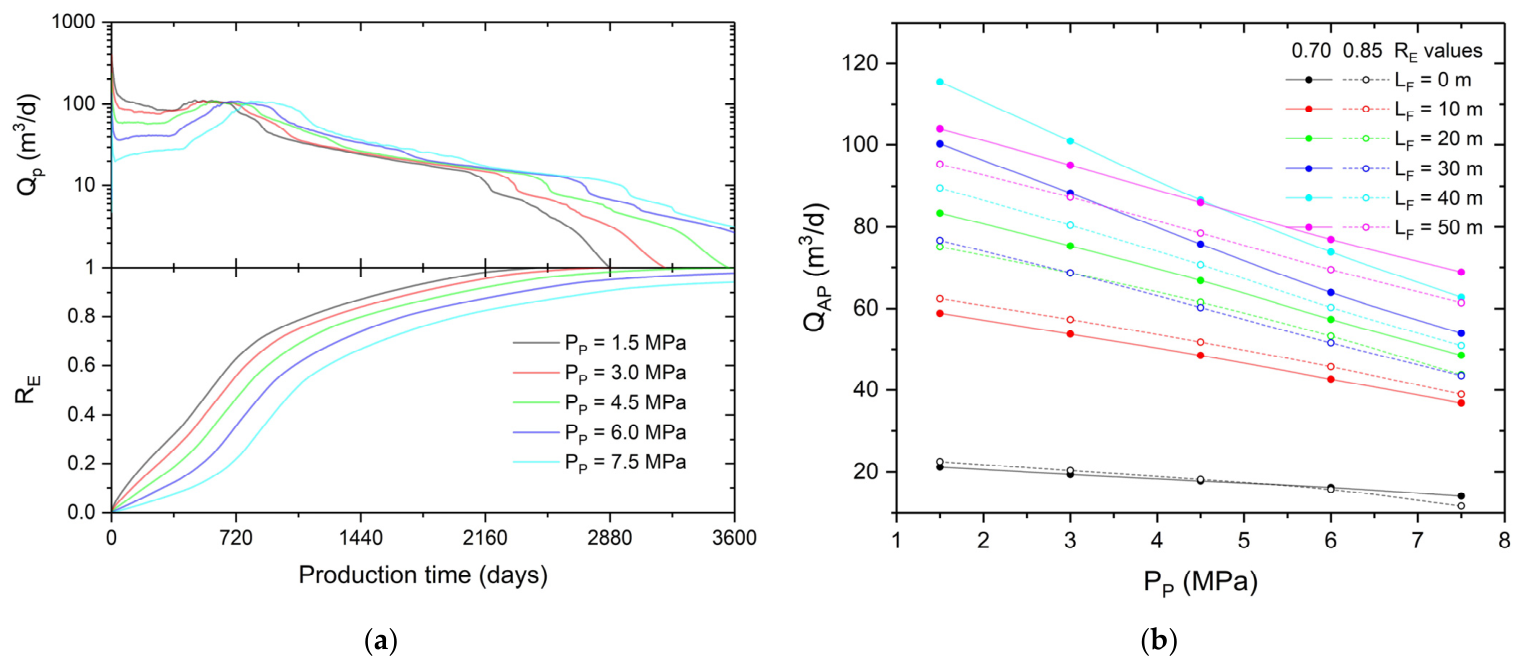
Figure 9 depicts the production performance at different PP values. It can be observed that reducing PP primarily enhances initial development efficiency (RE < 0.20). As PP decreases from 7.5 to 1.5 MPa, the initial QP increases from 21.56 to 123.32 m3/d. This enhancement is attributed to the fact that lower pressure facilitates the hydration decomposition around the depressurization well. Furthermore, based on the large-scale experiment conducted by Feng et al. [10], a lower PP also causes a higher driving force for gas recovery. This results in a shorter ineffective thermal stimulation period. Additionally, QAP decreases approximately linearly with increasing PP. It should be noted that reducing PI can also induce more severe water flooding. This results in a lower QAP at LF = 50 m compared to that at LF = 40 m (RE = 0.70 and PP ≤ 4.5 MPa). Therefore, it is recommended to adopt a low initial PP value to enhance development efficiency.

4. Multivariate Importance Evaluation

The above findings reveal that development efficiency is influenced by fracture parameters as well as injection and production parameters. However, the specific weight of each factor in this process has yet to be quantitatively established. Accordingly, this research utilizes eXtreme Gradient Boosting (XGBoost) and SHapley Additive exPlanations (SHAP) algorithm to systematically evaluate the importance of these factors. The XGBoost algorithm, an advanced implementation of gradient-boosted decision trees, enhances predictive performance by aggregating an ensemble of weak learners [53]. In this framework, each new decision tree is trained to compensate for the residuals of the existing ensemble, culminating in a model with high accuracy and robustness. Complementing this predictive strength, SHAP offers a rigorous method for model interpretability, decomposing predictions to reveal the marginal contribution of individual variables [53]. Consequently, the XGBoost-SHAP paradigm has become instrumental in deciphering complex engineering systems, evaluating the relative influence of multiple variables, and providing robust support for decision-making processes [54].
The XGBoost-SHAP framework was implemented through a systematic procedure. First, two separate XGBoost regression models were established, with the QAP at RE of 0.70 and 0.85 designated as the response variables, respectively. The predictor variables consisted of the influencing factors LF, CF, PI, TI, and PP. Subsequently, these two models were trained using the simulation dataset, with the training process continuing until the prediction error was reduced to below 0.5%. Finally, the SHAP algorithm was applied to compute the Shapley values for each input parameter, enabling a quantitative assessment of their relative importance. Notably, the dataset consists of 210 groups of simulation results, covering all parameter combinations in the scheme.
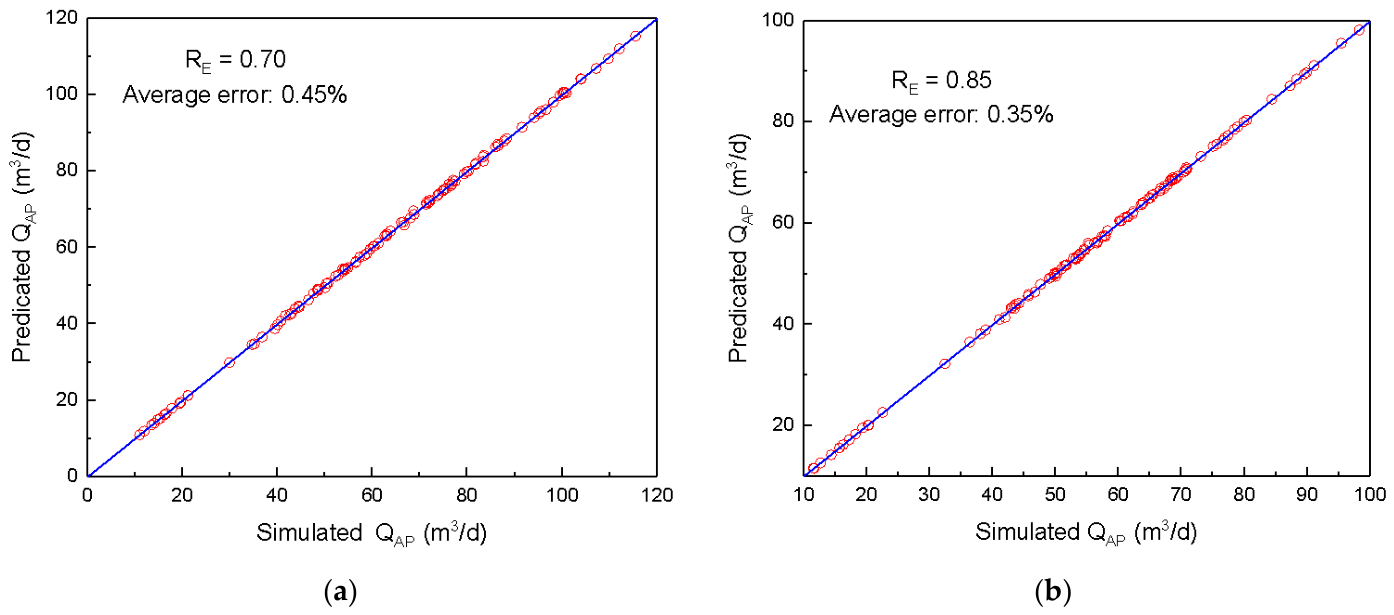
The predictive performance of the trained models is illustrated in Figure 10, which presents the prediction errors. It can be found that QAP at RE of 0.70 and 0.85 predicted by the XGBoost models are in close agreement with the simulated values, with prediction errors of 0.45% and 0.35%, respectively. These errors correspond to prediction accuracies exceeding 99.5%, indicating that the dataset size used is sufficient and effective to support reliable prediction and quantitative analysis.
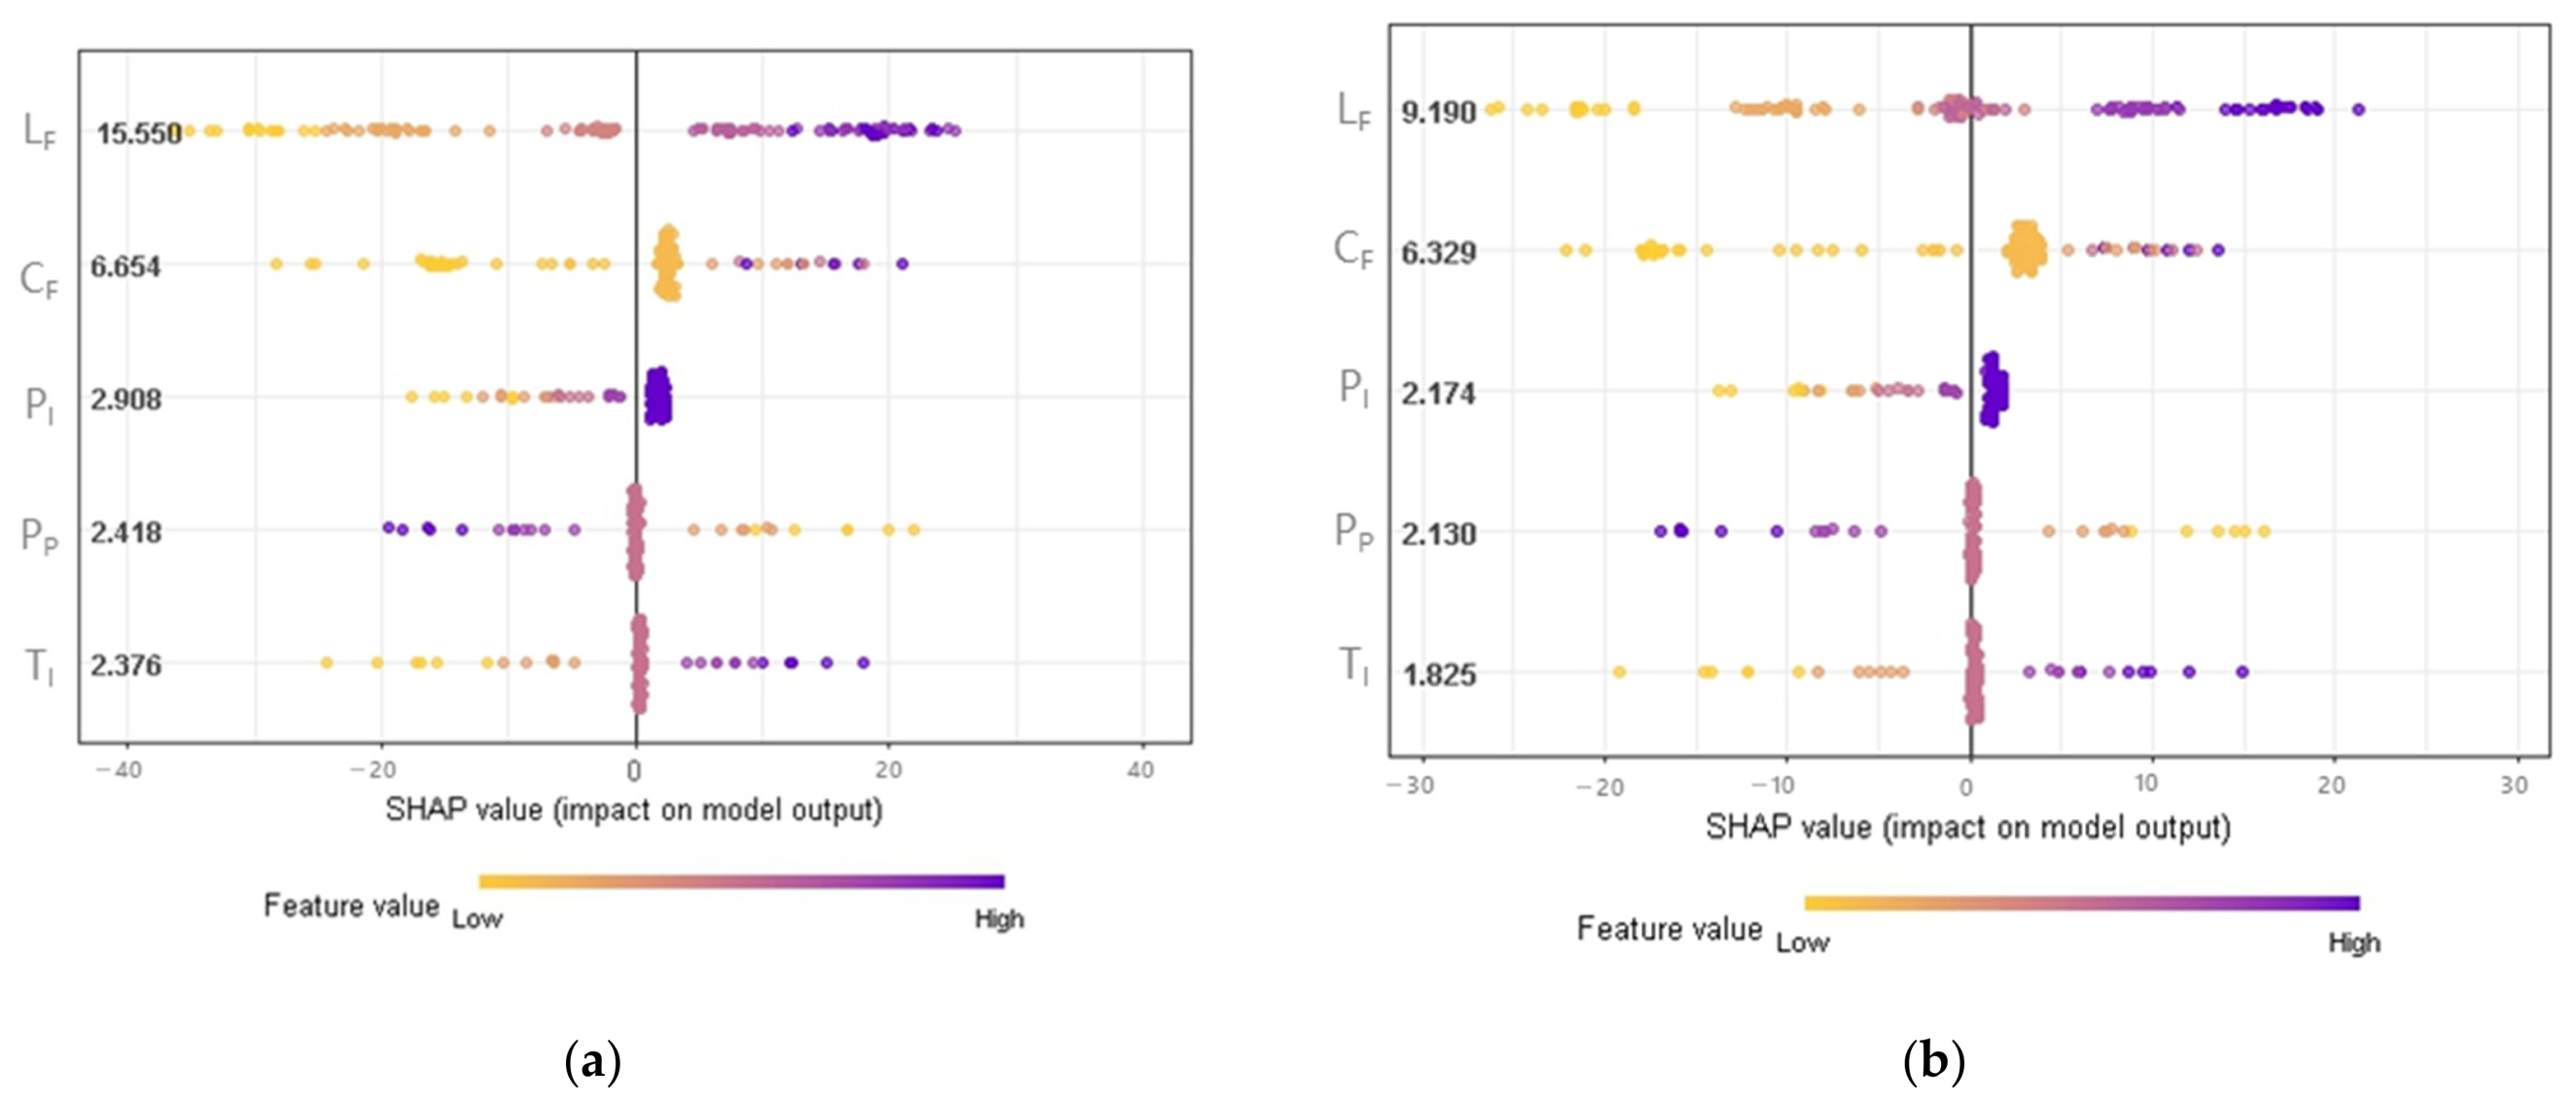
The SHAP values quantifying the contribution of each influencing factor to QAP at RE of 0.70 and 0.85 are presented in Figure 11. The analysis reveals a positive correlation for CF, LF, TI, and PI, as evidenced by their increasing feature values accompanying higher SHAP values. Conversely, PP exhibits an inverse relationship. Based on the mean SHAP values, the relative importance of these factors for QAP at RE = 0.70 and 0.85 is ranked in descending order as follows: LF (15.550 and 9.190), CF (6.654 and 6.329), PI (2.908 and 2.174), PP (2.418 and 2.130), and TI (2.376 and 1.825). These findings establish LF as the primary controlling factor for development efficiency, with CF being secondary. The remaining factors—PI, PP, and TI—display comparable and relatively limited effects.
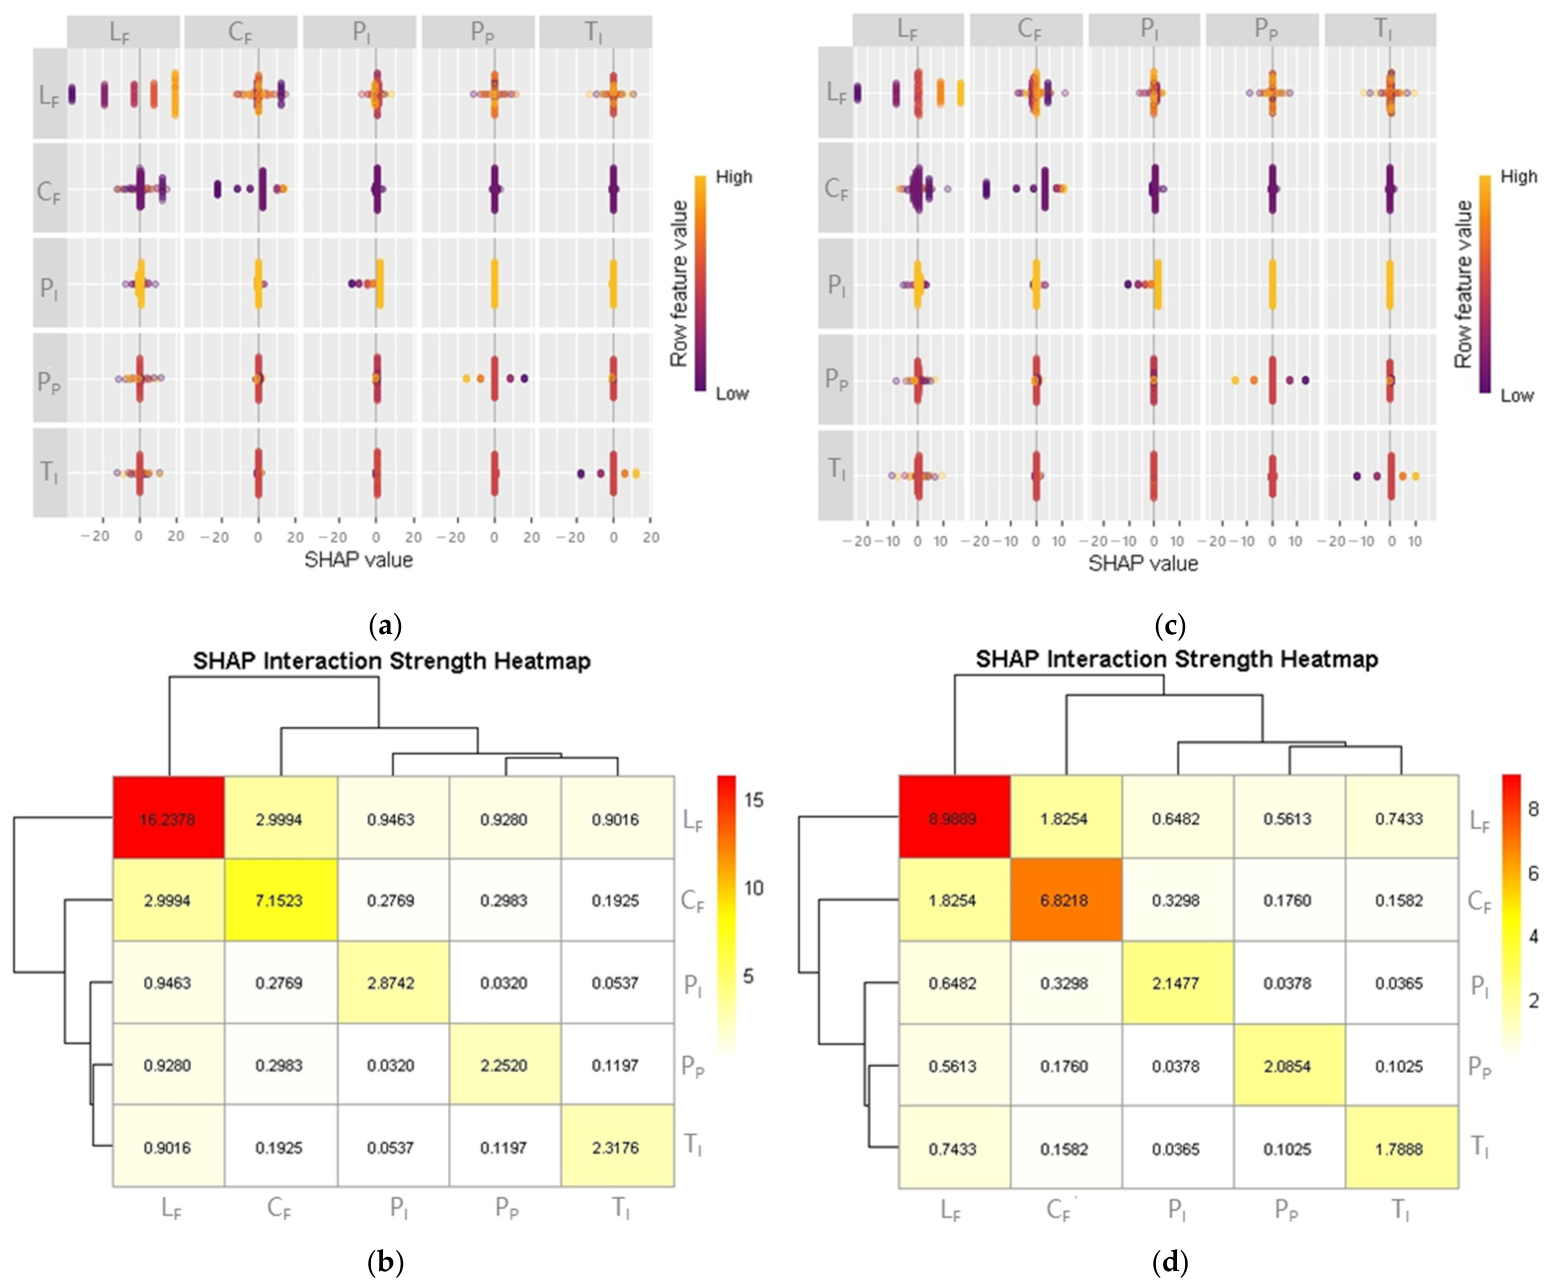
Figure 12 illustrates the interaction effects among the parameters. The shapviz package in R was used to visualize interaction effects, as shown in Figure 12a,b. To quantify interaction effects, interaction matrices were further plotted as shown in Figure 12c,d. At RE of 0.70, the interaction strength between LF and CF reaches 2.999, which is even greater than the main effect of PI, PP, and TI. This indicates that LF and CF exhibit a strong interactive effect on development efficiency and demonstrate positive synergy. Whereas the interaction strengths between other parameters are lower than 1.0, indicating the interaction effect can be ignored. At RE of 0.85, the interaction strength between LF and CF is 1.825, which is higher than the main effect of PI. As a result, there exists a relatively strong interaction effect between LF and CF, though its influence has diminished compared to that at RE of 0.70.

5. Conclusions

This study evaluated the development efficiency of challenging hydrates under reservoir fracturing and thermal stimulation, and elucidated the synergistic impacts of multivariate using a data-driven approach. The following conclusions can be drawn.
  • Reservoir fracturing can significantly improve injection-production behavior as the inter-well mass and heat transfer efficiency is enhanced by the high-conductivity fracture. Specifically, for fracture lengths of 10, 20, 30, 40, and 50 m and fracture conductivity of 100 D·cm, the average gas production at a recovery rate of 0.85 is 2.83, 3.37, 3.30, 3.87, and 4.30 times that of the unfractured scenario, respectively.
  • For Class I development standards (with a recovery rate of 0.70), larger-scale fracturing is not always preferable as it may induce more severe water flooding. In our simulations, production performance at a fracture length of 50 m was lower than at 40 m, and fracture conductivity greater than 250 D·cm hardly affects gas recovery.
  • Multivariate analysis based on XGBoost-SHAP algorithms revealed that fracture length (SHAP values of 15.550 and 9.190) was the primary factor influencing the development efficiency, followed by fracture conductivity (6.654 and 6.329), injection pressure (SHAP values of 2.908 and 2.174), injection temperature (SHAP values of 2.418 and 2.130), and production pressure (SHAP values of 2.376 and 1.825).
  • In plan design, it is essential to promptly adjust the inter-well pressure gradient to control water flooding. Additionally, the synergistic effect between fracture length and fracture conductivity should be considered. The recommended parameters: fracture length = 40 m, fracture conductivity = 100 D·cm.

Author Contributions

Conceptualization, S.N.; data curation, M.G.; formal analysis, L.Z.; investigation, H.L., L.Z., Q.G. and K.L.; methodology, S.N.; resources, H.L.; software, H.L., S.N. and X.Z.; writing—original draft, S.N. All authors have read and agreed to the published version of the manuscript.

Funding

This research received no external funding.

Data Availability Statement

The original contributions presented in this study are included in the article. Further inquiries can be directed to the corresponding author.

Conflicts of Interest

The authors declare no conflicts of interest.

References

  1. Milkov, A.V. Global estimates of hydrate-bound gas in marine sediments: How much is really out there? Earth-Sci. Rev. 2004, 66, 183–197. [Google Scholar] [CrossRef]
  2. Makogon, Y.F. Natural gas hydrates-A promising source of energy. J. Nat. Gas Sci. Eng. 2010, 2, 49–59. [Google Scholar] [CrossRef]
  3. Sun, H.; Chen, B.; Yang, M. Effect of multiphase flow on natural gas hydrate production in marine sediment. J. Nat. Gas Sci. Eng. 2020, 73, 103066. [Google Scholar] [CrossRef]
  4. Song, Y.; Luo, T.; Madhusudhan, B.N.; Sun, X.; Liu, Y.; Kong, X.; Li, Y. Strength behaviors of CH4 hydrate-bearing silty sediments during thermal decomposition. J. Nat. Gas Sci. Eng. 2019, 72, 103031. [Google Scholar] [CrossRef]
  5. Yu, T.; Guan, G.; Abudula, A. Production performance and numerical investigation of the 2017 offshore methane hydrate production test in the Nankai Trough of Japan. Appl. Energy 2019, 251, 113338. [Google Scholar] [CrossRef]
  6. Moridis, G.J.; Reagan, M.T.; Boyle, K.L.; Zhang, K. Evaluation of the Gas Production Potential of Some Particularly Challenging Types of Oceanic Hydrate Deposits. Transp. Porous Media 2011, 90, 269–299. [Google Scholar] [CrossRef]
  7. Ye, J.; Qin, X.; Xie, W.; Lu, H.; Ma, B.; Qiu, H.; Liang, J.; Lu, J.; Kuang, Z.; Lu, C.; et al. The second natural gas hydrate production test in the South China Sea. China Geol. 2020, 3, 197–209. [Google Scholar] [CrossRef]
  8. Jin, J.; Wang, X.; Guo, Y.; Li, J.; Li, Y.; Zhang, X.; Qian, J.; Sun, L. Geological controls on the occurrence of recently formed highly concentrated gas hydrate accumulations in the Shenhu area, South China Sea. Mar. Pet. Geol. 2020, 116, 104294. [Google Scholar] [CrossRef]
  9. Li, X.; Xu, C.; Zhang, Y.; Ruan, X.; Li, G.; Wang, Y. Investigation into gas production from natural gas hydrate: A review. Appl. Energy 2016, 172, 286–322. [Google Scholar] [CrossRef]
  10. Feng, J.; Wang, Y.; Li, X. Large Scale Experimental Evaluation to Methane Hydrate Dissociation below Quadruple Point by Depressurization Assisted with Heat Stimulation. Energy Procedia 2017, 142, 4117–4123. [Google Scholar] [CrossRef]
  11. Li, B.; Liu, S.; Liang, Y.; Liu, H. The use of electrical heating for the enhancement of gas recovery from methane hydrate in porous media. Appl. Energy 2018, 227, 694–702. [Google Scholar] [CrossRef]
  12. Wan, Q.; Si, H.; Li, B.; Li, G. Heat transfer analysis of methane hydrate dissociation by depressurization and thermal stimulation. Int. J. Heat Mass Transf. 2018, 127, 206–217. [Google Scholar] [CrossRef]
  13. Jin, G.; Xu, T.; Xin, X.; Wei, M.; Liu, C. Numerical evaluation of the methane production from unconfined gas hydrate-bearing sediment by thermal stimulation and depressurization in Shenhu area, South China Sea. J. Nat. Gas Sci. Eng. 2016, 33, 497–508. [Google Scholar] [CrossRef]
  14. Consortium, M.R. 2017. Available online: https://www.mh21japan.gr.jp/mh21wp/wp-content/uploads/mh21form2017_doc01.pdf (accessed on 7 January 2025).
  15. Yu, T.; Guan, G.; Abudula, A.; Wang, D. 3D investigation of the effects of multiple-well systems on methane hydrate production in a low-permeability reservoir. J. Nat. Gas Sci. Eng. 2020, 76, 103213. [Google Scholar] [CrossRef]
  16. Minagawa, H.; Ito, T.; Kimura, S.; Kaneko, H.; Noda, S.; Tenma, N. Depressurization and electrical heating of methane hydrate sediment for gas production: Laboratory-scale experiments. J. Nat. Gas Sci. Eng. 2018, 50, 147–156. [Google Scholar] [CrossRef]
  17. Ma, X.; Sun, Y.; Liu, B.; Guo, W.; Jia, R.; Li, B.; Li, S. Numerical study of depressurization and hot water injection for gas hydrate production in China’s first offshore test site. J. Nat. Gas Sci. Eng. 2020, 83, 103530. [Google Scholar] [CrossRef]
  18. Nie, S.; Zhong, X.; Ma, Y.; Pan, D.; Liu, K.; Wang, Y.; Li, X.; Chen, C. Numerical simulation of a new methodology to exploit challenging marine hydrate reservoirs without impermeable boundaries. J. Nat. Gas Sci. Eng. 2021, 96, 104249. [Google Scholar] [CrossRef]
  19. Chen, C.; Meng, Y.; Zhong, X.; Nie, S.; Ma, Y.; Pan, D.; Liu, K.; Li, X.; Gao, S. Research on the Influence of Injection–Production Parameters on Challenging Natural Gas Hydrate Exploitation Using Depressurization Combined with Thermal Injection Stimulated by Hydraulic Fracturing. Energy Fuels 2021, 35, 15589–15606. [Google Scholar] [CrossRef]
  20. Nie, S.; Chen, C.; Chen, M.; Song, J.; Wang, Y.; Ma, Y. Numerical Evaluation of a Novel Development Mode for Challenging Oceanic Gas Hydrates Considering Methane Leakage. Sustainability 2022, 14, 14460. [Google Scholar] [CrossRef]
  21. Huang, L.; Su, Z.; Wu, N.-Y. Evaluation on the gas production potential of different lithological hydrate accumulations in marine environment. Energy 2015, 91, 782–798. [Google Scholar] [CrossRef]
  22. Ito, T.; Igarashi, A.; Suzuki, K.; Nagakubo, S.; Matsuzawa, M.; Yamamoto, K. Laboratory Study of Hydraulic Fracturing Behavior in Unconsolidated Sands for Methane Hydrate Production. In Offshore Technology Conference (OTC19324); OTC: Houston, TX, USA, 2008. [Google Scholar]
  23. Shan, L.; Fu, C.; Liu, Y.; Qi, Y. A feasibility study of using frac-packed wells to produce natural gas from subsea gas hydrate resources. Energy Sci. Eng. 2020, 8, 1247–1259. [Google Scholar] [CrossRef]
  24. Liu, Y.; Sun, M.; Wang, G.; Wang, Q.; Zhao, L. An Investigation of Hydraulic-Fracturing Applied to Marine Gas Hydrate Reservoirs. IOP Conf. Ser. Mater. Sci. Eng. 2020, 729, 012050. [Google Scholar] [CrossRef]
  25. Konno, Y.; Jin, Y.; Yoneda, J.; Uchiumi, T.; Shinjou, K.; Nagao, J. Hydraulic fracturing in methane-hydrate-bearing sand. RSC Adv. 2016, 6, 73148–73155. [Google Scholar] [CrossRef]
  26. Zhang, W.; Shi, X.; Jiang, S.; Cao, Q.; Wang, F.; Wang, Z.; Ge, Y.; Du, Y. Experimental study of hydraulic fracture initiation and propagation in highly saturated methane-hydrate-bearing sands. J. Nat. Gas Sci. Eng. 2020, 79, 103338. [Google Scholar] [CrossRef]
  27. Ma, X.; Jiang, D.; Sun, Y.; Li, S. Experimental study on hydraulic fracturing behavior of frozen clayey silt and hydrate-bearing clayey silt. Fuel 2022, 322, 124366. [Google Scholar] [CrossRef]
  28. Nie, S.; Liu, K.; Zhong, X.; Wang, Y.; Yang, B.; Song, J. Research on Hydraulic Fracture Propagation Patterns in Multilayered Gas Hydrate Reservoirs Using a Three-Dimensional XFEM-Based Cohesive Zone Method. Energy Fuels 2024, 38, 5106–5123. [Google Scholar] [CrossRef]
  29. Nie, S.; Zhong, X.; Song, J.; Tu, G.; Chen, C. Experimental study on hydraulic fracturing in clayey-silty hydrate-bearing sediments and fracability evaluation based on multilayer perceptron-analytic hierarchy process. J. Nat. Gas Sci. Eng. 2022, 106, 104735. [Google Scholar] [CrossRef]
  30. Chen, C.; Yang, L.; Jia, R.; Sun, Y.; Guo, W.; Chen, Y.; Li, X. Simulation Study on the Effect of Fracturing Technology on the Production Efficiency of Natural Gas Hydrate. Energies 2017, 10, 1241. [Google Scholar] [CrossRef]
  31. Yang, L.; Chen, C.; Jia, R.; Sun, Y.; Guo, W.; Pan, D.; Li, X.; Chen, Y. Influence of Reservoir Stimulation on Marine Gas Hydrate Conversion Efficiency in Different Accumulation Conditions. Energies 2018, 11, 339. [Google Scholar] [CrossRef]
  32. Sun, J.; Ning, F.; Liu, T.; Liu, C.; Chen, Q.; Li, Y.; Cao, X.; Mao, P.; Zhang, L.; Jiang, G. Gas production from a silty hydrate reservoir in the South China Sea using hydraulic fracturing: A numerical simulation. Energy Sci. Eng. 2019, 7, 1106–1122. [Google Scholar] [CrossRef]
  33. Guo, W.; Zhang, P.; Wang, Y.; Jia, R.; Li, B. Evolution on the Gas Production from Low Permeability Gas Hydrate Reservoirs by Depressurization Combined with Reservoir Stimulation. Energy Fuels 2020, 34, 15819–15828. [Google Scholar] [CrossRef]
  34. Li, B.; Ma, X.; Zhang, G.; Guo, W.; Xu, T.; Yuan, Y.; Sun, Y. Enhancement of gas production from natural gas hydrate reservoir by reservoir stimulation with the stratification split grouting foam mortar method. J. Nat. Gas Sci. Eng. 2020, 81, 103473. [Google Scholar] [CrossRef]
  35. Shen, P.-F.; Li, G.; Li, X.-S.; Li, B.; Zhang, J.-M. Application of fracturing technology to increase gas production in low-permeability hydrate reservoir: A numerical study. Chin. J. Chem. Eng. 2021, 34, 267–277. [Google Scholar] [CrossRef]
  36. Ju, X.; Liu, F.; Fu, P.; White, M.D.; Settgast, R.R.; Morris, J.P. Gas Production from Hot Water Circulation through Hydraulic Fractures in Methane Hydrate-Bearing Sediments: THC-Coupled Simulation of Production Mechanisms. Energy Fuels 2020, 34, 4448–4465. [Google Scholar] [CrossRef]
  37. Zhong, X.; Pan, D.; Zhai, L.; Zhu, Y.; Zhang, H.; Zhang, Y.; Wang, Y.; Li, X.; Chen, C. Evaluation of the gas production enhancement effect of hydraulic fracturing on combining depressurization with thermal stimulation from challenging ocean hydrate reservoirs. J. Nat. Gas Sci. Eng. 2020, 83, 103621. [Google Scholar] [CrossRef]
  38. Zhong, X.; Pan, D.; Zhu, Y.; Wang, Y.; Tu, G.; Nie, S.; Ma, Y.; Liu, K.; Chen, C. Commercial production potential evaluation of injection-production mode for CH-Bk hydrate reservoir and investigation of its stimulated potential by fracture network. Energy 2022, 239, 122113. [Google Scholar] [CrossRef]
  39. Ma, X.; Sun, Y.; Guo, W.; Jia, R.; Li, B. Numerical simulation of horizontal well hydraulic fracturing technology for gas production from hydrate reservoir. Appl. Ocean Res. 2021, 112, 102674. [Google Scholar] [CrossRef]
  40. Nie, S.; Liu, K.; Xu, K.; Zhong, X.; Tang, S.; Song, J.; Zhang, H.; Li, J.; Wang, Y. Numerical study on the stimulation effect of boundary sealing and hot water injection in marine challenging gas hydrate extraction. Sci. Rep. 2024, 14, 15280. [Google Scholar] [CrossRef]
  41. Moridis, G.; Kowalsky, M.; Pruess, K. TOUGH+ Hydrate V1. 0 User’s Manual; Report LBNL-0149E; Lawrence Berkeley National Laboratory: Berkeley, CA, USA, 2008.
  42. Nie, S.; Li, J.; Liu, K.; Zhong, X.; Wang, Y. Numerical Evaluation of Commingled Production Potential of Marine Multilayered Gas Hydrate Reservoirs Using Fractured Horizontal Wells and Thermal Fluid Injection. J. Mar. Sci. Eng. 2024, 12, 365. [Google Scholar] [CrossRef]
  43. Kumar, P.; Collett, T.S.; Boswell, R.; Cochran, J.R.; Lall, M.; Mazumdar, A.; Ramana, M.V.; Ramprasad, T.; Riedel, M.; Sain, K.; et al. Geologic implications of gas hydrates in the offshore of India: Krishna–Godavari Basin, Mahanadi Basin, Andaman Sea, Kerala–Konkan Basin. Mar. Pet. Geol. 2014, 58, 29–98. [Google Scholar] [CrossRef]
  44. Li, B.; Li, X.-S.; Li, G.; Feng, J.-C.; Wang, Y. Depressurization induced gas production from hydrate deposits with low gas saturation in a pilot-scale hydrate simulator. Appl. Energy 2014, 129, 274–286. [Google Scholar] [CrossRef]
  45. Su, Z.; Cao, Y.; Wu, N.; He, Y. Numerical Analysis on Gas Production Efficiency from Hydrate Deposits by Thermal Stimulation: Application to the Shenhu Area, South China Sea. Energies 2011, 4, 294–313. [Google Scholar] [CrossRef]
  46. Wu, N.; Zhang, H.; Yang, S.; Zhang, G.; Liang, J.; Lu, J.A.; Su, X.; Schultheiss, P.; Holland, M.; Zhu, Y. Gas Hydrate System of Shenhu Area, Northern South China Sea: Geochemical Results. J. Geol. Res. 2011, 2011, 370298. [Google Scholar] [CrossRef]
  47. van Genuchten, M.T. A Closed-form Equation for Predicting the Hydraulic Conductivity of Unsaturated Soils. Soil Sci. Soc. Am. J. 1980, 44, 892–898. [Google Scholar] [CrossRef]
  48. Stone, H.L. Probability Model for Estimating Three-Phase Relative Permeability. J. Pet. Technol. 1970, 22, 214–218. [Google Scholar] [CrossRef]
  49. Li, Z. Basic Theory and Technology of Waterflooding Oilfield Development; Science Press Beijing: Beijing, China, 2019; pp. 68–70. [Google Scholar]
  50. Ma, Y.; Zhong, X.; Li, X.; Nie, S.; Li, Q.; Tu, G.; Chen, C. Numerical simulation of gas extraction from marine hydrate sediments using sodium chloride injection. Fuel 2023, 342, 127910. [Google Scholar] [CrossRef]
  51. Zhong, X.; Nie, S.; Tu, G.; Chen, C.; Guo, W.; Wang, Y. Fracture initiation-propagation behavior of the Shenhu hydrate reservoir with connected reservoir pore water. Energy Fuels 2024, 38, 12900–12915. [Google Scholar] [CrossRef]
  52. Too, J.L.; Cheng, A.; Khoo, B.C.; Palmer, A.; Linga, P. Hydraulic fracturing in a penny-shaped crack. Part II: Testing the frackability of methane hydrate-bearing sand. J. Nat. Gas Sci. Eng. 2018, 52, 619–628. [Google Scholar] [CrossRef]
  53. Gu, M.; Kang, S.; Xu, Z.; Lin, L.; Zhang, Z. AE-XGBoost: A Novel Approach for Machine Tool Machining Size Prediction Combining XGBoost, AE and SHAP. Mathematics 2025, 13, 835. [Google Scholar] [CrossRef]
  54. Liao, J.; Xie, Y.; Zhao, P.; Xia, K.; Xu, B.; Wang, H.; Li, C.; Li, C.; Liu, H. Probabilistic assessment of the thermal performance of low-enthalpy geothermal system under impact of spatially correlated heterogeneity by using XGBoost algorithms. Energy 2024, 313, 133947. [Google Scholar] [CrossRef]
Figure 1. Schematic diagram of the novel development plan for deep-sea hydrates.
Jmse 14 00778 g001
Figure 2. Grid independence test result.
Jmse 14 00778 g002
Figure 3. Production performance at different LF values: (a) Variation of QP and RE with production time; (b) variation of QAP values with LF at RE values of 0.70 and 0.85.
Jmse 14 00778 g003
Figure 4. Reservoir temperature (TR) and hydrate saturation (SH) distribution at the 300th day under LF values of 0 (a,b), 10 (c,d), 20 (e,f), 30 (g,h), 40 (i,j), and 50 m (k,l).
Jmse 14 00778 g004
Figure 5. Production performance at different CF values: (a) Variation of QP and RE with production time at LF = 30 m; (b) variation of QAP values with LF at RE values of 0.70 and 0.85.
Jmse 14 00778 g005
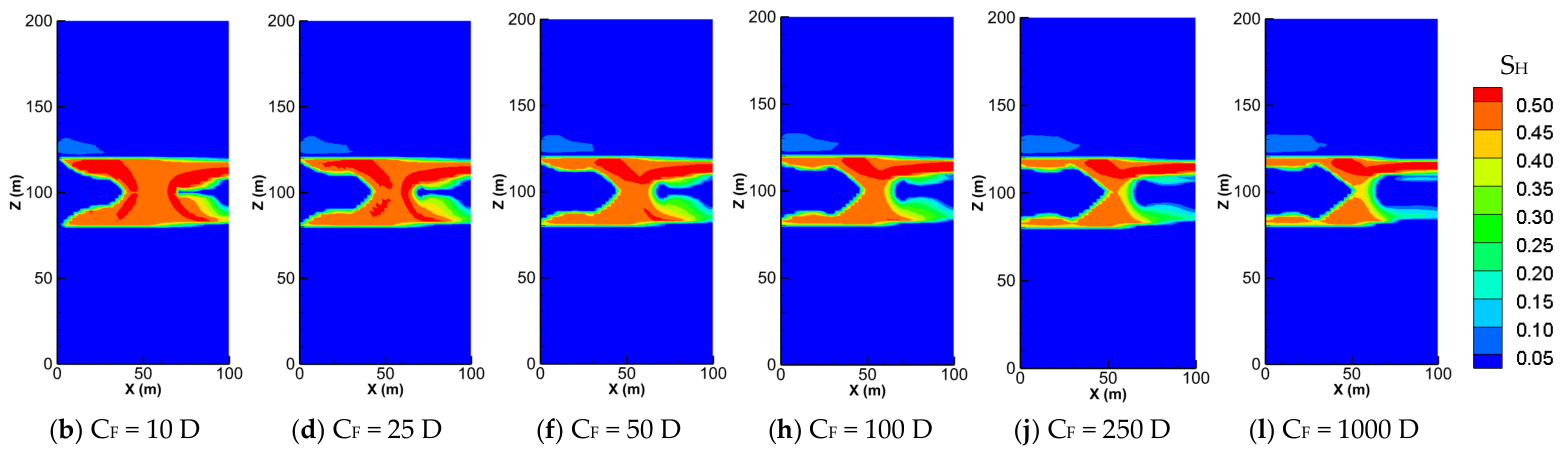
Figure 6. Reservoir temperature (TR) and hydrate saturation (SH) distribution at the 360th day under CF values of 10 (a,b), 25 (c,d), 50 (e,f), 100 (g,h), 250 (i,j), and 1000 D (k,l).
Jmse 14 00778 g006aJmse 14 00778 g006b
Figure 7. Production performance at different PI values: (a) Variation of QP and RE with production time at LF of 30 m; (b) variation of QAP values with LF at RE values of 0.70 and 0.85.
Jmse 14 00778 g007
Figure 8. Production performance at different TI values: (a) Variation of QP and RE with production time at LF of 30 m; (b) variation of QAP values with LF at RE values of 0.70 and 0.85.
Jmse 14 00778 g008
Figure 9. Production performance at different PP values: (a) Variation of QP and RE with production time at LF of 30 m; (b) variation of QAP values with LF at RE values of 0.70 and 0.85.
Jmse 14 00778 g009
Figure 10. The fitted results of XGBoost models: (a) QAP at RE = 0.70; and (b) QAP at RE = 0.85.
Jmse 14 00778 g010
Figure 11. The quantified importance of individual influencing factors via SHAP analysis: (a) QAP at RE of 0.70; (b) QAP at RE of 0.85.
Jmse 14 00778 g011
Figure 12. SHAP interaction chart and matrix heatmap at RE of 0.70 (a,b) and 0.85 (c,d).
Jmse 14 00778 g012
Table 1. Model parameters.
ParametersValue
Grain density2600 kg/m3
Dry and wet thermal conductivity of deposits1 and 3.1 W/m/K
Grain-specific heat1000 J·K/kg
Porewater salinity0.03
Formation thickness (Overlayer, HBL, and underlayer)80, 40, 80 m
Wellbore diameter0.2 m
Well spacing100 m
Intrinsic permeability and porosity of wells5 × 10−9 m2 and 1 [6]
Intrinsic permeability and porosity of deposits10 mD and 0.38
Aqueous saturation (Overlayer, HBL, and underlayer) S A 1, 0.56, and 1
Hydrate saturation S H 0.44
Calculation model for capillary pressure P c G W P c G W = P 0 [ ( S A S i r A 1 S i r A ) 1 / ϑ 1 ] 1 ϑ
P 0 and ϑ 1 × 10⁵ Pa and 0.45
Calculation model for relative permeability in aqueous and gaseous phases k r A ,   k r G k r A = ( S A S i r A 1 S i r A ) n , k r G = ( S G S i r G 1 S i r G ) n g
n ,   n g ,   S i r A , and S i r G 3.50, 3.50, 0.30, and 0.03
Table 2. Simulation scheme.
Scenario No.LF, mCF, D·cmPI, MPaTI, °CPP, MPaAnalysis Objective
1#[16, 20][30, 90][1.5, 7.5]Reference case
2#[10, 50]10020604.5The effect of LF (Section 3.1)
3#[10, 50][10, 1000]20604.5The effect of CF (Section 3.2)
4#[10, 50]100[16, 20]604.5The effect of PI (Section 3.4)
5#[10, 50]10020[30, 90]4.5The effect of TI (Section 3.4)
6#[10, 50]1002060[1.5, 7.5]The effect of PP (Section 3.5)
Disclaimer/Publisher’s Note: The statements, opinions and data contained in all publications are solely those of the individual author(s) and contributor(s) and not of MDPI and/or the editor(s). MDPI and/or the editor(s) disclaim responsibility for any injury to people or property resulting from any ideas, methods, instructions or products referred to in the content.