Article

Visual Localization for Deep-Sea Mining Vehicles During Operation

1
State Key Laboratory of Exploitation and Utilization of Deep-Sea Mineral Resources, Changsha Research Institute of Mining and Metallurgy Co., Ltd., Changsha 410012, China
2
College of Mechanical and Vehicle Engineering, Hunan University, Changsha 410082, China
*
Authors to whom correspondence should be addressed.
J. Mar. Sci. Eng. 2026, 14(8), 759; https://doi.org/10.3390/jmse14080759
Submission received: 18 March 2026 / Revised: 10 April 2026 / Accepted: 18 April 2026 / Published: 21 April 2026
(This article belongs to the Special Issue Advances in Underwater Positioning and Navigation Technology)

Abstract

Deep-sea mining operations demand continuous, drift-free positioning over multi-day missions—a requirement that traditional acoustic dead-reckoning systems struggle to meet due to cumulative error accumulation and frequent DVL bottom-lock loss in sediment plume environments. Inspired by Google Cartographer’s 2D grid mapping paradigm, we present a prior map-based visual localization framework that decouples offline mapping from real-time localization, fundamentally eliminating drift through absolute image registration against pre-built seabed mosaics. By integrating adaptive keyframe selection, Multi-Scale Retinex (MSR) enhancement, and the AD-LG deep feature matching architecture, our system constructs globally consistent seabed maps for absolute positioning. The framework leverages deformable convolutions and LightGlue to effectively mitigate challenges such as low texture and non-rigid distortion. Quantitative validation on tank simulation datasets demonstrates significant superiority over IMU-only and standard fusion schemes; qualitative deployment on real Pacific CCZ imagery confirms near-real-time operational feasibility on an embedded Jetson Orin NX platform. This system establishes visual navigation as a viable backup to acoustic systems, addressing a critical gap in deep-sea mining vehicle autonomy.

1. Introduction

1.1. Background and Engineering Needs of Deep-Sea Mining

The rapid development of new energy industries and high-end manufacturing has led to a continuously growing global demand for key strategic metals such as cobalt, nickel, and manganese. However, high-grade terrestrial deposits are becoming depleted, with their extraction costs and environmental constraints increasing. Consequently, deep-sea polymetallic nodule resources have gradually become a key development target in the field of international marine engineering. For instance, the polymetallic nodule fields in the Clarion–Clipperton Zone of the Pacific Ocean, with water depths typically ranging from 4000 to 6000 m, represent one of the most commercially promising deep-sea mineral resource areas [1].
In a typical pipe-lifting mining system, the deep-sea mining vehicle is responsible for core tasks such as field cruising, nodule collection, and local operation planning. The navigation and positioning accuracy of the mining vehicle directly determines the efficiency of mining path planning, the repeat coverage rate, and the overall system energy consumption [2]. Therefore, developing a stable, reliable, and practically applicable positioning method for the deep-sea environment—where external satellite signals are unavailable and strong disturbances exist—is a key technology for achieving intelligent and autonomous operation of deep-sea mining systems.

1.2. Limitations of Traditional Acoustic Navigation Methods

Currently, deep-sea operational equipment mainly relies on acoustic navigation systems, such as Long Baseline, Ultra-Short Baseline, and Doppler Velocity Log-Inertial Navigation System integrated solutions. However, in practical deep-sea mining operations, these methods commonly face issues of declining accuracy and reduced reliability. On one hand, LBL systems require the deployment of acoustic transponder arrays across vast mining fields, resulting in extremely high installation and maintenance costs that hinder the operational flexibility required for commercial mining. On the other hand, the positioning accuracy of USBL systems significantly degrades with increasing water depth, often failing to meet the decimeter-level precision requirements for operations beyond 4000 m [3].
Doppler Velocity Log-Inertial Navigation System (DVL-INS) integration has become the mainstream solution, using bottom-referenced velocity measurements to constrain INS drift via Kalman filtering. However, performance critically depends on acoustic measurement quality. During mining operations, hydraulic collection mechanisms disturb seafloor sediments, generating high-concentration particle plumes that cause DVL bottom-lock loss This forces the integrated system into pure inertial dead-reckoning mode, where positioning error diverges at rates exceeding 0.5% distance traveled—accumulating to multi-meter errors over typical 8–12 h missions.

1.3. Visual Localization: Transitioning from SLAM to Map-Based Paradigm

Visual localization, as a passive sensing modality immune to acoustic multipath and signal loss, offers complementary advantages. However, traditional Simultaneous Localization and Mapping (SLAM) approaches—despite sophisticated sensor fusion and loop closure techniques—remain fundamentally limited by drift accumulation during long-duration operations. Recent advances in terrestrial robotics demonstrate the viability of prior map-based localization: Google Cartographer’s success in warehouse automation and autonomous driving relies on pre-built 2D, 3D maps for drift-free navigation [4].
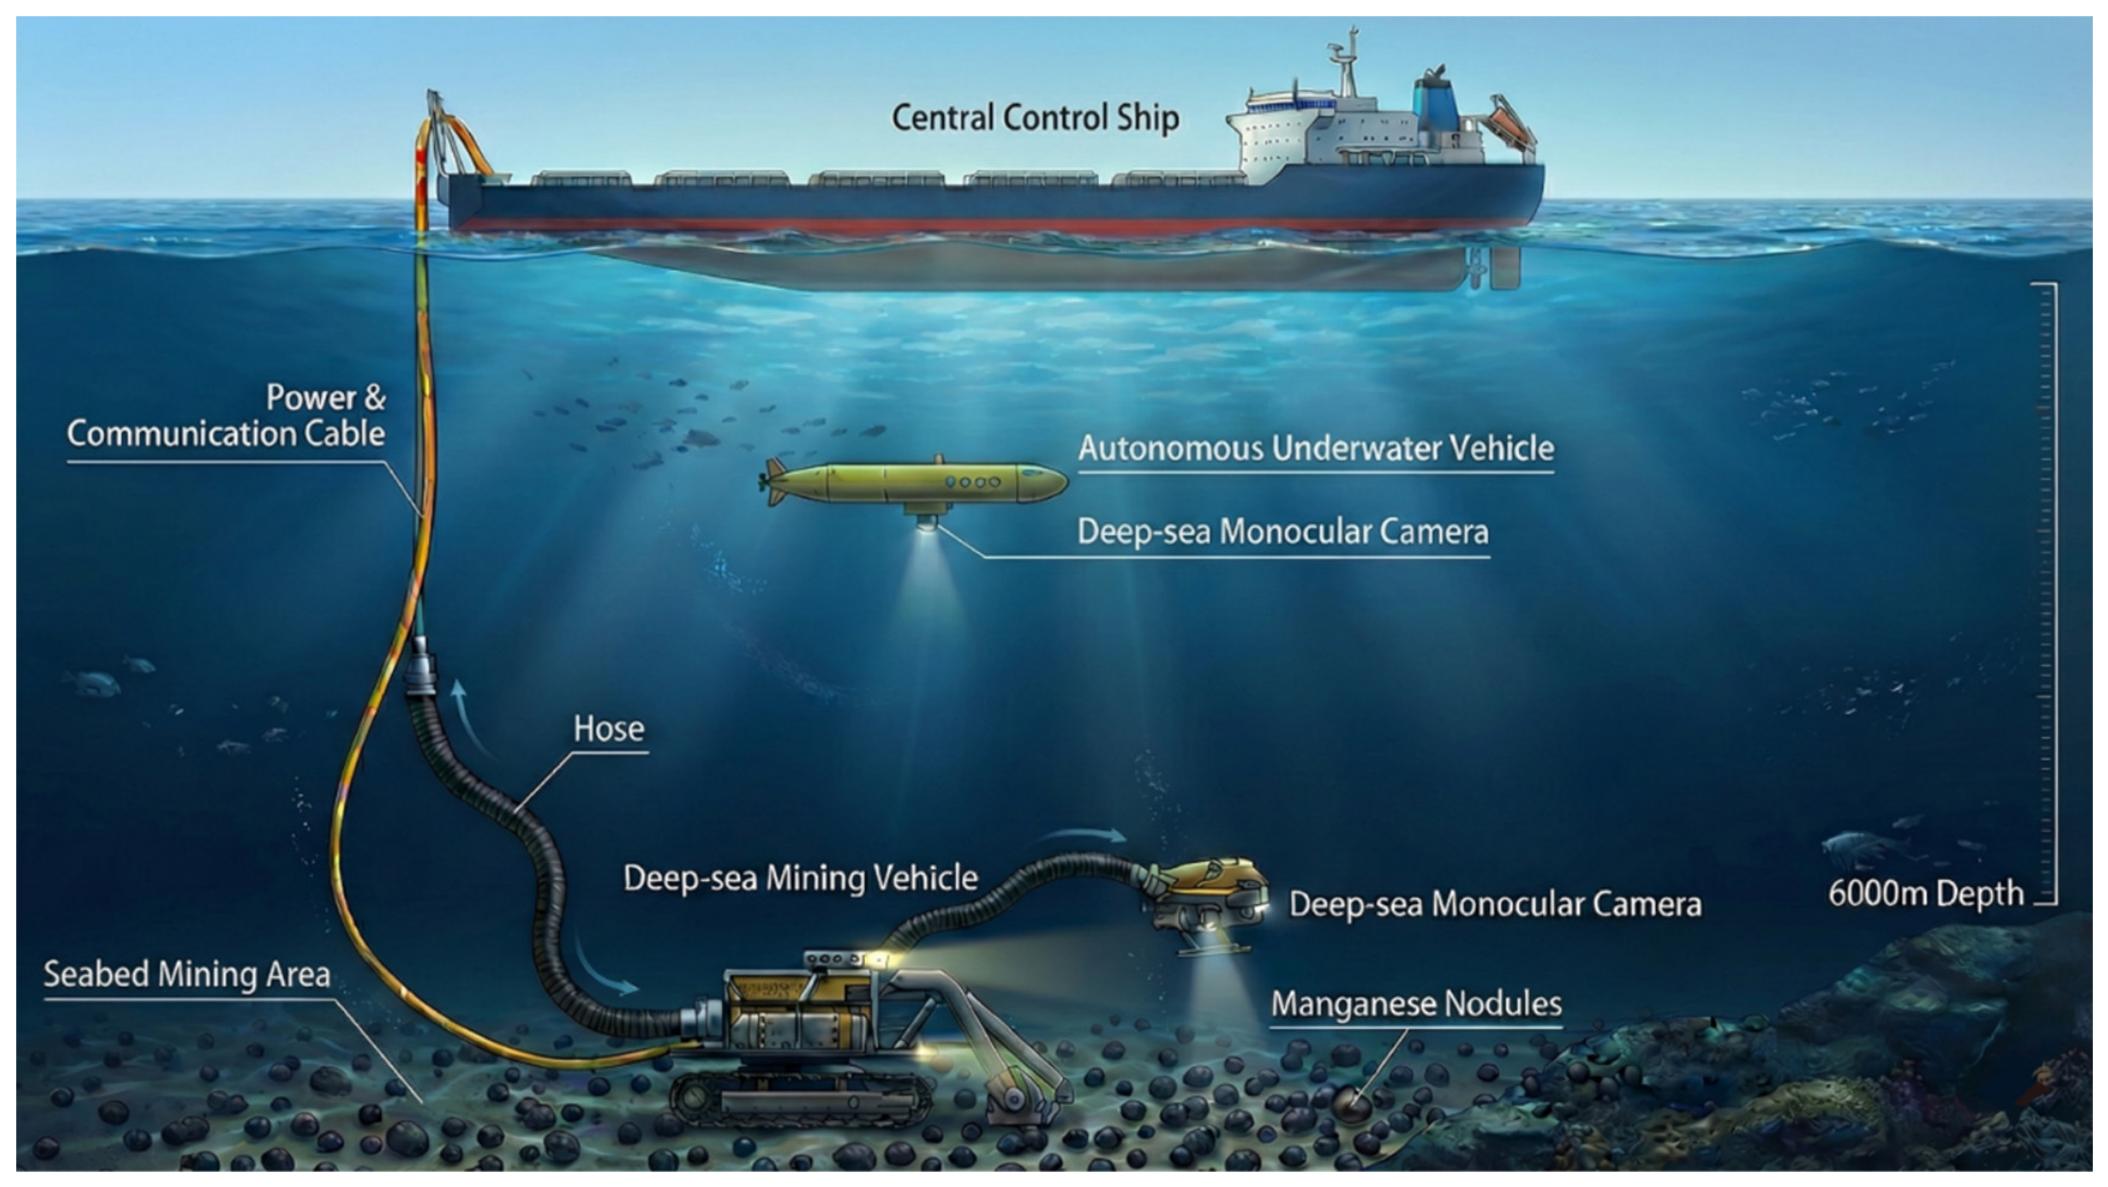
Unlike incremental SLAM that suffers from inevitable drift, our method adopts a “map-then-localize” paradigm inspired by Cartographer’s 2D grid mapping philosophy. While Cartographer successfully simplified indoor navigation by avoiding 3D complexity, we extend this concept to deep-sea mining: leveraging the inherently planar geometry of abyssal plains (slope < 2°), we construct a drift-free global mosaic serving as an absolute reference [5]. This strategy eliminates the cumulative error problem inherent in dead-reckoning systems and provides repeatable, verifiable positioning throughout multi-day operations—a critical requirement for commercial mining compliance and operational safety [6]. Figure 1 illustrates the overall architecture of the visual localization system for a deep-sea mining vehicle. Figure 2 shows a schematic diagram of the overall architecture of the deep-sea mining vehicle’s visual positioning system.
Translating this paradigm to deep-sea mining requires addressing unique challenges: (i) extreme lighting variations between mapping and localization phases due to artificial illumination differences; (ii) weak seafloor texture dominated by uniform sediment and repetitive nodule patterns; (iii) non-rigid image distortions from water refraction and flow turbulence; (iv) sediment plume degradation during active collection. Our approach tackles these through robust deep learning feature descriptors (ALIKED) combined with attention-based matching (LightGlue), ensuring reliable localization even under significant appearance variations [7].

1.4. Research Approach and Main Contributions

This work establishes a prior map-based visual localization framework for deep-sea mining vehicles, successfully translating the 2D cartographic principles of terrestrial SLAM into the challenging subsea domain. The main contributions of this work are as follows:
(1)
First application of AD-LG to deep-sea prior-map localization: We propose the AD-LG architecture by combining ALIKED’s deformable convolution feature extractor with LightGlue’s adaptive-depth Transformer matcher. To our knowledge, this is the first application of this architecture to prior-map-based visual localization in deep-sea nodule mining imagery, where non-rigid optical distortion and repetitive texture present challenges not addressed by existing benchmarks.
(2)
Map-then-localize paradigm for deep-sea mining: Inspired by Google Cartographer’s 2D grid mapping philosophy, we establish a ‘map-then-localize’ framework that fundamentally eliminates cumulative drift by decoupling offline map construction from real-time localization. This paradigm has not been previously demonstrated in deep-sea mining vehicle navigation.
(3)
Adaptive keyframe extraction: We adapt a Laplacian variance combined with optical flow constraint strategy to the specific redundancy and motion characteristics of deep-sea AUV video, validated quantitatively against four comparison methods.
(4)
MSR image enhancement: The Multi-Scale Retinex algorithm is selected and parameterised for the blue–green colour cast and uneven illumination characteristics of deep-sea mining imagery, with comparative validation against DCP and CLAHE.
(5)
Global bundle adjustment with multi-band blending: Standard BA and multi-band blending techniques are integrated into the pipeline and validated for drift correction in long-sequence deep-sea mosaicking.

2. Review of Related Work

2.1. Current State of Deep-Sea Navigation and Positioning Technologies

Acoustic navigation has dominated underwater positioning for decades due to electromagnetic signal attenuation in seawater [8]. LBL systems provide the highest absolute accuracy (0.1–1 m) through trilateration using calibrated seabed transponder arrays. However, deployment logistics—requiring ship-based array installation and acoustic calibration surveys—render LBL cost-prohibitive and inflexible for commercial mining’s dynamic operation zones. USBL systems offer simplified deployment by mounting transducer arrays on surface vessels, but accuracy degrades linearly with slant range, failing to guarantee decimeter-level precision at >4 km depths [9].

2.2. Advances in Underwater Visual Mapping and Localization

Visual mapping and localization technologies have developed relatively mature theories and system frameworks in the field of terrestrial robotics. However, their application in underwater environments still faces numerous challenges. Early underwater visual research often employed strip-based image mosaicking methods. These methods achieved seabed image mosaics through optical flow or correlation-based matching. However, they lacked an effective global error constraint mechanism, making it difficult to address the cumulative drift problem inherent in long-sequence image stitching [10].
With advancements in computational power, feature-based visual SLAM methods have been gradually introduced to underwater scenes [11]. Nevertheless, due to issues like low contrast, sparse textures, and suspended particle interference in underwater images, traditional handcrafted features exhibit insufficient stability and repeatability [12]. In recent years, factor graph optimization and loop closure detection mechanisms have been incorporated into underwater visual SLAM [13]. These enhancements have effectively improved the global consistency of the constructed maps. However, in extreme environments like deep-sea mining characterized by strong disturbances and weak textures, existing methods still face the risk of localization failure.

2.3. Development of Feature Extraction and Matching Methods

Feature extraction and matching are core components of a visual localization system. Traditional methods rely on local gradient or intensity statistics. Their performance significantly declines under conditions of illumination variation and image blur. Deep learning methods learn more robust feature representations in a data-driven manner and have demonstrated superiority in various complex scenes [14].
The recently proposed ALIKED feature extraction network introduces deformable convolutions. This allows the network’s receptive field to adapt to changes in local image geometry, granting it stronger geometric adaptability in non-rigid distortion scenarios. The LightGlue matching network is based on a Transformer architecture [15]. It incorporates attention mechanisms and adaptive inference depth, significantly reducing computational overhead while maintaining high matching accuracy [16]. The combination of these two offers a new technical pathway for achieving highly robust and efficient underwater visual matching on embedded platforms [17].

2.4. Underwater Image Enhancement Methods

Existing approaches to underwater image processing are broadly categorized into non-physical (image enhancement) and physical model-based (image restoration) methods [18]. The first category relies on statistical adjustments, such as histogram equalization, to improve visual contrast [19]. However, these methods often suffer from over-enhancement artifacts, including color distortion and noise amplification [20]. In contrast, physical model-based methods directly address the underlying optical physics [21]. By compensating for specific attenuation and scattering effects derived from underwater light propagation models, these approaches provide a more physically interpretable and geometrically consistent reconstruction [22].
The Multi-Scale Retinex method is based on the theory of color constancy. It estimates the illumination component and separates the reflection component through multi-scale Gaussian filtering [23]. This approach achieves a good balance between color restoration and detail enhancement in underwater scenes [24]. Therefore, this paper selects the MSR method as the image enhancement module for the visual front-end [25]. The aim is to provide more stable and higher-quality image input for the subsequent feature extraction and matching stages [26].
The above review reveals three limitations that motivate the present work. First, acoustic navigation methods (Section 2.1) are subject to cumulative drift and performance degradation during sediment plume events, with DVL bottom-lock loss forcing the system into pure inertial mode where errors accumulate at over 0.5% of distance travelled. Second, underwater visual SLAM approaches (Section 2.2) inherit the fundamental limitation of drift accumulation during long-duration operations: loop closure detection becomes unreliable in deep-sea mining environments due to the near-featureless, repetitive texture of nodule fields, and the high computational cost of online mapping conflicts with embedded platform constraints. Third, while prior map-based localization methods (Section 2.3) eliminate online drift by registering against a pre-built reference, existing work has focused on structured terrestrial environments or shallow-water scenes; to our knowledge, no prior study has validated learning-based local feature matching for prior-map localization in deep-sea polymetallic nodule imagery, where non-rigid optical distortion and uniform blue–green colour cast constitute distinct challenges. The proposed framework directly addresses these three limitations by adopting a pre-built seabed mosaic as the absolute reference, applying AD-LG feature matching optimised for deep-sea conditions, and validating real-time deployment on an embedded platform under simulated acoustic failure.

3. Method and System Architecture

3.1. Overall System Framework

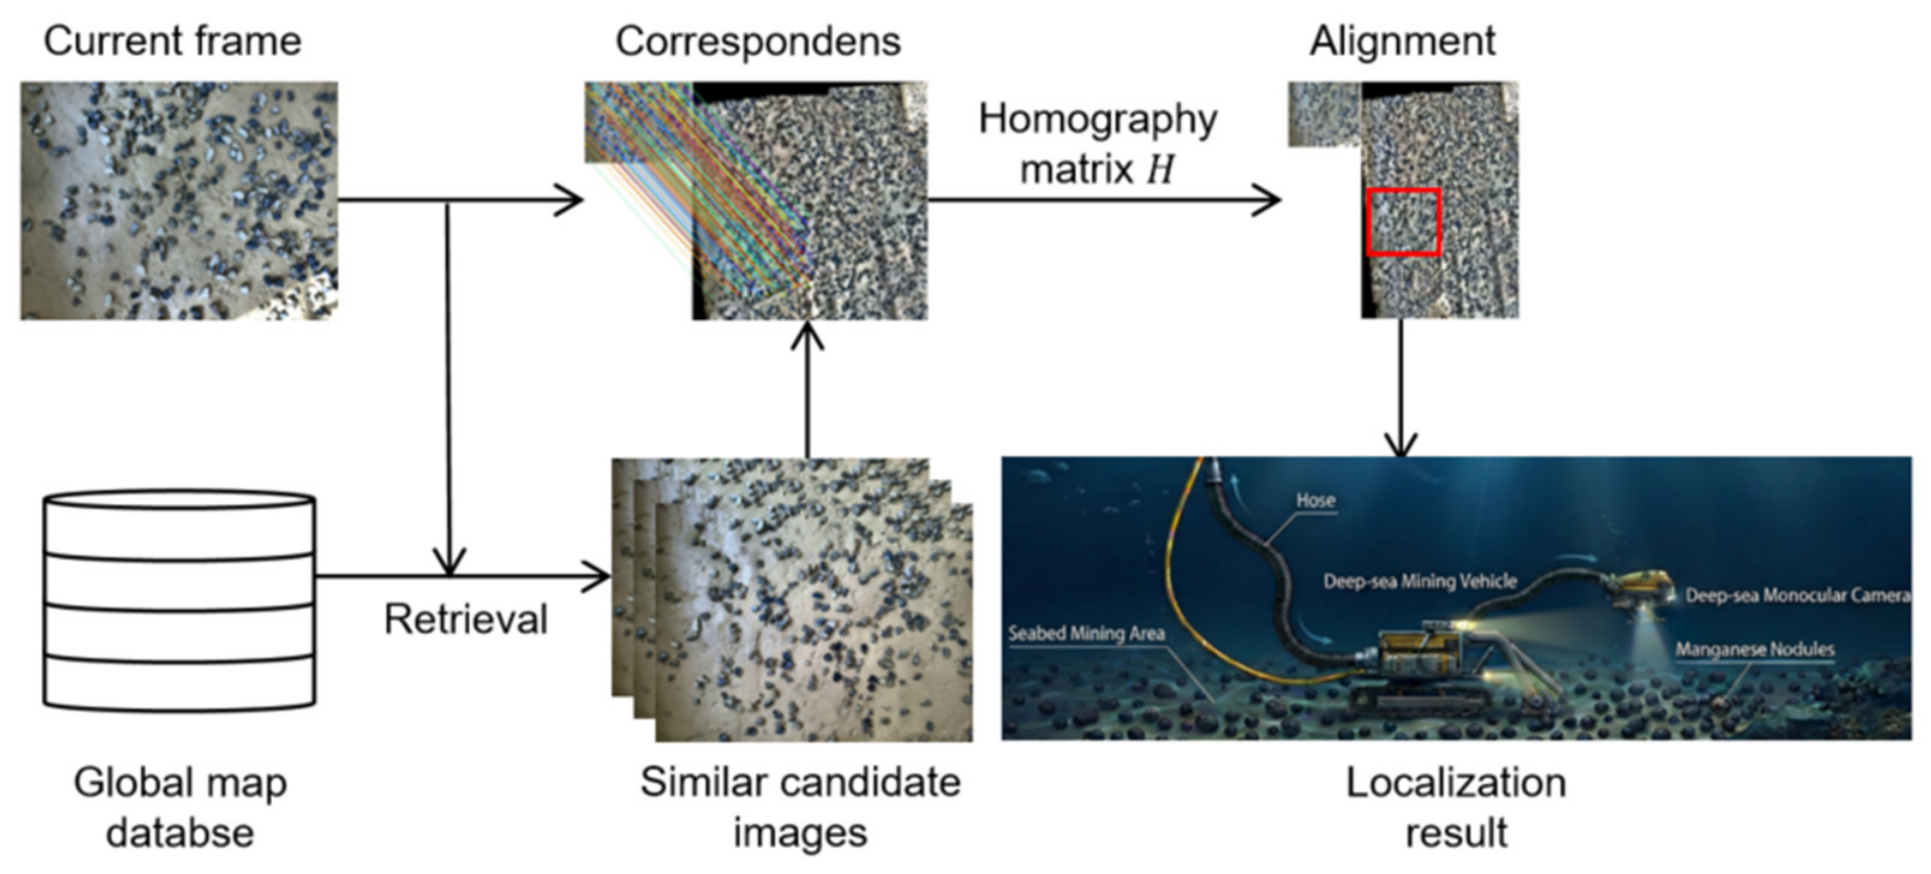
The proposed method adopts a ‘local-to-global’ localization strategy, structured around a pipeline that progresses from data reduction to final positioning. Initially, the system mitigates redundancy by performing adaptive keyframe extraction on the raw video stream, followed by visual quality improvement via MSR enhancement [27]. The core feature extraction and matching are handled by the AD-LG architecture, which serves as the foundation for constructing a high-precision, globally consistent seabed map through bundle adjustment and multi-band blending [28]. Ultimately, absolute positioning is achieved by registering real-time local imagery against this pre-built global reference [29]. The overall architecture is illustrated in Figure 3.

3.2. Coordinate System Definitions and Imaging Geometry Model

To achieve high-precision visual localization, this paper first provides unified definitions and modeling for the coordinate systems and imaging geometry involved in the system. The system primarily includes the following coordinate systems: the world coordinate system {W}, the body coordinate system {B}, the camera coordinate system {C}, the image coordinate system, and the pixel coordinate system. The world coordinate system uses a local reference point within the mining area as its origin, describing the global positions of both the seabed map and the mining vehicle. The body coordinate system is fixed at the buoyancy center of the DSMV, describing the vehicle’s own motion state. The camera coordinate system originates at the camera’s optical center, and its pose is linked to the body coordinate system via a pre-calibrated extrinsic matrix [30].
In the deep-sea environment, cameras are typically housed within pressure-resistant enclosures, and light must pass through multiple media (“water-glass-air”) causing refraction. Considering the relatively stable operating altitude and the common vertical downward-facing camera configuration, this paper adopts an equivalent pinhole model. The complex refraction effects are approximated and absorbed into the camera’s intrinsic matrix for modeling. The projection of a 3D space point P c   =   [ X x , X y , X Z , ] T onto the pixel plane P   =   [ u , v ] T satisfies [31]:
s [ U V 1 ] = [ f x 0 c x 0 f y c y 0 0 1 ] [ X c Y c Z c ] =   K P c
where s is a scale factor, and K is the camera intrinsic matrix.
Combined with the camera-to-seabed height h provided by an altimeter, the mapping between pixel scale and real physical scale can be further established:
Size   =   N   ×   h   ×   W sensor f   ×   W img
Here, W s e n s o r is the physical width of the sensor, W i m g is the image width in pixels, and f is the camera focal length. This formula serves as the basis for subsequent construction of a map with true geographic scale [21,32].

3.3. Adaptive Keyframe Extraction Strategy

Deep-sea mining video data possesses high temporal redundancy. Processing all video frames directly imposes a significant computational burden. Furthermore, excessively short baselines between adjacent frames can degrade the geometric accuracy of motion estimation. To address this, this paper proposes an adaptive keyframe extraction method that combines image sharpness assessment and motion constraints.
First, an image sharpness evaluation metric based on the Laplacian operator is introduced. This metric value drops significantly when image blur occurs due to vehicle vibration or rapid motion. By setting an adaptive threshold, blurred frames can be filtered out, ensuring that keyframes entering subsequent stages possess sufficient texture detail. For an input image I ( x , y ) , its Laplacian response 2 I is defined as:
2 I ( x , y )   =   2 I x 2   +   2 I y 2
The “blur score” S blur is defined as the variance of the Laplacian response image:
S blur   =   1 N x , y ( L ( x , y ) μ ) 2
A larger variance indicates sharper edges and higher image clarity, while a smaller value indicates more blur. In experiments, a threshold S th is set, and only frames with S blur   >   S th are retained.
Second, to ensure sufficient spatial overlap between adjacent keyframes (necessary for reliable matching), a motion constraint based on optical flow is introduced. The Lucas-Kanade optical flow method is used to track the displacement of feature points between consecutive frames. A new keyframe is triggered for extraction only when the cumulative displacement exceeds a preset threshold. This strategy converts non-uniform sampling in the time domain into approximately uniform sampling in the spatial domain, maintaining uniform map coverage even when the vehicle’s speed varies [33].

3.4. Underwater Image Enhancement Based on MSR

To address the severe blue–green color cast and low contrast in deep-sea images, this paper employs the Multi-Scale Retinex image enhancement algorithm in the preprocessing stage. Since illumination typically varies at low frequencies while reflectance contains high-frequency details, illumination can be estimated via Gaussian convolution [34].
Retinex theory decomposes an observed image into an illumination component L and a reflectance component R:
I ( x , y ) = L ( x , y ) R ( x , y )
Since illumination typically varies at low spatial frequencies while reflectance contains high-frequency details, illumination can be estimated via Gaussian convolution. The single-scale Retinex output in the log domain is:
r σ ( x , y ) = l o g I ( x , y ) l o g ( G σ I ( x , y ) )
where G σ is a Gaussian kernel with standard deviation σ and denotes convolution. The Multi-Scale Retinex extends this to a weighted combination across K scales:
R M S R ( x , y ) = k = 1 K w k [ l o g I ( x , y ) l o g ( G σ k I ( x , y ) ) ]
In this paper, three scales are used: σ = {15,80,250} with equal weights w k = 1 / 3 . The small scale (σ = 15) preserves nodule edge detail and high-frequency texture; the medium scale (σ = 80) corrects uneven illumination from the AUV lighting source, whose effective coverage corresponds approximately to one-third of the image area at typical operating altitudes; the large scale (σ = 250) corrects the global blue–green colour cast characteristic of deep-sea imagery. These scale values were selected empirically by evaluating UIQM and average gradient scores across candidate values on the UIEB severely-degraded image subset.
Since each colour channel is processed independently in MSR, the output may exhibit colour over-saturation or greyscale collapse due to disruption of the inter-channel ratio. A colour-restoration step is therefore applied:
I e n h a n c e d c ( x , y ) = C [ I c c I c ( x , y ) ] R M S R ( x , y )
where c indexes the colour channel (R, G, B) and CC
C is a gain coefficient set to 6 in our implementation to balance colour saturation. This step preserves the original inter-channel ratio while applying the MSR-derived luminance correction, effectively restoring colour balance without introducing artificial hues.

3.5. Feature Extraction and Matching Based on the AD-LG Architecture

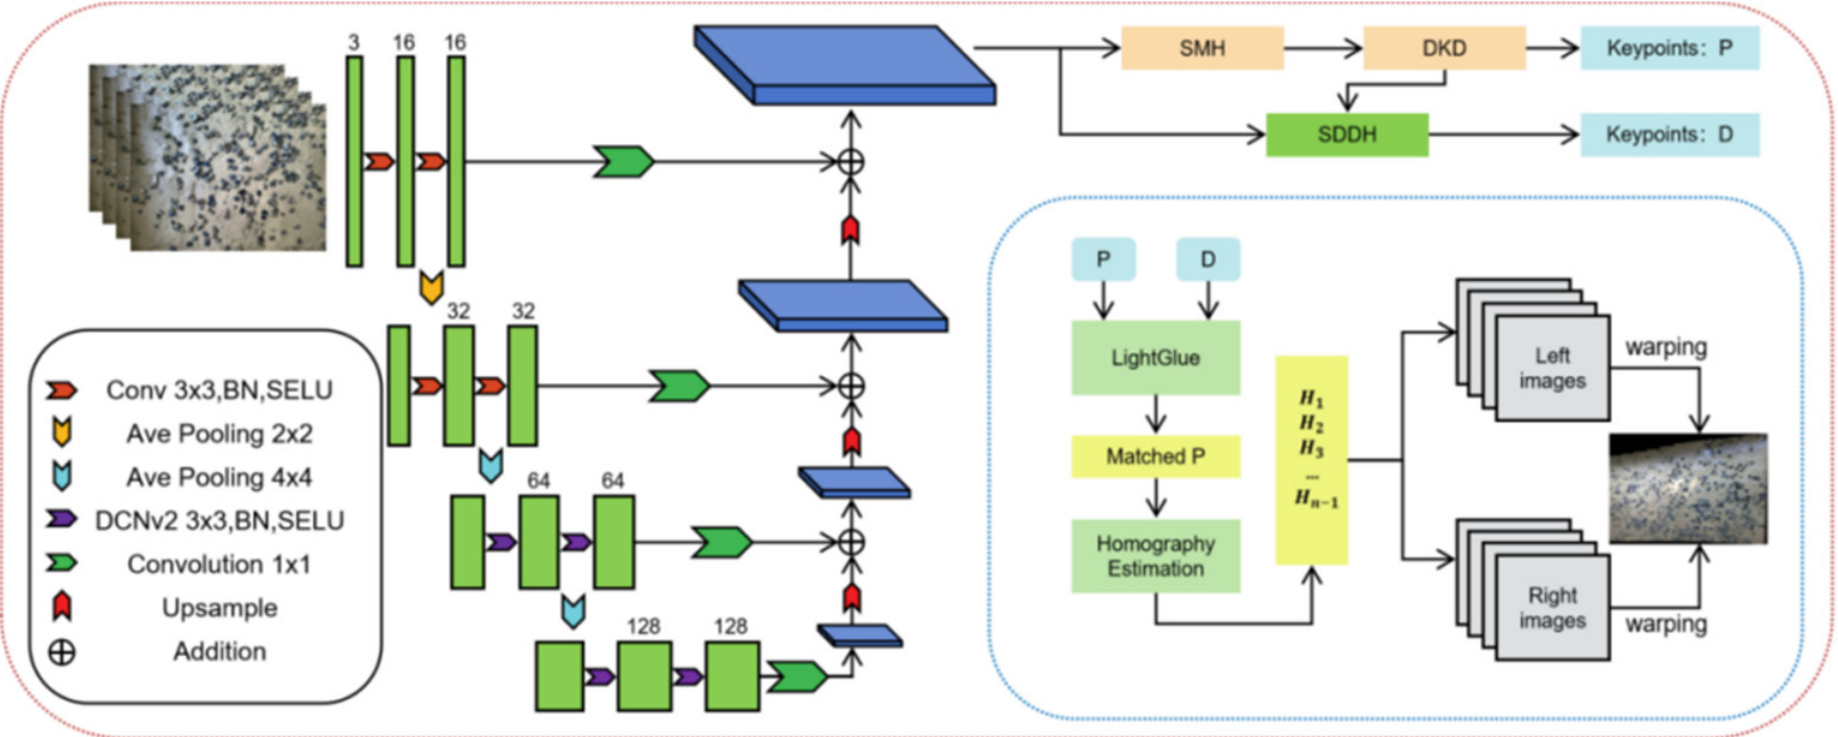
To address the challenges of weak textures and non-rigid distortions in the deep-sea environment, this paper constructs an AD-LG feature matching architecture using the ALIKED feature extraction network and the LightGlue matching network. Its structure is shown in Figure 4.
The core of the ALIKED network is the introduction of deformable convolutions. Unlike traditional convolutions that use a fixed, regular sampling grid, the sampling locations in deformable convolutions can adaptively shift based on the input image content. This allows the network to better adapt to local geometric deformations caused by water refraction and subtle seabed topography changes, thereby extracting more repeatable and stable feature points.
The LightGlue matching network is a lightweight matcher based on the Transformer architecture. It takes the feature points and their descriptors from two images as input. The network models the contextual relationships among feature points within a single image via a self-attention mechanism and establishes correspondences between feature points across the two images via a cross-attention mechanism. A key feature of LightGlue is its “adaptive pruning” and “early stopping” mechanisms. The network predicts a matching confidence for each feature pair and can halt deep computation for a pair early once sufficient confidence is reached. This significantly improves computational efficiency while maintaining high matching accuracy, making it particularly suitable for deployment on embedded platforms like Jetson.

3.6. Global Map Construction and Bundle Adjustment

After obtaining high-quality inter-frame matches, this paper first performs initial image stitching based on a homography model to create a coherent seabed visual map. However, in long-sequence stitching, minor errors in homography matrix estimation accumulate, leading to severe geometric drift and warping in the generated map.
To eliminate this cumulative error, global Bundle Adjustment is introduced. BA jointly optimizes all camera poses and the 3D coordinates of all observed feature points. The objective is to minimize the sum of reprojection errors for all feature points across all images, forming a large-scale nonlinear least squares problem:
E t o t a l = n = 1 N j X n u n j π ( H n X j ) Σ 2
where u nj is the observed coordinate of feature point j in frame n, π is the projection function, and Σ 2 is the Mahalanobis distance, used to suppress the influence of outliers. The Levenberg-Marquardt algorithm is employed to iteratively solve this optimization problem. The LM algorithm combines the advantages of gradient descent and Gauss-Newton methods, effectively handling potential ill-conditioning of the Hessian matrix and ensuring stable convergence of the optimization.
After completing the geometric global optimization, the map may still contain stitching seams and visual artifacts due to uneven illumination or color differences between images. To address this, multi-band blending technique is further applied. This method decomposes images into subbands of different spatial frequencies (typically achieved via a Laplacian pyramid). Low-frequency subbands are blended to ensure smooth transitions in illumination and color, while high-frequency subbands are blended to preserve texture and edge detail clarity. This frequency-separated processing effectively eliminates noticeable seams and ghosting, producing a visually continuous and natural global seabed map.

4. Experiments and Results Analysis

4.1. Experimental Data and Platform Configuration

To comprehensively validate the effectiveness of the proposed method, three types of datasets were used for testing: the public UIEB underwater image dataset, laboratory tank simulation data, and real sea trial data from the Pacific CCZ mining area. The primary experimental platform was the NVIDIA Jetson Orin NX embedded computing unit (NVIDIA Corporation, Santa Clara, CA, USA), running the Ubuntu 22.04 operating system, to evaluate the real-time performance of the algorithm under resource constraints. Details of the datasets are provided in Table 1.

4.2. Performance Evaluation of Adaptive Keyframe Extraction

To verify the effectiveness of the adaptive keyframe strategy in deep-sea mining videos, a quantitative evaluation was conducted on both tank simulation data and real CCZ video data. Evaluation metrics included: keyframe utilization (ratio of effective keyframes to total frames), data compression ratio, average sharpness score of extracted keyframes, and the robustness of the algorithm under different disturbance conditions. Table 2 shows comparison of results for non-keyframe extraction methods.

4.3. Comparative Analysis of Underwater Image Enhancement Effects

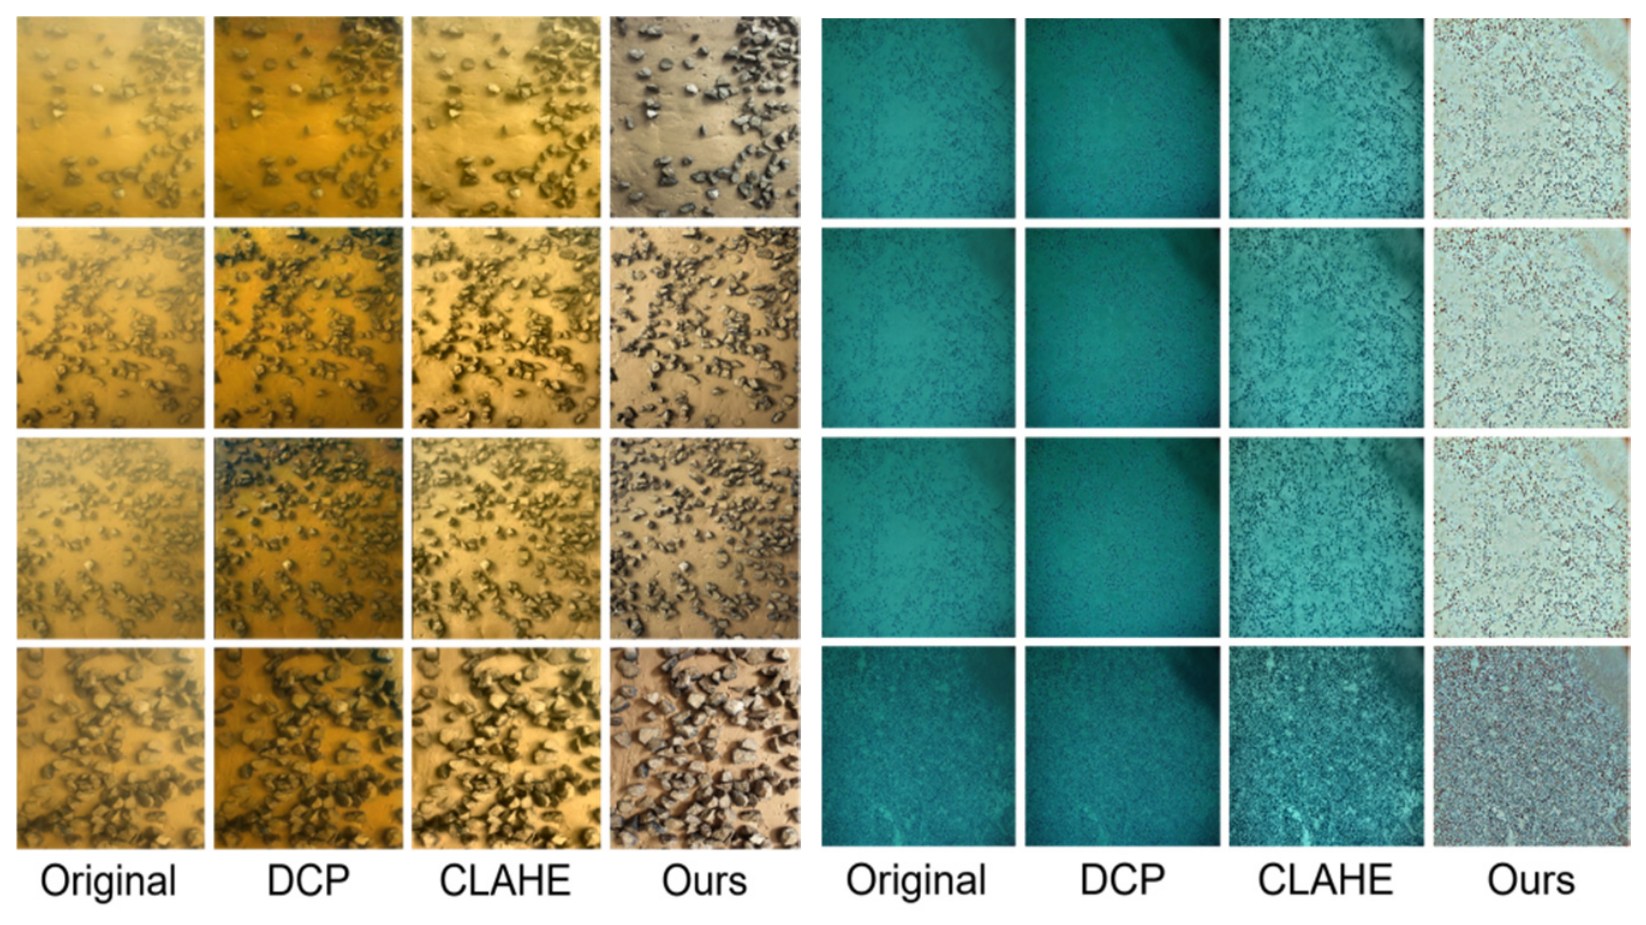
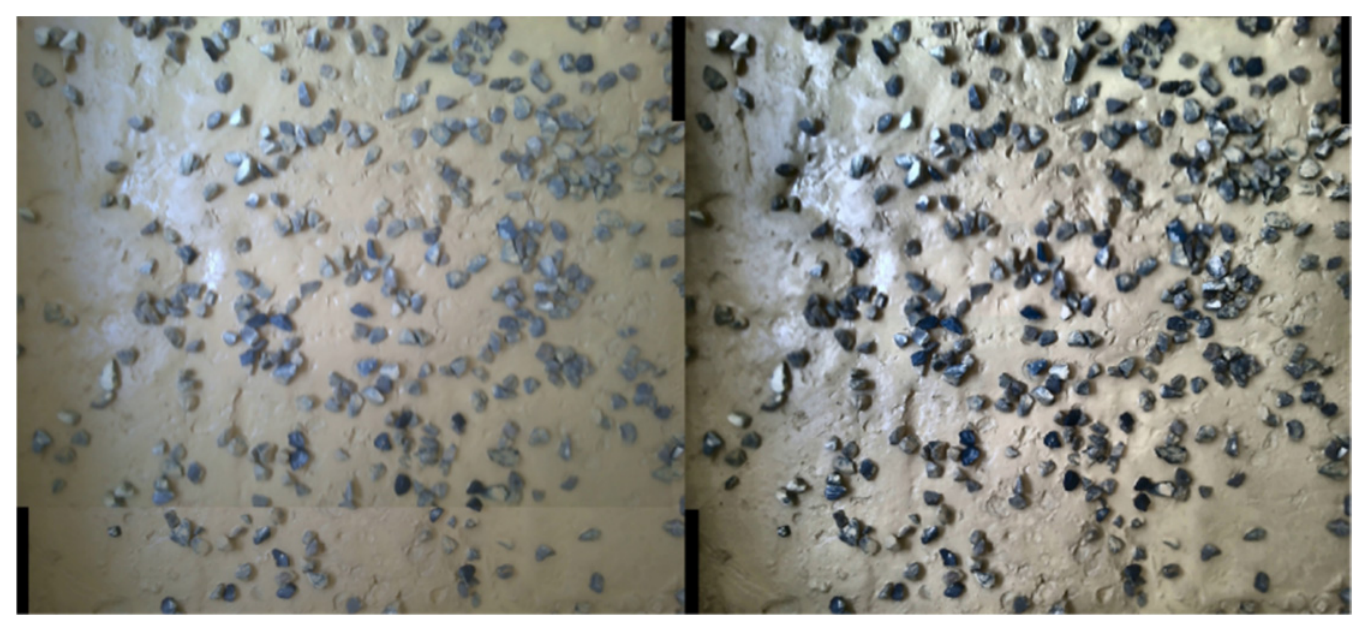
Figure 5 visually compares the enhancement results of the original image, the Dark Channel Prior method, the Contrast Limited Adaptive Histogram Equalization method, and our MSR method. Visually, the DCP method shows over-enhancement in some areas, while CLAHE improves contrast but amplifies suspended particle noise. In contrast, the MSR method better maintains the sharpness of nodule edges and texture continuity while suppressing background scattering, which is beneficial for stable subsequent feature extraction.
We conducted a quantitative evaluation of the enhancement effects using no-reference image quality metrics (UCIQE, UIQM, Information Entropy, Average Gradient) and full-reference metrics (PSNR, SSIM). The results are presented in Table 3.
The results show that the MSR method performs best in color correction (UIQM) and detail recovery (Average Gradient), and also achieves the highest information entropy, indicating richer image information content. Although its SSIM score is slightly lower.

4.4. Comparison of Feature Extraction and Matching Algorithms

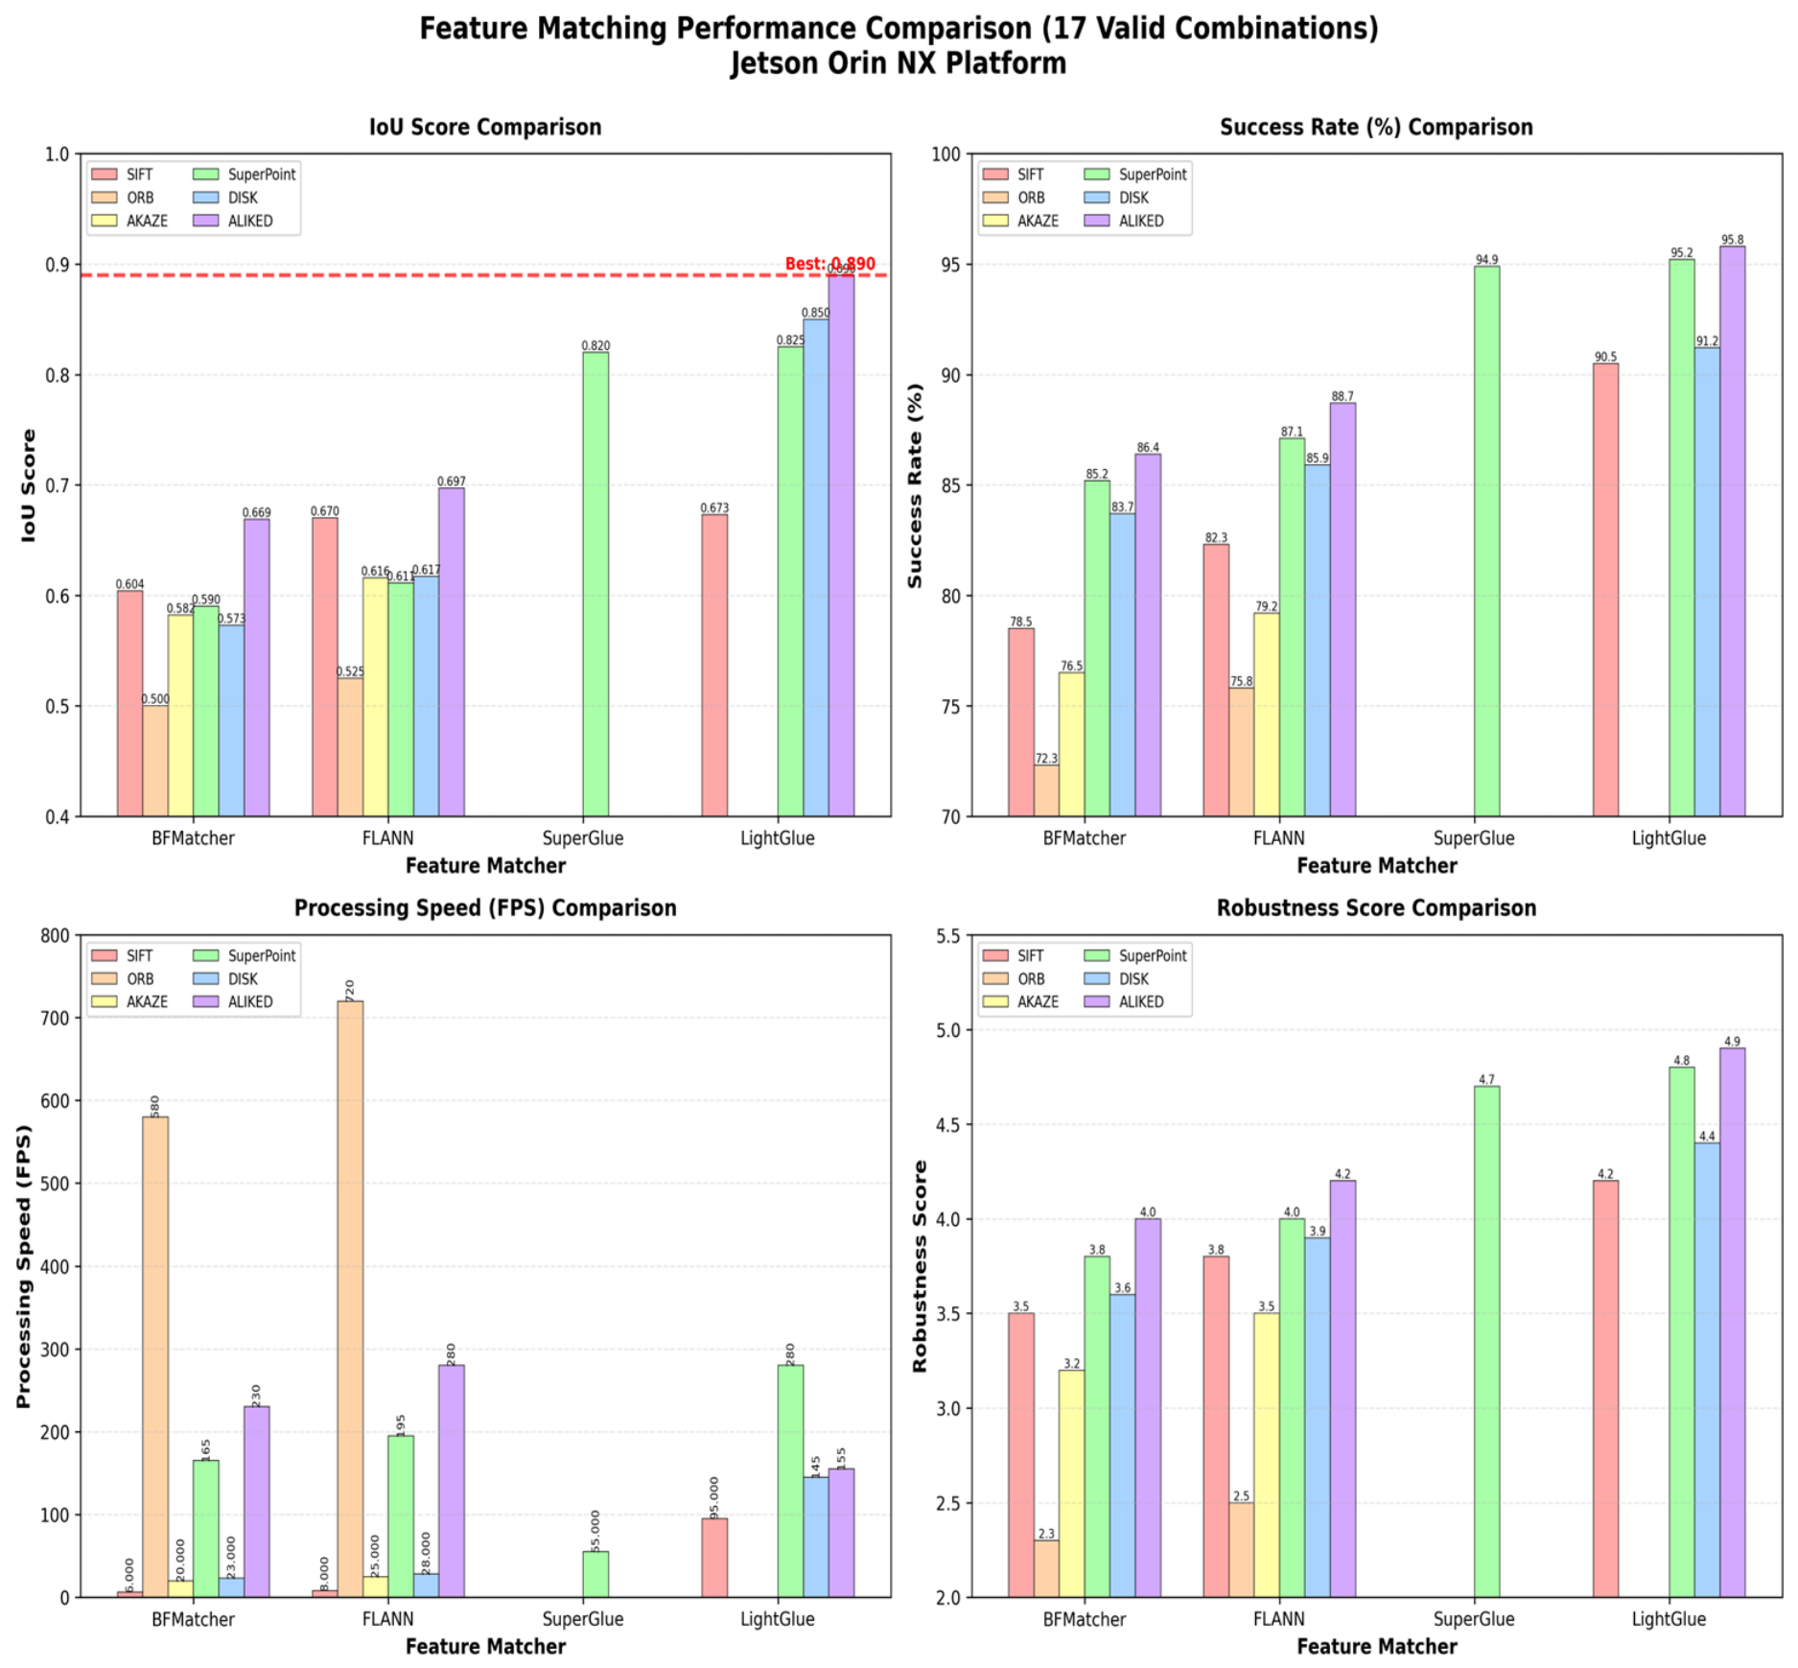
To verify the advantages of the AD-LG architecture, we compared several mainstream methods on the Jetson Orin NX 16G platform: traditional methods (SIFT + FLANN, ORB + BFMatcher) and deep learning methods (SuperPoint + SuperGlue, and our AD-LG). Evaluation metrics included: matching success rate (ratio of correct matches), Intersection over Union (IoU, for evaluating geometric consistency of matches), processing speed (frames per second, FPS), and a comprehensive robustness score. Figure 6 compares the overall performance of different feature extraction and matching methods.
The proposed AD-LG method demonstrates comprehensive advantages in deep-sea image matching tasks. It achieves the best performance in IoU (0.890), matching success rate (95.8%), and robustness score (4.9), while also ranking among the top methods in terms of processing speed. Compared to the traditional best method SIFT + FLANN, it improves IoU by 32.8%; compared to the current state-of-the-art SuperPoint + SuperGlue, it also improves by 8.5%. Experiments further show that Transformer-based matchers generally outperform traditional schemes, and the ALIKED detector, with its deformable convolution and adaptive receptive field design, consistently outperforms other deep learning detectors. In contrast, traditional handcrafted feature methods lag significantly behind due to their sensitivity to low-contrast textures and difficulty adapting to non-rigid distortions. Furthermore, AD-LG exhibits the most stable performance across various challenging scenarios (IoU standard deviation 0.063), and its cross-scenario robustness has significant practical value for long-duration deep-sea operations.
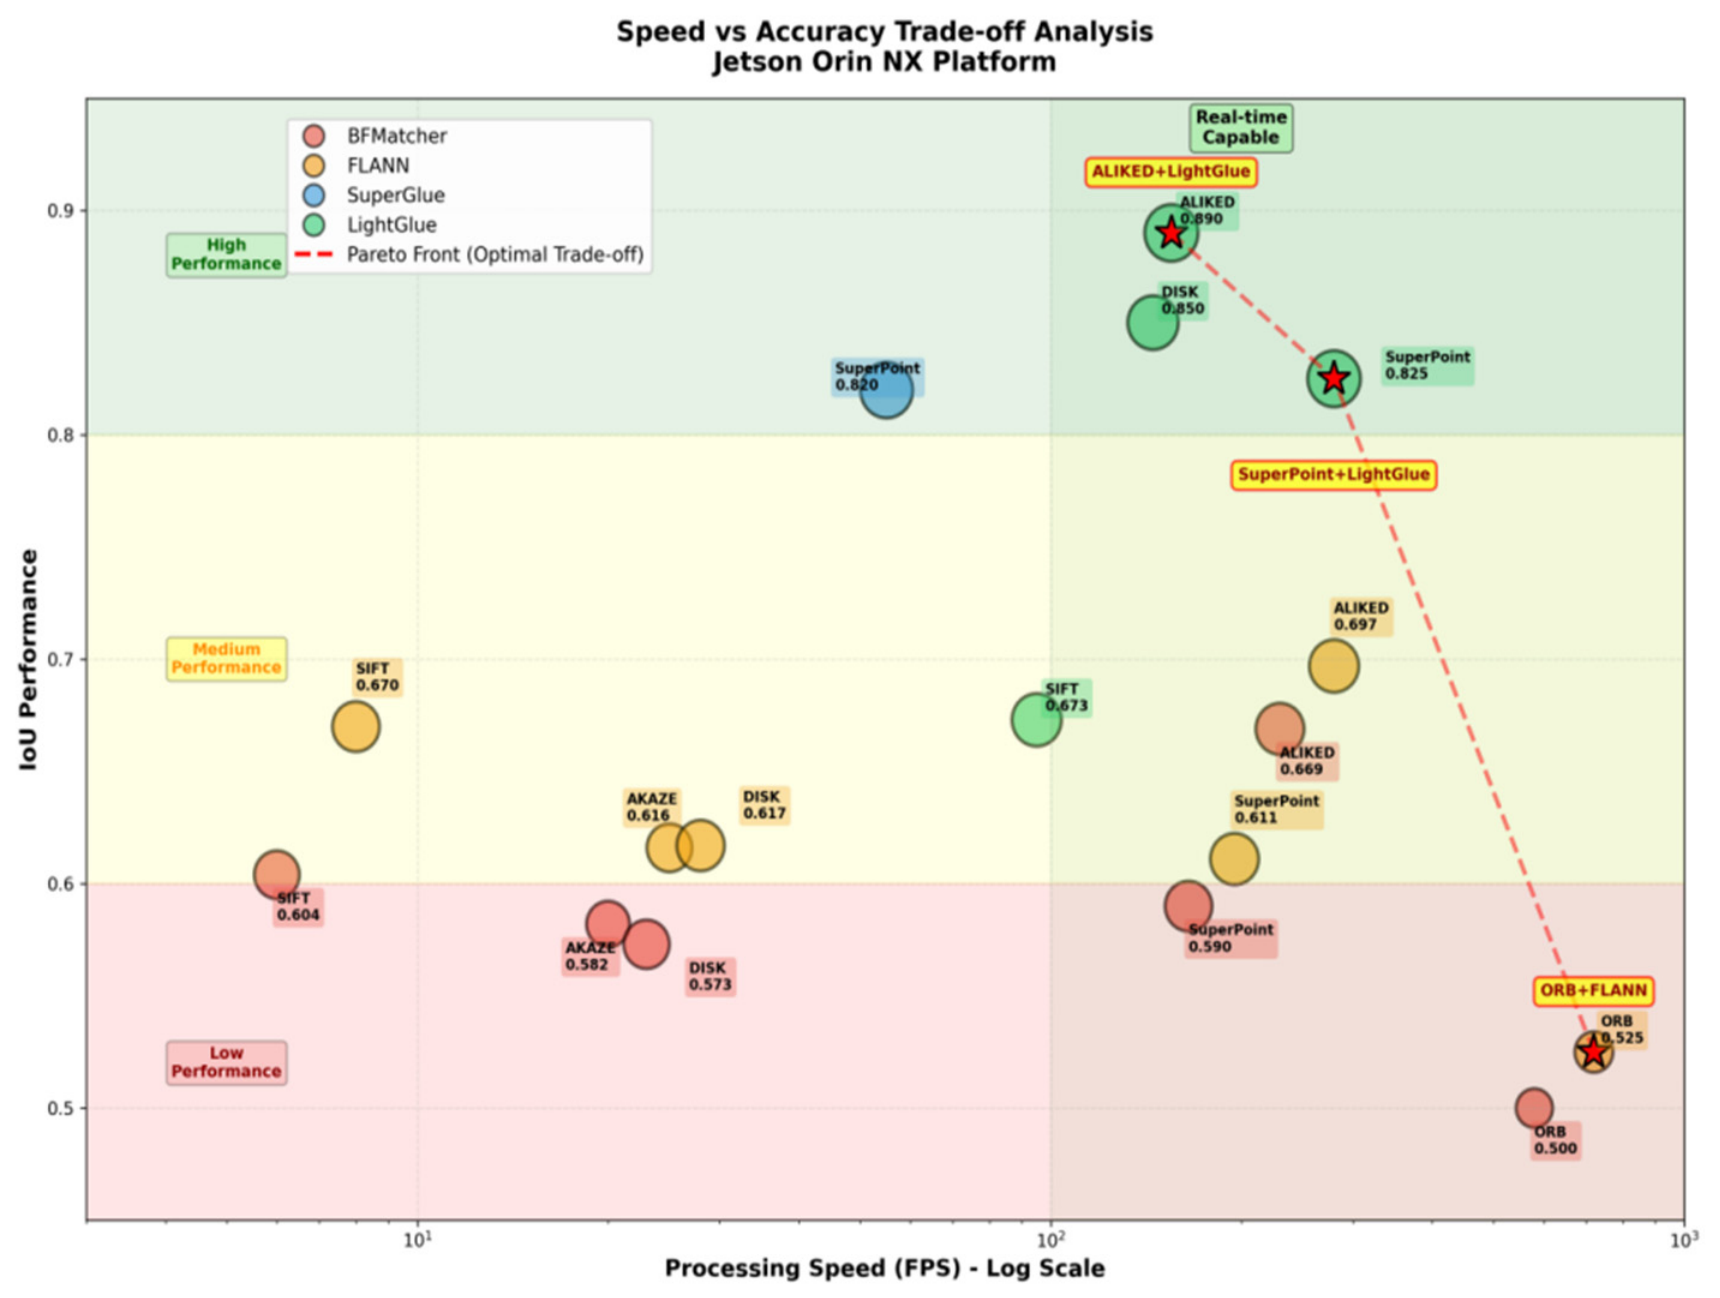
Figure 7 uses a scatter plot to simultaneously illustrate the trade-off between processing speed (horizontal axis, logarithmic scale) and IoU performance (vertical axis) for 17 methods in a two-dimensional space. The figure is divided into three performance regions, and the real-time capability threshold and Pareto front are marked. The dashed line in the diagram marks the Pareto front of the speed-accuracy trade-off, with methods above it representing the current optimal solution. AD-LG (ALIKED + LightGlue) sits at the top of this front, representing the globally optimal performance trade-off. Compared to SuperPoint + LightGlue, which is also on the front, AD-LG improves accuracy (IoU) by 7.9%, although its speed is slightly lower, it still far exceeds the real-time threshold. Compared to DISK + SuperGlue, AD-LG achieves a significant improvement in accuracy while simultaneously increasing processing speed by 16 times, demonstrating a significant advantage in both speed and accuracy.

4.5. Global Mapping Accuracy and Drift Correction Analysis

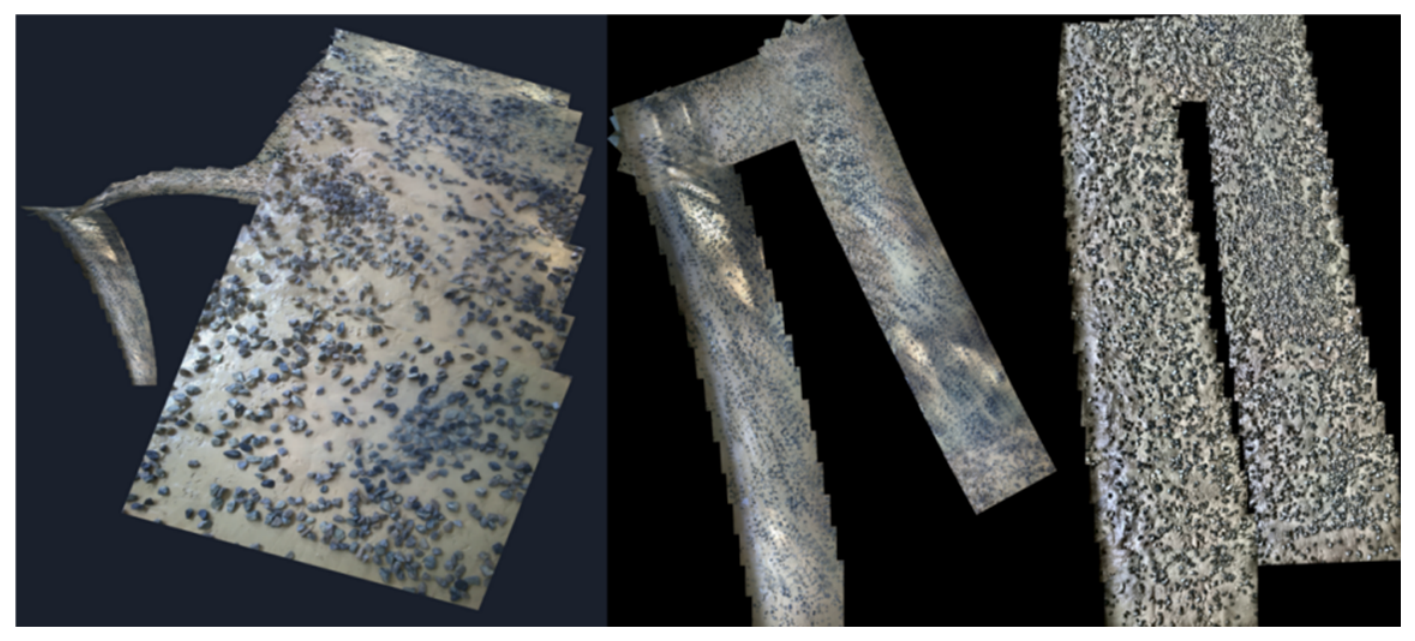
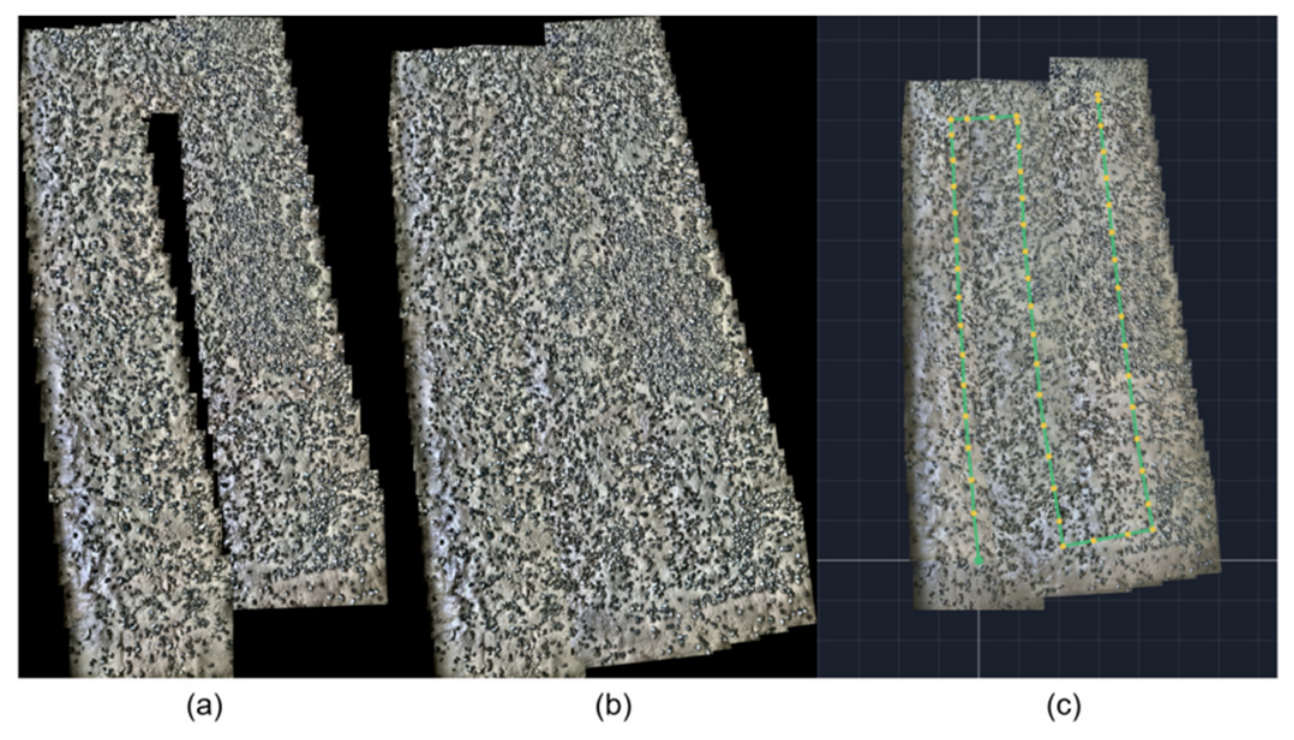
In long-sequence image stitching experiments, the initial map relying solely on inter-frame homography transformation exhibited significant geometric warping and cumulative drift. Figure 8 visually compares the maps before and after drift correction. It can be seen that after global BA optimization, the geometric structure of the map becomes straight and consistent, with the cumulative drift effectively eliminated.
Furthermore, Figure 9 compares the effects of traditional linear blending and the multi-band blending method adopted in this paper on stitching regions. The left side (linear blending) shows obvious seams and unnatural color transitions. The right side (multi-band blending) eliminates these artifacts, resulting in a visually more continuous and natural high-quality seabed visual map.

4.6. Motion Trajectory Recovery and Analysis

Based on the globally optimized map and camera poses from BA, we recovered the motion trajectory of the mining vehicle during operation. Figure 10 shows a comparison before and after optimization: (a) the global map without BA optimization, where the vehicle fails to form a loop closure when passing the same area again; (b) the point cloud map after global BA optimization, showing a clear loop closure; (c) the vehicle motion trajectory recovered from the optimized poses.
The comparison shows that global BA not only corrects the geometric structure of the map but also makes the recovered vehicle trajectory smoother and more consistent with physical motion laws. It can reflect the real yaw and drift of the vehicle caused by ocean currents, providing a reliable basis for operational assessment and path planning.

4.7. Local-to-Global Visual Localization Results

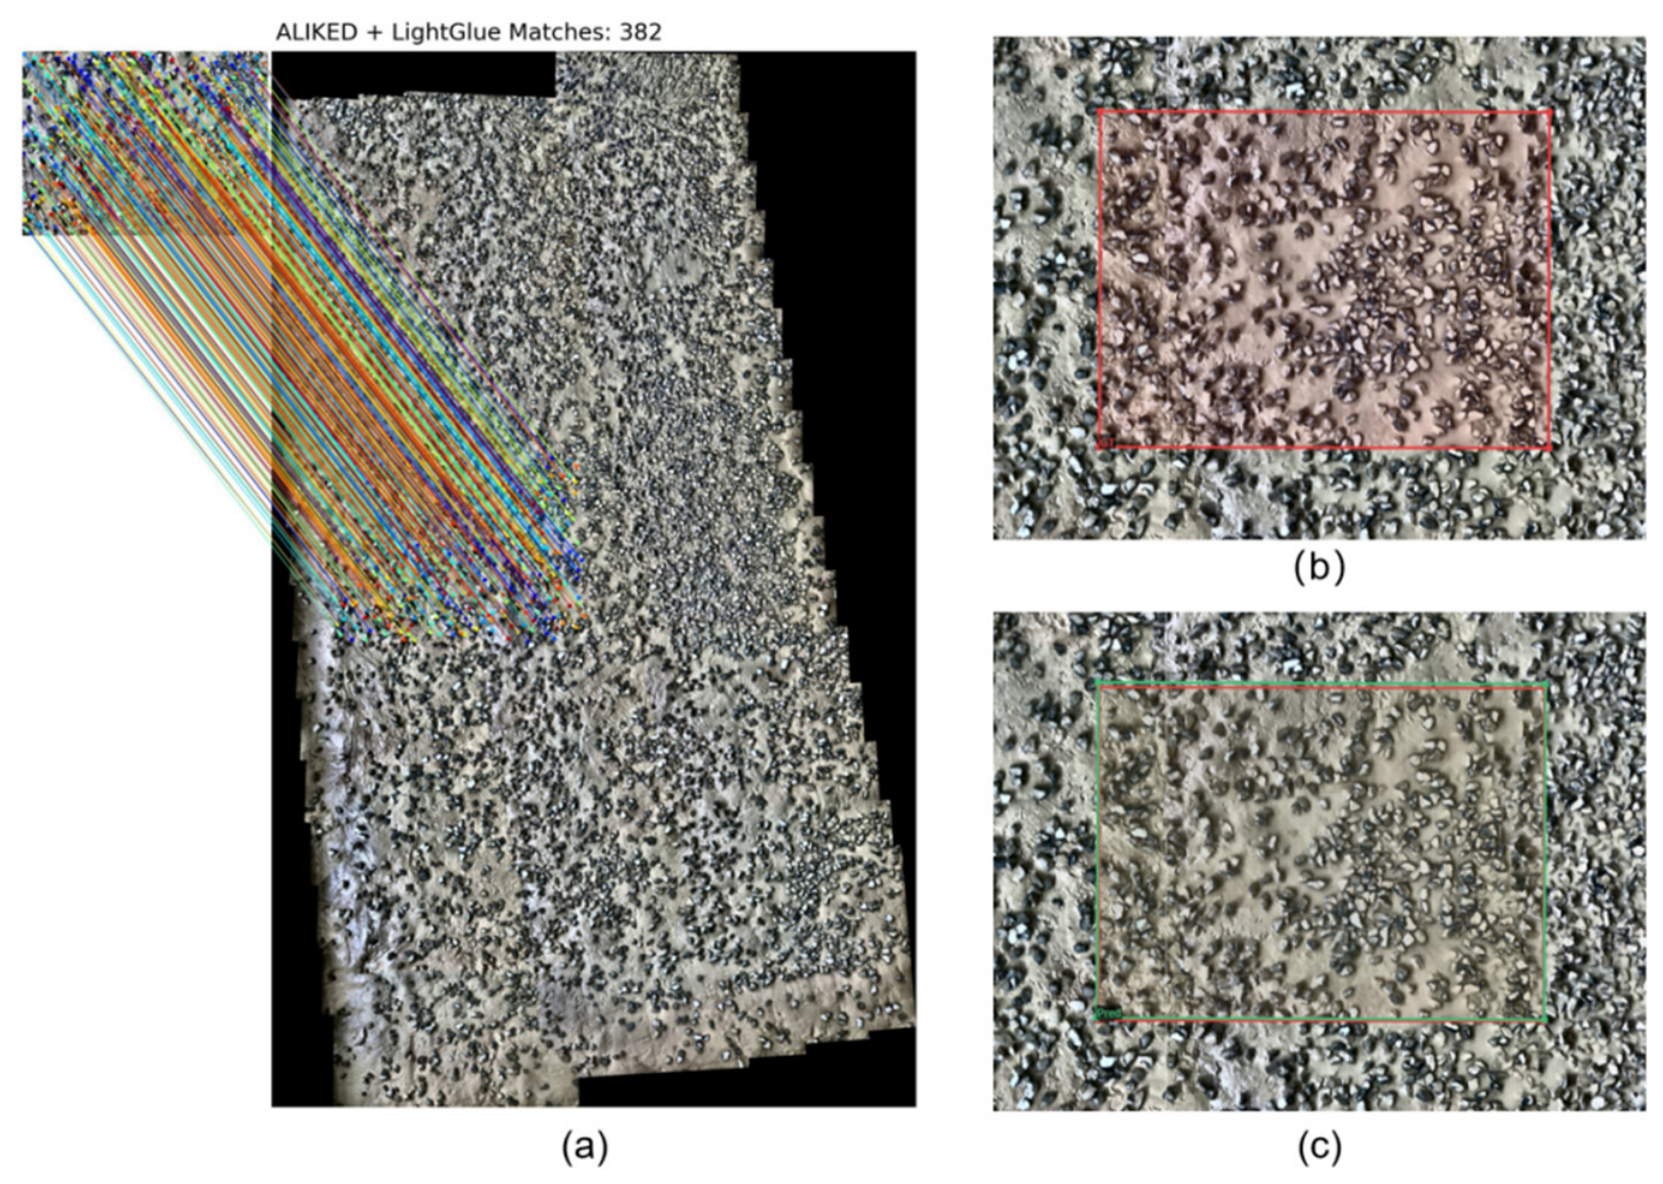
In the localization experiment, local images were randomly selected and matched with the global map. The homography of the matched region was calculated using the AD-LG model to estimate the vehicle’s position in the world coordinate system. A localization was considered successful when the IoU between the predicted bounding box and the ground truth box exceeded 0.5. Experimental results show that the IoU values for most test samples were significantly higher than this threshold, indicating stable and reliable localization results. Figure 11 shows the local-to-global visual localization matching results.

4.8. Precision Comparison Analysis with Traditional Localization Methods

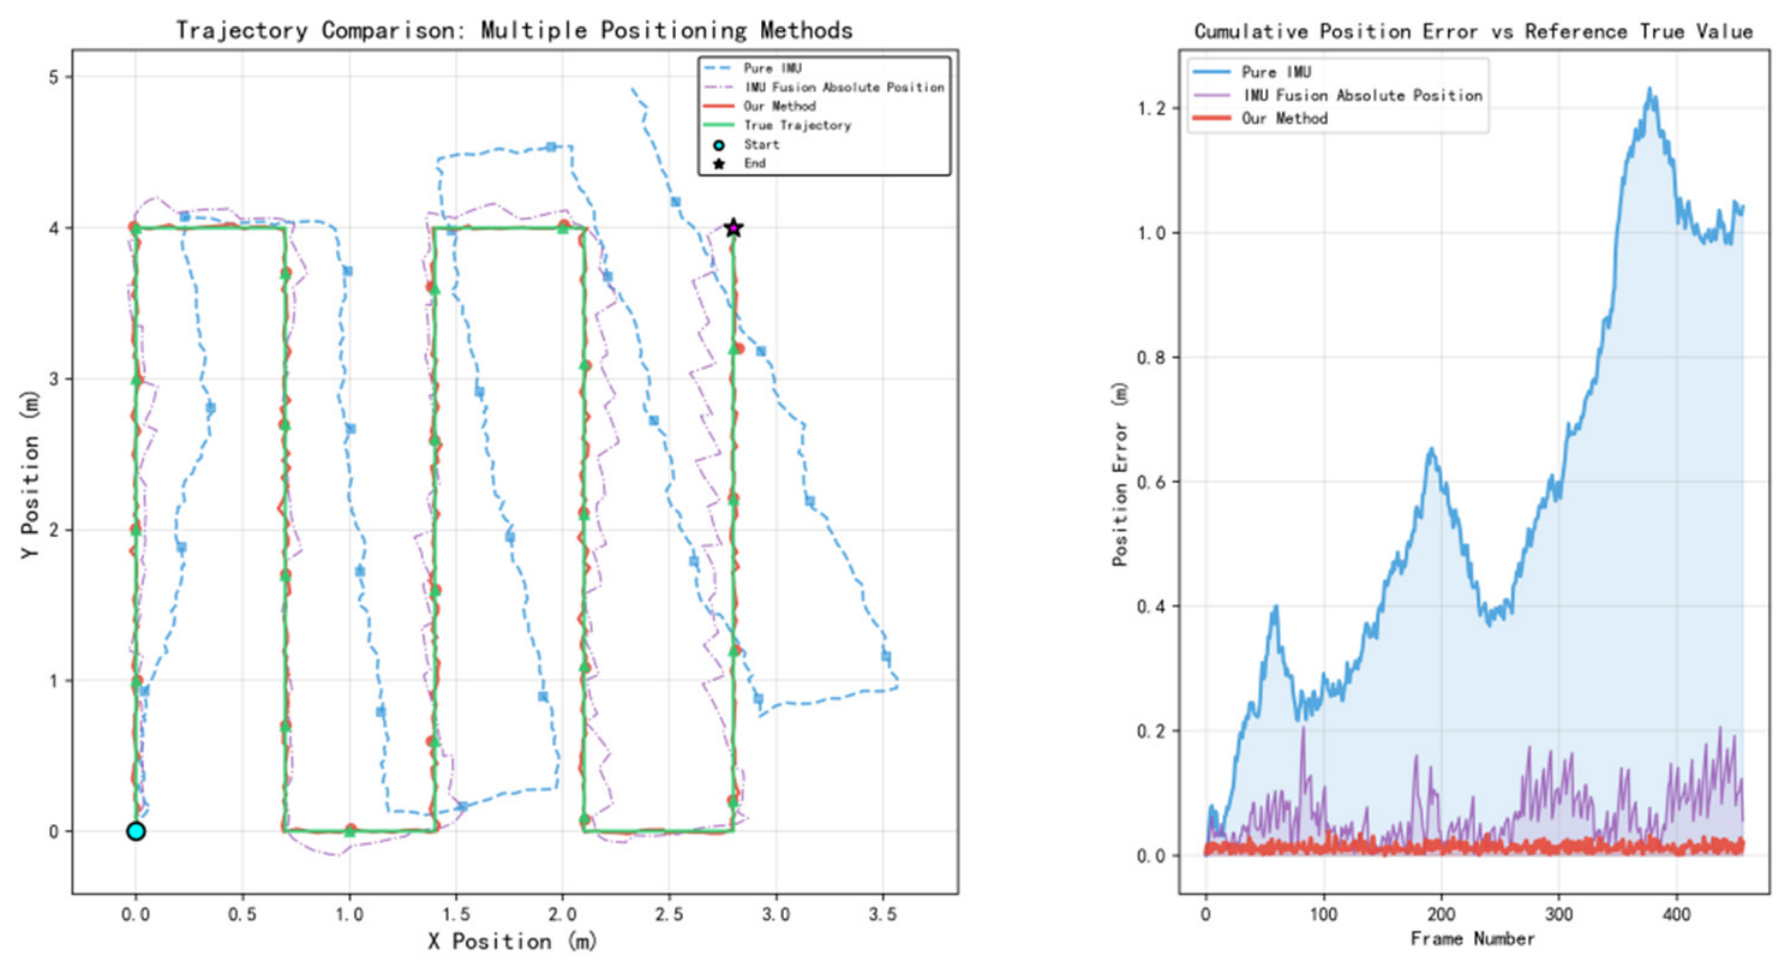
To evaluate the engineering value of the proposed visual localization method, we compared it with two baseline methods under a simulated acoustic failure (DVL invalid) scenario:
Method 1 (Pure-INS): Pure inertial navigation without any external correction, representing the worst-case drift baseline.
Method 2 (IMU-Fusion): An extended Kalman filter (EKF) that fuses IMU measurements with intermittent absolute position inputs derived from the optical motion capture system, simulating a scenario where sparse absolute fixes are available but continuous acoustic navigation has failed.
Ground truth was provided exclusively by an OptiTrack optical motion capture system with ±1 mm positioning accuracy. The motion capture system served as the ground-truth reference only and was not included as a competing method; its outputs were used both to generate the absolute position inputs for Method 2 and to evaluate the positioning error of all three methods against a common reference.
Figure 12 shows the comparison between the vehicle motion trajectories estimated by different methods and the ground truth trajectory. The results show that the error of pure inertial localization accumulates and diverges rapidly over time. The fusion method suppresses divergence to some extent, but the error continues to grow during prolonged periods without external absolute observations (e.g., acoustic). In contrast, our visual localization method provides absolute position observations by matching the global map, thus eliminating cumulative drift. Throughout the simulated acoustic failure period, its absolute localization error remained within the centimeter level, significantly outperforming the other comparison methods. This fully demonstrates the advantage of visual localization as an effective compensation method when acoustic aids fail.

4.9. Experimental Validation Based on Simulated Deep-Sea Mining Scenario Datasets

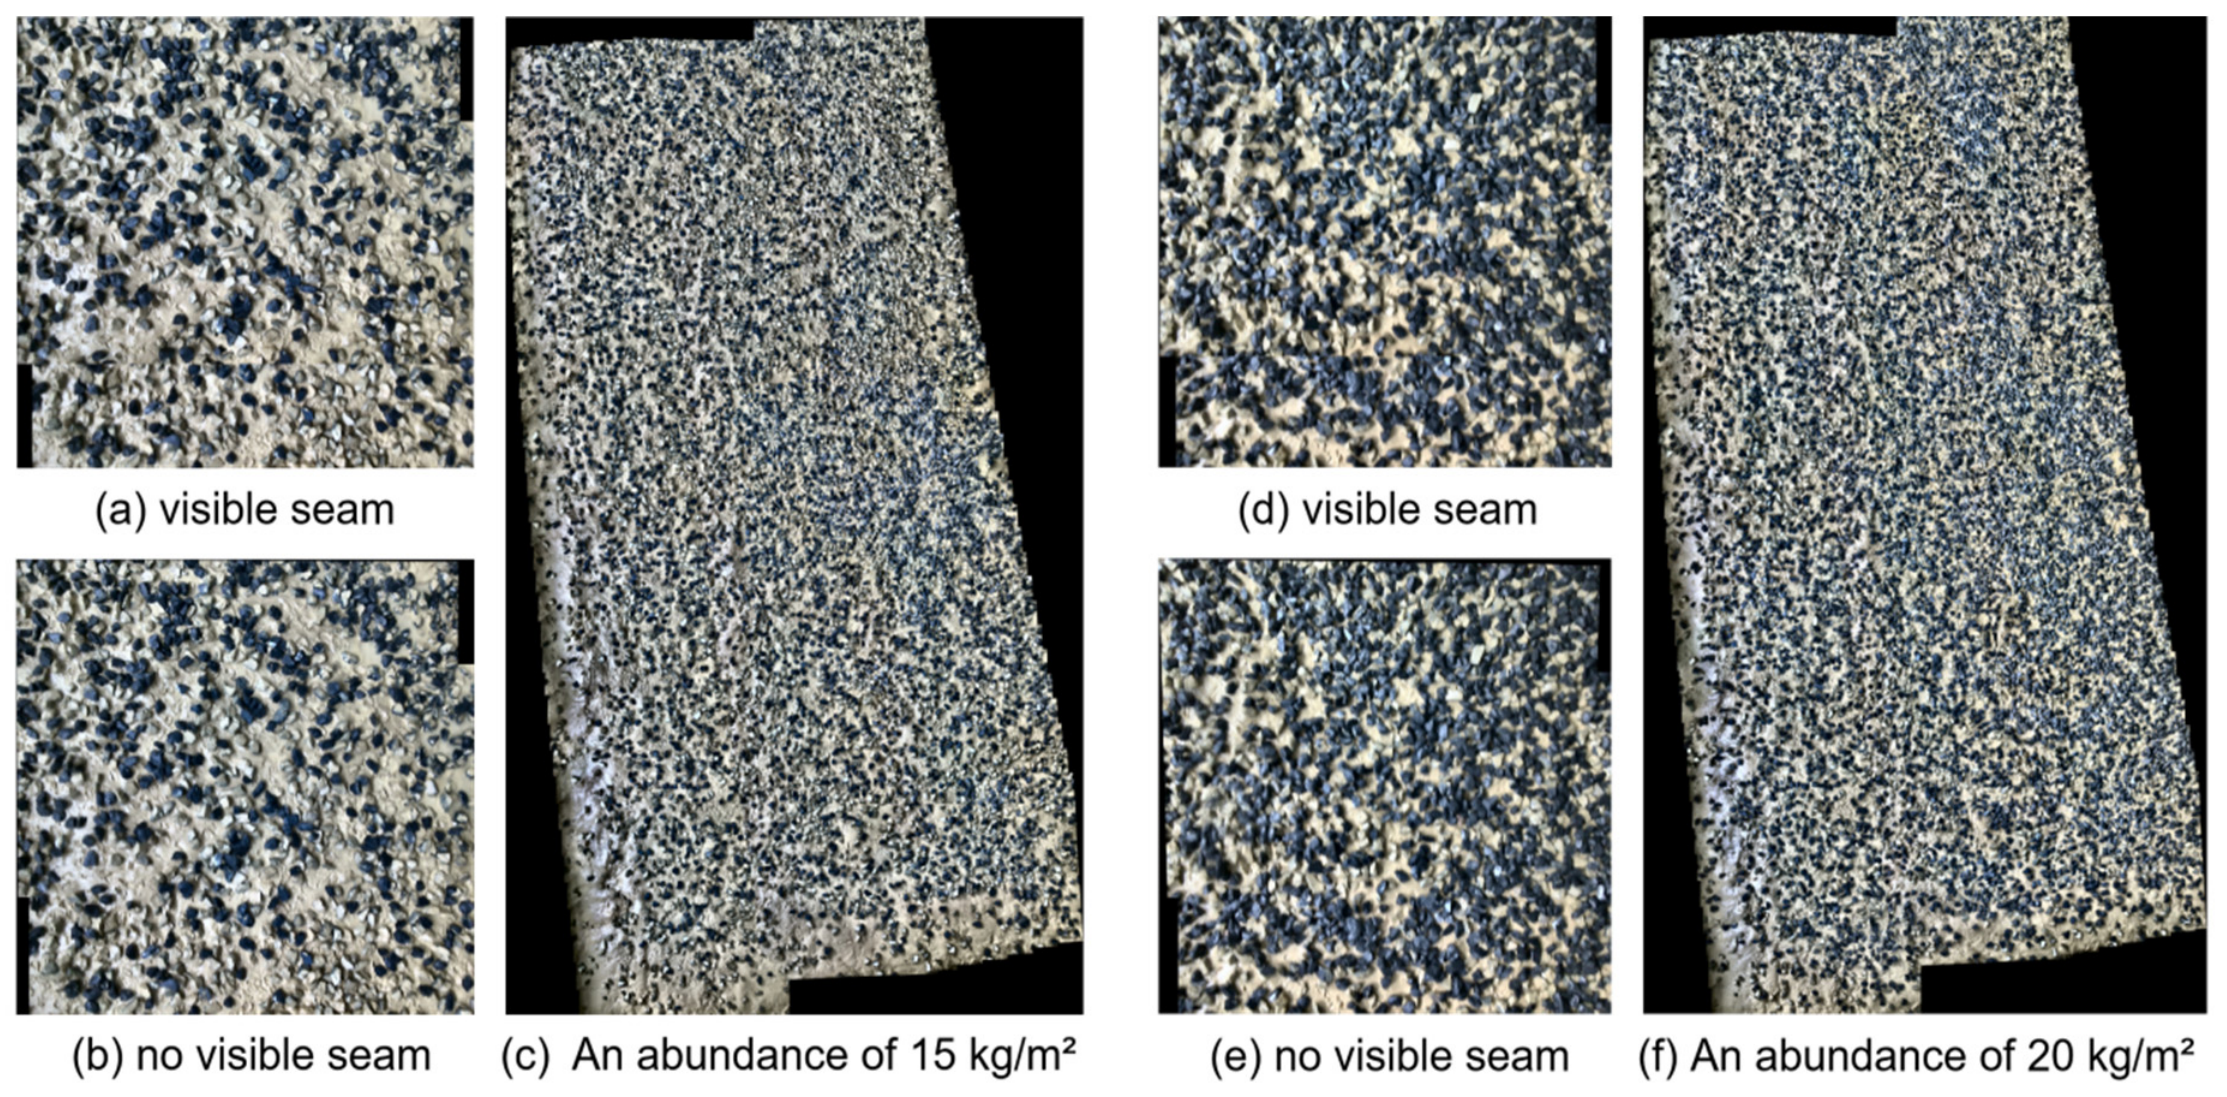
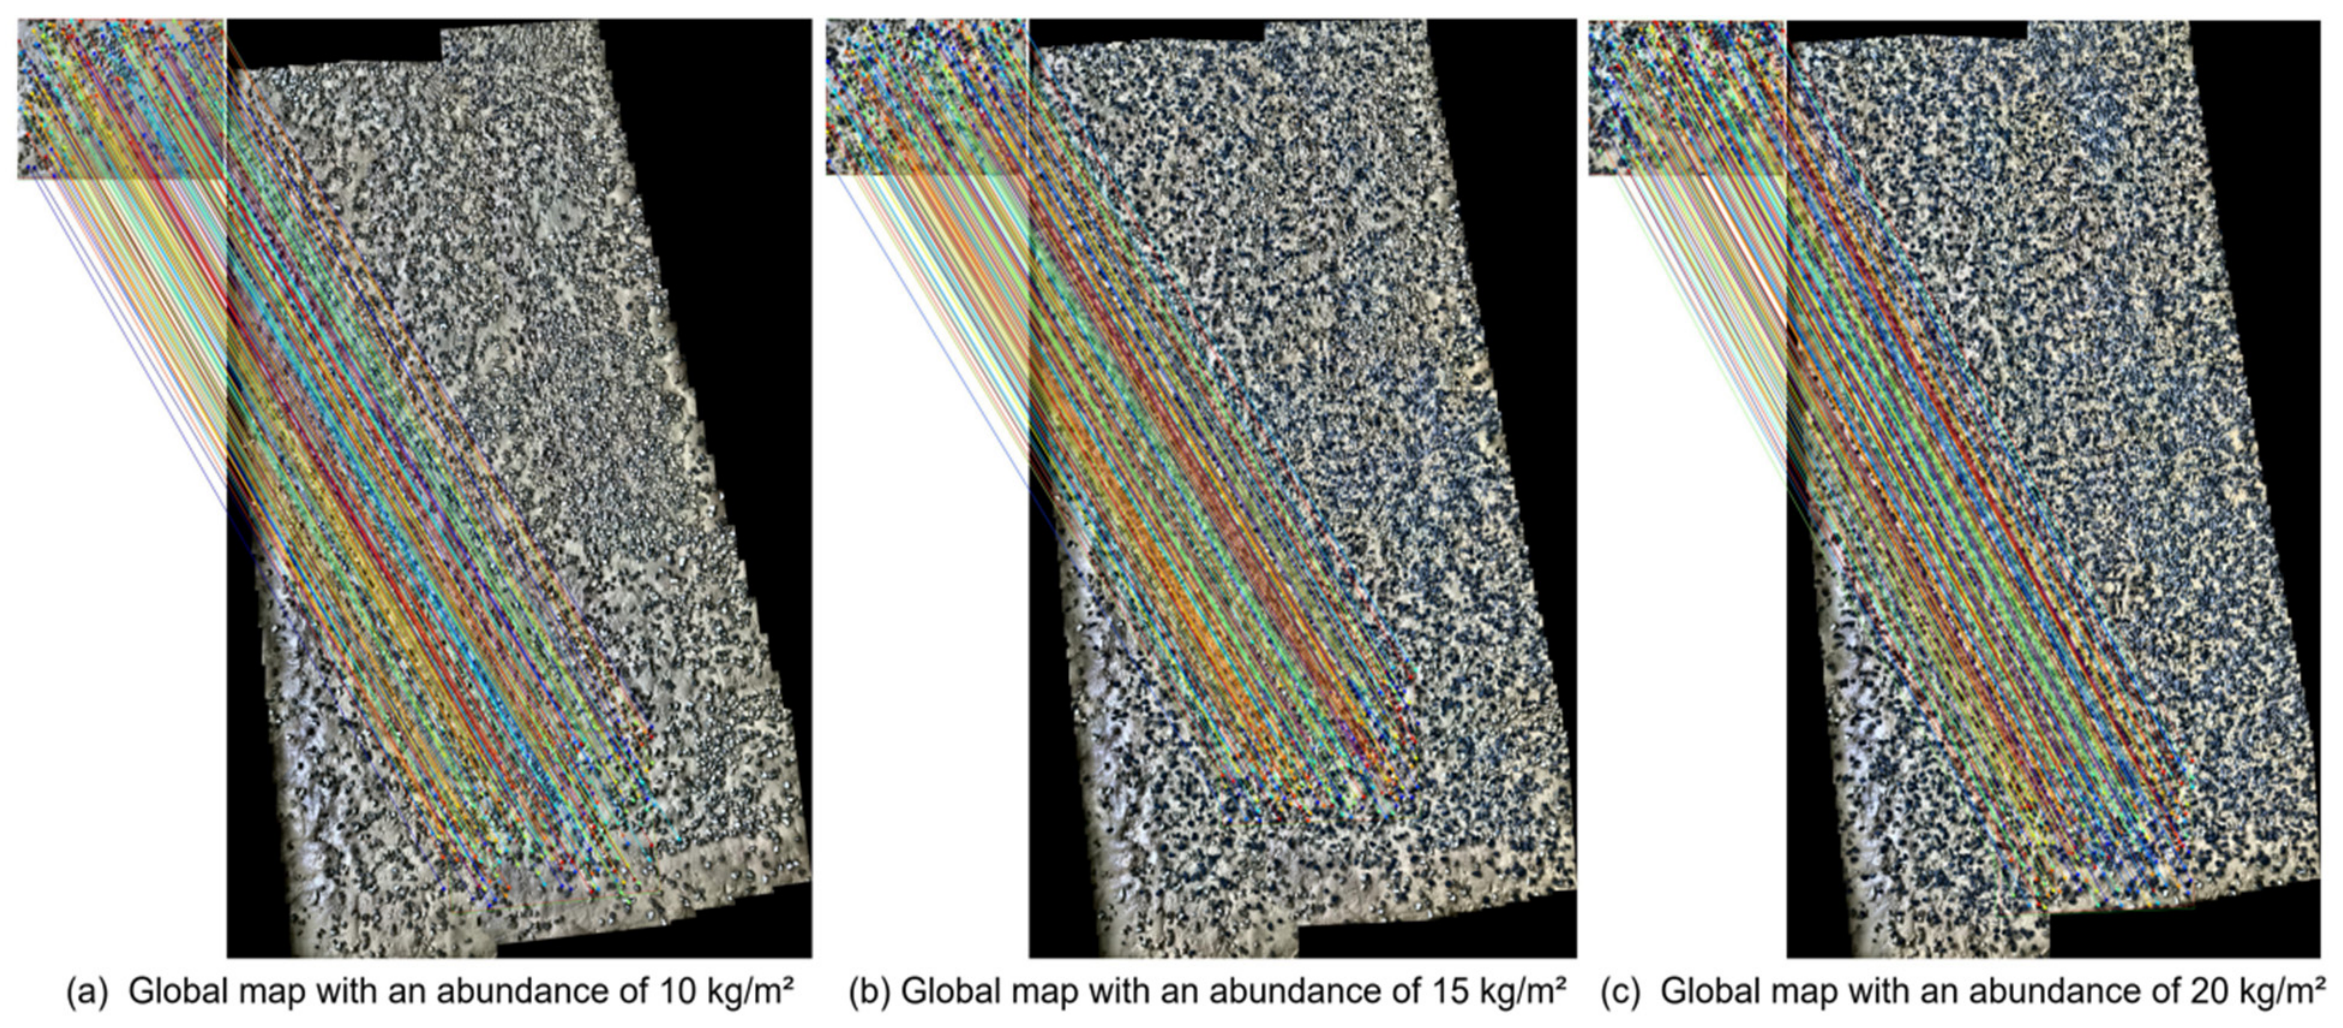
According to the literature, the average nodule abundance in the Pacific CCZ area is 15 kg/m2. In Section 4.5 and Section 4.6, we conducted image fusion and global map drift correction experiments in an area with an abundance of 10 kg/m2. To more realistically simulate the mining environment and evaluate the robustness of the algorithm, we further established deep-sea mining scenarios with abundances of 15 kg/m2 and 20 kg/m2. The corresponding experimental results are shown in Figure 13.
As shown, the proposed method successfully constructed global maps under three density conditions: 10 kg/m2, 15 kg/m2, and 20 kg/m2, demonstrating good robustness. Following this, we conducted local-to-global map matching experiments using the stitched global map. The input image size was set to 3280 × 2464 pixels, matching the keyframe image dimensions. Figure 14 shows that when the input image size was the same as the keyframe size, the system achieved effective matching in all cases, with IoU values exceeding 0.95.
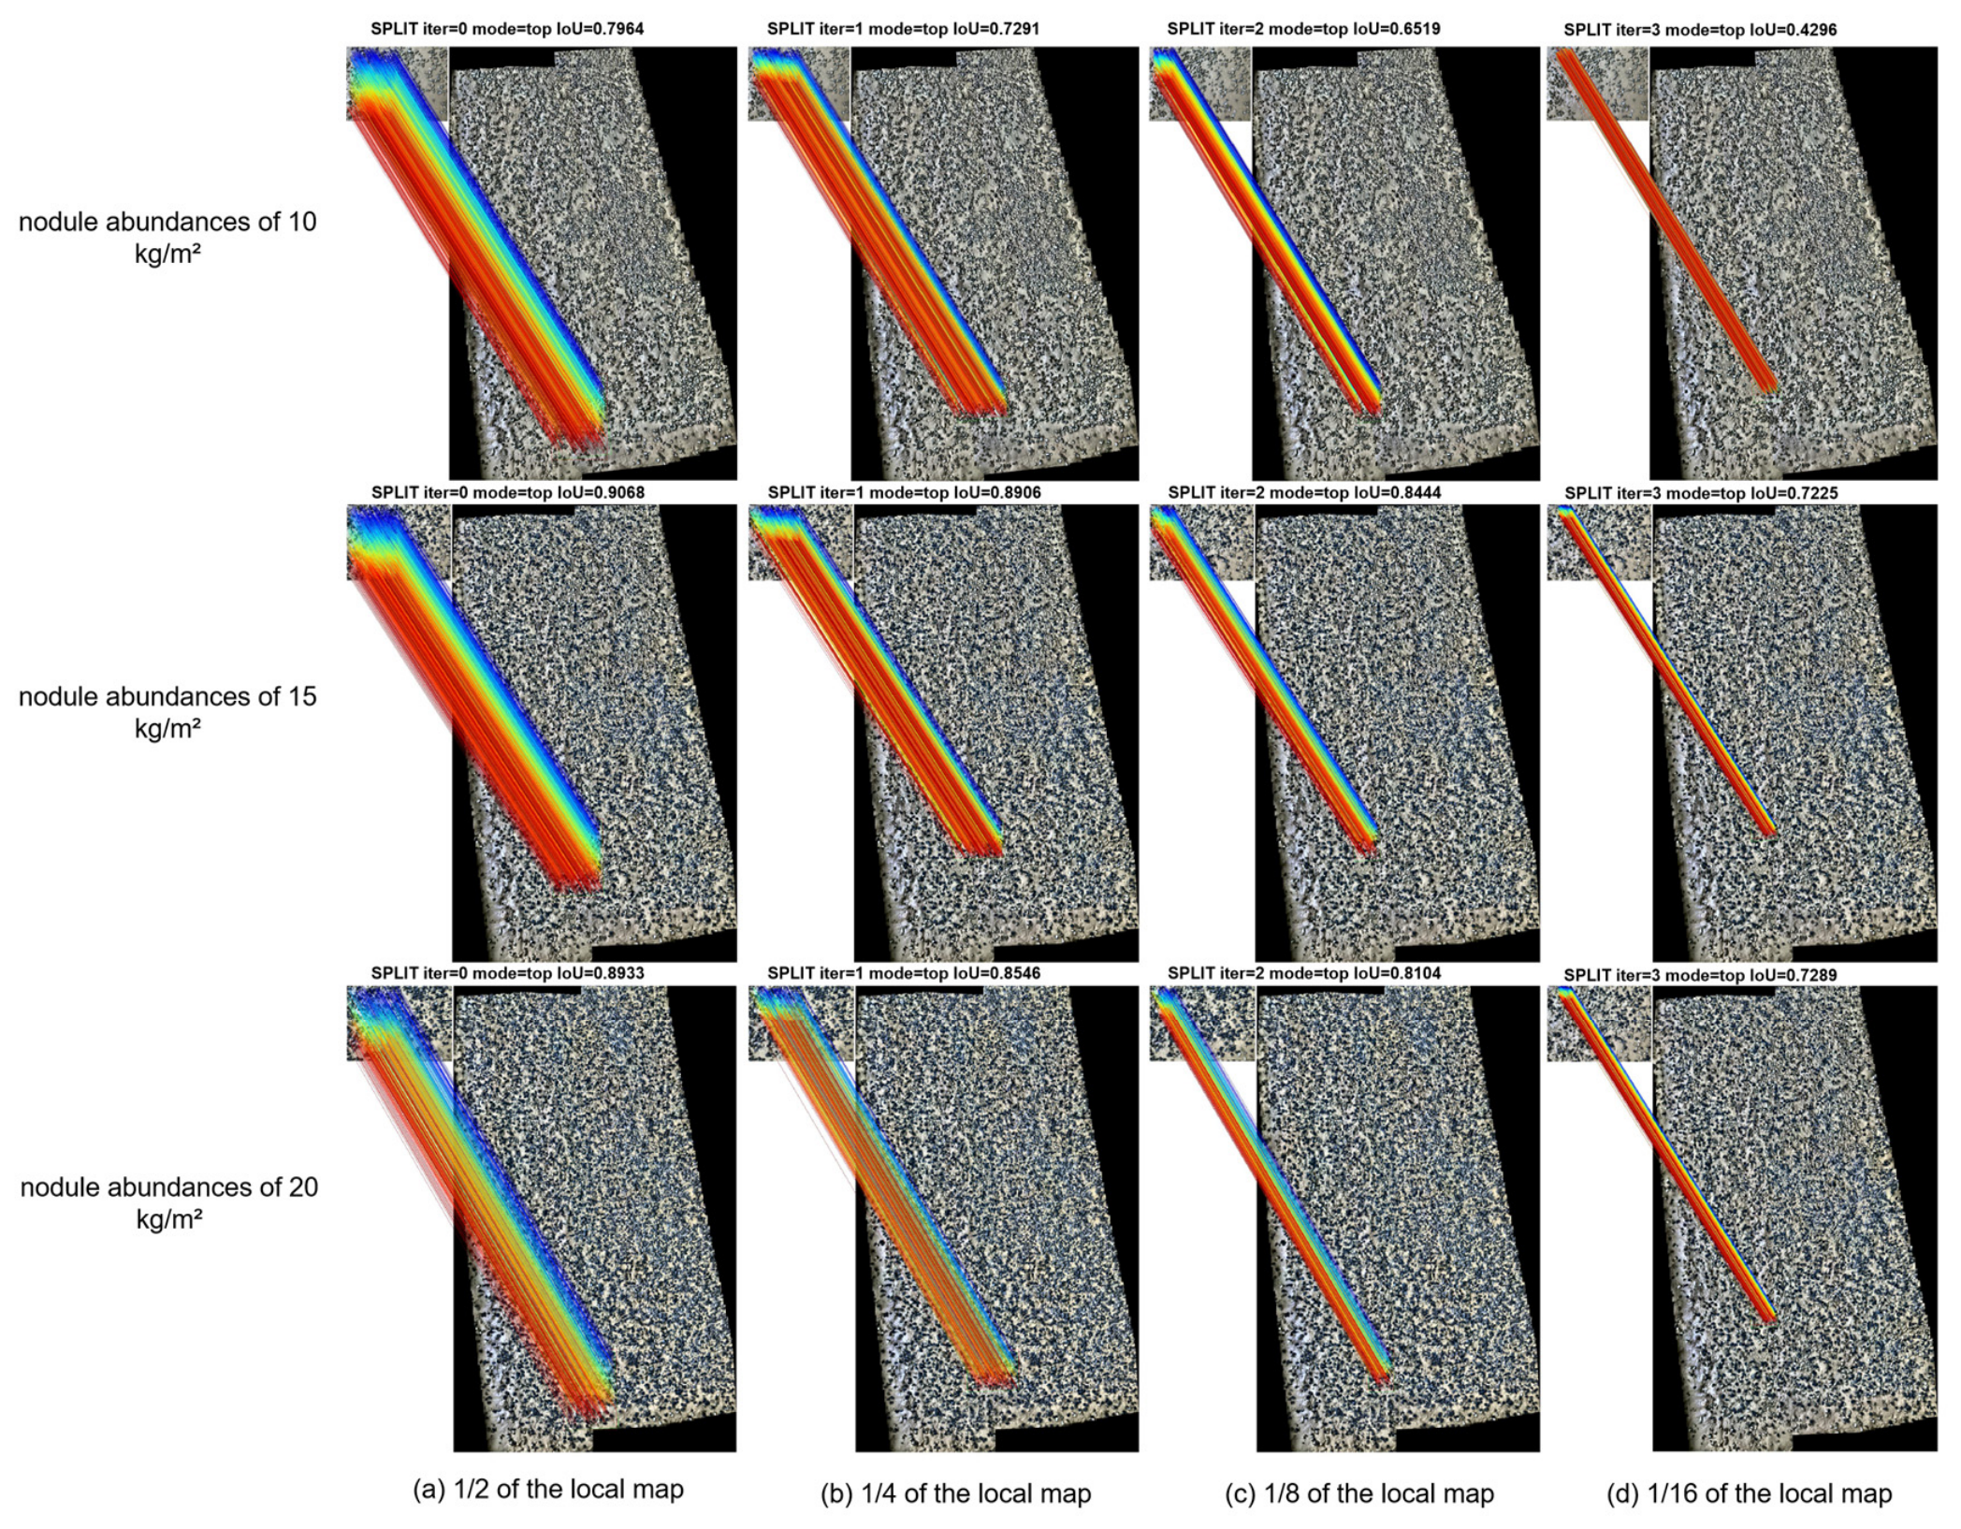
To quantitatively evaluate the experimental results, we employed a stepwise testing approach: we gradually reduced the local map size and repeated the experiments to measure localization accuracy. We used the Intersection over Union (IoU) metric to assess localization performance, with an IoU below 0.5 considered a matching failure. Additionally, we defined the area ratio (i.e., resolution ratio) between the local image and the global map to determine the minimum required local map area ratio for the visual localization system under the given experimental conditions. This threshold is not a fixed constant but depends on the texture distribution in the specific environment and the discriminative capability of the algorithm used. Figure 15 illustrates the positioning accuracy of the progressive search.
As shown in Table 4, the IoU value decreased correspondingly as the local map size was reduced. Increased texture richness provided more textural information, which improved the accuracy of visual matching. However, when the local map was reduced to 1/32 of the original image (3280 × 2464), the system could not achieve effective matching and localization. At this point, the area ratio (resolution ratio) between the local image and the global map is calculated as follows: R a t i o = A r e a l o c a l m i n A r e a g l o b a l = 0.76 % .
This finding demonstrates that the adopted deep learning features (AD-LG) offer greater robustness compared to traditional methods. They can effectively mitigate perceptual aliasing in underwater environments. Furthermore, this threshold provides a quantitative basis for designing key parameters of the visual system on underwater mining platforms, such as the field of view (FOV) and resolution.
When the spatial scale of the mining area changes, maintaining this minimum area ratio becomes a core challenge for engineering design.
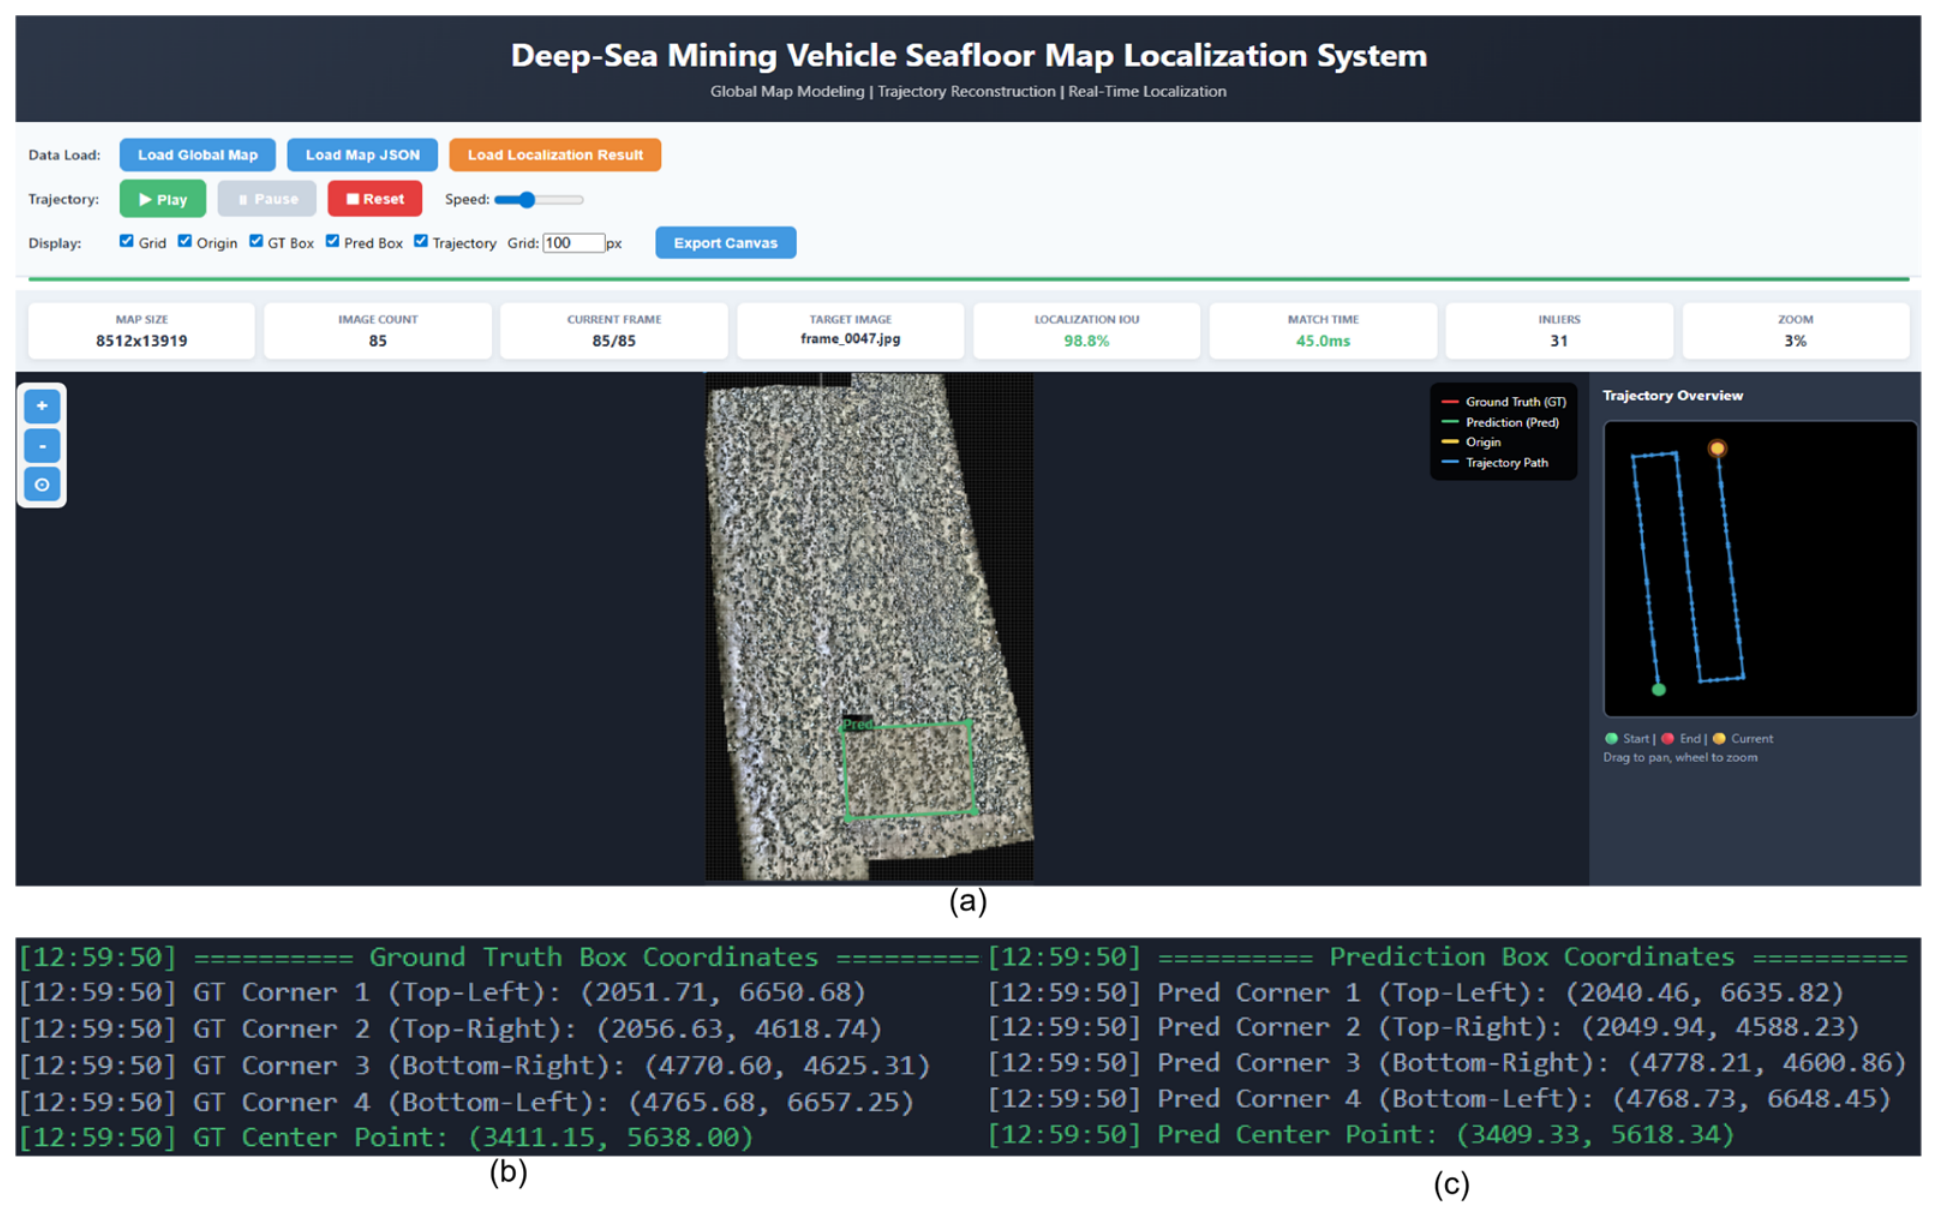
Figure 16 shows the interface of the deep-sea mining vehicle seabed visual localization software system deployed on the Jetson Orin NX platform, along with real-time processing screens and localization output from the actual sea trial data. The experiments confirmed that the system can achieve near real-time processing on the embedded platform, verifying the engineering feasibility of the entire method and its reliability in practical operating environments.

4.10. Discussion

The results across Section 4.2, Section 4.3, Section 4.4, Section 4.5, Section 4.6, Section 4.7, Section 4.8 and Section 4.9 support the following interpretations. First, the superior performance of the proposed adaptive keyframe strategy over fixed-interval sampling is attributable to its responsiveness to actual carrier motion: at low carrier speeds, 30 fps sampling produces a 92% overlap rate and extensive data redundancy; at higher speeds, 3 fps sampling introduces gaps that cause matching failure. The dual-criterion strategy (sharpness + optical flow) maintains a 76% overlap rate across varying speed conditions, providing a consistent input quality for subsequent processing stages.
Second, the lower SSIM score of MSR relative to DCP (Table 3, 0.745 vs. 0.927) does not indicate inferior enhancement quality in this application context. Deep-sea visual localization depends on feature descriptor stability rather than pixel-level similarity to the original image; the superiority of MSR in average gradient (43.32 vs. 19.62) and UIQM (1.77 vs. 0.56) directly reflects its advantage in the feature-relevant quality dimensions. The methodological justification for de-emphasising SSIM in this scenario—that localization fidelity depends on texture and edge preservation rather than absolute pixel similarity—is grounded in the nature of the AD-LG feature extractor, which responds to local gradient structure rather than photometric absolute values.
Third, the AD-LG performance advantage over SuperPoint + SuperGlue (IoU 0.890 vs. 0.820) is attributable to ALIKED’s deformable convolution mechanism, which explicitly adapts its sampling grid to local image geometry. This property is particularly advantageous in deep-sea imagery, where non-rigid optical distortions from water refraction and flow turbulence create spatially varying geometric deformations that fixed-grid detectors such as SuperPoint do not address.
Fourth, the 0.76% minimum area ratio threshold identified in Section 4.9 provides a quantitative design guideline for camera system specification: for a given mining area spatial scale, FOV and sensor resolution must be selected such that the local image covers at least 0.76% of the global map area. This threshold is environment-dependent—it will shift upward in lower-texture environments (below 10 kg/m2 nodule abundance) and may relax in higher-abundance zones—and should be re-evaluated when deploying in a new mining area.

5. Conclusions and Future Work

5.1. Conclusions

Aiming to address the frequent failure of acoustic-based localization in strong disturbance environments during deep-sea mining operations, this paper proposed a visual localization method based on multi-source image matching and implemented a corresponding engineering system. The method reduces data redundancy through adaptive keyframe extraction and improves input quality by applying MSR for underwater image enhancement. The system employs the AD-LG deep network architecture to handle challenges of weak textures and non-rigid distortions. It constructs a high-precision, drift-free seabed visual map via global bundle adjustment and multi-band blending techniques, ultimately achieving absolute vehicle localization through local-to-global image matching.
Validation results based on tank simulation experiments show that the proposed method exhibits good real-time performance and operational stability on embedded computing platforms. Under simulated acoustic failure conditions, the method achieved decimeter-level absolute positioning accuracy, significantly outperforming pure inertial navigation and its filtering-based fusion counterparts. Quantitative results from tank simulation experiments demonstrate the engineering feasibility of the proposed method under controlled conditions. Qualitative deployment on real Pacific CCZ sea trial imagery further confirms near-real-time operational feasibility on the embedded Jetson Orin NX platform, though quantitative ground-truth validation for the ocean trial data remains a direction for future work when USBL fix data become available.
Several operational boundary conditions merit explicit discussion. Regarding turbidity: the MSR enhancement module estimates illumination via multi-scale Gaussian convolution (Section 3.4). Under severe turbidity where the scattering coefficient substantially exceeds the absorption coefficient, the illumination estimate becomes unreliable and feature descriptor quality degrades; we expect the AD-LG matching success rate to fall below the operational threshold in such conditions, consistent with the sensitivity observed in the UIEB severely-degraded subset (Table 3). Regarding seabed texture density: Table 4 shows that when the local map area ratio falls below 0.76% of the global map, the system fails to achieve reliable localisation (IoU < 0.5) even at the highest nodule abundance (20 kg/m2). In largely featureless sediment plains between nodule fields—where texture density is lower than the 10 kg/m2 condition tested—the AD-LG architecture is expected to fail, and dead-reckoning bridging or acoustic aiding would be required. Regarding map-to-query appearance change: the prior map is constructed from a single AUV survey pass. Significant seabed disturbance between map construction and vehicle deployment—due to active mining, sediment resuspension, or biological activity—may alter seafloor texture sufficiently to degrade localisation reliability; periodic map updates would be required in long-term commercial operations. Regarding illumination failure: the current framework assumes functional AUV lighting; complete illumination loss represents a hard operational constraint not addressed by the present system, and is identified as a direction for future work.
Beyond deep-sea mining, the prior-map visual localization framework proposed in this paper is applicable to other GPS-denied scenarios where a high-resolution reference image can be constructed offline. In building-façade inspection, for instance, an initial survey pass could construct a georeferenced facade mosaic; subsequent inspection passes could then localise against this prior map to identify material anomalies or structural changes at metric-level positions. The appearance-gap challenge in this domain—where imaging conditions between the mapping and localization phases differ—is analogous to the map-to-query variation encountered in deep-sea operations, and recent work on transformer-based domain adaptation for exterior cladding material detection from street-view imagery [35] demonstrates that such gaps can be bridged effectively. Similarly, the framework could support construction-site monitoring in GPS-denied indoor or underground environments; domain-adaptive detection methods for construction safety compliance [36] address appearance variation across body-worn and fixed camera viewpoints in a manner directly transferable to the map-building stage of our pipeline. These extensions remain subjects for future investigation.

5.2. Future Work

Although this study has made progress, there remain directions for improvement and further exploration. Future research will primarily focus on the following two aspects:
(1)
Deep Multi-Sensor Fusion: While visual localization shows clear advantages in specific scenarios, it is constrained by underwater visibility. Future work considers deeper-level information fusion of visual data with acoustic sensors (e.g., DVL, imaging sonar), inertial measurement units, and other sensors (e.g., magnetometers, depth sensors). By designing loosely or tightly coupled fusion architectures that leverage the complementary nature of multi-source information, it is expected to further enhance the system’s continuous positioning capability, robustness, and accuracy in extremely harsh environments, such as areas with very high turbidity or completely texture-less regions.
(2)
System Long-term Operation and Large-scale Mapping Optimization: To meet the requirements for long-term autonomous operations in larger-scale mining areas in the future, challenges need to be addressed. These include online incremental mapping, management and storage of large-scale maps, map updating and maintenance during long-term operation (to cope with environmental changes), and further optimization of algorithmic computational efficiency. Concurrently, researching more lightweight models and more efficient matching strategies to adapt to lower-power embedded platforms is of great significance for promoting the practical engineering application of this technology.
(3)
Regarding turbidity: under severe turbidity where the scattering coefficient substantially exceeds the absorption coefficient, the MSR illumination estimate becomes unreliable and feature descriptor quality degrades, consistent with the sensitivity observed in the UIEB severely-degraded subset (Table 3). Regarding seabed texture density: Table 4 shows that when the local map area ratio falls below 0.76% of the global map, the system fails to achieve reliable localisation (IoU < 0.5) even at the highest nodule abundance tested (20 kg/m2); in largely featureless sediment plains below 10 kg/m2, dead-reckoning bridging or acoustic aiding would be required. Regarding map-to-query appearance change: significant seabed disturbance between map construction and vehicle deployment may degrade localisation reliability; periodic map updates would be required in long-term commercial operations. Regarding illumination failure: complete illumination loss is a hard operational constraint not addressed by the present system.
Through continuous research and optimization, visual and fusion-based navigation technologies are expected to provide solid and reliable technical support for advancing deep-sea mining equipment towards greater intelligence and higher autonomy.

Author Contributions

Conceptualization, Y.C. and X.Z.; Methodology, Y.C., B.W. and K.L.; Software, B.W.; Validation, B.W.; Formal analysis, K.L. and Y.G.; Investigation, Y.C., X.Z. and K.L.; Resources, Y.C. and X.Z.; Data curation, B.W. and Y.G.; Writing—original draft, B.W.; Writing—review & editing, B.W. and K.L.; Visualization, B.W. and Y.G.; Supervision, Y.C. and X.Z.; Project administration, Y.C. and X.Z.; Funding acquisition, Y.C. and X.Z. All authors have read and agreed to the published version of the manuscript.

Funding

This work was supported by the National Key Research and Development Program of China (Grant No. SH6700-01).

Data Availability Statement

The authors do not have permission to share the data publicly.

Conflicts of Interest

Authors Yangrui Cheng, Bingkun Wang, Xiaojun Zhuo and Kai Liu was employed by the company Changsha Research Institute of Mining and Metallurgy Co., Ltd. The remaining authors declare that the research was conducted in the absence of any commercial or financial relationships that could be construed as a potential conflict of interest.

References

  1. Teague, J.; Allen, M.J.; Scott, T.B. The Potential of Low-Cost ROV for Use in Deep-Sea Mineral, Ore Prospecting and Monitoring. Ocean Eng. 2018, 147, 333–339. [Google Scholar] [CrossRef]
  2. Cheng, Y.; Dai, Y.; Zhang, Y.; Yang, C.; Liu, C.; Cheng, Y.; Dai, Y.; Zhang, Y.; Yang, C.; Liu, C. Status and Prospects of the Development of Deep-Sea Polymetallic Nodule-Collecting Technology. Sustainability 2023, 15, 4572. [Google Scholar] [CrossRef]
  3. Yang, J.; Liu, L.; Lyu, H.; Lin, Z. Deep-Sea Mining Equipment in China: Current Status and Prospect. Chin. J. Eng. Sci. 2020, 22, 1–9. [Google Scholar] [CrossRef]
  4. Du, K.; Xi, W.; Huang, S.; Zhou, J. Deep-Sea Mineral Resource Mining: A Historical Review, Developmental Progress, and Insights. Min. Metall. Explor. 2024, 41, 173–192. [Google Scholar] [CrossRef]
  5. Chen, W.; Shang, G.; Ji, A.; Zhou, C.; Wang, X.; Xu, C.; Li, Z.; Hu, K. An Overview on Visual SLAM: From Tradition to Semantic. Remote Sens. 2022, 14, 3010. [Google Scholar] [CrossRef]
  6. DeTone, D.; Malisiewicz, T.; Rabinovich, A. SuperPoint: Self-Supervised Interest Point Detection and Description. In Proceedings of the IEEE Conference on Computer Vision and Pattern Recognition (CVPR) Workshops, Salt Lake City, UT, USA, 18–22 June 2018. [Google Scholar]
  7. Lindenberger, P.; Sarlin, P.-E.; Pollefeys, M. LightGlue: Local Feature Matching at Light Speed. In Proceedings of the IEEE/CVF International Conference on Computer Vision (ICCV), Paris, France, 2–6 October 2023. [Google Scholar]
  8. Wang, Z.; Cheng, Q.; Mu, X. RU-SLAM: A Robust Deep-Learning Visual Simultaneous Localization and Mapping (SLAM) System for Weakly Textured Underwater Environments. Sensors 2024, 24, 1937. [Google Scholar] [CrossRef] [PubMed]
  9. Shen, Q.; Zhao, H.; Yan, W.; Wang, C.; Qin, T.; Yang, M. Cross-Modal Visual Relocalization in Prior LiDAR Maps Utilizing Intensity Textures. In Proceedings of the 2024 IEEE/RSJ International Conference on Intelligent Robots and Systems (IROS), Abu Dhabi, United Arab Emirates, 14–18 October 2024. [Google Scholar]
  10. Schoening, T.; Jones, D.O.B.; Greinert, J. Compact-Morphology-Based Poly-Metallic Nodule Delineation. Sci. Rep. 2017, 7, 13338. [Google Scholar] [CrossRef]
  11. Huang, L.; Wang, S.; Liu, W.; Sun, Y.; Li, Y.; Hong, X.; Xu, M.; Jiang, L.; Xu, F.; Li, Y.; et al. Real-Time Simulation for Deep-Sea Mining System with Sea Trial Validation. Ocean Eng. 2025, 342, 122751. [Google Scholar] [CrossRef]
  12. Zhang, S.; Zhao, S.; An, D.; Liu, J.; Wang, H.; Feng, Y.; Li, D.; Zhao, R. Visual SLAM for Underwater Vehicles: A Survey. Comput. Sci. Rev. 2022, 46, 100510. [Google Scholar] [CrossRef]
  13. Wang, C.; Shu, X.; Zhou, S.; Song, H.; He, Q. Embracing a New Era of Deep-Sea Mining: Research Progress and Prospects. Mar. Policy 2025, 180, 106778. [Google Scholar] [CrossRef]
  14. Yuan, P.; Fan, C.; Zhang, C. Deep-Sea Image Stitching: Using Multi-Channel Fusion and Improved AKAZE. IET Image Process. 2023, 17, 4061–4075. [Google Scholar] [CrossRef]
  15. Shortis, M. Calibration Techniques for Accurate Measurements by Underwater Camera Systems. Sensors 2015, 15, 30810–30826. [Google Scholar] [CrossRef]
  16. Karmakov, S.; Aliabadi, M.H.F. Deep Learning Approach to Impact Classification in Sensorized Panels Using Self-Attention. Sensors 2022, 22, 4370. [Google Scholar] [CrossRef]
  17. Xie, Y.; Wang, Q.; Chang, Y.; Zhang, X. Fast Target Recognition Based on Improved ORB Feature. Appl. Sci. 2022, 12, 786. [Google Scholar] [CrossRef]
  18. Barath, D. SupeRANSAC: One RANSAC to Rule Them All. arXiv 2025, arXiv:2506.04803. [Google Scholar] [CrossRef]
  19. Li, F.; Chen, Y.; Shi, Q.; Shi, G.; Yang, H.; Na, J. Improved Low-Light Image Feature Matching Algorithm Based on the SuperGlue Net Model. Remote Sens. 2025, 17, 905. [Google Scholar] [CrossRef]
  20. Qin, T.; Li, P.; Shen, S. VINS-Mono: A Robust and Versatile Monocular Visual-Inertial State Estimator. IEEE Trans. Robot. 2018, 34, 1004–1020. [Google Scholar] [CrossRef]
  21. Hao, Y.; Liu, J.; Liu, Y.; Liu, X.; Meng, Z.; Xing, F. Global Visual–Inertial Localization for Autonomous Vehicles with Pre-Built Map. Sensors 2023, 23, 4510. [Google Scholar] [CrossRef]
  22. Yabuuchi, K.; Wong, D.R.; Ishita, T.; Kitsukawa, Y.; Kato, S. Visual Localization for Autonomous Driving Using Pre-Built Point Cloud Maps. In Proceedings of the 2021 IEEE Intelligent Vehicles Symposium (IV), Nagoya, Japan, 11–17 July 2021; IEEE: Piscataway, NJ, USA, 2021; pp. 913–919. [Google Scholar]
  23. Xu, H.; Liu, H.; Huang, S.; Sun, Y. C2L-PR: Cross-Modal Camera-to-LiDAR Place Recognition via Modality Alignment and Orientation Voting. IEEE Trans. Intell. Veh. 2025, 10, 1128–1144. [Google Scholar] [CrossRef]
  24. Campos, C.; Elvira, R.; Rodriguez, J.J.G.; Montiel, J.M.M.; Tardos, J.D. ORB-SLAM3: An Accurate Open-Source Library for Visual, Visual–Inertial, and Multimap SLAM. IEEE Trans. Robot. 2021, 37, 1874–1890. [Google Scholar] [CrossRef]
  25. Alkendi, Y.; Seneviratne, L.; Zweiri, Y. State of the Art in Vision-Based Localization Techniques for Autonomous Navigation Systems. IEEE Access 2021, 9, 76847–76874. [Google Scholar] [CrossRef]
  26. Zhao, X.; Wu, X.; Miao, J.; Chen, W.; Chen, P.C.Y.; Li, Z. ALIKE: Accurate and Lightweight Keypoint Detection and Descriptor Extraction. IEEE Trans. Multimed. 2023, 25, 3101–3112. [Google Scholar] [CrossRef]
  27. Zhao, C.; Fan, B.; Hu, J.; Pan, Q.; Xu, Z. Homography-Based Camera Pose Estimation with Known Gravity Direction for UAV Navigation. Sci. China Inf. Sci. 2021, 64, 112204. [Google Scholar] [CrossRef]
  28. Lu, L.; Dai, F. A Unified Normalization Method for Homography Estimation Using Combined Point and Line Correspondences. Comput.-Aided Civ. Infrastruct. Eng. 2022, 37, 1010–1026. [Google Scholar] [CrossRef]
  29. Arandjelovic, R.; Gronat, P.; Torii, A.; Pajdla, T.; Sivic, J. NetVLAD: CNN Architecture for Weakly Supervised Place Recognition. IEEE Trans. Pattern Anal. Mach. Intell. 2018, 40, 1437–1451. [Google Scholar] [CrossRef] [PubMed]
  30. Jaffe, J.S. Computer Modeling and the Design of Optimal Underwater Imaging Systems. IEEE J. Ocean. Eng. 1990, 15, 101–111. [Google Scholar] [CrossRef]
  31. Schechner, Y.Y.; Karpel, N. Recovery of Underwater Visibility and Structure by Polarization Analysis. IEEE J. Ocean. Eng. 2005, 30, 570–587. [Google Scholar] [CrossRef]
  32. Quintana, J.; Garcia, R.; Neumann, L.; Campos, R.; Weiss, T.; Köser, K.; Mohrmann, J.; Greinert, J. Towards Automatic nnRecognition of Mining Targets Using an Autonomous Robot. In Proceedings of the OCEANS 2018 MTS/IEEE Charleston, Charleston, SC, USA, 22–25 October 2018; pp. 1–7. [Google Scholar]
  33. Ding, Y.; Yang, J.; Kukelova, Z. Homography Decomposition Revisited. Int. J. Comput. Vis. 2026, 134, 102. [Google Scholar] [CrossRef]
  34. Schönberger, J.; Larsson, V.; Pollefeys, M. Fixing the RANSAC Stopping Criterion. arXiv 2025, arXiv:2503.07829. [Google Scholar] [CrossRef]
  35. Wang, S. Domain adaptation using transformer models for automated detection of exterior cladding materials in street view images. Sci. Rep. 2026, 16, 2696. [Google Scholar] [CrossRef] [PubMed]
  36. Wang, S. Domain-adaptive faster R-CNN for non-PPE identification on construction sites from body-worn and general images. Sci. Rep. 2026, 16, 4793. [Google Scholar] [CrossRef] [PubMed]
Figure 1. Overall Framework of the Proposed Map-Based Visual Localization System.
Jmse 14 00759 g001
Figure 2. Schematic diagram of the overall architecture of the deep-sea mining vehicle’s visual positioning system.
Jmse 14 00759 g002
Figure 3. Schematic diagram of the local-global map-based localization strategy.
Jmse 14 00759 g003
Figure 4. Schematic diagram of the AD-LG feature extraction and matching network structure.
Jmse 14 00759 g004
Figure 5. Visual comparison of different underwater image enhancement methods.
Jmse 14 00759 g005
Figure 6. Comprehensive performance comparison of different feature extraction and matching methods.
Jmse 14 00759 g006
Figure 7. Bubble chart for comprehensive performance analysis of feature extraction-matching algorithms.
Jmse 14 00759 g007
Figure 8. Comparison of long-sequence image stitching results before and after drift correction.
Jmse 14 00759 g008
Figure 9. Comparison of image blending effects. (Left): Traditional linear blending. (Right): Multi-band blending result.
Jmse 14 00759 g009
Figure 10. Comparison of maps and trajectories before and after global bundle adjustment. (a) Map without BA optimization; (b) After global BA optimization; (c) Recovered trajectory.
Jmse 14 00759 g010
Figure 11. Local-to-global visual localization matching. (a) Local-to-global map matching (b) Ground truth bounding boxes (c) Matched bounding boxes and ground truth boxes.
Jmse 14 00759 g011
Figure 12. Comparison of accuracy results for different localization methods.
Jmse 14 00759 g012
Figure 13. Mosaic of global maps with different nodule abundances.
Jmse 14 00759 g013
Figure 14. Local-to-global map matching results.
Jmse 14 00759 g014
Figure 15. Localization accuracy of the progressive search.
Jmse 14 00759 g015
Figure 16. The seabed visual localization software system for the deep-sea mining vehicle (a) Software main interface (b) Original image coordinate values (c) Predicted image coordinate values.
Jmse 14 00759 g016
Table 1. Overview of the experimental datasets.
DatasetResolutionTypeScenarioNumber of Images/Frames
UIEBVariousImagesCoral, Fish, Seabed Scenery890
Severely Degraded Images60
Nodule Abundance: 10 kg/m21800
VideoNodule Abundance: 15 kg/m21800
Nodule Abundance: 20 kg/m21800
Pacific Mining Area1920 × 1080ImagesPolymetallic Nodule Area690
Video
Table 2. Comparison of keyframe extraction methods.
MethodsFrame ExtractionCompression Ratio UtilizationAverage SharpnessAverage Overlap Rate
Uniform sampling—30 fps52,3840%45%28592%
Uniform sampling—3 fps523890.0%68%29072%
SIFT-based838184.0%72%31078%
Clarity only785885.0%62%42588%
Ours312794.0%88%38576%
Table 3. Quantitative comparison of different image enhancement methods.
MethodNo-Reference IQA MetricsFull-Reference IQA Metrics
UCIQEUIQMEntropyAverage GradientPSNR (dB)SSIM
RAW6.35270.29616.446314.4029--
DCP7.71510.56066.496519.617713.84130.9273
CLAHE7.56570.80017.004924.050914.76810.8515
Ours7.77961.77447.367143.321918.84130.7445
Table 4. IoU Values for Visual Matching under Different Nodule Abundances and Local Map Scales.
Nodule Abundance (kg/m2)Full Image1/2 of the Local Map1/4 of the Local Map1/8 of the Local Map1/16 of the Local Map1/32 of the Local Map
10 kg/m20.95320.79640.72910.65190.4296-
15 kg/m20.97010.90680.89060.84440.7225-
20 kg/m20.97090.89930.85460.81040.7289-
Disclaimer/Publisher’s Note: The statements, opinions and data contained in all publications are solely those of the individual author(s) and contributor(s) and not of MDPI and/or the editor(s). MDPI and/or the editor(s) disclaim responsibility for any injury to people or property resulting from any ideas, methods, instructions or products referred to in the content.