1. Introduction
Containerized shipping represents a fundamental component of global maritime freight transport, playing a critical role in the efficiency and integration of international supply chains [
1,
2]. In 2024, out of the total of 12,720 million tons of goods transported globally by sea, containerized transport represented almost 16 percent, with a volume reaching 2000 million tons [
3].
Modern container terminals are the interface between container shipping lines, hinterland land transport networks and supply chain stakeholders. Due to global geopolitical tensions and temporary restrictions in certain key areas (e.g., Panama Canal, Strait of Hormuz), the global maritime supply chain needs to reshape itself, resulting in significantly increased maritime tonne-mile trade with a negative impact on the carbon footprint of the transport mode, higher transport costs, increased delivery times, changing importance of established container hub terminals [
4,
5]. The current challenges regarding restrictions in the Strait of Hormuz oblige established container operators (Maersk, Hapag-Lloyd, CMA CGM) to no longer transit the area for safety reasons, which isolates and blocks ships and hub terminals with significant transhipment traffic, thereby increasing delivery times for containerized goods between Asia and Europe [
6]. In addition to the aforementioned, container terminals also operate under competitive pressure, as terminal productivity directly influences the ship’s dwell time in the terminal, maritime transport costs, as well as the overall performance of the entire supply chain [
7,
8]. However, for conventional container terminal operators worldwide, which represent, in 2026, 95% of all existing specialized terminals, achieving sustained productivity improvements remains an ongoing challenge [
9,
10].
According to recent industry reports and port performance studies, delays in container terminals impose substantial operational and economic burdens, exceeding
$200 billion annually. At the operational level, even a single day of congestion at a major terminal may result in costs of approximately
$3–5 million for port operators and shipping companies, including demurrage and associated inefficiencies [
11,
12]. Despite ongoing investments in automation and optimization technologies, conventional container terminals continue to encounter significant challenges in ensuring the predictability and efficiency of productivity indicators under conditions of operational disruption [
13,
14].
Traditional research in port operations has focused primarily on optimization problems, such as berth allocation and quay crane scheduling, while comparatively less attention has been given to real-time productivity prediction and detailed disturbance classification in conventional (non-automated) terminals [
15,
16]. Optimization typically relies on idealized or forecasted scenarios, whereas predictive modeling captures the variability observed during actual operations [
17,
18]. These approaches are complementary: accurate predictions can enhance optimization processes, while optimization outputs can inform predictive models [
19]. This distinction is particularly relevant in conventional terminals, where operational variability is significantly higher than in automated environments [
20].
To address these challenges, this study introduces a set of interrelated contributions: (1) the paper introduces a dual-mode machine learning framework (forecast vs. decision) for distinguishing between retrospective analysis and pre-operational decision support scenarios. This distinction enables the evaluation of predictive performance under both ideal and real-world information constraints, which is not commonly addressed in port-related studies. (2) This research proposes a multi-indicator productivity modeling approach, simultaneously analyzing productivity metrics, thereby allowing for a comparative assessment of their structural sensitivities to operational disruptions and resource allocation strategies. (3) This study integrates detailed delay structures and equipment allocation variables into a unified analytical framework, facilitating a deeper understanding of the interaction between operational disturbances and productivity beyond isolated prediction tasks. (4) The use of a high-resolution, real-world operational dataset at ship-call level, covering a three-year period, enables the empirical validation of the proposed framework under realistic and heterogeneous operational conditions. (5) Additionally, the analysis highlights the existence of nonlinear effects associated with increasing congestion levels, suggesting the presence of operational thresholds beyond which predictive reliability and system stability may deteriorate. Together, these contributions provide both methodological and operational insights, bridging the gap between predictive analytics and practical decision-making in conventional container terminals.
To address the complexities of modern maritime systems, the research proposed by the authors is structured across five strategic dimensions. It begins with a multi-indicator productivity modeling approach, providing a comprehensive assessment of operational efficiency. This is supported by a structured classification of operational disturbances, capturing both temporal and causal dimensions. The study further evaluates ensemble machine learning methods, assessing their robustness under heterogeneous and uncertain conditions. In addition, system behavior under extreme congestion scenarios is examined to evaluate operational resilience. The framework ultimately supports decision-oriented predictive modeling, bridging the gap between analytical modeling and real-time operational strategy.
The main contributions of this study can be summarized as follows: (1) the development of a dual-mode machine learning framework (forecast vs. decision) that distinguishes between theoretical predictive capacity and real-world decision-support applicability in container terminal operations; (2) the simultaneous modeling and comparative analysis of multiple productivity indicators, highlighting their structural differences and sensitivity to operational disruptions; (3) the integration of operational delay structures into the predictive modeling process, enabling a more detailed understanding of the relationship between internal and external disruptions and terminal performance; (4) the validation of ensemble learning techniques (bagging) in a real-world conventional terminal context, demonstrating their robustness under heterogeneous and noisy operational conditions; (5) the formulation of an operationally oriented analytical framework that links machine learning outputs to practical decision-making processes, supporting both pre-operational planning and real-time performance monitoring.
The remainder of this paper is structured from theoretical framing to empirical validation. The
Section 2 synthesizes the relevant literature and identifies existing research gaps. The
Section 3 presents the dataset (2023–2025), indicator definitions and the dual modeling framework (forecast vs. decision). The
Section 4 reports regression and classification performance across ship types and operational conditions. The
Section 5 interprets findings in relation to operational dynamics and existing literature, emphasizing the role of ensemble models and decision-support relevance. The
Section 6 summarize contributions, managerial implications, limitations and future research directions.
2. Literature Review
This chapter aims to identify and critically analyze existing research related to the topic of this study. It is structured along four main directions: (i) the role of quay cranes (QCs) in conventional container terminal performance, (ii) the operational challenges faced by such terminals, (iii) the application of artificial intelligence (AI) and machine learning (ML) methods, and (iv) the identification of unresolved research gaps. The review adopts a comparative perspective, highlighting methodological patterns, limitations, and areas requiring further investigation.
2.1. Quay Cranes—Critical Role and Performance Indicators
Quay cranes (QCs), also known as Ship-to-Shore (STS) cranes, represent the critical interface between vessels and terminal operations, being responsible for loading and unloading containers. Any disruption in their operation directly limits terminal throughput and may trigger cascading effects across the entire logistics chain [
21]. The literature identified several key productivity indicators that differ fundamentally in their structural characteristics and sensitivity to operational disruptions. RQCP (QC Raw Productivity) represents the basic measure of mechanical efficiency—moves per crane per hour—and is primarily influenced by equipment allocation and utilization patterns. GMPH (Gross Moves Per Hour) normalizes productivity to total working hours, introducing a moderate elasticity that makes it more sensitive than RQCP to systemic disruptions while remaining relatively stable compared to other metrics. NMPH (Net Moves Per Hour), calculated on effective productive time, exhibits high volatility in situations with major operational shocks, responding immediately to increases in internal delay frequency and work rhythm disruptions. WBMPH (Working Berth Moves Per Hour) integrates normalization elements at the berth level with actual operational performance, occupying an intermediate position with balanced behavior between stability and sensitivity to disruptions [
22,
23]. Despite the importance of these indicators, QC scheduling and management remain largely manual and reactive, often resulting in increased vessel waiting times, suboptimal equipment utilization, and higher operational costs [
24].
2.2. The Challenges Specific to Conventional Container Terminals
Conventional container terminals face multiple interconnected challenges that affect QC efficiency. These include equipment reliability issues, such as failures in spreaders, lifting mechanisms, or electrical systems, which lead to unplanned downtime and productivity losses estimated at 15–20% [
25]. Additionally, operational inefficiencies arise from planning methodologies that are insufficiently responsive to real-time constraints, resulting in idle time and suboptimal resource allocation [
26].
Delays within the quay crane area not only disrupt the ship schedule downstream but also have ripple effects upstream, affecting operations in the terminal yard and road transport, necessitating a period of recovery to resume normal operations post-breakdowns [
27,
28]. Furthermore, external unpredictable factors such as adverse weather conditions, terminal congestion, and workforce availability during shifts introduce operational uncertainties that are challenging to forecast using conventional means [
29].
Although advanced tools such as digital twin (DT) technologies have been recognized for their potential to enhance operational visibility and forecasting, their adoption in real-time performance management remains limited [
30]. The delay in the incorporation of such tools results in a tangible decline in performance metrics, with container dwell times surpassing 10–14 days compared to the expected 4–6 days, consequently causing a notable drop in QC productivity below its maximum theoretical capacity [
31].
2.3. Applications of Artificial Intelligence and Machine Learning in Container Terminals
Recent advances in AI and ML have created new opportunities for optimizing container terminal operations without requiring full automation or major infrastructure investments [
32,
33,
34]. Machine learning models can learn operational patterns from historical data, capturing complex nonlinear relationships between operational variables and terminal performance [
35,
36]. Deep learning approaches, such as Long Short-Term Memory (LSTM) networks and attention-based architectures, have demonstrated strong performance in time-series forecasting [
37,
38,
39], while ensemble methods (e.g., Random Forest, XGBoost, Support Vector Machines) provide robust predictive and classification capabilities [
40,
41]. Hybrid architectures combining Convolutional Neural Networks (CNNs) and Recurrent Neural Networks (RNNs) have achieved prediction accuracies of up to 97–99% for vessel operation times [
42], and integration with discrete event simulation has yielded accuracies as high as 99.91% [
43]. Ensemble approaches have also shown superior performance in handling uncertainty compared to single models [
44]. However, most existing studies focus on berth allocation or scheduling optimization in automated terminals, with limited research addressing QC productivity and delay management in conventional terminals using real operational data [
45,
46].
Despite the growing adoption of machine learning techniques in port operations, the existing literature reveals several structural and methodological limitations. Most studies focus on single-task optimization problems, such as berth allocation or crane scheduling, or on isolated predictive tasks, without developing integrated frameworks capable of capturing the multidimensional nature of terminal performance. As a result, productivity indicators are often treated as interchangeable, although they reflect distinct operational dimensions and exhibit different sensitivities to delays and resource allocation strategies. Furthermore, delays are typically incorporated in an aggregated manner, with limited formal classification or analysis of their causal impact, which constrains the identification of inefficiency drivers. From a data perspective, there is a strong reliance on simulation-based or synthetic datasets, while studies using real multi-year operational data remain relatively scarce, thereby limiting external validity. At the same time, although advanced models such as deep learning architectures are increasingly employed, their emphasis on predictive accuracy often reduces interpretability, restricting their applicability in operational decision-making contexts. In addition, most approaches rely on complete datasets that include post-operational variables, without distinguishing between retrospective prediction and real-time decision-support scenarios, which further limits their practical relevance in environments characterized by incomplete information.
These limitations highlight the need for integrated, interpretable, and data-driven predictive frameworks explicitly grounded in operational realities. Such approaches are particularly important for conventional container terminals, where higher levels of variability, uncertainty, and resource constraints require models that not only achieve high predictive accuracy but also provide actionable insights to support decision-making in less automated environments.
2.4. Unexplored Research Areas and Methodological Gaps for Conventional Container Terminals
Container terminals operate under increasing competitive pressure, with productivity directly influencing ship service costs, overall shipping expenses, and supply chain performance. Accurate container throughput forecasting is therefore essential for optimizing port operations, resource allocation, and supply chain efficiency [
47,
48,
49]. However, current planning approaches rely largely on manual scheduling and reactive problem-solving, leading to extended vessel waiting times and inefficient crane utilization. These limitations stem in part from insufficient integration of uncertainty quantification and limited adaptation to real-time operational constraints [
50,
51].
Berth allocation and quay crane scheduling represent interdependent optimization problems that require the coordinated management of multiple resource constraints [
52,
53]. Recent research highlights the importance of continuous approaches to improving aspects of berth utilization in container terminals and integrated multi-resource coordination methodologies [
54,
55,
56].
In this context, the structured classification of delays—such as the 27-category framework adopted in this study—enables a more detailed understanding of their temporal positioning and causal mechanisms. Since operational delays propagate across the entire supply chain, their accurate prediction remains a critical challenge. Real-time monitoring systems and decision-support frameworks can enhance visibility into delay dynamics and support proactive intervention [
57].
The integration of machine learning into supply chain management has demonstrated improvements in areas such as demand forecasting, inventory optimization, and risk assessment [
58,
59,
60]. Emerging generative AI approaches further extend these capabilities by enabling advanced scenario analysis and solution generation. The application of AI across domains such as agriculture, maintenance, and industrial processes highlights its versatility and broad applicability [
61,
62,
63].
Despite significant advances in both operational optimization and machine learning [
64,
65], important gaps remain at their intersection, particularly in the context of conventional container terminals. Existing studies typically address isolated components of terminal operations, without integrating productivity modeling, delay structures, and resource allocation into a unified analytical framework [
66].
Moreover, most machine learning applications focus on single-output prediction tasks, without systematically comparing multiple productivity indicators or analyzing their distinct responses to operational disruptions. Similarly, delays are rarely modeled in a structured manner that captures both their typology and temporal positioning within the operational cycle [
67,
68].
In addition, current predictive approaches do not clearly distinguish between retrospective models and those intended for real-time decision support, where only partial information is available [
66,
69,
70]. This limitation reduces the practical applicability of machine learning models in operational planning environments.
Accordingly, there is a clear need for an integrated modeling approach that simultaneously addresses these dimensions, combining multi-indicator productivity analysis, structured delay classification, and decision-oriented predictive modeling within a real-world operational framework [
59,
69,
70].
Building on the limitations identified above, this study addresses a set of interrelated research gaps that remain insufficiently explored in the literature. Specifically, the present research proposes: (i) a multi-indicator predictive framework that simultaneously models several productivity metrics with distinct structural properties; (ii) a structured classification of operational delays based on temporal positioning and causal origin; (iii) a dual-mode analytical approach (forecast vs. decision) that bridges the gap between retrospective analysis and real-time decision support; and (iv) a systematic evaluation of ensemble methods in heterogeneous operational conditions using real-world data.
By integrating these elements, the study advances beyond isolated predictive or optimization approaches and contributes to the development of a unified, operationally grounded framework for analyzing and managing productivity in conventional container terminals.
3. Materials and Methods
This section presents the data sources, preprocessing procedures, and machine learning methodology employed to analyze and predict operational performance in a conventional container terminal. The experimental framework is designed to ensure reproducibility, methodological rigor, and practical relevance by integrating real-world operational data with advanced analytical techniques. The approach combines data harmonization, feature engineering, and robust handling of missing values with the development of regression and classification models, evaluated under both forecast and decision scenarios. This dual perspective enables the assessment of both the theoretical predictive capacity of the models and their applicability in real-time operational decision-making contexts.
3.1. Data and Operational Context
3.1.1. Origin and Explanation of the Data Used to Conduct the Study
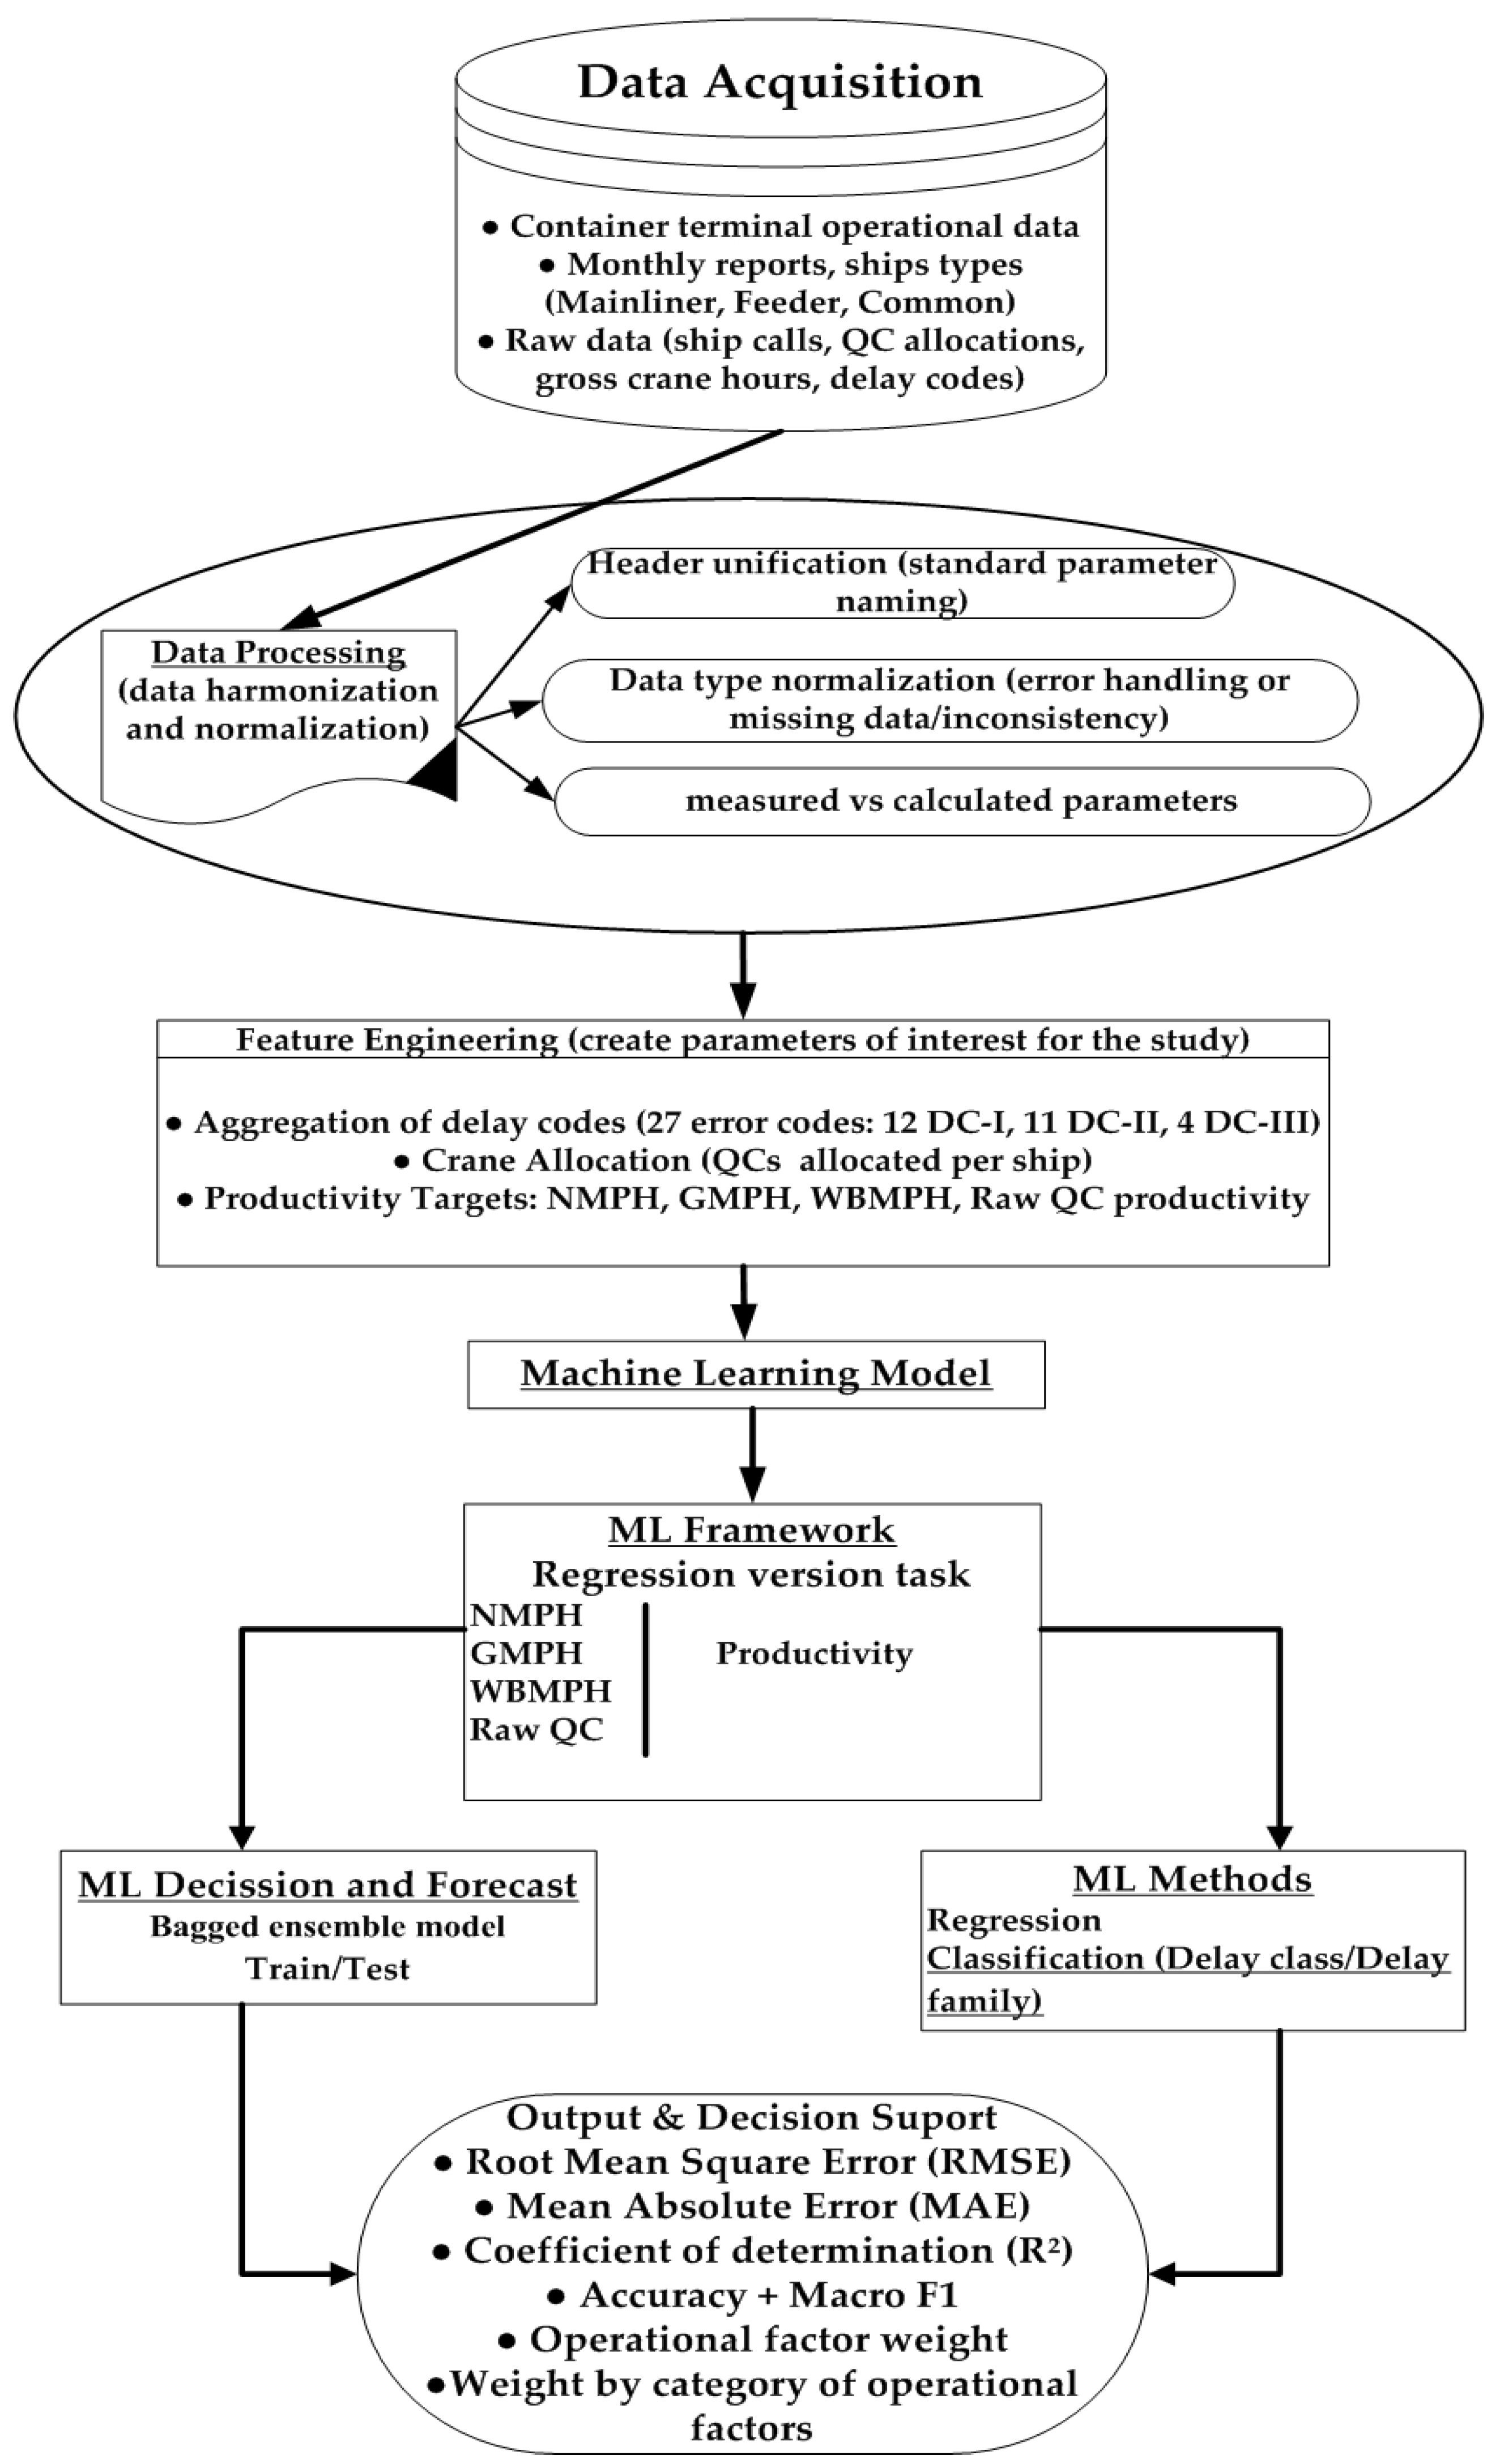
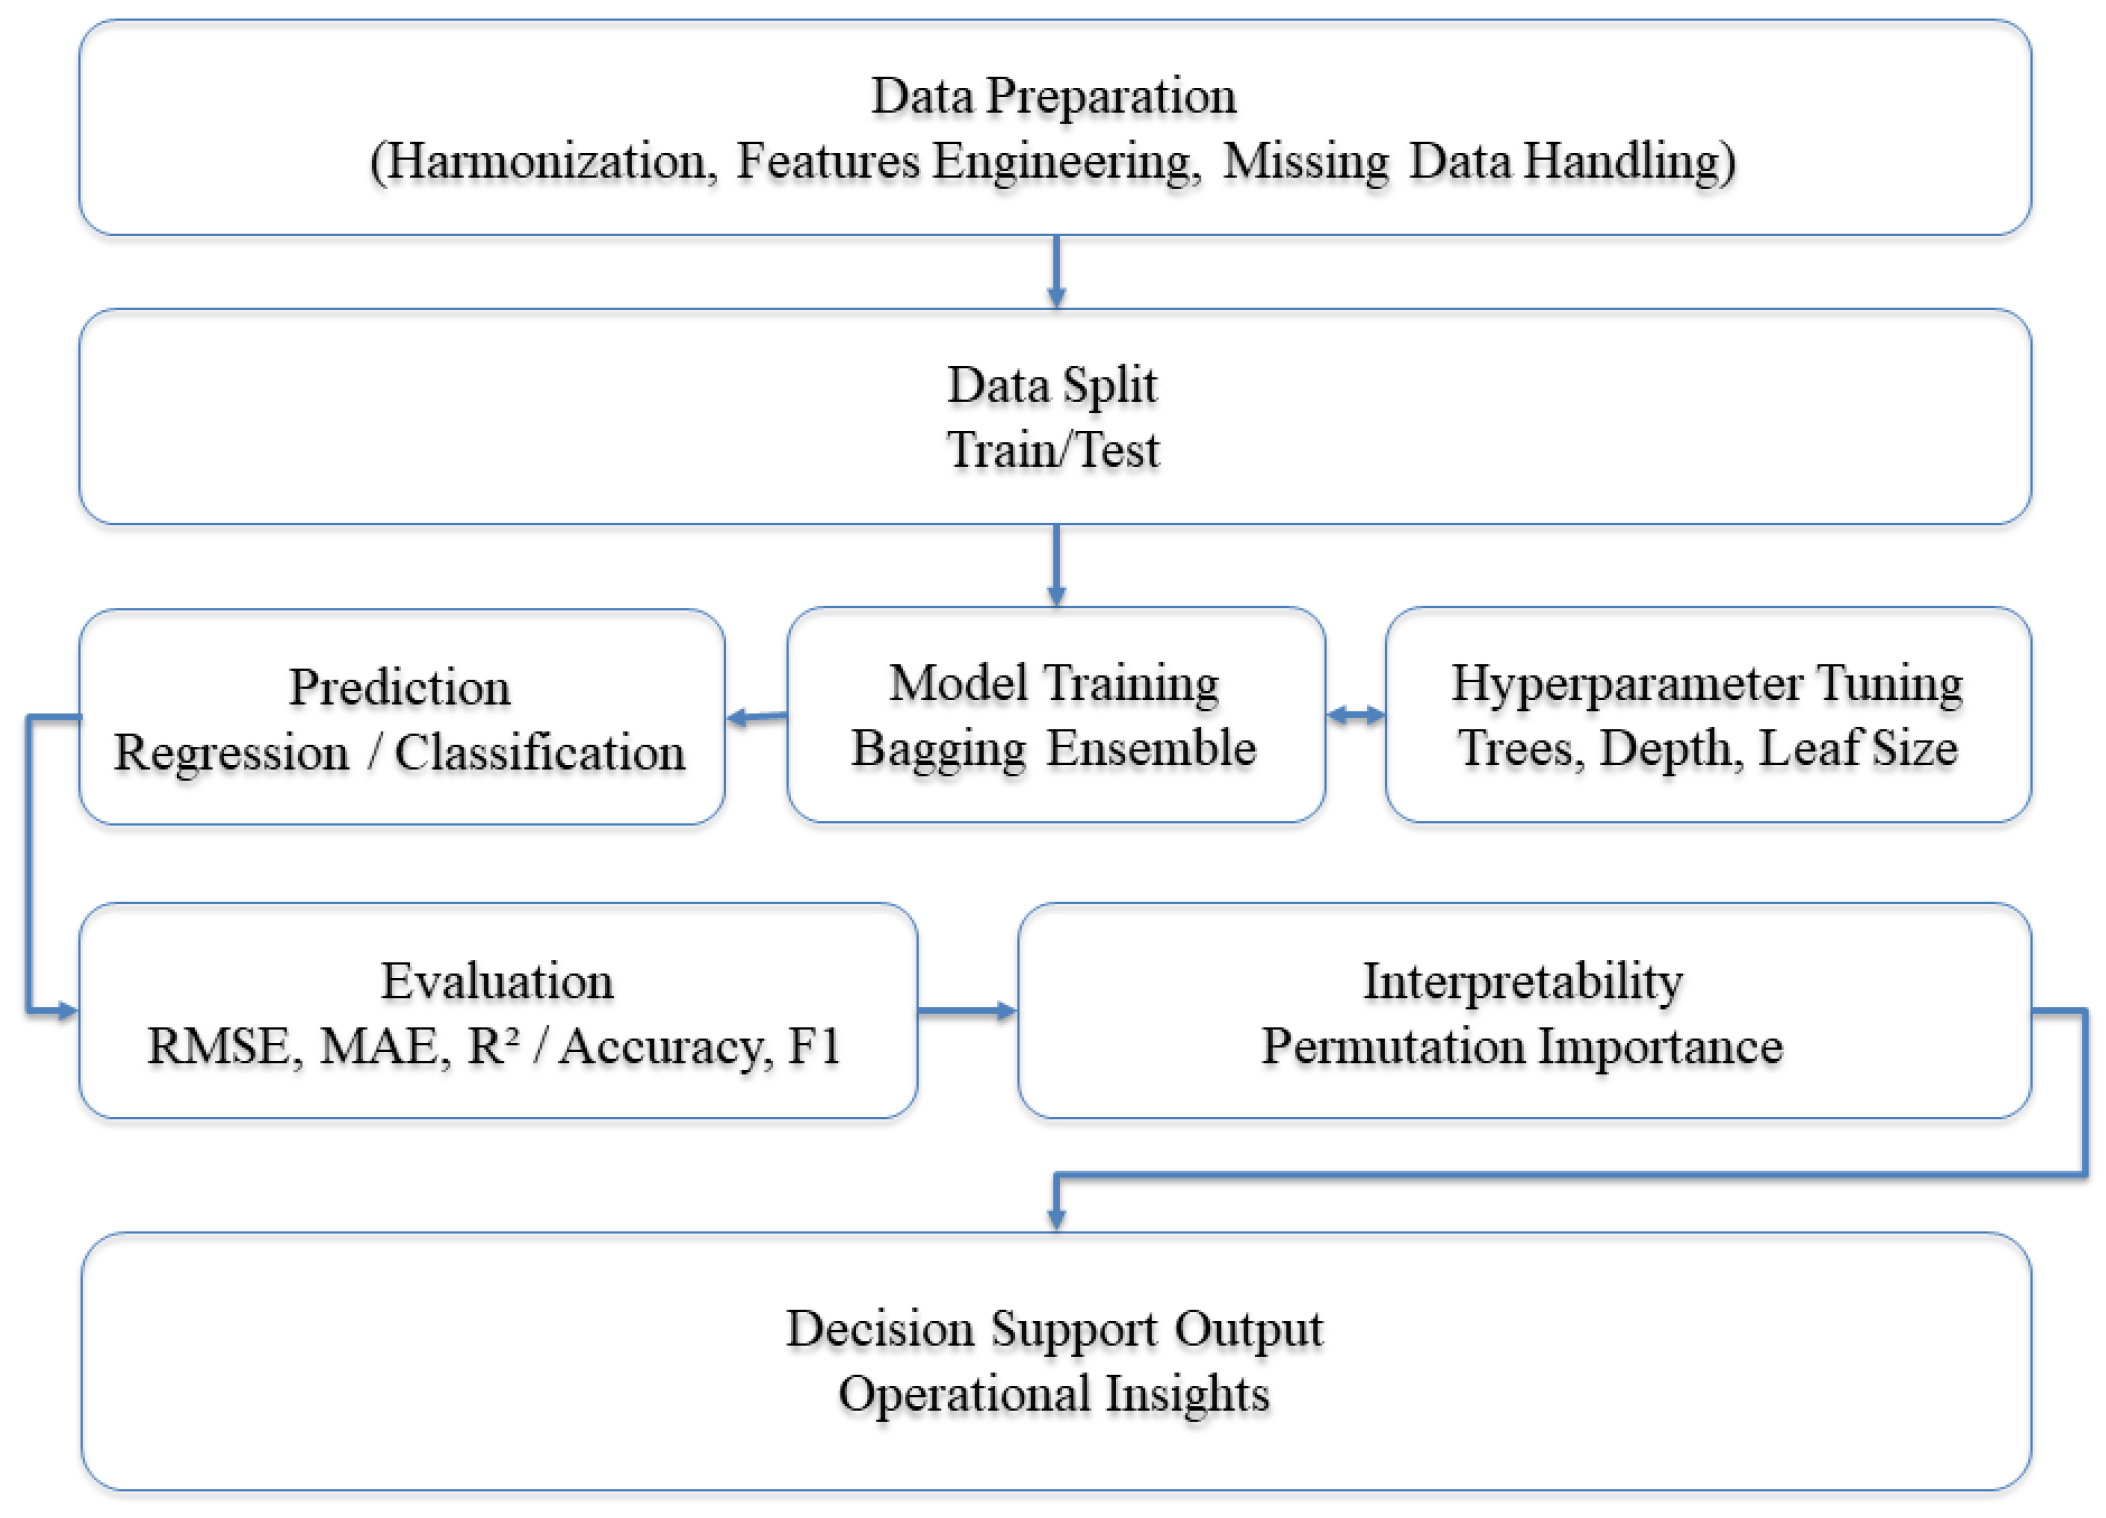
The study methodology, schematically depicted in
Figure 1, follows a structured, data-driven workflow designed to support productivity prediction and operational decision-making in container terminals. The workflow comprises five main steps: data acquisition, data processing and harmonization, feature engineering, machine learning modeling, and decision-support outputs.
The present study is based on a real-world operational dataset comprising 117 variables, of which 23 are derived features, collected over a three-year period (2023–2025) from quay crane operations at a conventional medium-sized container terminal. This temporal scope reflects a recent and operationally relevant phase marked by post-pandemic recovery, supply chain reconfiguration driven by geopolitical tensions and increased variability in maritime logistics. As such, the dataset captures both stabilized operational patterns and residual disruptions, providing a representative basis for analyzing productivity dynamics.
The dataset integrates multiple categories of variables. Temporal variables record key operational timestamps—such as berthing, handling start and end, and departure—enabling the computation of total berth time, effective working time, and idle intervals. Operational variables describe handling activity, including total container moves (in TEU and units), as well as equipment-related parameters such as the number of active quay cranes, mobile harbor cranes, and associated working hours. Additional variables capture vessel characteristics (type, service, length, berth allocation) and the broader operational context.
A core component of the dataset is the structured representation of operational delays, encoded through 27 distinct delay codes. These are recorded across operational phases (pre-operation, in-operation, and post-operation) and aggregated into three functional categories: internal delays (DC-I), external delays (DC-II), and exceptional events (DC-III). Aggregated delay indicators are further used as explanatory features in both regression and classification models.
The dataset comprises 1344 ship calls categorized into three operational classes: Feeder (1105 observations), Common (192), and MainLine (47). This distribution reflects the operational structure of the terminal, with Feeder traffic exhibiting higher frequency and greater stability, while MainLine operations remain comparatively underrepresented and more variable.
It should be noted that the MainLine vessel category is underrepresented in the dataset (47 observations), which may limit the statistical robustness and generalizability of the corresponding results. Consequently, findings related to this category should be interpreted with caution, and the analysis primarily emphasizes Feeder and Common traffic, where data density is significantly higher.
These data are provided under a confidentiality agreement and were used strictly within the constraints imposed by this arrangement. Access to and understanding of the operational environment were facilitated through a collaborative partnership, which enabled direct observation and analysis within the terminal. The use of real operational data allows for a faithful representation of the complexity and variability inherent in port activities—characteristics that are difficult to replicate in simulated or experimental settings.
Ship operations are carried out using quay cranes, which represent the critical node governing the flow of containers during ship handling. In this study, the operational context corresponds to a configuration of five ship-to-shore (STS) quay cranes, able to handle up to 8500 TEU vessels, each with a maximum lifting capacity of 70 tons, supplemented by one mobile harbor crane with a maximum capacity of 100 tons.
The allocation and utilization of terminal cranes are determined by operational requirements driven by vessel characteristics, including ship size, number of container rows, and maximum stacking height on deck. The mobile harbor crane is primarily used to support operational flexibility, particularly for smaller vessels such as barges or, when required, feeder ships. It is also employed in handling specialized cargo types, including containerized bulk (e.g., grains) and oversized cargo, thereby contributing to the diversification of terminal operations.
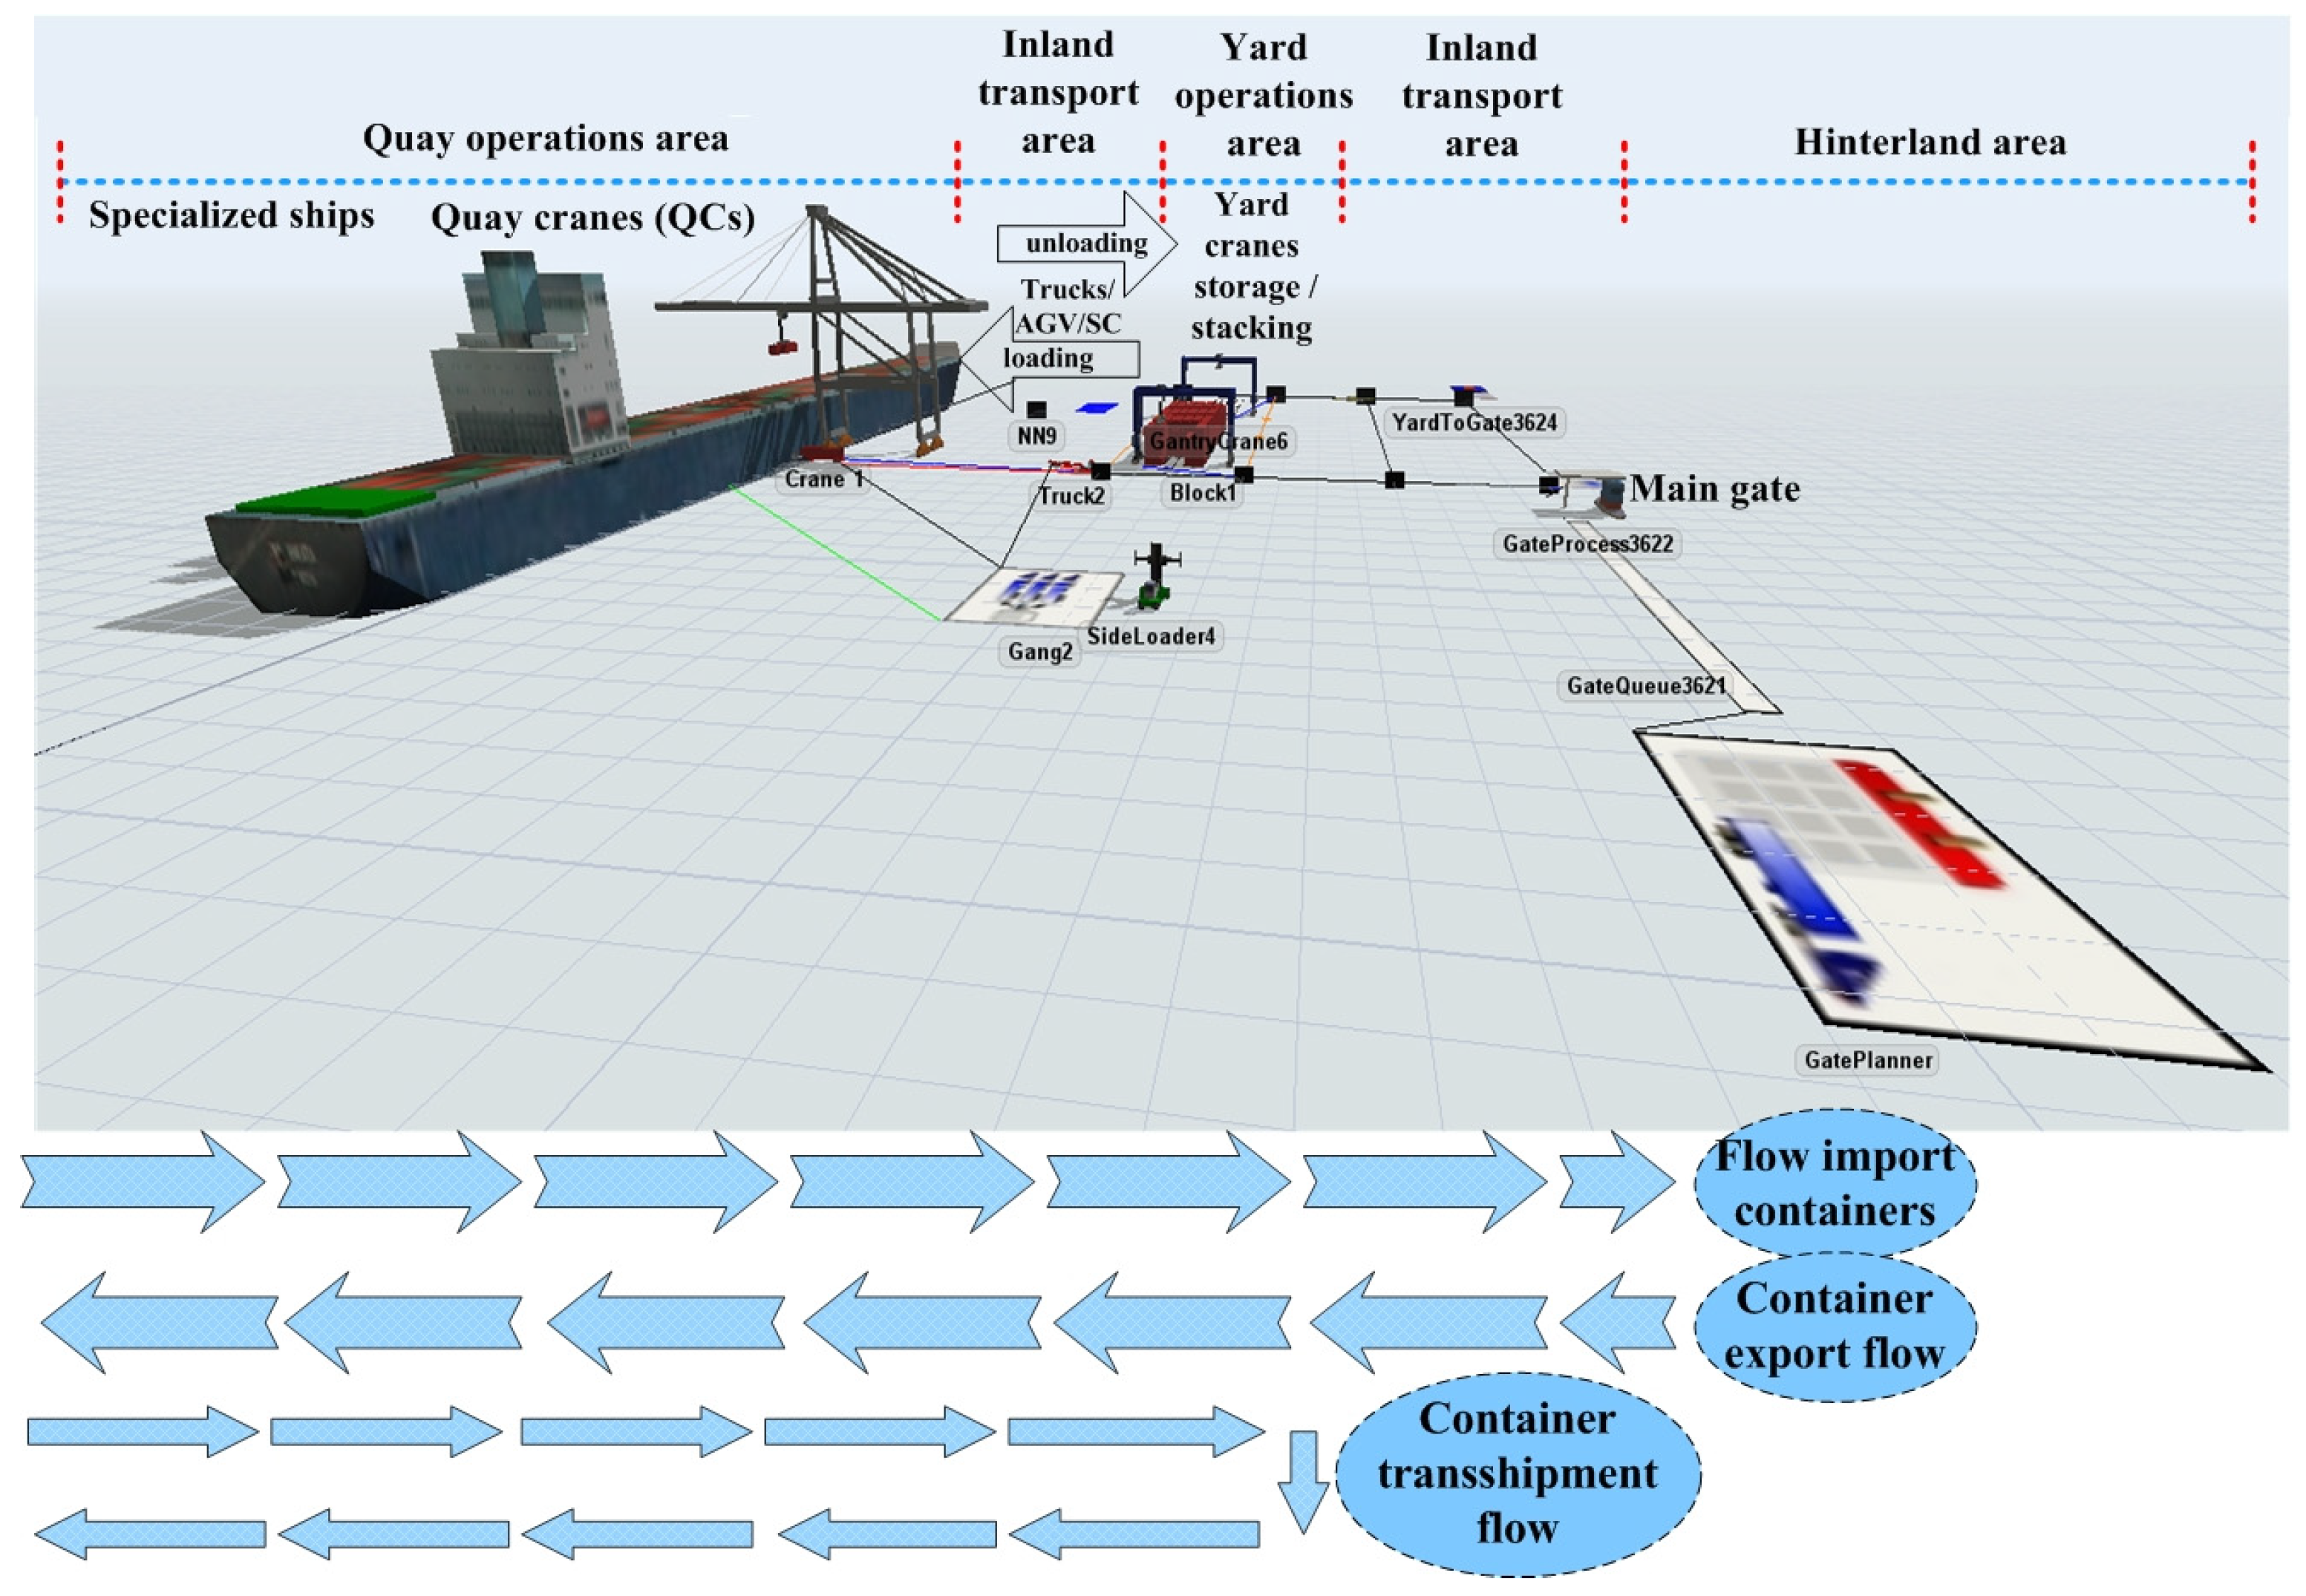
Figure 2 represents the graphical modeling using the FlexTerm modeling software (version 20.1.0) of the most common configuration of a conventional container terminal, according to the study model, to better understand the representation of the areas in which the quay cranes operate and the availability of the operating areas, which represent the main operational limitations.
The dataset is structured as monthly operational reports, documenting detailed information on ship calls, quay crane activity, and handling delays. These reports reflect standard container terminal performance monitoring practices and are routinely used to assess productivity levels and compliance with predefined performance indicators. Although the dataset spans only three consecutive years, it provides a high degree of granularity at the level of individual port calls. Each record (observation) corresponds to a completed operational cycle, enabling detailed micro-level analysis of quay crane productivity and delay patterns.
This ship-level granularity ensures a sufficient number of observations for statistical analysis and for training machine learning models across each operational category. The resulting data density enhances the reliability of results obtained through both regression and classification methods [
75,
76].
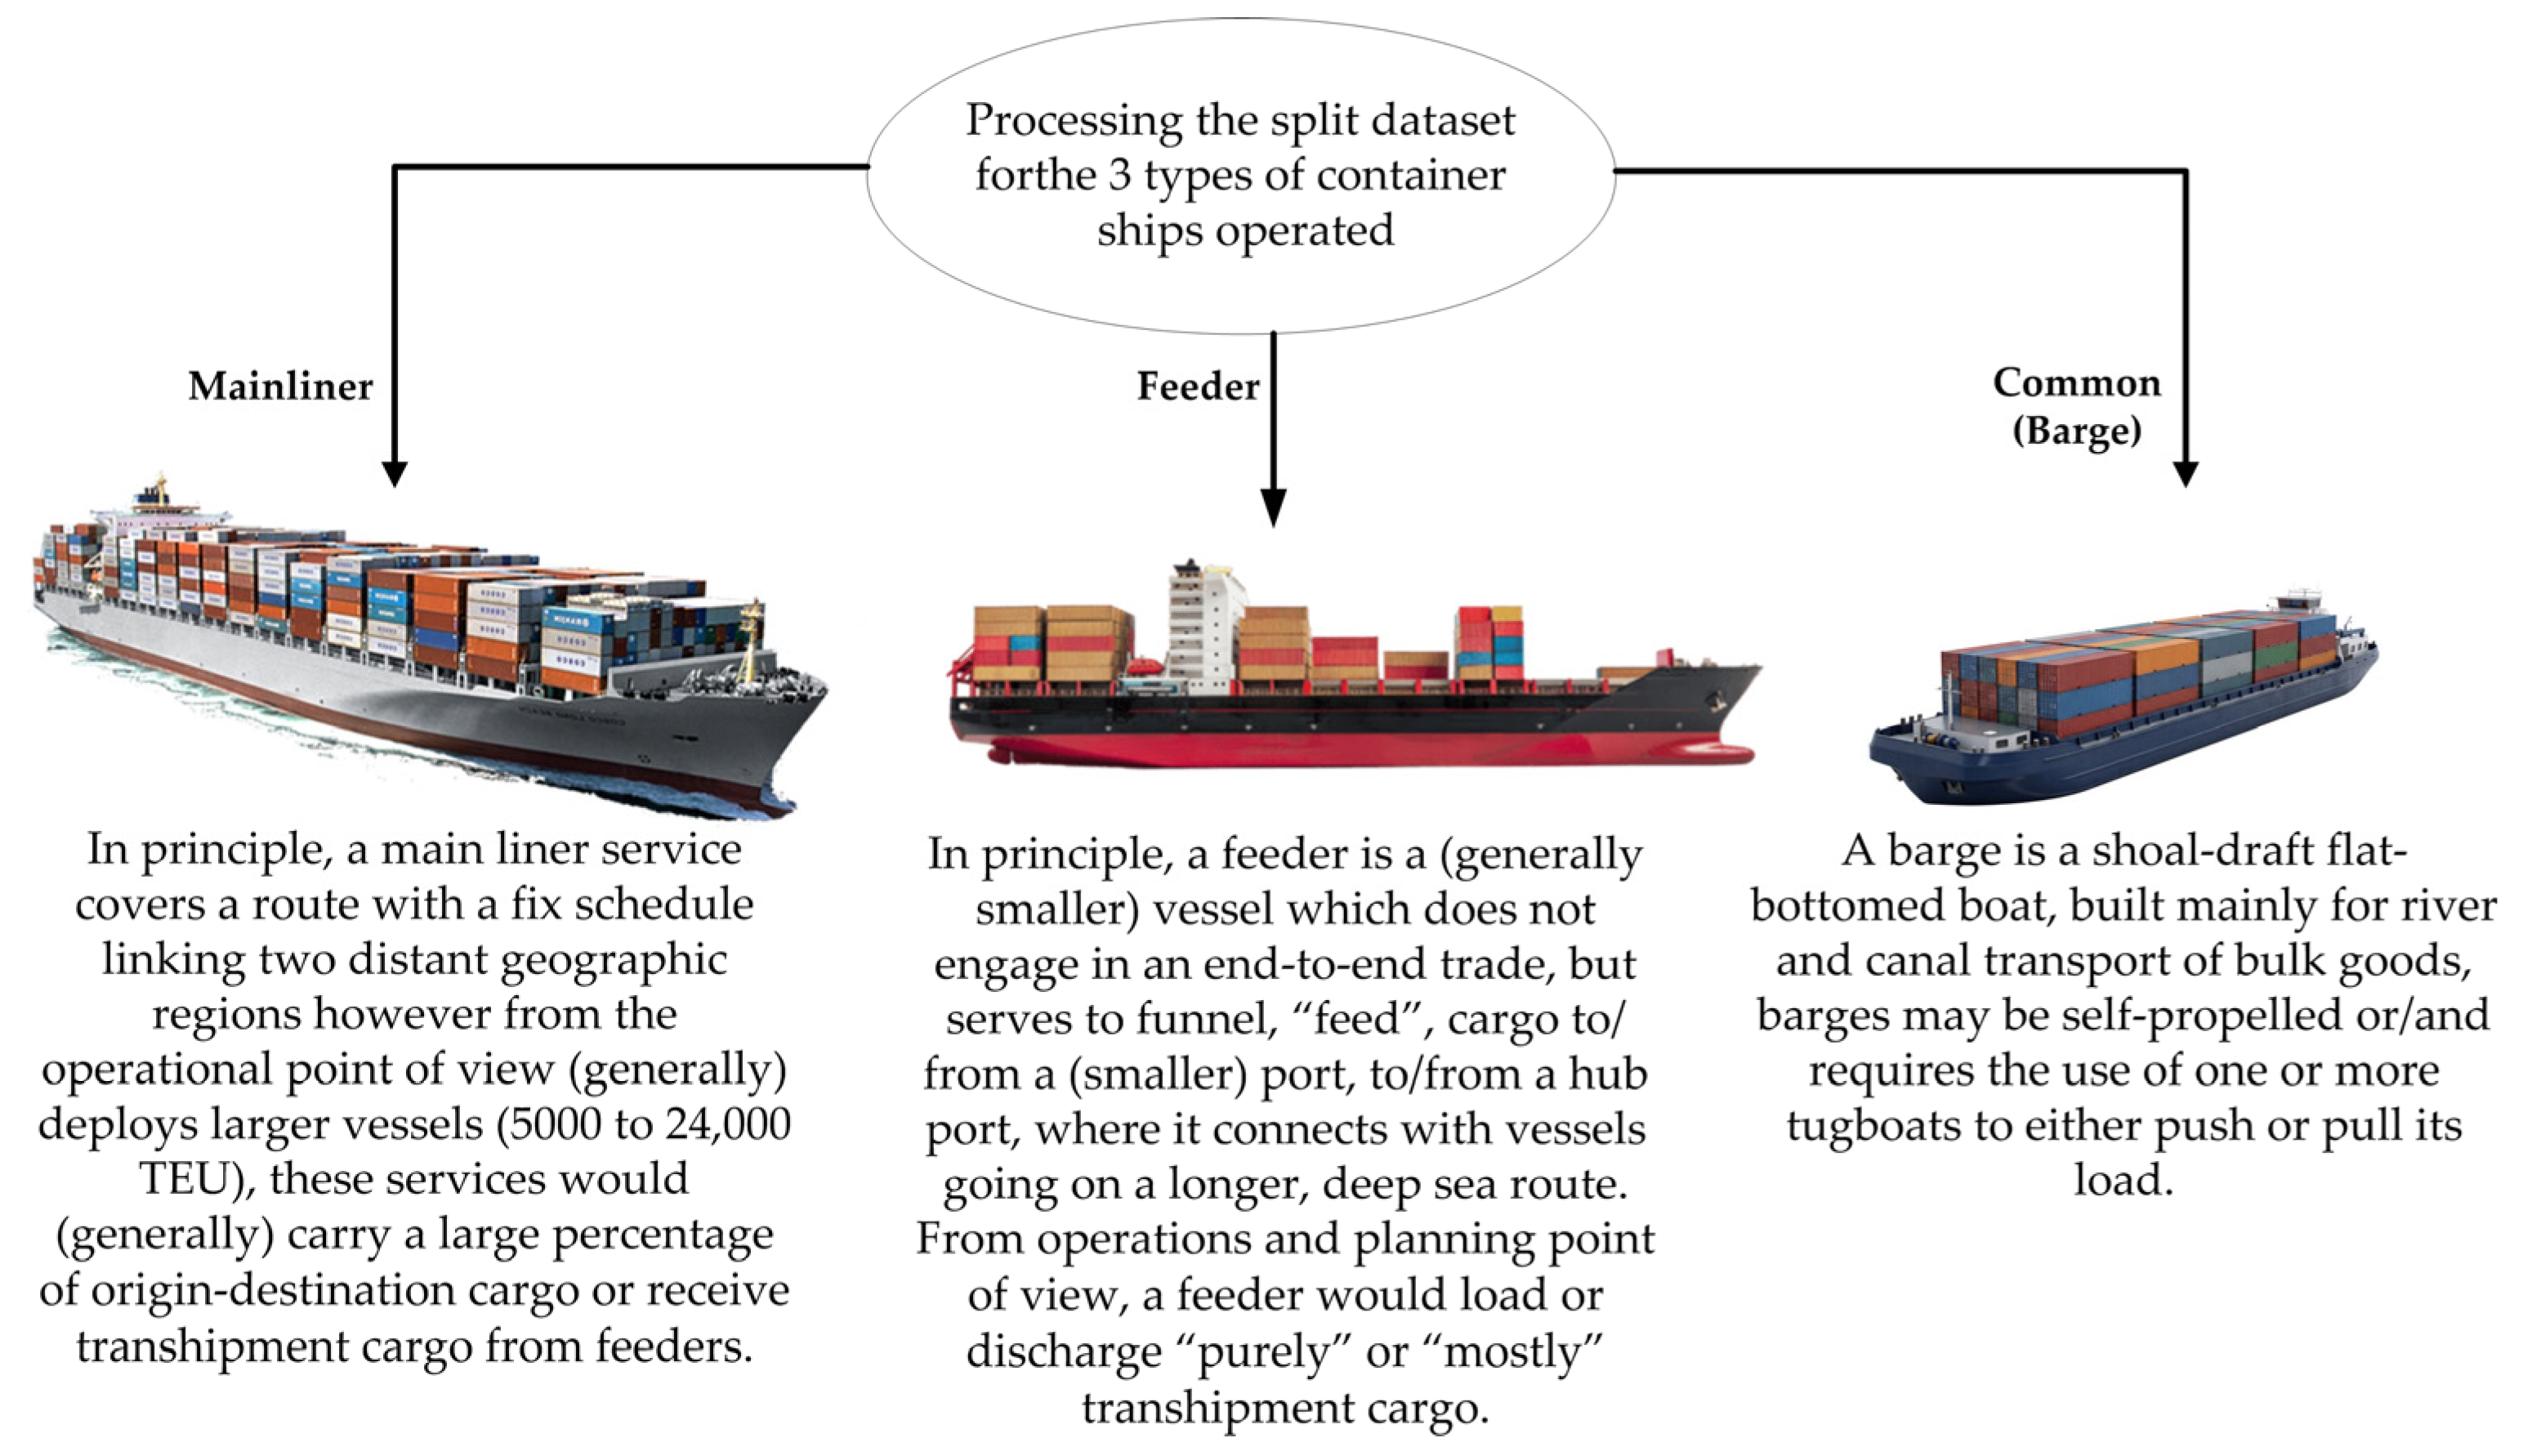
The dataset also captures variations across different ship categories (MainLine, Feeder, and Common ships, i.e., barges—
Figure 3), enabling consistent data aggregation and clear operational differentiation between service types at the quay. By combining multi-year operational data with ship-level granularity, the dataset provides a robust foundation for modeling quay crane delays and productivity dynamics. This supports both descriptive statistical analyses and advanced machine learning applications aimed at understanding and predicting terminal performance [
25,
77].
From an analytical perspective, the distinction between the three ship categories enables rigorous comparative modeling while avoiding aggregation biases that may arise from combining heterogeneous vessel types into a single dataset. Such aggregation could obscure structural differences in operational dynamics, particularly in crane allocation strategies and delay patterns [
78]. Category-based segmentation also facilitates the evaluation of the consistency of predictive relationships across service types, as well as the identification of variations driven by ship size, call frequency, and operational priority. These aspects are essential for understanding how congestion and quay crane delays propagate across different levels of the logistics network [
79]. Thus, the structured differentiation between MainLine, Feeder, and Common ships, as illustrated in
Figure 3, provides a coherent operational framework for empirical analysis. It supports both category-specific modeling and cross-category comparisons, thereby enhancing interpretability [
80].
3.1.2. Allocation and Use of Quay Cranes to Obtain Productivity Indicators
For each ship call at berth, the dataset includes detailed information on key operational timestamps, including the time of berthing (Ta), the time of departure (Tp), and the timestamps corresponding to the first (Mi) and last (Mf) handling cycles. These variables enable the calculation of effective operational duration and support the assessment of terminal resource utilization throughout the entire berthing period. Operational productivity is characterized through multiple metrics, including NMPH, GMPH, and WBMPH, each reflecting a distinct dimension of performance.
In addition to these established indicators, the study introduces a new quay crane productivity metric, defined as the ratio between the total number of moves performed and the effective working hours of the cranes. This multi-indicator framework allows performance to be analyzed from complementary perspectives. Rather than relying on a single metric, the approach distinguishes between equipment-level efficiency, net operational responsiveness, and berth-level performance. As each metric follows a different normalization logic and exhibits a specific sensitivity to delays, their combined use enables a more comprehensive understanding of the interaction between delays, resource allocation, and operational conditions.
A central component of the dataset concerns the allocation and utilization of quay cranes. For each ship call, the number of handling resources assigned to the operation is recorded, including quay cranes and auxiliary equipment used for inland container transport. This level of detail provides a structured representation of how resources are distributed at berth and constitutes a fundamental basis for the analysis of operational performance.
The allocation of quay cranes represents a critical operational decision, as it directly influences vessel turnaround time and overall terminal productivity. The number of cranes assigned to a vessel determines the handling capacity available during the port call. Consequently, variations in resource allocation can lead to significant differences in performance indicators.
From an analytical perspective, the inclusion of crane allocation and utilization variables enhances the explanatory and predictive power of the models. These variables act as structural determinants of performance and enable the identification of productivity losses associated with resource constraints and delay-related disruptions. By capturing both quantitative and qualitative aspects of resource distribution, the dataset provides a robust foundation for modeling the relationship between quay crane configuration, congestion dynamics, and productivity.
3.1.3. Definition and Classification of Delays Contributing to the Calculation of QC Productivity
The dataset includes a detailed representation of delay codes, organized into 27 distinct categories. These capture delays occur both within the operational service window of vessels—defined between the first and last handling cycles—and outside it, namely before the start and after the completion of operations. For each port call, delays are recorded at a granular level, enabling their aggregation based on temporal position within the operational cycle and underlying causes. This approach provides a more consistent analytical basis than methods relying solely on aggregate delay indicators [
81].
In addition to temporal aggregation, delay codes are grouped into three main categories: internal delays attributed to the terminal (DC-I), delays generated by external factors related to vessels or scheduling (DC-II), and delays caused by exceptional events, such as force majeure (DC-III). Internal delays typically reflect equipment failures, workforce constraints, or inefficient planning, while external delays may be associated with weather conditions, delayed vessel arrivals, or coordination issues beyond the terminal’s direct control. Exceptional delays correspond to rare and unpredictable disruptions. This structured framework for coding and classifying delays provides a consistent basis for analyzing the relationship between operational disruptions and productivity outcomes.
To ensure terminological clarity, these categories are consistently referred to throughout the manuscript as DC-I (internal delays), DC-II (external delays), and DC-III (exceptional events).
3.1.4. Data Processing and Matching for ML Algorithm Training
Operational data undergo a preprocessing stage prior to modeling. This process includes harmonizing variable structures across the analyzed years, standardizing column naming conventions, converting data types into consistent numerical or categorical formats, and systematically handling missing values. These steps are essential to ensure dataset consistency and reliability across machine learning models [
82].
Missing data are addressed using carefully selected strategies to preserve as much information as possible without compromising data quality. Variables with excessive missing values are removed to avoid biasing the analysis, while remaining gaps are treated using controlled statistical imputation, primarily through median substitution. This approach minimizes the influence of extreme values and helps maintain the stability and balance of the dataset.
In its processed form, the dataset supports both productivity estimation and delay classification tasks. The diversity of variables and the large number of observations at the ship-call level enable the application of advanced analytical methods while preserving the practical relevance of the results for terminal management and operational decision-making.
3.2. Feature Engineering and Methodology
3.2.1. Overview of the Analytical Process and Harmonization of Data for the Study
The analytical process was designed as a standardized and reproducible workflow, ensuring consistency across years and ship categories. In the initial stage, data from different years and traffic types were imported, harmonized, and integrated into a unified structure through the standardization of variable names, alignment of data types, and correction of formatting inconsistencies. This step was necessary due to structural variations in operational reports across the 2023–2025 period.
Subsequently, a feature engineering phase was conducted, during which relevant derived variables were generated, including aggregated delay indicators, crane allocation parameters, and productivity metrics. These transformations enable the capture of complex operational relationships within the dataset. Missing data were handled by removing variables with a high degree of incompleteness and applying median-based imputation to the remaining values, thereby preserving distributional properties and minimizing statistical distortion.
Based on the processed dataset, machine learning models were developed for both regression (productivity prediction) and classification (operational state identification). Model performance was evaluated using statistical metrics, graphical analyses, and variable importance assessments. The workflow also includes the automated generation of outputs, such as synthetic indicators, visualizations, and rankings of key influencing factors.
A central element of the methodological framework is the use of two complementary analytical modes. The “forecast” mode utilizes all available information to maximize predictive accuracy, while the “decision” mode excludes variables dependent on final outcomes in order to simulate real-world operational decision-making conditions. This dual approach enables both validation of model explanatory power and assessment of practical applicability, ensuring a balance between methodological rigor and operational relevance.
3.2.2. Target Definition: Productivity Indicators
The regression component of the study relies on four standardized productivity targets—RQCP (Raw Quay Crane Productivity), GMPH (Gross Moves Per Hour), NMPH (Net Moves Per Hour), and WBMPH (Working Berth Moves Per Hour)—which capture distinct yet complementary dimensions of operational performance and together provide a multi-dimensional representation of terminal efficiency.
NMPH reflects the ratio between effective container moves and net operational time. Because it excludes certain non-productive intervals, it is particularly sensitive to interruptions and operational delays. As such, NMPH serves as a delay-aware performance indicator and is well suited for assessing operational responsiveness.
GMPH captures overall handling intensity under gross working conditions. This indicator reflects the broader performance environment and incorporates time intervals that may include partial inefficiencies. It provides a stable reference metric frequently used in operational reporting.
WBMPH introduces an additional normalization mechanism based on the reporting framework adopted by the terminal. By incorporating weighting logic related to berth occupation or operational structure, WBMPH offers a hybrid perspective that balances crane-level productivity with berth-level aggregation effects.
RQCP isolates crane-level efficiency by focusing directly on quay crane output relative to working time. It is defined as:
The formulation of productivity indicators is designed to directly reflect fundamental operational variables, based on primary data generated by terminal activities. This approach avoids reliance on opaque internal formulas or excessive aggregation and enables intuitive performance interpretation by explicitly relating operational volume to effective working time. To ensure numerical consistency, observations with zero or negative working hours are excluded, as they would produce undefined or distorted values and adversely affect model stability.
In selecting target variables, the BMPH indicator was excluded alongside NMPH, GMPH, WBMPH, and RQCP, as it exhibits a high degree of informational overlap with GMPH without providing additional analytical value. Moreover, its aggregated nature at the berth level limits its ability to capture equipment-level performance variations, which are critical for operational decision-making. The use of complementary indicators enables the analysis of multiple performance dimensions—from crane-level efficiency to aggregated operational dynamics—while highlighting differences in sensitivity to delays and resource allocation. This multi-indicator approach enhances both predictive accuracy and the conceptual robustness of the analytical framework.
For classification tasks, continuous delay-related variables were discretized into categorical classes (Low, Medium, High) to facilitate operational interpretability and decision-oriented analysis. Threshold selection followed a data-driven approach, combining empirical distribution analysis with operational relevance. Specifically, percentile-based thresholds were used to partition the data into intervals that preserve the natural distribution of delays while ensuring adequate representation of each class.
This approach enables the classification framework to capture meaningful distinctions between normal, moderate, and critical delay conditions, rather than relying on arbitrary cut-off values. In addition, preliminary sensitivity analyses were conducted by varying threshold boundaries slightly, confirming that classification patterns and model performance remained stable, particularly for extreme categories. This indicates that the results are robust to minor variations in threshold selection.
3.2.3. The RQCP and QC Allocation Problem
The dataset for each ship call includes detailed information on quay crane activity and associated mobile equipment, providing an accurate representation of resource utilization during operations. These variables reflect not only effective equipment use but also planning decisions and operational constraints at the time of execution. During preprocessing, raw data are transformed into synthetic indicators, such as the number of simultaneously active cranes, which captures both allocated capacity and operational intensity at the berth.
This indicator is incorporated into the analytical models as a numerical variable, enabling the evaluation of how resource allocation influences both productivity and delay severity. The approach does not focus on individual crane performance but rather on the aggregated effect of available resources, resulting in a more realistic representation of operational strategies. Consequently, the models capture how variations in equipment allocation affect overall performance, highlighting the relationship between resource planning and congestion dynamics.
In parallel, RQCP is defined as the ratio between total operational volume and effective working time, providing a direct measure of equipment efficiency. Its calculation includes the exclusion of invalid values (zero or negative working hours) to prevent distortions and ensure interpretability.
The integration of RQCP within the analytical framework enables comparison with other productivity indicators and supports the assessment of the extent to which observed variations can be explained by operational factors such as delays and crane allocation. Due to its direct linkage to primary data, RQCP serves as a stable benchmark for validating predictive models, thereby reinforcing both the methodological robustness and the practical relevance of the results for terminal decision-making.
3.3. Machine Learning (ML) Methodology
3.3.1. Decision vs. Forecast Mode
The machine learning (ML) methodology adopted in this study is structured around two complementary analytical regimes, referred to as “forecast mode” and “decision mode,” each addressing distinct objectives related to the evaluation of operational performance.
Forecast mode relies on the complete set of information available after the completion of operations, including variables such as total move volume and effective working hours, and is intended for retrospective analysis. Within this framework, models benefit from full information, enabling the estimation of the upper bound of predictive performance and providing a theoretical benchmark for how well operational outcomes can be explained by the available variables. This regime facilitates the identification of structural relationships between operational factors and performance outcomes under ideal informational conditions.
In contrast, decision mode simulates real-world operational planning conditions, where certain information is not yet available. By excluding variables that may introduce data leakage, models are trained exclusively on data accessible prior to or at the beginning of operations, thereby providing a realistic assessment of predictive utility in decision-making contexts. This distinction allows for the simultaneous evaluation of both explanatory capacity and practical applicability.
Both regimes employ ensemble techniques based on bagging (bootstrap aggregating), selected for their ability to reduce prediction variance and ensure robustness in the presence of heterogeneous and highly variable operational data typical of container terminals. The detailed configuration and implementation of these models are presented in
Section 3.3.3.
The practical relevance of the dual-mode framework is further supported by the interpretation of decision mode as a proxy for real-world planning conditions. By restricting the input space to pre-operational variables, this mode replicates the informational constraints faced by terminal planners during resource allocation and scheduling decisions.
The validity of this approach is reinforced by the consistency of predictive performance observed between the two modes, particularly for structurally driven indicators such as GMPH and RQCP. The relatively small performance gap between forecast and decision scenarios suggests that a substantial portion of predictive information is embedded in pre-operational variables, supporting the applicability of the framework for decision-support purposes.
Although direct benchmarking against existing decision-support systems is beyond the scope of this study, the proposed approach provides a reproducible and interpretable analytical baseline that can be integrated into operational workflows. It supports the proactive identification of high-risk scenarios, such as congestion and delay accumulation.
Overall, this design also serves as a form of indirect validation, as decision mode replicates real-world informational constraints, allowing for the assessment of model performance under realistic implementation conditions.
3.3.2. Robust Missing-Data Handling
Data in container terminals is often incomplete and inconsistent due to diverse reporting practices over time, vessel types, and operational procedures, leading to missing or inaccurately recorded information. Addressing missing data is crucial for maintaining analytical integrity and model performance, especially in machine learning applications.
The strategy outlined in this research is systematic and progressive, seeking a balance between data preservation and analytical robustness. Initially, variables with substantial incompleteness are eliminated using predefined criteria to mitigate unreliable data influences. Subsequent imputation of missing values in remaining variables is conducted using the median, a robust measure suitable for skewed distributions common in port data. This method is applied selectively to pertinent datasets for analyses to prevent artificial enhancements in performance and ensure real-world applicability.
The findings endorse the efficacy of this approach over simplistic imputation methods, enhancing model stability and prediction accuracy by maintaining data structure while mitigating errors and fluctuations. This methodology is well suited for heterogeneous operational settings where data quality fluctuates, providing a sturdy basis for performance modeling in container terminals.
3.3.3. Model Implementation and Configuration
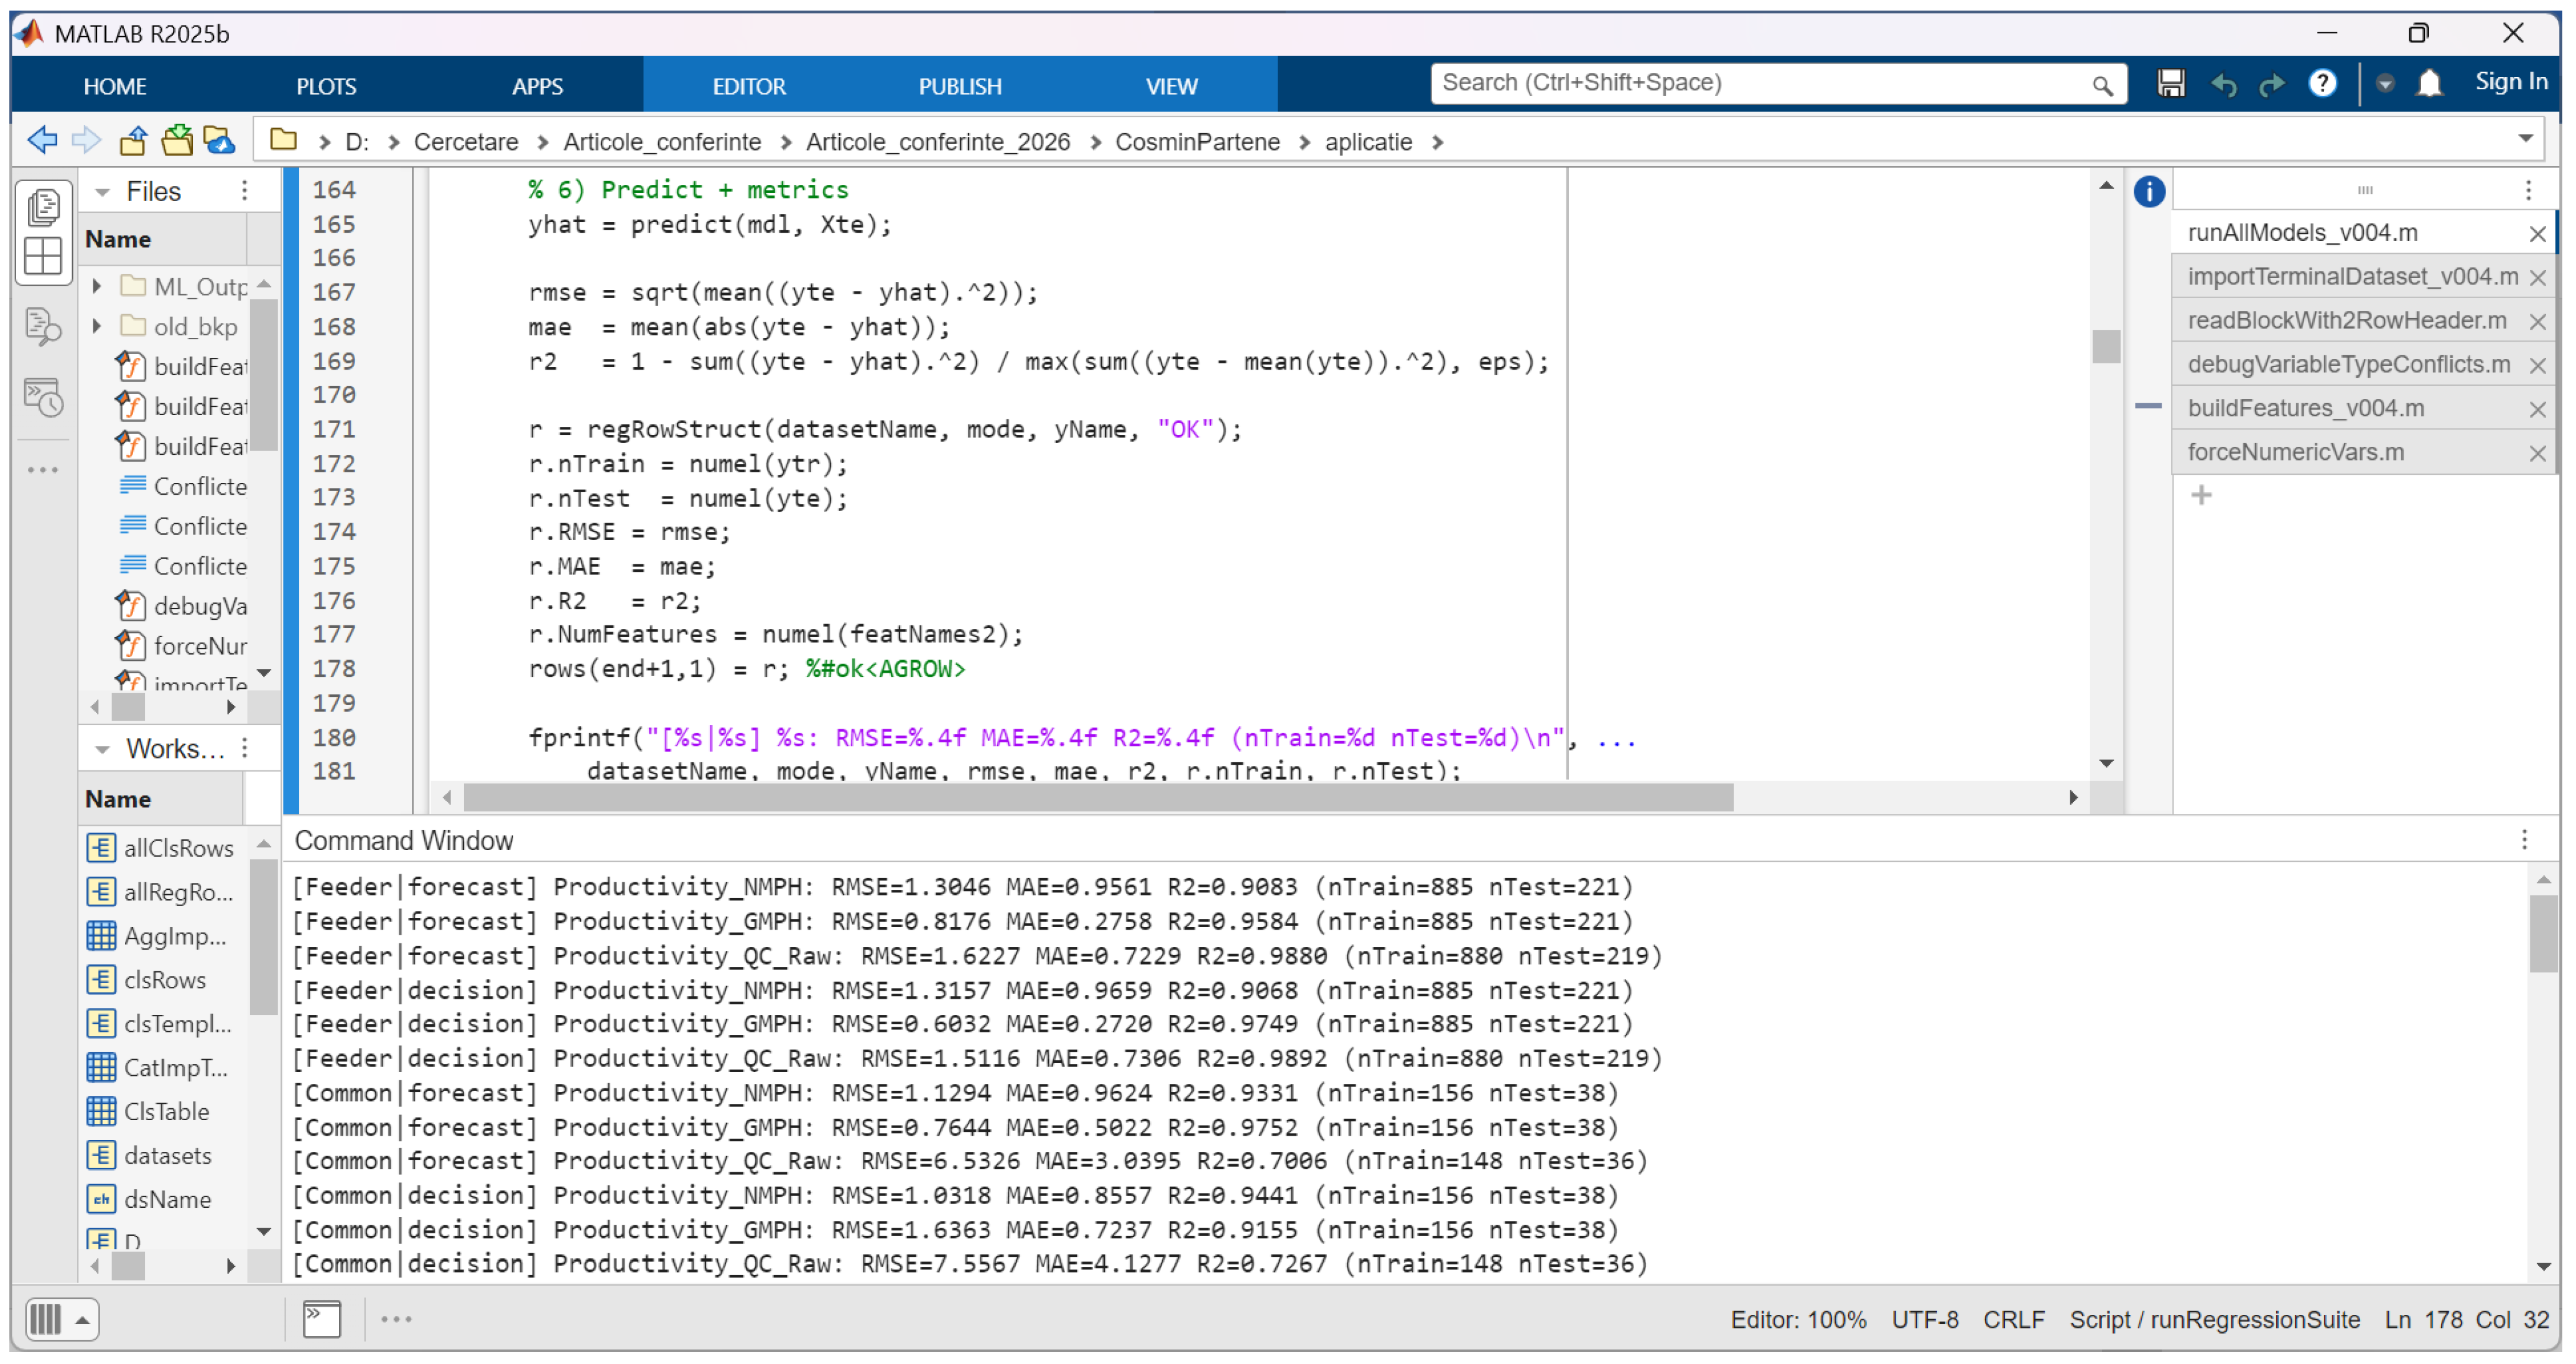
The machine learning models employed in this study (
Figure 4) are based on ensemble techniques using bootstrap aggregating (bagging), selected for their robustness to noise, ability to reduce variance, and suitability for heterogeneous operational datasets. Each ensemble model consists of multiple decision trees trained on bootstrap samples, with final predictions obtained through aggregation (mean values for regression and majority voting for classification).
The training process was designed to balance predictive performance and generalization capability. Hyperparameter tuning was conducted empirically, focusing on key parameters such as the number of trees, maximum tree depth, and minimum leaf size. The number of estimators was progressively increased until convergence of prediction error was achieved, thereby avoiding overfitting while maintaining model stability.
To ensure methodological transparency and reproducibility, the dataset was partitioned into training and testing subsets using a hold-out validation strategy, ensuring that model performance was evaluated on unseen data. The split ratio was selected to preserve the representativeness of each ship category while maintaining sufficient data for training. This approach provides a realistic assessment of predictive capability in operational contexts and preserves the integrity of operational sequences, avoiding artificial data mixing that may arise from cross-validation in structured datasets.
Model performance was evaluated using standard statistical metrics: Root Mean Square Error (RMSE), Mean Absolute Error (MAE), and coefficient of determination (R2) for regression tasks, and Accuracy and Macro-F1 score for classification tasks. Variable importance was assessed using permutation-based methods, enabling the identification of the most influential operational factors and enhancing model interpretability.
Cross-validation techniques were considered but not systematically applied due to the moderate sample size in certain categories (e.g., MainLine ships) and the risk of introducing artificial mixing across operational contexts. Instead, robustness was assessed through consistency of results across multiple indicators and ship categories, as well as through sensitivity analyses under varying operational conditions.
Model configuration was guided by a balance between predictive accuracy, stability, and interpretability—key requirements in operational decision-support environments. Default parameter ranges were initially considered and subsequently refined through iterative testing, with performance monitored across both training and testing datasets to ensure generalization.
Model comparison was conducted using both statistical performance metrics and operational interpretability criteria. In addition to numerical accuracy, models were evaluated based on their ability to provide meaningful insights into operational processes through feature importance analysis. This evaluation framework ensures that the selected models are both statistically robust and practically relevant.
The choice of ensemble-based models over more complex approaches, such as boosting techniques or deep learning architectures (e.g., LSTM, GRU, or transformer-based models), was motivated by several factors. These include the structured nature of the dataset, the moderate sample size, and the need for interpretability in operational contexts. While advanced models may offer strong predictive performance, they typically require larger datasets, involve higher computational costs, and reduce transparency, limiting their practical applicability.
In contrast, bagging-based ensemble methods provide a robust and interpretable modeling framework, offering a favorable trade-off between accuracy, stability, and explainability. This makes them particularly suitable for real-world implementation in container terminal operations, aligning with the objective of developing a reproducible and operationally applicable predictive framework.
4. Results
This section presents the empirical results obtained from applying the proposed machine learning framework to the operational dataset. The analysis covers both regression and classification tasks. Model performance is evaluated across different productivity indicators and ship categories. Results are reported for both forecast and decision modes, allowing a comparative assessment of predictive accuracy under ideal and operationally realistic conditions. The findings are supported by graphical representations, performance metrics, and variable importance analyses. Together, these provide a comprehensive view of the models’ explanatory capacity and practical relevance.
The graphical representations included in this section serve two main purposes: illustrating model performance and enhancing interpretability. The analysis includes visual comparisons between observed and predicted values. It also examines distribution patterns, dispersion around the ideal diagonal, and class-level performance using confusion matrices. Although explicit confidence intervals are not presented, model uncertainty is reflected indirectly through the spread of observations and the consistency of results across ship categories and modeling regimes. In addition, differences between forecast and decision modes are analyzed, alongside variations across productivity indicators. This comparative approach provides a contextual benchmark for evaluating model robustness.
4.1. The Experimental Setup of the Study
The experimental framework was designed to evaluate the ability of machine learning models to predict the operational performance of a container terminal using data collected over a three-year period. The dataset supports both the numerical estimation of productivity (through regression) and the classification of operational conditions (by identifying delay severity or dominant causes). Prior to model development, the data were harmonized across years and ship categories by standardizing variable names and correcting formatting differences, thereby ensuring a unified and consistent analytical basis.
The methodology incorporates two distinct analytical modes: “forecast,” which utilizes all available information, and “decision,” which excludes variables that could introduce data leakage and is oriented toward decision-making prior to the start of operations. Missing data were handled systematically to maintain model stability by removing variables with a high degree of incompleteness and imputing the remaining values using the median. Ensemble methods based on bagging were employed for modeling, given their suitability for heterogeneous and variable data, and the dataset was divided into training and testing subsets to ensure a reliable evaluation of model performance.
Model performance was assessed using standard metrics, including RMSE, MAE, and R2 for regression, and accuracy and Macro-F1 score for classification, complemented by variable importance analysis and confusion matrices. The experiments were conducted in a controlled environment to ensure reproducibility, and models were developed separately for each ship category in order to avoid distortions caused by operational heterogeneity. Cases with insufficient observations were identified and excluded, thereby ensuring the validity and robustness of the results.
Accordingly, the experimental design presented in
Figure 5 was structured to ensure both methodological validity and practical relevance. By clearly distinguishing between forecasting and decision-support scenarios, the framework enables the evaluation of both the theoretical predictive capacity of the models and their practical applicability in terminal management.
4.2. Forecast Mode Results (Regression Performance)
4.2.1. Net Moves per Hour Prediction
The prediction of the NMPH indicator represents a central component of the empirical analysis, as it reflects the effective operational intensity of quay crane activities during active handling intervals. By excluding non-productive periods, NMPH provides a measure of net performance under real operating conditions. From this perspective, the indicator is both challenging to model and operationally relevant, as it is particularly sensitive to the structure of delays and the efficiency of crane allocation.
Regression models for NMPH prediction were developed separately for each ship category in order to ensure structural homogeneity of the data and to capture differences across operational contexts. In forecast mode, the inclusion of temporal variables and operational volume indicators significantly enhanced the explanatory power of the models, enabling them to capture nonlinear relationships between operation duration, resource utilization, and productivity levels. In decision mode, a slight decrease in performance was observed; however, the models retained meaningful predictive capability for decision support. This is because variables prone to data leakage were excluded, and the models relied primarily on crane allocation, delay structure, and operational characteristics.
Across the analyzed datasets, NMPH exhibited a moderate to high degree of predictability, influenced by sample size and operational variability. The datasets corresponding to the Feeder and Common categories, characterized by a larger number of observations and more stable operational patterns, yielded superior results compared to the MainLine category, where the limited sample size constrained the robustness of the conclusions.
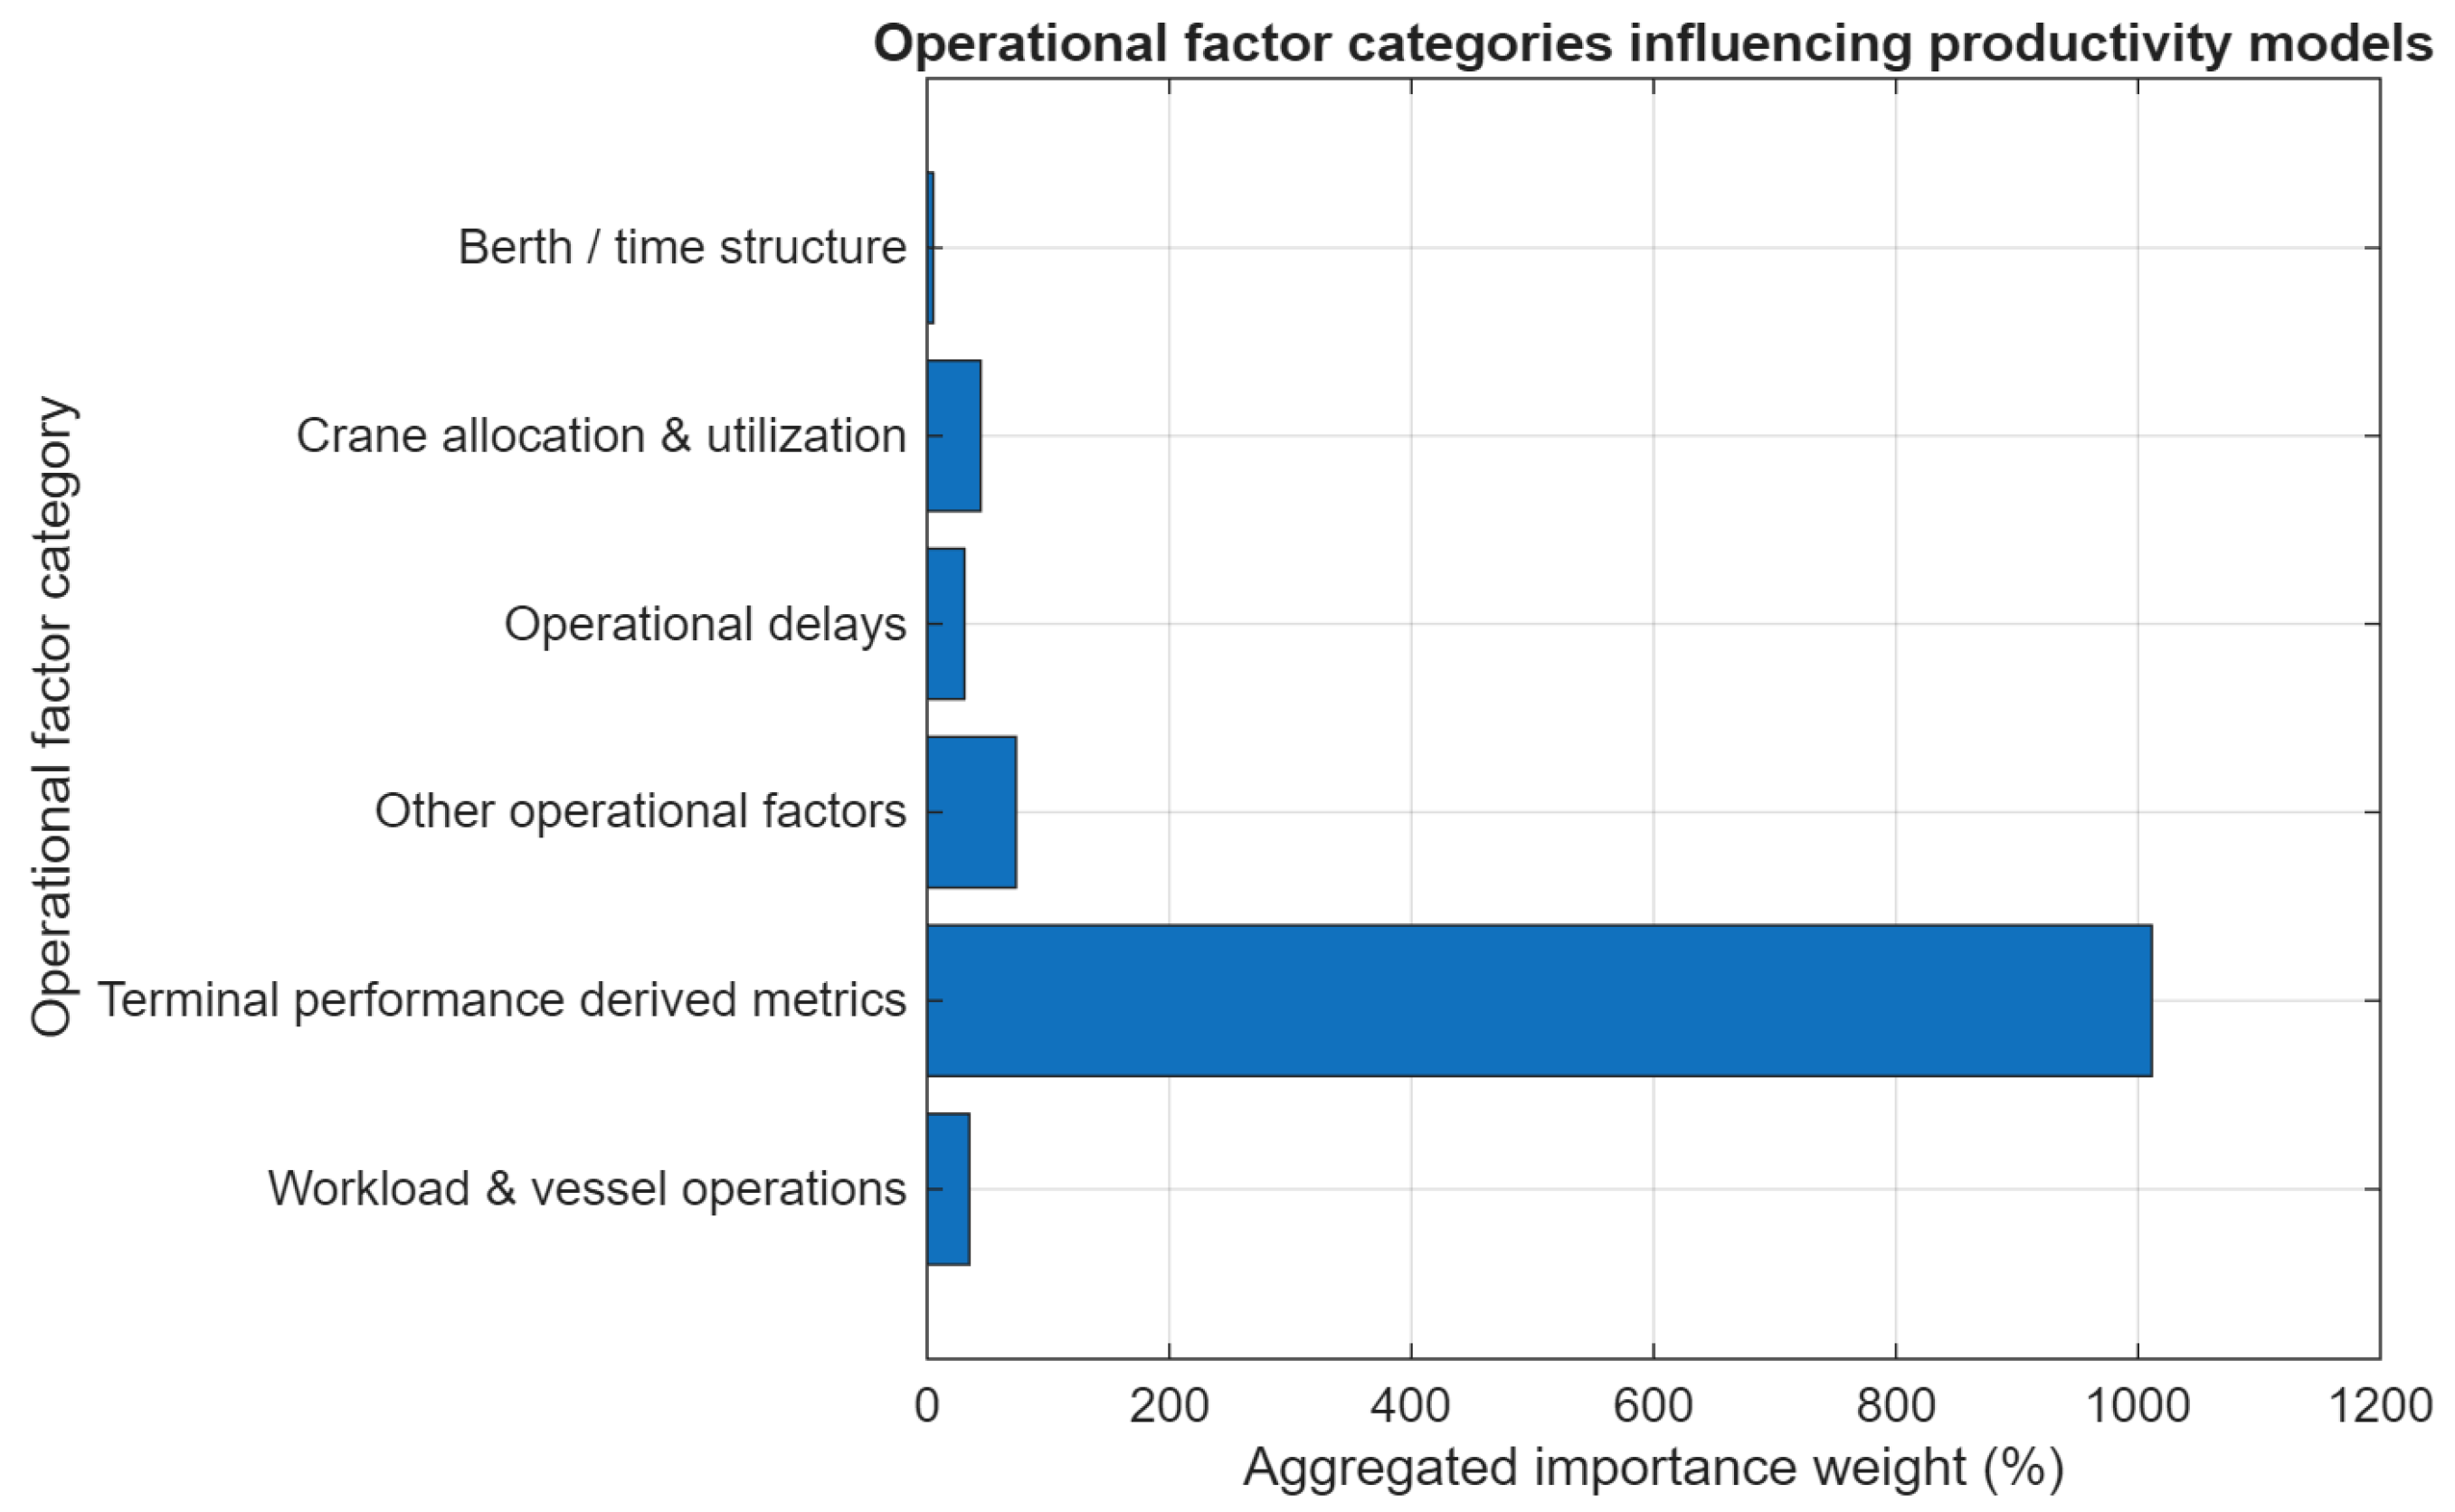
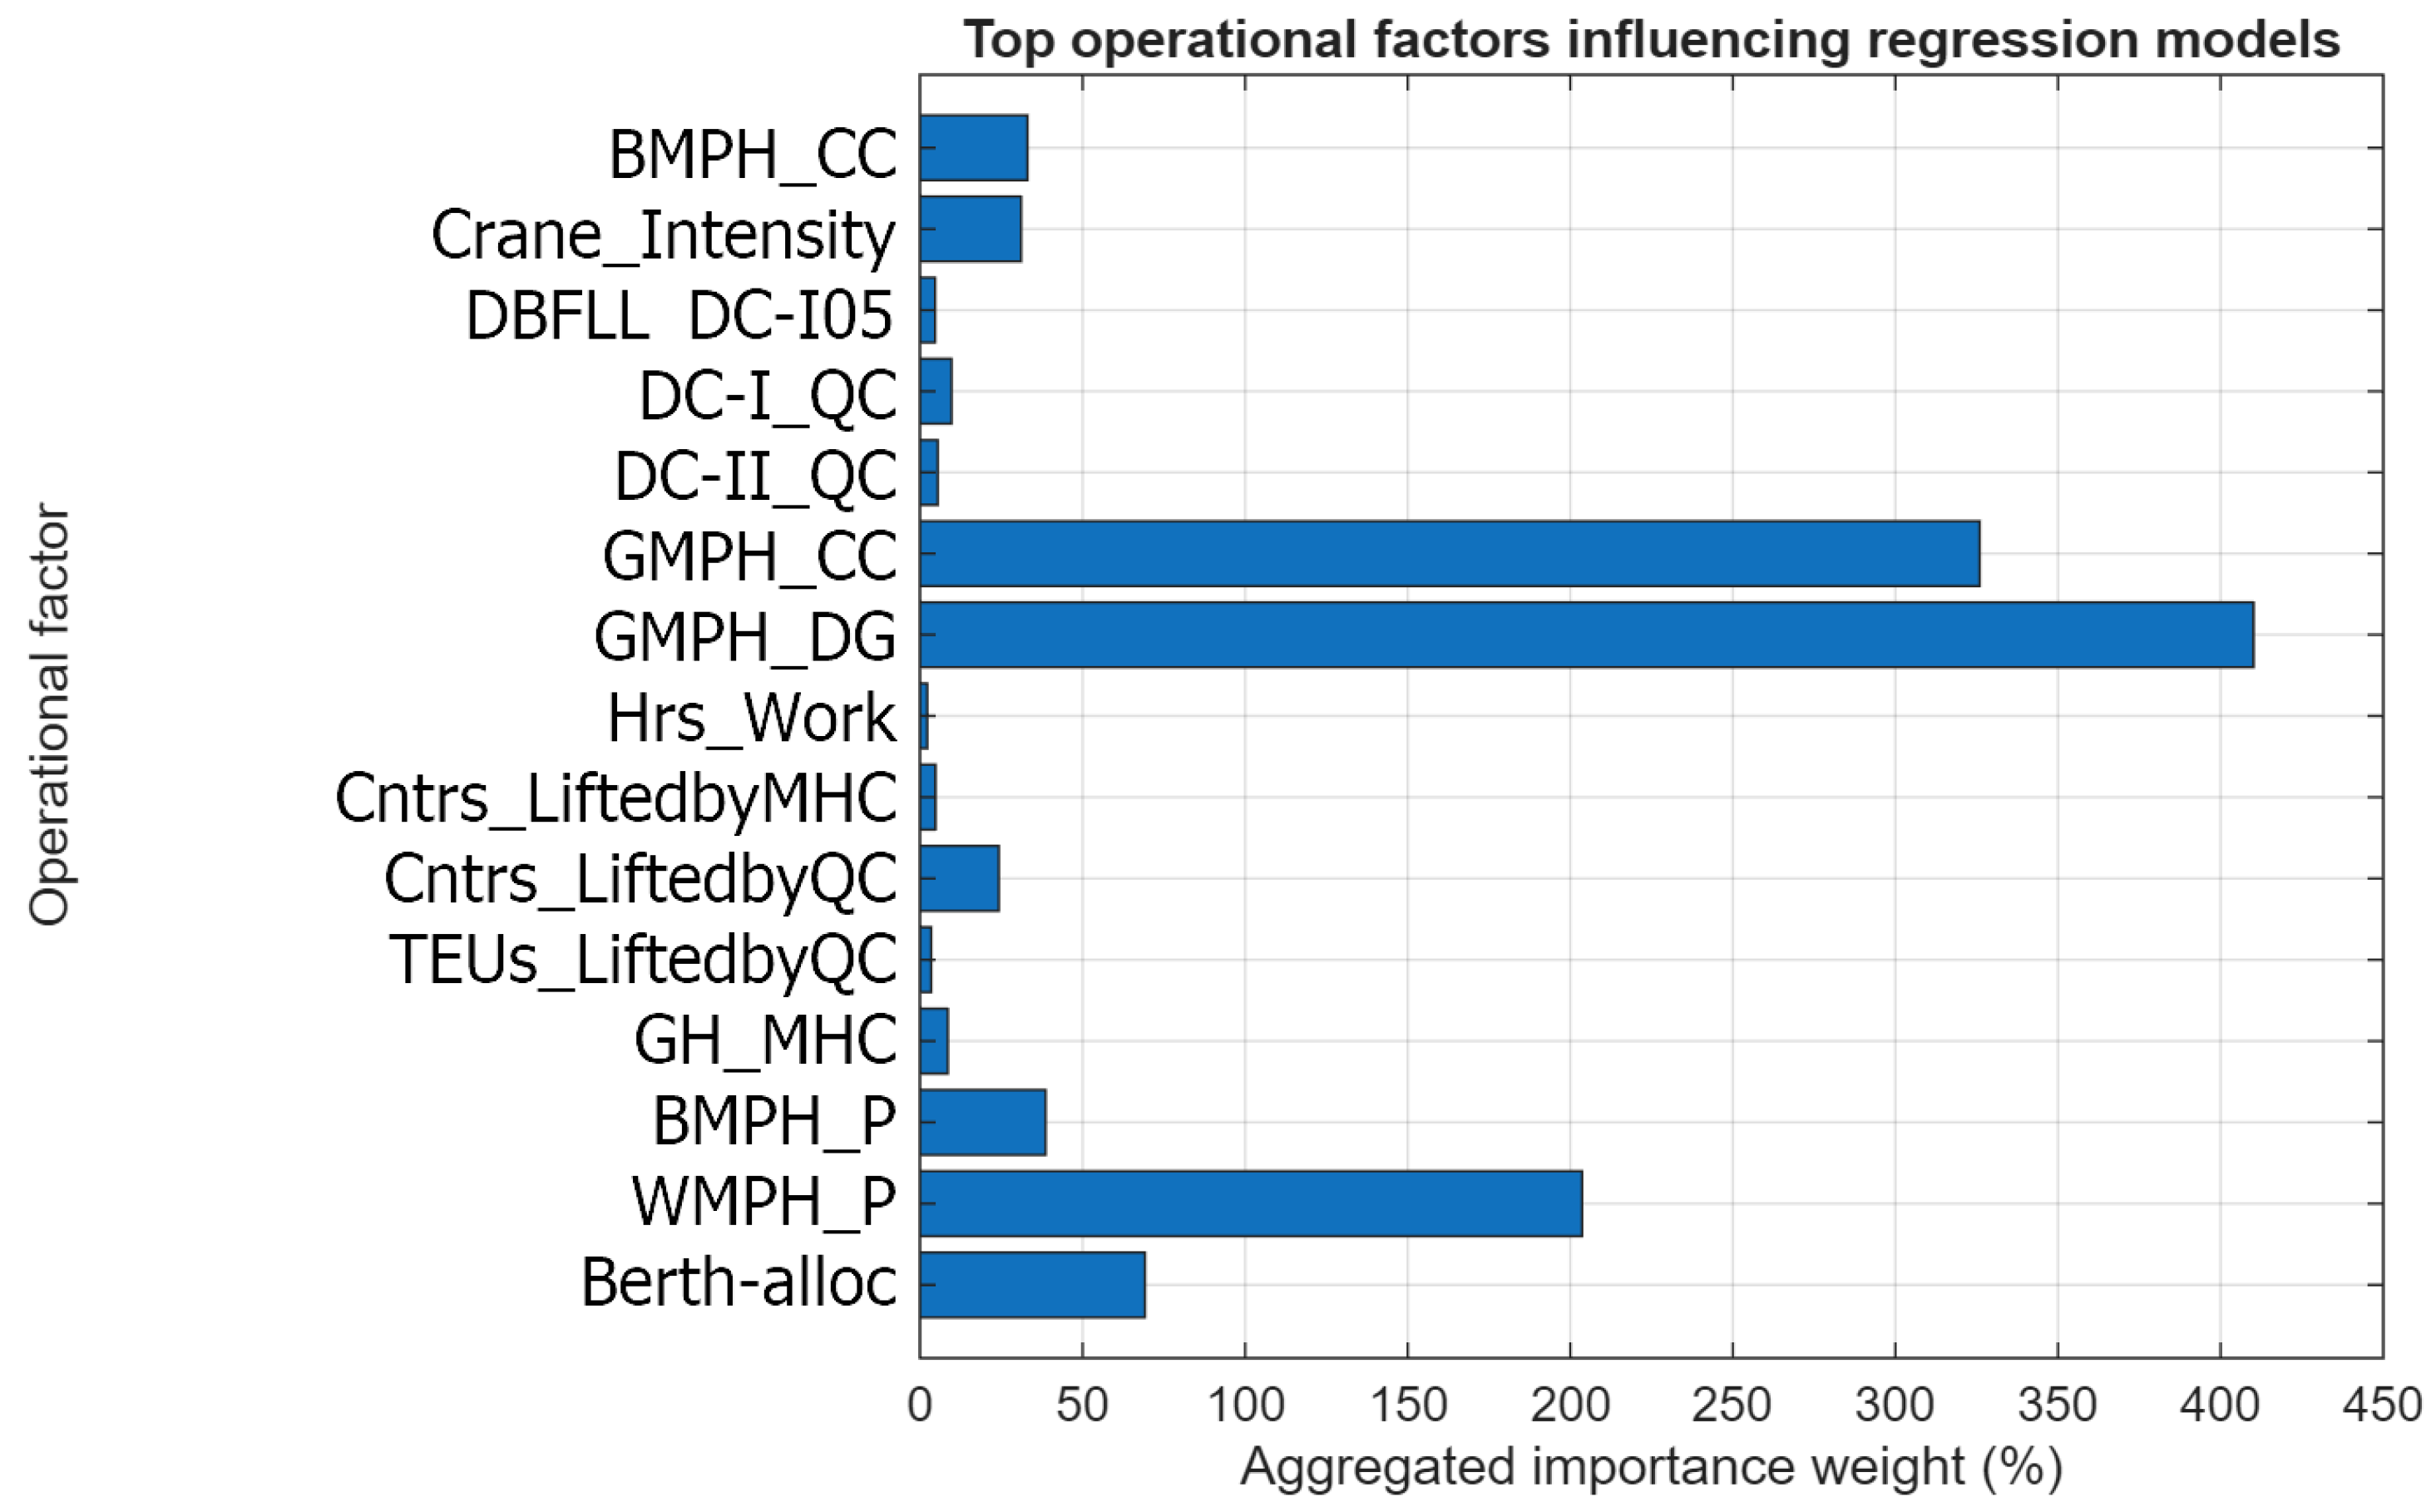
The variable importance analysis presented in
Table 1 highlights the significant influence of aggregated delay variables on NMPH values. In particular, delays occurring between the first and last handling cycles (InOp delays) demonstrated a higher predictive weight compared to delays in the pre- and post-operational phases. This finding is consistent with the nature of the NMPH indicator, as it is primarily sensitive to disruptions occurring during the active crane operation interval.
Variables associated with crane allocation made a significant contribution to predictive performance, particularly the number of active cranes and the total number of working hours. These were identified as consistent explanatory factors of net productivity. Such variables directly influence the operational rhythm and interact with the delay structure, highlighting the combined role of resource utilization and operational disruptions.
The use of ensemble models based on the bagging technique reduced prediction variance and ensured result stability under heterogeneous operational conditions. Residual analysis indicates that errors tend to increase in extreme congestion scenarios. However, the ensemble structure limits major deviations, thereby maintaining the overall robustness of the models.
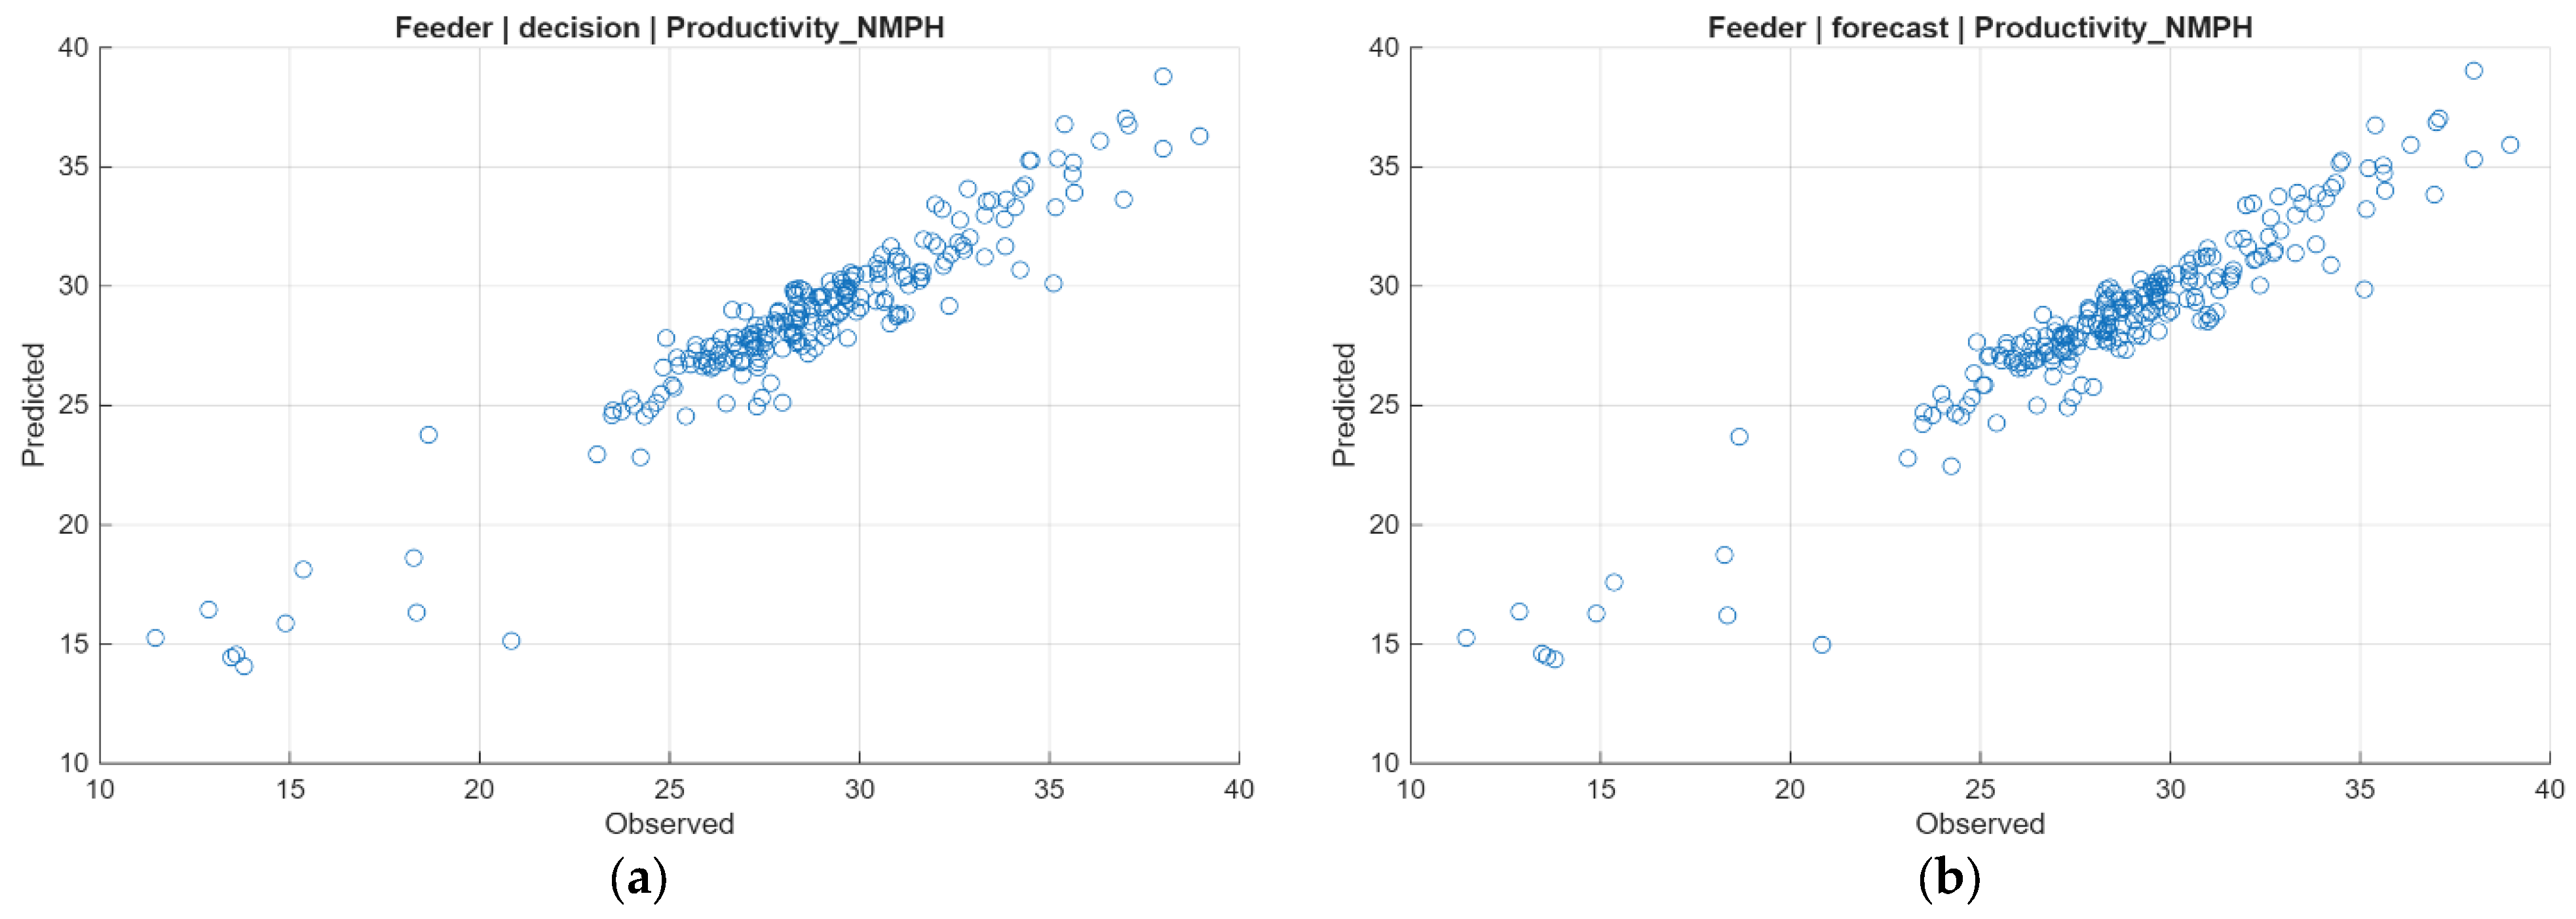
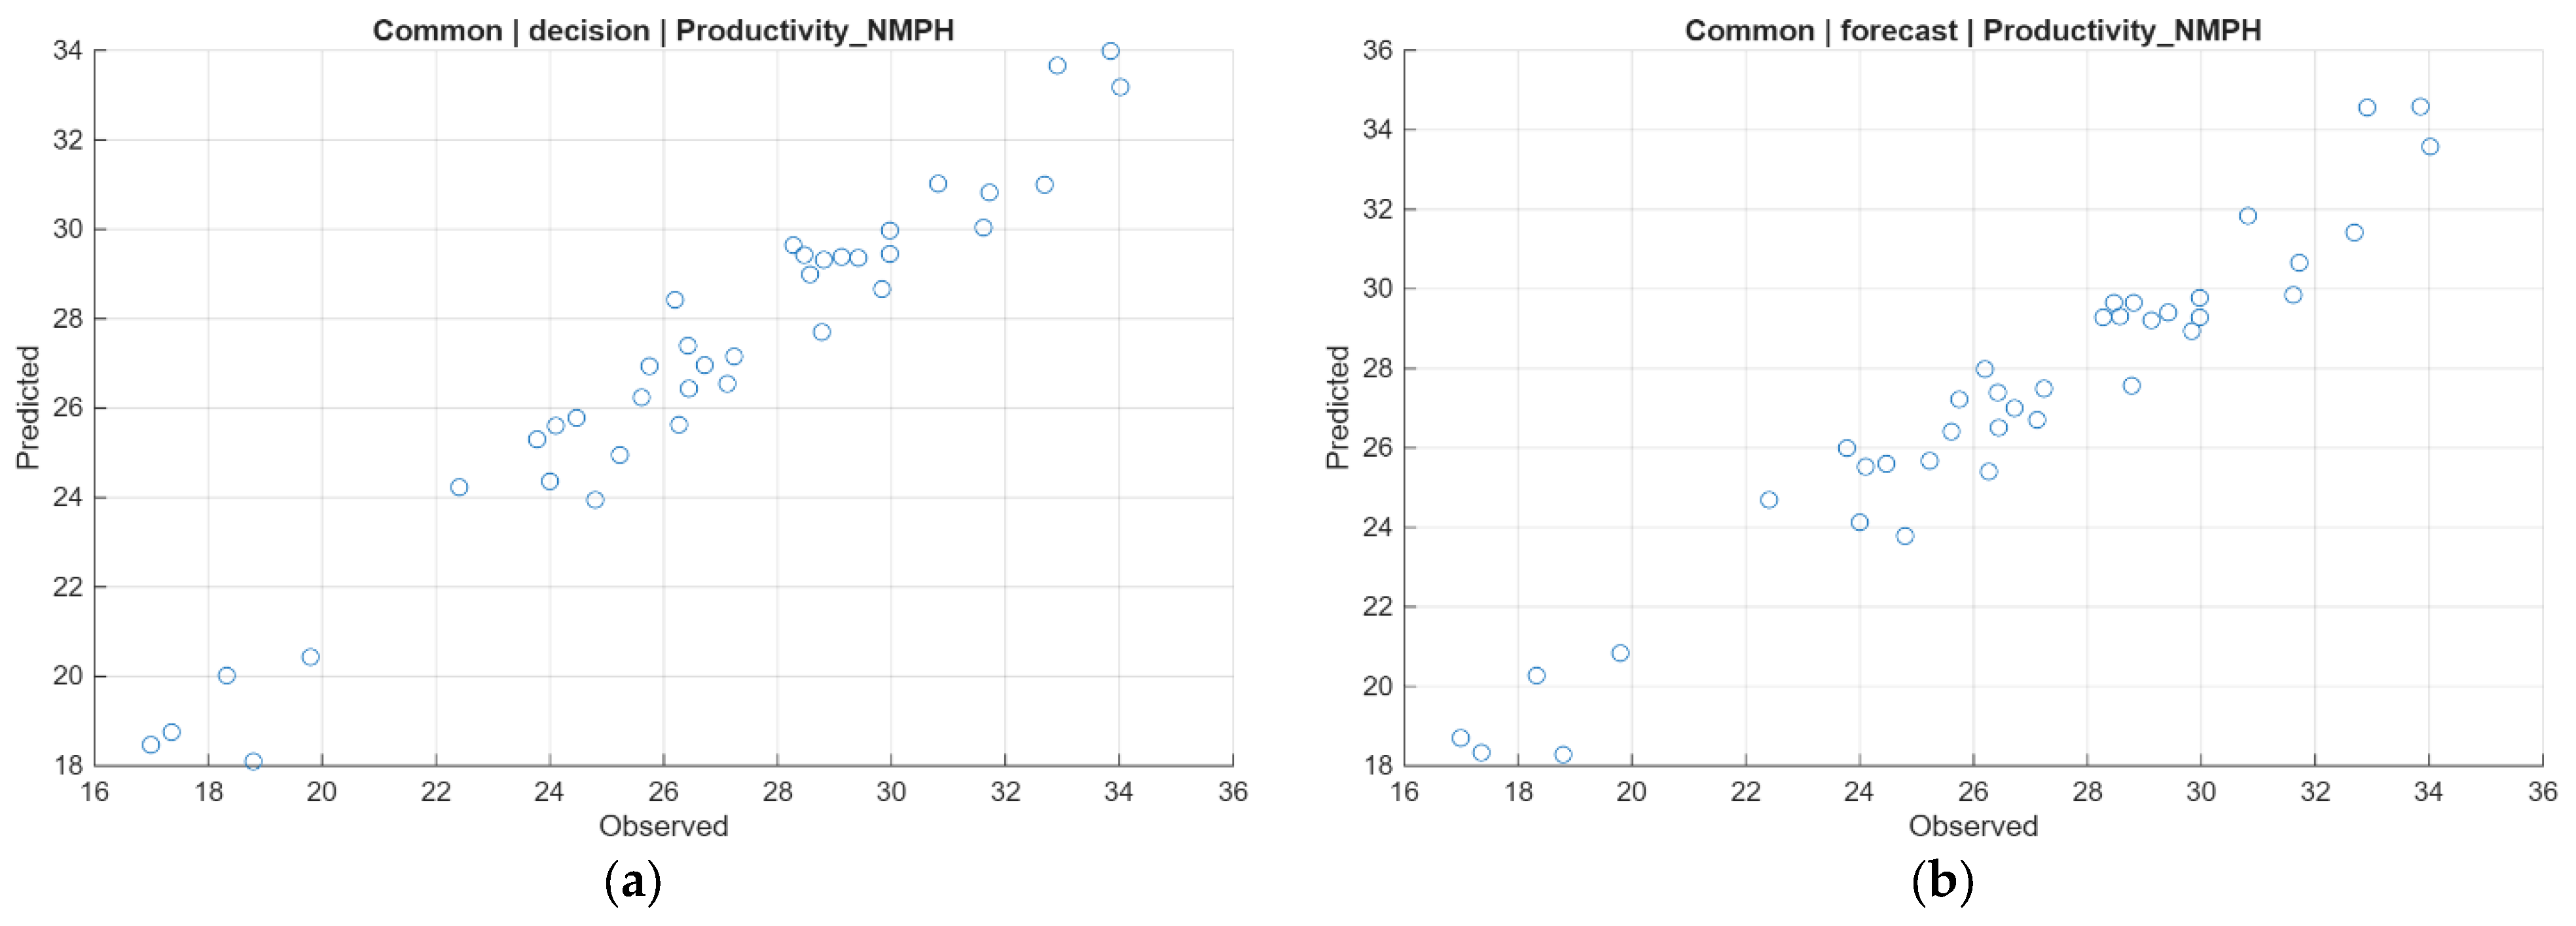
The NMPH indicator’s predictive accuracy, as shown in
Table 2, is strong in all datasets and modeling approaches. In the Feeder group, high R
2 values (>0.90 in both forecast and decision modes) indicate that the considered operational variables explain a substantial portion of net productivity variance. The similar R
2 values (0.9083 in forecast mode and 0.9068 in decision mode) demonstrate the model’s reliable predictive ability, unaffected by extraneous factors. In the Common category, the model performs better in decision mode (R
2 = 0.9441), highlighting the influence of structural operational factors such as crane allocation and delays, rather than activity volume. The reduced RMSE emphasizes the metric’s sensitivity to key operational variables, underscoring the importance of the modeling approach in predicting pre-operational performance.
Results indicate that NMPH shows a strong yet variable predictive capacity, remaining sensitive to operational variability compared to other productivity indicators. Comparison of forecast and decision modes affirms the model’s explanatory power in limited information scenarios.
4.2.2. Gross Moves per Hour Prediction
From a structural perspective, the GMPH indicator is less sensitive to the distinction between productive and non-productive intervals, as it is based on the gross operating hours of quay cranes. This characteristic produces a stabilizing effect on its values compared to NMPH, resulting in more uniform distributions and lower residual variability in regression models.
In forecast mode, the inclusion of operational volume variables and temporal indicators (such as gross working hours, number of cranes, and total number of moves) contributed significantly to prediction accuracy. Ensemble models effectively captured the nonlinear relationships between these components and the delay structure.
In decision mode, the exclusion of variables directly related to operational time and volume led to a more constrained modeling framework. However, the models maintained a high predictive capacity by relying on crane allocation, aggregated delays, and ship operational characteristics.
The variable importance analysis (
Table 3) shows that factors related to crane utilization dominate the prediction of GMPH. In particular, the number of active cranes, gross working hours, and equipment density indicators confirm the direct dependence of this metric on the intensity of operational resource usage.
Delay families exert a measurable influence on GMPH prediction; however, their contribution is generally lower compared to the models developed for NMPH. In particular, internal terminal delays (DC-I) exhibit the highest predictive weight, suggesting that GMPH is primarily sensitive to internal operational inefficiencies affecting crane availability and utilization. Across ship categories, the dataset corresponding to Feeder ships generates the most stable results due to the relatively homogeneous nature of operations. In contrast, MainLine ships display higher variability driven by differences in scale and operational complexity.
Similarly, the ensemble-based modeling approach contributes to reducing prediction variance and enhancing result stability. It limits the influence of atypical ship calls characterized by extreme delays or unusual crane configurations. This stabilizing effect is particularly evident for Common ships, where operational heterogeneity is more pronounced. Residual analysis indicates that prediction errors tend to increase primarily in scenarios involving atypical crane usage, such as technical failures or insufficient resource allocation relative to ship size.
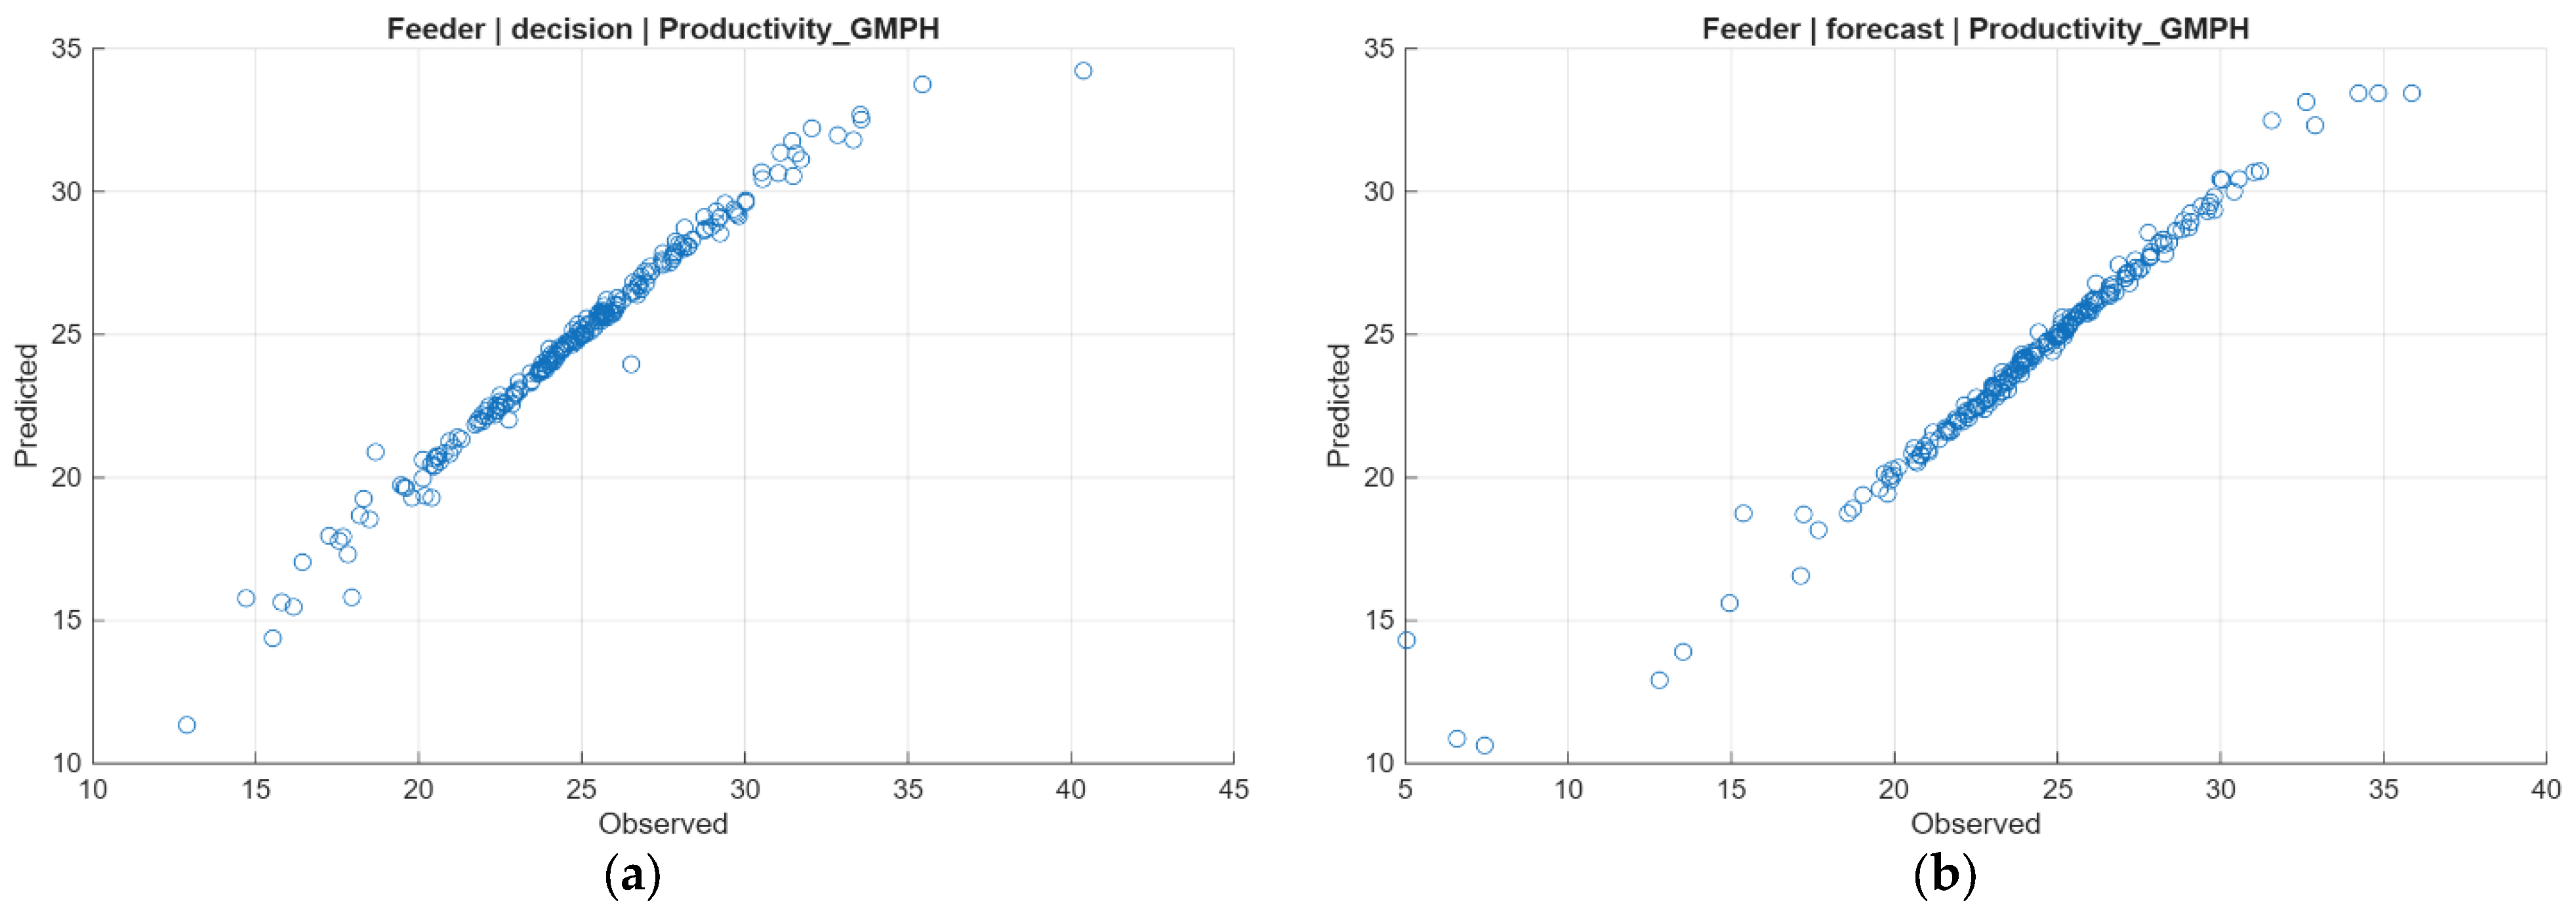
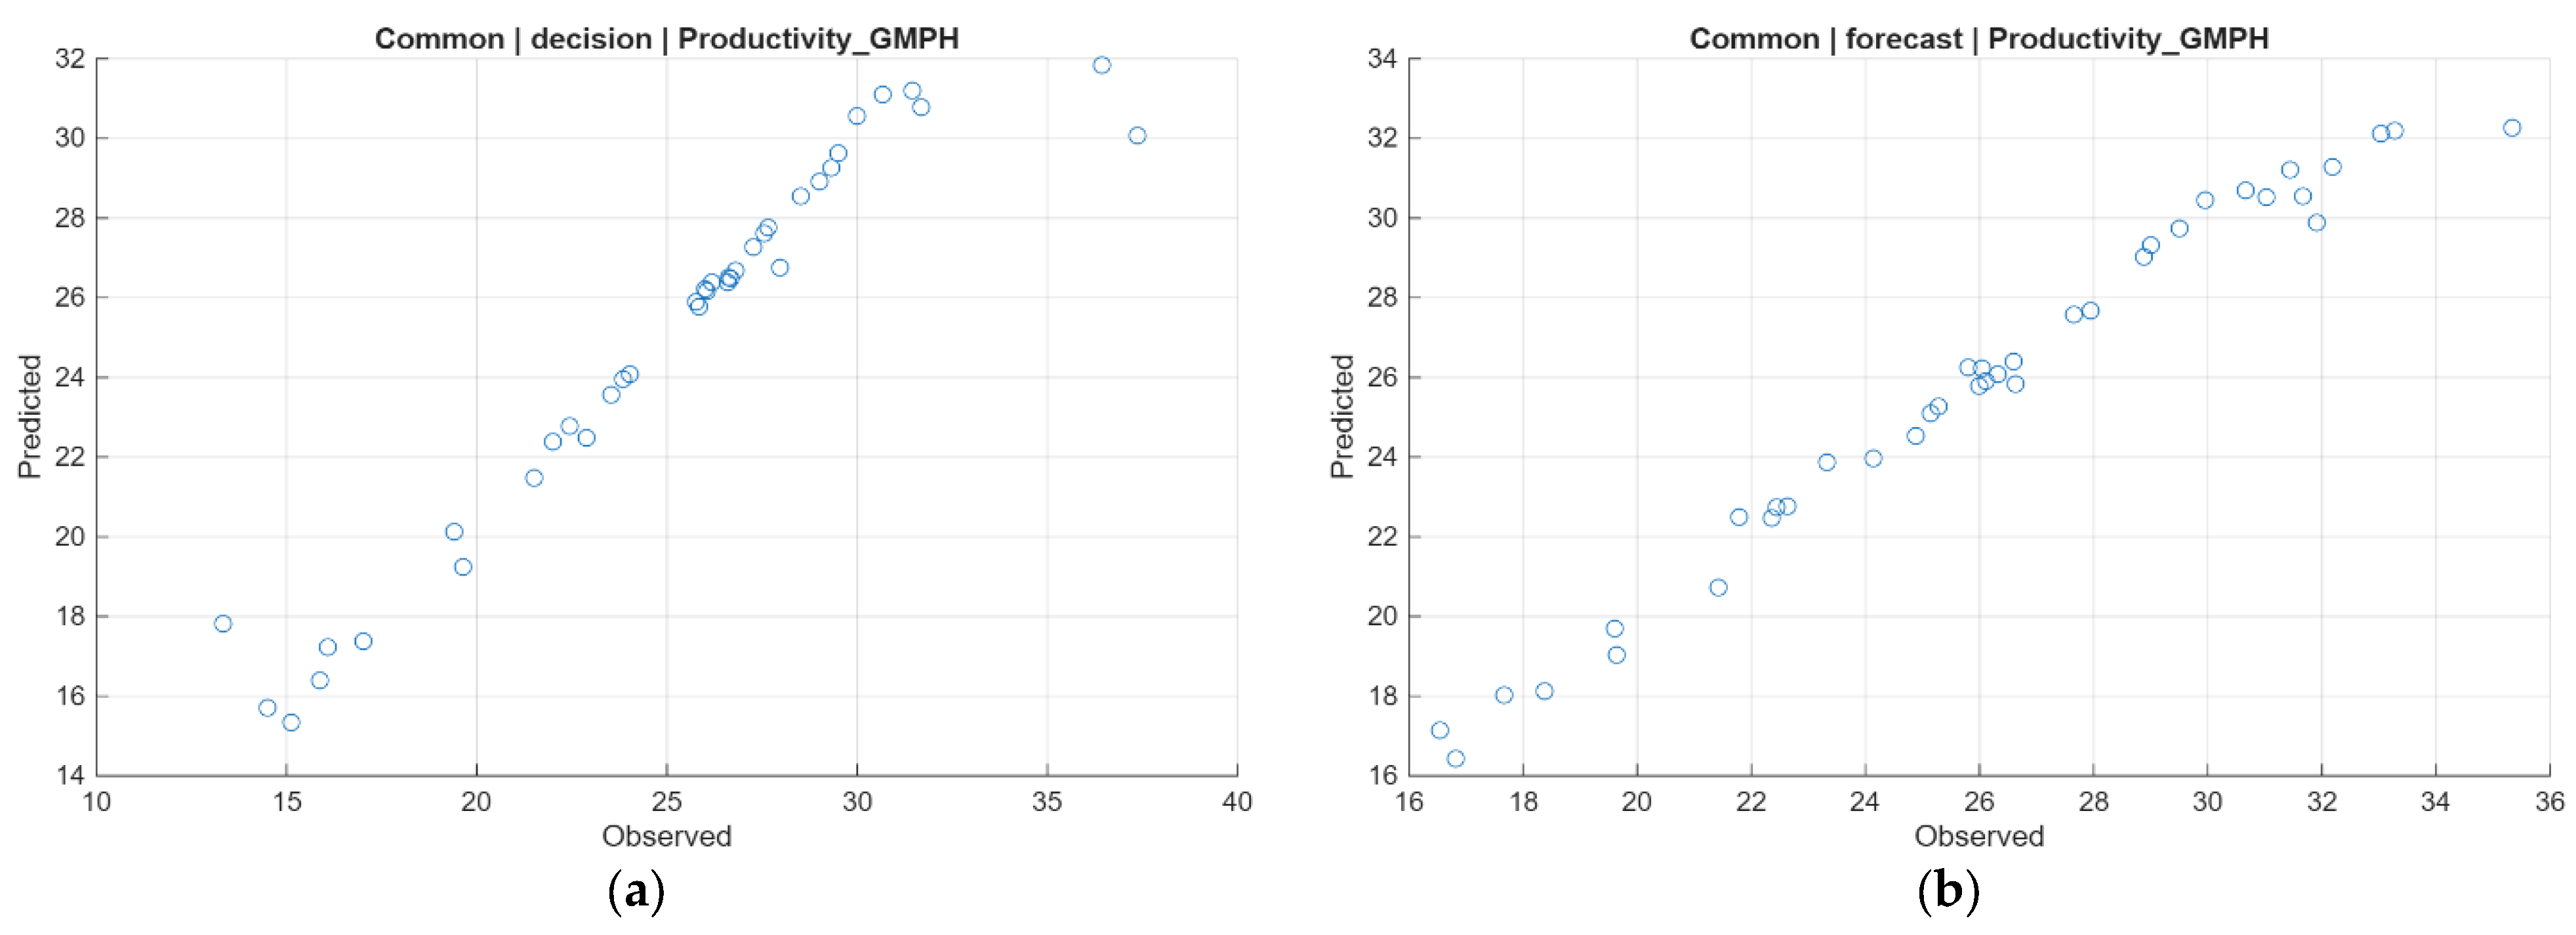
Table 4 indicates that the GMPH indicator exhibits high predictability with relatively stable values, particularly in forecast mode, as it is computed based on the total number of crane working hours. For this reason, the indicator is well suited for use in regression models based on machine learning techniques. The analysis shows that gross crane productivity is primarily determined by equipment allocation strategies and internal delays that affect the execution of operations.
From an experimental perspective, GMPH is the most predictively stable indicator among those analyzed. For Feeder ships, decision mode models achieve very high performance (R2 = 0.9749), suggesting that this indicator is strongly influenced by variables available at the planning stage, such as crane allocation and workload density. For Common ships, performance is higher in forecast mode (R2 = 0.9752) but decreases in decision mode (R2 = 0.9155), indicating a greater dependence on actual operational conditions in more heterogeneous contexts. Compared to NMPH, GMPH is less sensitive to delays and is primarily driven by equipment utilization and variables associated with operational volume, confirming its role as an indicator focused on resource usage intensity.
In summary, the results indicate that GMPH demonstrates one of the highest levels of predictive stability, while remaining less sensitive to operational variability than net productivity measures. The comparison between forecast and decision modes confirms the robustness of this structurally driven indicator under constrained information scenarios.
4.2.3. Weighted Berth Moves per Hour Prediction
The prediction of the WBMPH indicator involves an additional level of complexity, as it combines berth-level performance with berth utilization duration, reflecting both the number of moves and the time of occupancy. From a structural perspective, WBMPH is simultaneously influenced by crane allocation, delays, and time utilization, positioning it between equipment-level and berth-level indicators.
In forecast mode, the inclusion of variables related to operation duration and activity volume led to more accurate predictions. Ensemble models effectively captured the nonlinear relationships among these components. In decision mode, the exclusion of variables directly related to time and volume reduced predictive accuracy. However, WBMPH remained reasonably predictable, relying on crane allocation, aggregated delays, and ship characteristics. The variable importance analysis also revealed a balanced distribution of explanatory factors, showing that the indicator is influenced both by resource utilization and by internal delays, which have a consistent impact on weighted productivity.
Predictive performance varied across ship categories. Feeder services showed more stable results due to their standardized operational patterns, while Common ships produced more dispersed errors due to higher variability. WBMPH proved sensitive to extreme situations, such as congestion or atypical berth utilization. However, ensemble models limited major deviations, maintaining overall prediction stability. WBMPH can be modeled with reasonable accuracy when complete operational information is available, and its hybrid nature explains its intermediate position between net productivity indicators and equipment-level metrics.
In summary, the results indicate that WBMPH occupies an intermediate position between highly stable and highly reactive indicators, combining structural predictability with moderate sensitivity to operational variability. The comparison between forecast and decision modes confirms that this hybrid indicator remains reasonably robust under constrained information scenarios.
4.2.4. QC Raw Productivity Prediction
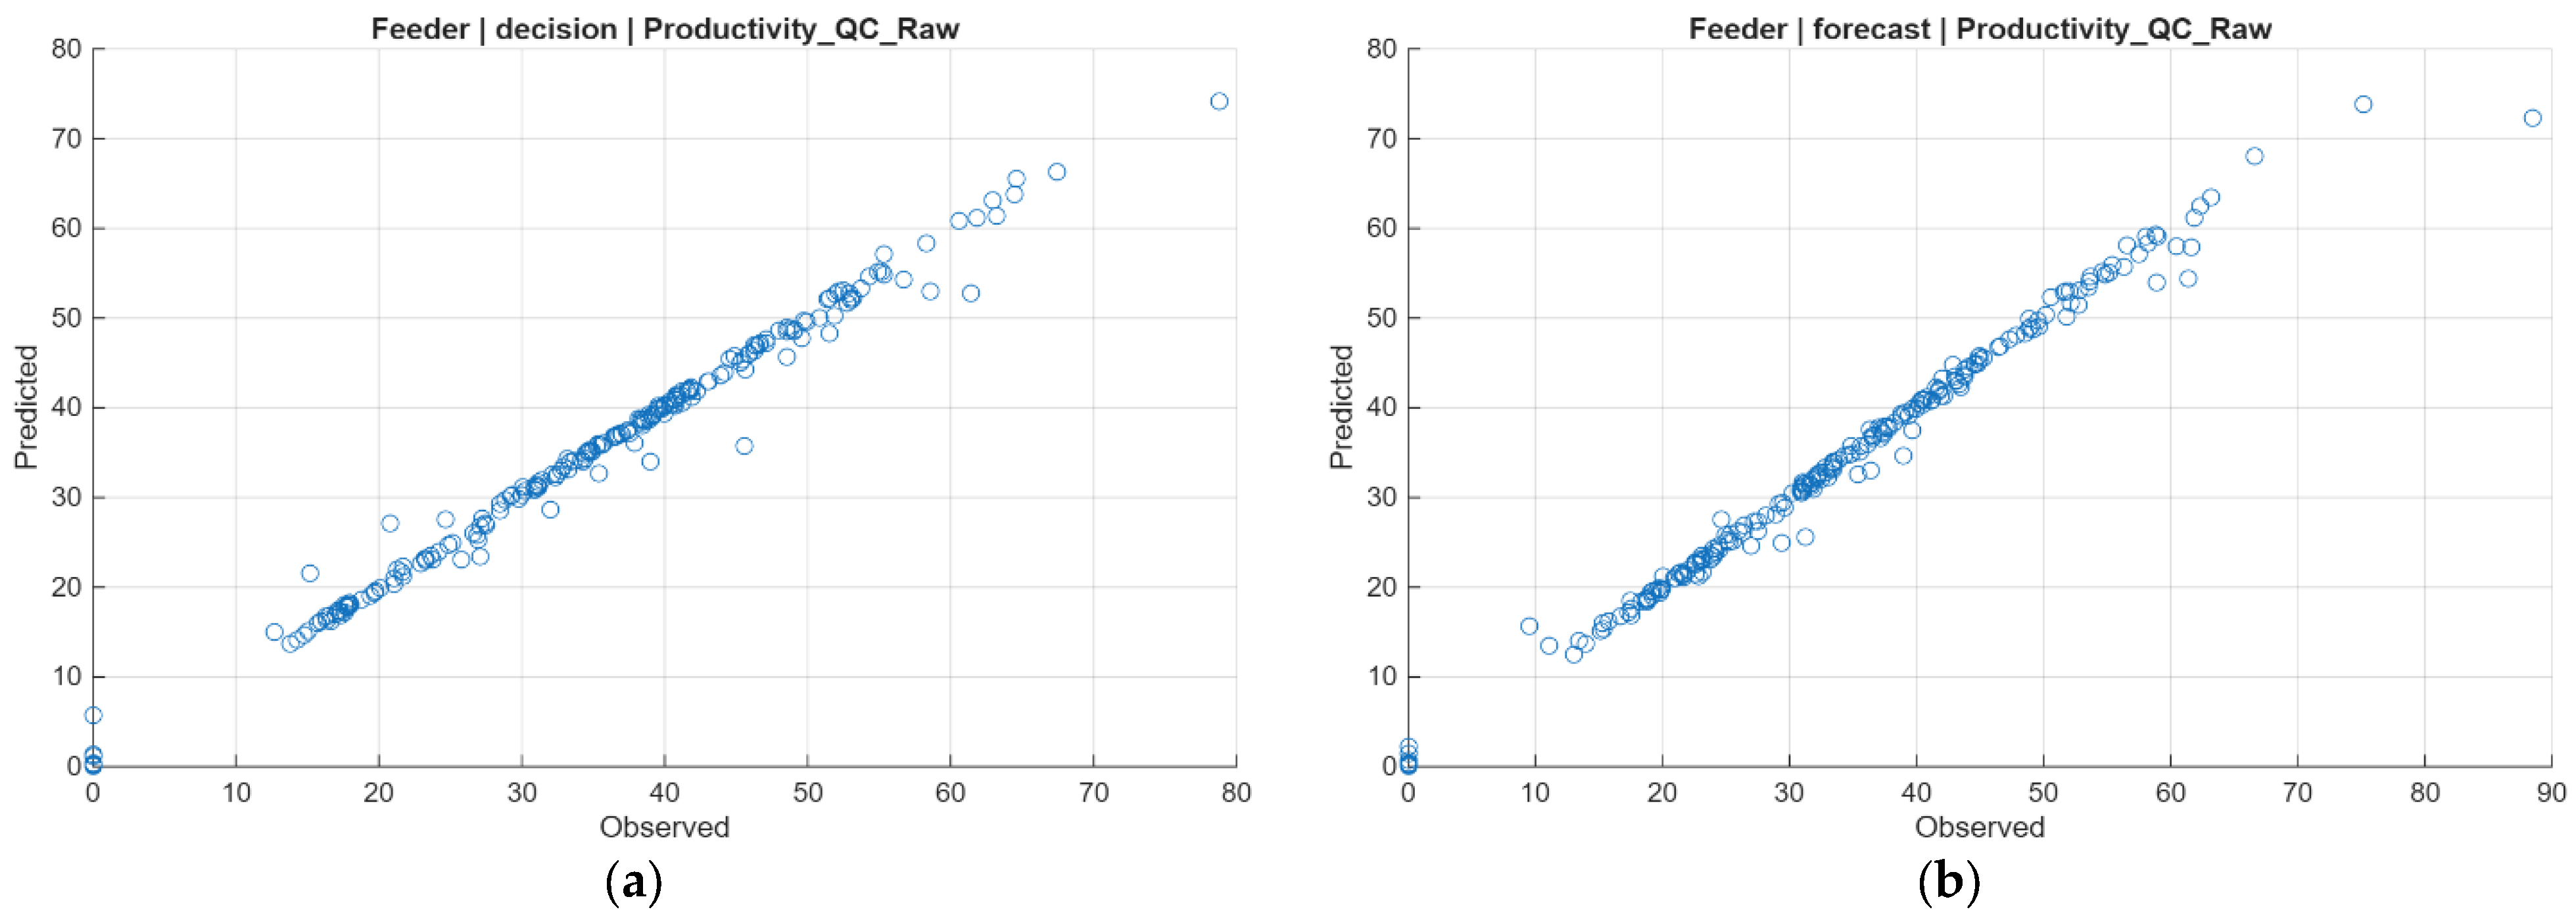
RQCP represents the most granular indicator analyzed and is defined as the ratio between the number of containers handled and the effective working hours of the quay cranes. This indicator directly reflects equipment efficiency without being influenced by broader factors such as total ship berth time or operational-level adjustments. As such, RQCP enables performance evaluation strictly at the crane level, reducing the impact of external factors and providing a clear perspective on the effective utilization of resources.
In forecast mode, the indicator exhibited high prediction stability due to the inclusion of relevant variables such as the number of active cranes, working hours, and aggregated delays. This resulted in lower prediction errors compared to berth-level indicators. In decision mode, although the exclusion of certain variables made prediction more challenging, performance remained satisfactory. This suggests that crane allocation and delay patterns provide sufficient information to estimate equipment efficiency even prior to the completion of operations.
The variable importance analysis (
Table 5) indicates that factors directly related to crane utilization—particularly the number of active cranes and total operating hours—have the strongest influence on RQCP. Delays play a secondary role, as the indicator is normalized by effective working time. Compared to the other indicators, RQCP exhibits the highest level of predictability. Very strong results are observed for the Feeder and MainLine datasets, which are characterized by more standardized operations, and satisfactory performance is achieved even for the Common category.
Although prediction errors increase in atypical scenarios, such as multiple equipment failures or unusual crane configurations, the use of ensemble models mitigates the impact of these variations and maintains overall stability. Furthermore, the reduced sensitivity to berth congestion—stemming from its focus on actual crane activity—explains the high R2 values and lower prediction errors compared to other productivity indicators.
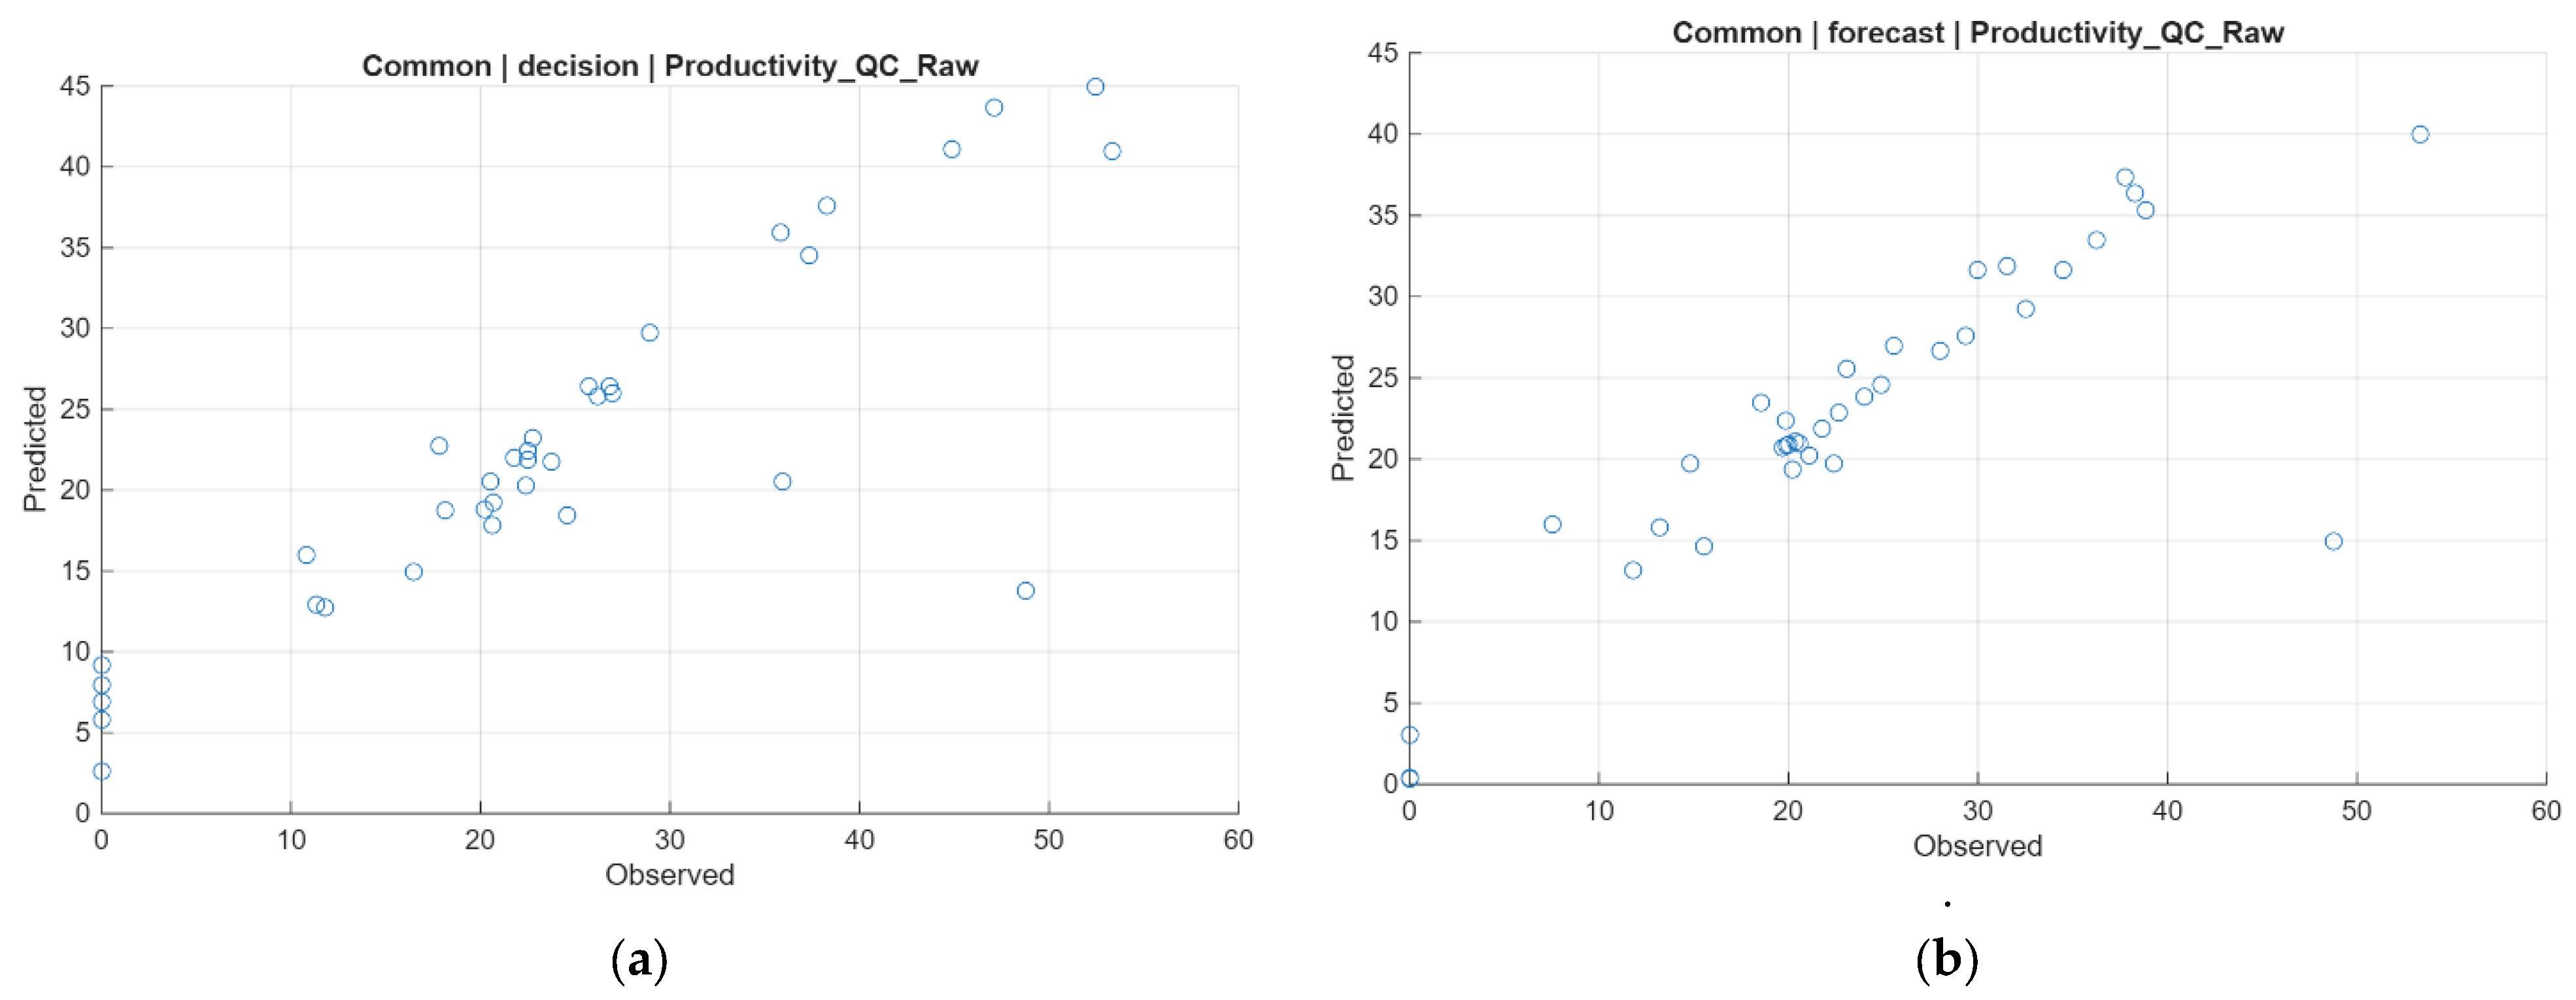
In the dataset presented in
Table 6, the Feeder category achieved the best results for RQCP, with R
2 values close to 0.99 in both modeling modes. This indicates that operational variables related to crane utilization almost entirely explain the variability of gross productivity. In contrast, for the Common dataset, R
2 values were lower (approximately 0.70–0.73), reflecting higher variability and a less standardized operational structure.
The difference between the Feeder and Common categories confirms that gross crane productivity is strongly influenced by resource allocation and the presence of stable operational routines. In the case of Feeder ships, the consistent structure of operations makes performance significantly easier to predict.
The results demonstrate that RQCP demonstrates the highest predictive stability among the analyzed indicators, while remaining the least sensitive to operational variability. The comparison between forecast and decision modes confirms the robustness of this structurally driven indicator under constrained information scenarios.
4.3. Decision Mode Results (Operational Classification)
For the classification analysis, thresholds corresponding to operational performance levels (low, medium, high) were defined, enabling the transformation of continuous numerical values into categories relevant from a managerial perspective. The main classification tasks focused on variables such as DelayClass and DelayFamily, which reflect concrete operational states based on the structure of internal or external delays. This approach facilitates the assessment of operational risk.
The experiments conducted in decision mode aimed to evaluate the model’s ability to support decision-making under conditions of limited information by excluding variables available only after the completion of operations. Under these conditions, the models relied on information available during the planning phase or at the start of operations, such as crane allocation, historical delay patterns, ship characteristics, and other contextual variables. An ensemble method based on bagging was used for classification, as it is well suited to heterogeneous and imbalanced data. This approach reduces the risk of overfitting and improves the robustness of the results.
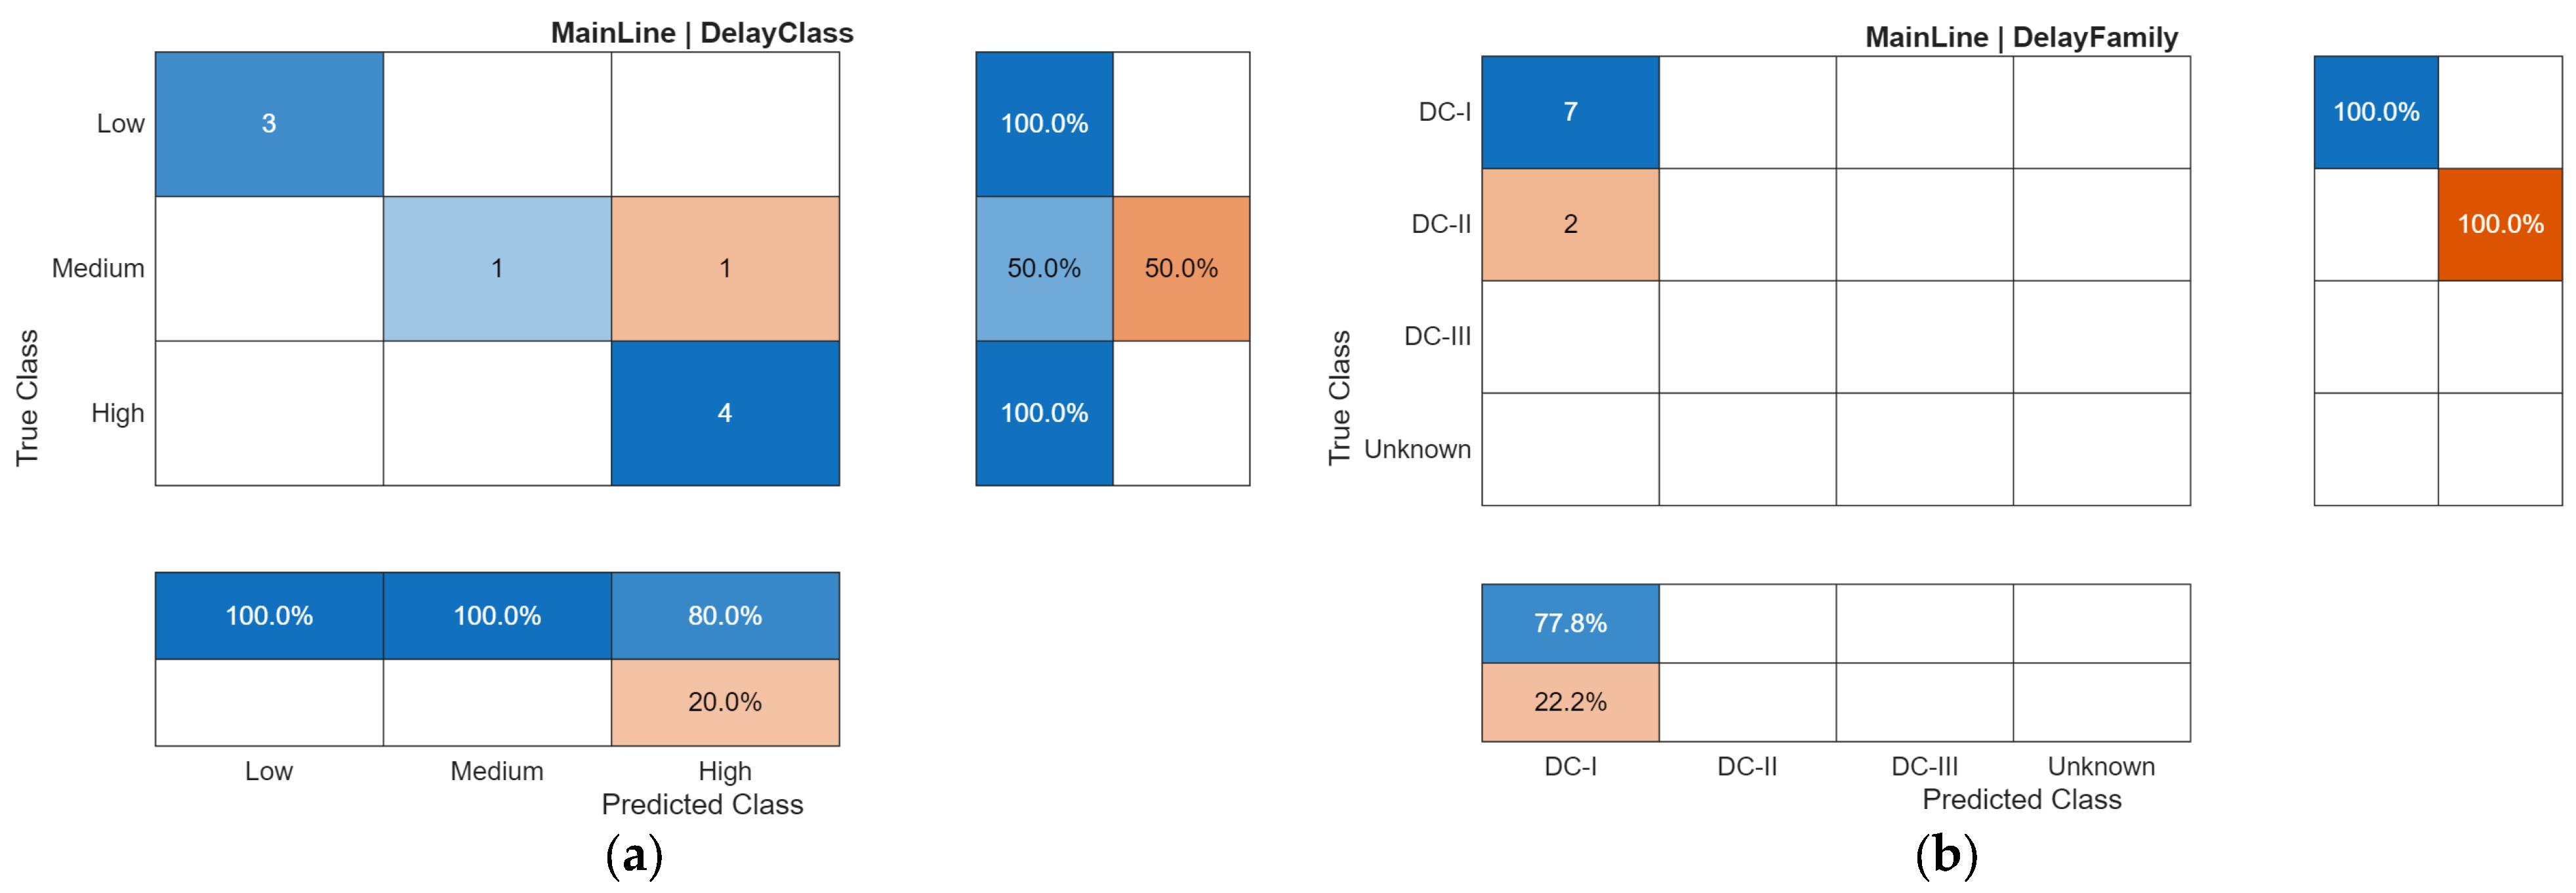
Classification performance was evaluated using Accuracy and Macro-F1, the latter being essential for capturing balance across categories in the presence of uneven class distributions. The analysis shows stable performance for DelayFamily classification in the Feeder and Common datasets, where the volume of observations is sufficient. In contrast, performance for the MainLine category is less consistent due to the limited sample size. Confusion matrix analysis indicates that errors occur mainly between adjacent categories, whereas extreme cases are correctly identified. This highlights the model’s ability to detect high-risk situations.
Variable importance analysis indicates that internal delays (DC-I) and crane allocation indicators are the primary determinants of classification, confirming the role of resource organization and operational disruptions in defining risk. Decision mode proved useful for the early anticipation of critical operational situations, enabling planning adjustments prior to the completion of operations. At the same time, result stability depends on dataset size and class balance, and cases with insufficient observations were appropriately flagged. Overall, ensemble models demonstrate the ability to effectively classify operational states using information available at the planning stage, providing meaningful support for managerial decision-making.
4.3.1. Classification Stability
The stability of classification models is a fundamental requirement for their use in supporting operational decision-making, particularly in a complex and highly variable environment such as a container terminal. In this context, the use of ensemble models based on bagging enabled the generation of more robust results that are less sensitive to random variations in the data. Compared to individual decision tree models, the ensemble approach significantly reduced performance fluctuations when the data were partitioned differently into training and testing sets, thereby ensuring greater consistency of the results.
The stabilizing effect was particularly evident for categories with medium and low frequency, where simple models exhibited considerable variability. By combining predictions from multiple models, bagging improved the Macro-F1 score, especially for rare classes such as low-performance situations or severe delays. This characteristic is operationally relevant, as correctly identifying critical cases is more important than accurately classifying routine situations. The ensemble method therefore provided a better balance between precision and detection capability.
Confusion matrix analysis showed that classification errors occur primarily between adjacent categories, while extreme cases are rarely misclassified. This indicates that the model effectively captures the ordered structure of performance levels. In decision mode, the models demonstrated the ability to identify high-risk operational intervals, characterized by significant internal delays and inefficient crane utilization. Moreover, congestion situations were detected through the interaction between crane density and delay structure. Internal delays (DC-I) were classified with high accuracy, confirming their central role in performance dynamics.
It should be noted that most classification errors occur near class boundaries, which is consistent with the discretization process and further supports the robustness of the selected threshold scheme. In the absence of a standardized benchmark dataset for conventional container terminals, model performance is evaluated comparatively across indicators, ship categories and modeling modes, providing an internal consistency-based benchmark for assessing robustness.
Mainly, the classification results indicate that ensemble-based models provide stable and reliable performance, with errors concentrated near adjacent categories rather than extreme cases. The comparison across ship categories and class structures confirms the robustness of the classification framework under constrained information scenarios.
4.3.2. Classification Results by Ship Category
The stability of classification models is crucial for aiding operational decision-making, notably in fluctuating settings like container terminals. Enhanced stability, particularly notable in low- and medium-frequency classes, improved Macro-F1 scores, balancing accuracy with critical case identification (
Table 7).
The analysis of confusion matrices indicates that classification errors are primarily concentrated between adjacent categories, while extreme cases are accurately identified. This pattern reflects the gradual nature of the underlying operational phenomena and confirms that the model effectively captures the ordered structure of performance levels, supporting the overall consistency of the classification framework.
The models effectively identified early-stage high operational risk situations involving internal delays, inefficient crane use, and congestion.
Ensemble models consistently classified diverse operational conditions reliably. Their alignment with regression results, like high R2 values for indicators such as RQCP and GMPH, reinforces the methodological framework’s validity and practical significance. The classification results indicate that severity-based classes are identified more robustly than causal delay families, particularly in datasets with stronger structural consistency. The comparison across ship categories confirms that model stability is highest for Feeder traffic and becomes more sensitive to data imbalance and operational heterogeneity in Common and MainLine contexts.
Interpretation for Feeder—DelayClass vs. DelayFamily
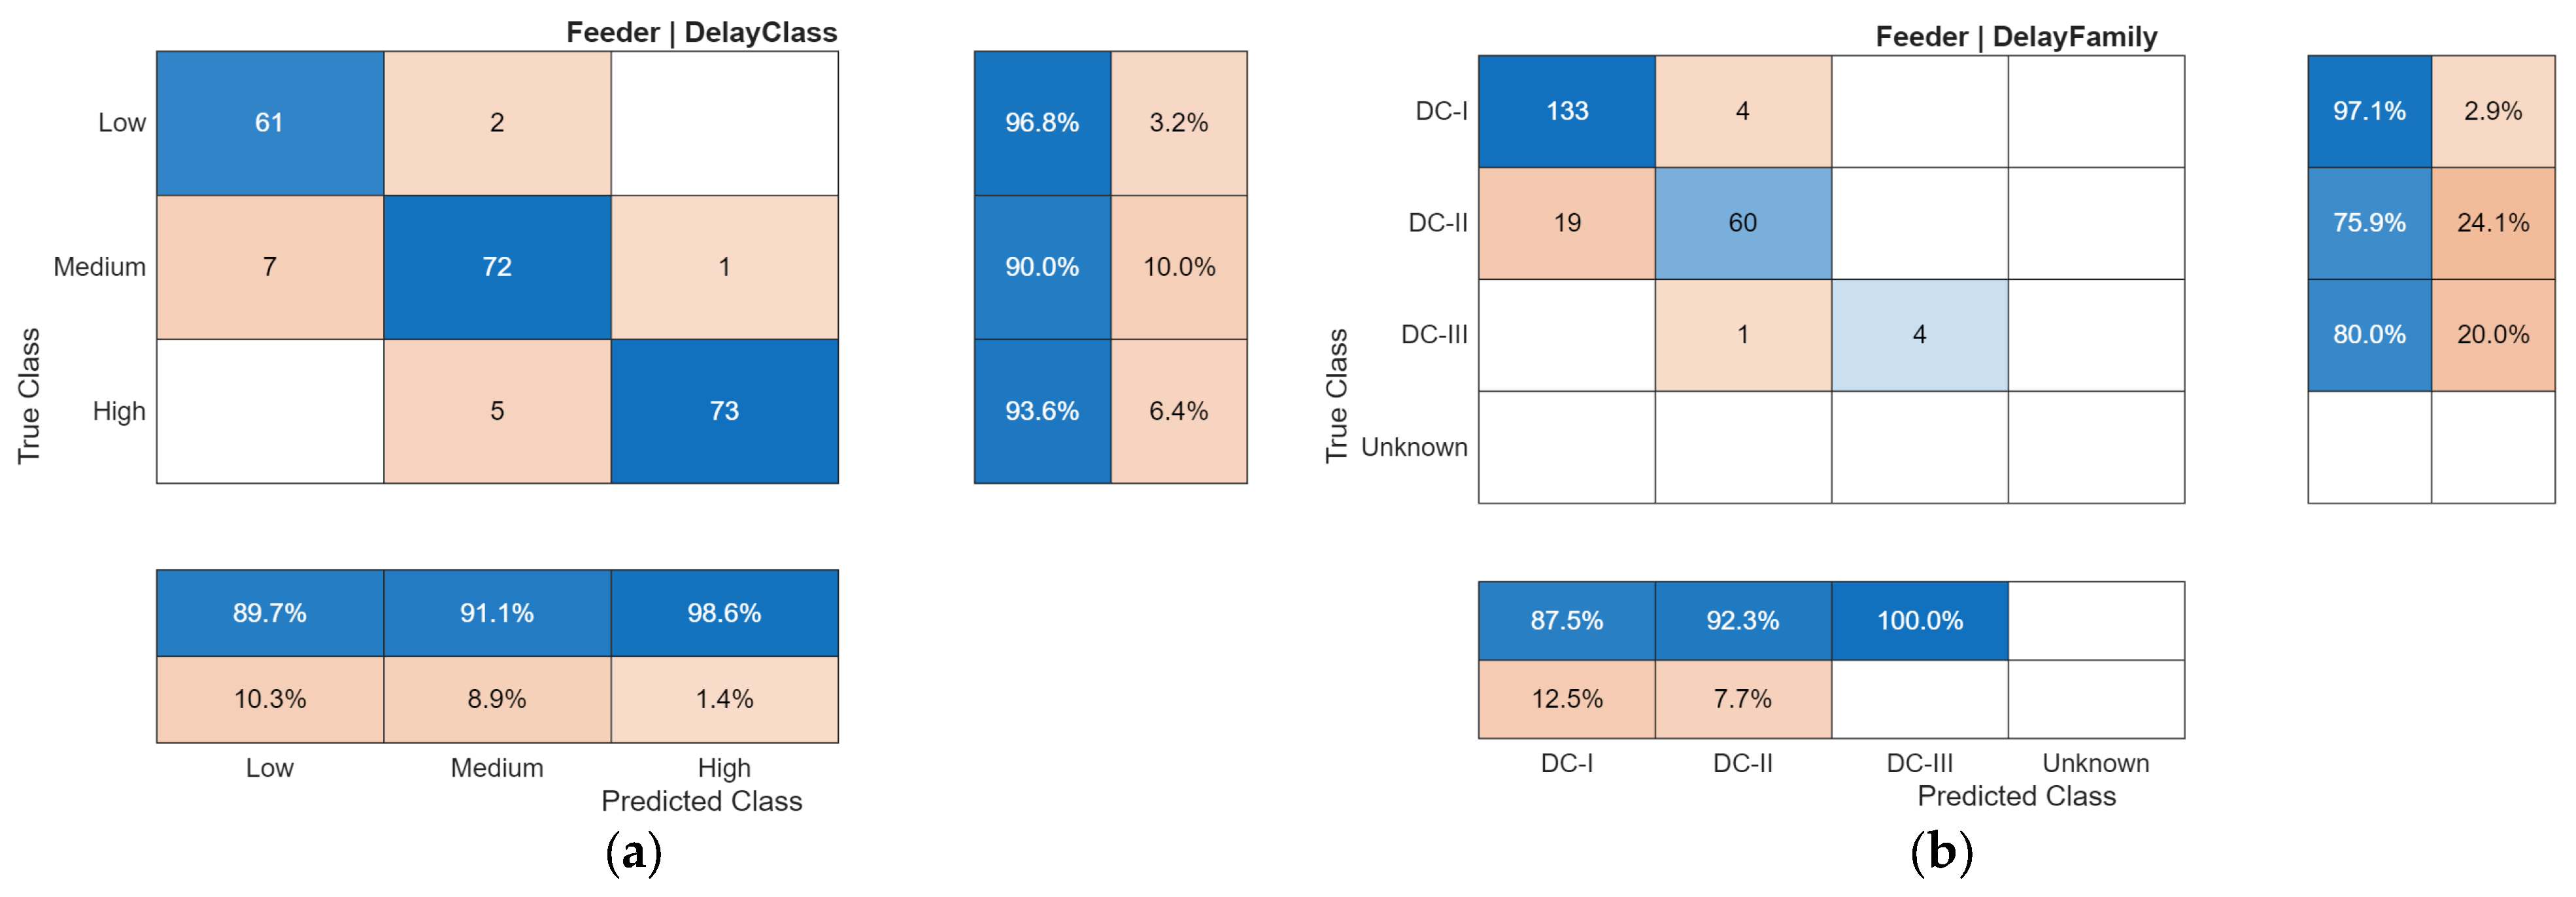
According to
Figure 6, in the case of DelayClass classification, the model demonstrates very high performance in identifying delay severity levels (Low, Medium, High). The confusion matrix shows a consistent number of correct classifications across all three categories (61/63 for Low, 72/80 for Medium, and 73/78 for High), indicating a strong capacity to differentiate between severity levels. Classification errors are mainly concentrated between adjacent categories, while confusions between extreme classes are rare, suggesting that the model accurately captures the gradual nature of the phenomenon.
Performance metrics support these observations, with the model achieving an accuracy of approximately 0.932 and a similar Macro-F1 score for Feeder ships, indicating balanced performance across classes. Additionally, the high recognition rate for severe delays (approximately 93.6%) and the tendency to classify mispredicted cases into the Medium category reflect a conservative behavior that is operationally advantageous.
In contrast, the DelayFamily classification, which aims to identify the cause of delays (internal, external, or force majeure), shows good overall performance but less balance across classes. The model performs very well in identifying internal delays (133 correct classifications out of 137), but encounters difficulties in distinguishing external delays, which are sometimes misclassified as internal, likely due to similarities in their operational manifestation. The force majeure category, being less represented, contributes to reduced classification stability.
These differences are also reflected in the performance metrics: for Feeder ships, DelayFamily classification achieves an accuracy of 0.891 but a significantly lower Macro-F1 score (0.661), indicating class imbalance. Overall, the results show that delay severity is easier to predict than delay causality, and that machine learning models can reliably anticipate both the level of operational risk and its origin, particularly in the context of internal delays and large datasets, as is the case for Feeder ships.
The results demonstrate that delay severity classification demonstrates the highest predictive stability for Feeder ships, while causal family identification remains more sensitive to class imbalance. The comparison between DelayClass and DelayFamily confirms the robustness of severity-based classification under operationally structured and information-constrained scenarios.
Interpretation for Common—DelayClass vs. DelayFamily
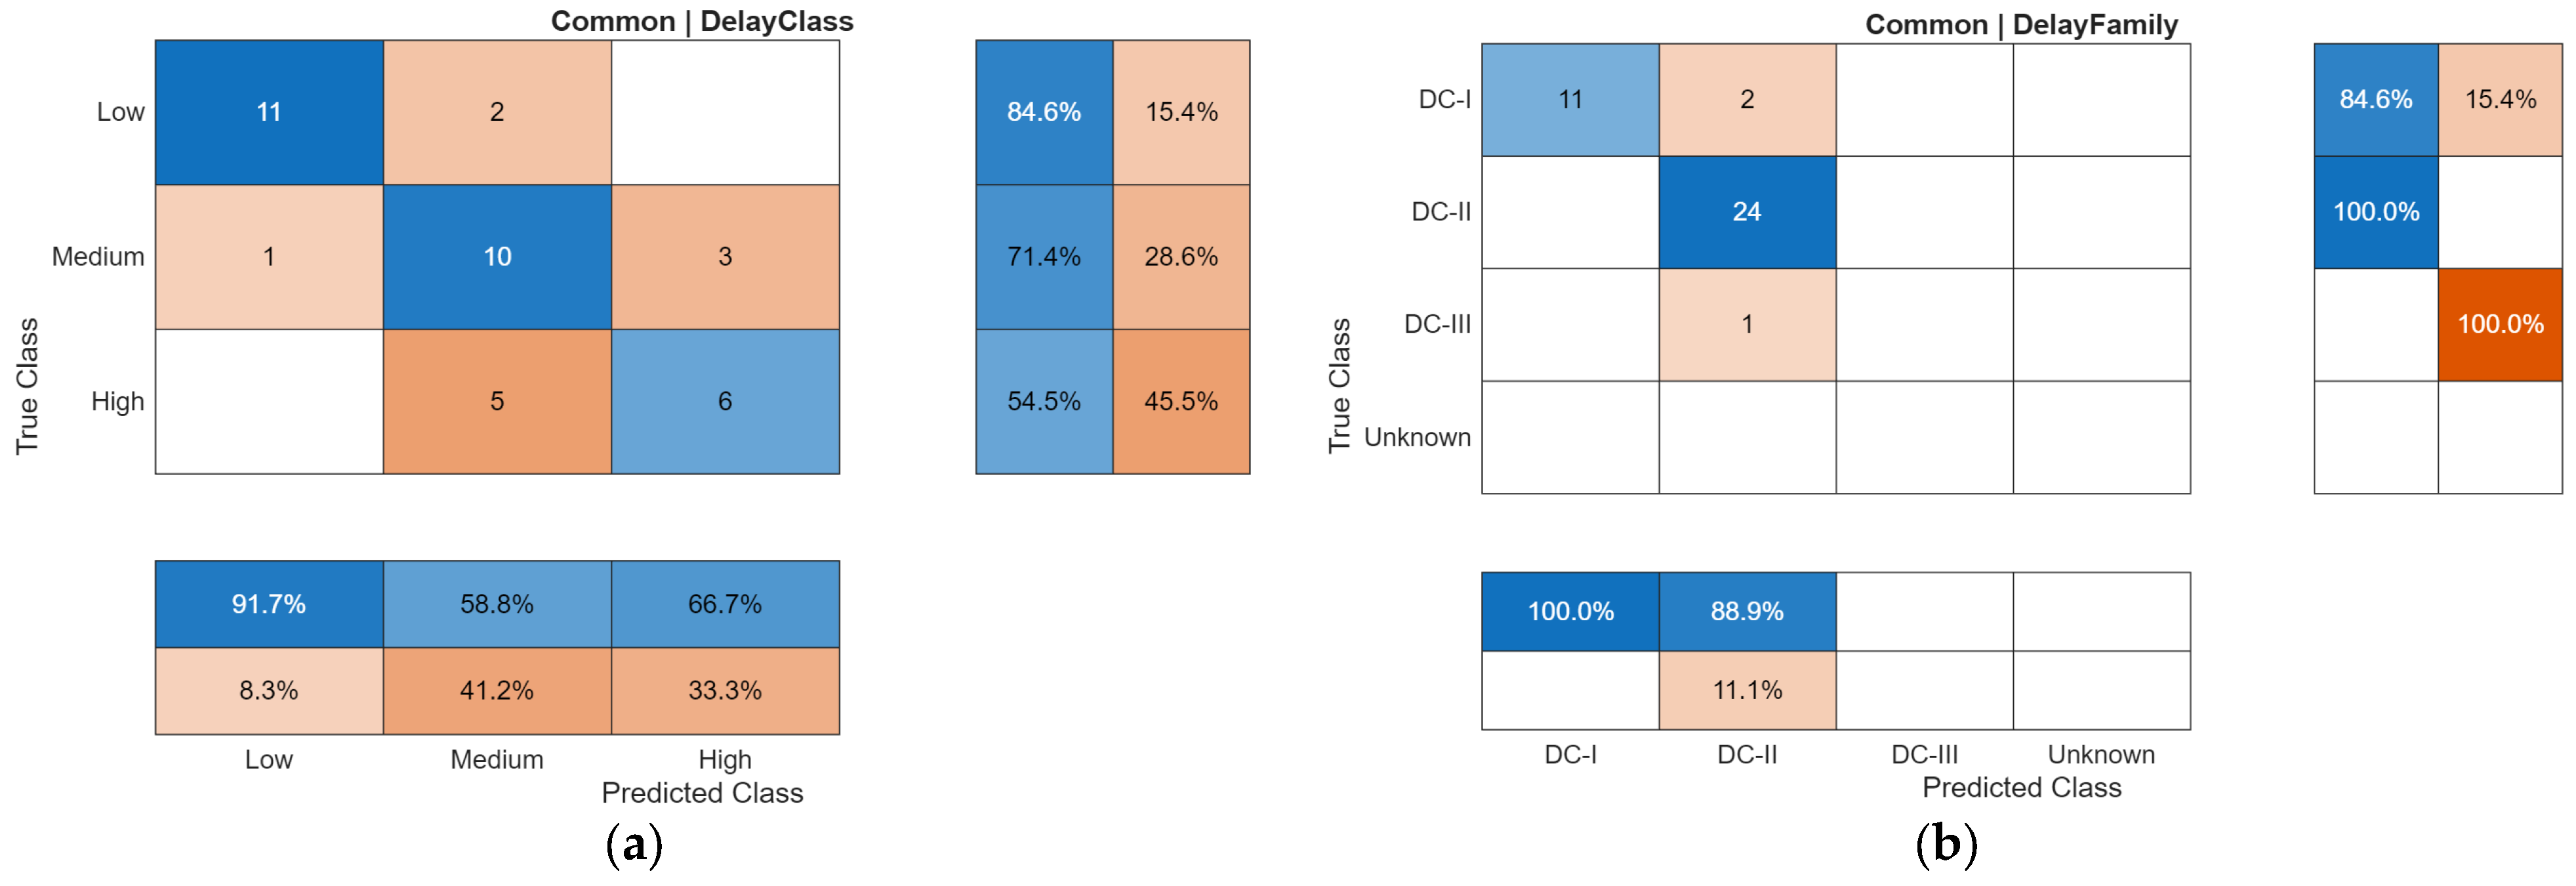
The comparative analysis of the scenarios presented in
Figure 7 for Common ships highlights a lower level of performance compared to that observed for Feeder ships. This result can be explained by the more heterogeneous nature of operations and the smaller size of the dataset.
The comparative analysis of the scenarios presented in
Figure 7 for Common ships highlights a lower level of performance compared to that observed for Feeder ships. This result can be explained by the more heterogeneous nature of operations and the smaller size of the dataset. In the case of DelayClass classification, the model is able to identify delay severity levels satisfactorily, but with a higher degree of confusion between adjacent categories. While low delays are correctly recognized in most cases (11 out of 13), errors frequently occur between the Medium and High categories. Some severe cases are classified as moderate, indicating difficulty in distinguishing between intermediate and high levels of disruption.
This limitation can be attributed to the higher operational variability of Common ships, which do not follow standardized operating patterns, as well as to the relatively small size of the test sample (approximately 36–38 observations). Despite these constraints, the model maintains logical consistency in classification, without major systematic errors. Performance metrics reflect this moderate level of predictability, with an accuracy of 0.711 and a Macro-F1 score of 0.708. The close values indicate relatively balanced performance across classes and suggest that the difficulty arises primarily from the complexity of the task.
Regarding the DelayFamily classification, the model exhibits a different performance profile. Internal terminal delays are identified with high accuracy, whereas distinguishing between external delays and force majeure events proves more challenging. This limitation is mainly due to class imbalance, as rare events are underrepresented in the dataset, reducing the model’s ability to learn their characteristic patterns. This is reflected in the overall metrics: although accuracy is high (0.921), the Macro-F1 score is significantly lower (0.464), highlighting a pronounced imbalance in performance across classes.
For the Common category, the findings suggest that delay severity classification (DelayClass) is more stable and balanced than delay cause identification (DelayFamily), which is more sensitive to class distribution and the rarity of certain events. Compared to the Feeder category, performance is affected by both sample size and operational variability. However, the model still provides a reasonable identification of operational risk. These findings underline the need for larger datasets to improve classification robustness in heterogeneous operational contexts.
Interpretation for Mainline—DelayClass vs. DelayFamily
In the case of the MainLine category, the interpretation of the results presented in
Figure 8 must be approached with caution, given the very limited size of the dataset (38 observations for training and only 9 for testing). This limitation significantly affects the statistical robustness of the conclusions; therefore, the results should be considered indicative rather than definitive. In the DelayClass classification task, the model achieves apparently high performance values (Accuracy = 0.889; Macro-F1 = 0.852), suggesting a relatively balanced distribution of predictions across classes. However, in the context of such a small sample, these values may overestimate the model’s true generalization capability.
In contrast, DelayFamily classification reveals more pronounced limitations. Although the model identifies the dominant category (internal delays) satisfactorily, overall performance is affected by strong class imbalance and the small number of observations. This is reflected in the significant difference between accuracy (0.778) and the Macro-F1 score (0.219), indicating a limited capacity to correctly identify rare categories. Consequently, the global accuracy metric alone is insufficient for assessing actual performance, and complementary metrics are required to capture the effects of class imbalance.
Compared to the other ship categories, the results for MainLine confirm the general trend that delay severity classification is easier than identifying delay causes. While Feeder ships provide the most stable results and the Common category shows moderate performance, the MainLine case remains statistically constrained. In this context, the analysis highlights the importance of using metrics such as Macro-F1 for a more realistic evaluation of model performance, particularly in situations characterized by limited data and imbalanced class distributions.
In summary, the results indicate that delay severity classification appears more stable than causal family identification for MainLine ships; however, both findings must be interpreted cautiously due to the limited sample size. The comparison between the two tasks confirms that statistical robustness under constrained information scenarios is strongly dependent on dataset size and class balance.
4.4. Comparative Model Analysis
The comparative analysis between single decision tree models and ensemble models based on bagging was conducted to evaluate the benefits of aggregating multiple models in an operational environment characterized by high variability. The results consistently indicate that ensemble methods reduce the root mean squared error (RMSE) across all analyzed variables. This advantage is particularly relevant in the context of port operations, where data variability is driven by multiple and difficult-to-control factors.
The effect of variance reduction is most pronounced for the NMPH indicator, which is highly sensitive to delays and operational disruptions. Single decision tree models tend to overfit local patterns, leading to unstable predictions. In contrast, bagging—through the aggregation of multiple models trained on different samples—mitigates extreme deviations and produces more robust results. For GMPH and WBMPH, the improvement is more moderate due to the higher structural stability of these variables. For RQCP, the differences between methods are minimal, reflecting the more deterministic nature of this indicator.
From a bias–variance perspective, the use of ensemble models primarily contributes to reducing prediction variance without significantly increasing systematic error (bias). This characteristic is essential in heterogeneous operational environments, where factors such as weather conditions, equipment failures, or logistical constraints may generate substantial fluctuations. Moreover, ensemble models proved to be less sensitive to small sample sizes, delivering more stable results than single models, particularly in limited subsets such as those corresponding to MainLine ships.
The advantages of the ensemble approach are evident both statistically and operationally. The reduction in RMSE translates into more accurate productivity predictions, directly impacting quay crane allocation planning, berth operation organization, and congestion mitigation strategies. The high values of the coefficient of determination (R2) and the stability of results across both analysis modes (“forecast” and “decision”) confirm the effectiveness of the method, particularly for indicators such as GMPH and RQCP in the Feeder category.
4.5. Feature Importance Analysis
4.5.1. Operational Factors Weight
The variable importance analysis was conducted to identify the operational factors that most strongly influence model outcomes and to better understand the relative contribution of each variable in predicting different productivity indicators.
To facilitate the interpretation of the results and reduce the dimensionality of the feature space, the explanatory variables were grouped into several operational categories reflecting the main functional dimensions of container terminal activity. These categories include equipment allocation and utilization, operational disruptions and delay structure, container handling intensity, the temporal structure of berth utilization, derived performance indicators, and external constraints. This classification enables the assessment of the relative weight of each operational dimension in explaining the observed variability in productivity.
The weight of operational factors is defined as the aggregated relative importance of variables belonging to the same category, expressed in relation to the total contribution of all variables within the model:
The main method uses permutations and consists of randomly modifying the values of a variable and observing the increase in the prediction error; if the error increases significantly, that variable is considered important. In some situations, measures specific to decision-making trees have also been analyzed to verify that the hierarchies obtained are consistent.
Table 8, obtained from the aggregation of variable importance, includes several columns that summarize the contribution of each operational factor to the performance of the machine learning models. Each column has a specific meaning in evaluating the influence of variables on predictive outcomes.
Feature indicates the name of the variable (predictor) used in the model. Each row represents an operational factor from the dataset, such as the number of active cranes, operation duration, number of container moves, or different types of delays. In essence, this column identifies the variable whose influence on productivity indicators is being assessed.
MeanImportance represents the average importance of the variable computed across all models in which it appears. Importance is determined using the permutation importance method, which measures how much the model error increases when the values of that variable are randomly permuted. The higher this value, the stronger the variable’s influence on predictions.
MeanWeightPct indicates the average percentage weight of the variable within individual models. The importance of each variable is normalized so that the total importance within each model sums to 100%. This column therefore shows the average proportion of total predictor importance attributed to the respective variable.
SumImportance represents the sum of the raw importance values of the variable across all analyzed models. It provides a cumulative measure of the variable’s influence within the entire set of models, without percentage normalization. Variables with high values in this column are generally the most relevant for overall predictive performance.
SumWeightPct shows the aggregated total weight of the variable expressed as a percentage, obtained by summing the normalized weights across all models. This is typically the most useful metric for interpretation, as it allows direct comparison of the relative influence of operational factors on predictive results.
NumModelsPresent indicates the number of models in which the variable is included and for which its importance was calculated. Some variables may be absent from certain models due to data filtering, missing values, or differences between datasets (Feeder, Common, MainLine). This column therefore provides information on the representativeness of the variable across the analyzed models.
Figure 9 identifies the top 15 operational factors that contribute most significantly to explaining productivity variations in the container terminal and facilitates the managerial interpretation of machine learning results. Across all regression models, the most influential factors were consistently the number of active cranes and the total working hours. These variables directly reflect the terminal’s operational capacity and the intensity of equipment utilization. Their systematic presence at the top of the rankings confirms the central role of technical resource allocation in determining productivity, in line with both theoretical principles and operational practice in container terminals.
Operational delays, particularly those generated by mechanical failures and internal interruptions, demonstrated a significant influence on model performance, especially for indicators sensitive to disruptions during active operations. Permuting these variables led to consistent increases in prediction error, highlighting the direct impact of internal inefficiencies on productivity. At the same time, congestion indicators, such as crane density and berth utilization rate, played an important role in explaining variations in composite indicators, reflecting the systemic pressure exerted on terminal operations.
Moreover, external delays and force majeure events showed a more moderate predictive contribution due to their more random nature and weaker correlation with the operational structure. Administrative delays also had a limited impact on performance compared to technical factors and resource allocation decisions. Yard-related constraints became particularly relevant during periods of high traffic, when the interaction between quay operations and yard activities generates cumulative effects on overall productivity.
In summary, the results indicate that crane allocation and working-time-related variables demonstrate the highest explanatory stability, while delay-related and congestion-related variables remain more sensitive to operational variability. The comparison across factor groups confirms the robustness of structurally driven predictors within heterogeneous terminal conditions.
4.5.2. Weight by Categories of Operational Factors
The analysis of importance across categories of operational factors indicates that terminal productivity is primarily influenced by crane allocation and utilization, followed by operational delays and workload characteristics. This distribution confirms that operational performance is predominantly driven by internal structural factors rather than by random variations in the logistics process.
To evaluate the relative influence of operational factors on predictive outcomes, the variable importance values obtained through permutation methods were aggregated not only at the individual level but also across functional categories. This approach enabled the identification of the relative contribution of major operational dimensions, such as crane allocation, operational delays, workload intensity, and the temporal structure of operations.
Table 9, derived from aggregating variable importance across categories of operational factors, presents several columns that summarize the contribution of each operational dimension to the performance of the machine learning models.
Category indicates the operational category in which the explanatory variables have been grouped. Each category represents a functional dimension of container terminal operations, such as equipment allocation, operational delays, or container handling intensity. Grouping variables into categories reduces analytical complexity and highlights the structural factors influencing operational productivity.
MeanImportance represents the average raw importance of the variables within a category, computed across all models in which they appear. Importance is determined using the permutation importance method, which estimates how much the model error increases when predictor values are randomly permuted. This metric therefore reflects the average contribution of the factors within a category to model performance.
MeanWeightPct indicates the average percentage weight of the category within individual models and expresses its relative importance in the overall predictor structure. Variable importance is first normalized within each model so that the total equals 100%, after which the average of these weights is computed across all variables belonging to the category.
SumImportance represents the sum of the raw importance values of all variables within a category, aggregated across all analyzed models. It provides a cumulative measure of the category’s influence on predictions and is useful for identifying the operational dimensions that contribute most significantly to explaining productivity variations.
SumWeightPct expresses the total aggregated weight of the category across all models, calculated by summing the normalized percentage weights of the variables belonging to that category. This is typically the most relevant metric for interpretation, as it allows direct comparison of the relative contribution of different categories of operational factors.
NumFeatures indicates the number of individual variables (predictors) included in the respective category and reflects its dimensional complexity, showing how many factors contribute to representing that operational dimension.
NumModelsPresent represents the number of predictive models in which variables from that category are included and for which importance was computed. Since some models may use different subsets of variables (depending on ship type or analysis mode—forecast/decision), this column provides an overview of the consistency with which the category appears across the overall analysis.
Thus, by aggregating the importance at the category level, the analysis becomes easier to interpret from a managerial perspective, facilitating the identification of areas where operational interventions can generate the most significant improvements in terminal performance as shown in
Figure 10.
In summary, the aggregated results indicate that equipment allocation and utilization categories demonstrate the strongest and most stable contribution to predictive performance, while delay-related categories remain more sensitive to operational variability. This comparison confirms the dominant role of internal structural factors under constrained information scenarios.
4.6. Cross-Target Structural Insights
The comparative analysis of results obtained through regression and classification across all productivity indicators reveals significant structural differences that go beyond a simple comparison of performance values. These differences provide a clearer understanding of how each indicator responds to operational variability and to the dynamics of delays within the terminal.
RQCP proved to be the most stable and predictable indicator. Prediction errors were low, variability across model runs was minimal, and the most important explanatory variables were directly related to crane allocation and working hours. This behavior is consistent with the definition of the indicator, which measures equipment efficiency directly, without being strongly influenced by berth-level normalization factors or indirect system effects.
The GMPH indicator exhibited moderate elasticity. Although it remains closely linked to crane utilization, it is more sensitive than RQCP to systemic disruptions such as operational congestion, equipment failures, adverse weather conditions, yard-related logistical issues, ship delays, scheduling changes, and organizational or administrative constraints. Because it incorporates both the total number of moves and gross working hours, GMPH reflects both mechanical performance and certain operational inefficiencies.
In contrast, NMPH proved to be the most volatile indicator under conditions characterized by operational shocks, namely unexpected events such as equipment failures, extreme weather, sudden congestion, major ship delays, yard disruptions, or organizational constraints that disrupt normal operations. Since it is calculated based on effective productive time, NMPH is directly affected by delays occurring during active operations. The analysis showed that sudden increases in internal delays generate more pronounced fluctuations in NMPH compared to other productivity indicators, confirming its role as a highly reactive metric capable of capturing rapid deterioration in operational conditions.
WBMPH occupies an intermediate position among the analyzed indicators. Its formulation combines berth-level normalization with actual operational performance, resulting in a balance between stability and sensitivity to delays. While it responds to operational disruptions, its volatility is lower than that of NMPH but higher than that of RQCP, reflecting a balanced predictive behavior.
The analysis of variability across different data splits confirms a clear hierarchy: (1) RQCP exhibits the lowest variability, (2) NMPH the highest, and (3) GMPH and WBMPH occupy intermediate positions. Furthermore, the propagation of internal delays differs across indicators. The strongest impact is observed for NMPH, a moderate effect for WBMPH, and a more limited influence for RQCP. This indicates that normalization levels play a key role in shaping sensitivity to disruptions.
Finally, the correlation analysis among productivity indicators shows that, although they are interrelated, they are not redundant, as each captures a distinct dimension of operational performance. The results support a clear conceptual hierarchy: equipment-level productivity (RQCP) emerges as the most stable and deterministic indicator, driven primarily by resource allocation; GMPH reflects both equipment utilization and moderate operational influences; WBMPH displays a hybrid behavior, combining allocation effects with delay sensitivity; and NMPH remains the most sensitive to operational disruptions, particularly those occurring during active operations, making it especially relevant for assessing operational risk. In summary, the cross-target analysis confirms that structurally driven metrics exhibit the highest predictive robustness, while disruption-sensitive indicators are more vulnerable to operational variability.
4.7. Sensitivity and Robustness Analysis
To evaluate the robustness of the modeling framework under extreme operational conditions, sensitivity analyses were conducted to simulate sudden increases in delay levels. These scenarios correspond to realistic situations such as severe congestion, a high frequency of mechanical failures, or the accumulation of internal delays beyond typical operating levels.
Methodologically, these tests involved the controlled modification of aggregated delay variables and indicators related to crane availability, while keeping other structural characteristics constant. This approach allowed the isolation of the effect of operational shocks on model performance. The results revealed nonlinear behavior. For moderate increases in delays, model accuracy decreases gradually but remains within operationally acceptable limits. However, once a certain congestion threshold is exceeded, performance degrades rapidly, particularly for indicators sensitive to disruptions, such as NMPH. This dynamic is consistent with real terminal operations, where moderate congestion can be mitigated through operational adjustments, whereas severe accumulations generate cascading effects across the entire system.
The comparison between single models and ensemble models highlighted the advantage of the bagging technique in maintaining stability across a wider range of disruption intensity. This is achieved by reducing the influence of extreme observations and smoothing prediction variability. As a result, performance degradation is more gradual for ensemble models, and their ability to distinguish between operational states remains stronger, including in classification tasks. The analysis also enabled the identification of a conceptual congestion threshold (T), beyond which prediction reliability declines significantly, marking the transition toward systemic disruptions.
While GMPH and WBMPH exhibit relatively higher resilience due to normalization mechanisms, and QC Raw remains the most stable under consistent equipment utilization, NMPH confirms its high sensitivity to delays occurring during active operations. Overall, the models prove reliable under normal or moderately disrupted conditions. However, in scenarios of extreme congestion, prediction uncertainty increases substantially, requiring cautious interpretation in decision-making contexts.
4.8. Summary of Empirical Findings
The analysis conducted within a conventional container terminal provides a detailed evaluation of the performance of machine learning models applied to multiple productivity indicators under different operational conditions. The results confirm both the methodological soundness of the modeling framework and the structural differences among the analyzed indicators. By employing ensemble models, superior results were obtained—both in regression and classification—compared to simple models based on a single decision tree. The use of bagging reduced prediction variance and improved generalization capability under heterogeneous operational conditions. The most significant performance improvements were observed for indicators strongly influenced by delays, such as NMPH, where operational activity is characterized by high variability. The choice of ensemble methods proved essential, as it reduced extreme fluctuations, particularly in the presence of high data noise and uneven delay distributions.
At the same time, the “forecast” mode highlighted the indicators RQCP and GMPH. When variables related to operational time and workload volumes were included, the models achieved high R2 values and demonstrated increased predictive stability. RQCP proved to be the most deterministic indicator, while GMPH also showed a high level of predictability due to its direct relationship with gross working hours and equipment allocation.
The “decision” mode enhanced the operational relevance of the analytical framework by relying exclusively on variables available prior to or at the beginning of ship operations. Although predictive performance was slightly lower than in forecast mode, the results remain sufficiently robust to support decision-making in the pre-operational phase. The models successfully identified high-risk operational situations and congestion intervals without relying on post-operation information.
Another important outcome concerns robustness to incomplete data. The preprocessing workflow—combining the removal of variables with excessive missing values and median-based imputation—contributed to improving model stability and preserving the natural variability of the data. This step is particularly important in port operational environments, where reporting practices may vary over time and missing information is common.
The results also confirm that the analyzed productivity indicators are structurally distinct and should not be treated as equivalent. RQCP proved to be the most stable and least volatile; GMPH exhibited moderate elasticity; NMPH was the most sensitive to delay-induced shocks; and WBMPH occupied an intermediate position, combining normalization effects with responsiveness to operational conditions. These differences support the previously proposed conceptual taxonomy, according to which each indicator reflects a distinct level of terminal performance.
Sensitivity analysis showed that predictive performance remains stable within normal operational ranges but deteriorates under conditions of extreme congestion. This behavior is consistent with the nonlinear nature of systemic disruptions in port environments and highlights the need to apply models within a monitored framework.
Observed vs. predicted scatter plots, used to evaluate regression model performance in estimating operational productivity, show a strong correspondence between observed and predicted values. Deviations from the diagonal line reflect prediction errors or areas where the model has reduced explanatory capacity. Interpretation is carried out on two levels: (1) by ship traffic type (Feeder vs. Common) and (2) by modeling mode (decision vs. forecast), as well as by productivity indicator (GMPH, NMPH, RQCP).
4.8.1. Feeder Traffic
The dispersion of points around the diagonal provides an implicit indication of prediction uncertainty, where tighter clustering reflects higher model confidence, while wider dispersion indicates increased variability associated with operational disturbances.
Feeder—Productivity NMPH: Decision vs. Forecast
The results for the prediction of the NMPH indicator for Feeder ships (
Figure 11) highlight a high predictive performance in both modeling regimes, forecast and decision. Graphical representations show a strong concentration of observations around the diagonal line, indicating a high level of agreement between observed and predicted values. In forecast mode, NMPH values range approximately between 12 and 38 moves per hour, while model predictions cover a similar interval (14–39), with a high density of points in the 26–32 range, reflecting a strong ability to capture operational dynamics. Quantitative performance metrics support these observations, with the model achieving R
2 ≈ 0.908, RMSE ≈ 1.30, and MAE ≈ 0.96, indicating a low level of estimation error.
In decision mode, where variables that may introduce information leakage are excluded, the distribution structure remains similar, and performance is maintained at a comparable level (R2 ≈ 0.907, RMSE ≈ 1.32, MAE ≈ 0.97). The differences between the two regimes are minimal, with only a slight increase in dispersion observed for lower productivity values, where the model tends to slightly overestimate results, likely due to atypical operational disruptions. For higher values (33–38 NMPH), the correlation remains very strong, confirming that structural variables such as crane allocation and delay patterns are sufficient to anticipate net productivity. From an operational perspective, these results support the use of the models in the planning phase, enabling reliable performance estimation and optimization of resource allocation prior to the actual execution of operations.
Feeder—Productivity GMPH: Decision vs. Forecast
The results for the GMPH indicator prediction for the Feeder category (
Figure 12) highlight a very high level of predictive performance in both modeling regimes (forecast and decision), as reflected by the near-perfect alignment of observations along the diagonal line in the validation plots.
In forecast mode, the observed productivity values range approximately between 5 and 36 moves per hour, while model predictions cover a comparable interval (11–33), with a strong concentration in the 22–30 GMPH range, where deviations from the ideal diagonal are minimal. The statistical performance confirms this accuracy, with the model achieving R2 ≈ 0.958, RMSE ≈ 0.82, and MAE ≈ 0.28, indicating a high capability to estimate gross productivity under conditions of complete information.
In decision mode, although variables dependent on the final outcome of operations are excluded, performance remains very high and is even slightly improved (R2 ≈ 0.975, RMSE ≈ 0.60, MAE ≈ 0.27), with a more compact distribution of points around the diagonal. This stability indicates that GMPH is primarily determined by structural factors such as crane allocation and operational intensity, which are already available at the planning stage. The differences between the two regimes are minimal and are observed only for very low productivity values, where slight overestimations occur in forecast mode. Overall, the results confirm the strong predictability of GMPH in Feeder traffic and support the use of machine learning models as effective tools for resource planning and equipment utilization optimization in container terminals.
Feeder—Productivity RQCP: Decision vs. Forecast
The results for the RQCP indicator prediction (
Figure 13) for the Feeder category show an extremely strong correlation between observed and estimated values in both forecast and decision modes, as reflected by the near-perfect alignment of points along the diagonal. In forecast mode, observed values range approximately between 0 and 88 moves per hour, while predictions fall within a comparable interval (0–75), with a pronounced concentration in the 20–55 range, where deviations are minimal. The statistical performance confirms this high level of accuracy (R
2 ≈ 0.988, RMSE ≈ 1.62, MAE ≈ 0.72), indicating a low prediction error relative to the amplitude of the values. In decision mode, the distribution remains similar, with observed values between 0 and 78 and predictions between 0 and 74 moves per hour, while performance is slightly improved (R
2 ≈ 0.989, RMSE ≈ 1.51, MAE ≈ 0.73), highlighting the robustness of the model even in the absence of variables that could introduce information leakage.
The comparison between the two regimes reveals only minor differences, limited to slight underestimations at very high productivity values and marginally increased dispersion for some intermediate observations. The presence of very low or near-zero values—likely associated with periods of reduced or interrupted activity—does not affect the coherence of the relationship between observed and predicted values.
Overall, the results confirm that RQCP is one of the most predictable indicators analyzed, being primarily determined by direct operational factors such as crane allocation and handling volume. From an operational perspective, this high level of predictability supports the use of machine learning models in the planning phase, enabling accurate estimation of equipment performance and optimization of resource allocation in Feeder traffic characterized by stable and repetitive operational patterns.
4.8.2. Common (Barges) Traffic
Common (Barges)—Productivity NMPH: Decision vs. Forecast
The results for the prediction of the NMPH indicator for ships in the Common category (
Figure 14) highlight the existence of a coherent predictive relationship between observed and estimated values, albeit with a higher level of dispersion compared to Feeder traffic, reflecting the more heterogeneous nature of these operations.
In forecast mode, observed values range between 17 and 34 moves per hour, while model predictions cover a similar interval (18–35), with a pronounced concentration in the 24–30 NMPH range. Although the model captures the general productivity trend accurately, moderate deviations are observed, particularly in the 25–28 NMPH interval, suggesting the influence of additional operational factors not fully captured by the included variables. For extreme values, both low (17–20) and high (31–34), the agreement remains generally good, indicating an adequate capacity to model overall operational dynamics.
In decision mode, the structure of the relationship is preserved, although prediction dispersion becomes slightly more pronounced, especially in the mid-range values (26–29 NMPH), where deviations from the ideal diagonal are more visible. The relatively small difference between the two regimes indicates that a significant portion of the predictive information is already contained in variables available prior to the execution of operations, although the exclusion of outcome-dependent variables leads to a moderate decrease in accuracy. Overall, the results show that NMPH for Common ships is reasonably predictable, but with a higher level of uncertainty driven by operational variability and the lower degree of standardization. From an operational perspective, the models can provide useful estimates for planning purposes; however, their use should be accompanied by a careful assessment of variability and the uncertainty associated with the predictions.
Common (Barges)—Productivity GMPH: Decision vs. Forecast
The analysis of the GMPH prediction (
Figure 15) for ships in the Common category highlights a coherent predictive relationship between observed and estimated values in both forecast and decision modes, with points distributed along a linear trend close to the ideal diagonal.
In forecast mode, observed values range approximately between 16 and 35 moves per hour, while predictions fall between 16 and 32, with a pronounced concentration in the 25–30 GMPH interval, where the model accurately reproduces average productivity levels. For lower values (16–20 GMPH), a slightly higher dispersion is observed, while for higher values (31–35 GMPH), there is a tendency toward underestimation, suggesting limitations in capturing high-performance operational configurations.
In decision mode, the relationship’s structure remains consistent, with increased dispersion in predictions for values exceeding 33–35 GMPH, leading to underestimation. This discrepancy from forecast mode is due to excluding outcome-dependent variables, elevating uncertainty and emphasizing operational variables. GMPH for Common ships is a moderately predictable metric, showing more variability than in Feeder traffic due to operational diversity. Models offer reliable estimates for mid-range productivity but necessitate caution when forecasting extreme values, possibly requiring additional variables for better operational comprehension.
Common (Barges)—Productivity RQCP: Decision vs. Forecast
The results for the prediction of the RQCP indicator for ships in the Common category (
Figure 16) highlight a positive relationship between observed and estimated values, although with higher variability compared to Feeder traffic, reflecting the operational heterogeneity specific to this ship type. In forecast mode, observed values range approximately between 0 and 56 moves per hour, while predictions fall between 0 and 40, with a predominant concentration in the 18–30 moves per hour interval, where the model captures the general trend accurately. However, for higher productivity values, significant deviations are observed, with the model tending to underestimate extreme performance levels and compress predictions in the upper range of the distribution, indicating a limited ability to fully capture the operational conditions associated with very high values.
In decision mode, prediction dispersion becomes more pronounced, particularly for higher values (approximately 47–50 moves per hour), where estimates vary considerably due to the model’s reliance exclusively on structural variables available prior to operation. Although the predictive relationship remains coherent within the mid-range interval (18–28 moves per hour), the exclusion of outcome-dependent variables leads to increased uncertainty and more visible deviations from the ideal diagonal. The presence of very low or near-zero values, associated with limited or interrupted activity, further contributes to prediction variability. RQCP for Common ships is reasonably predictable, but with a higher level of uncertainty, requiring cautious interpretation (especially for extreme values) and suggesting the need to extend the set of variables in order to better capture operational complexity.
To facilitate a comparative interpretation of the results,
Table 10 provides a synthetic overview of the predictive performance across all productivity indicators, vessel types, and modeling modes. The table highlights the relative stability of structurally driven indicators such as RQCP and GMPH, as well as the higher variability associated with NMPH, particularly in the case of Common traffic and under decision-mode constraints. This synthesis enables a concise evaluation of model robustness and the sensitivity of each indicator to operational conditions.
5. Discussion
The results of the study confirm that machine learning (ML) techniques can accurately predict quay crane (QC) productivity in conventional terminals, providing valuable decision support for the proactive management of delays.
Beyond predictive performance, the findings should be interpreted within the methodological framework proposed in this study. Unlike conventional approaches focused on single-task prediction, this framework enables a differentiated interpretation of operational performance by distinguishing between structurally driven and delay-sensitive productivity indicators. This perspective shifts the role of machine learning from a purely predictive tool to an integrated decision-support mechanism, particularly suited to conventional container terminals characterized by high variability and limited automation.
A central insight of the analysis is that terminal productivity cannot be treated as a single, homogeneous construct. The comparative evaluation of the four indicators—RQCP, GMPH, WBMPH, and NMPH—reveals a clear structural hierarchy in terms of predictability and sensitivity to disruptions. RQCP exhibits the highest stability and predictability, being primarily driven by direct operational inputs such as crane allocation and effective working time. In contrast, NMPH shows pronounced variability, reflecting its dependence on disruptions occurring during active operations. GMPH and WBMPH occupy intermediate positions, combining structural dependence on resource utilization with varying degrees of responsiveness to delay propagation.
This differentiation has important theoretical implications. It indicates that productivity indicators inherently capture distinct dimensions of terminal performance, ranging from deterministic efficiency to disruption-sensitive responsiveness. In this context, RQCP can be interpreted as a measure of equipment-level efficiency under relatively stable conditions, whereas NMPH reflects the system’s responsiveness to operational shocks. This layered interpretation aligns with broader perspectives on operational resilience, where performance results from the interaction between structural capacity and disturbance propagation mechanisms.
One of the most significant methodological findings is the superiority of bagging-based ensemble models over individual decision trees. In port environments characterized by noisy data and uneven delay distributions, bagging significantly reduces prediction variance and improves model robustness. This advantage is particularly relevant under moderate congestion conditions, where random fluctuations can be effectively filtered. However, this study also identifies a congestion threshold (T), beyond which model reliability declines as the system enters a regime of cascading disruptions that are difficult to capture using conventional approaches.
These findings are consistent with prior research demonstrating the effectiveness of ensemble learning techniques in complex and noisy operational environments. However, unlike existing studies that focus primarily on improving predictive accuracy, the present work shows that model performance must be interpreted in relation to the structural characteristics of the target indicators. This highlights that the success of machine learning applications in port operations depends not only on algorithm selection, but also on the alignment between modeling design and operational realities.
From a methodological perspective, the study contributes by embedding machine learning models within an operationally grounded framework that explicitly links predictive performance to productivity indicators, delay typologies, and resource allocation strategies. This approach contrasts with studies that evaluate model accuracy in isolation, without integrating operational context. The results confirm that model robustness depends not only on algorithm choice, but also on the structuring of input variables and their alignment with real-world decision constraints.
The validation of the “decision mode,” which excludes post-operational variables, demonstrates the practical applicability of the proposed approach. The fact that indicators such as GMPH and RQCP maintain R2 values above 0.90 (particularly for Feeder traffic) in a pre-operational setting suggests that planning variables—such as crane allocation, vessel characteristics, and historical delay patterns—contain most of the information required for reliable performance estimation.
From an operational perspective, the “decision mode” framework provides a realistic approximation of pre-operational planning conditions, enabling the identification of high-risk scenarios without relying on post-event information. This enhances its potential integration into planning processes, where early-stage estimation of productivity and delay risk is critical for resource allocation decisions.
Although the proposed models were not directly deployed within an operational decision-support system, the validation strategy is grounded in real-world conditions. The use of actual terminal data, combined with the restriction to pre-operational variables, provides a realistic proxy for implementation scenarios.
In this context, the models are evaluated under constraints similar to those faced by terminal planners, ensuring that predictive outputs are both feasible and actionable. The consistency of performance across ship categories and operational regimes further supports their robustness. The framework can therefore be interpreted as an operationally validated analytical baseline, with potential for integration into planning workflows or extension through simulation-based and real-time decision-support systems.
The variable importance analysis confirms that crane allocation and utilization are the primary drivers of productivity. Internal terminal delays (DC-I), such as mechanical failures and workforce inefficiencies, have a greater impact on performance degradation than external factors such as weather conditions or scheduling constraints. This indicates that terminal operators retain direct control over key performance drivers through the optimization of internal processes.
The analysis of observed versus predicted values further supports these findings. A strong alignment along the ideal diagonal indicates high predictive capability for most productivity indicators. The best results are obtained for RQCP and GMPH, which depend primarily on stable operational variables such as crane allocation, working hours, and handling intensity. The relative stability of these variables enables models to capture underlying relationships more effectively, resulting in consistent and accurate predictions. By contrast, NMPH exhibits greater dispersion in predictions, reflecting its sensitivity to operational delays and interruptions during handling activities. Because such disruptions occur unpredictably and vary significantly across ship calls, modeling NMPH is inherently more complex and associated with higher prediction variability.
This differentiation between stable and disruption-sensitive indicators suggests that productivity metrics should not be treated as interchangeable in operational decision-making. Instead, they should be used in a complementary manner: stable indicators support long-term planning and resource allocation, while reactive indicators provide early-warning signals for emerging disruptions. This layered approach enhances the integration of predictive models into decision-support systems, enabling both strategic optimization and real-time operational control.
From an operational standpoint, the findings provide actionable insights for terminal management. The differentiation between productivity indicators highlights that performance cannot be assessed using a single metric, as each captures distinct aspects of operational efficiency. In particular, the strong dependence of RQCP and GMPH on crane allocation underscores the importance of resource planning, while the sensitivity of NMPH to delays makes it suitable for real-time monitoring and risk assessment. This enables a more targeted approach to operational control, combining strategic planning with responsive intervention.
Furthermore, the analysis shows that model performance is generally higher for Feeder traffic than for Common traffic. This can be explained by the higher level of standardization in Feeder operations, where vessel characteristics and handling processes are more consistent. In contrast, Common traffic exhibits greater variability, driven by differences in ship size, cargo volumes, and operational organization. The limited dataset for MainLine vessels reduces the robustness of conclusions for this category, highlighting the need for more extensive data in future research. The higher variability observed in Common traffic also suggests the need to incorporate additional contextual variables to better capture its specific characteristics.
These findings reinforce the practical relevance of the proposed framework, demonstrating its potential to support both strategic planning and real-time decision-making in conventional container terminal environments.
Overall, the results emphasize that predictive modeling in port operations should not be evaluated solely in terms of statistical accuracy, but in relation to its ability to capture the structural dynamics of the operational system. By linking machine learning outputs to distinct layers of terminal performance, this study contributes to bridging the gap between data-driven modeling and practical decision-making in conventional container terminals.
6. Conclusions and Future Research Directions
This study examines the applicability of machine learning techniques for predicting operational productivity in conventional container terminals, using real-world data and a structured analytical framework. The results confirm that machine learning models are capable of capturing complex relationships between operational variables, delay structures, and equipment utilization, providing reliable estimates of key productivity indicators under both retrospective and pre-operational conditions.
The analysis highlights clear structural differences between productivity indicators. RQCP and GMPH demonstrate high predictive stability, being primarily driven by deterministic factors such as crane allocation and working time. In contrast, NMPH exhibits significantly higher variability, reflecting its sensitivity to operational disruptions and delays occurring during active handling processes. WBMPH occupies an intermediate position, combining elements of structural stability with moderate responsiveness to operational conditions. These findings confirm that productivity indicators should not be treated as interchangeable, but rather as complementary measures reflecting distinct dimensions of terminal performance.
From a methodological perspective, the results demonstrate that ensemble-based models provide robust and consistent predictive performance in heterogeneous operational environments. The use of bagging techniques contributes to variance reduction and improved generalization, particularly for indicators sensitive to disruptions. The comparative analysis across ship categories further shows that model performance is strongly influenced by data structure and operational consistency, with more reliable predictions obtained for standardized traffic (Feeder) compared to more heterogeneous contexts (Common and MainLine).
6.1. Technical Contributions
The findings suggest that predictive accuracy is closely linked to the structural characteristics of the target indicators. Metrics primarily determined by resource allocation and operational intensity can be estimated with high reliability, whereas indicators influenced by real-time disruptions require a more complex representation of operational variability.
Simultaneously, the analysis highlights the importance of incorporating delay structures into predictive models. Internal delays, in particular, play a central role in shaping productivity outcomes, exerting a stronger influence than external or exceptional factors. This confirms that operational performance is largely driven by internal system dynamics rather than purely exogenous conditions.
From a technical perspective, the differences observed across ship categories emphasize the role of data homogeneity and sample size in model performance. Standardized operational patterns lead to more stable and predictable outcomes, whereas heterogeneous environments introduce higher variability and increased prediction uncertainty. These aspects should be considered when extending predictive models to different terminal contexts.
6.2. Managerial Implications
From an application perspective, the study demonstrates that integrating machine learning models into container terminal operational management systems can improve crane planning and resource optimization processes by providing realistic estimates of productivity before operations begin. At the same time, the models effectively contribute to the early identification of situations with a high risk of productivity decline, facilitating the implementation of appropriate delay mitigation strategies.
From an operational perspective, the results support a differentiated approach to performance management in container terminals. The use of multiple productivity indicators enables a more nuanced understanding of operational efficiency, allowing decision-makers to align analytical outputs with specific management objectives.
Structurally stable indicators, such as RQCP and GMPH, are particularly suitable for strategic planning and resource allocation, as they provide consistent estimates based on pre-operational information. In contrast, delay-sensitive indicators such as NMPH can be used as early-warning signals for operational disruptions, supporting real-time monitoring and risk assessment.
From a managerial perspective, the analysis also highlights the practical relevance of predictive modeling for pre-operational decision-making. Reliable productivity estimates can be obtained using variables available at the planning stage, enabling proactive adjustments in crane allocation and operational scheduling. In addition, the identification of internal delays as key drivers of performance degradation indicates that terminal operators retain direct control over productivity improvements through maintenance optimization, workforce coordination and process management.
Overall, the results demonstrate that machine learning models can support the transition from reactive to predictive operational management, thereby enhancing both efficiency and decision-making in complex port environments.
6.3. Limitations and Future Research Directions
Although the proposed modeling framework has been validated under realistic operational constraints, it has not yet been deployed or tested within a live operational environment. As such, while the results provide a solid analytical foundation, further validation within real-world decision-support systems or digital twin implementations remains necessary.
Despite its contributions, the study is subject to several limitations that should be acknowledged. First, the dataset is derived from a single conventional container terminal, which may limit the generalizability of the findings to other operational environments with different infrastructure configurations or traffic patterns. Future research should incorporate multi-terminal datasets to validate the consistency of the observed relationships across diverse contexts.
Second, although the modeling approach includes mechanisms to reduce overfitting, the possibility of model-specific bias cannot be entirely excluded, particularly in the presence of heterogeneous data and imbalanced ship categories. Extending the analysis through alternative validation strategies and comparative modeling approaches would further strengthen the robustness of the results.
Third, the absence of real-time implementation limits the assessment of integration constraints associated with operational deployment, such as data availability, system interoperability, and user interaction. Future work should focus on embedding predictive models within decision-support systems or digital twin environments in order to evaluate their performance under live operational conditions.
Finally, the exclusion of certain contextual variables—such as detailed meteorological data, yard congestion indicators, and workforce-related factors—may reduce the explanatory capacity of the models, particularly in extreme or atypical scenarios. The integration of multi-source data represents a key direction for improving predictive accuracy and capturing the full complexity of terminal operations.
Future research will extend the current framework toward a more comprehensive representation of container terminal systems. This includes the integration of yard management processes, such as container stacking and rehandling dynamics, as well as the modeling of multimodal transport flows involving maritime, road, and rail operations. Additionally, the incorporation of sustainability-related variables, including energy consumption and emission reduction strategies, will support the development of more efficient and environmentally sustainable terminal operations.
By advancing toward integrated, data-driven models of terminal activity, future studies can contribute to enhancing system resilience, improving operational coordination, and supporting the transition toward intelligent and sustainable port ecosystems.