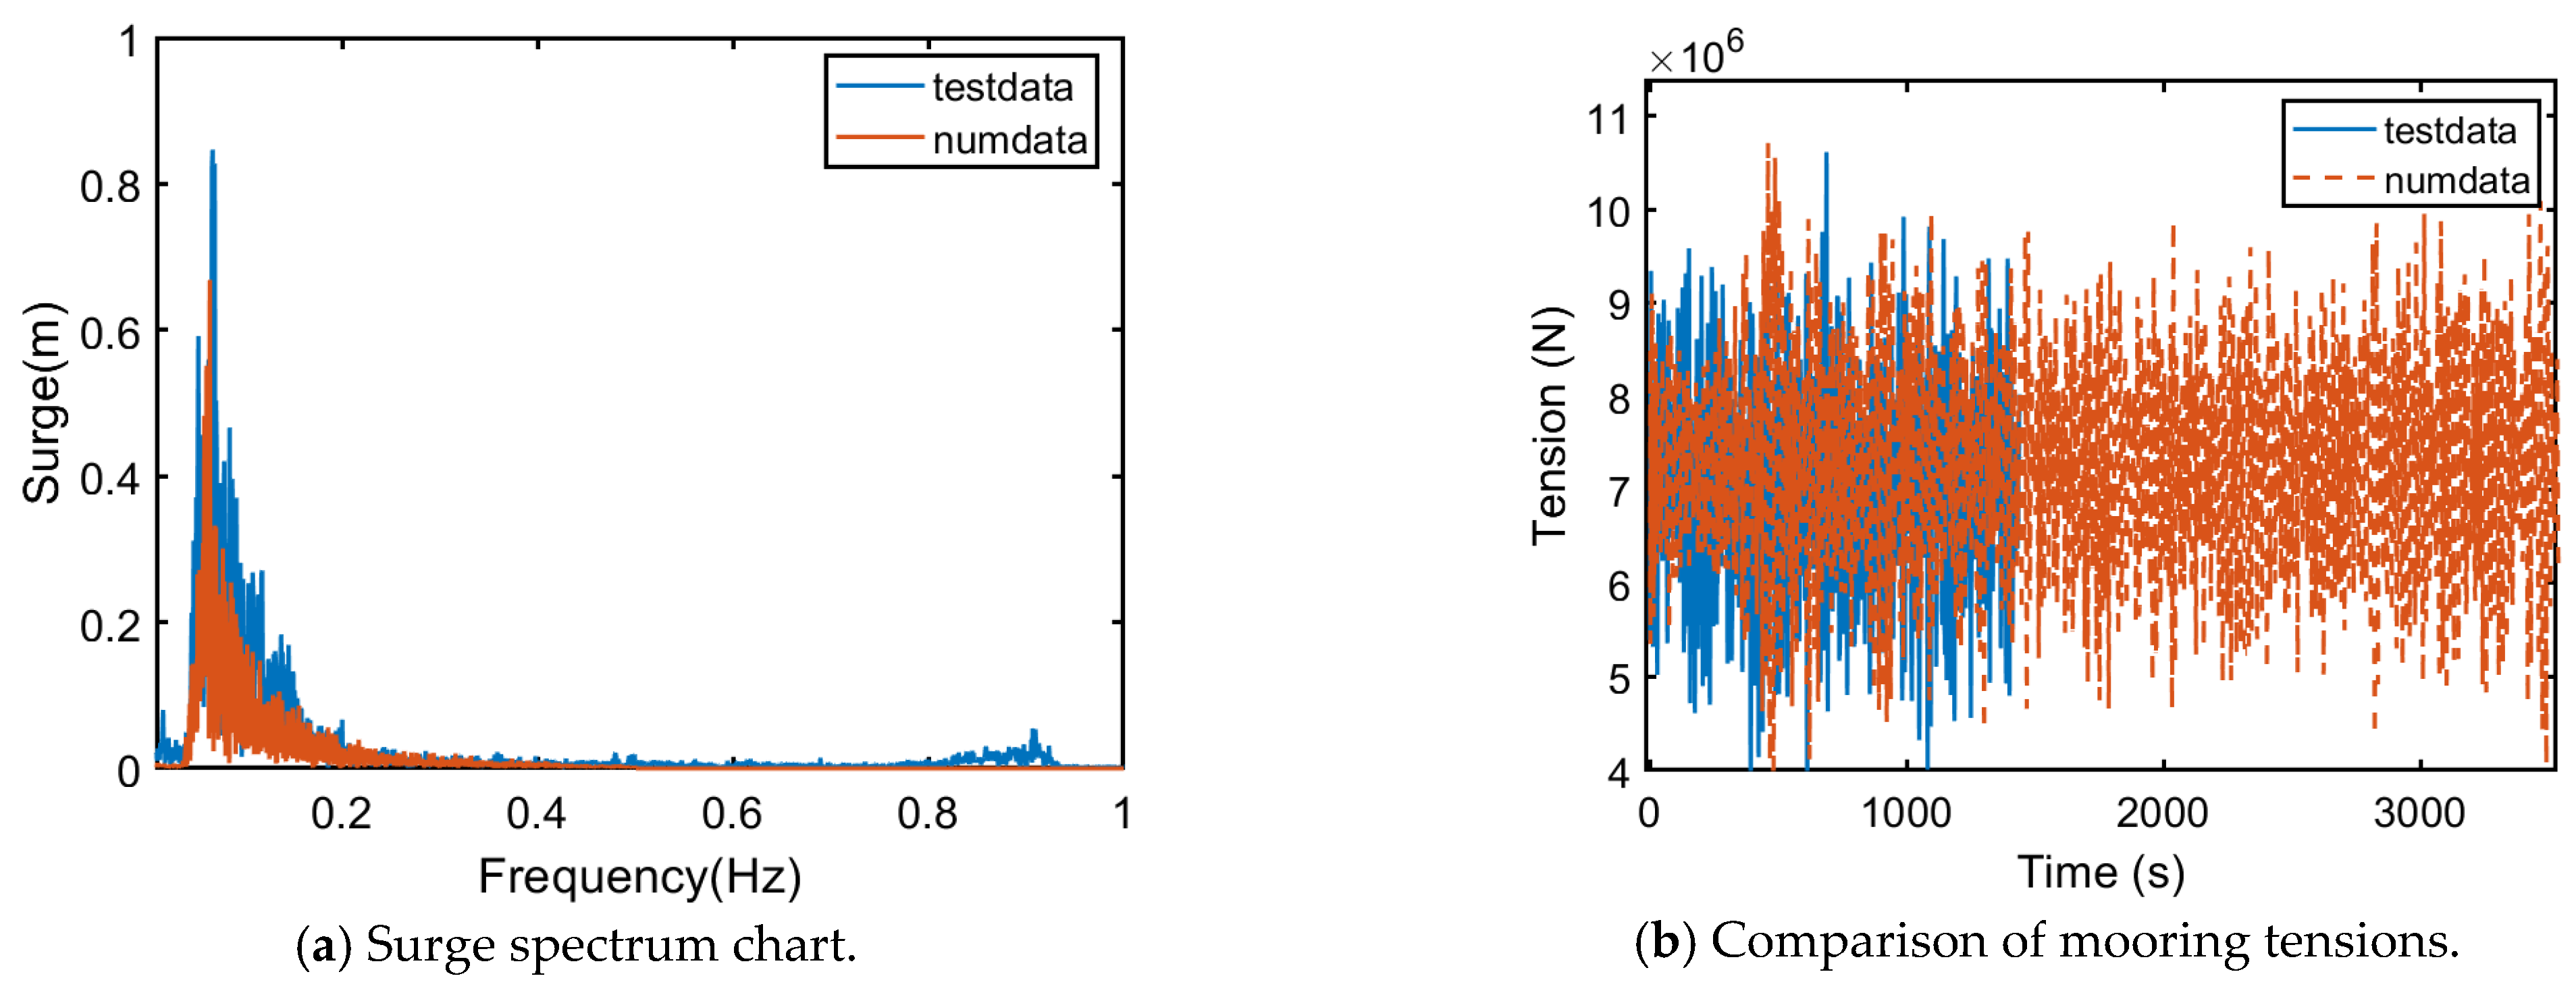
This section introduces the design of the TLP FOWT and the mechanical properties of tendons. Subsequently, hydrodynamic coefficients are obtained via HydroDyn, and a numerical model is established via the latest version of OpenFAST with all its sub-modules to analyze its hydrodynamic performances as well as the dynamic responses under various sea conditions, including wind, wave–current coupling, and wind–wave–current coupling, to evaluate the motion performance of different schemes and conduct model selection. Among them, MoorDyn is adopted for mooring modeling, ServoDyn is used for servo control, and AeroDyn is employed as the aerodynamic module.
3.1. Conceptual Design and Screening of Schemes A, B and C
The present platform design follows our previously developed 15 MW TLP FOWT [
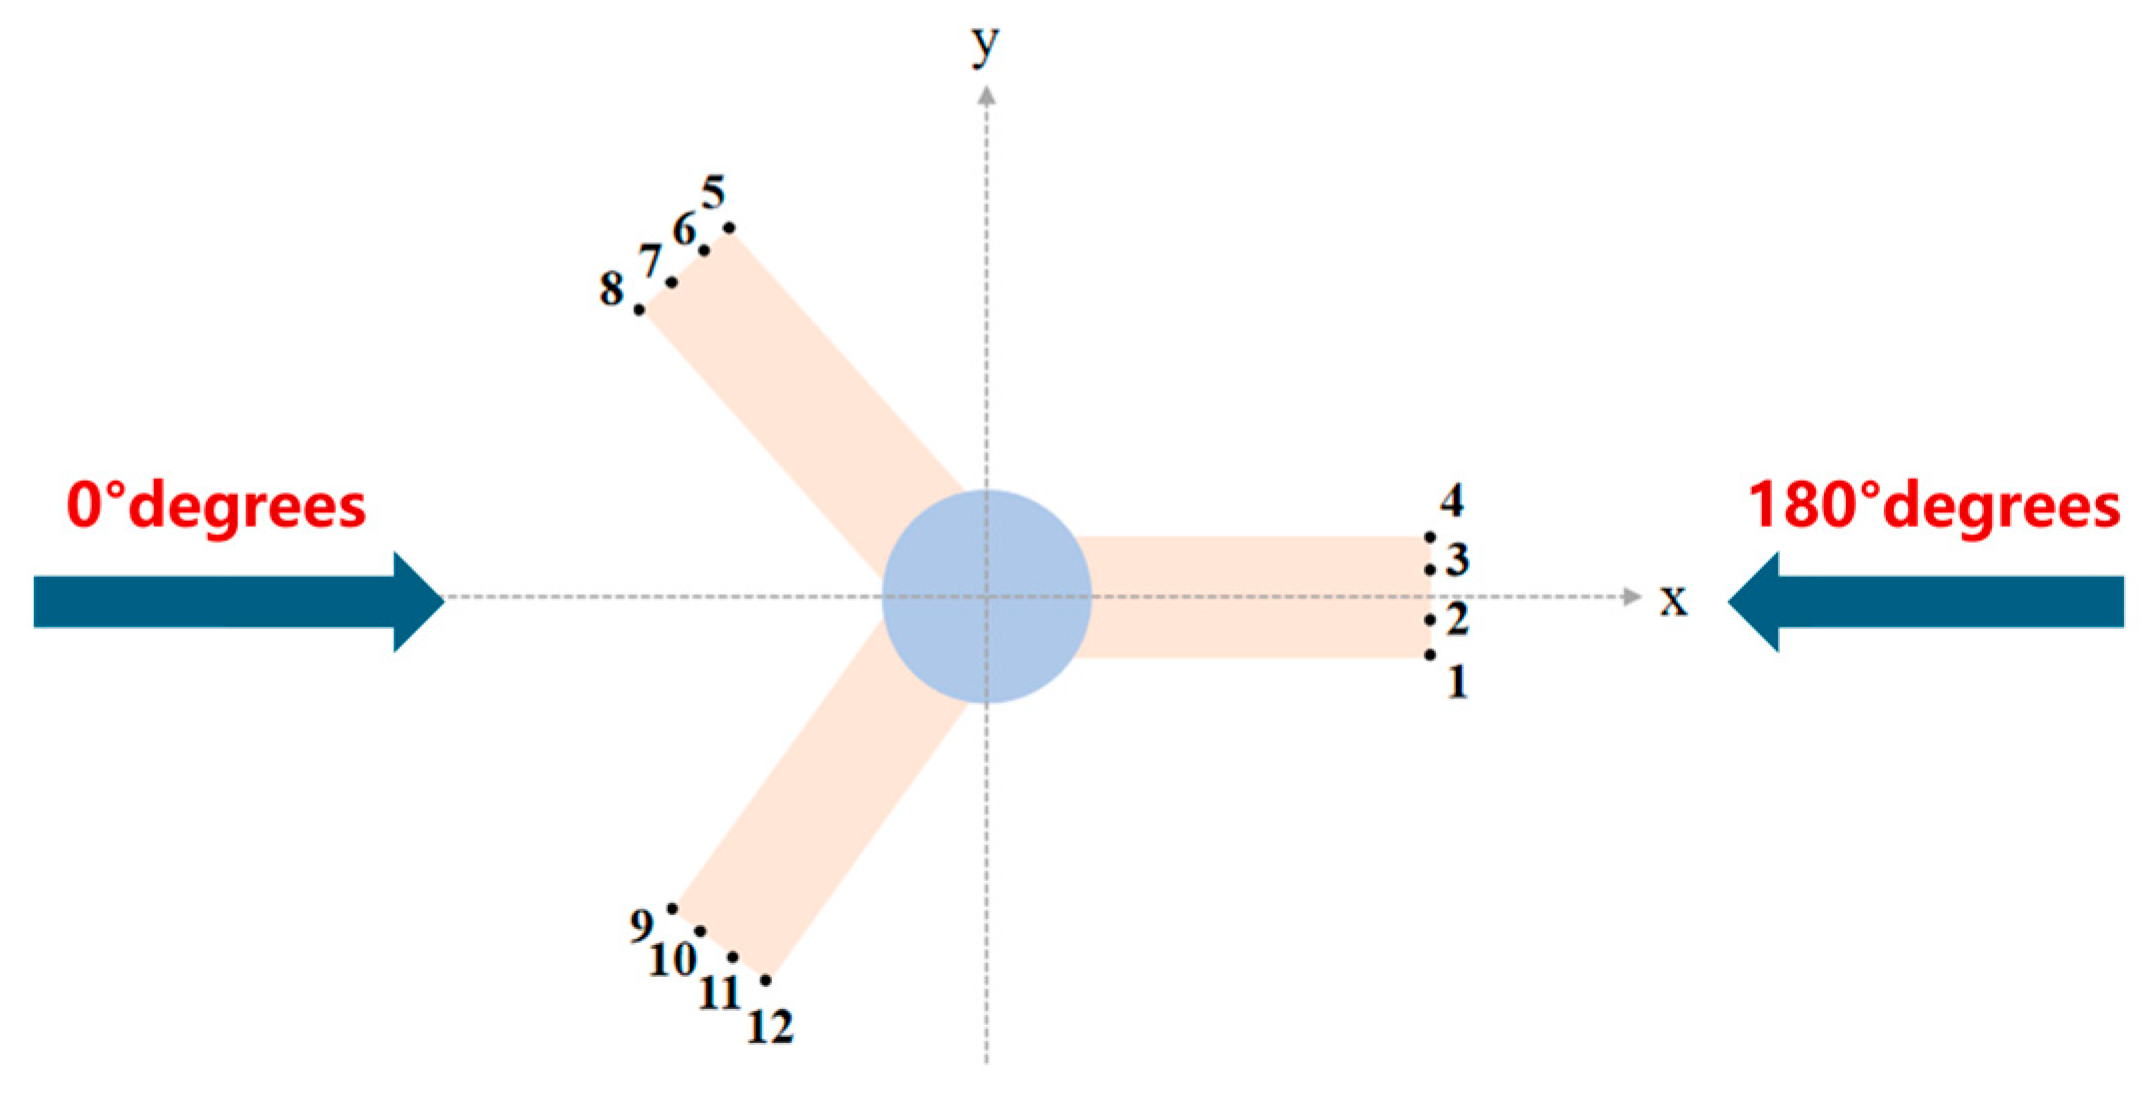
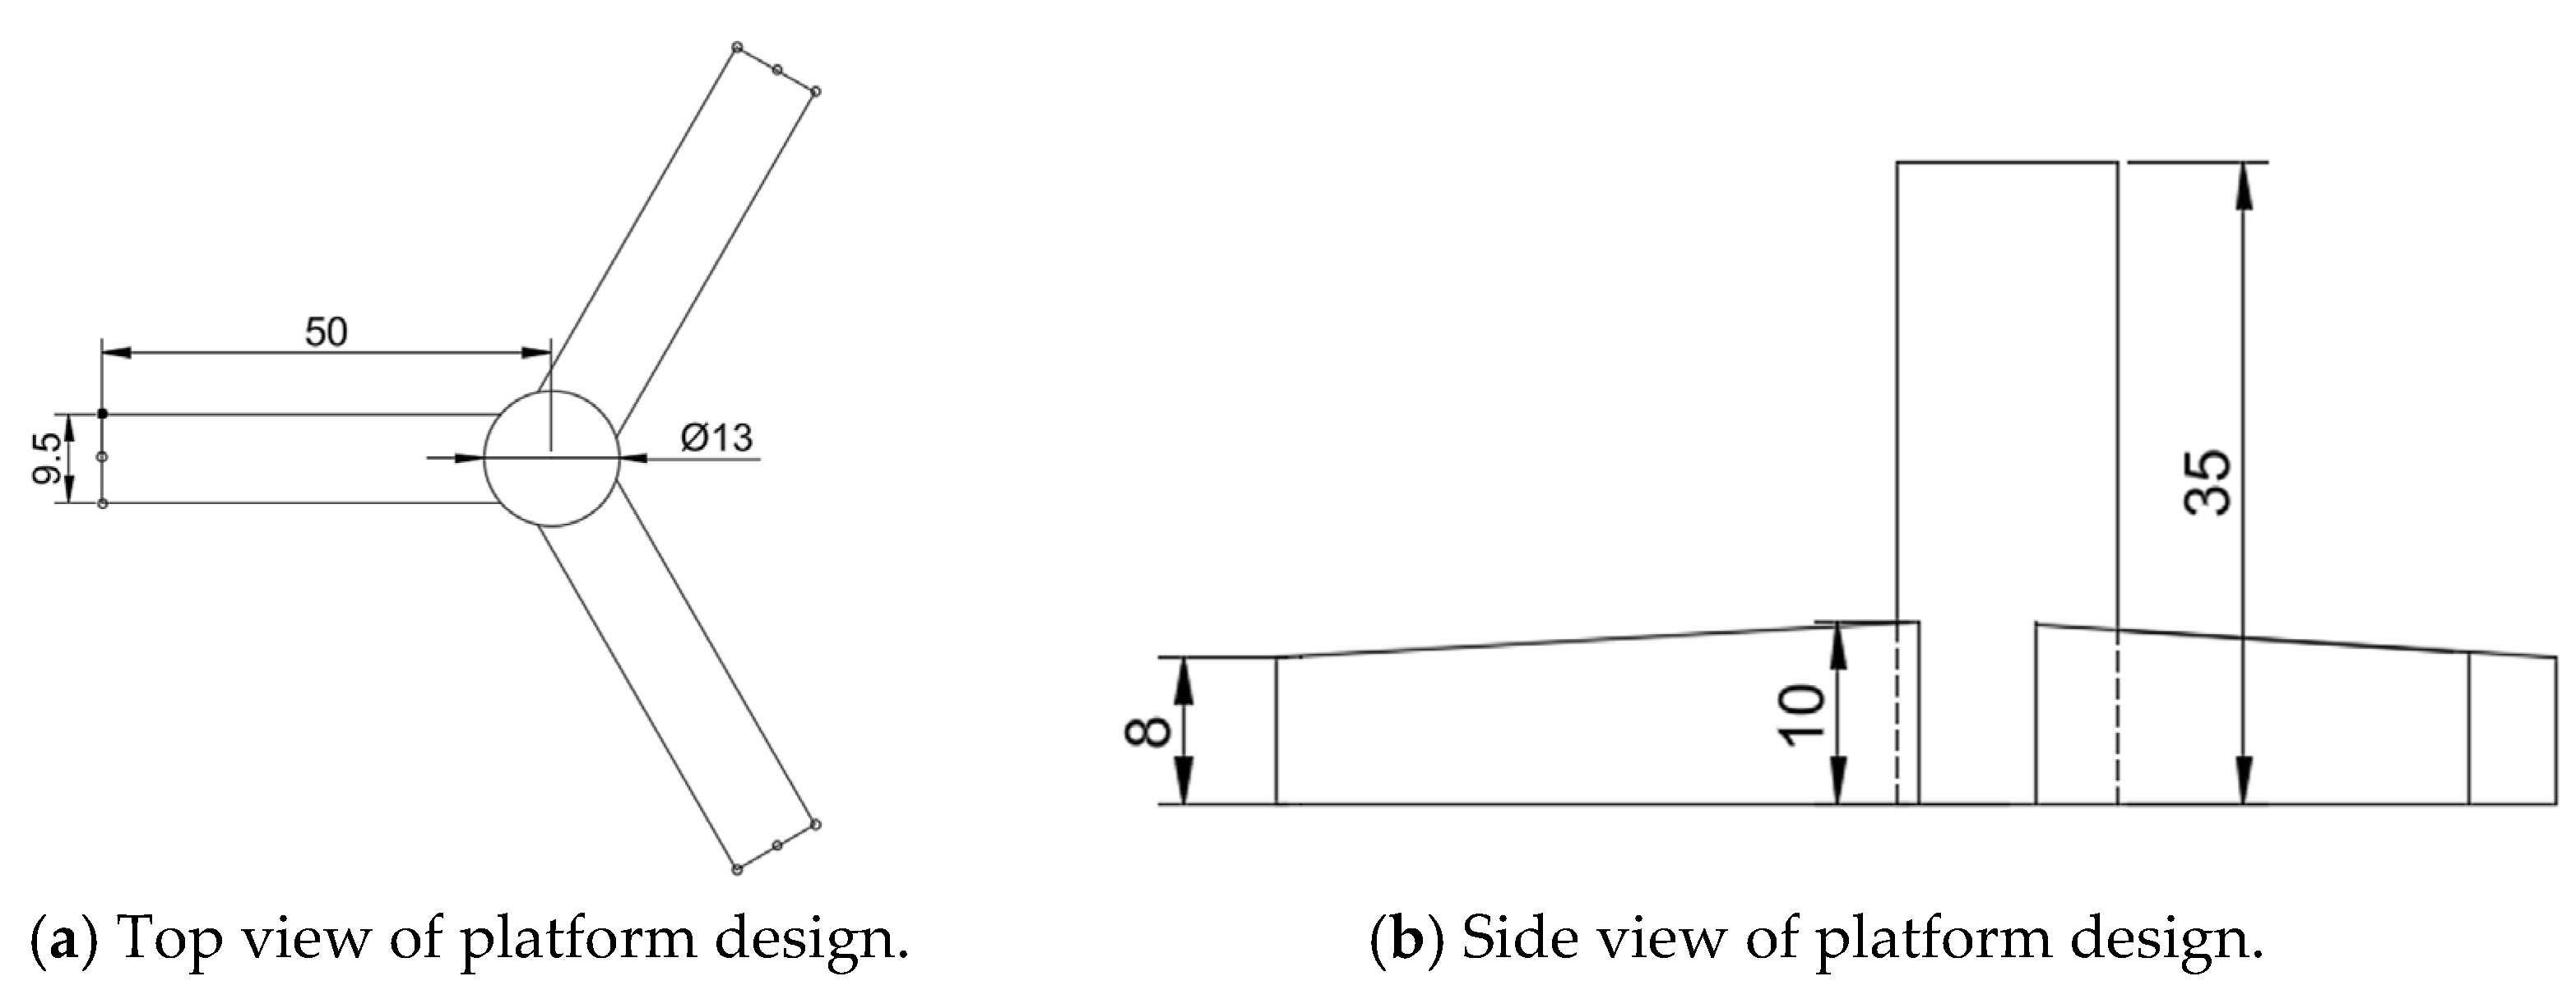
6], which demonstrated good global performance and stability. On this basis, a global sizing of the TLP hull is designed for supporting the IEA-22 MW wind turbine. The mooring system of the TLP FOWT consists of three groups of tendons with identical material properties. A comprehensive evaluation is conducted on the operational performance of the system matching the 22 MW wind turbine under extreme sea conditions. In the preliminary design, each group comprises 4 tendons, totaling 12 in all. The fairleads are positioned at the outermost part of the bottom of the three pontoons. The mooring layout of the platform is illustrated in
Figure 4, and the general design drawing of the floating platform is shown in
Figure 5Considering that the TLP FOWT operates at a water depth of 100 m, Xtreme steel wire is used for the tendons, and the mooring constraints are articulated at both upper and lower nodes. Meanwhile, the drag coefficient Cd is 1.6, and detailed information on the wire is presented in
Table 6.
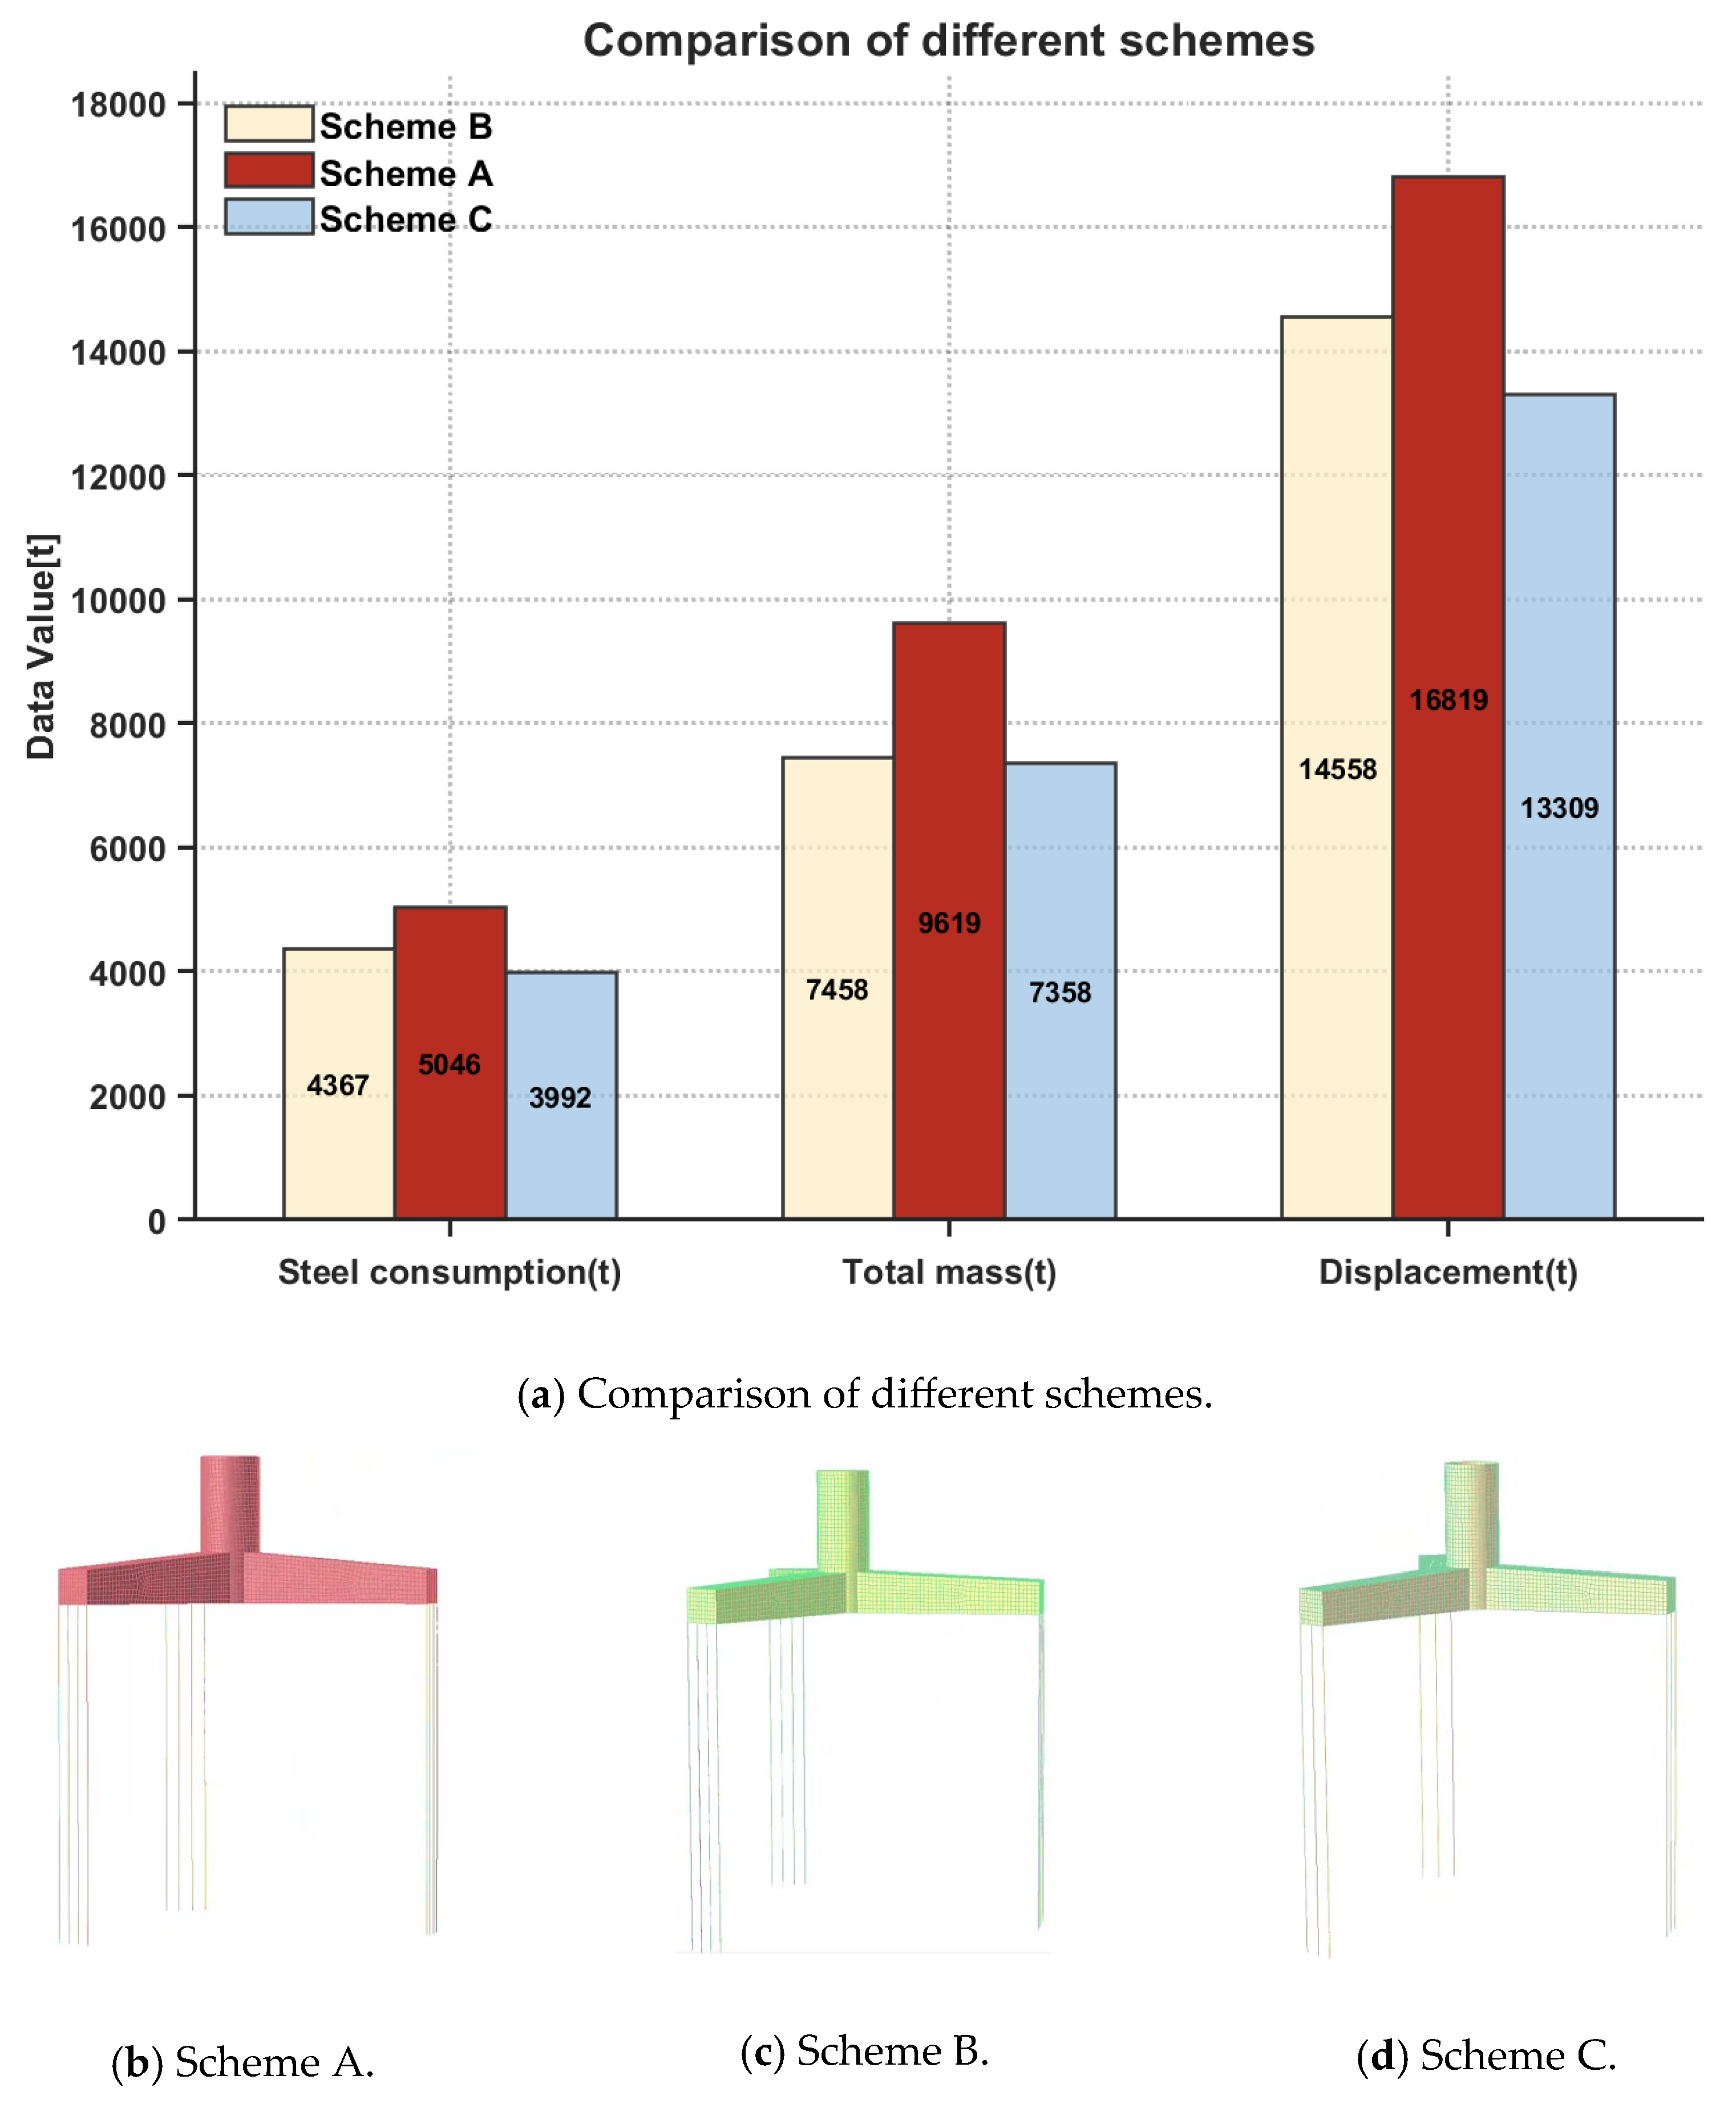
This study comprehensively considers design factors such as the mechanical properties of mooring lines, the weight of the platform and displacement, and proposes three schemes (A, B, and C) for the mooring system. The specific design parameters are presented in
Table 7. The study finds that scheme A adopts a ballast water configuration of nearly 2000 tons. Although it can meet the basic stability requirements, it will directly increase the steel consumption, thereby significantly raising the initial construction cost of the platform, making it difficult to reflect the economic advantages of the TLP foundation in engineering applications. The comparison diagram of the floating foundation steel consumption, total mass, displacement and mooring design of the three schemes (A, B, and C) is illustrated in
Figure 6. It can be clearly seen that the comprehensive cost–performance ratio of scheme A can hardly meet the economic indicators required for TLP selection, so this scheme will be excluded from the scope of subsequent analysis. The response analysis in this paper will focus on schemes B and C for calculation, verify the operational performance differences between the two schemes under the same sea conditions by comparing with relevant standards, and finally determine the optimal floating foundation design scheme.
3.2. OpenFAST Modeling, ULS Checks for B and C, and Final Selection of Option B
This section verifies the mechanical properties and motion response of the FOWT under different sea conditions. It verifies the dynamic responses of schemes B and C under wind, wave–current coupling, and wind–wave–current coupling conditions, with the upper wind turbine and tower adopting the IEA 22 MW wind turbine. In line with the standard requirements, 5 random seeds are selected for each design sea area. During the subsequent verification process, the extreme values of platform motion response and mooring tension are further checked to meet the standard.
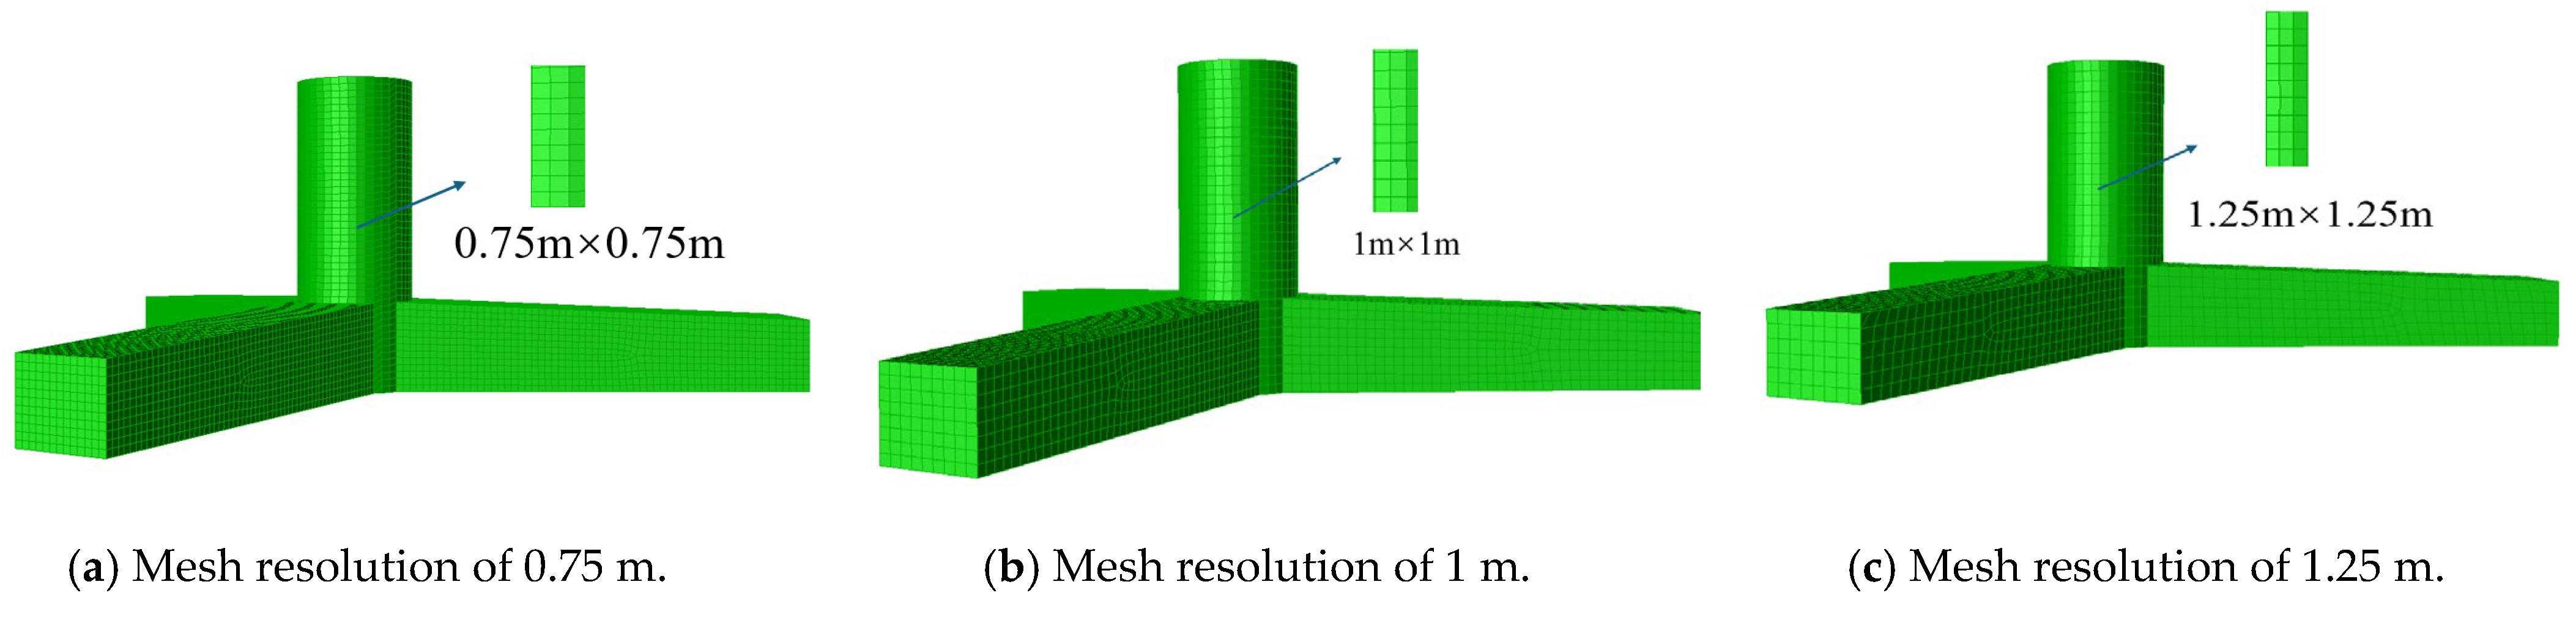
To verify the sensitivity of numerical results to discretization, a grid independence test is performed in GeniE using characteristic grid sizes of 0.75, 1.00 and 1.25 m, with consistent physical models, boundary conditions and solution control parameters, and the schematic diagram is shown in
Figure 7. The response amplitude operator (RAO) is taken as the criterion: the amplitude and curves of RAOs for each degree of freedom under different grids are compared within the same incident wave direction and frequency range. The results show that the RAO curves tend to be stable as the grid is refined from 1.25 m to 1.00 m and further to 0.75 m. The differences in key resonance frequencies and peak responses remain within an acceptable range, indicating that the numerical results are insensitive to grid size. Therefore, a grid size of 1 m is adopted in this paper to ensure the accuracy of the calculation results while taking computational efficiency into account.
Meanwhile, this section conducts hydrodynamic performance analysis of the TLP floating foundation using the HydroD. To obtain the motion characteristics of the platform in still water—including key parameters such as natural frequency and damping coefficient—RAO and free decay numerical analysis is carried out. This calculation not only verifies the accuracy of the numerical simulation model and clarifies the platform’s hydrodynamic characteristics but also provides reliable basic parameter support for subsequent platform motion performance evaluation and operational safety verification.
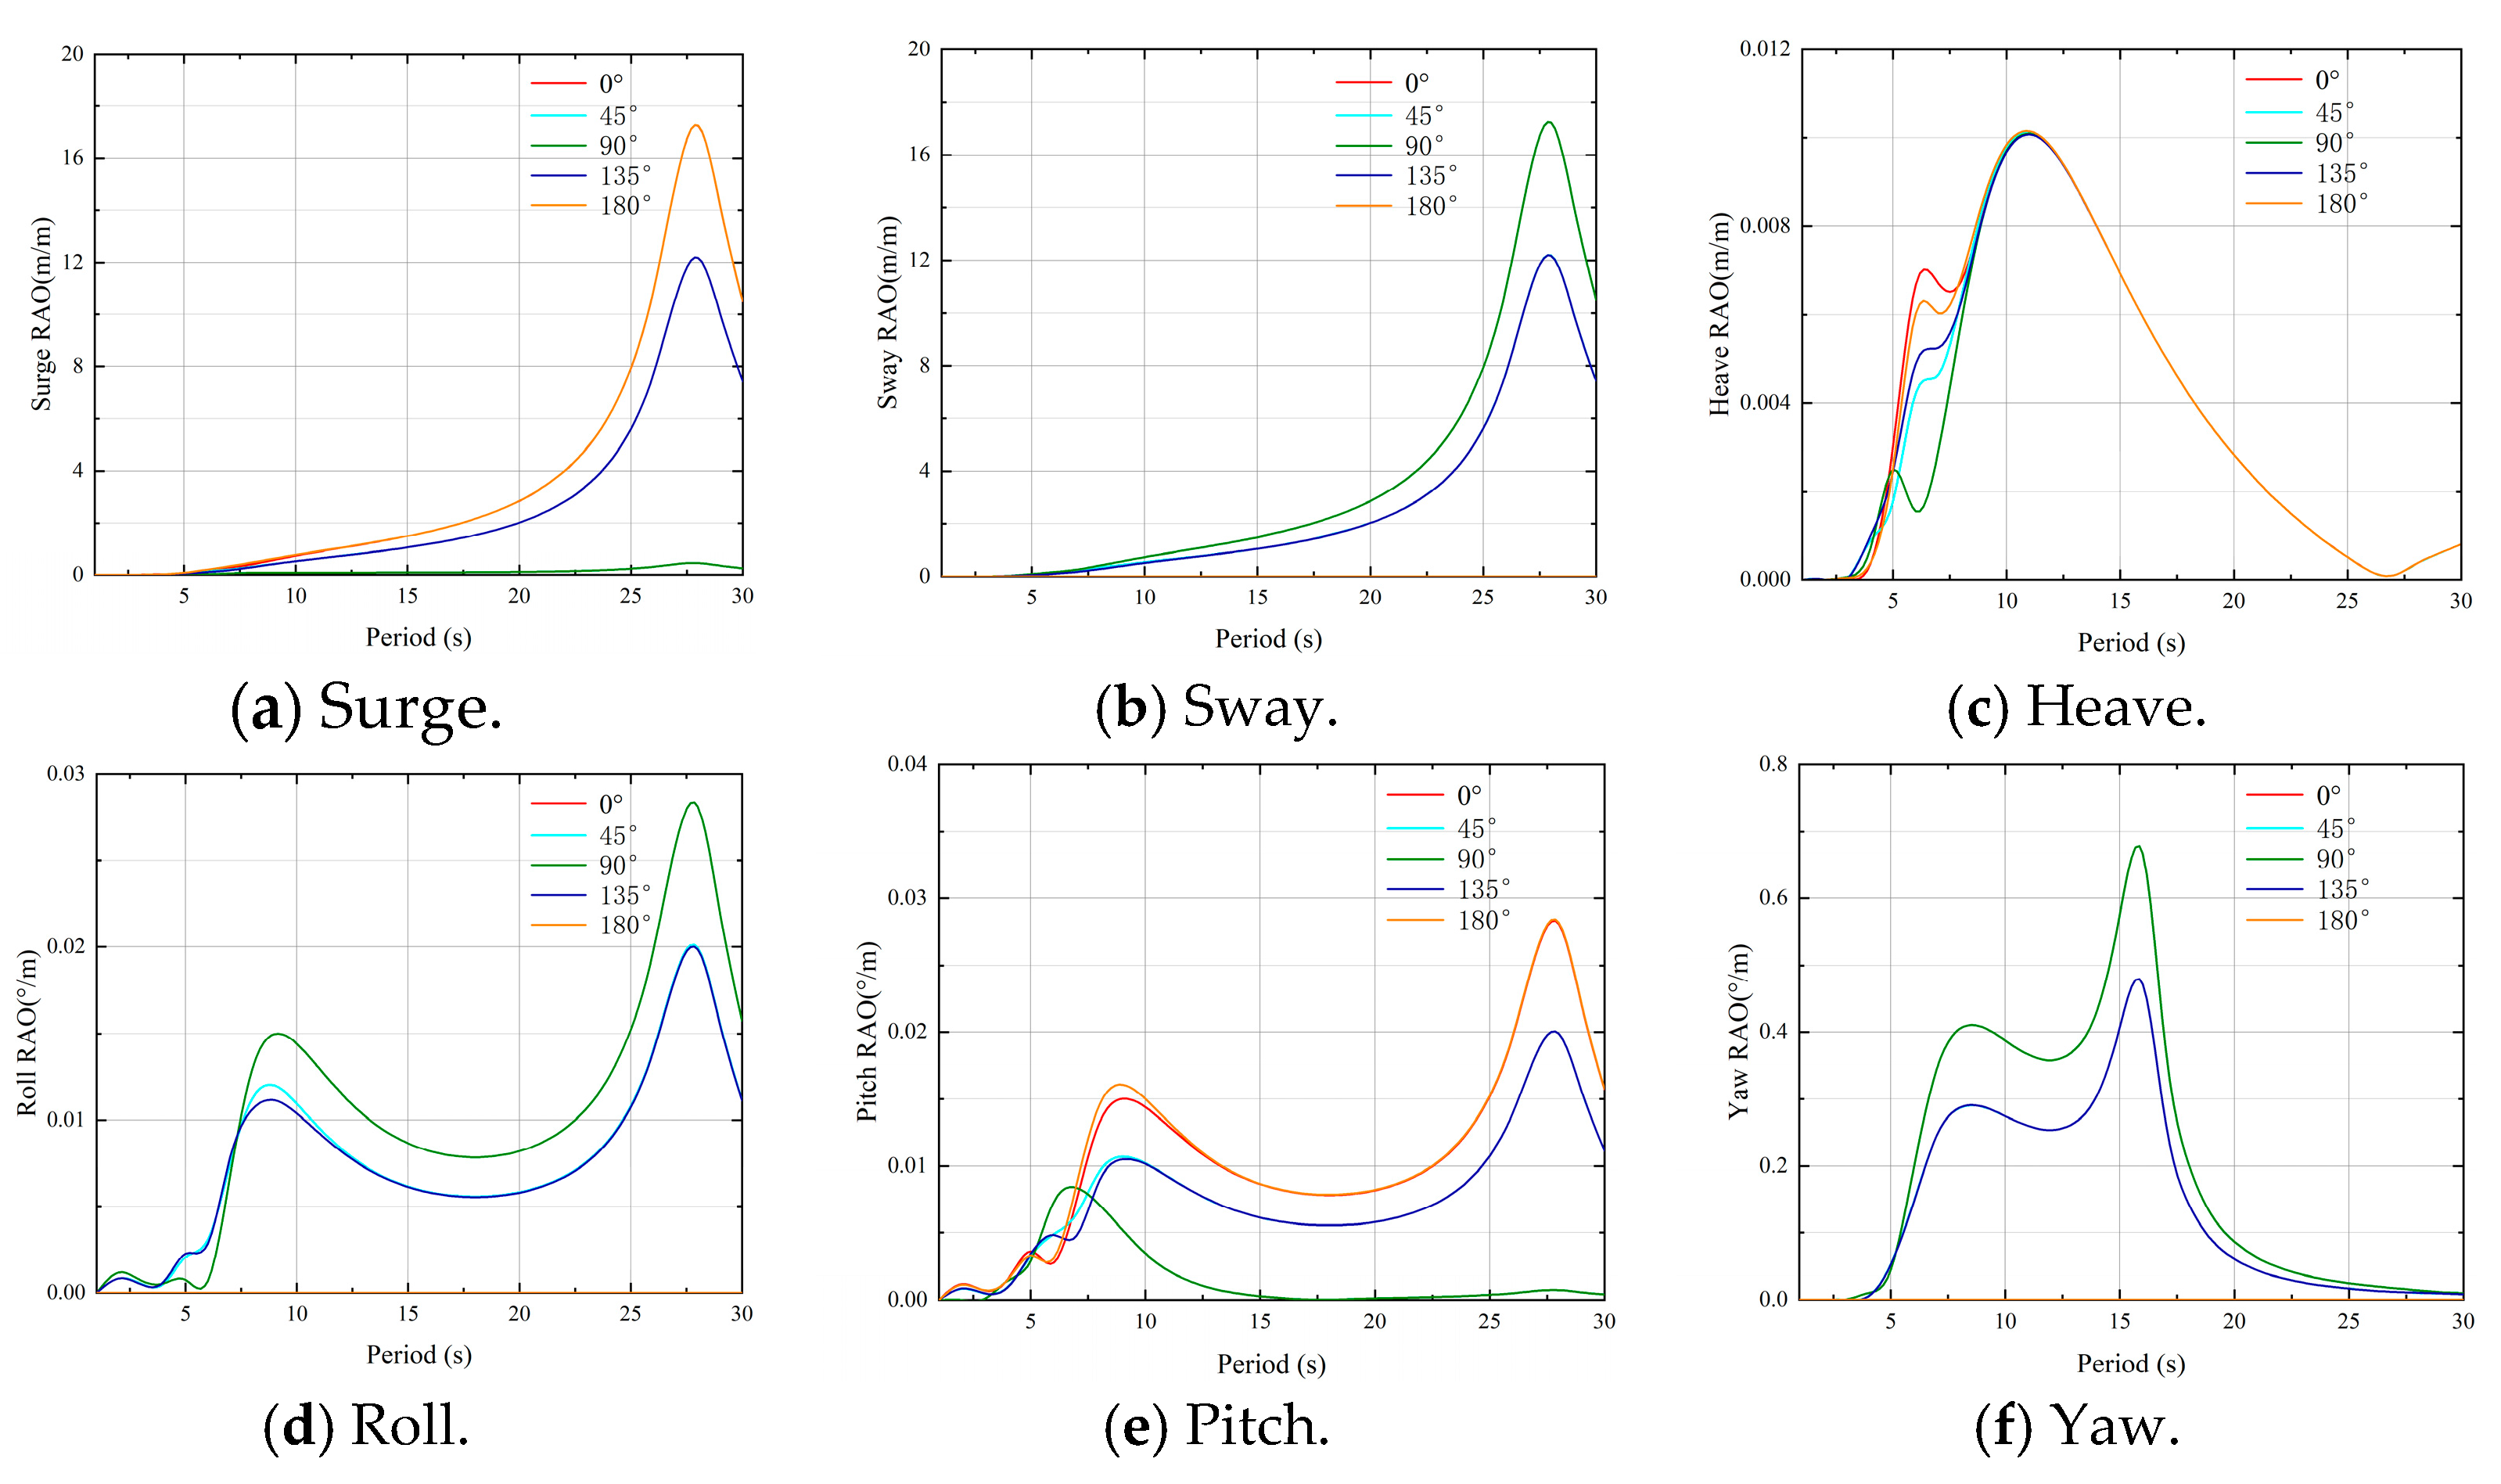
Figure 8 shows the 6-DOF RAO curves of the platform under wave directions of 0°, 45°, 90°, 135°, and 180°. Only the RAOs of scheme B are presented below. It can be seen that the peak values and trends of the surge and sway RAO curves are similar, reaching peaks at a period of approximately 27.5 s. The heave RAO peaks at around 12 s, and different wave directions have little influence on its amplitude. In addition, the roll and yaw RAO curves are nearly zero at 0° and 180°, while the curves at other angles reach maxima at 7.5 s and 27.5 s, respectively. The pitch curves at 0° and 180° almost coincide, with peaks at approximately 7.5 s and 16 s, and the peak at 16 s is larger than that at 7.5 s.
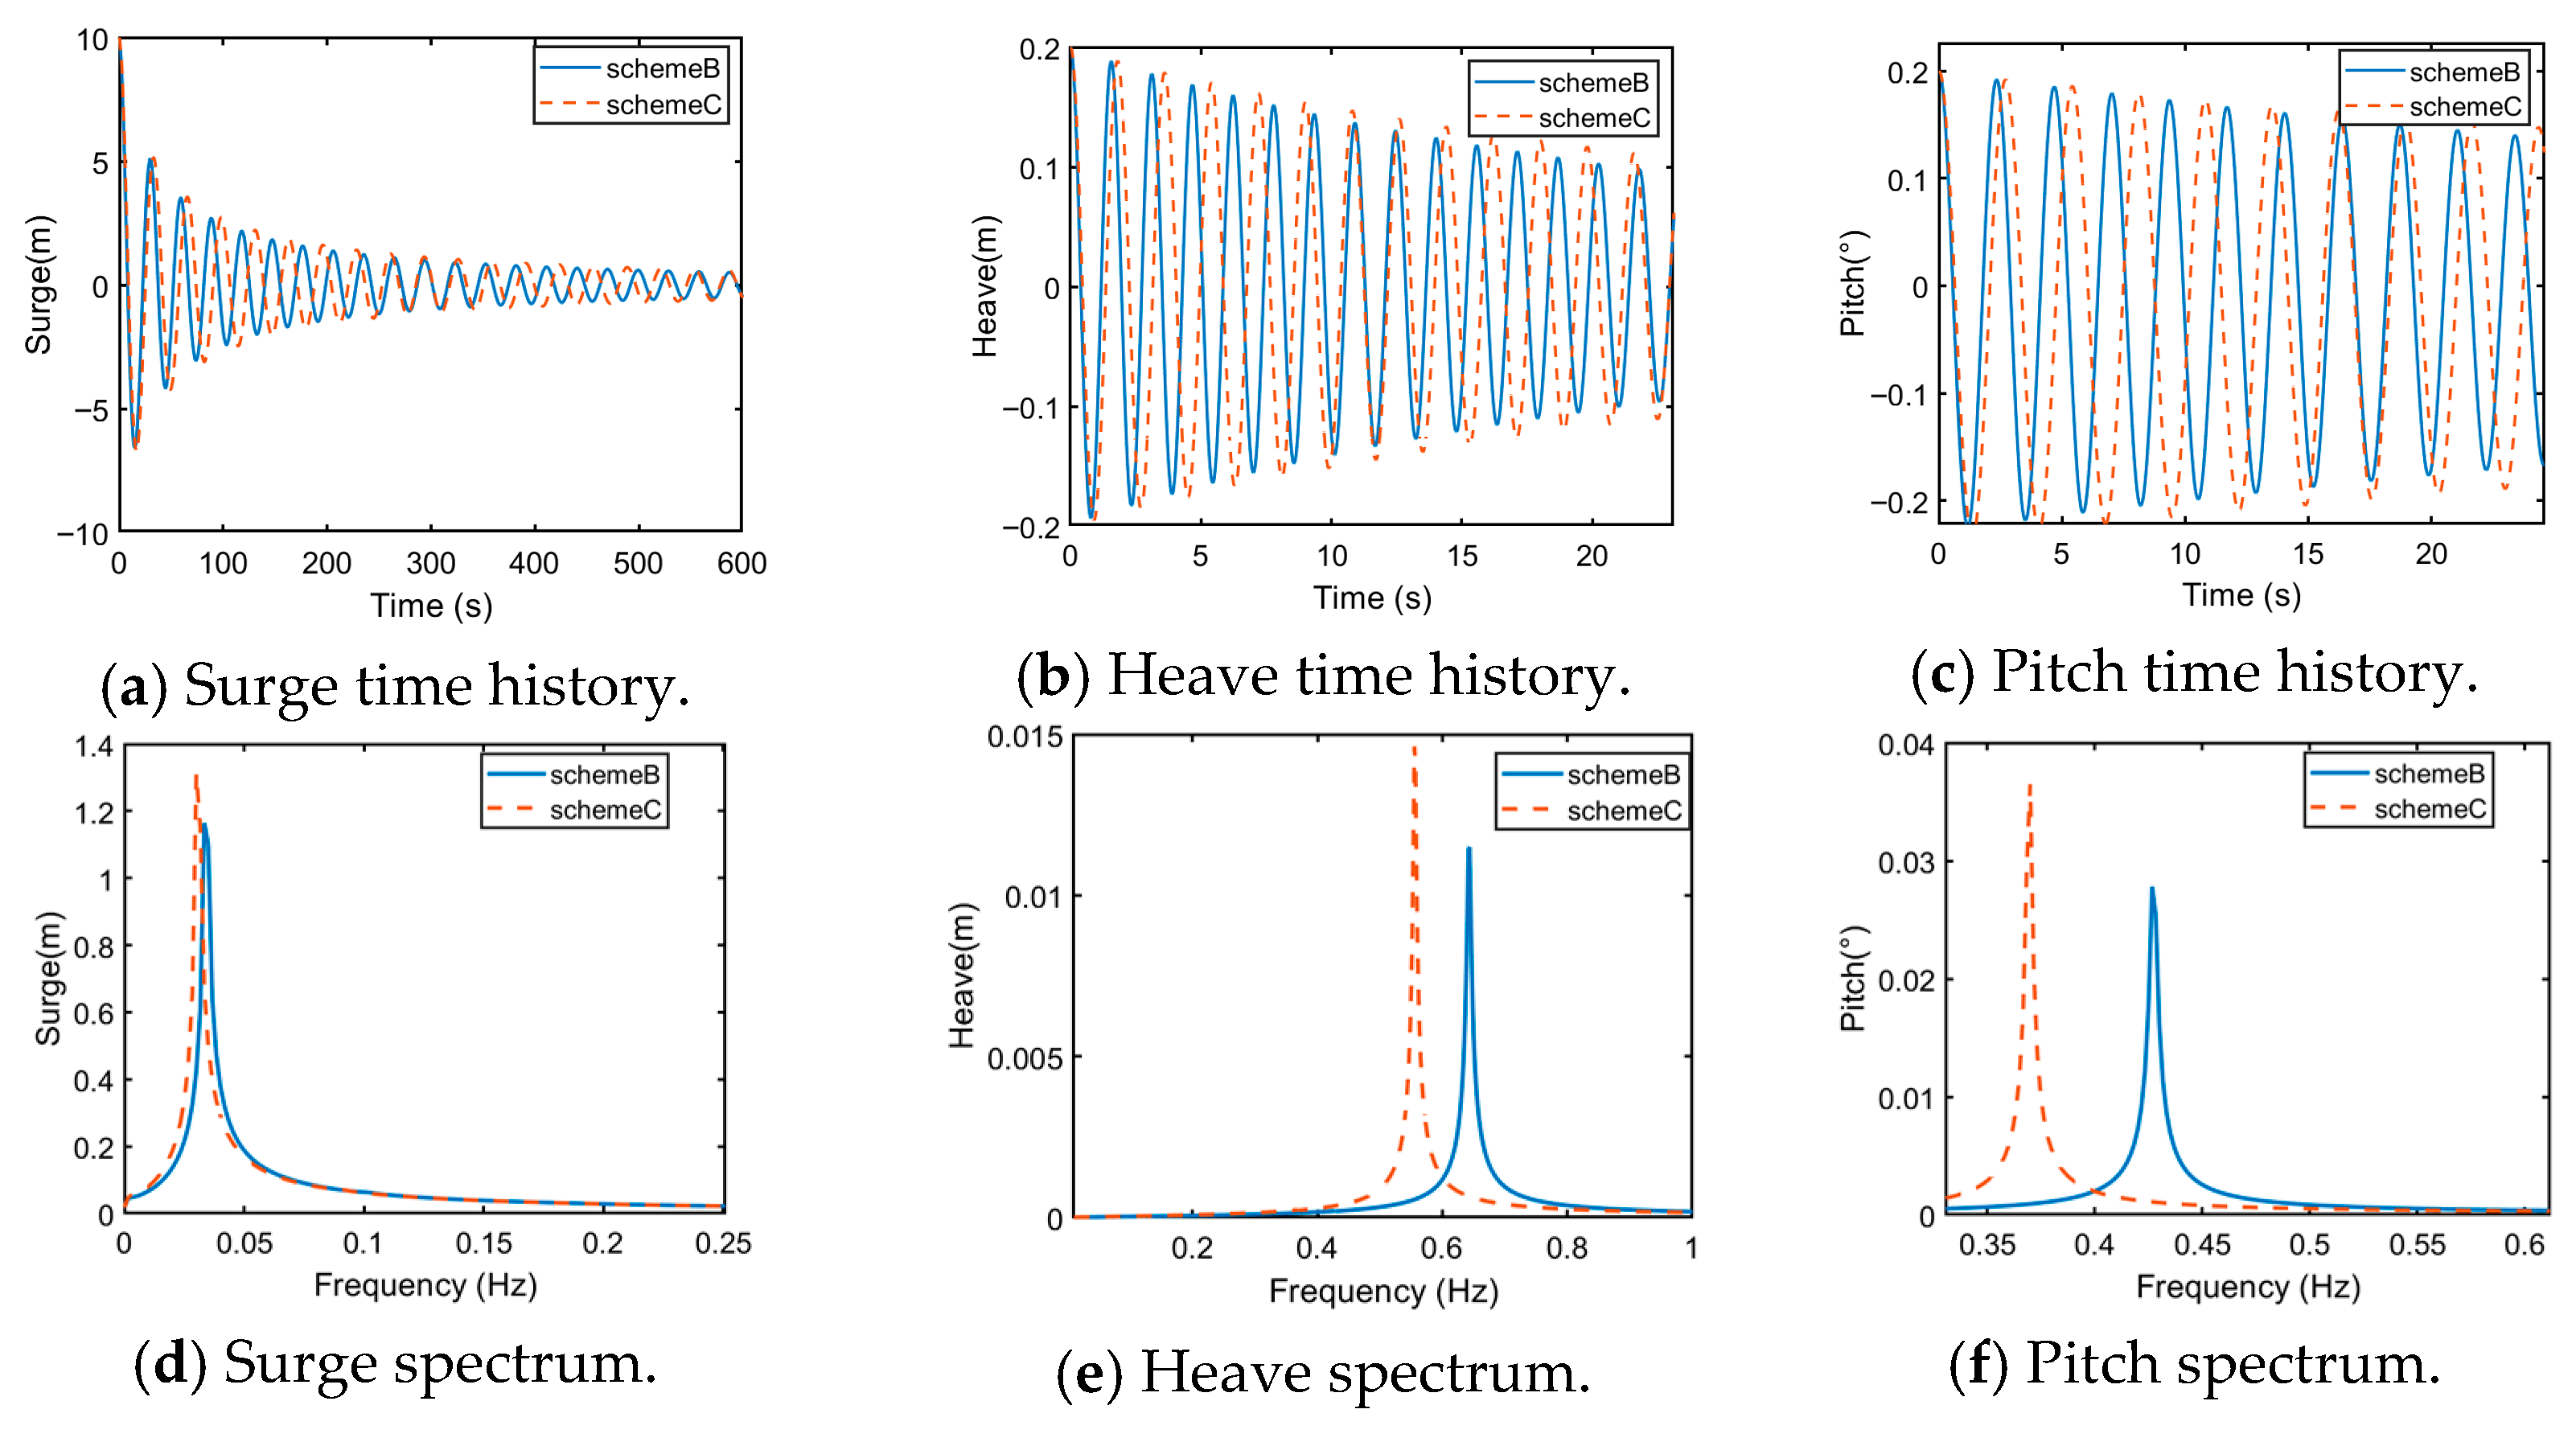
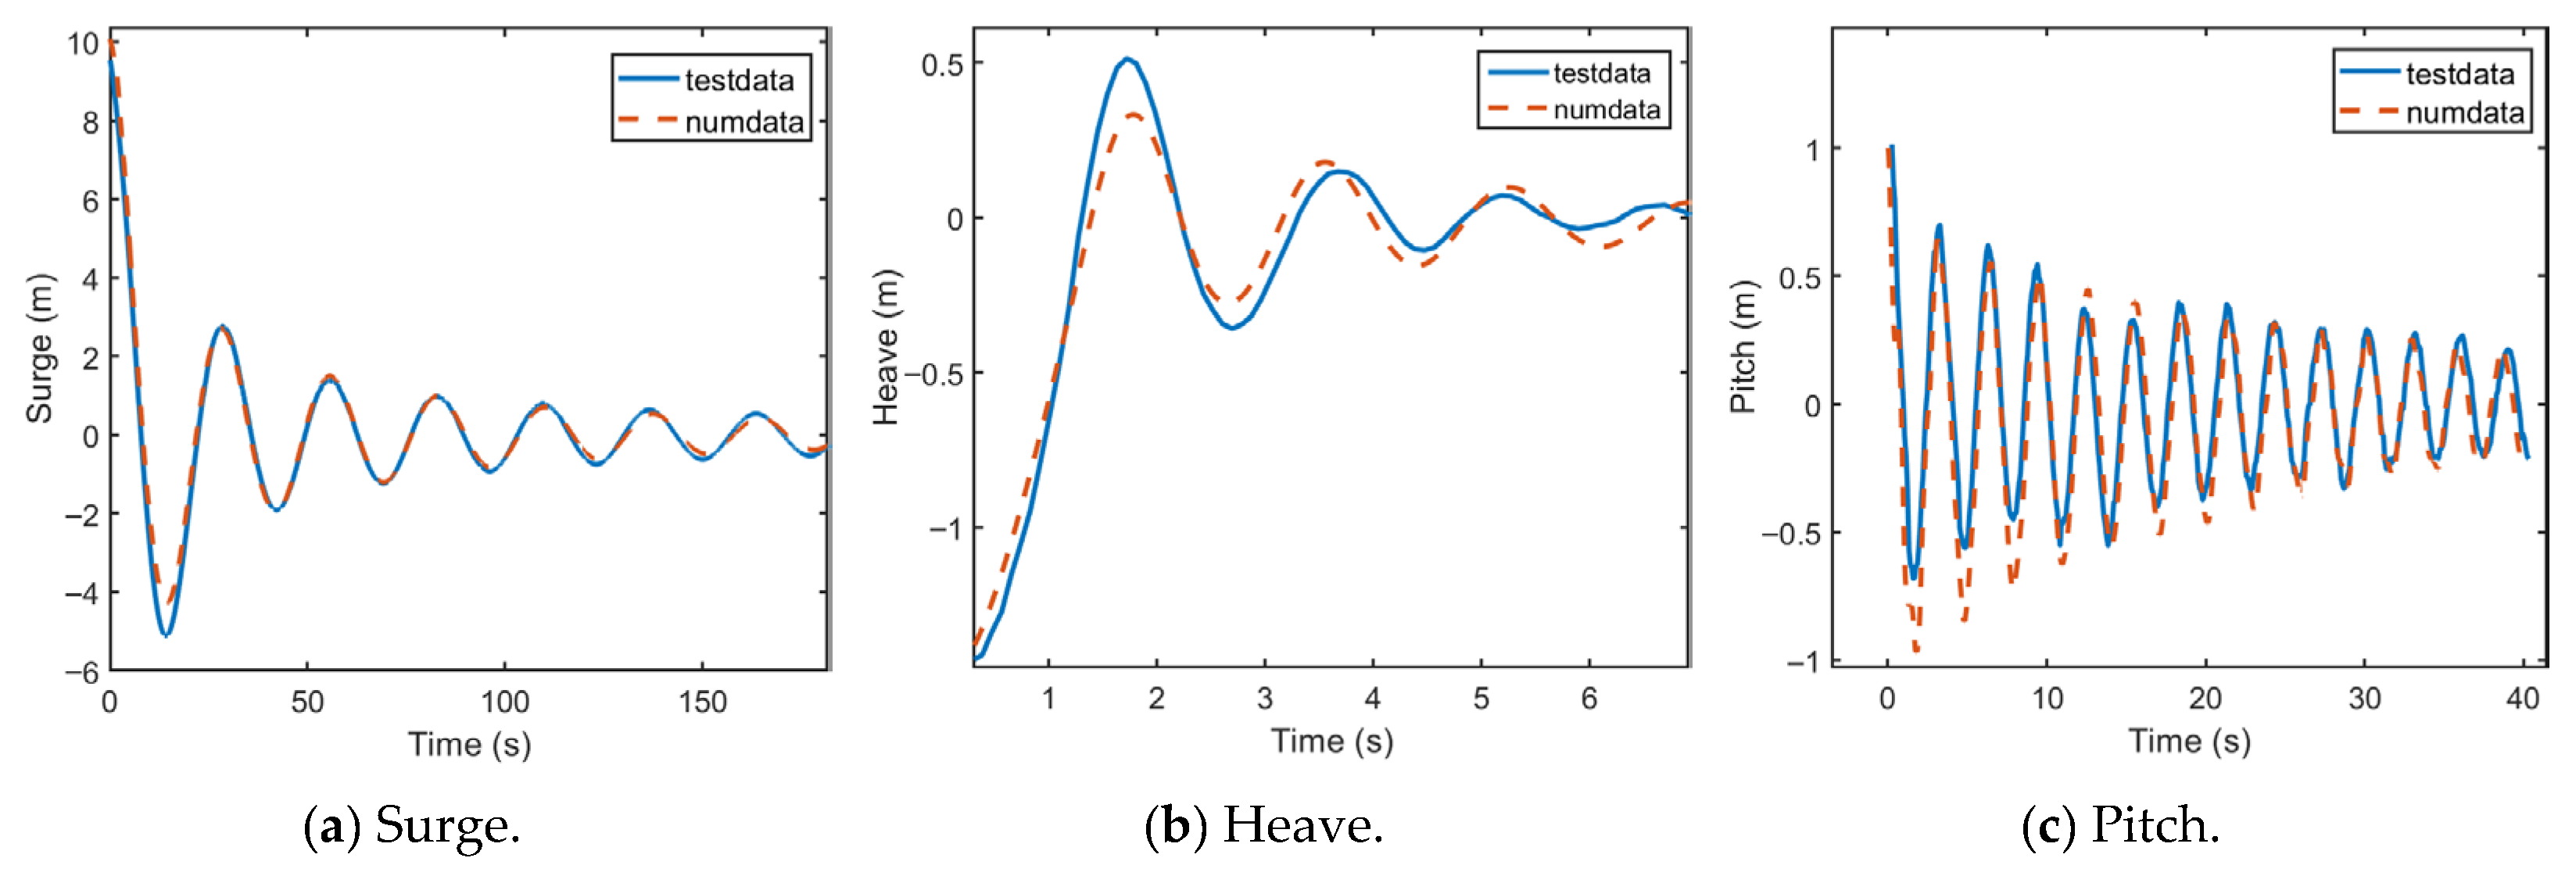
Figure 9 illustrates the free decay characteristics of schemes B and C in the surge, heave, and pitch degrees of freedom, and the free decay period of schemes B and C in six DOF is presented in
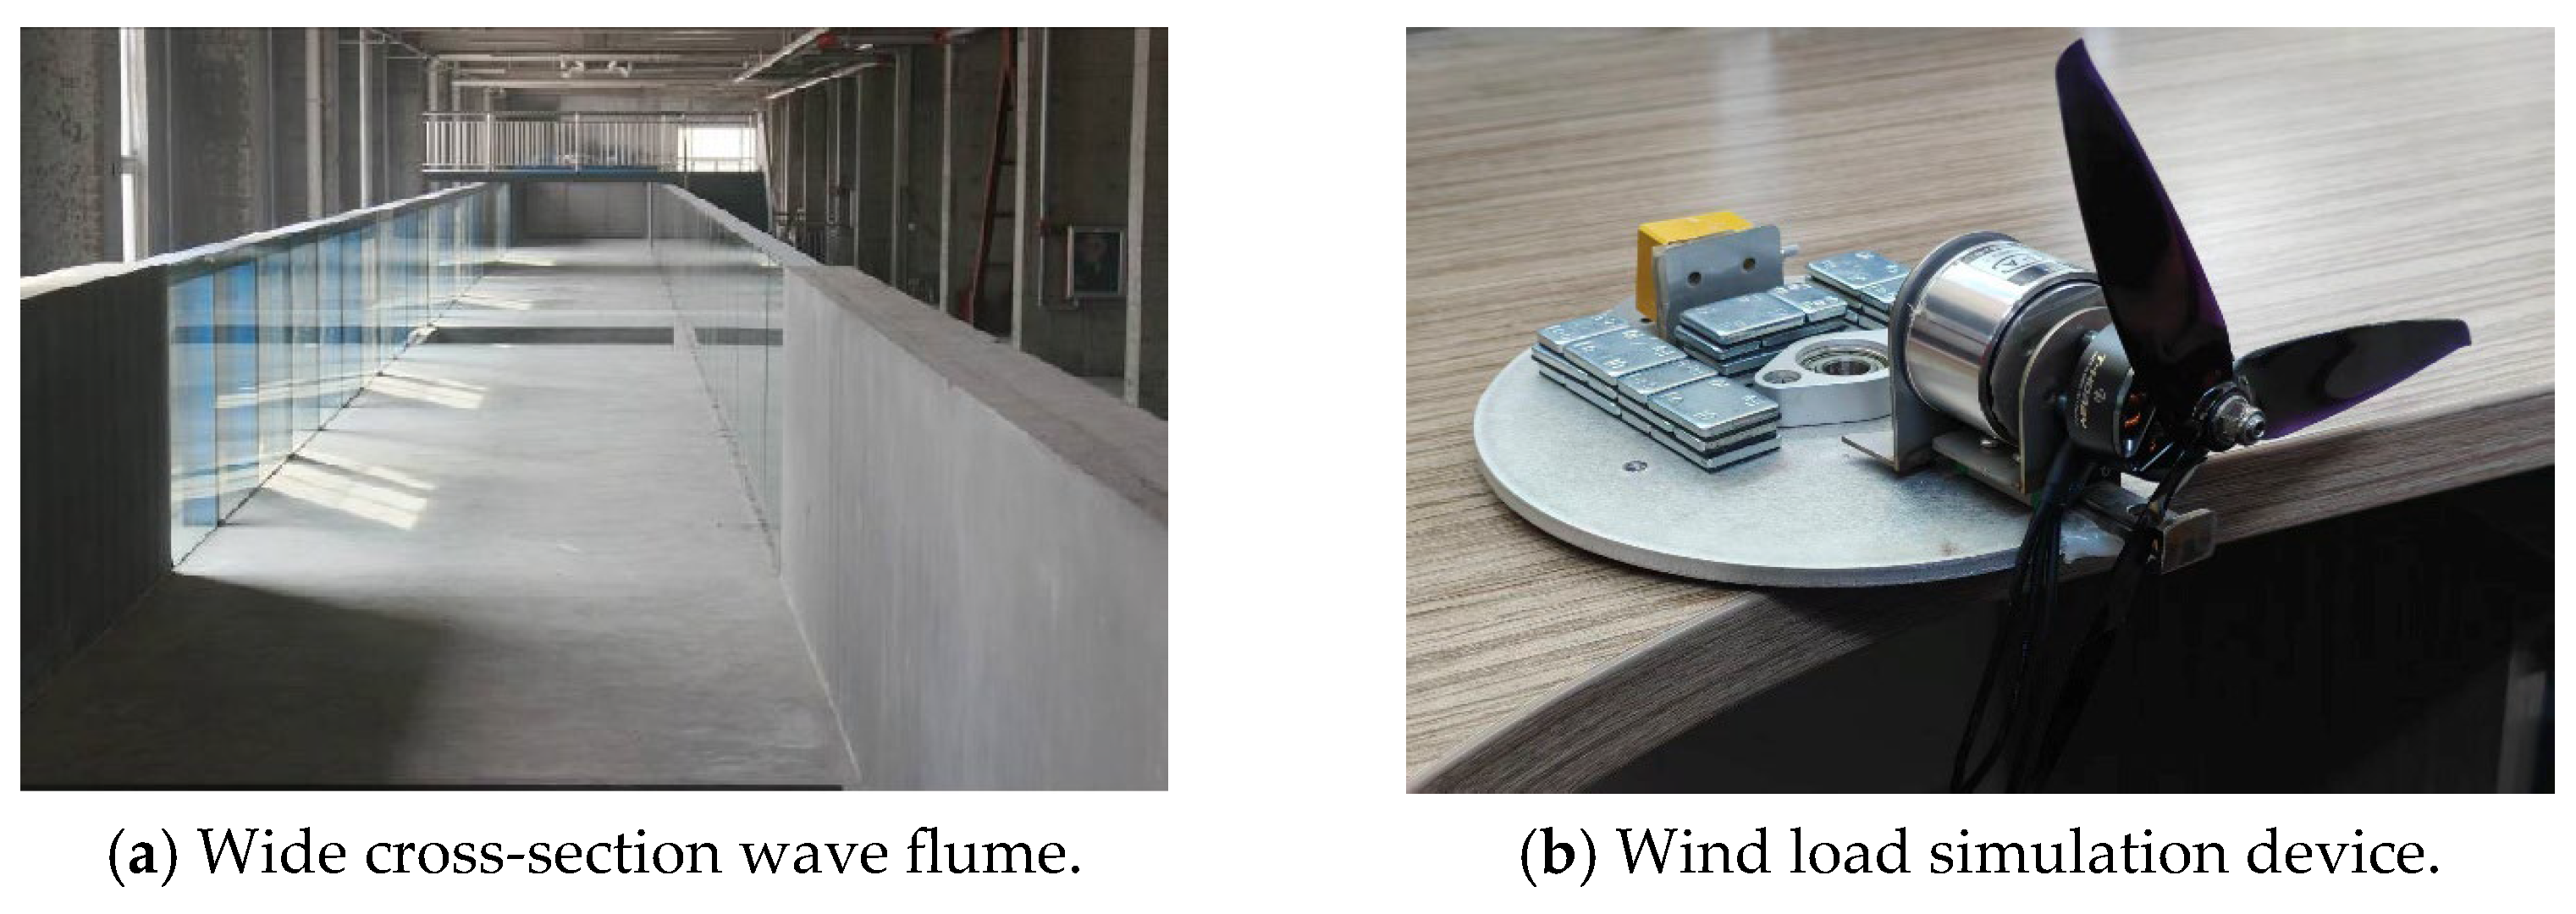
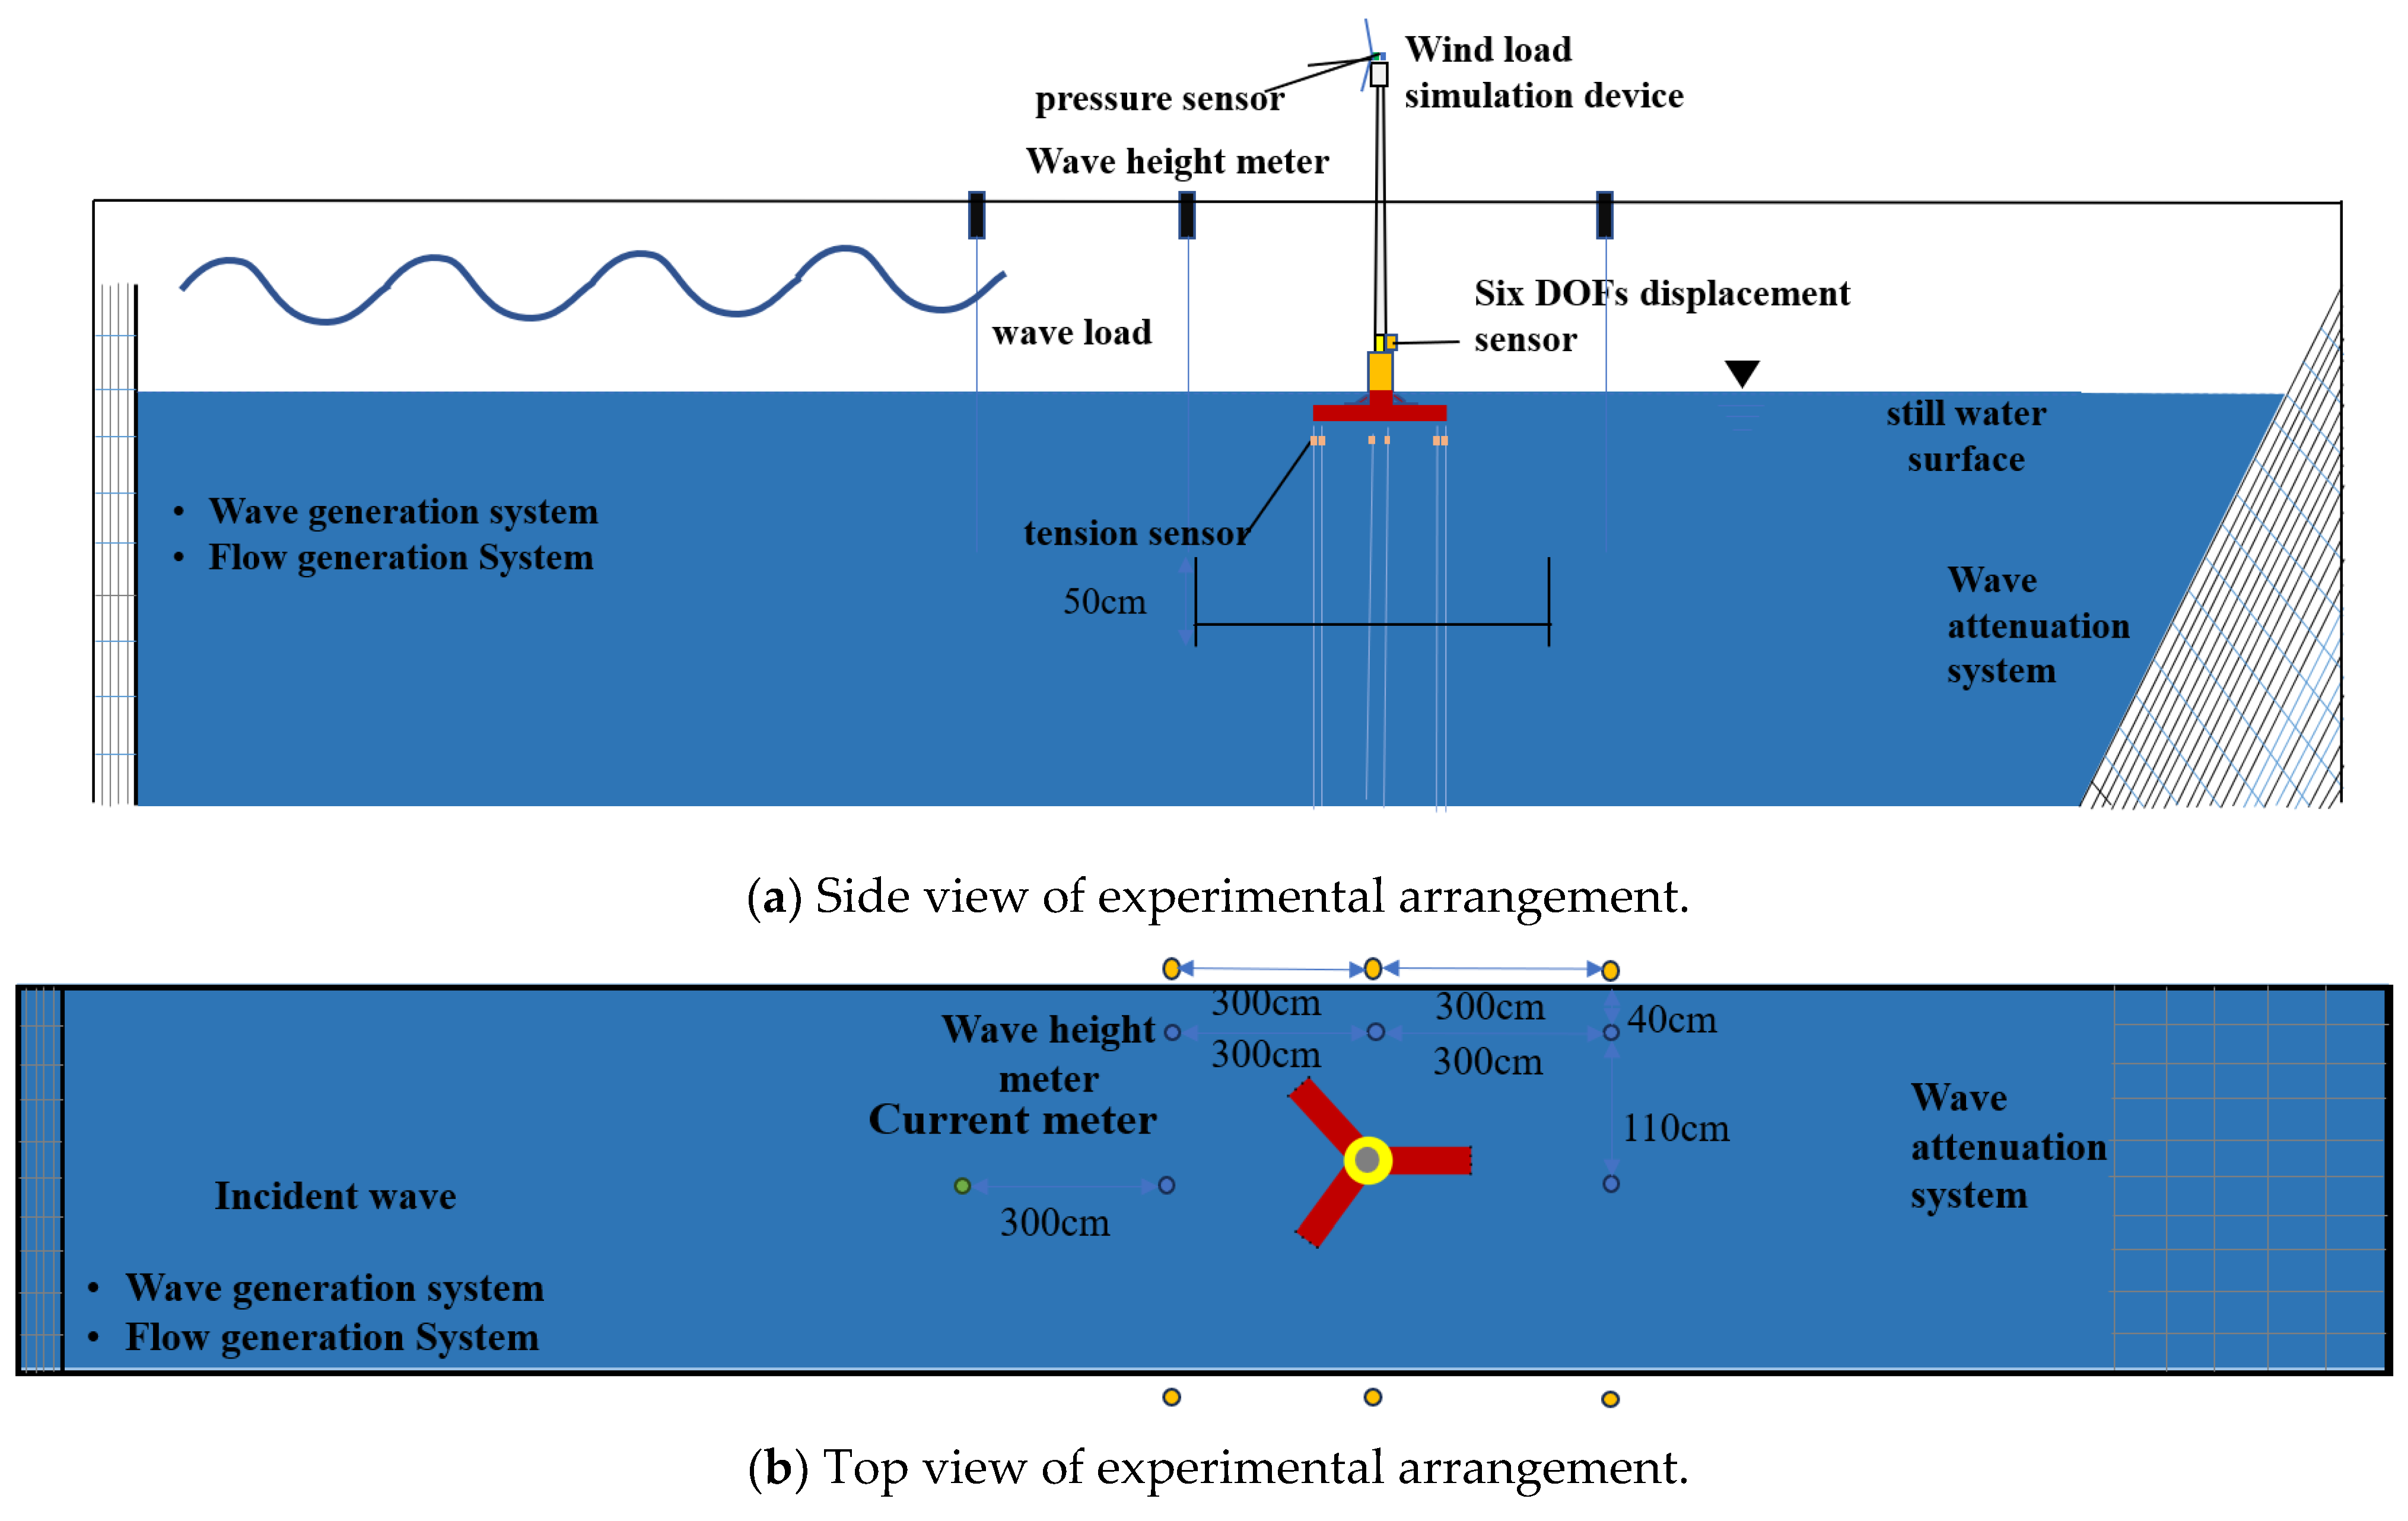
Table 8. It can be seen from the comparison that due to the increase in the number of mooring tendons, the overall natural period of scheme B is shorter than that of scheme C, indicating that scheme C has a more flexible structural dynamic characteristic. Both schemes have relatively long natural periods in the surge and sway directions, while the roll and pitch periods are relatively small, and they are more easily excited by waves. Once excited, the platform will exhibit obvious frequency coupling and resonance amplification trends. Therefore, subsequent focus should be placed on verifying the coupled response characteristics between wave loads and the pitch-roll motion of the platform. Nevertheless, its coupling characteristics may be affected by aerodynamic damping and viscous damping. Thus, to better describe the coupled response characteristics, scaled model tests were carried out in the follow-up study for verification.
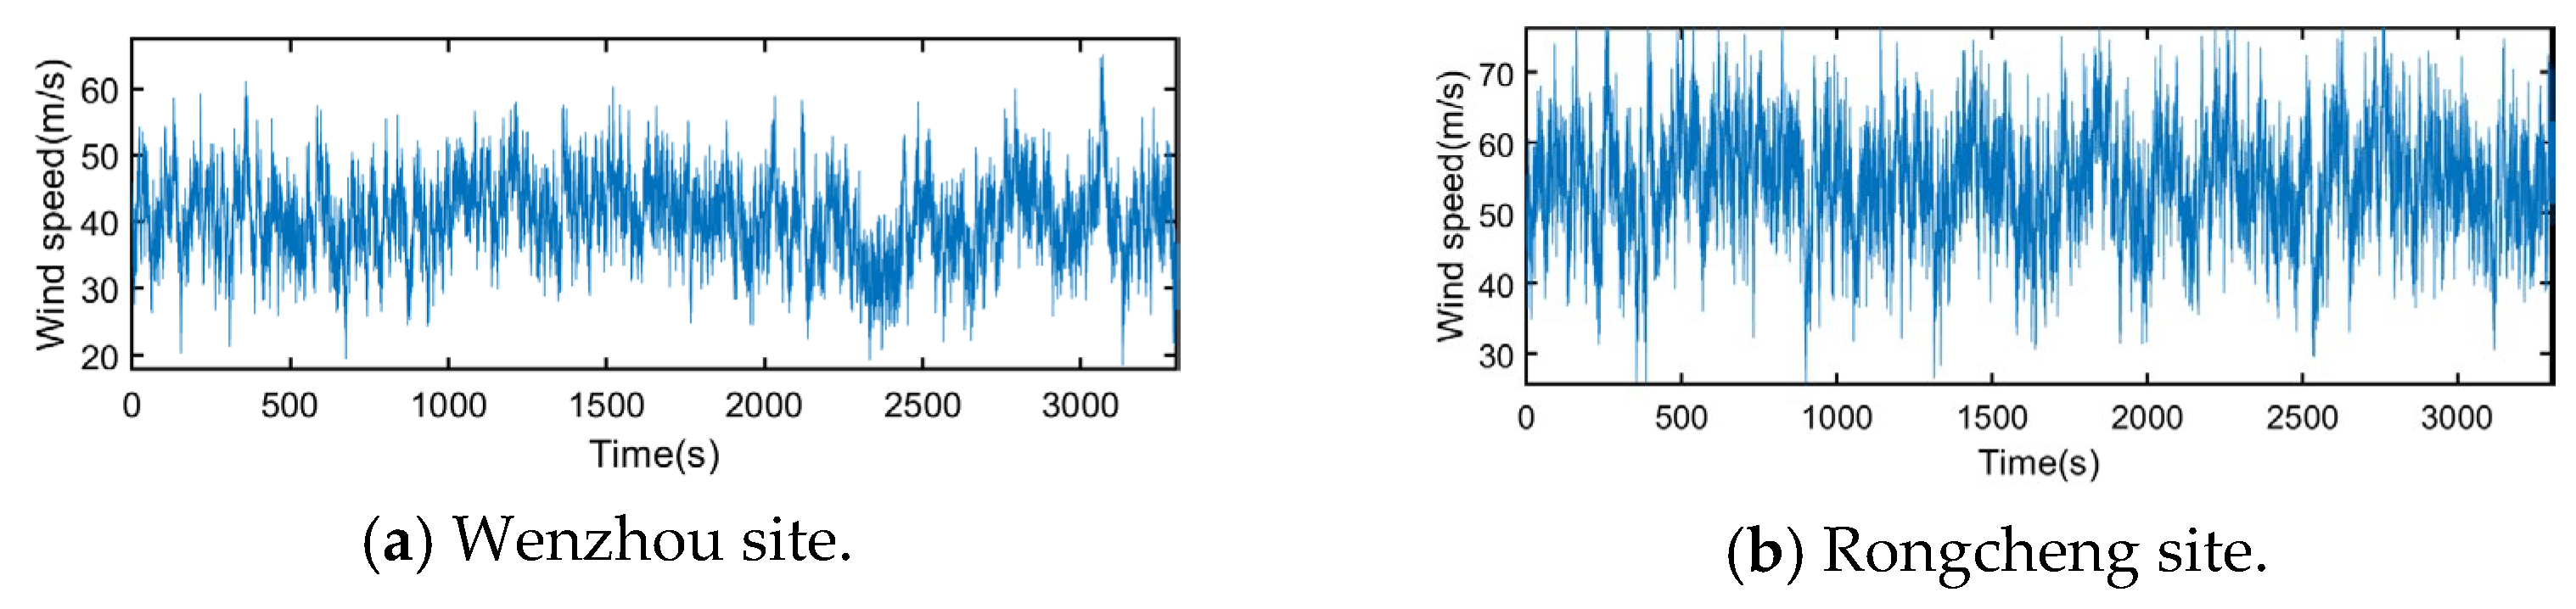
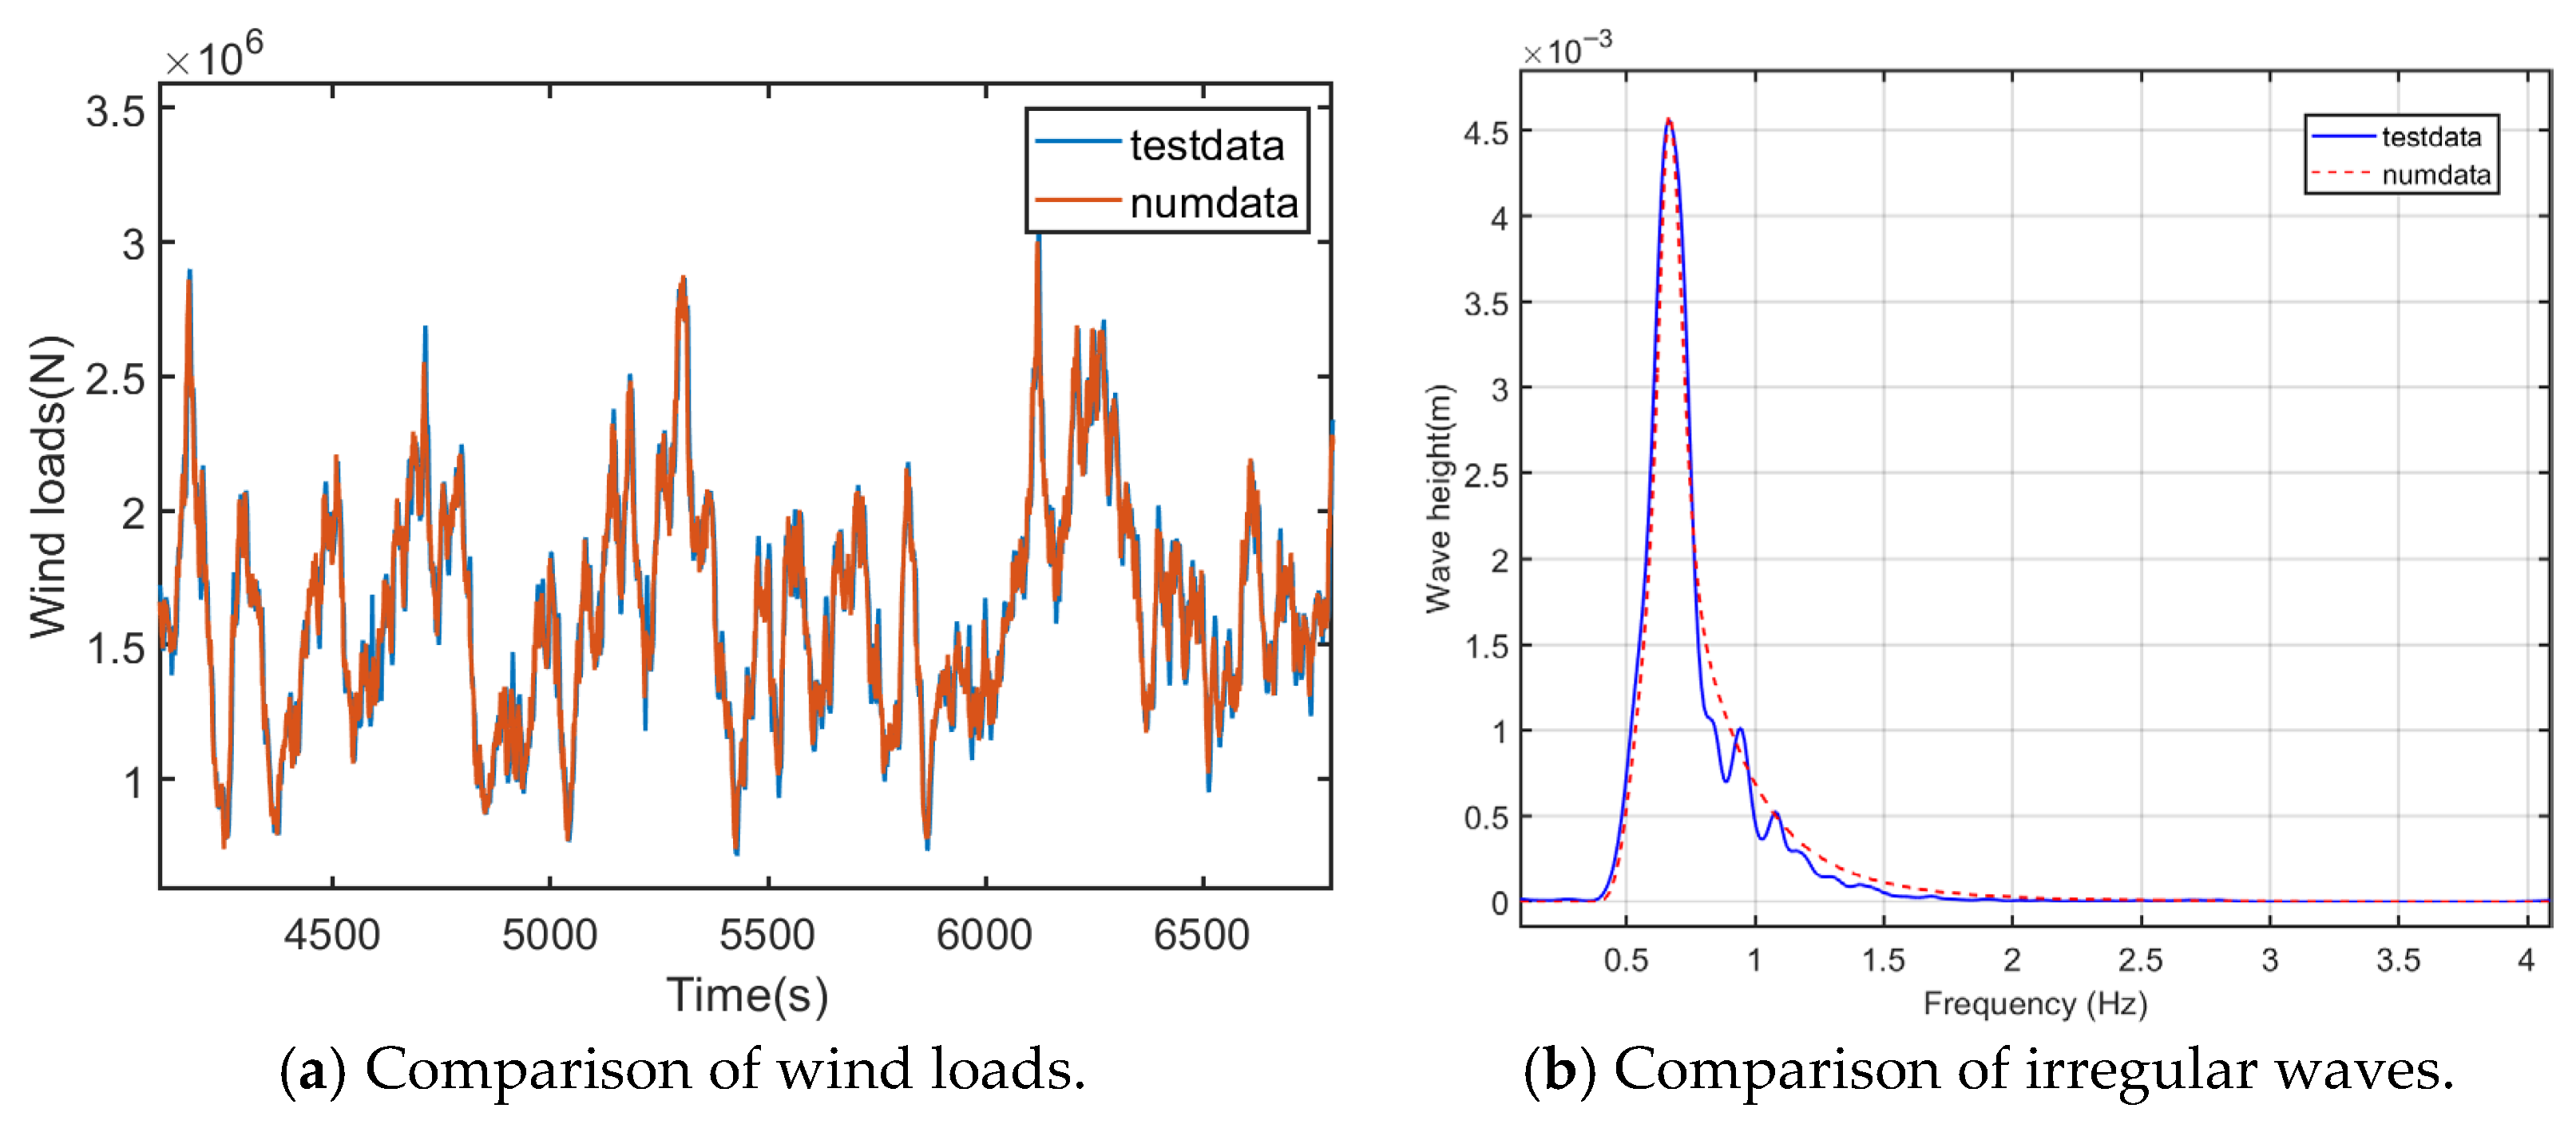
The cut-out wind speed of the wind turbine is 25 m/s; when the wind speed exceeds this value, the turbine will automatically switch to shutdown mode and stop energy generation. To evaluate the dynamic response characteristics and structural safety of schemes B and C under such extreme wind conditions, this study selects extreme wind parameters from two typical offshore wind farm sites in China—Wenzhou, Zhejiang, and Rongcheng, Shandong—for numerical calculation. Among them, the extreme verification wind speeds for the two sea areas are set at 40.59 m/s and 55 m/s. Both are significantly higher than the turbine’s cut-out wind speed, which can fully demonstrate the platform’s dynamic response under extreme wind load conditions, and the turbulent wind curve used in the calculation is illustrated in
Figure 10. In addition, the JONSWAP spectrum is adopted for waves, and wave spreading is not considered. Meanwhile, the key parameters for the numerical simulation are set as follows: the time step is 0.0125 s, and the total simulation duration is 3600 s to ensure the stability and representativeness of the results. The initial 50 s of the transient period are excluded and not presented; only the steady-state data are retained for subsequent analysis to guarantee the reliability of the results, and the condition parameter settings are detailed in
Table 9. Herein, BW/CW denotes scheme B and scheme C under the Wenzhou sea state, while BR/CR denotes scheme B and scheme C under the Rongcheng sea state. The abbreviation WD stands for wind conditions, and WC stands for combined wind and current conditions. Cases without additional abbreviations refer to the combined wind–wave–current conditions.
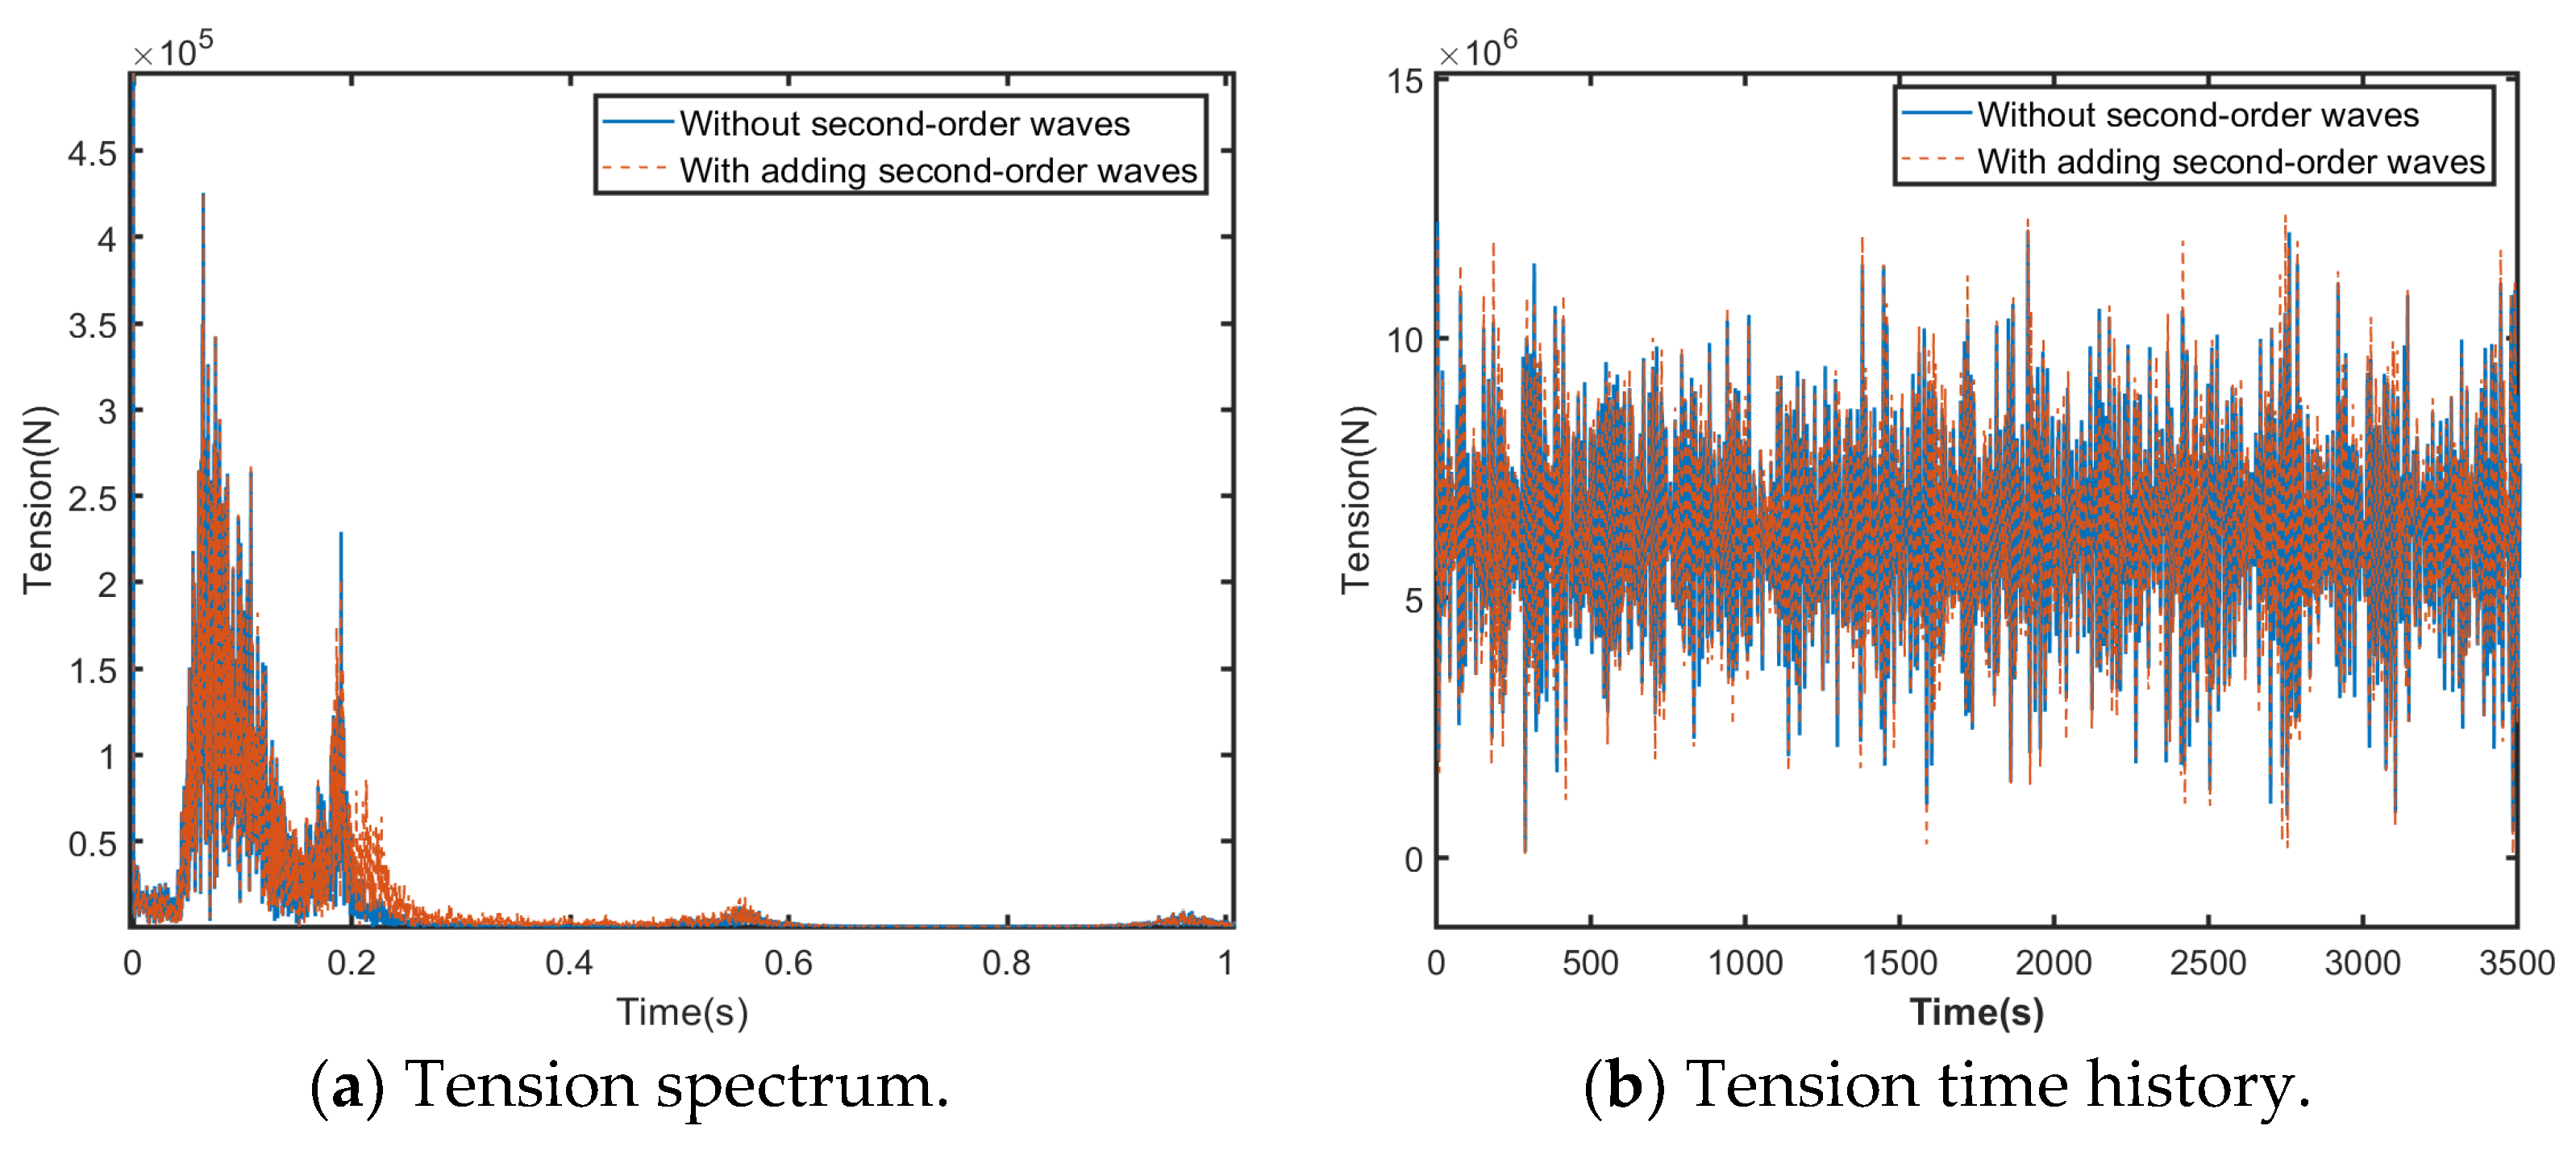
To analyze the influence of second-order waves on the TLP, we first compared the responses of the TLP floating platform under first-order and second-order sum-frequency extreme sea conditions, and presented the frequency-domain diagram and time-domain diagram of Mooring Line 1, as shown in
Figure 11. It can be seen from the comparison results that the influence of second-order waves on the long-period wave band above 10 s is not significant under this extreme sea condition. In
Figure 8a, the spectral lines of “without adding second-order waves” and “with adding second-order waves” basically overlap in the low-frequency region, and the energy distribution is almost consistent with the spectral peak position, indicating that the second-order sum-frequency does not significantly increase the amplitude of the long-period response.
Figure 8b also shows that the two working conditions are highly consistent. It can be clearly seen that the response of the structure to long-period waves is mainly controlled by the first-order component under this working condition, and the second-order sum-frequency response is relatively weak. Therefore, we will just analyze the response of the TLP under first-order waves in the following sections.
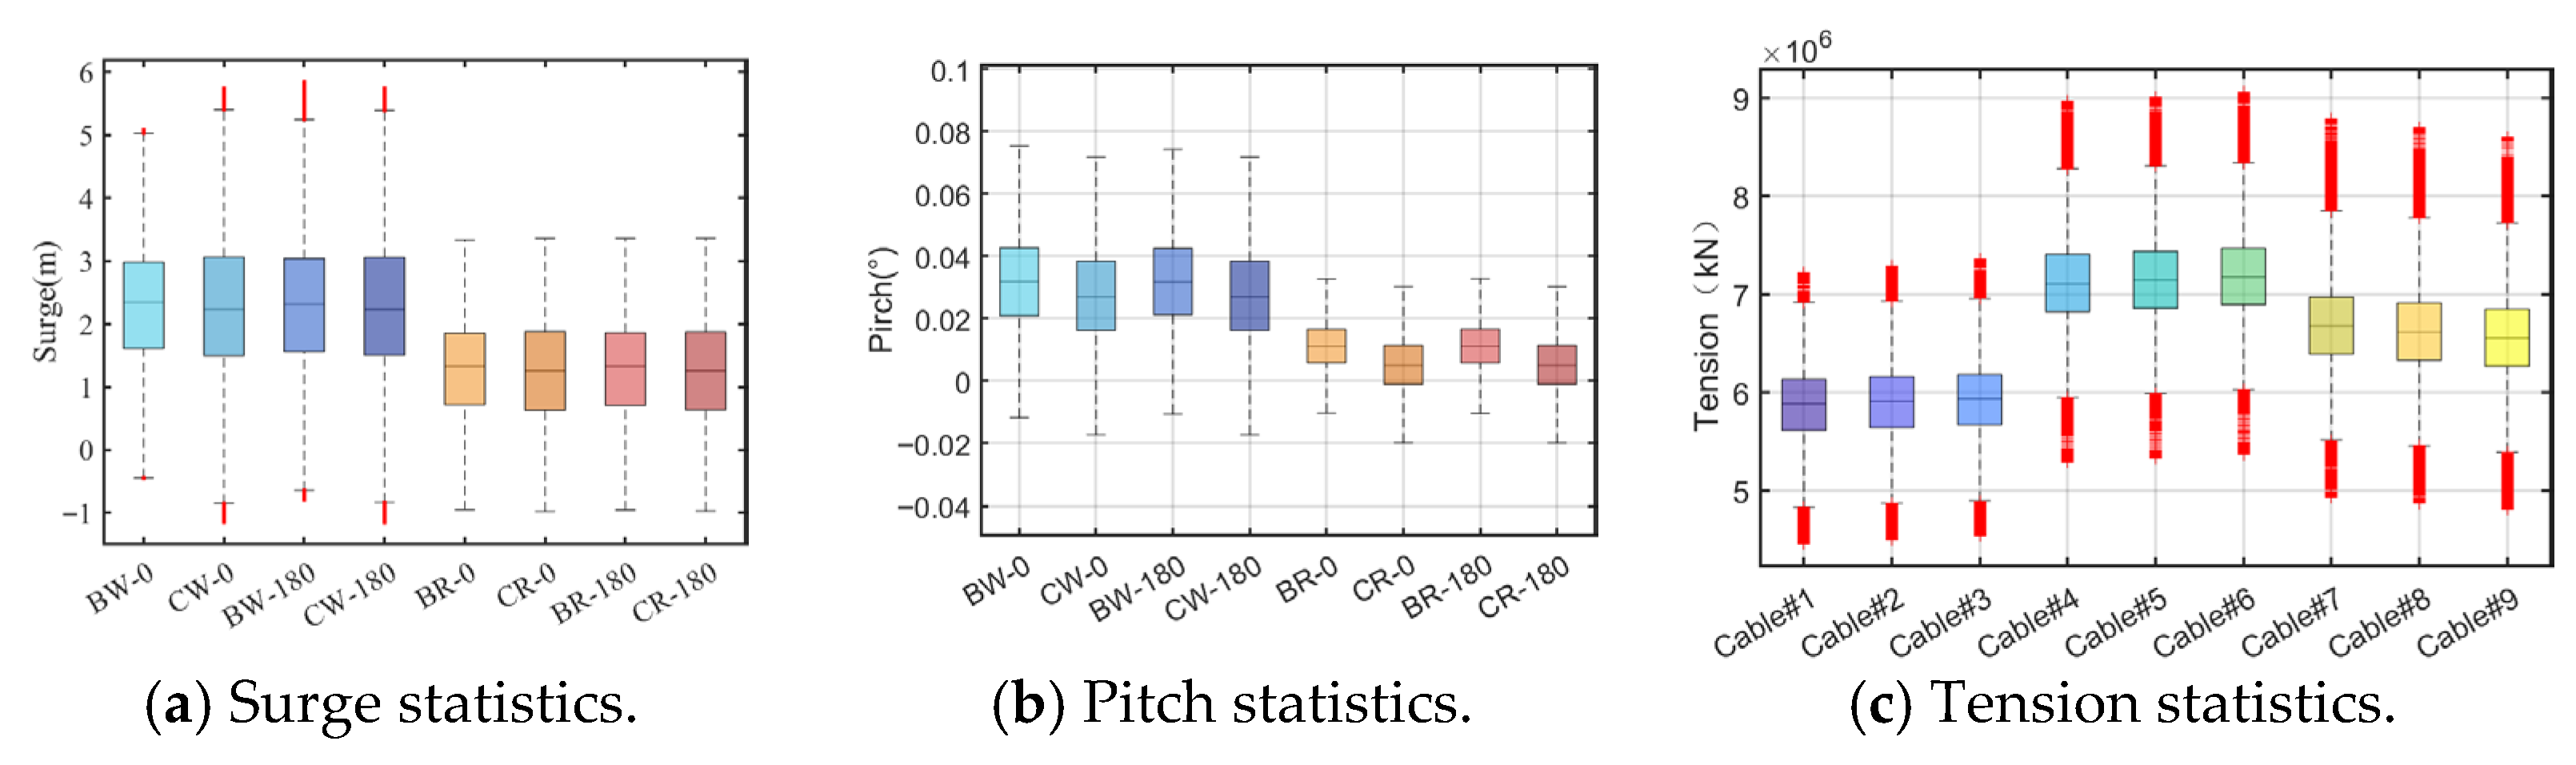
The statistical values of the TLP FOWT motion and tension response under wind load conditions are illustrated in
Figure 12. The dynamic response characteristics were analyzed, and the results show: the maximum mooring tension of scheme B is 7969 kN, and the maximum pitch angle of the platform is 0.09237°; the maximum mooring tension of scheme C reaches 9060 kN, while the maximum pitch angle of the platform is 0.0892°. It can be seen from the comparison that scheme B is superior to scheme C in both controlling the extreme mooring tension and the platform pitch, and it also has better fluctuation stability in overall dynamic response. Further statistics show that the fluctuation amplitude of the mooring tension of both schemes does not exceed 50 tons, and the fluctuation amplitudes of the mooring tension on the windward and leeward sides are of the same order of magnitude, showing no significant difference.
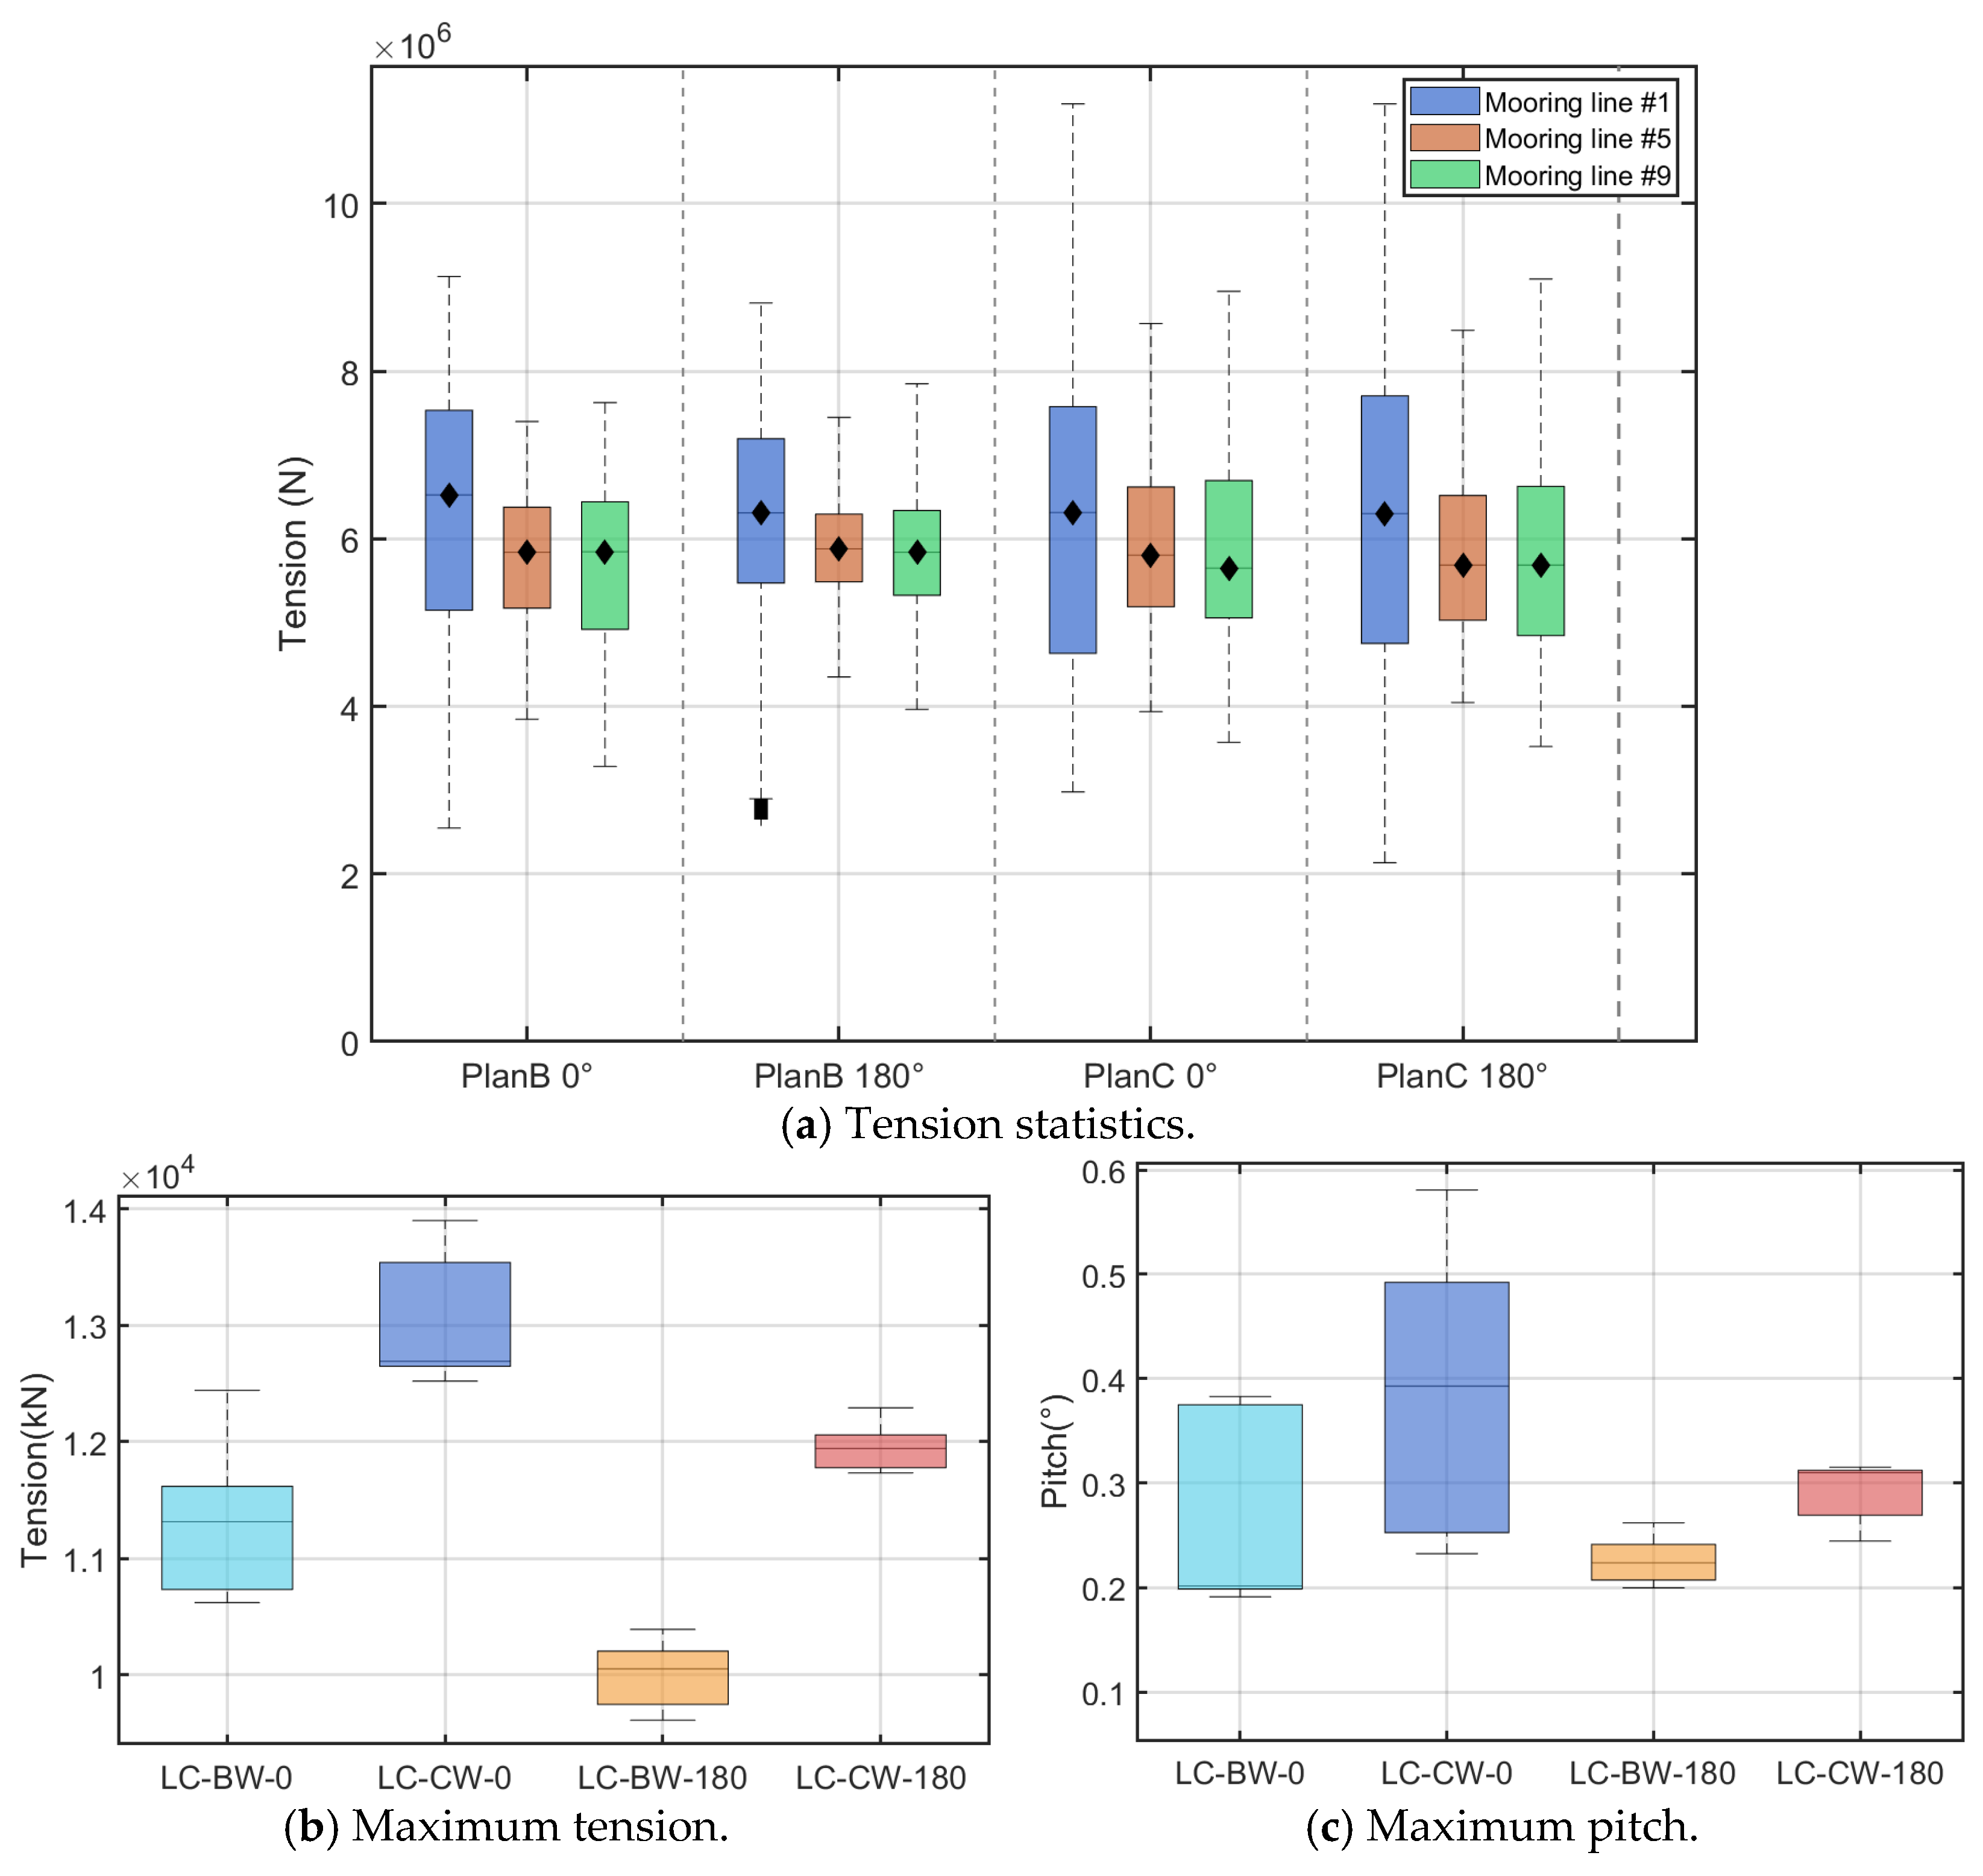
The statistical values of the mooring tension of #1, #5 and #9 under the combined wave–current sea conditions in Wenzhou and Rongcheng are presented in
Table 10. It can be clearly observed that schemes B and C exhibit the same trend in influencing mooring tension under wave–current sea conditions. Therefore, to clearly demonstrate the performance gap between schemes B and C under the same sea conditions, the dynamic response of the platform under the sea conditions in Rongcheng is taken as an example for illustration.
As can be seen from
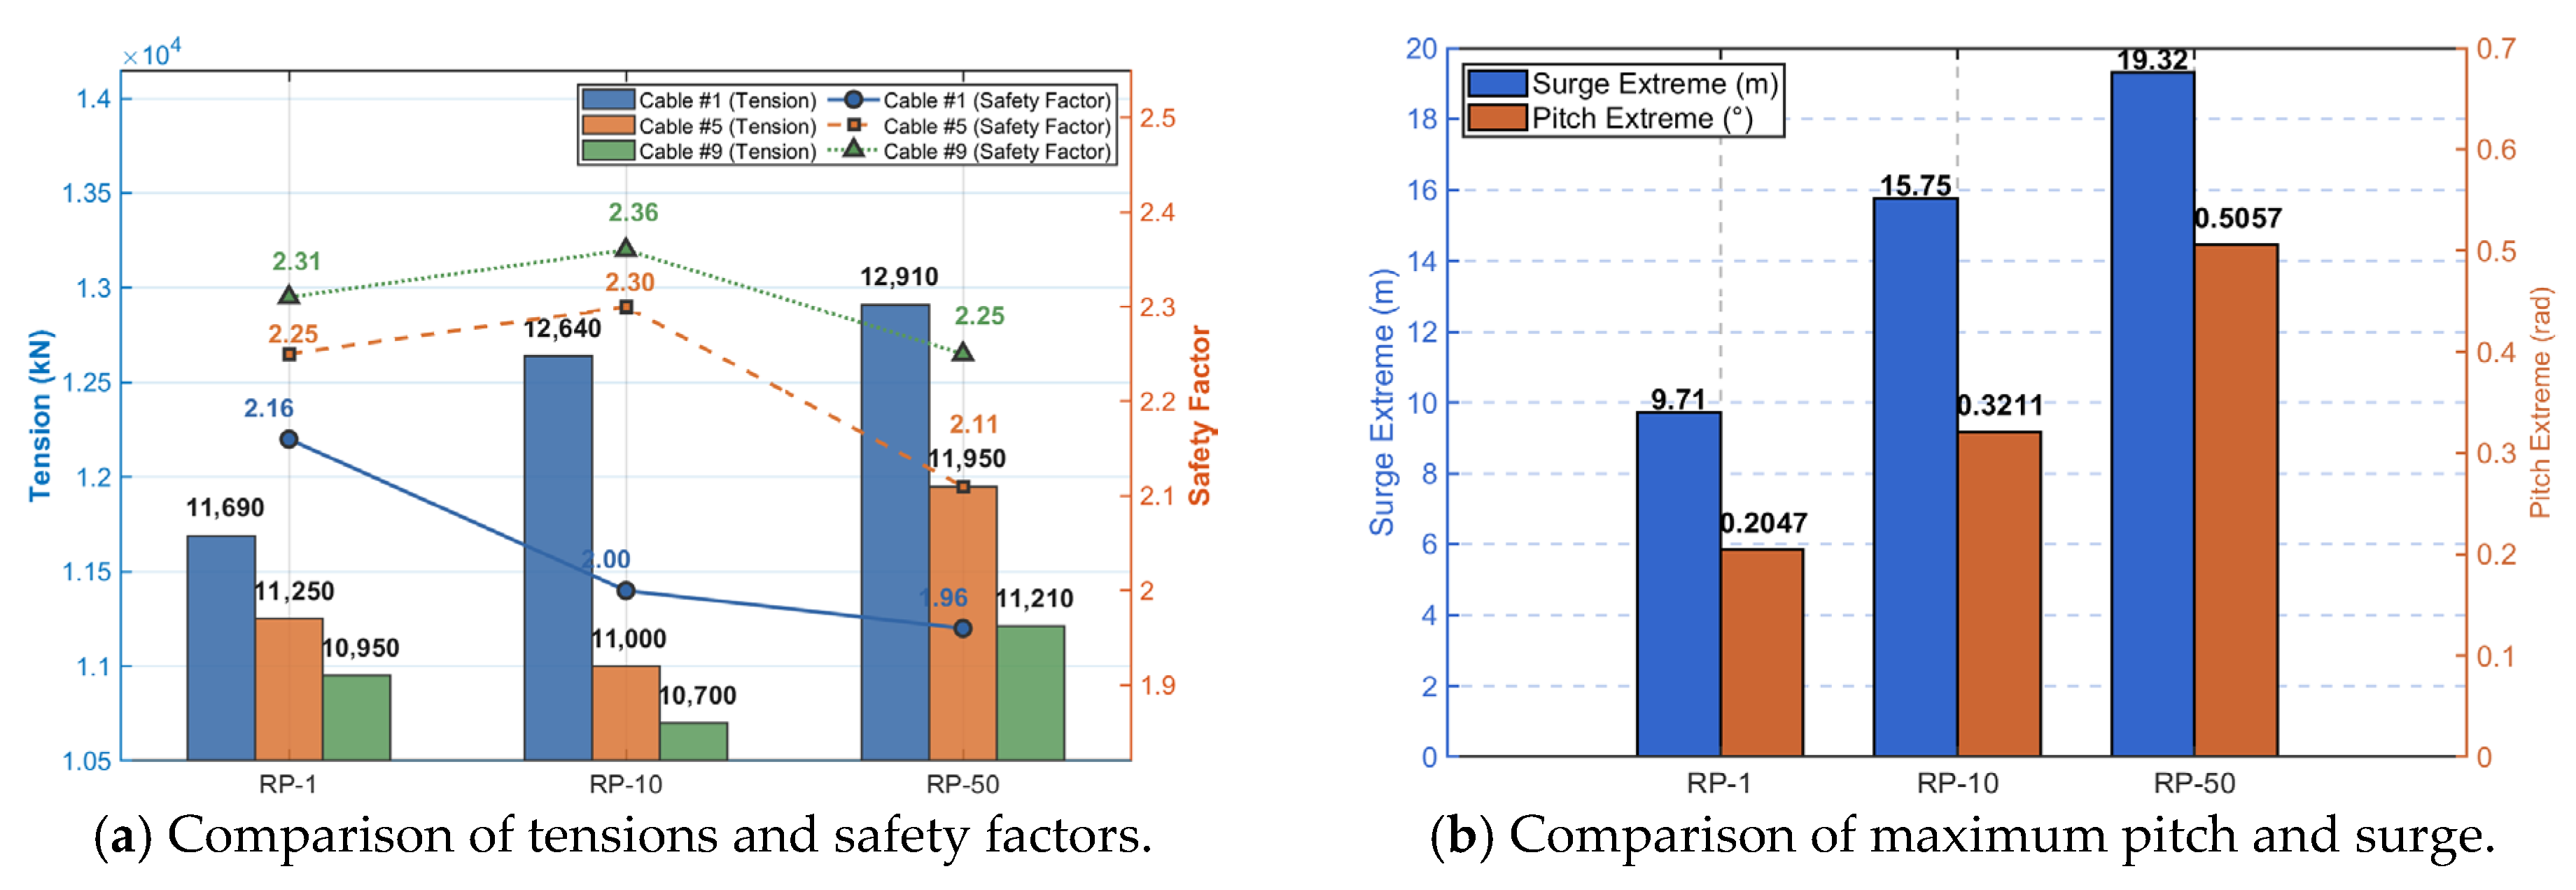
Figure 13, the maximum pitch angle of the platform in scheme B is 0.3838°. However, since scheme C has three fewer tension tendons than scheme B, the motion response of scheme C increases significantly, with the maximum pitch angle of its platform reaching 0.5809°, an increase of 51.62%. Furthermore, due to the increase in the extreme value of the motion response of the floating foundation, the extreme mooring tension also rises significantly, increasing from 11,760 kN in scheme B to 16,330 kN in scheme C, a growth of 38.86%. Thus, under the same wave–current coupling conditions, scheme B has a significantly better ability to restrict the motion of the wind turbine platform than scheme C.
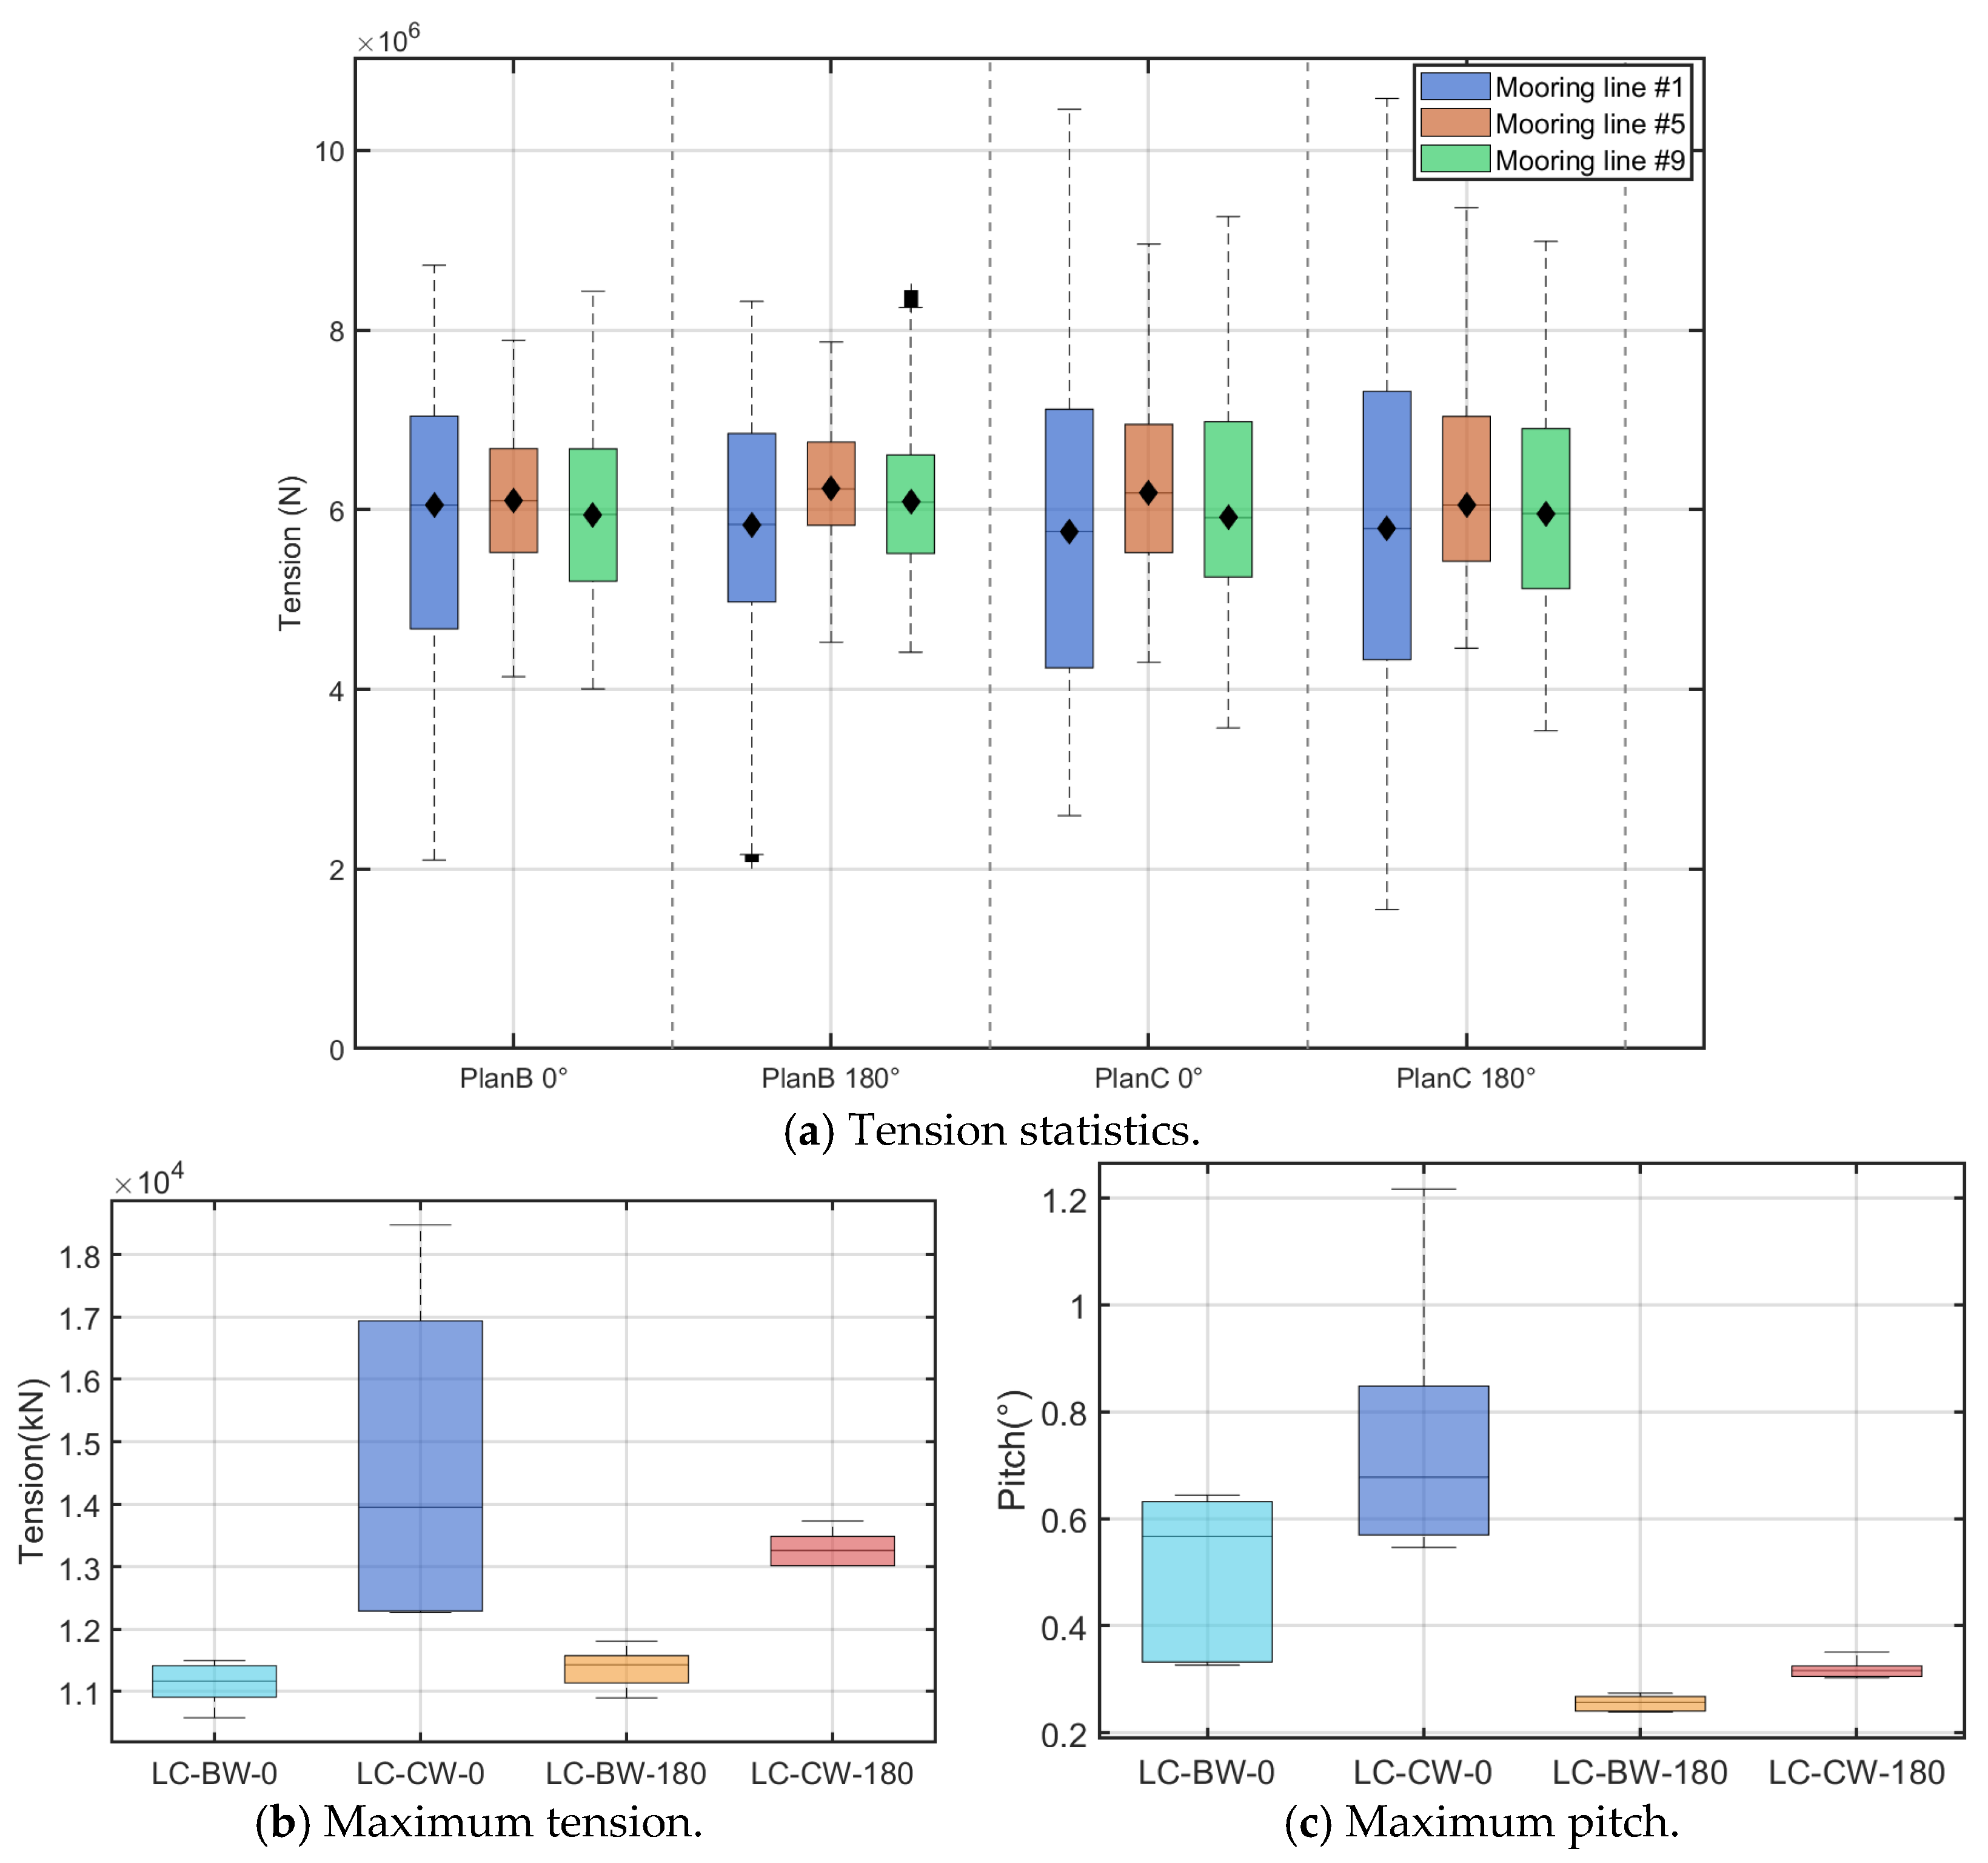
The statistical values of the mooring tension of #1, #5 and #9 under the wind–wave–current coupled sea conditions in Wenzhou and Rongcheng are shown in
Table 11. It can be clearly observed that the variation trend of the dynamic response of the platform in Rongcheng is basically consistent with that in Wenzhou; thus, the dynamic response of the platform under the sea conditions in Rongcheng is taken as an example for demonstration.
As can be seen from
Figure 14, the maximum pitch angle of the platform of scheme B is 0.5983°. However, since the mooring restoring force provided by scheme C is significantly smaller than that of scheme B under the same displacement, the extreme value of the platform motion response increases remarkably, with the maximum pitch angle of the wind turbine platform reaching 0.9387°, an increase of 56.89%. Moreover, due to the increase in the extreme value of the motion response of the floating foundation, the extreme mooring tension also increases significantly, rising from 12,070 kN in scheme B to 17,680 kN in scheme C, an increase of 46.48%. Under the combined wind–wave–current sea conditions, scheme B still outperforms scheme C in terms of displacement restriction effect on the wind turbine platform, and also has a significant improvement in the ability to control the extreme tension of the mooring system.
3.3. Comparison of Key Responses and Selection of Option B
As can be seen from the analysis of the dynamic response of the FOWT under different combined sea conditions in the previous section, the number of tension tendons in scheme B is larger than that in scheme C. The extreme values of the main DOF motion response and mooring tension of the floating foundation of scheme B are significantly lower than those of scheme C under the same sea conditions, and the effect becomes more pronounced as the components of the combined sea conditions increase. During the operational period, TLP FOWT are subject to the impacts of extreme sea conditions; therefore, the extreme values of the dynamic response of the TLP FOWT under the wind–wave–current combined sea conditions are selected for standard verification. In accordance with the requirements of core standards,
Table 12 verifies the operational performance of the schemes B and C proposed in this paper.
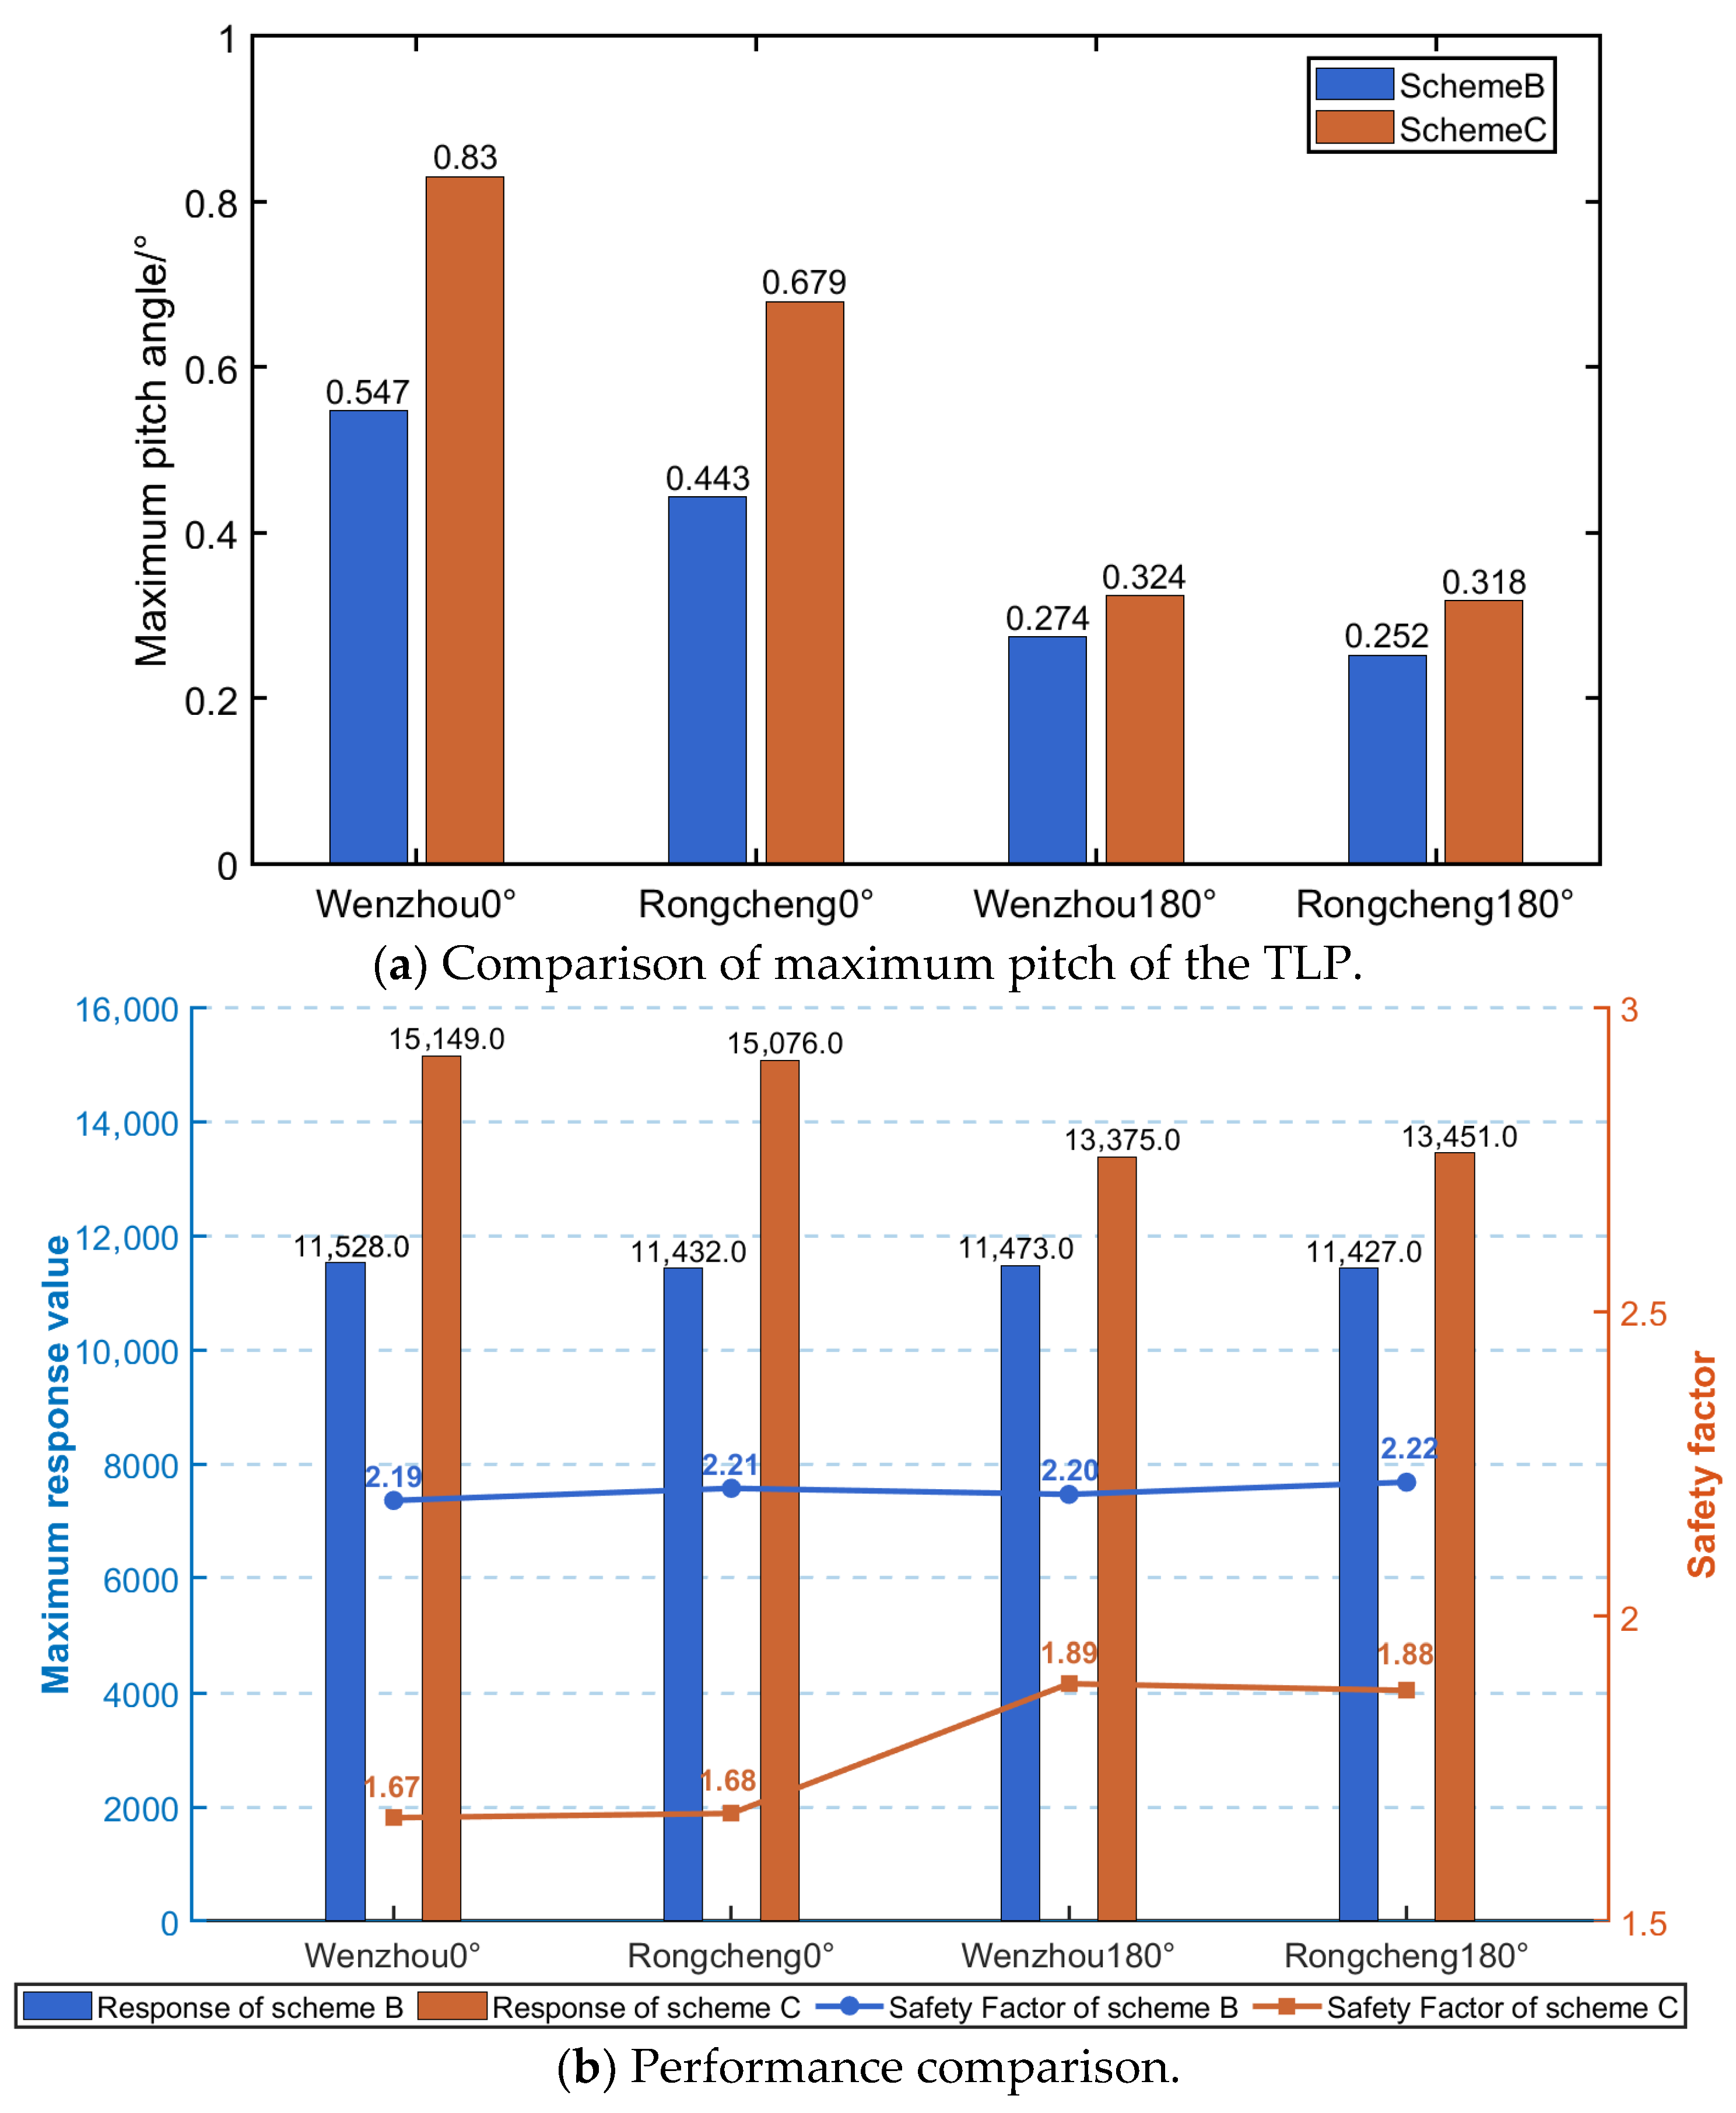
As can be seen from
Figure 15a, the vertical tension mooring layout selected in this paper exerts good constraints on the extreme pitch motion value of the TLP FOWT, resulting in a maximum pitch angle significantly lower than the 5°/10° requirement specified in the standards. Meanwhile, the increase in the number of tendons enables scheme B to have better constraint capacity than scheme C.
Figure 15b shows the comparison between the maximum tension values of scheme B and C and the standard verification values under wind–wave–current combined sea conditions. According to the API RP 2SK [
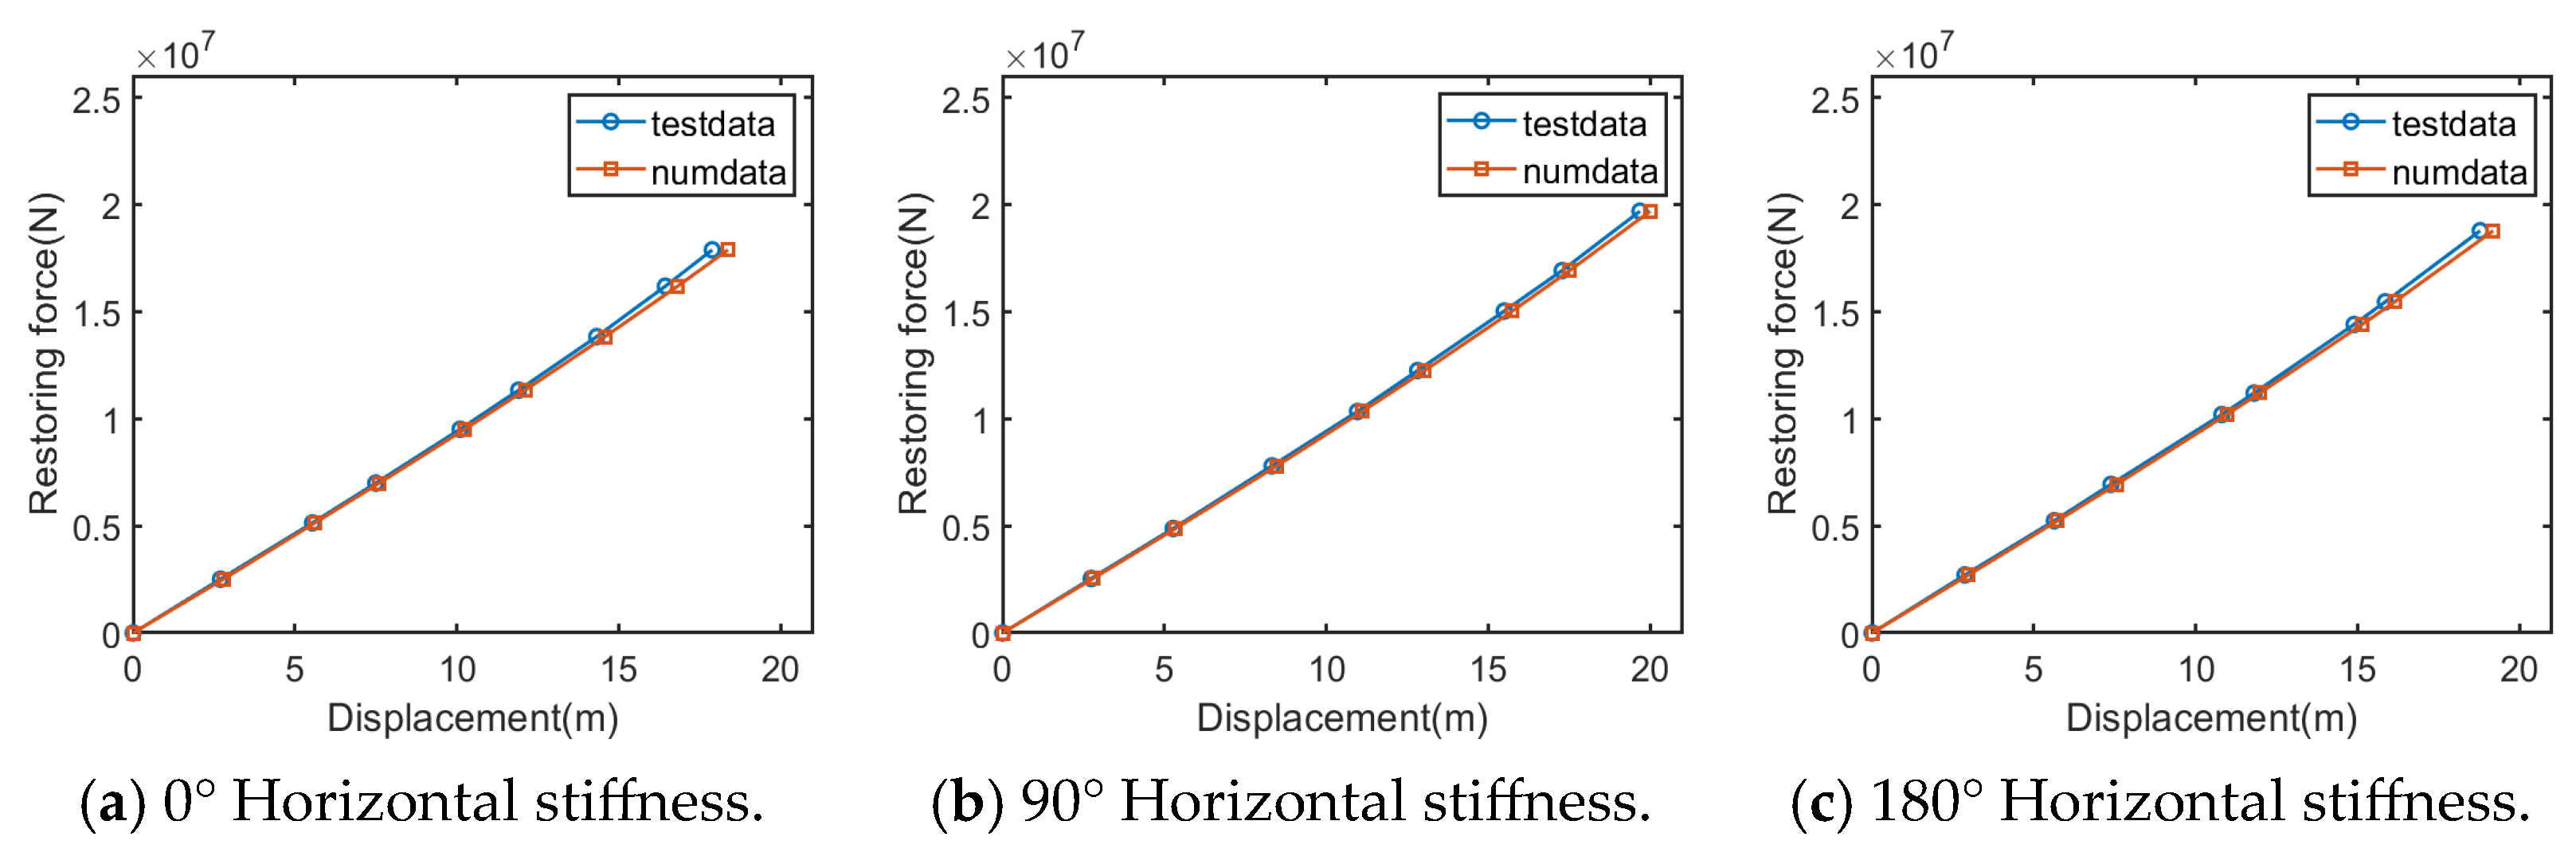
26], the safety factor of 1.67 is used for the mooring system. It is evident that the safety factors of the mooring tension for scheme B are all greater than 1.67. For scheme C, however, due to the smaller number of mooring tendons, its constraint on the motion response of main DOF, such as pitch, is relatively poorer than that of scheme B. This leads to a significant increase in the maximum mooring tension of scheme C, making its safety factor approach 1.67. Meanwhile, it can be seen from the standard verification value curve of scheme C that the TLP FOWT of scheme C is more sensitive to the incident direction of sea conditions.
Under sea conditions with the same parameters but different incident directions, there are significant differences in the standard verification values of the mooring tension for scheme C. Under 180° incidence, the verification values of scheme C are 1.89 and 1.88; when the incident direction of sea conditions changes to 0°, the verification values reach 1.67 and 1.68, which are very close to the standard requirements. Since TLP FOWT are exposed to complex and variable sea conditions, scheme C poses certain risks when facing complex sea conditions. Therefore, this paper selects the floating foundation and mooring system design of scheme B as the final design scheme.