Review

Technological Bottlenecks in Fuels for Maritime Decarbonization

Chemistry Research Centre of the University of Porto/Institute of Molecular Sciences (CIQUP-IMS), Faculty of Sciences, University of Porto, Rua do Campo Alegre s/n, 4169-007 Porto, Portugal
J. Mar. Sci. Eng. 2026, 14(6), 570; https://doi.org/10.3390/jmse14060570
Submission received: 13 February 2026 / Revised: 9 March 2026 / Accepted: 16 March 2026 / Published: 19 March 2026

Abstract

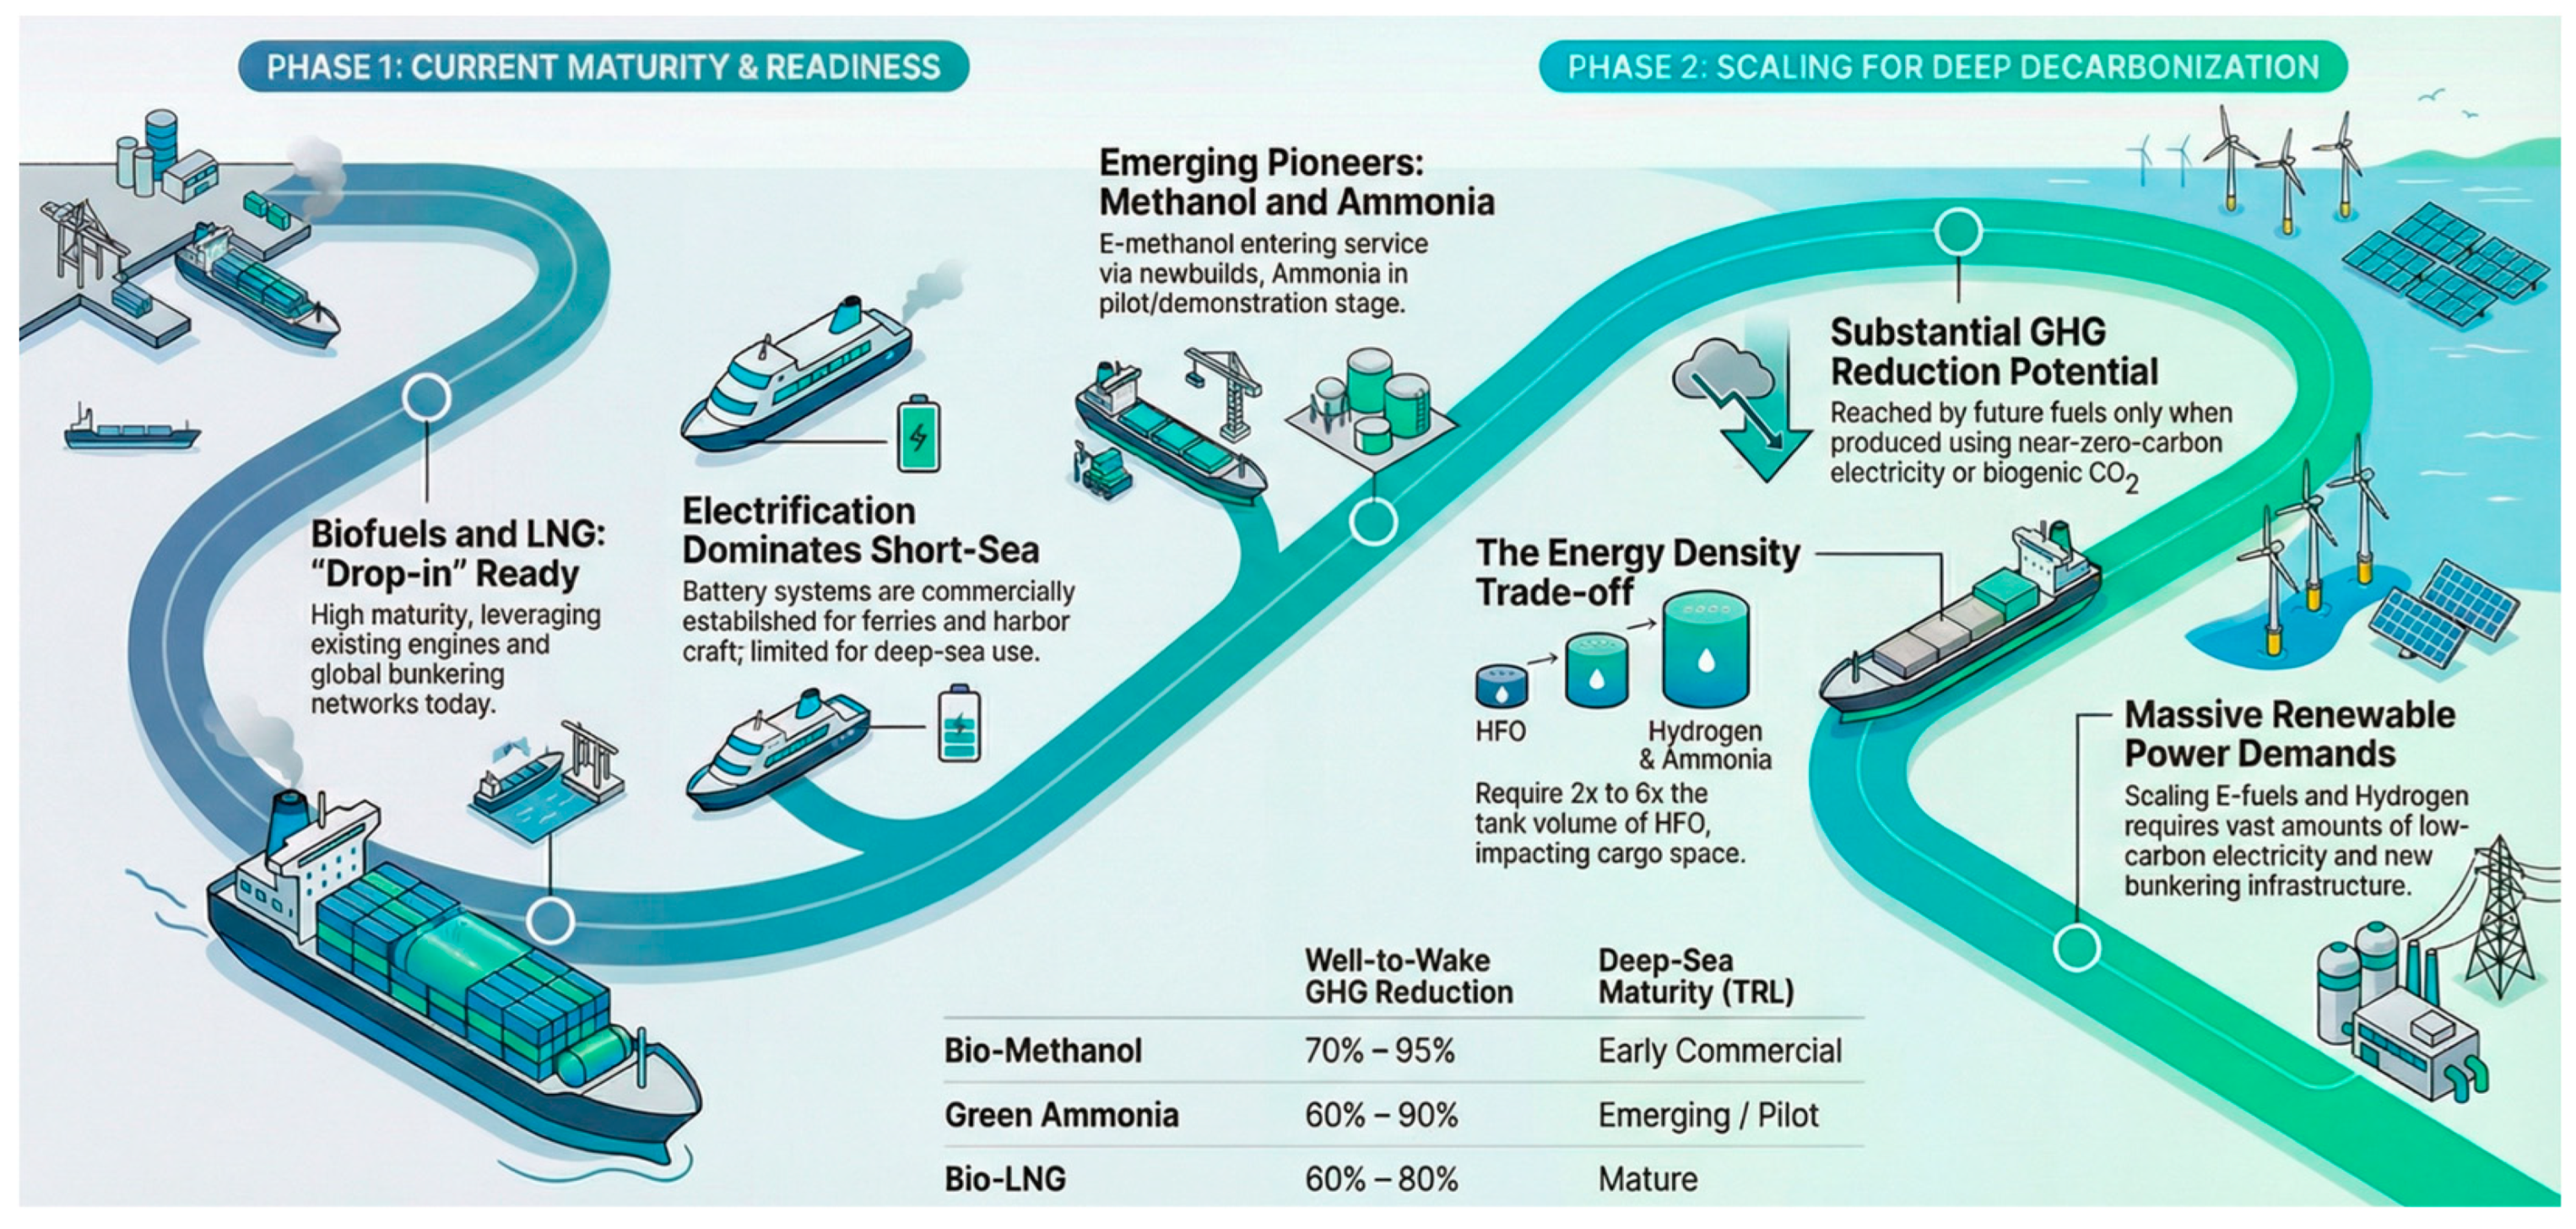
Maritime decarbonization has shifted from a long-term aspiration to an engineering and systems-integrated problem under near-term compliance pressure. International regulatory bodies, governments, and a wide array of private-sector coalitions will tighten greenhouse-gas fuel-emission standards from 2028, translating climate targets into enforceable cost signals and accelerating interest in alternative-fuel and retrofit pathways. This review synthesizes the state of the art (SoA) of maritime decarbonization by mapping where technological bottlenecks concentrate along the well-to-wake (WtW) value chain for the main candidate pathways: biofuels, LNG/bio-LNG, hydrogen, ammonia, e-methanol, and electrification, and by benchmarking them side-by-side using a unified framework designed to compare their realizable well-to-wake GHG-reduction potential under maritime operating constraints. Building on that comparative lens, this work aims to connect pathway readiness to the near-term market and regulatory reality, while the alternative-fuel-capable fleet is projected to expand rapidly, creating a structural capability vs. supply gap, in which, for example, ship readiness can outpace low-GHG fuel availability and bunkering rollout. The merged evidence indicates that near-term abatement will be dominated by scalable drop-in biofuels, whereas deep-sea options (ammonia/hydrogen and e-fuels) remain gated by upstream low-GHG production, port infrastructure, and safety/regulatory maturation. Nevertheless, mid-term deployment of low-GHG fuels can act as a system “relief valve”, reducing infrastructure lock-in and accelerating emissions reductions while zero-carbon fuel supply chains scale up.

1. Introduction

The maritime decarbonization challenge is no longer whether to move beyond oil, but how fast the sector can deploy technically and commercially viable alternatives without compromising safety, reliability, or global trade. The International Maritime Organisation’s (IMO) 2023 Greenhouse Gases (GHG) strategy tightened the trajectory to at least 20% (striving for 30%) total GHG reduction by 2030 and at least 70% (striving for 80%) by 2040, on a path to net-zero by or around 2050 [1]. Against this backdrop, the development, large-scale production, and safe deployment of low-GHG fuels have emerged as a central lever for meeting the tightened GHG reduction milestones.
The literature largely converges on a frontier map for maritime decarbonization constraint sets that includes (a) energy carriers and onboard conversion with methanol, ammonia, hydrogen and hybrid electric/fuel-cell pathways advancing, but bounded by volumetric energy density penalties, retrofitability, and the hard engineering of storage/handling at sea; (b) system safety and operability where the cutting edge is no longer “Can we burn/use it?” but “Can we industrialize it safely and repeatedly regarding toxicity, ignition regimes, bunkering procedures, crew competency, and class rules?”, which safety-barrier analyses treat as a first-order rate limiter rather than a downstream compliance detail [2]; (c) true climate performance under lifecycle accounting, where the research emphasis is shifting from tank-to-wake claims to well-to-wake and broader sustainability screens, because the upstream electricity carbon intensity, feedstock provenance, and methane/N2O slip may erase nominal gains, making robust LCA boundaries and fuel certification architectures a decisive frontier [3,4]; and (d) bridge and residual-emissions options, notably onboard carbon capture and storage/use concepts, that the literature frames as an immediately deployable lever for portions of the fleet, but one hemmed in by capture energy penalties, space/weight integration, solvent logistics, and the absence of mature port CO2 offloading networks [5]. Overlaid on all of this is governance realism, with several analyses emphasizing that fragmented policy signals and heterogeneous regional rulemaking can either accelerate learning curves or strand capital. Hence, the frontier is increasingly the co-design of technology pathways with credible regulation, measurement, and incentives rather than propulsion hardware in isolation [6].
This review aims to interrogate the SoA over roughly the past five years, focusing on prominent pathways: (a) liquid biofuels, (b) LNG/bio-LNG, (c) hydrogen, (d) ammonia, (e) e-methanol, and (f) electrification and energy storage. Rather than ask which single fuel “wins,” this work aims to examine where each option encounters technological bottlenecks, in particular, energy density and storage penalties onboard, conversion and synthesis losses, safety and emissions control, bunkering and port power constraints, lifecycle GHG variability, and retrofit feasibility. Recent comparative assessments underscore that technology choices are route- and vessel-specific and highly sensitive to upstream electricity source and supply-chain assumptions [7].
Liquid biofuels can play a practical near-term role in maritime decarbonization by reducing well-to-wake emissions while using much of the existing fleet and bunkering infrastructure, often as drop-in fuels or blends that require limited ship modifications. Their climate benefit depends heavily on feedstock and the production pathway, so peer-reviewed LCAs emphasize sustainability governance and certification: upstream factors such as residue vs. crop feedstocks, process energy, allocation choices, and land-use change risk largely determine outcomes and can even reverse conclusions. As a result, biofuels are most credible as a bridge when sourced from low-ILUC wastes/residues or well-managed lignocellulosic routes, but their scale is constrained by sustainable biomass availability and competition from other hard-to-abate sectors. Strategically, they provide a near-term compliance lever under lifecycle-based policies and a portfolio hedge that can decarbonize legacy tonnage and niche routes during the 2020s–2030s while zero-carbon fuel ecosystems mature [8,9]. Bio-LNG is often framed as a near-term drop-in for dual-fuel engines. Still, recent peer-reviewed lifecycle studies converge on methane slip, both engine-out and along the supply chain, as the pivotal uncertainty that can erase or reverse climate benefits vs. conventional fuels [10]. Mitigation through advanced combustion strategies and oxidation catalysts is promising yet not fully proven under varied marine duty cycles. In parallel, the scalability of sustainably sourced bio-methane remains contested. These unresolved factors position bio-LNG as a transitional option whose climate performance depends on rigorous measurement, reporting, and verification of methane and on demonstrably low-leak supply chains [11].
Subsequently, hydrogen offers zero-carbon use when produced from renewables, but storage and conversion pathways remain technologically immature and must be further developed for large-scale applications. Compressed hydrogen’s low volumetric density and liquid hydrogen’s cryogenic complexity impose significant tankage and boil-off penalties, while fuel-cell systems add cost and durability concerns in marine operations. When evaluated on a “wind-to-wake” basis, several studies find that hydrogen fuel cells can require substantially less renewable electricity than ammonia for the same delivered propulsion, highlighting the efficiency premium of fewer conversion steps, but only if storage, safety, and bunkering standards are solved for real-world operations [12].
Ammonia has surged as a candidate for deep-sea ranges because it is a carbon-free carrier with an intermediate onboard volumetric penalty relative to heavy fuel oil (HFO) (typically requiring ~2–3× HFO tank volume for equivalent energy), while remaining less space-penalizing than hydrogen storage in most ship concepts, and it is supported by an emerging engine roadmap [13,14]. The SoA, however, points to three relevant bottleneck issues: (a) toxicity and crew/port safety, (b) combustion challenges that drive NOx and potential N2O formation, and (c) the need for slip monitoring and after-treatment strategies validated at the marine scale. These technical questions sit atop a supply-side hurdle, since producing “green” ammonia at volumes aligned with bunker demand is challenging without crowding out other sectors [15].
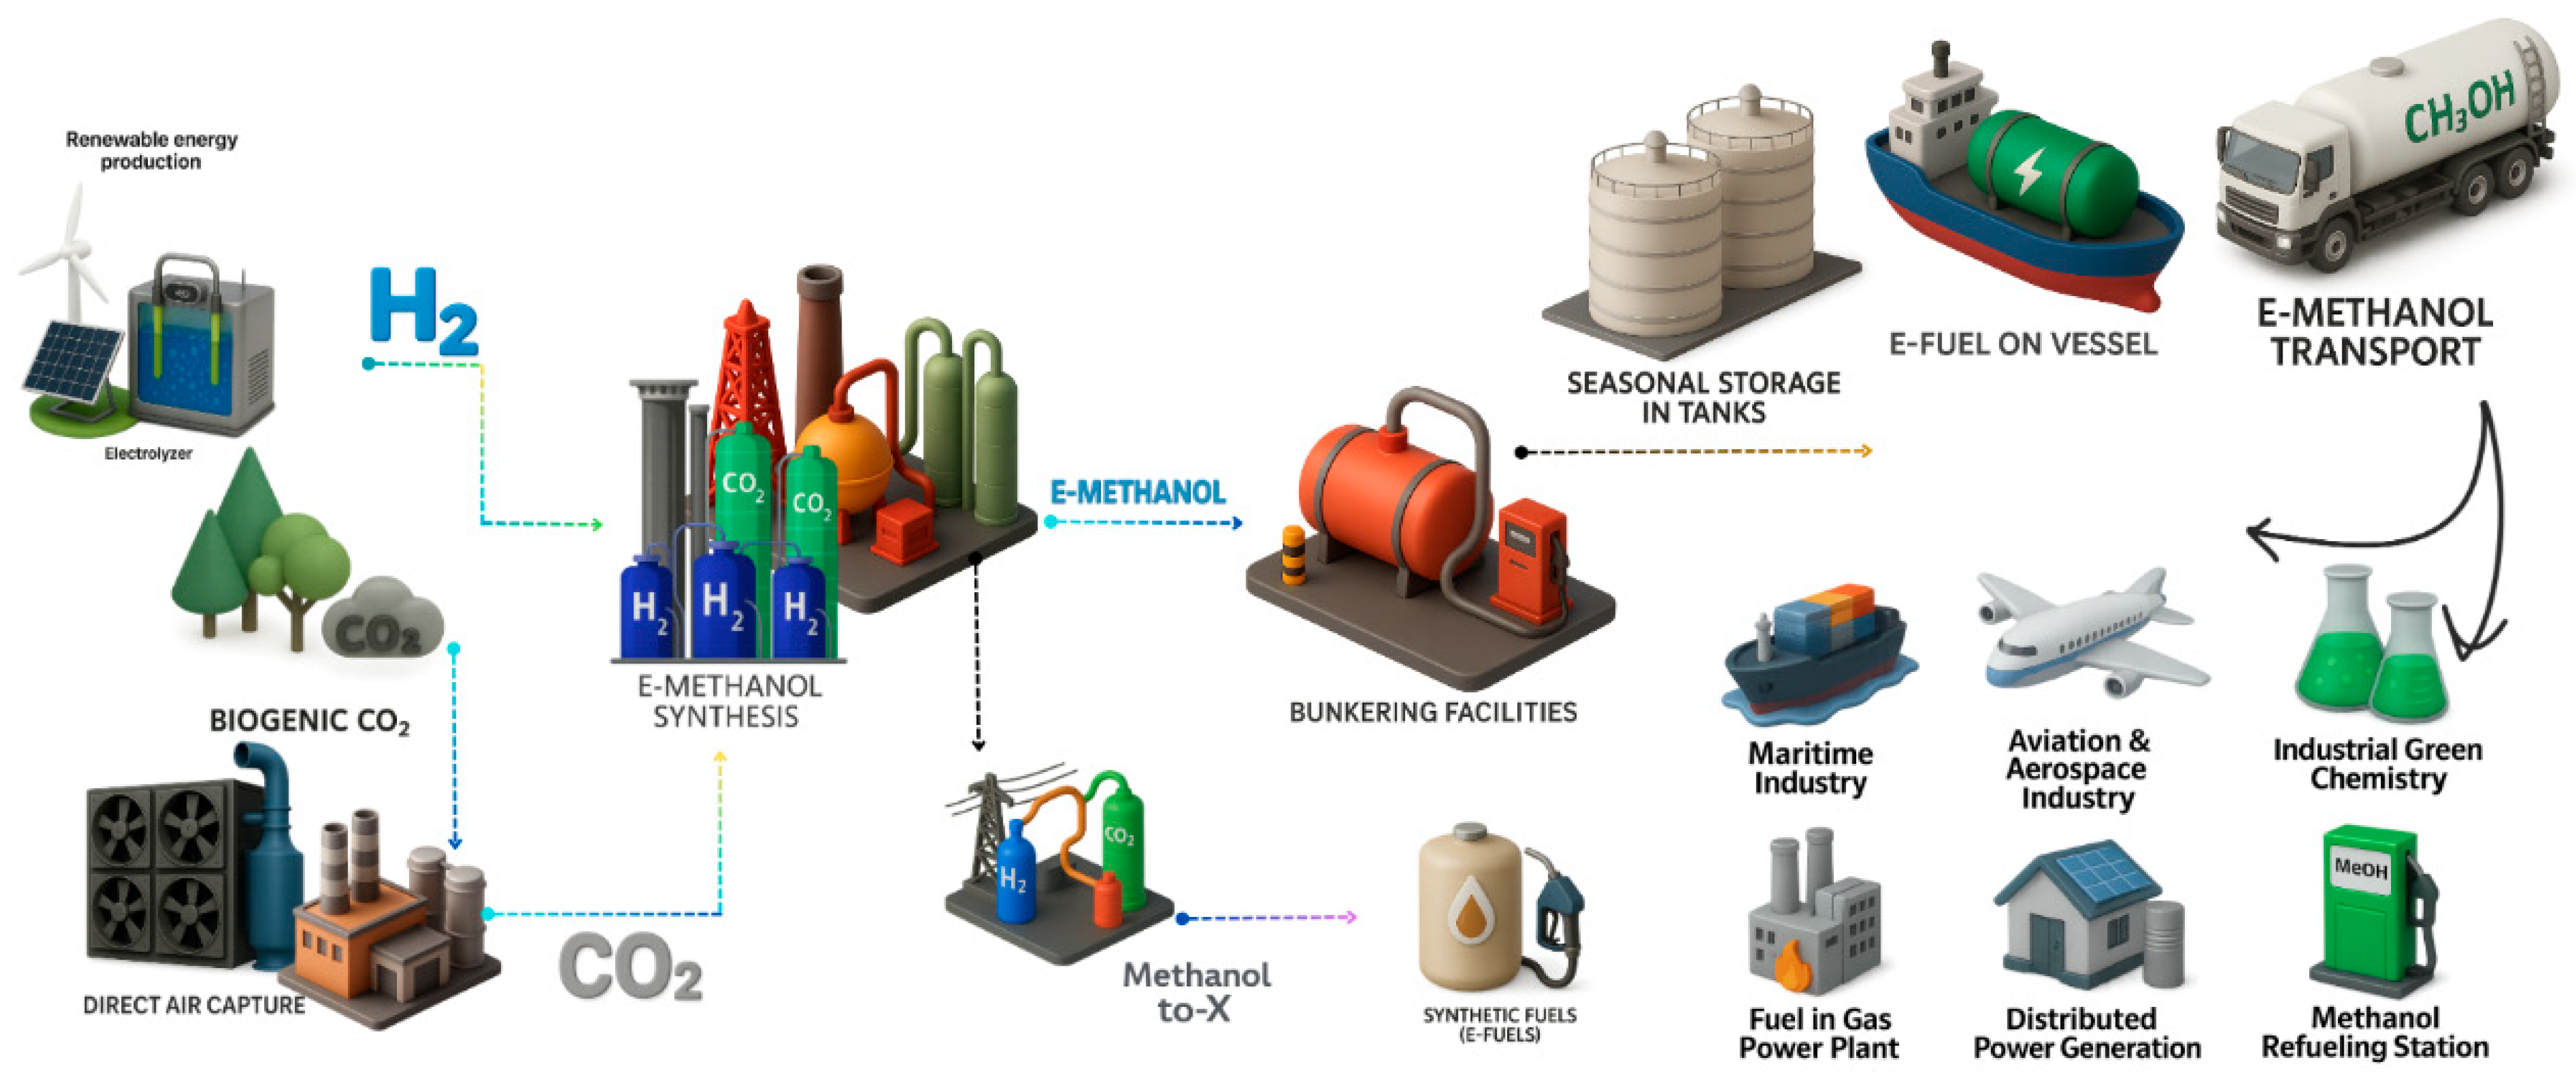
E-methanol has gained momentum because it is a liquid at ambient conditions, compatible with much existing handling infrastructure and with rapidly maturing engine platforms [16]. The literature emphasizes its operational simplicity relative to hydrogen or ammonia, while noting two critical barriers: (a) a volumetric energy density lower than conventional marine fuels, implying a tank-volume requirement of roughly ~2.0–2.5× HFO for equivalent energy (though within the alternative liquid fuels considered, it remains comparatively space-efficient and far easier to integrate than cryogenic or high-pressure hydrogen storage), and (b) the scarcity and cost of truly “green” carbon (from sustainable biogenic sources or direct air capture) needed to close the carbon loop. As orders for methanol-ready vessels rise, so will the well-to-wake performance, verifiable renewable synthesis routes, and effective control of formaldehyde and other air toxics in use [11].
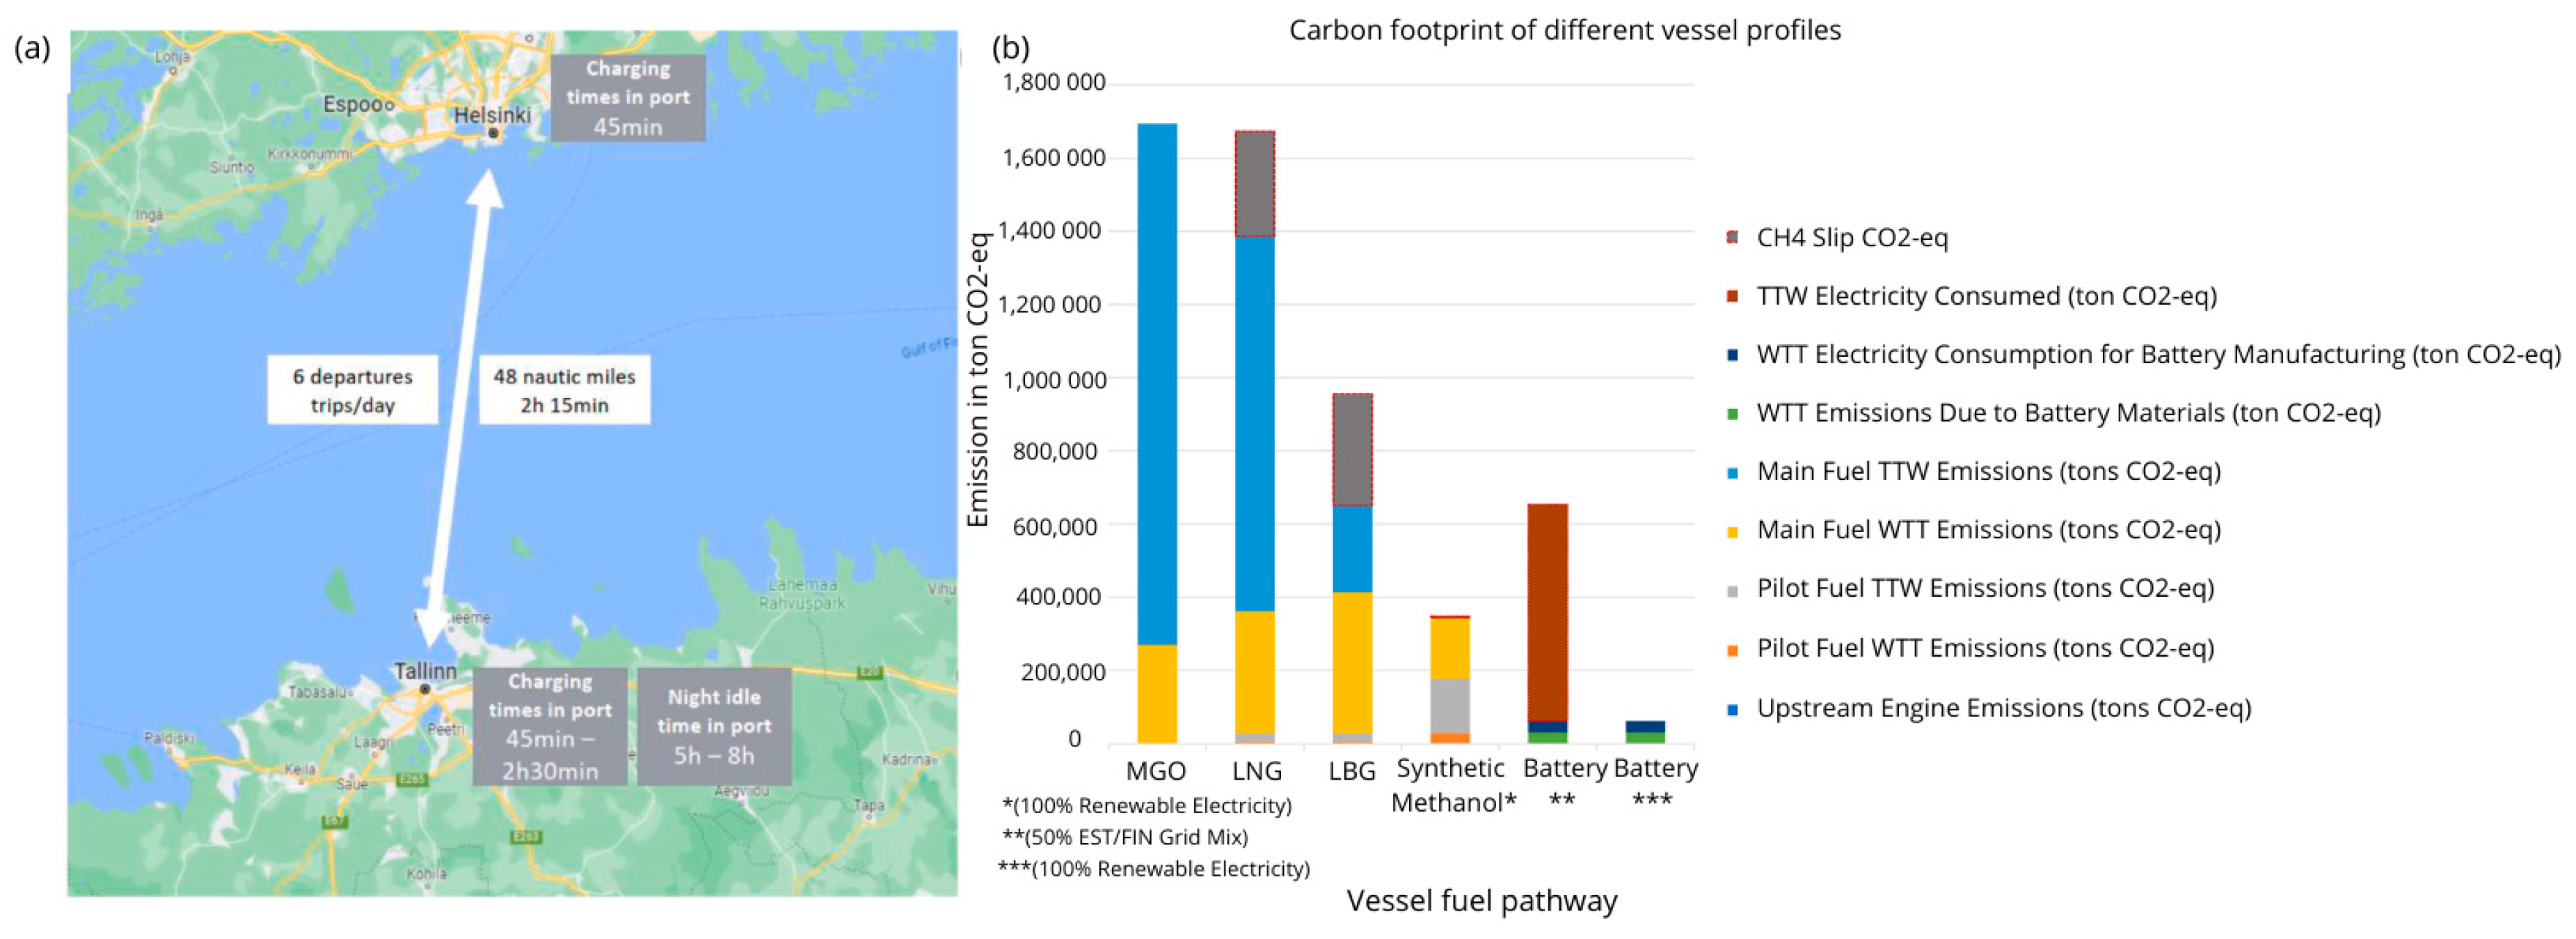
Thereafter, electrification has moved from pilots to routine service in short-sea segments (e.g., ferries, harbor craft), with clear efficiency and air-quality benefits at the point of use. Yet its adoption at scale runs into three coupled constraints: low gravimetric/volumetric energy density relative to liquid fuels; safety and thermal-management requirements at pack and system levels; and the need for megawatt-class charging alongside robust shore-power at ports. The recent literature documents show advances in marine battery systems and energy-management strategies, while also highlighting that grid capacity, operational profiles, and charging logistics can be as limiting as cell chemistry [17,18].
Across pathways, infrastructure emerges as a shared constraint. Battery and hybrid solutions require dependable shore power and high-rate charging aligned with port operations. Hydrogen, ammonia, and e-methanol demand new bunkering standards, storage, and safety protocols, and all power-to-x fuels ultimately lean on massive additions of low-carbon electricity. Recent port-focused studies show that planning for onshore power supply (OPS) and electrified auxiliaries materially affects both grid capacity needs and realized emissions, underscoring the importance of system-level coordination between vessels and terminals [19,20].
A central premise of this review is that the decarbonization value of a marine fuel cannot be inferred from the nominal carbon content or point-of-use emissions alone. Rather, its effective GHG-abatement potential is conditioned by technological bottlenecks distributed across the well-to-wake chain, including upstream fuel production, storage and conversion losses, non-CO2 emissions, onboard integration penalties, and port/bunkering readiness. Accordingly, the purpose of this article is not only to summarize the main alternative-fuel pathways but also to compare them in terms of how such bottlenecks shape their realizable GHG-reduction potential under maritime operating conditions.
The following sections examine bio-LNG, hydrogen, ammonia, e-methanol, and batteries in turn, before concluding with cross-cutting priorities for R&D, standards, and infrastructure that can unlock deployment at the pace implied by the IMO’s mid-century objectives.

2. Methodology

This review uses a structured narrative design to identify and compare technological bottlenecks across the well-to-wake (WtW) value chains of leading sustainable energy pathways for maritime decarbonization. The methodological workflow comprises the (a) definition of scope and research questions, (b) targeted literature retrieval and eligibility-based screening (peer-reviewed and high-quality gray literature), (c) standardized data extraction and categorization into harmonized bottleneck categories, and (d) comparative synthesis using a unified cross-pathway framework.

2.1. Review Scope and Research Questions

The review targets ocean-going and short-sea shipping, including port-side operations relevant to fuel supply and onboard energy use. The primary pathways assessed are liquid biofuels (e.g., FAME, HVO/renewable diesel, bio-methanol), LNG/bio-LNG, hydrogen, ammonia, e-methanol, and electrification/energy storage. Emphasis is placed on the most recent ~5 years, reflecting intensified regulatory pressure and accelerated piloting of alternative marine fuels.
The review is guided by three research questions (RQs):
RQ1: 
Where along each pathway’s WtW value chain do technological bottlenecks concentrate?
RQ2: 
How do pathways compare in lifecycle climate performance, readiness, safety/emissions control, infrastructure needs, and scalability?
RQ3: 
What cross-cutting enablers and research gaps emerge when pathways are assessed side by side?
In operational terms, these questions structure the review from pathway-specific evidence to comparative synthesis. RQ1 is addressed by mapping where bottlenecks arise along each pathway’s WtW chain; RQ2 is addressed through side-by-side comparison of indicative WtW GHG performance, technology readiness, safety and emissions control, infrastructure requirements, and scalability; and RQ3 is addressed by identifying cross-cutting constraints and enabling measures that remain visible only when the pathways are assessed jointly.

2.2. Search Strategy, Source Selection, and Evidence Synthesis

A targeted search was conducted across major academic databases (Web of Science, Scopus, ScienceDirect, IEEE Xplore) using pathway-specific and cross-cutting Boolean keyword strings. These combined pathway terms (e.g., liquid biofuel, FAME, HVO, bio-LNG, hydrogen, fuel cell, ammonia, e-methanol, battery, shore power), sector terms (e.g., shipping, marine, maritime, port), and lifecycle and systems terms (e.g., well-to-wake, lifecycle assessment, techno-economic analysis, infrastructure, bunkering, risk assessment). Search strings were iteratively refined to balance recall and precision and to ensure coverage of both onboard propulsion and shore-side supply-chain topics. In parallel, gray literature was retrieved through targeted searches of outputs from recognized bodies (e.g., IMO, classification societies, port authorities, international energy agencies, and industry consortia), when such sources provided quantitative datasets, standards context, or operational insights not yet fully represented in peer-reviewed publications.

2.3. Eligibility Criteria and Screening

Inclusion criteria required that sources (a) are explicitly relevant to maritime and/or port applications; (b) address at least one focal pathway (biofuels, LNG/bio-LNG, hydrogen, ammonia, e-methanol, electrification); (c) provide quantitative performance indicators and/or explicit discussion of technological bottlenecks, safety/emissions issues, or infrastructure constraints.
Exclusion criteria removed sources that (a) focus exclusively on land-based applications without transferable maritime insights; (b) are purely conceptual/opinion pieces without technical depth; (c) duplicate or are clearly superseded by more complete analyses.
For each included source, information was extracted into a standardized template. This template captured the (a) technology configuration and system boundaries, including WtW boundary assumptions; (b) method type, such as LCA, techno-economic analysis (TEA), engine testing, fuel-cell testing, safety/QRA, or infrastructure/grid modeling; (c) key performance indicators, where available, including WtW GHG intensity, conversion efficiency, storage density and penalties, boil-off or other losses, methane slip, NOx/N2O/NH3/formaldehyde and other unregulated emissions, durability under marine duty cycles, and thermal-runaway or other safety-critical behaviors; (d) operational context, including ship type, route or duty cycle, and port setting; and (e) the bottlenecks and mitigation strategies identified by the respective authors. The extracted variables were grouped into common bottleneck categories to improve cross-study comparability. These covered upstream production and supply-chain emissions, onboard storage and energy-density constraints, conversion efficiency and durability under marine duty cycles, safety and unregulated emissions, port and bunkering plus grid/infrastructure implications, and scalability constraints related to feedstock and renewable-power availability. Because the aim of this article is comparative bottleneck mapping across multiple fuel pathways rather than a formal PRISMA-style systematic review or meta-analysis, the evidence base was developed as a structured narrative synthesis.

2.4. Synthesis and Comparative Framework

The collected evidence was synthesized in two layers. First, a pathway-specific synthesis was conducted for each fuel or technology. Findings were organized along the WtW chain, including production, conditioning, transport, port interface, onboard storage, conversion, and, where relevant, end-of-life stages, with emphasis on where bottlenecks arise and how they interact across subsystems. A unified comparative framework was then applied to benchmark the pathways across six decision dimensions: (a) indicative WtW GHG performance, (b) local pollutant and unregulated emissions, (c) technology readiness and durability, (d) safety and regulatory maturity, (e) port and infrastructure requirements, and (f) scalability under feedstock and renewable-electricity constraints. This framework is intentionally portfolio-oriented (not a “single winner” selection tool). It is used to identify route- and vessel-specific niches, expose trade-offs between near-term deployability and long-term decarbonization potential, and surface cross-cutting needs in standards, measurement/reporting/verification (MRV), and infrastructure planning.
Unless otherwise stated, volumetric energy-density comparisons are expressed as required onboard tank volume relative to HFO on a volume basis to maintain consistent naval-architecture interpretation. The synthesis is interpretative but evidence-anchored, prioritizing quantitative comparability while explicitly tracking the assumptions that drive variability in reported results (especially in LCA and TEA studies).
In the main benchmarking tables, these variables were condensed into a standardized assumptions/boundary descriptor to ensure that headline WtW ranges and readiness comparisons remain interpretable considering upstream-energy, accounting-boundary, emissions-control, and operational-context differences across studies. The present article does not generate new primary LCA values; rather, it synthesizes and harmonizes quantitative ranges reported in the reviewed literature so that pathway-specific outcomes can be better compared under clearly stated boundary conditions.

3. Results

3.1. Biofuels

Over the past years, the biofuels most relevant to maritime decarbonization have converged around FAME (fatty acid methyl ester) bio-diesel used as bunker blends, hydrotreated vegetable oil (HVO, renewable diesel) as a higher-quality drop-in distillate substitute, and bio-methanol as an alcohol pathway that is liquid at ambient conditions but typically requires dedicated (or modified) fuel systems. Across the peer-reviewed literature, these options are repeatedly positioned as the fastest-to-deploy levers for near-term GHG-intensity reductions because they can leverage existing liquid-fuel logistics and, in many cases, existing engines, yet their ultimate contribution is constrained by feedstock sustainability, traceability, and life cycle accounting uncertainty.
Bio-LNG is also bio-based and therefore relevant to the broader biofuel landscape. However, it will be discussed separately in Section 3.2 because, after upgrading and liquefaction, it enters the methane fuel chain and shares its principal maritime bottlenecks with LNG, especially cryogenic storage, BOG management, methane slip, and LNG-type bunkering infrastructure, rather than with liquid biofuels such as FAME or HVO.

3.1.1. FAME Bio-Diesel

FAME (fatty acid methyl ester) bio-diesel refers to the fuel class used in marine compression-ignition applications, but the reviewed evidence should be interpreted across three distinct levels that are often conflated in the literature: (a) the generic FAME blend family, typically discussed in the B5-B30 range for marine practice where B5 denotes a 5% bio-diesel blend and B30 a 30% bio-diesel blend; (b) the feedstock pathway, which strongly affects life cycle GHG performance, especially when comparing waste/residue-derived FAME with crop-based FAME; and (c) the specific marine use case, such as B30 engine trials or B50 blends using used cooking oil-derived bio-diesel with MGO. Distinguishing these levels is important because operability conclusions are often transferable across blends, whereas environmental conclusions are highly pathway-specific.
A key SoA theme in recent years is that FAME is no longer discussed primarily as a generic biofuel option, but as a blend component whose feasibility hinges on managing compatibility, stability, and onboard fuel-handling constraints under modern marine fuel practice (VLSFO (very-low-sulfur fuel oil)/MGO (marine gas oil)). The literature has become markedly more specific about the operationally attractive blend window (often B5-B30 in practice, sometimes higher in controlled trials), the failure modes that matter most (sediment/precipitation, oxidation stability, water affinity, and microbial risk), and the engine-system sensitivities that determine whether FAME blending behaves like an easy win or a maintenance problem. On the fuel-chemistry side, the most visible shift is that researchers now treat blend stability with VLSFO and other residual-type fuels as a first-order technical bottleneck, rather than assuming that bio-diesel mixes well. Kass et al. [21] evaluated VLSFO with 5–20 wt% bio-diesel and used standard stability protocols (e.g., ASTM D4740 [22] spot testing) to show stable blends under test conditions while mapping how viscosity and other rheological/combustion-relevant properties change with the blend ratio. Building on that, more recent marine-focused work has even explored the idea that bio-diesel can function as a cutter fraction/dispersant to improve asphaltene stability and compatibility, explicitly tying FAME’s polarity and tendency to sludge formation risks that have been prominent since the IMO 2020 fuel transition [23]. In other words, the SoA is not just that FAME can blend; the FAME blending also interacts with VLSFO’s asphaltene–maltene balance, so stability must be demonstrated for the specific bunker and supply chain, not assumed. On the engine and operations side, peer-reviewed evidence has moved from generic diesel-engine claims to marine-relevant architectures and duty cycles, especially for two-stroke propulsion engines and practical blend levels. A notable onboard milestone was achieved by Stathatou et al. [24], who reported direct emissions measurements aboard an ocean-going dry bulk vessel operating on a 50:50 blend of used-cooking-oil bio-diesel and MGO, framing the results in both onboard and life cycle terms (highlighting how upstream pathway assumptions dominate the net climate benefit). More specifically, the literature indicates that FAME does not correspond to a single life cycle climate outcome. In this review’s comparative synthesis, drop-in bio-diesel/HVO blends span approximately 10–80% WtW GHG reduction relative to HFO, with the upper part of that range associated mainly with advanced waste- and residue-based pathways.
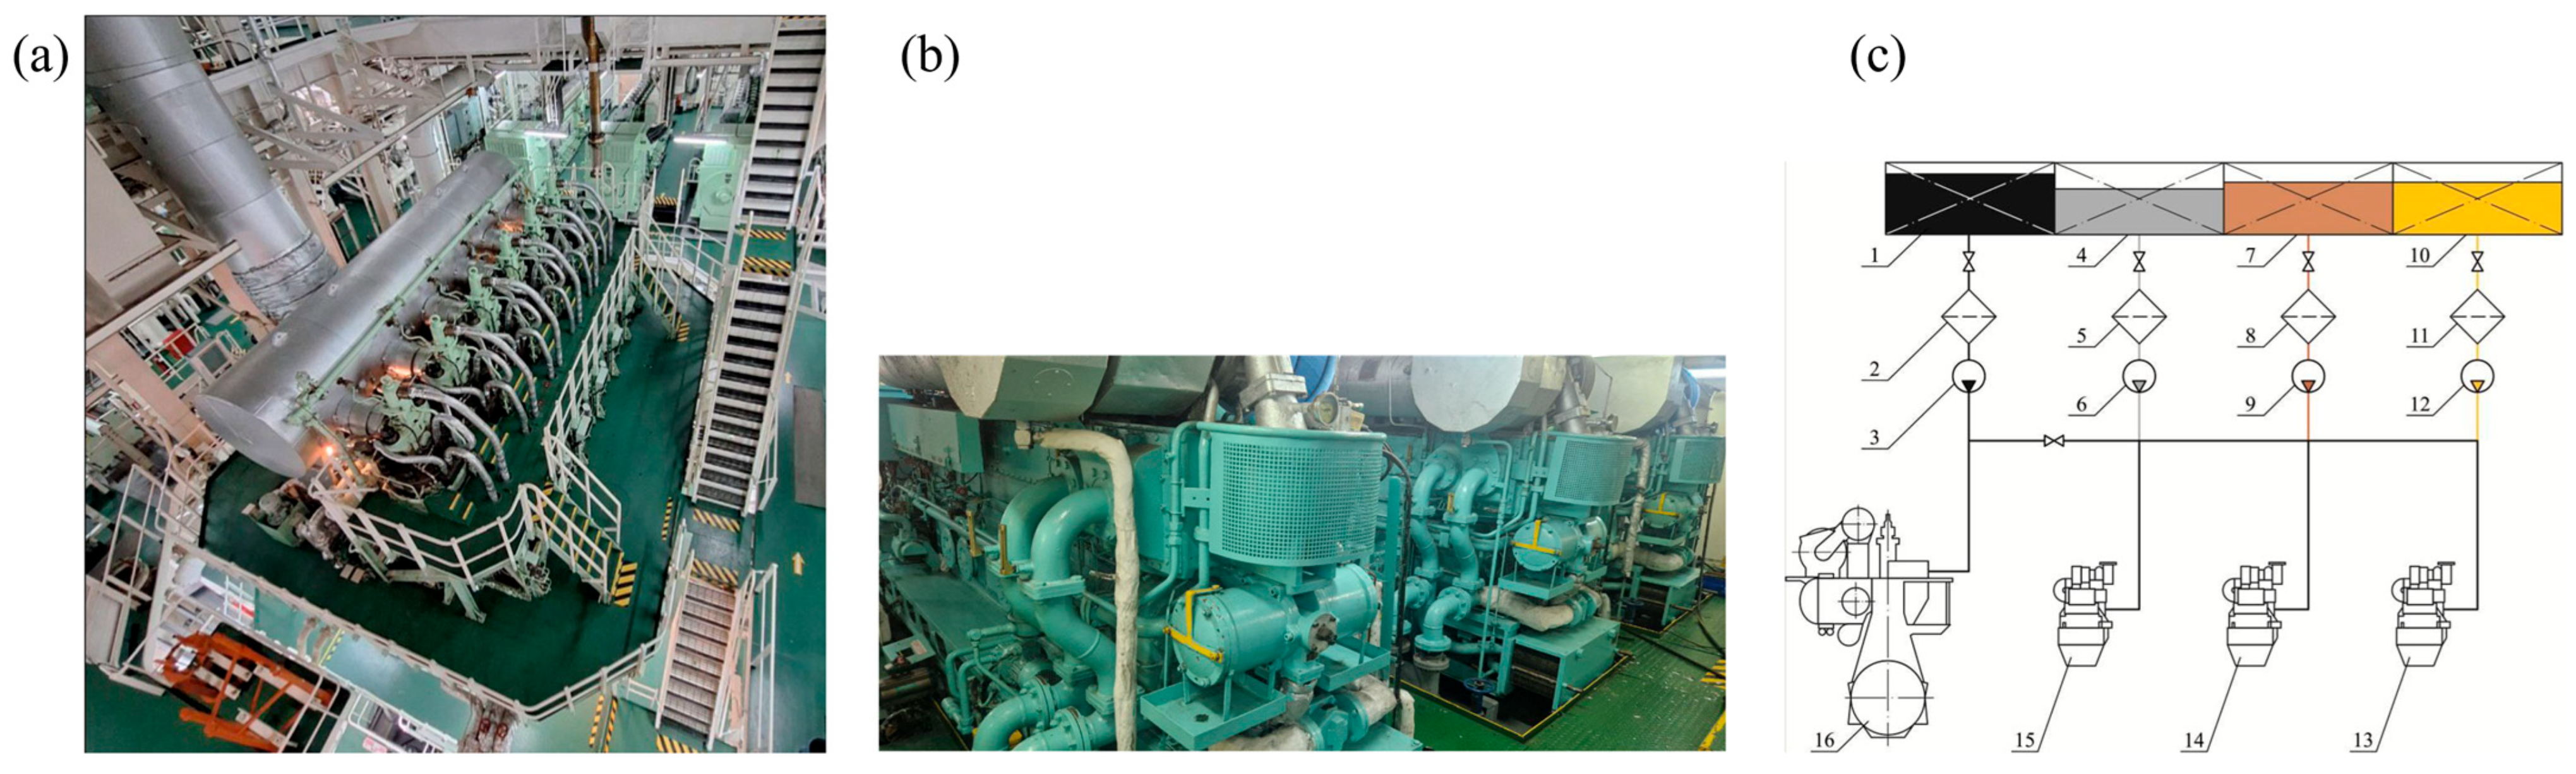
In contrast, crop-based pathways can be markedly less favorable once land-use effects and process-energy assumptions are included. For marine FAME use, the most decision-relevant distinction is therefore not only the blending ratio but also whether the methyl ester is derived from used cooking oil, other waste lipids, or dedicated crop feedstocks, since this upstream distinction can outweigh differences observed at the engine-exhaust level. The B50 used cooking oil/MGO case reported in the reviewed marine literature should therefore be read as evidence for a specific waste-based FAME pathway, not as a representative proxy for all FAME bio-diesel. Complementing this, Chountalas et al. [25] concluded that a ~30% biofuel blend can be used in electronically controlled two-stroke engines with minimal performance impact and only small NOx increases. This achievement raises the question of “How far we can push the blend?” from the viewpoint of operators, thinking beyond token blend ratios. At the medium-speed end, controlled-engine studies continue to quantify the trade-off space among the blend ratio, efficiency, and regulated pollutants. For example, Sagin et al. [26] examined marine engine operation on diesel FAME mixtures with an explicit optimization objective for blend concentration. Figure 1a–c depicts a full-scale shipboard experimental platform designed to ensure robust and representative assessment of FAME–diesel blends in marine applications. The study combines a low-speed MAN-B&W main engine operating over typical propulsion load ranges with medium-speed Daihatsu auxiliary engines supplying shipboard electrical demand, thereby capturing the operational diversity of commercial vessels. The integrated fuel system shown in Figure 1a–c allows controlled switching between heavy fuel oil, marine diesel oil, and bio-diesel blends (B10 and B30) using common tanks and supply lines, while onboard diagnostic systems continuously monitor all key parameters. This arrangement ensures that observed changes in emissions and fuel consumption arise from fuel properties rather than experimental artefacts, providing high confidence in the transferability of the results to real-world marine operations.
Figure 1a–c is included not merely as an illustration of hardware layout, but because it shows the methodological basis on which the reported FAME-blend results should be interpreted as being the same shipboard fuel architecture that is used to compare conventional and bio-diesel-containing fuels under representative marine operating conditions. In Figure 1c, the integrated fuel system should be considered the enabling element of the experiment, as it combines common storage, transfer, treatment, supply, and return functions, allowing B10 and B30 blends to be introduced into the same propulsion and auxiliary-engine environment without redesigning the ship’s fuel architecture. This is important because it reduces confounding effects and makes the comparison of emissions and performance more representative of practical marine retrofit conditions.
Field-oriented studies have also appeared, aimed at validating feasibility under real operational constraints rather than idealized lab settings [28]. The evidence, therefore, frames FAME blending less as a single fuel pathway than as a family of operationally managed options whose climate value depends on the combined effect of the blend level, storage, and fuel-management discipline, and, most importantly, feedstock pathway definition. In practical WtW terms, waste- or residue-derived FAME can deliver meaningful near-term GHG reductions for existing tonnage. In contrast, crop-based FAME requires much more caution in interpretation because land-use effects, process energy, and chain-of-custody assumptions can substantially erode or even negate the apparent advantage suggested by the tailpipe or onboard performance alone.

3.1.2. Renewable Diesel Hydrotreated Vegetable Oil (HVO)

HVO is increasingly framed as the highest-quality drop-in bio-liquid for marine diesel use, technically straightforward at the ship level, but environmentally and economically decisive at the supply chain level. From a life cycle perspective, HVO should also not be treated as a single climate-performance value. In the broader comparative synthesis developed in this review, drop-in bio-diesel/HVO pathways can deliver approximately 10–80% WtW GHG reduction relative to HFO, while advanced waste- and residue-based pathways may reach roughly 60–90% + under favorable boundary conditions. However, these values are highly sensitive to the origin of the lipid feedstock, the energy source used in hydrotreatment, the hydrogen source used for upgrading, and the treatment of land-use and allocation effects. Accordingly, the environmental performance of HVO produced from waste lipids using low-carbon hydrogen and low-carbon process energy should be explicitly distinguished from that of HVO derived from crop oils and from more carbon-intensive refining pathways. For maritime decision-making, HVO’s technical attractiveness at the ship level is comparatively straightforward, as it is a high-readiness drop-in option with favorable ignition quality and consistently lower soot and black carbon emissions than conventional diesel-like fuels. The more difficult question is environmental robustness at scale. In that respect, the critical variables are upstream rather than onboard, particularly sustainable feedstock availability, whether it is auditable, and the carbon intensity of the hydrogen and process energy used during upgrading.
In contrast to FAME, HVO is repeatedly characterized as a paraffinic, sulfur- and oxygen-free fuel whose diesel-like physicochemical properties reduce many operational frictions and tend to deliver cleaner combustion behavior (notably lower soot propensity) with minimal hardware changes, especially in distillate-type applications [29,30]. On the combustion and emissions side, recent syntheses and engine studies have converged on a consistent mechanism: HVO’s high cetane number and low aromatic content promote shorter ignition delays and more complete combustion, which tends to suppress soot and black-carbon formation relative to petroleum diesel under comparable operation. The biofuel/black-carbon-based literature for marine propulsion increasingly uses HVO as the clean-burning reference among liquid biofuels, with reviews summarizing trials and experimental studies reporting substantial black-carbon reductions under controlled conditions without obvious penalties in operability [25,31]. Experimental work beyond shipping (but still informative for the underlying physics) similarly finds lower black-carbon signals for HVO blends vs. conventional diesel across operating regimes, reinforcing the idea that the soot benefit is largely compositional rather than application-specific [32]. What has changed most in recent years is not the conclusion that HVO can run in compression-ignition engines, but the increasing insistence that the true bottlenecks sit upstream. Recent WtW comparisons emphasize that HVO is not a single climate number, since LCA outcomes depend strongly on the feedstock choice (waste lipids vs. dedicated crops), process energy, hydrogen source, allocation/crediting assumptions, and certification boundaries, so the same ship-level drop-in story can map to very different well-to-wake GHG intensities. This variability in life cycle outcomes is a recurring conclusion in multi-fuel comparative LCAs for maritime energy, where bio-pathways can look excellent on GHG emissions but only under specific, auditable pathway definitions [33,34].
In parallel, techno-economic/environmental assessments that explicitly model ships (rather than generic energy systems) treat HVO-type liquids as operationally attractive but constrained by the sustainable supply potential and cost of compliant volumes, which ultimately limits how far HVO can scale in deep-sea bunkering compared with electricity-derived fuels and other long-run options [35]. HVO positions as a high-readiness, low-disruption decarbonization lever, particularly valuable for near-term compliance and for segments that prioritize retrofit simplicity, while there is repeated warning that its long-term role is governed more by credible, scalable, and verifiable low-carbon supply chains than by engine integration. HVO appears in the literature as both a practical here-and-now emissions lever (especially for particulate/black-carbon reduction narratives) and a fuel whose climate value is only as strong as the upstream pathway documentation that accompanies each ton bunkered.

3.1.3. Bio-Methanol

Bio-methanol has become the liquid biofuel most often framed as transition-compatible, since it behaves like a conventional liquid in storage and bunkering, aligns with a rapidly maturing methanol-engine ecosystem, and crucially, its climate value can be very high if the upstream carbon is truly biogenic and sustainably sourced. The literature increasingly treats bio-methanol less as a marginal biofuel blend and more as a strategic liquid vector that can scale operationally faster than cryogenic hydrogen and is less infrastructure-disruptive than ammonia, while still offering a credible route toward very low WtW emissions when produced from residues, wastes, or tightly governed biomass supply chains [11,36].
Technically, several works continue to reinforce why methanol, whether fossil, bio-, or e-methanol (Section 3.5), fits shipping’s operational logic, since it is liquid at ambient conditions, simplifies storage relative to LH2, and avoids many of the extreme handling/safety complexities associated with ammonia. But how can the combustion modes and after-treatment be optimized to manage methanol-specific emissions while maintaining high efficiency? A recurring finding is that methanol can substantially reduce SOx and PM/soot relative to heavy fuels and can help with NOx compliance depending on the combustion strategy. Still, it introduces unregulated species, most notably unburned methanol and formaldehyde, that are increasingly at the center of performance- and compliance-related discussions. Recent peer-reviewed syntheses explicitly analyze the mechanisms of formation for these unregulated emissions and treat oxidation catalysts and calibration strategies as practical mitigation levers, which is important because it shifts the discussion from methanol’s drawbacks to its solvable engineering requirements [37,38]. What distinguishes bio-methanol in the decarbonization literature is not the shipboard hardware, because that argument is largely shared with green methanol more broadly, but the upstream sustainability and boundary conditions that determine whether it is genuinely low-carbon at the system level. Here, in recent years, the argument has become clearer, as LCA studies of bio-methanol’s WtW benefits are highly sensitive to the feedstock choice, land-use impacts, and system boundaries, and it is more explicit that biogenic is not a sufficient label without land-use safeguards and transparent accounting. A recent perspective focused specifically on bio-methanol for marine use places land-use sustainability at the center of the pathway’s credibility, effectively reframing the main bottleneck as sustainable biomass availability and governance, rather than ship compatibility [36]. In parallel, broader reviews of LCA studies for marine alternative fuels emphasize persistent variability in assumptions and reporting that can materially swing comparative outcomes, an issue that matters acutely for bio-methanol because upstream choices dominate the WtW result [11]. The emerging consensus, then, is nuanced but actionable, centered on bio-methanol being repeatedly positioned as one of the most operationally ready low-carbon fuels for shipping, particularly attractive for early adoption because it leverages conventional liquid logistics and a growing base of methanol-capable ships and bunkering initiatives. At the same time, the SoA treats its long-run role as volume-constrained unless production can be expanded from genuinely sustainable feedstocks (residues/wastes or carefully governed biomass) and unless certification and life cycle accounting become robust enough to avoid paper decarbonization.

3.2. Methane-Based Liquefied Fuels: LNG and Bio-LNG

Bio-LNG is bio-based in feedstock origin, but it is treated together with LNG in this section because the decisive maritime bottlenecks are shared after liquefaction. Once bio-methane is upgraded and liquefied, Bio-LNG becomes chemically interchangeable with fossil LNG and therefore follows the same shipboard and port-side constraint structure: cryogenic storage, BOG management, bunkering logistics, engine-platform dependence, methane slip, and methane-oxidation control. For that reason, the present review organizes Section 3.2 around the methane-based liquefied-fuel pathway, while retaining the distinction that LNG and Bio-LNG differ fundamentally in upstream production route, sustainability, and life cycle carbon accounting.
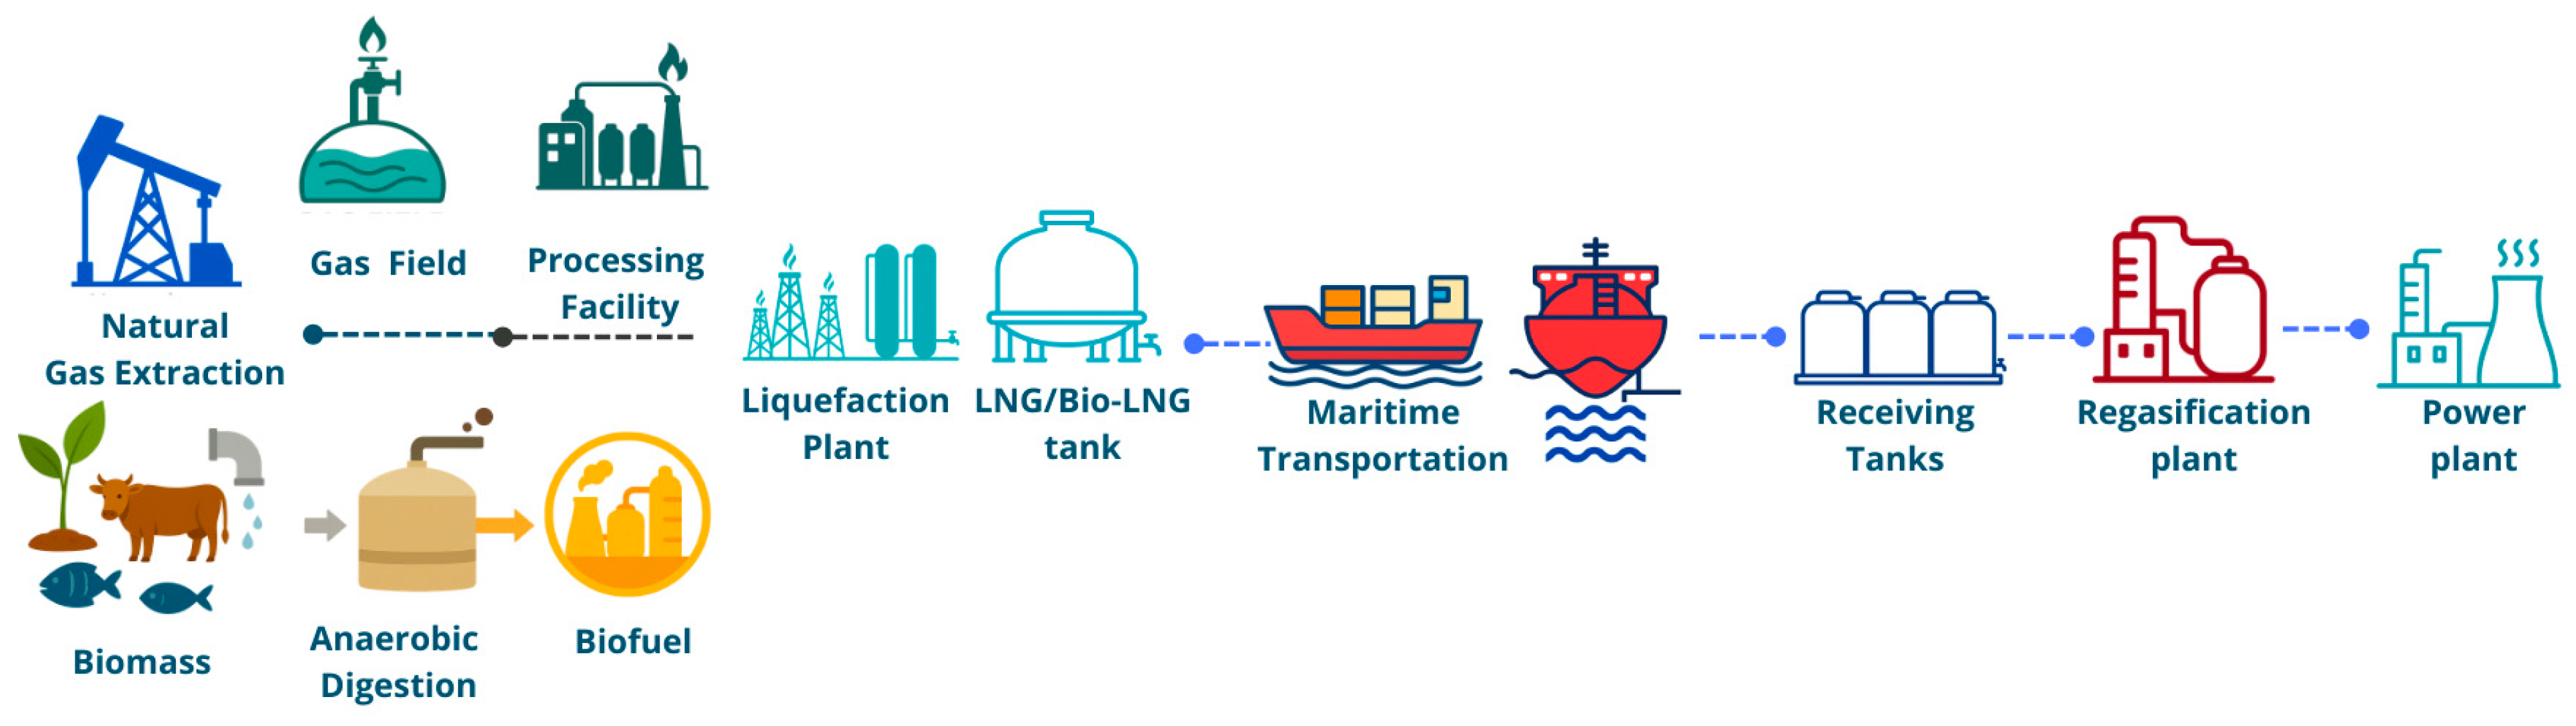
The recent peer-reviewed literature identifies multiple technological limitations across the LNG/Bio-LNG value chain, from extraction to end use, hindering scale-up and decarbonization [39]. Figure 2 is included not merely to depict the LNG/Bio-LNG supply chain, but to clarify why the present review treats these fuels as a single methane-based liquefied-fuel pathway from a maritime-technology standpoint. For this review, Figure 2 should not be read as shifting the analysis away from marine propulsion, but as clarifying where the shipping segment connects to the wider system. The marine-relevant bottlenecks begin once LNG or Bio-LNG enters the liquefied-methane chain used for storage, transport, bunkering, and onboard conversion. From that point onward, the critical issues are cryogenic storage, boil-off gas management, transfer logistics, engine technology, and methane slip control. The broader pathway is shown because differences in upstream origin and processing remain important for life cycle carbon accounting, even when shipboard use is technically similar. Figure 2 aims to map the points at which the two pathways differ and those at which they become functionally identical. The natural-gas route begins with extraction and gas processing, whereas the bio-based route begins with biomass conversion and bio-methane upgrading; however, once the gas is liquefied, both pathways enter the same cryogenic handling chain and therefore share the same shipboard and port-side bottlenecks. The key interpretive point is that this convergence after liquefaction is what makes LNG and Bio-LNG comparable in shipping. Storage at approximately −162 °C, BOG formation, terminal transfer, dual-fuel engine compatibility, and methane-slip mitigation are common constraints for both fuels. By contrast, the main difference between them lies upstream, in feedstock origin, trace-impurity control, and life cycle carbon accounting. Figure 2, therefore, supports one of the manuscript’s broader arguments related to the climate value of LNG/Bio-LNG, which depends not only on fuel origin but also on how effectively methane emissions and cryogenic losses are controlled across the shared maritime part of the value chain.
The natural gas pathway begins with extraction from underground reservoirs, followed by gas processing to purify and prepare it for liquefaction. Concurrently, the biofuel pathway begins with biomass, including organic waste and residues, which are processed through anaerobic digestion to produce biofuel. Both pathways converge at the LNG/Bio-LNG liquefaction plant, where gases are cooled to produce liquefied methane, which is stored in LNG/Bio-LNG tanks. The liquefied gas can be used to power or transported via maritime shipping, using specialized vessels to LNG/Bio-LNG receiving terminals. Finally, the LNG/Bio-LNG is supplied to power plants for electricity generation, completing the low-carbon energy supply chain. Al-Kuwari et al. [40] present an integrated life cycle sustainability assessment of UK electricity generation from Qatari LNG, combining multi-regional input–output LCA, detailed process simulation, and a bespoke LNG shipping model across 11 supply-chain stages. The authors demonstrated that gas extraction and power plant operation dominate the burdens, with extraction accounting for ~96% of total life cycle energy use and combustion accounting for ~67% of GHG emissions. At the same time, regasification and the Sulfur Recovery Unit/Tail Gas Treatment Unit emerge as key hotspots for NOx, PM2.5, land-use, and human-health impacts. The analysis also highlights strong social and economic concentration in the shipping segment, which provides most of the employment and labor income, and in downstream power generation and LNG handling, which drive most costs. Sensitivity analysis identifies regasification, shipping, and liquefaction/LNG recovery as priority intervention points, and the authors conclude that efficiency improvements, carbon capture and storage deployment, cold-energy recovery, and better integration with renewables are essential if LNG and future bio/e-LNG variants are to support net-zero pathways rather than lock in high-impact infrastructure.
LNG is a cryogenic mixture dominated by methane (typically > 90 mol%) with variable fractions of ethane, propane, and nitrogen, depending on the gas field of origin and processing. These minor components affect key fuel properties, such as the Wobbe index and methane number, which are relevant to engine behavior [41,42]. At standard pressure, LNG is stored near methane’s normal boiling point (≈−162 °C), so even small heat ingress drives vapor generation designated by boil-off gas (BOG), whose rate and composition evolve with tank design, insulation, and the relative volatility of light components, making BOG both a thermodynamic inevitability and a central handling consideration [43,44]. Because LNG’s chemistry is methane-rich, its combustion tends to yield low particulate and SOx by design, while nitrogen oxides and unburned methane (slip) depend on mixing, temperature, and catalyst effectiveness in the low-temperature oxidation regime [45].
A more sustainable approach is Bio-LNG, which is the liquefied form of bio-methane, a purified stream obtained by upgrading raw biogas (e.g., from anaerobic digestion or landfill gas) that initially contains ~50–70% CH4 with the balance mainly CO2 and trace amounts of H2S, NH3, moisture, and volatile siloxanes [46,47]. Upgradation techniques aim to remove CO2 and contaminants using absorption (e.g., amines), adsorption (e.g., pressure swing adsorption), membranes, or cryogenic separation. These routes’ separation chemistry sets residual impurity levels that matter for downstream liquefaction, materials compatibility, and engine deposits [48,49]. Recent reviews also highlight power-to-gas methanation (Sabatier process: CO2 + 4 H2 ⇌ CH4 + 2H2O) as a complementary pathway to bio-methane, with Ni-based catalysts and tailored supports improving CO2 activation and methane selectivity at lower temperatures, enabling coupling to biogenic or captured CO2 sources [50,51].
Critically, once upgraded and liquefied, Bio-LNG is molecule-for-molecule methane and is therefore chemically interchangeable with fossil LNG in engines, tanks, and pipelines. The differences arise not in combustion chemistry but in trace-impurity fingerprints and upstream carbon accounting [52]. This is why Bio-LNG is discussed in the present review alongside LNG rather than in the liquid-biofuel subsection. From the standpoint of onboard technology and bunkering infrastructure, it behaves as part of the methane pathway, even though its renewable character is determined upstream. Siloxanes and sulfur species must be reduced to trace levels because their oxidation products form abrasive silica and corrosive acids, and recent work has reported effective adsorption/cryocondensation schemes to meet fuel-grade specifications [53,54].
Across both LNG and Bio-LNG, cryogenic thermodynamics govern storage and transfer, with multi-component phase behavior controlling preferential evaporation of nitrogen and light alkanes, while re-liquefaction or controlled use of BOG mitigates safety, loss, and climate concerns [44]. LNG and its renewable counterpart Bio-LNG are increasingly used in maritime operations as methane-based fuels that cut SOx and particulate emissions and can lower NOx with appropriate calibration, while leveraging the large installed base of dual-fuel engine platforms and existing cryogenic infrastructure [39,55]. Their net climate value, however, is highly sensitive to methane management across the chain, with recent life cycle reviews finding that well-to-wake outcomes are dominated by engine slip and upstream leakage assumptions [10]. As an example, engine studies consistently show higher slip in low-pressure dual-fuel concepts and substantially lower slip in high-pressure direct-injection architectures, underscoring that platform choice and control at a low load are pivotal for GHG performance [56,57]. Complementing combustion improvements, methane-oxidation catalysts tailored for lean, humid marine exhausts have achieved >90% conversion in recent tests, signaling a maturing after-treatment pathway to mitigate residual slip [58,59]. For Bio-LNG, the same tank-to-wake physics apply; likewise, the life cycle benefits depend on sustainably produced bio-methane with tightly controlled upstream emissions and credible accounting [10,39].
Considering transport and storage across carriers, terminals, and ships, the BOG effect is thermodynamically inevitable. Design papers and reviews show that the insulation quality, maximum allowable working pressure, and reliquefaction/recompression logic are decisive for loss minimization and safety [60,61]. For LNG-fueled ships, dynamic BOG handling strategies (e.g., use in engines, reliquefaction, or recompression) reduce the venting risk and protect the climate performance. Recent studies propose a higher efficiency associated with small-scale reliquefiers and smarter control integration with dual-fuel engines [61].
Regarding bunkering and port interface operations, the risk-assessment literature on LNG bunkering (ship-to-ship and shore-to-ship) identifies hose integrity, emergency shutdown logic, and exclusion-zone management as the primary contributors to individual/societal risk. Additionally, quantitative studies provide data-driven guidance for terminals planning high-throughput operations [62,63]. Recent advances in methods and data support more consistent quantitative risk assessment (QRA) inputs (e.g., release frequency, dispersion, ignition), enabling safer scaling of multi-lane bunkering while maintaining acceptable risk contours at legacy quays [63].
For onboard conversion, the key comparison is not generic engine performance but methane-slip behavior and its effect on tank-to-wake GHG emissions. Recent measurements show that low-pressure dual-fuel engines tend to exhibit substantially higher methane slip, especially at a low load and during transient operation, whereas high-pressure direct-injection concepts report markedly lower slips under comparable marine-duty conditions [42,64]. At the broader life cycle level, recent reviews show that these engine-out differences, together with upstream methane leakage, strongly condition the overall WtW climate performance of LNG/Bio-LNG pathways [10]. Real-world ship and lab campaigns confirm that slip is highly load-dependent and that improving control strategies can lower emissions, but low-pressure dual fuel at a low load remains challenging [65,66]. High-pressure dual-fuel platforms consistently achieve order-of-magnitude lower slip, strengthening their role in deep-sea duty where methane management is critical [67]. An after-treatment breakthrough has been dedicated to methane oxidation catalysts formulated for lean, humid, sulfur-tolerant marine exhaust, which now demonstrate >90–95% conversion in engine-relevant conditions and on-board trials, addressing the central tank-to-wake uncertainty for LNG/Bio-LNG [68]. Recent catalysis reviews clarify low-temperature kinetics, deactivation pathways, and regeneration strategies, guiding system placement (pre/post-turbo), and monitoring to maintain conversion in service [58,69]. Optimization studies link speed policies, engine loading, and piloting strategies to annualized methane slip, showing meaningful reductions from operational measures even before hardware retrofits, particularly valuable for existing low-pressure dual-fuel fleets [70]. Converging shipboard measurement protocols (e.g., Fourier Transform Infrared Spectroscopy/Non-Dispersive Infrared and harmonized methods) enable credible tracking of the catalyst effectiveness and operational improvements as part of emerging MRV (monitoring, reporting, and verification) regimes [68]. In terms of hybridization and auxiliary conversion, solid oxide fuel cell (SOFC)-hybrid propulsion architectures can improve electrical efficiency with methane-rich fuels (including Bio-LNG), reducing fuel throughput and slip exposure for given service profiles. Recent marine-focused studies detail integration layouts and performance [71].
Table 1 summarizes peer-reviewed quantitative evidence on methane slip in marine LNG dual-fuel engines, organized by engine concept (low-pressure dual uel (LPDF) vs. high-pressure dual fuel (HPDF)), operating load, and measurement approach. When available, slip is reported as brake-specific factors (g CH4/kWh) from onboard campaigns, and for cases where onboard factors are scarce, particularly for HPDF, the table also includes plume-based ΔCH4/ΔCO2 ratios as a discriminator. This format highlights both the load sensitivity of methane slip and the spread across studies, providing a transparent basis for cross-technology comparison and subsequent WtW analysis.
Across the value chain, LNG/Bio-LNG offers air-quality benefits and infrastructure compatibility, but climate credibility centers on four variables, in particular: (a) origin-specific WtT data and tight upstream methane management, (b) engine platform choice favoring high-pressure dual fuel (where feasible) and load-aware control on low-pressure dual fuel, (c) deployment of proven methane oxidation catalyst after-treatment with in-use monitoring, and (d) BOG-smart ship/terminal design and operations, plus sustainability-vetted bio-methane and robust mass-balance accounting for Bio-LNG claims. When these are in place, recent LCAs show a competitive WtW performance; nevertheless, when they are not, methane’s potency can outweigh CO2 gains.
Ejder et al. [74], using noon-report data from 11 voyages on an 81k DWT bulker, found that LNG CO2 cut cumulatively by ~27–30% vs. VLSFO/MGO and reduced fuel use at a comparable power, improving the ship’s CII from E-C on oil fuels to A under the LNG scenario. Yet CII performance is highly sensitive to operations (long port/anchorage time degraded ratings on voyages 10–11), and a decision-tree model (≈99% test accuracy) judged that LNG aligned with IMO-2050 pathways only ~33% of the time, thus supporting the view that LNG is a transition option into the mid-2030s rather than a standalone 2050 solution.
Comparative LCA finds that methane-based marine fuels can deliver near-term WtW benefits vs. oil fuels if methane slip in engines is minimized and upstream leakage is tightly managed (as discussed previously). Under those conditions, Bio-LNG pathways (from sustainable biogas/biomass) often outperform fossil LNG and are competitive with several e-fuels based on today’s knowledge [75]. On the supply side, recent reviews conclude that bio-methane production is scaling but remains finite and regionally constrained; consequently, Bio-LNG’s role is significant but bounded by sustainable feedstock availability and the need for a rigorous chain-of-custody/MRV for methane [76,77]. By contrast, hydrogen’s marine readiness is improving yet still limited by the storage volume/BOG for LH2, bunkering/safety standards, and fuel-cell durability/cost, with techno-economic assessments indicating that competitiveness against drop-in liquids will depend on further cost declines and port integration over the next decade [78,79].
Taken together, the literature supports a sequencing in which Bio-LNG leverages existing LNG engines and infrastructure to cut GHGs and air pollutants now (provided methane is tightly controlled), while hydrogen (direct or via derivatives) scales toward broader competitiveness and profitability [10].

3.3. Hydrogen as Energy Vector

Hydrogen is increasingly framed as a versatile energy vector produced from varied primary sources capable of linking hard-to-electrify sectors with low-carbon energy supplies [80]. Recent reviews highlight its system value for balancing variable renewables and decarbonizing applications such as high-temperature heat, long-duration storage, and heavy transport, while noting that end-use choices should be selective and evidence-based [81,82,83]. Cost remains the central constraint, but contemporary meta-analyses and techno-economic studies indicate falling trajectories driven by cheaper renewables and rapid electrolyzer development, suggesting that gaps with fossil-based hydrogen will narrow over time. At the same time, materials and infrastructure challenges, in particular, safety, storage (compressed, liquefied, and solid-state), and compatible pipelines/tanks, are active areas of research with clear trade-offs across energy efficiency, safety, and scalability. A recent review finds that hydrogen fuel cells and hybrid systems can cut GHG emissions by up to 90% and significantly reduce NOx and particulate matter, while also improving energy efficiency, especially when combined with renewable sources. At the same time, it identifies major barriers: high costs for green hydrogen, limited refueling and bunkering infrastructure, safety, regulatory challenges, economic viability, and public acceptance, while exploring emerging solutions such as cheaper electrolysis and novel materials (e.g., Multi-Organic Frameworks or advanced hydrides) [84].

3.3.1. Upstream Production and Life Cycle Boundary Conditions

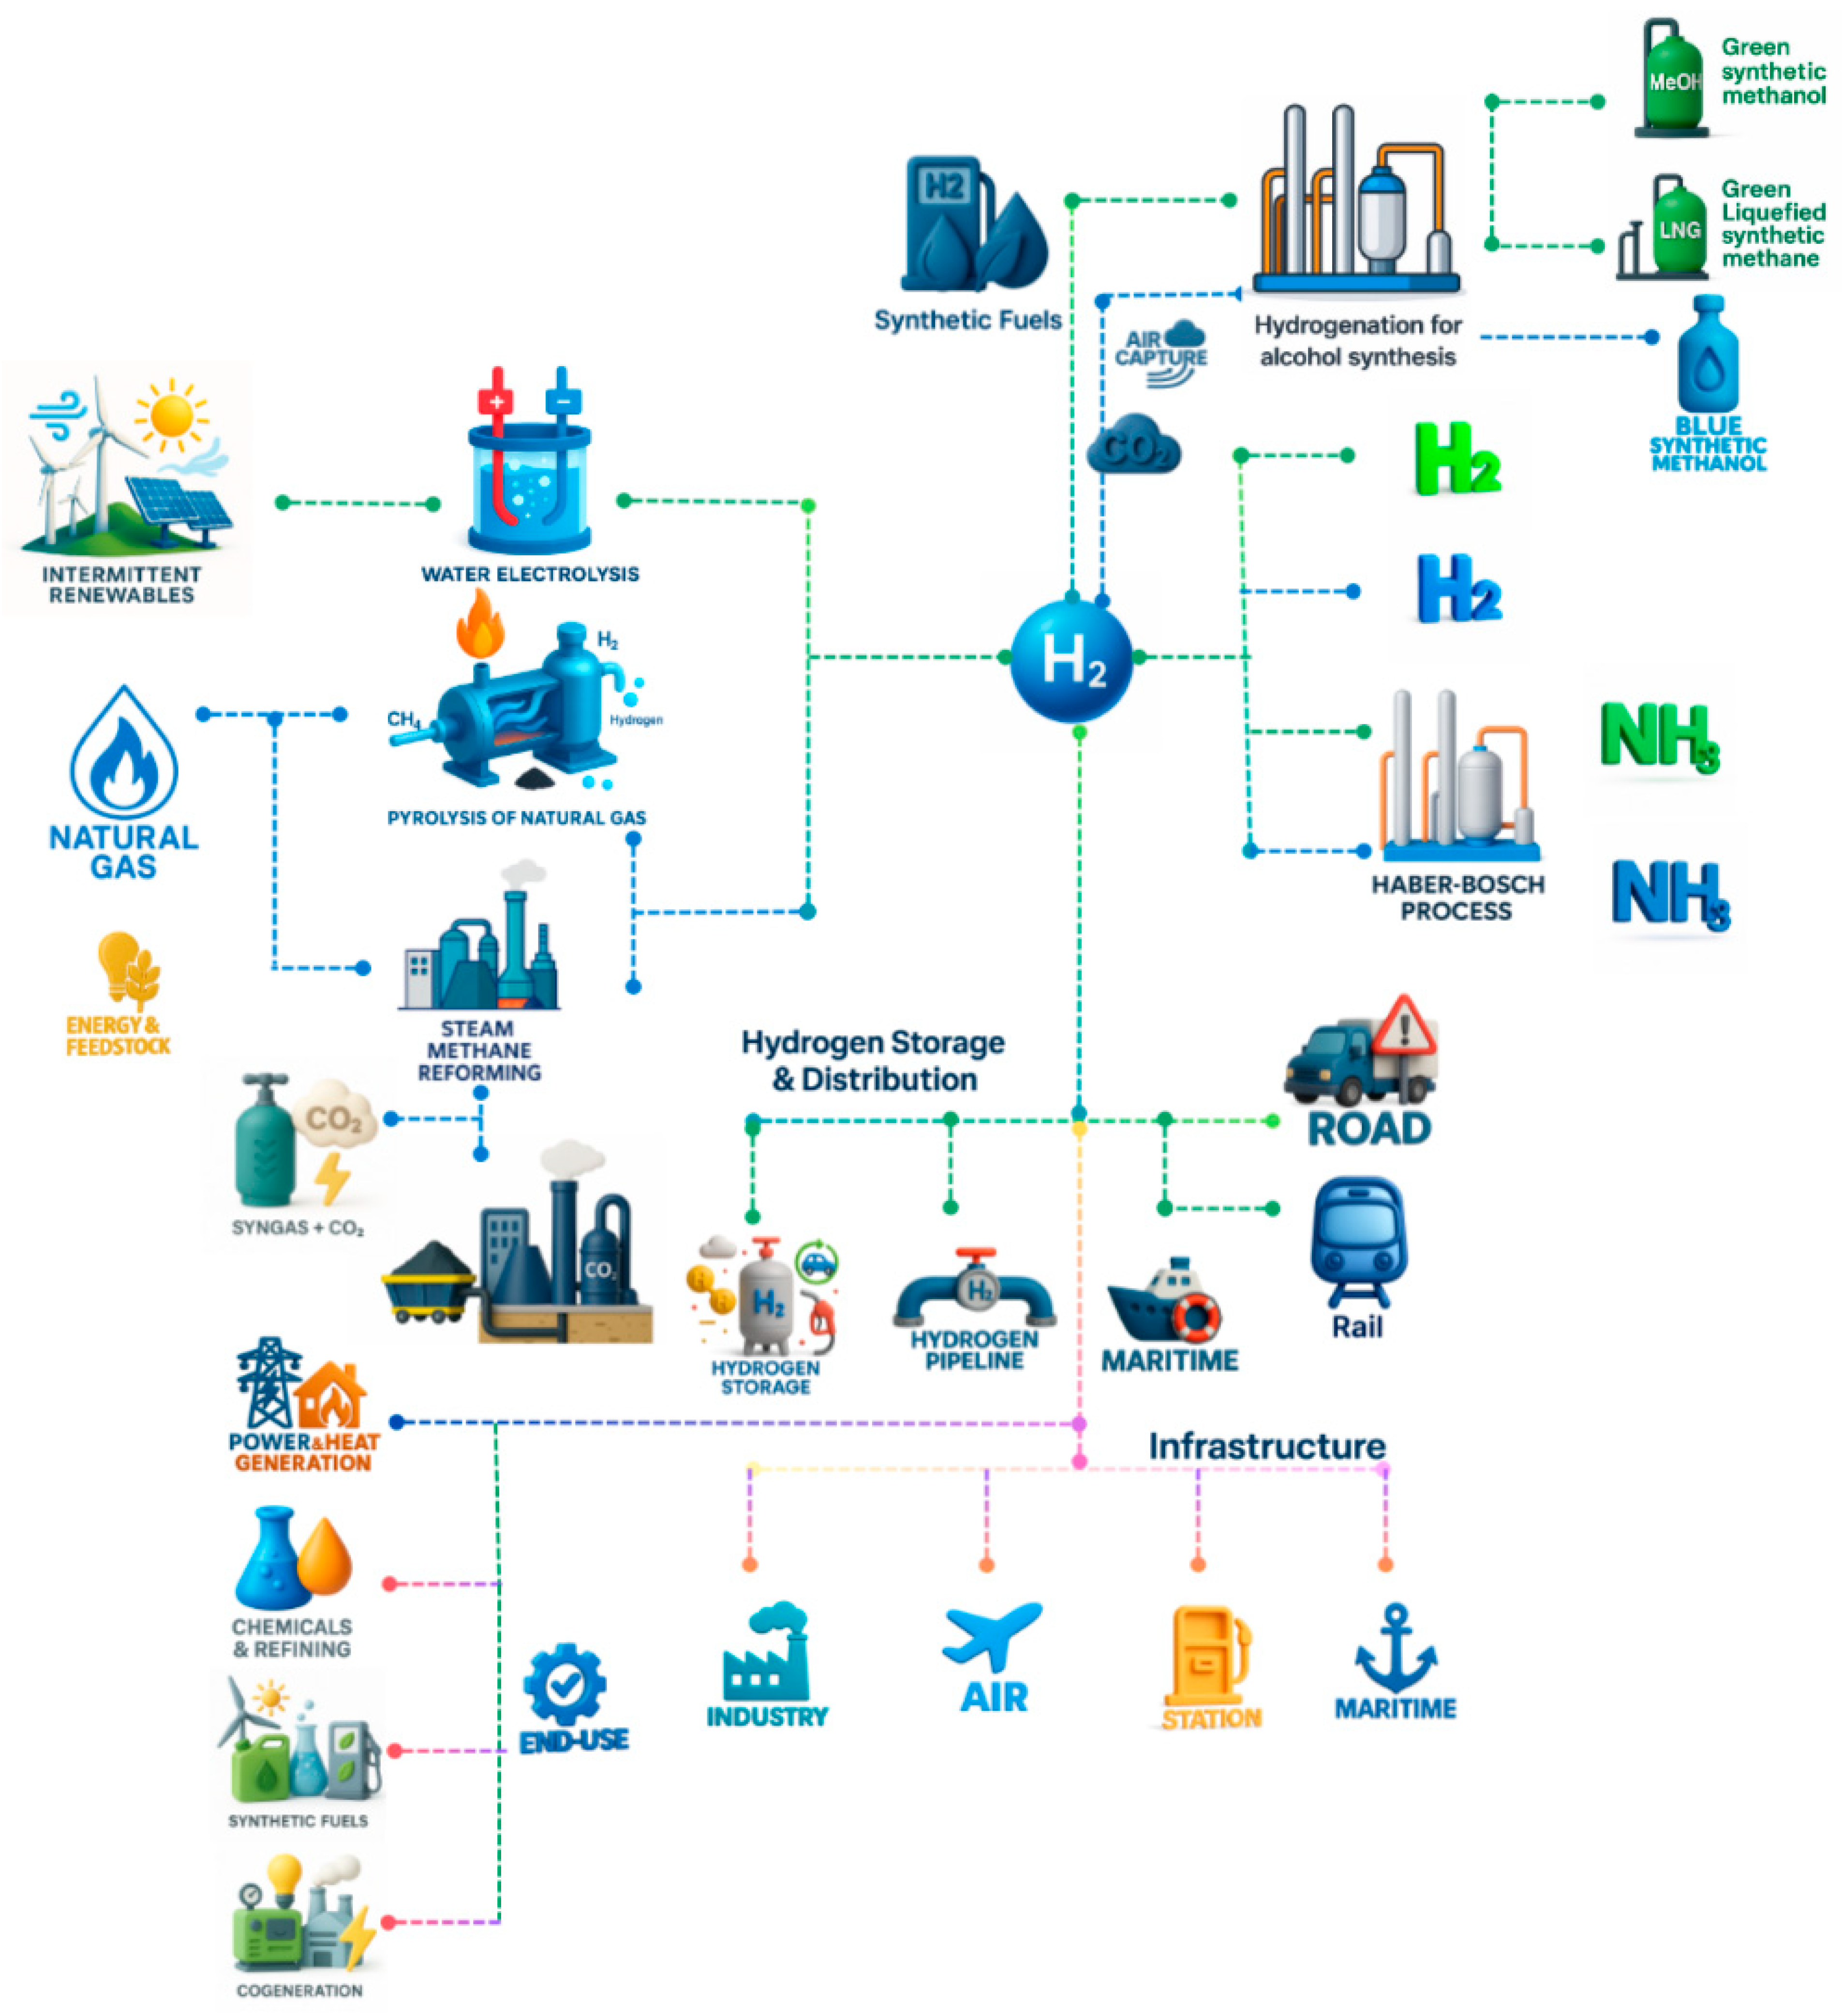
Figure 3 should be interpreted as a systems map of hydrogen, not a linear production diagram. Its purpose in this review is to show that hydrogen’s feasibility for shipping is shaped by a tightly coupled chain that extends from the primary energy input to onboard use. Figure 3 also links renewable-electricity and natural-gas routes to hydrogen production, then follows the fuel through conditioning, storage, transport, and, where relevant, conversion to ammonia or methanol. Considering these downstream stages matters because hydrogen’s delivered cost and effective GHG performance are not determined solely by the electrolyzer or reformer; they are co-determined by the utilization rate, electricity carbon intensity, water and purification requirements, conditioning penalties, transport losses, and end-use efficiency. In interpretive terms, Figure 3 highlights why hydrogen is often attractive in principle but difficult in practice for maritime use. Each interface in the chain introduces a distinct penalty or constraint: low-capacity-factor electrolysis degrades both economics and life cycle performance; compression and liquefaction impose major energy overheads; storage and transport raise material and boil-off challenges; and the final shipboard value depends on whether hydrogen is used directly, converted to a derivative fuel, or consumed in a fuel-cell or combustion system. Figure 3, therefore, supports the manuscript’s central claim that hydrogen’s decarbonization potential is real, but only if upstream energy supply, conditioning losses, infrastructure, and onboard integration are treated as one coupled system. Hydrogen’s entire value chain is complex because of production costs and climate value center on electrolyzer utilization, electricity carbon intensity, and water/purity constraints, with recent system reviews showing that low-capacity-factor electrolysis rapidly degrades both economics and well-to-wake performance [85]. Additionally, hydrogen’s value chain is a tightly coupled system in which production, conditioning, transport, storage, and end-use performance co-determine both the cost and climate value, as recent reviews synthesize across electrolysis, reforming with carbon capture and storage (CCS), and sectoral demand linkages [86].
On the supply side, peer-reviewed assessments emphasize that electrolyzer CAPEX, utilization, electricity carbon intensity, and water sourcing/purity (incl. deionization) dominate “green H2” cost and life cycle results, while low-emission output remains a small share of global hydrogen today [86,87].

3.3.2. Onboard Storage, Conditioning, and Transport Penalties

Conditioning choices impose large, physics-driven penalties: compression increases delivery energy and material stress, while liquefaction demands >10 kWh kg−1 and careful ortho-para conversion management to limit BOG, a key driver of logistics losses [88]. For transport, pipeline repurposing/newbuild is attractive for scale but constrained by hydrogen embrittlement, permeation, and weld/heat-affected-zone behavior in steels under high-pressure gas [89,90]. Bulk shipping solutions (LH2, ammonia, liquid organic hydrogen carrier) must also manage cryogenic heat ingress, handling, and terminal integrations, with recent analyses quantifying how insulation design and transfer procedures govern losses and safety [88,91]. End-use conversion performance (proton-exchange membrane fuel cell (PEM)/SOFC stacks, turbines, engines) counts for fuel purity, transients, thermal/water management, and durability. Additionally, hybridization and co-design of the operating strategy are repeatedly identified as levers to protect efficiency and lifetime [86]. System-level reviews stress that certification (guarantees of origin), cradle-to-gate LCA conventions, and measurement/verification of losses (including liquefaction and BOG) are as decisive as hardware in determining credible “low-carbon” claims across the value chain [92].
Hydrogen technology also relies on batteries to buffer transients and regenerative energy, letting fuel cells run near their efficient sweet spot, thereby improving battery power density, thermal safety, and cycle life, directly cutting hydrogen consumption, downsizing stacks, and extending durability [93]. Upstream and at terminals, improved stationary and onboard batteries smooth renewable inputs for electrolysis, shave peaks for compressors/cryo pumps, and backstop safety systems, lowering the delivered cost of green hydrogen and simplifying safe integration across the value chain [94]. Hydrogen’s appeal at sea is clear: zero CO2 at the point of use and a maturing stack of propulsion options, but the past five years of peer-reviewed work portray a technology family whose viability centers on solving storage, safety, durability, and infrastructure at a maritime scale [95,96]. The most persistent bottleneck is volumetric density involving compressed H2, which severely penalizes the tank volume, while LH2 improves density at the cost of cryogenic complexity, BOG management, and insulation mass/space [97,98].
Table 2 provides a side-by-side comparison of high-pressure compressed hydrogen (CGH2, nominally 700 bar/70 MPa at near-ambient temperature) and liquid hydrogen (LH2, nominally ~20 K near 1 bar) using a consistent set of system-relevant metrics.
Table 2 compares high-pressure compressed hydrogen (CGH2, nominally 700 bar/70 MPa at ~288–300 K) with liquid hydrogen (LH2, nominally ~20–20.3 K near 1 bar) across thermophysical performance, energy overheads, system implications, and operational/technology constraints. It shows that LH2 has a substantially higher volumetric density (~70.8–71.0 kg/m3) than CGH2 at 700 bar (~39–40 kg/m3), implying a more compact storage volume for the same hydrogen mass, but at the cost of a much larger process energy penalty for liquefaction (typically ~11.9–15 kWh/kg, ~35–45% of lower heating value) vs. compression to 700 bar (often ~1.7–6.4 kWh/kg, with a lower theoretical bound around ~1.35 kWh/kg depending on inlet pressure and idealization). Table 2 also contrasts system-level consequences, with CGH2 tending toward heavier, bulkier pressure vessels and higher high-pressure leakage/permeation risks. At the same time, LH2 shifts the challenge to cryogenic tank/insulation performance, boil-off losses, and cryogenic hazards, then consolidates the dominant chemical/technological bottlenecks, notably hydrogen material interactions and sealing/thermal management for CGH2, and vacuum-jacket integrity, boil-off/reliquefaction/venting, and ortho para conversion heat management for LH2, with an observation/reference column intended to anchor each entry to peer-reviewed sources. Accordingly, it is emphasized that the CGH2–LH2 choice is not a simple density comparison but a ship-integration trade-off among onboard volume, conditioning energy, and system complexity. CGH2 avoids cryogenic equipment and boil-off management, but its low volumetric density and high structural mass make it difficult to scale beyond short-range or lower-energy-duty applications. LH2 approximately doubles the hydrogen volumetric density relative to 700-bar storage, making it more credible for routes where the tank volume is the binding constraint; however, this advantage is offset by a much larger upstream energy penalty for liquefaction, persistent boil-off, insulation requirements, and added complexity in bunkering and onboard safety management.
Marine design studies show that the LH2 tank geometry, vacuum-insulation layout, and cryogenic piping placement strongly influence heat ingress and BOG, with optimized Type-C concepts and vacuum-cold shields reducing losses but not eliminating them [112]. Recent reviews of LH2 transfer and storage highlight remaining gaps in low-loss couplings, cooldown procedures, and standardized BOG utilization routes (e.g., recompression, fuel cell consumption), all of which are critical during port calls and bunkering [113]. Large-range case designs demonstrate feasibility for LH2-fueled ships but acknowledge payload/arrangement penalties and the need for redundant safety zoning and ventilation in H2 spaces [114].

3.3.3. Conversion Pathways and Propulsion Integration

On the conversion side, PEM fuel cells dominate early deployments thanks to their high-power density and fast transients, but durability under marine cycling (e.g., start–stop, load-following, salt mist) and impurity tolerance (e.g., humidified H2, trace N2/air) remain prime concerns for OPEX [115]. The recent literature targets the stack lifetime by improving membranes/catalysts, optimizing humidification/thermal control, and hybridizing with batteries to buffer transients, thereby reducing fuel consumption and extending the stack life in realistic duty profiles [115,116]. SOFCs offer high electrical efficiency and multi-fuel flexibility (including H2-rich streams), with promising integration studies for base-load propulsion, though the trade-offs include higher operating temperatures, thermal cycling limits, and system mass [117]. A parallel track explores hydrogen internal combustion engines (H2-ICEs) to leverage existing engine platforms. Peer-reviewed syntheses report progress on pre-chamber ignition, backfire mitigation, and NOx control, though brake thermal efficiency and after-treatment robustness under marine loads still need validation [118]. From an energy-systems view, direct H2 use in fuel cells minimizes conversion steps and can require less renewable electricity per nautical mile than indirect carriers, but only if storage/BOG losses and safety-driven spacing do not erase the advantage in practice [97]. Reviews comparing hydrogen carriers conclude that while LOHCs/solid carriers ease handling, their hydrogenation/dehydrogenation penalties, catalyst demands, and added mass make them hard to justify onboard today relative to LH2 for deep-sea use [119].
Additionally, assessments sharpen the distinction between LOHCs and ammonia as logistics vectors for maritime hydrogen supply chains. LOHCs (e.g., DBT/H18-DBT) behave as low-vapor-pressure liquids in ambient conditions, enabling handling and storage with fuel-like procedures and reducing BOG constraints; however, they shift the technical bottleneck to onboard dehydrogenation, which requires sustained high-temperature heat integration (typically ~280–320 °C), sizeable reactor/catalyst systems, and management of catalyst deactivation and product-gas purification penalties that propagate to the ship layout and net delivered-H2 efficiency. By contrast, ammonia offers a higher hydrogen content and a well-established global logistics base, making it attractive for long-distance, large-volume energy trade. Still, it introduces a fundamentally different risk and emissions profile (acute toxicity), the need for tight slip control, and, when used as an H2 carrier rather than a direct fuel, an additional cracking/cleanup step whose parasitic energy demand can be comparable to (or slightly lower than) LOHC dehydrogenation depending on catalyst/heat-source assumptions. Comparative supply-chain studies, therefore, tend to place LOHCs in niches where ambient liquid handling and minimized cryogenic infrastructure are prioritized (often at a smaller scale or where return logistics for the spent carrier are acceptable), whereas ammonia is typically favored for bulk international transport and scalable bunker supply, provided that cracking integration, safety engineering, and nitrogen-species control are credibly resolved [120,121,122].

3.3.4. Port Infrastructure and Deployment Implications

Three breakthrough clusters are maturing. Firstly, cryogenic engineering is reaching better multilayer insulation, optimized vacuum-jacketed piping, and active BOG utilization schemes that integrate with fuel cells, cutting parasitic and enabling tighter tank arrangements [112,113]. Second, megawatt-class fuel-cell systems are moving from concept to integrated hybrid powertrains, with control strategies that coordinate batteries and PEMFC/SOFC to handle peaks and maritime transients at higher overall efficiency [115,116]. Third, codes, standards, and port integration are converging. Recent reviews document accelerating work on hydrogen bunkering procedures, risk models, and material-compatibility guidance for terminals, as well as preconditions for scaling beyond pilots [55,123].
The SoA in this field frames hydrogen as a route- and vessel-specific approach today, strongest where LH2 volume penalties are tolerable (short- to medium-range, high-frequency routes). Ports can host segregated cryogenic systems, and hybrid powertrains smooth fuel-cell cycling. The scaling to deep-sea mainstream service depends on credible progress in cryogenic containment/BOG control, standardized bunkering, and proven ship–port safety cases [98,115]. Ammonia sits within the hydrogen value chain as both a product of green H2 (via the Haber–Bosch process using electrolytic hydrogen) and a logistics-friendly hydrogen carrier that can transport large energy volumes globally and be reconverted to H2 at or near the point of use [78]. Liquid ammonia has a relatively high volumetric energy density, 12.7 MJ/L, which is higher than liquid hydrogen (8.49 MJ/L) and compressed hydrogen (4.5 MJ/L at pressure of 69 MPa and temperature of 25 °C), and its ability to be handled as a liquid at ambient pressure enables long-distance shipping and storage using established chemical-industry infrastructure, which is why multiple assessments rank it among the most viable carriers for maritime and intercontinental trade [78,124]. To feed fuel cells or H2-internal combustion engines, ammonia must be cracked back to hydrogen, adding efficiency and cost penalties that depend on the catalyst choice and operating temperature. Ammonia cracking for hydrogen supply is a topic area in which recent reviews report rapid progress in ruthenium- and nickel-based catalyst-integrated cracker-fuel-cell system designs [125].
Table 3 summarizes the most decision-relevant performance metrics needed to compare fuel cells and internal combustion engines (ICEs) for ship powertrains, using a consistent set of indicators: net efficiency (LHV), power density, dynamic response/start-up, and durability/lifetime, alongside the maritime-specific integration constraints that typically govern feasibility. This consistent comparison framework is important because technology selection in shipping is rarely driven by efficiency alone: vessels with highly transient duty cycles (e.g., maneuvering, short-sea) require fast load-following and high power density, while long-duration, quasi-steady operation (e.g., auxiliary power, some deep-sea profiles) can favor higher-efficiency conversion with strong heat-integration potential. Table 3 provides a quantitative basis for matching conversion technologies (PEMFC, SOFC, H2-ICE, transitional dual-fuel concepts) to operational profiles and for identifying where performance advantages are offset by practical constraints (fuel purity, thermal management, cycling limits, after-treatment, and safety/integration of H2 storage).

3.3.5. Safety, Certification, and Operational Constraints

A second bottleneck is safety at the ship–port interface, due to hydrogen’s wide flammability range, low ignition energy, and buoyancy, which require rigorous leak detection, ventilation, hazardous-area classification, and emergency handling protocols during storage and transfer [55]. Systematic port-safety reviews highlight limited empirical data for LH2 tanker trucks, hoses, and ship-to-ship operations, and they call for harmonized QRA methods and validated dispersion/jet-fire models specific to maritime terminals. Broader port readiness surveys similarly flag materials compatibility, bunker connection standards, and footprint constraints for gaseous and liquid systems as near-term blockers, especially where legacy quayside layouts restrict segregation distances [123].
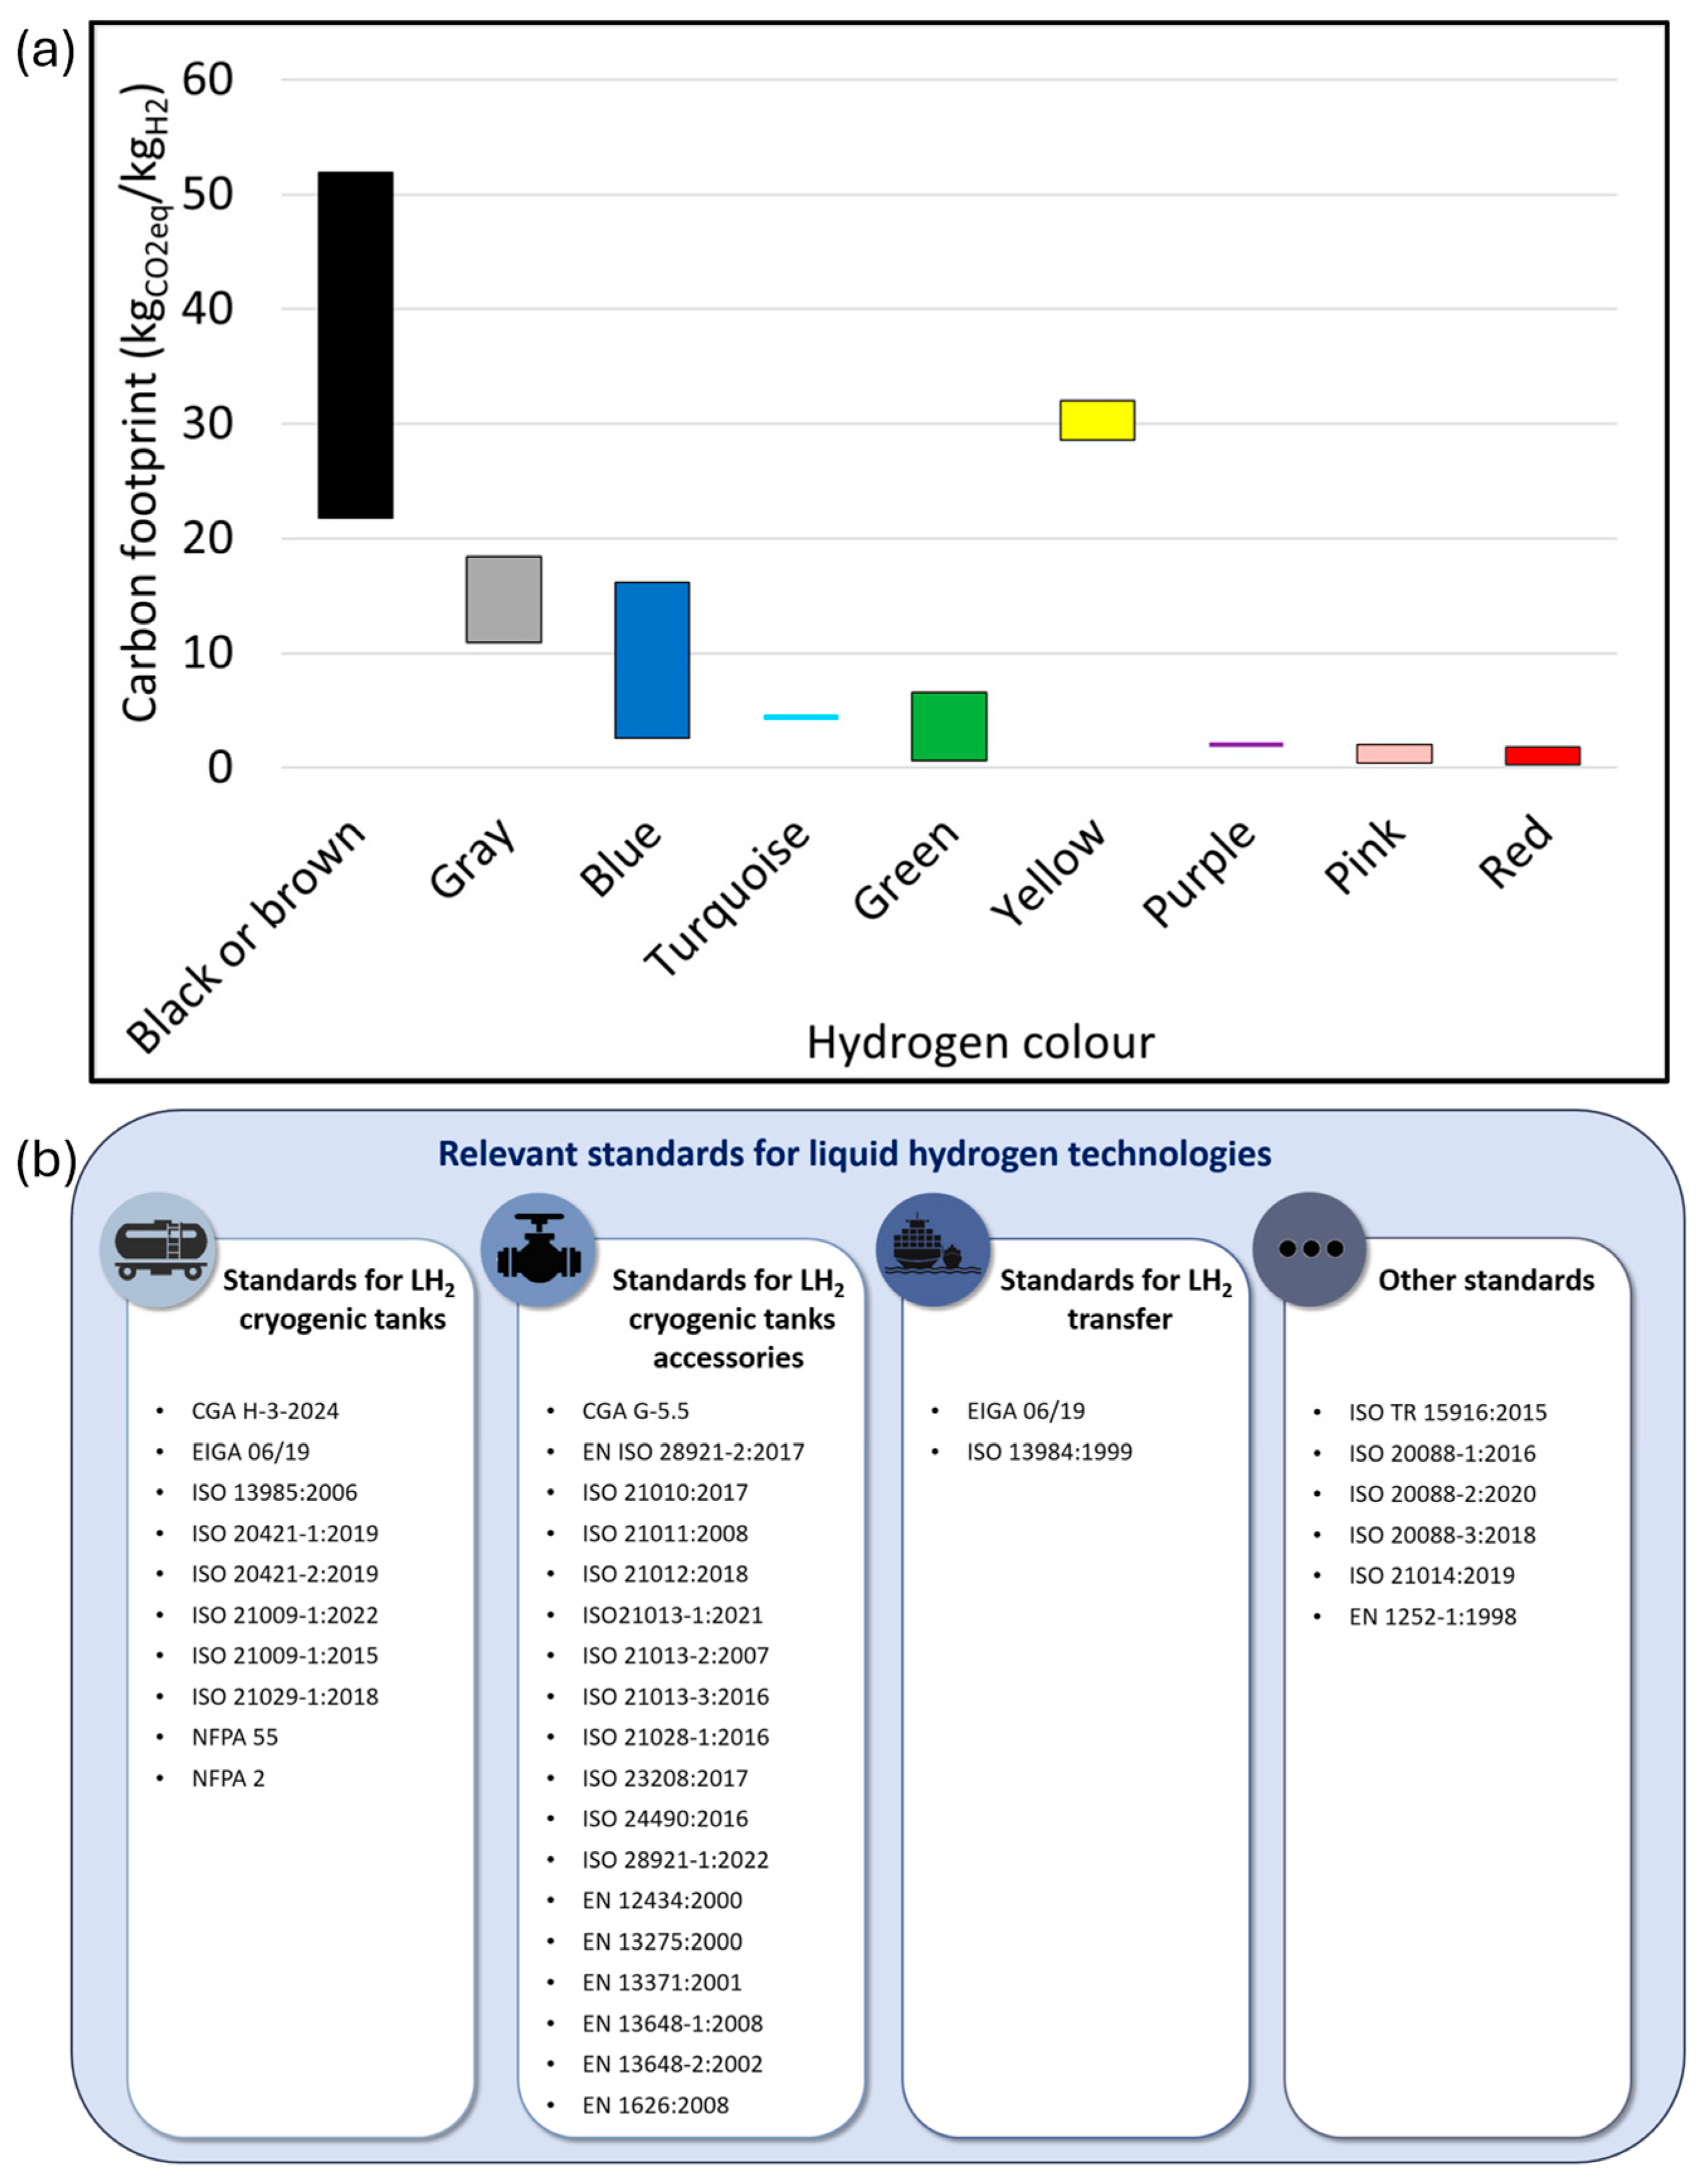
Figure 4a,b is included to make explicit that hydrogen sustainability in shipping has two inseparable dimensions: the carbon intensity of the production pathway and the maturity of the regulatory framework governing storage, handling, and transfer. Figure 4a should be interpreted as a reminder that hydrogen is not a single environmental category. Its life cycle GHG footprint varies widely depending on whether it is produced from coal, natural gas, natural gas with carbon capture, renewable electrolysis, or other low-carbon routes. Panel (b), in turn, shows that even a low-GHG hydrogen pathway cannot be deployed credibly at maritime scale unless standards for liquid-hydrogen systems, transfer interfaces, safety distances, and equipment certification are sufficiently mature and harmonized.
Figure 4a compares indicative life cycle carbon footprints of the main colors of hydrogen, from fossil-based black/brown and gray hydrogen with high emissions (often >10–20 kg CO2-eq/kg H2 for natural-gas and coal routes). The blue and turquoise options partially or fully capture carbon, while green hydrogen from renewable electrolysis and emerging carbon-negative or nuclear-powered variants (yellow, purple, pink, red) can approach near-zero or even net-negative emissions when low-carbon electricity and effective CO2 management are used, highlighting the crucial role of production pathways in determining hydrogen’s overall climate impact [129]. The principal international codes and standards governing liquid hydrogen technologies, including International Organization for Standardization (ISO), European Norm (EN), Compressed Gas Association (CGA), European Industrial Gases Association (EIGA) and National Fire Protection Association (NFPA) documents for cryogenic tanks, tank accessories, transfer operations and cross-cutting safety requirements, reflect the recent efforts to harmonize design, operation and safety practices as large-scale LH2 storage and transport infrastructure is deployed [113]. Accordingly, the literature frames ammonia as a bridging logistics layer in the hydrogen economy, as it links renewable H2 production to maritime end uses by easing transport and storage, while shifting the technical burden to cracking efficiency, safety engineering, and standards development at the ship–port interface [130,131].

3.4. Ammonia

Green ammonia, produced from renewable electricity, is a pivotal enabler of the global energy transition by serving as a scalable hydrogen carrier and carbon-free fuel for shipping, power generation, and industry, while supporting resilient, socially equitable energy systems through both large export hubs and decentralized regional value chains [132]. Accordingly, the value chain starts with low-carbon electricity feeding electrolyzers (alkaline, PEM, SOEC), in which the technology choice drives efficiency, CAPEX, and cycling tolerance, ultimately shaping ammonia costs and plant design [87,133]. These feeds enter a Haber–Bosch process loop whose economic and emissions performance under variable renewables relies on flexible operation, storage co-optimization, and dispatch strategies rather than purely steady-state design [134].

3.4.1. Upstream Production and Synthesis Pathways

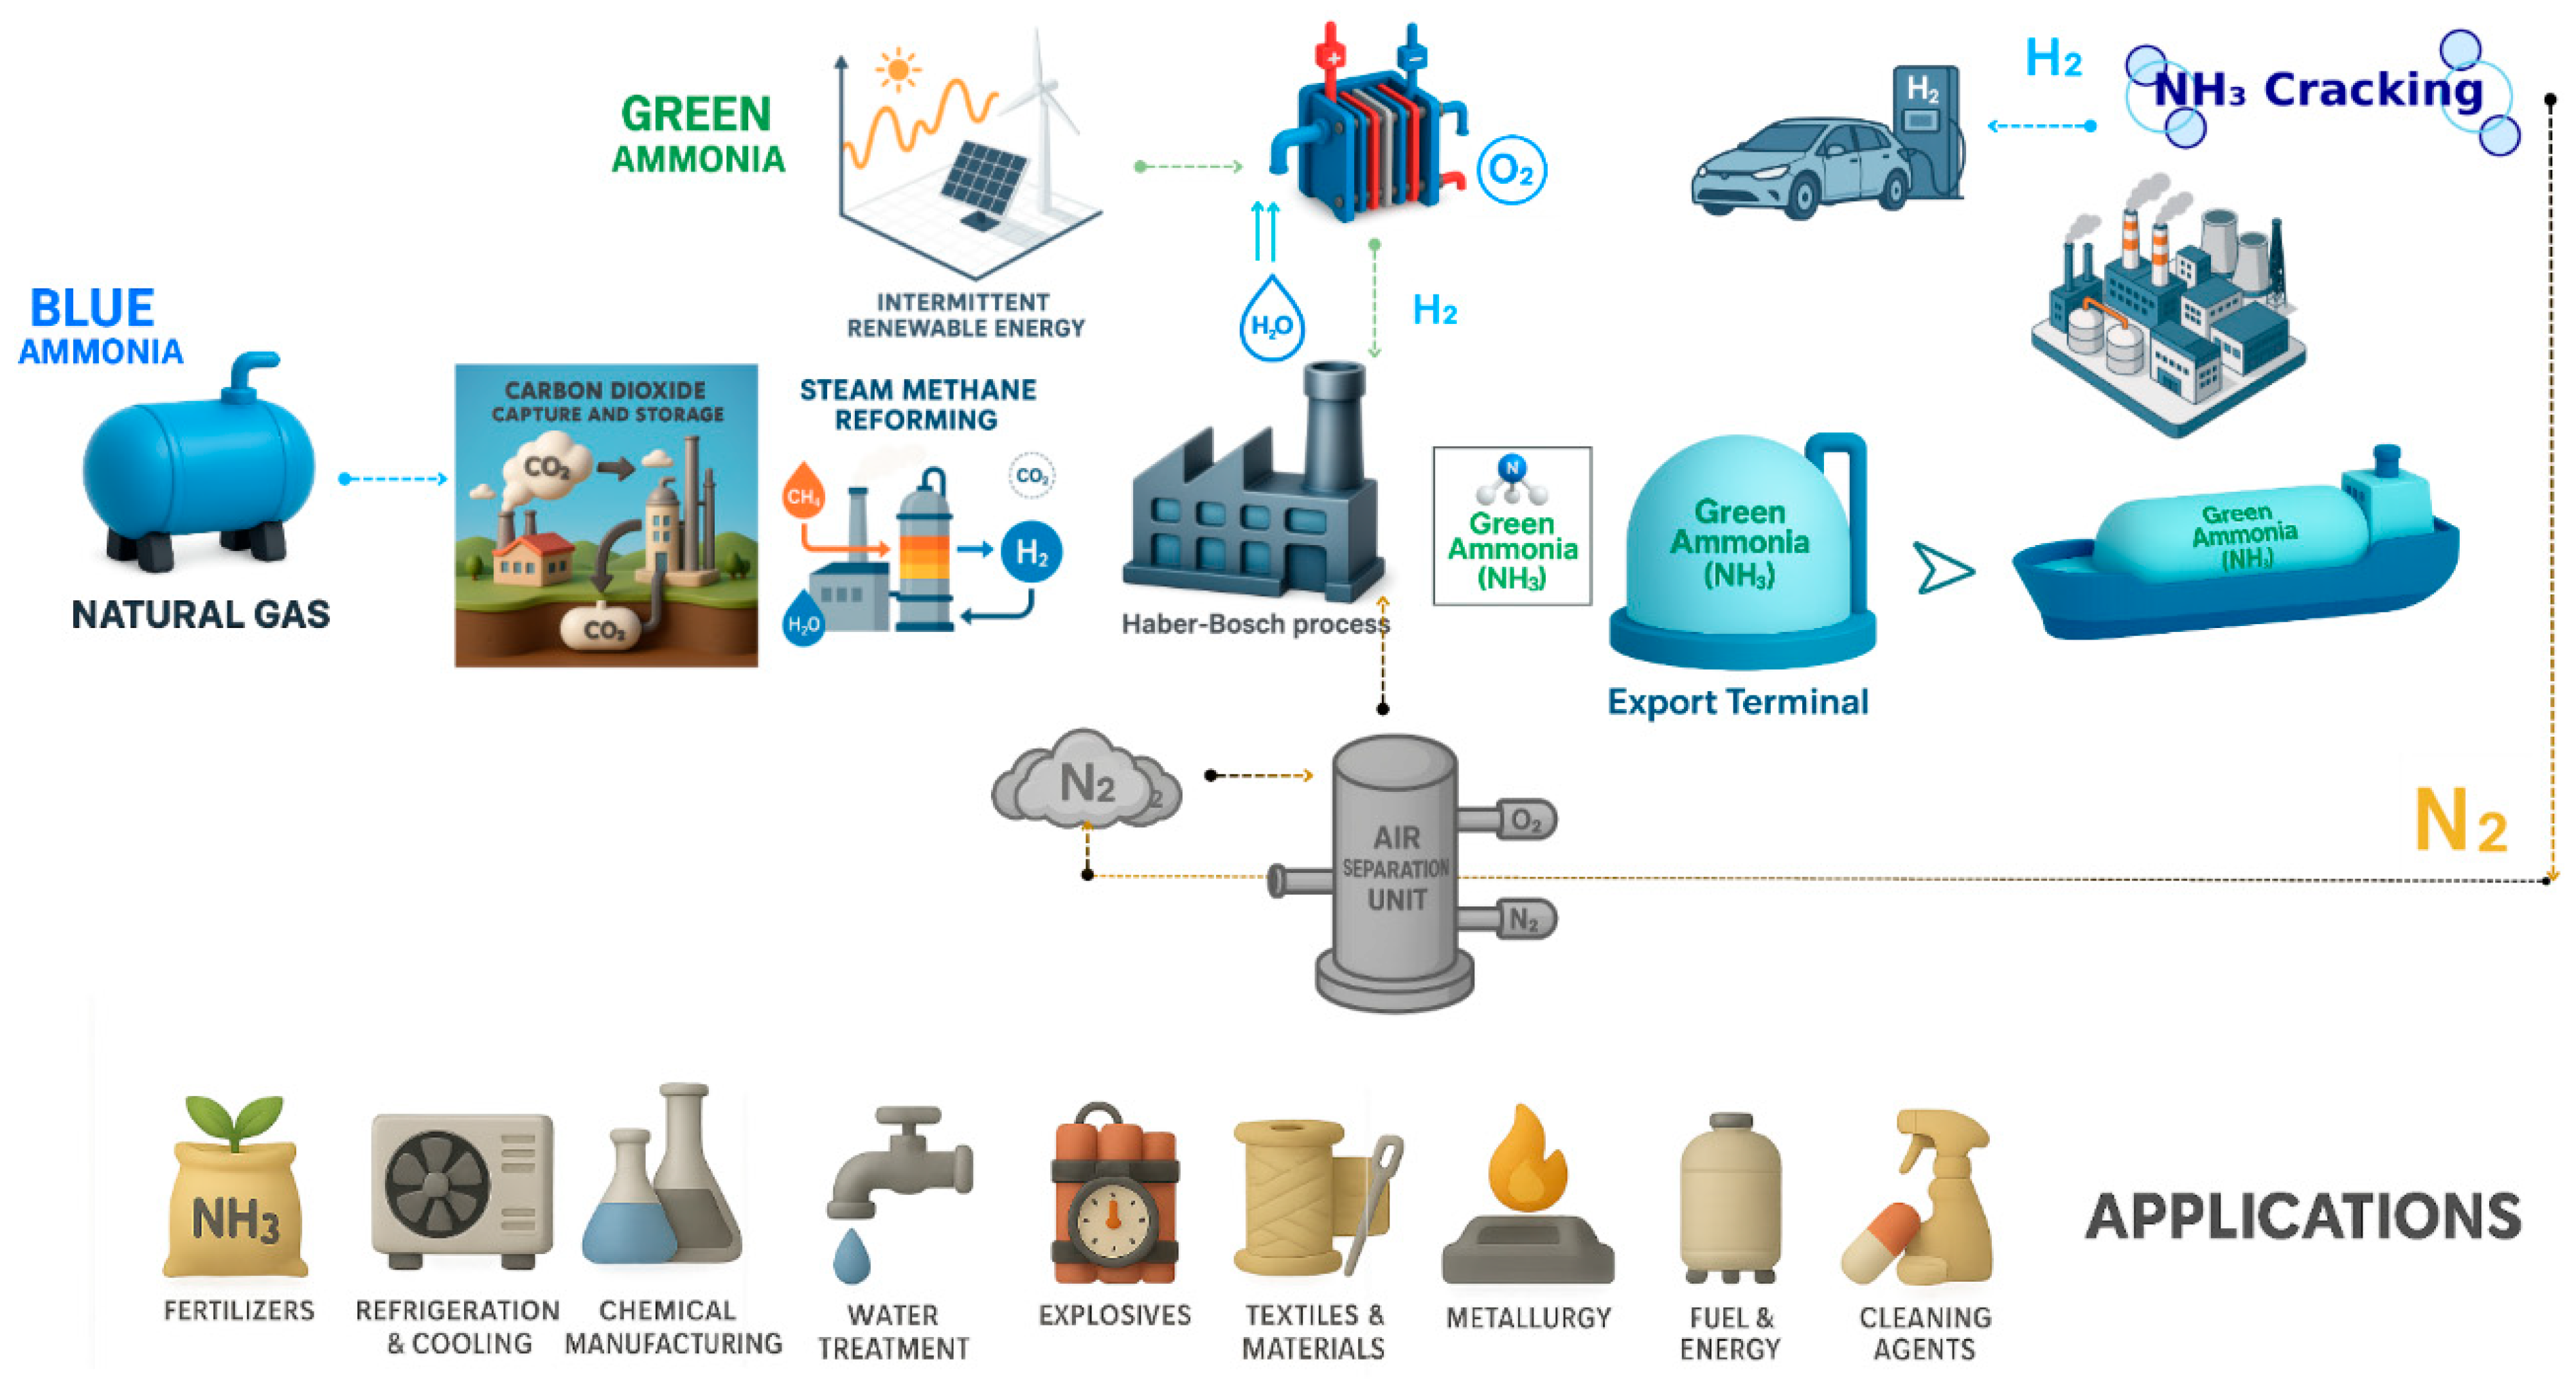
Figure 5 illustrates the integrated value chain for blue and green ammonia from natural gas and renewable-energy-based production, through hydrogen and nitrogen handling and marine transport, to downstream cracking and a wide range of industrial applications.
The thermocatalytic Haber–Bosch process produces ammonia that can be paired with either fossil-derived hydrogen or green hydrogen from electrolysis. A second route is fully electrochemical nitrogen reduction (e-NRR) in an electrolyzer that directly produces NH3 from N2 and a proton source. This process spans aqueous, membrane, and high-temperature solid-state cells and has been subject to intense scrutiny of rates, Faradaic efficiency, and contamination-free verification [135,136]. Closely related but often treated as its own class is the lithium-mediated variant of e-NRR, which uses Li chemistry and a solid-electrolyte interphase to enable higher rates under ambient conditions. Recent reviews now profile it separately because its mechanisms, reactors, and performance limits differ from other e-NRR systems [137,138]. A fourth route is non-thermal plasma-assisted synthesis, either plasma-only or plasma–catalyst hybrids (and even plasma with H2O as the H-donor), pursued for modular, lower-temperature operation [139,140]. The fifth route is based on light-driven fixation, following photocatalytic, photoelectrocatalytic, photothermal, and PV-coupled electrocatalytic schemes. This synthesis route continues to progress, though reproducibility and ammonia quantification remain central concerns [141].
Another route relies on the chemical-looping ammonia synthesis, which splits N2 activation and hydrogenation across redox solids (imides/nitrides) to run at milder pressures and enable modular, renewables-coupled plants [142,143]. A seventh route follows a mechanochemical synthesis (e.g., ball-milling iron catalysts, sometimes with defect promoters), which has emerged as a solvent-free, low-temperature route that continues to rack up proofs of concept [144]. And finally, there are biological routes ranging from engineered nitrogenase systems to bio-/bioelectro-catalytic processes, which are being explored as ambient-condition options, albeit at very early TRLs compared with the processes [145,146].
Ammonia has surged as a low-GHG maritime fuel because it is carbon-free at the point of use and can be synthesized at scale from green hydrogen, with shipboard safety, combustion/emissions control, and port integration being the decisive bottlenecks [10,147]. Ribeiro and Santos [148] reviewed pathways to decarbonize ammonia by first greening the conventional Haber–Bosch process with renewable-electricity hydrogen, and then, in the longer term, replacing it with electrochemical nitrogen-reduction routes. It shows that coupling the Haber–Bosch process with water electrolysis (alkaline water electrolyzer, PEM, SOEC, emerging anion-exchange membrane) could cut specific CO2 emissions from ~1.6 to ~0.1 tCO2/t NH3 with only modest additional energy use. Furthermore, lithium-mediated indirect nitrogen reduction may ultimately deliver even lower costs than green-H2 Haber–Bosch.
The main bottlenecks are upstream in green hydrogen production (high CAPEX, limited lifespans of electrolyzers, dependence on cheap, continuous renewable electricity, and local scarcity of high-purity water). Additionally, there are bottlenecks in the Haber–Bosch loop itself, due to high-pressure, high-temperature energy intensity and poor flexibility to intermittent H2, plus the need to replace steam methane reforming waste heat, and in the electrochemical N2-reduction step. Further system-level bottlenecks arise in scaling up these technologies, integrating them with variable renewables, and achieving economic viability through lower electricity prices, improved catalysts, and supporting policy frameworks.

3.4.2. Emissions, Toxicity, and Safety Engineering

When analyzing combustion reactivity and emissions, a consistent finding is that ammonia’s poor auto-ignition and narrow flammability lead to delayed heat release, increased misfire risk, and the need for ignition enhancers or blended fuels. Consequently, unmanaged combustion tends to elevate engine-out NOx and can form N2O, a potent GHG [147,149]. Engine-focused studies show that strategies involving partial H2 enrichment, pre-chamber ignition, and in-cylinder reforming can stabilize combustion and improve thermal efficiency while suppressing unburned NH3, NOx, and N2O. However, durability and control across transient marine loads remain to be proven at scale [150,151]. Recent works focused on N2O emissions caution that climate performance is highly sensitive to operating conditions, after-treatment, and measurement methods, underscoring the need for standardized testing and continuous slip monitoring on dual-fuel engines [152].

3.4.3. Onboard Storage and Fuel-System Integration

Considering onboard storage and arrangement, ammonia has a higher volumetric energy density than compressed or liquid hydrogen, which eases tankage. Nevertheless, toxicity, corrosivity, and materials compatibility impose strict segregation, ventilation, and detection requirements that reshape machinery-space design [153,154]. Computational fluid dynamics and experiment-based studies of leak scenarios (e.g., vent mast releases, machinery-space losses) show that ventilation rates, intake/exhaust placement, and enclosure geometry govern crew exposure and safe egress, providing design targets and revealing gaps in empirical validation for shipboard environments [155,156].

3.4.4. Conversion Pathways: Engines, Cracking, and Fuel Cells

When analyzing the power conversion options, PEM fuel cells (FCs) are not tolerant of neat ammonia, so a cracking process is required. Recent catalyst and reactor reviews report steady improvements in low-temperature, high-throughput ammonia decomposition, opening pathways to fuel cell–battery hybrids sized for maritime duty [157]. Alternatively, SOFC can internally reform or directly utilize ammonia-derived hydrogen at high efficiency, with integrated designs proposed for base-load propulsion, albeit with mass/thermal-cycling drawbacks that must be engineered for marine transients [158,159]. For internal-combustion routes, dual-fuel concepts and advanced ignition systems are advancing, but peer-reviewed assessments still flag the need to demonstrate stable, low-slip operation across the full engine map and over the full life, paired with robust NOx and N2O control [149]. Throughout the WtW performance and uncertainty lens, the recent LCA finds that ammonia’s climate benefit depends on sourcing (renewable electricity to H2 → NH3), upstream energy/emissions, and tank-to-wake control of NOx/N2O/NH3, with reported WtW outcomes ranging from strongly beneficial to eroded by slip and carbon-intensive power [10]. The LCA focused specifically on ammonia-fueled ships, reinforcing that a credible GHG advantage requires verifiably low-carbon synthesis and emissions-managed operation, motivating MRV frameworks that include N2O and NH3 [152,160].
Salehmin et al. [161] assessed the role of ammonia as a hydrogen carrier and fuel, covering energy density, cost outlook, and production routes. The authors compared the gravimetric and volumetric energy contents of hydrogen and several potential carriers, showing that while hydrogen has the highest energy per unit mass, liquid organic carriers and fuels such as methanol, toluene, and methylcyclohexane offer much higher energy per unit volume, with ammonia and methane providing an intermediate compromise between storage space and weight. The authors also presented the projected levelized cost of ammonia (LCOA) for blue and green pathways, indicating that although green ammonia is currently more expensive, both technologies are expected to decline in cost over time, with blue ammonia remaining the lower-cost option in the near term. The study schematically depicts an example process chain in which biomass-derived syngas is upgraded via steam methane reforming, gas cleaning, water–gas shift, CO2 removal, and methanation, before entering a conventional ammonia loop, highlighting how low-carbon hydrogen can be integrated into established ammonia synthesis infrastructure.
As breakthrough signals, three areas stand out in the recent literature: (a) combustion/control with in-cylinder reforming gas recirculation and H2-assisted ignition, improving efficiency while cutting NOx/N2O/NH3, (b) cracking + fuel-cell hybrids by employing higher-activity catalysts and compact reactors aiming to reduce parasitic loads and enable PEM/SOFC systems, and (c) safety engineering throughout better-validated ventilation/dispersion models and structured risk methods for bunkering and enclosed spaces [151,155,157]. Despite progress, the peer-reviewed record indicates four gating items for mainstream deep-sea adoption that include the proven low-slip engines and after-treatment over life, a standardized/low-loss bunkering with clear terminal rules, the ship designs that meet risk-equivalency targets for toxicity without untenable space penalties, and assured green-ammonia supply aligned with fleet demand [149,162,163]. In the near term, ammonia looks most credible where ports can host segregated transfer systems, ships can accept tankage and safety-zone impacts, and operators adopt hybrid architectures (engine–battery or cracker-fuel cell–battery) to keep emissions within limits while maintaining operability [159,164].
Table 4 provides a compact comparison of electrochemical ammonia-production pathways against the industrial benchmark Haber–Bosch, focusing on what matters for an energy-transition narrative, in particular, where each route could plausibly offer value (e.g., modularity, renewable compatibility, or co-benefits), what currently blocks competitiveness (selectivity, verification rigor, durability, materials stability, separation, and system efficiency), and how these constraints shape the credibility of each pathway for near- to mid-term deployment. Rather than treating electrochemical ammonia as a single option, the table disaggregates the field into distinct reactors and chemistry families, including room-temperature direct N2 reduction, lithium-mediated routes, intermediate-temperature ceramic/membrane reactors, molten-salt systems, and nitrate-to-ammonia conversion, because their advantages and failure modes differ materially. This framing clarifies why near-term large-volume green ammonia still tends to be discussed in terms of electrolytic hydrogen feeding HB, while alternative electrochemical routes are best positioned either as longer-horizon R&D candidates (e.g., room temperature eNRR), as more credible but integration-heavy contenders (Li-NRR, intermediate-T systems), or as niche solutions that reorient the story toward nitrogen circularity.

3.4.5. Bunkering, Port Interface, and Safe Deployability

Regarding bunkering and the port interface, the QRA for ship-to-ship and shore-to-ship ammonia transfer highlights credible accident sequences across small, medium, and large releases, with mitigation effectiveness relying on standardized couplings, emergency shutdown logic, and exclusion zones suited to legacy quay layouts [164,171]. Hazard-identification work specific to fuel-supply systems on ammonia carriers (likely early adopters) points to prevention/mitigation measures for piping, valves, and purge systems, but calls for harmonized port-terminal rules and validated dispersion/jet-release models before widescale rollout [163].
Because ammonia safety is governed by acute toxicity, corrosivity, and the potential for release in enclosed or port-adjacent spaces, risk reduction cannot be reduced to ventilation alone. The literature instead supports a layered-barrier approach combining arrangement and compartmentalization, leak prevention through materials and sealing choices, early detection and automatic interlocks, controlled ventilation and discharge management, safeguarded bunkering procedures, and emergency preparedness. To make these engineering controls explicit, Table 5 summarizes the principal mitigation categories, the risks they address, the supporting evidence base, and the boundary conditions that influence their effectiveness.
The evidence base indicates that no single safeguard is sufficient for ammonia. Ventilation reduces exposure only under favorable enclosure and airflow conditions, while bunkering risk remains strongly site- and meteorology-dependent. Accordingly, ammonia deployability should be understood as contingent on the successful integration of multiple independent barriers, validated through dispersion analysis, formal safety assessment, and robust ship–port operating procedures, rather than solely on fuel properties.

3.5. E-Methanol

E-methanol (electro-methanol or renewable methanol) is typically defined as methanol synthesized from captured CO2 and hydrogen produced via water electrolysis powered by renewable electricity, rather than from fossil syngas [172]. In a typical process, renewable electricity drives water electrolysis to generate H2, which is then reacted with concentrated CO2 from industrial point sources or direct air capture to form methanol and water (Figure 6). Detailed process simulations of power-to-methanol plants confirm that reaction conditions and heat-integration strategies strongly influence overall efficiency and cost, motivating intensified and modular reactor concepts [173]. LCA for shipping shows that electro-methanol can reduce WtW emissions relative to HFO, though the magnitude of the benefit depends on the grid mix, plant utilization, and CO2 source [174]. System-level LCA studies further highlight that integrating power-to-X plants into a rapidly decarbonizing power system is essential to avoid burden shifting and to unlock the full climate benefits of e-methanol [175].
A major application focus in the recent literature is the maritime sector, where methanol-ready dual-fuel engines and bunkering concepts are already emerging, and techno-economic studies compare fossil, bio-, and e-methanol as alternative ship fuels [176]. At the same time, e-methanol is discussed as a drop-in replacement for fossil methanol in the chemical industry, which relies on methanol as a C1 building block for products such as formaldehyde, olefins, and synthetic fuels [172].
Recent conceptual designs of integrated green-methanol complexes show how CO2 capture, hydrogen production, and methanol synthesis can be co-optimized to supply existing methanol value chains while minimizing energy penalties [177]. Alongside conventional thermocatalytic synthesis, emerging research explores solar-driven and photoelectrochemical routes to methanol from CO2 and water, positioning e-methanol within a broader landscape of solar fuels and artificial-photosynthesis concepts [178]. Recent reviews of hydrogen-based e-fuels emphasize that e-methanol combines a relatively high volumetric energy density, easier handling, and existing infrastructure with the potential for near-zero life cycle emissions when produced under stringent sustainability conditions [179]. E-methanol also emerges as a technically mature and versatile electrofuel with strong potential to decarbonize hard-to-electrify sectors, while also stressing that its real-world climate benefit pivots on rapid expansion of low-carbon electricity, careful siting and integration, and robust sustainability governance [172]. Despite these advantages, recent studies indicate that e-methanol deployment is constrained by several technological bottlenecks that must still be overcome [180]. System-level analyses highlight limitations in heat integration, plant flexibility, and coupling with variable renewable power, as well as the lack of dedicated e-methanol infrastructure and standards for large-scale maritime and industrial use, all of which must be addressed to fully realize its decarbonization potential [175].
From the maritime deployment perspective, the literature positions e-methanol as a pragmatic near-term pathway because it is liquid at ambient conditions, compatible with conventional fuel systems after targeted modifications, and supported by rapidly maturing dual-fuel engine platforms [55,181]. The most relevant on-board penalty is the lower volumetric energy density of MGO/HFO, which increases tank volume and would constrain payload or range on space-constrained ships [2,181]. Material compatibility adds a second limitation, focused on methanol’s polarity and corrosivity, requiring careful selection of tank and line materials (e.g., stainless steel or suitable carbon steel, and resistant elastomers) and precluding the reuse of standard MGO/HFO tanks without modification [2].
On the combustion and emissions side, engine studies consistently show strong reductions in SOx and particulate matter, while the potential for low NOx exists with appropriate calibration. However, it raises flags about unregulated species, especially formaldehyde and unburned methanol under certain loads and injection strategies [38,182]. Large-bore and heavy-duty reviews report rapid progress in injection concepts (port vs. direct/dual, ignition, stratification control) that stabilize combustion, improve efficiency, and suppress unburned hydrocarbons and carbon monoxide while maintaining marine-relevant transients [182,183]. Recent works focused on unregulated emissions emphasize the need for continuous monitoring and integration of after-treatment systems (e.g., oxidation catalysts) to manage formaldehyde and trace organics at the fleet scale [37].
From a WtW perspective, e-methanol’s climate benefit relies on two upstream levers: the carbon intensity of the electricity used for electrolysis/synthesis and the source of CO2 (biogenic or direct air capture) [177]. The SoA LCA reviews covering dozens of maritime fuel pathways find that e-methanol can deliver substantial GHG reductions relative to fossil baselines when synthesized with low-carbon power and sustainable CO2, but outcomes vary widely when grid mixes are carbon-intensive [10]. A recent comparative LCA/TEA study reinforces this sensitivity, showing competitive or superior WtW performance relative to LNG and parity with other electrofuels under clean-power assumptions [177]. On the production front, breakthroughs are arriving in CO2-to-methanol catalysis and process integration, but core chemical realities still limit single-pass conversion and raise heat-management demands [184,185]. Emerging designs couple capture and hydrogenation (including direct air capture to MeOH routes) and explore co-hydrogenation of CO/CO2 streams, which could broaden sustainable carbon sourcing and reduce energy consumption in the process [186,187]. Even in optimistic scenarios, TEA/LCA studies stress that renewable electricity availability and CO2 sourcing at scale remain the gating variables for cost and carbon intensity through the 2030s [177].
The port interface and bunkering are comparatively tractable relative to cryogenic or pressurized fuels, with methanol’s ambient-temperature handling enabling faster infrastructure roll-out, but safety cases must address flammability and material compatibility in hoses, seals, and pumps [2,55]. Peer-reviewed safety frameworks for alternative fuels classify methanol as a Class 3 flammable liquid and prescribe segregation, ventilation, and detection strategies that can be implemented within typical terminal footprints [2]. Putting these elements together, the literature points to a coherent technology package for near-term scaling that includes dual-fuel or dedicated methanol engines, which must address (a) optimized injection/ignition, oxidation/hydrocarbon-HCHO after-treatment, (b) corrosion-aware tank-room designs, and (c) route planning that accommodates tankage while leveraging existing liquid-fuel logistics [2,38,182]. Strategically, e-methanol’s competitiveness strengthens where ports can secure verifiably low-carbon power for synthesis and where operators value straightforward bunkering and rapid retrofits over maximum energy density [177,181]. The decisive bottlenecks remain centered on upstream electricity/CO2 constraints that determine true WtW savings and costs, on-board volume constraints on long-range or high-payload vessels, and assurance associated with ultra-low unregulated emissions across all operating modes [177,188].
Recent studies highlight three main factors as promising pathways: (a) improved catalytic routes and reactor design for higher conversion and better heat removal; (b) engine-side advances in dual-fuel operation and timing control; and (c) formaldehyde-focused after-treatment/monitoring regimes that close the emissions gap. These improvements, together, push e-methanol fuel from niche to mainstream in deep-sea segments expected to mature within the next 10-year window, conditioned by green-synthesis scale-up [38,183,184].
Akbari et al. [189] demonstrate a breakthrough, fully integrated Power-to-Methanol system that couples a solar-driven Cu–Cl thermochemical hydrogen cycle with a retrofitted oxy-fuel power plant and adaptive market-based operation, showing that such a configuration can significantly reduce emissions while driving e-methanol costs toward long-term competitiveness with fossil methanol. The work estimates that retrofitting a natural-gas combined-cycle plant with a semi-closed oxy-fuel combustion system and integrating it with a solar-driven Cu–Cl thermochemical hydrogen cycle and e-methanol synthesis can achieve high capture rates (≈350 kgCO2/MWh), improve power-plant efficiency relative to conventional oxy-fuel designs, and produce low-carbon methanol with specific avoided emissions of about 1.2 tCO2 per ton of methanol. Nevertheless, it also finds that the current levelized costs of methanol (~$1190/t, falling to ~$745/t in optimistic 2050 scenarios with strong carbon credits and cost reductions) remain above fossil methanol prices; consequently, large cost cuts in green hydrogen, concentrated solar power components, and CAPEX, plus robust policy support, are still needed for full economic competitiveness. Sillman et al.’s [190] work delivers a key breakthrough by combining dynamic energy-system optimization with actor-based life cycle costing and assessment to show, for the first time, how large-scale e-methanol value chains can become both economically viable (with very low renewable electricity prices, favorable finance, and targeted hydrogen subsidies) and achieve up to ~90% GHG reduction compared with fossil methanol.

3.6. Electrification and Energy Storage

In maritime decarbonization, batteries are no longer an emerging chemistry story so much as an operational systems framework: when routes are short, schedules are fixed, and ports can supply high-power electricity, battery-electric and battery-hybrid vessels can deliver very high tank-to-wake efficiency, eliminate in-port emissions, and materially cut well-to-wake GHGs provided the grid is low-carbon. Recent synthesis papers converge on the same boundary conditions: batteries are already compelling for ferries, harbor craft, offshore support in near-shore duty, and short-sea logistics, while their stand-alone use in deep-sea segments remains constrained primarily by the pack-level energy density, mass/volume penalties, and charging logistics rather than by incremental gains in cell electrochemistry [17,191]. The SoA art is therefore best framed around three coupled design spaces: route energetics, ship integration, and port/grid coupling. First, route energetics: for battery-electric vessels, the round-trip energy budget governs feasibility and the extent to which that energy can be replenished during turnaround. TEA/LCA work that explicitly sizes batteries for real routes shows that, once it is moved beyond small commuter ferries toward large RoPax concepts, the battery question becomes a port-power and logistics question that includes megawatt-class charging, berth time, and grid constraints, with these factors dominating cost and emissions outcomes as much as the battery itself. A recent RoPax case study for the Helsinki–Tallinn corridor (sized around a ~110 MWh LFP battery concept) illustrates this shift clearly: environmental performance is strong under low-carbon electricity, but the viability hinges on high-power charging availability and route-specific operational assumptions (Figure 7a,b) [192].
Secondly, ship integration studies emphasize that marine batteries succeed when treated as part of an integrated electric power system (DC distribution, power electronics, redundancy, EMS/optimal control), not as an energy tank. Reviews of maritime electrification highlight that batteries deliver disproportionate value even when they do not provide the full voyage energy through peak shaving, spinning reserve, ramp-rate control, and optimal loading of gensets or fuel cells, which reduces fuel consumption and maintenance while improving transient response [17,191]. In practice, this is why battery hybrids are scaling faster than fully electric solutions on routes shorter than 10 miles, since hybrid systems capture much of the efficiency and local air-quality benefits without imposing extreme volume penalties. Third, from a port/grid coupling perspective, the literature increasingly treats charging infrastructure and OPS as first-order bottlenecks. Even when vessels can technically be electrified, berth power availability, connection standards, substation capacity, and demand peaks can limit the deployment pace. Reviews spanning standards-to-deployment underline that OPS/charging rollout is uneven and that planning methods must translate ship calls into power and energy requirements at the port level [191]. Route-specific analyses and port-power methodologies similarly show that grid readiness is not a generic condition, as it depends on the simultaneity of charging events, local network constraints, and the ability to manage peaks (e.g., buffering, scheduling, or hybridization).
Safety and assurance have also matured into a defining pillar of the SoA. For marine Li-ion systems, the dominant technical risk is not normal operation but rare thermal runaway events and their escalation pathways in enclosed battery rooms. Recent work has focused on thermal runaway gas composition, flammability/toxicity hazards, and ventilation/mitigation design, because these directly shape classification requirements, space allocation, and firefighting concepts. Bugryniec et al.’s [193] work consolidates evidence on off-gas generation during thermal runaway and frames the hazard as a coupled fire explosion toxicity problem rather than a simple battery fire. This risk lens pushes marine design towards fault-tolerant module layouts and segregation, detection tuned to early gas release, ventilation sized for both heat and gas management, and operational procedures that recognize charging as a distinct risk state. Finally, the case study literature is moving beyond ‘Does it work?’ to ‘How do we optimize whole-ship energy use once electric?’ For example, recent ferry-focused case work explores auxiliary integration (e.g., heat pumps using low-temperature seawater/return heat) to reduce the total electrical load and thereby shrink the required battery capacity or charging power, again reinforcing that the leading edge is systems engineering, not only the cell chemistry [194]. Battery-electric vessels are already the best available option in short-sea segments when ports can supply high-power, low-carbon electricity, and battery-hybrid architectures are a near-term cross-cutting enabler across many ship types by improving engine/fuel-cell operating regimes and absorbing transients. The principal open bottlenecks are still the energy density at the pack-and-safety-system level (mass/volume), megawatt-class charging/port grid integration, and safety assurance against thermal runaway propagation and toxic/flammable off-gas in enclosed maritime spaces, with progress increasingly driven by corridor-scale infrastructure planning, electric power system integration, and validated safety engineering, nevertheless highly reliant on incremental advances in batteries’ interfacial electrochemistry.

4. Cross-Pathway Comparison and Critical Discussion

Section 4 addresses the manuscript’s central comparative question: How do the main maritime fuel pathways differ in terms of their practical potential to reduce GHG emissions once technological bottlenecks are considered? The comparison shows that the relevant metric is not theoretical decarbonization potential in isolation, but realizable WtW GHG reduction under deployment constraints. Across the literature, these constraints are created by different combinations of upstream electricity or feedstock dependence, non-CO2 climate species, onboard energy-density penalties, safety requirements, and port-side infrastructure maturity. A comparative perspective is therefore essential, because pathways that appear highly attractive under idealized assumptions may not retain the same climate advantage under real maritime operating and supply conditions.
Table 6 synthesizes the literature into a structured comparison of the six pathway groups assessed in this review, namely biofuels, LNG/Bio-LNG, hydrogen, ammonia, e-methanol, and electrification, across life cycle climate performance, technological readiness, safety and unregulated emissions, infrastructure, and scalability. From a GHG perspective, three broad patterns emerge. First, the most credible near-term realizable abatement options are those that can leverage existing ship and port systems, especially waste- and residue-based drop-in biofuels and battery-electric propulsion in short-sea applications with access to low-carbon electricity. Second, LNG/Bio-LNG occupies a transitional position: it can deliver modest to meaningful WtW reductions in favorable cases, but its climate performance is unusually sensitive to methane slip and upstream leakage, meaning that nominal CO2 advantages do not automatically translate into robust GHG abatement. Third, hydrogen-, ammonia-, and e-methanol-based pathways offer high long-term theoretical decarbonization potential, but this potential is conditional on low-GHG electricity, large-scale fuel production, and resolution of major storage, safety, and bunkering bottlenecks.
A key message emerging from the comparison is that maritime fuel pathways should be ranked not by nominal carbon intensity alone, but by the gap between theoretical and realizable GHG reduction. For biofuels, this gap is governed mainly by feedstock sustainability, land-use effects, and certification boundaries; for LNG/Bio-LNG, by methane slip and methane leakage across the supply chain; for hydrogen and ammonia, by upstream electricity carbon intensity and the practical penalties of storage, bunkering, and safety engineering; for e-methanol, by the availability of low-carbon electricity and sustainable CO2; and for electrification, by the route length, charging opportunity, and the carbon intensity of the supplying grid. In this sense, the technological bottlenecks examined in this manuscript are not secondary implementation issues, but the factors that determine whether each pathway’s nominal climate promise can be realized in shipping practice.
Hydrogen and ammonia, by contrast, show robust tank-to-wake decarbonization potential but carry substantial penalties in volumetric energy density (hydrogen) or toxicity and N2O/NH3 control (ammonia), and both require entirely new port-side safety and bunkering frameworks. For ammonia, deployability is not determined solely by fuel availability or engine readiness, but by whether multi-layer toxicity-risk controls can be engineered and operationalized at the ship and port level without unacceptable penalties in space, complexity, turnaround, and terminal layout. E-methanol is distinctive in combining high operational simplicity with a heavy reliance on verifiably low-carbon electricity and sustainable CO2, raising questions about competition with other sectors for scarce green molecules. Batteries stand out as clearly superior for short-sea and port applications where high-frequency charging is feasible, but pack-level energy density and thermal-safety constraints sharply limit their use in deep-sea applications. Wei et al. [203] evaluated how switching a large container ship from heavy fuel oil to liquid hydrogen, ammonia, or methanol in dual-fuel engines affects GHG emissions and other environmental impacts from 2020 to 2050. Using life cycle assessment and cargo-capacity penalties, the study shows that with today’s fossil-based hydrogen and electricity, these fuels can actually increase GHGs per ton-nautical mile, but under a rapidly decarbonized power system, they can deliver roughly 50–65% GHG cuts by mid-century, and up to ~80% with fully renewable electrolysis and sustainable CO2 for methanol. However, the shift to hydrogen-based fuels tends to increase material use, land and water pressures, and some pollution categories due to the large-scale deployment of renewables, electrolyzers, and fuel plants.
When the pathways are analyzed jointly, the literature converges on a portfolio view rather than a single-fuel solution. LNG/Bio-LNG and electrification are most competitive for short- to medium-range routes and segments where infrastructure can be concentrated and where operational flexibility is valued. Hydrogen and ammonia are structurally better suited to energy-intensive deep-sea trades, provided that cryogenic or toxic-hazard handling, N2O/NH3 emissions, and port safety can be managed at scale. E-methanol occupies a pragmatic niche where operators prioritize retrofitability and straightforward bunkering over maximum energy density.
This route- and vessel-specific logic is often implicit in individual studies but becomes explicit only when the pathways are juxtaposed. A key contribution of this review is to make these trade-offs visible in a unified comparative framework, highlighting that decisions about “which fuel” cannot be separated from decisions about route structures, port-power planning, and upstream electricity mixes. Beyond fuel-specific issues, the comparative analysis reveals three cross-cutting bottlenecks. First, the climate performance of all pathways is highly sensitive to upstream electricity and feedstock assumptions, underscoring the need for harmonized, transparent well-to-wake LCA conventions and guarantees of origin. Secondly, safety and emissions control for non-CO2 species (methane, N2O, NH3, formaldehyde, and battery-related fire/toxic-gas risks) are not yet consistently integrated into regulatory frameworks, raising the risk of problem-shifting. Third, port and grid infrastructure (OPS, megawatt-class charging, hydrogen/ammonia/methanol bunkering) currently lags on-board technology development and will dictate the feasible pace of deployment. Conversely, the same analysis points can be made for cross-cutting enablers focused on the advanced after-treatment and measurement/verification systems for methane and unregulated emissions; integrated ship–port–grid planning for OPS and power-to-X; and fuel-agnostic safety and risk-assessment methodologies that can be adapted across pathways. These elements suggest that, from a systems perspective, progress in infrastructure and governance is at least as critical as progress in individual technologies.
Framed in comparative GHG-abatement terms, the evidence suggests a time-horizon differentiation across pathways. For the near term, the strongest opportunities lie in scalable drop-in biofuels for legacy tonnage and in electrification for short-sea and port-centered operations. In the medium term, methanol pathways and selected LNG/Bio-LNG applications may serve as transition options, where retrofitability, fuel availability, and infrastructure concentration support deployment, although their climate value remains highly pathway-dependent. For the longer term, hydrogen and ammonia retain the strongest potential for deep-sea decarbonization, but only if the sector can secure abundant low-GHG electricity, robust safety governance, and dedicated bunkering systems on a scale.
Figure 8 roadmaps the maritime decarbonization presented in Table 5, showing how different fuel and propulsion options may progress from today’s current maturity and readiness toward scaling for deep decarbonization.
Figure 8 is an interpretive synthesis of the manuscript rather than a deterministic forecast. It condenses the comparative results of Table 6 into a staged decarbonization logic, separating the most practical early options from those that offer deeper long-term decarbonization but require much larger changes in energy supply, ship design, and port infrastructure. In that sense, the roadmap does not identify a single “winner”; instead, it shows how pathway choice depends on the trade-off between immediate deployability and ultimate decarbonization potential. Along the route, it highlights key constraints and enablers, including the energy-density trade-off for hydrogen and ammonia storage, expected WtW GHG reduction ranges by fuel, and the need for massive renewable power, low-carbon electricity, and new bunkering infrastructure to unlock substantial emissions reductions at scale. The main interpretive message is that the maritime transition is likely to be sequential and portfolio-based. In the near term, the strongest opportunities lie in options that can be implemented with limited onboard disruption, especially drop-in biofuels for legacy tonnage, LNG/Bio-LNG where methane infrastructure and engine platforms already exist, and battery-electric propulsion in short-sea segments with suitable charging access. In the medium to long term, deeper decarbonization increasingly shifts toward fuels such as e-methanol, hydrogen, and ammonia, but only as renewable-electricity supply, fuel production scale, safety governance, and bunkering systems mature. Figure 8, therefore, supports the broader conclusion that the key distinction among pathways is not only theoretical GHG reduction but also the time horizon and system conditions under which that reduction becomes realistically achievable.

Marine Engine Operation Drawbacks

A recurring limitation in early discussions of ammonia and hydrogen engines is that they implicitly treat premixed/Otto-mode operation as the dominant pathway for alternative-fuel combustion challenges (e.g., propensity for abnormal combustion, ignition limitations, or load-map constraints). That framing is increasingly misaligned with the direction of development for deep-sea main propulsion, where the leading two-stroke platforms are converging on high-pressure direct injection of the alternative fuel and mixing-controlled (diesel-mode) combustion initiated by a small pilot-fuel injection. This architecture avoids creating a large, premixed reactive charge in-cylinder and instead relies on jet-driven mixing and diffusion-flame/partially premixed heat release near the top center, a regime that is inherently more tolerant of low-speed residence times and is more controllable across the marine load map than premixed combustion for both NH3 and H2. In other words, several of the premixed-fuel bottlenecks discussed for ammonia and hydrogen remain important, particularly for medium- and high-speed four-stroke concepts, but they are no longer representative of the current SoA for low-speed two-stroke propulsion engines. Sjöholm et al. [204,205] demonstrated that the dominant ammonia pathway in large, low-speed, two-stroke engines is high-pressure direct injection with a small diesel pilot, rather than premixed combustion. Full-scale tests of the MAN B&W LGI-A concept demonstrated stable operation at >95% ammonia energy share, low N2O emissions (ppm-level), and up to 99.7% combustion efficiency, while maintaining diesel-like indicated efficiency and lower NOx emissions than diesel. The two-stroke configuration helps by providing a long residence time and strong scavenging/swirl, improving late-cycle NH3 burnout and reducing unburned-ammonia slip. In parallel, WinGD’s X-DF-A similarly uses dedicated high-pressure ammonia injectors plus a conventional pilot system, shifting the core challenges toward safe high-pressure fuel delivery and minimizing injector slip/sac volume, with reported trends indicating only a few percent pilot fuel and low NH3 and N2O across the load map when hardware and controls are optimized. In the hydrogen context, Sjöholm et al. [206] also demonstrated hydrogen operation in a modified two-stroke cylinder, requiring a pilot injection to control ignition, with behavior comparable to methane HPDI (mixing/jet-momentum governed). The same work found that premixed hydrogen was difficult and unsafe to control because pre-pilot ignition was hard to avoid at low engine speeds, supporting the view that premixed-H2 challenges are not representative of the HPDI pathway for deep-sea propulsion. The main remaining challenge shifts to NOx management, since HPDI enables full-load operation and avoids pre-ignition/backfire, but can raise NOx unless mitigated through exhaust gas recirculation, water addition, or after-treatment. In low-speed main engines, the key constraints are increasingly the fuel-system architecture and safety (toxic NH3 handling, purge/vent management, secondary containment), injector design (minimizing sac volume and slip), and load-map control of NOx/N2O/NH3 under HPDI mixing-controlled combustion, not premixed-combustion stability per se.
To support cross-pathway comparison, Table 7 consolidates a concise set of indicators spanning ship capability (fleet and orderbook), fuel availability, and enabling conditions (rules and port infrastructure). This structure highlights a central transition risk: the vessel’s capability can scale faster than the supply of low-GHG fuels and bunkering readiness.
Table 7 synthesizes the manuscript’s core decision signals across fuel pathways and complementary abatement levers by aligning adoption momentum (existing fleet and orderbook), readiness (technology, rules, and infrastructure), and the dominant constraints that condition real-world emissions outcomes. The comparison highlights a recurring asymmetry across several pathways, including ship capability, which is scaling faster than fuel and infrastructure availability, especially evident in methanol and emerging low-GHG fuels, where orderbooks are rising but bunkering networks, standards, and supply remain immature. Mature options (e.g., LNG and drop-in biofuels) score higher on technical and regulatory readiness. Yet their climate performance is more assumption-sensitive, notably to upstream methane leakage for LNG and to feedstock sustainability and fuel management for biofuels, underscoring the need for life-cycle-based accounting. In parallel, efficiency and bridging measures (WAPS and OCC) appear as near- to mid-term system relief valves with measurable savings/abatement potential, but both are context- and infrastructure-dependent, requiring route suitability (WAPS) and port-side CO2 offloading capacity (OCC). Finally, the IMO Net-Zero Framework indicators (GFI reduction and RU price tiers) provide an explicit policy-driven economic backdrop that can accelerate uptake of low-GHG options, while also increasing exposure to compliance-market uncertainty.

5. Pilot Projects

A particularly concrete illustration of infrastructure as the bottleneck on the hydrogen pathway is the MF Hydra project in Norway, widely discussed in the peer-reviewed safety and systems literature as the first ferry to use LH2 onboard and, crucially, as a logistics-led demonstration rather than a purely propulsion-led one. A consequence-modeling study by Hansen et al. [180] explicitly frames the MF Hydra as a technology demonstrator intended to build operational experience before larger tenders. The study also documents the enabling but constraining fuel supply arrangement: because there was no domestic LH2 production available, green LH2 was produced in Leuna (Germany) and delivered by truck, with bunkering planned at a cadence of roughly once every three weeks a vivid example of how early hydrogen shipping depends on ad hoc distribution solutions while ports, codes, and standardized transfer systems catch up. That same work uses MF Hydra as the motivation for detailed Computational Fluid Dynamics simulation and explosion-consequence analysis of large-scale LH2 release scenarios, underscoring how pilots are actively building infrastructure readiness through the parallel development of transfer procedures, safety zoning, and quantitative risk arguments that ports and regulators need before they can permit routine operations at scale. These findings are fully consistent with the topics discussed in the present review, since even when fuel cells and storage hardware can be demonstrated onboard, the deployment pace is still governed by supply-chain availability, port bunkering arrangements (truck-to-ship vs. shore-to-ship vs. ship-to-ship), and regulatory/safety frameworks, issues emphasized as central hurdles for maritime LH2 adoption in broader peer-reviewed syntheses [97,98].
A second example of hydrogen that neatly operationalizes the infrastructure-as-a-bottleneck argument is HySeas III, which is intentionally framed not just as a vessel prototype, but as an island-scale hydrogen supply-chain demonstration for the Orkney Islands (Scotland). In the peer-reviewed life cycle assessment of the project, Gomez Trillos et al. [208] describe HySeas III as a hydrogen and fuel-cell RoPax ferry concept intended for a specific inter-island route (Kirkwall Shapinsay), explicitly leveraging Orkney’s surplus wind/tidal generation as a local rationale for producing hydrogen and using it in maritime transport, so the pilot is fundamentally about stitching together the following chain event: renewable electricity → electrolysis → storage → refueling/bunkering → ship operation into one integrated system rather than simply swapping engines onboard. Even where shipboard fuel-cell propulsion can be engineered, the rate-limiting steps become the port/harbor energy interface (how hydrogen is produced, conditioned, stored, and transferred safely and repeatedly at the quay) and the system-level design choices that determine whether the whole pathway is scalable and genuinely low-carbon. Importantly, peer-reviewed energy-systems work that references HySeas III makes the same point from a fueling-operations angle: when marine fueling events involve large volumes but relatively low frequency, the infrastructure sizing problem (compressors, buffer storage philosophy, dispensing layout) differs materially from road transport, and HySeas III is cited as an example where that design logic drives the refueling system concept [209].
Ammonia bunkering is still largely pre-commercial; the most concrete pilot-scale progress documented in the peer-reviewed record is not yet a fleet of operating bunkering terminals, but the infrastructure that must exist before a pilot can be permitted, namely, standardized transfer procedures, safety zones, and QRA that translate ammonia’s toxicity/dispersion behavior into port-operational rules. A good example of this pre-pilot infrastructure is how recent studies explicitly treat bunkering as a port operation that must be engineered through risk-informed envelopes: Fan et al. [210] develop a Bayesian-network QRA framework for ship-to-ship ammonia bunkering, showing that toxicity-driven outcomes dominate and that risk quantification can be used to diagnose causal pathways and prioritize safeguards for the exact analytical scaffolding ports, and regulators need to approve early demonstrations. Complementarily, Yang and Lam [164] assess ammonia bunkering risk across small/medium/large release scales and perform sensitivity analyses showing how meteorology and transfer-system parameters can radically change toxic cloud footprints, evidence that infrastructure readiness is inseparable from site-specific port conditions and operational constraints. At the interface of operations and layout, Duong et al. [211] focus on truck-to-ship ammonia bunkering and model dispersion to derive safety-zone implications, directly supporting the procedural controls and exclusion zones that pilot ports must implement before the first transfer. Finally, Khan et al. extend the pre-pilot lens by integrating systems-theoretic process analysis with Bayesian networks for port ammonia bunkering operations, explicitly framing bunkering as a sociotechnical system where organizational controls, barriers, and human equipment interactions determine risk, again aligning with this review’s argument that infrastructure bottlenecks are as much about procedures, governance, and port integration as they are about the molecule itself [211].
A concrete pilot-scale illustration of how infrastructure becomes the universal bottleneck is the Helsinki–Tallinn RoPax battery-electric ferry concept, deliberately framed around a real, high-throughput short-sea corridor where vessels must turn around quickly and cannot overcome range limits by simply carrying more energy onboard. In this case study, the technical feasibility and environmental performance are shown to depend less on the onboard battery per se and more on whether the ports can deliver megawatt-class charging within operational turnaround windows, which immediately pushes the problem upstream into terminal electrical architecture, grid-connection capacity, and charging logistics, e.g., exactly the port energy interface that the review flags as a cross-cutting constraint. Katumwesigye et al. [192] model a fully lithium iron phosphate battery-electric RoPax design sized in the order of ~110 MWh and show that the pathway’s viability is conditional on high-power charging availability and compatible port call patterns, making the bottleneck tangible: without grid reinforcement, power-electronics integration, and coordinated charging operations, the ship concept cannot be realized at the service level even if the propulsion technology is mature on paper. As a complementary port-infrastructure case study that similarly operationalizes infrastructure readiness as a planning and sizing problem (albeit in the OPS/shoreside power context), Amaral et al. develop an OPS power-needs methodology and apply it to the Port of Lisbon, explicitly linking ship calls/berth use to required installed capacity and grid interface decisions [20].

6. Conclusions

This review shows that maritime decarbonization has moved decisively from a fuel choice debate to a bottleneck-mapping problem across entire WtW value chains. When biofuels, LNG/Bio-LNG, hydrogen, ammonia, e-methanol, and electrification are assessed side by side, the literature converges on a portfolio logic rather than a single dominant pathway. In answer to RQ2, the reviewed pathways differ markedly in their practical GHG-reduction potential once WtW assumptions and deployment bottlenecks are made explicit. The highest near-term realizable reductions are associated with scalable drop-in biofuels and route-constrained electrification. At the same time, hydrogen, ammonia, and e-methanol have the strongest long-term theoretical decarbonization potential but remain conditional on low-GHG upstream energy, large-scale fuel supply, and port and ship infrastructure readiness. LNG and Bio-LNG remain transitional options whose climate performance is highly contingent on methane management across the full value chain. Options that are easiest to integrate with today’s ships and ports (notably scalable drop-in biofuels, LNG/Bio-LNG where leakage and slip are tightly controlled, and batteries on short routes) are best positioned to deliver near-term abatement under tightening compliance timelines. Still, sustainable feedstock availability, non-CO2 climate species, and corridor-specific infrastructure limits bound their contribution. In contrast, the pathways that can, in principle, deliver the deepest reductions in energy-intensive deep-sea segments (hydrogen and ammonia, and e-fuels more broadly) remain gated by upstream low-GHG production scale, the maturity of bunkering standards and safety cases, and the demonstrated durability and emissions control of onboard conversion systems under marine duty cycles.
A central finding emerging from the comparative framing is that ship readiness can plausibly outpace fuel and infrastructure readiness, creating a structural capability supply gap that will dictate real-world decarbonization rates. Across all pathways, the analysis identifies three cross-cutting bottlenecks that most strongly determine real-world deployment. These are (a) the strong sensitivity of WtW climate performance to upstream electricity, feedstock, leakage, and accounting assumptions; (b) the incomplete integration of non-CO2 emissions and safety hazards into current regulatory and assurance frameworks; and (c) the growing role of port and grid infrastructure as the practical rate-limiting step for implementation. Overall, the evidence supports a portfolio-based, time-sequenced transition, in which readily deployable options drive near-term reductions, while deeper, long-term decarbonization depends on simultaneous progress in fuel supply, infrastructure, standards, and emissions-control systems. Accordingly, the most leverageable solutions identified by the evidence are enabling measures that cut across fuels: measurement/verification and after-treatment architectures that explicitly address methane and other unregulated emissions; integrated ship–port–grid planning that treats OPS, charging, and power-to-X supply as coupled system design problems; and fuel-agnostic, risk-informed methodologies that translate hazard properties into approvable operational procedures for bunkering and onboard integration.

Funding

The work was funded by Fundação para a Ciência e Tecnologia (FCT) under Research Grants UID/PRR/00081/2025 (https://doi.org/10.54499/UID/PRR/00081/2025) and LA/P/0056/2020 (https://doi.org/10.54499/LA/P/0056/2020).

Data Availability Statement

No new data were created or analyzed in this study. Data sharing does not apply to this article.

Acknowledgments

Renata Costa acknowledges CA23138-Port City Territories in Action: A Collaborative Laboratory for Inclusive Energy Transition (PACT) and CA23157-European Network for Multiple View Life Cycle Sustainability Assessment (MultiViewLCSA) COST Actions for network funding.

Conflicts of Interest

The author declares no conflicts of interest.

List of Abbreviations

Abrev.Designation
BTMSBattery Thermal Management System
BOGBoil-Off Gas
CCSCarbon Capture and Storage
CAPEXCapital Expenditure
DACDirect Air Capture
FAMEFatty Acid Methyl Ester
GHGGreenhouse Gas
ILUCIndirect Land-Use Change
HFOHeavy Fuel Oil
HPDIHigh-Pressure Direct Injection
HVOHydrotreated Vegetable Oil
IMOThe International Maritime Organization
LCALife cycle Assessment
LCOALevelized Cost of Ammonia
LBSILean-Burn Spark-Ignition
LOHCsLiquid Organic Hydrogen Carriers
LPDILow-Pressure Direct Injection
MGOMarine Gas Oil
OPSOnshore Power Supply
OPEXOperating Expenditure
PEMProton-Exchange Membrane Fuel Cell
QRAQuantitative Risk Assessment
ROPAXRoll-on/Roll-off/Passenger
SoAState of the Art
SOFCsSolid Oxide Fuel Cell
TEATechno-economic Analysis
VLSFOVery-Low-Sulfur Fuel Oil

References

  1. International Maritime Organization’s (IMO). 2023 IMO Strategy on Reduction of GHG Emissions from Ship; IMO: Shanghai, China, 2023. [Google Scholar]
  2. Ismail, A.; Metwalli, M.; Alamoush, A. Towards Safe Maritime Decarbonization: Safety Barriers of Methanol Fuel. Sustainability 2025, 17, 4896. [Google Scholar] [CrossRef]
  3. Jin, C.; Choi, J.; Lee, C.; Kim, M. Sustainable Maritime Decarbonization: A Review of Hydrogen and Ammonia as Future Clean Marine Energies. Sustainability 2025, 17, 11364. [Google Scholar] [CrossRef]
  4. Anantharaman, M.; Sardar, A.; Islam, R. Decarbonization of Shipping and Progressing Towards Reducing Greenhouse Gas Emissions to Net Zero: A Bibliometric Analysis. Sustainability 2025, 17, 2936. [Google Scholar] [CrossRef]
  5. Adami, G.; Rocchi, R.; Figari, M. Exploring carbon capture for maritime decarbonization: A case study on a military vessel. Appl. Ocean Res. 2025, 165, 104868. [Google Scholar] [CrossRef]
  6. Kotzampasakis, M. Maritime emissions trading in the EU: Systematic literature review and policy assessment. Transp. Policy 2025, 165, 28–41. [Google Scholar] [CrossRef]
  7. Zamboni, G.; Scamardella, F.; Gualeni, P.; Canepa, E. Comparative analysis among different alternative fuels for ship propulsion in a well-to-wake perspective. Heliyon 2024, 10, e26016. [Google Scholar] [CrossRef]
  8. Foretich, A.; Zaimes, G.; Hawkins, T.; Newes, E. Challenges and opportunities for alternative fuels in the maritime sector. Marit. Transp. Res. 2021, 2, 100033. [Google Scholar] [CrossRef]
  9. Watanabe, M.; Cherubini, F.; Cavalett, O. Climate change mitigation of drop-in biofuels for deep-sea shipping under a prospective life-cycle assessment. J. Clean. Prod. 2022, 364, 132662. [Google Scholar] [CrossRef]
  10. Roux, M.; Lodato, C.; Laurent, A.; Astrup, T. A review of life cycle assessment studies of maritime fuels: Critical insights, gaps, and recommendations. Sustain. Prod. Consum. 2024, 50, 69–86. [Google Scholar] [CrossRef]
  11. Wang, Y.; Xiao, X.; Ji, Y. A Review of LCA Studies on Marine Alternative Fuels: Fuels, Methodology, Case Studies, and Recommendations. J. Mar. Sci. Eng. 2025, 13, 196. [Google Scholar] [CrossRef]
  12. Manias, P.; McKinlay, C.; Teagle, D.; Hudson, D.; Turnock, S. A wind-to-wake approach for selecting future marine fuels and powertrains. Int. J. Hydrogen Energy 2024, 82, 1039–1050. [Google Scholar] [CrossRef]
  13. Chavando, A.; Silva, V.; Cardoso, J.; Eusebio, D. Advancements and Challenges of Ammonia as a Sustainable Fuel for the Maritime Industry. Energies 2024, 17, 3183. [Google Scholar] [CrossRef]
  14. Duong, A.; Kang, H. Ammonia as fuel for marine dual-fuel technology: A comprehensive review. Fuel Process. Technol. 2025, 272, 108205. [Google Scholar] [CrossRef]
  15. Pukazhselvan, D.; Sandhya, K.; Fagg, D.; Blaabjerg, F. The future of clean transportation: Hydrogen, batteries, ammonia, and green methane in perspective. Renew. Sustain. Energy Rev. 2026, 226, 116286. [Google Scholar] [CrossRef]
  16. Nunes, L. Renewable Methanol as an Agent for the Decarbonization of Maritime Logistic Systems: A Review. Futur. Transp. 2025, 5, 54. [Google Scholar] [CrossRef]
  17. Aksöz, A.; Asal, B.; Golestan, S.; Gençtürk, M.; Oyucu, S.; Biçer, E. Electrification in Maritime Vessels: Reviewing Storage Solutions and Long-Term Energy Management. Appl. Sci. 2025, 15, 5259. [Google Scholar] [CrossRef]
  18. Ziakas, A.; Boile, M. Toward zero-emission ferries: Integrating systematic review and bibliometric analysis insights on alternative fuels and policies. J. Shipp. Trade 2025, 10, 27. [Google Scholar] [CrossRef]
  19. Jesus, D.; Oliveira, T.; Perdigão, M.; Mendes, A. Plugging into Onshore Power Supply System Innovation: A Review from Standards and Patents to Port Deployment. Energies 2025, 18, 5449. [Google Scholar] [CrossRef]
  20. Amaral, M.; Amaro, N.; Arsénio, P. Methodology for Assessing Power Needs for Onshore Power Supply in Maritime Ports. Sustainability 2023, 15, 6670. [Google Scholar] [CrossRef]
  21. Kass, M.; Kaul, B.; Armstrong, B.; Szybist, J.; Lobodin, V. Stability, rheological and combustion properties of biodiesel blends with a very-low sulfur fuel oil (VLSFO). Fuel 2022, 316, 123365. [Google Scholar] [CrossRef]
  22. ASTM D-4740-04; Standard Test Method for Cleanliness and Compatibility of Residual Fuels by Spot Test. ASTM International: West Conshohocken, PA, USA, 2014.
  23. Zhou, D.; Wei, H.; Tan, Z.; Xue, S.; Qiu, Y.; Wu, S. Biodiesel as Dispersant to Improve the Stability of Asphaltene in Marine Very-Low-Sulfur Fuel Oil. J. Mar. Sci. Eng. 2023, 11, 315. [Google Scholar] [CrossRef]
  24. Stathatou, P.; Bergeron, S.; Fee, C.; Jeffrey, P.; Triantafyllou, M.; Gershenfeld, N. Towards decarbonization of shipping: Direct emissions & life cycle impacts from a biofuel trial aboard an ocean-going dry bulk vessel. Sustain. Energy Fuels 2022, 6, 1687–1697. [Google Scholar] [CrossRef]
  25. Chountalas, T.; Founti, M.; Tsalavoutas, I. Evaluation of biofuel effect on performance & emissions of a 2-stroke marine diesel engine using on-board measurements. Energy 2023, 278, 127845. [Google Scholar] [CrossRef]
  26. Sagin, S.; Karianskyi, S.; Madey, V.; Sagin, A.; Stoliaryk, T.; Tkachenko, I. Impact of Biofuel on the Environmental and Economic Performance of Marine Diesel Engines. J. Mar. Sci. Eng. 2023, 11, 120. [Google Scholar] [CrossRef]
  27. Sagin, S.; Kuropyatnyk, O.; Matieiko, O.; Razinkin, R.; Stoliaryk, T.; Volkov, O. Ensuring Operational Performance and Environmental Sustainability of Marine Diesel Engines through the Use of Biodiesel Fuel. J. Mar. Sci. Eng. 2024, 12, 1440. [Google Scholar] [CrossRef]
  28. Jang, H.-S.; Kim, J.-S.; Lee, M.-H.; Baek, C.-H.; Seo, J.-W.; Na, Y.-G.; Choi, J.-H. A field-study of the feasibility of the use of biodiesel in the marine industry. J. Int. Marit. Saf. Environ. Aff. Shipp. 2023, 7, 2267905. [Google Scholar] [CrossRef]
  29. Faitar, C.; Voicu, I.; Panaitescu, M.; Nedelcu, A.; Rusu, E. Study on the Potential Impact of Biofuels on the Operation and Maintenance Durability of Marine Main Engine Components. J. Mar. Sci. Eng. 2025, 13, 2398. [Google Scholar] [CrossRef]
  30. Kuszewski, H.; Jaworski, A.; Szpica, D. Performance of Hydrotreated Vegetable Oil–Diesel Blends: Ignition and Combustion Insights. Energies 2025, 18, 5962. [Google Scholar] [CrossRef]
  31. Manikandan, S.; Vickram, S.; Devarajan, Y. Cutting-edge technologies: Biofuel innovations in marine propulsion systems to lower black carbon emissions. Results Eng. 2025, 25, 104095. [Google Scholar] [CrossRef]
  32. Hodovány, S.; Chong, T.; Józsa, V.; Mehmood, Q.; Xiong, J.; Szabó, G.; Bozóki, Z.; Rahman, A.; Ajtai, T. Demonstration of particulate matter characterization from HVO-blended diesel using an integrated multi-instrument approach. Sci. Rep. 2025, 16, 2024. [Google Scholar] [CrossRef] [PubMed]
  33. Zincir, A.; Arslanoglu, Y. Comparative Life Cycle Assessment of Alternative Marine Fuels. Fuel 2024, 358, 129995. [Google Scholar] [CrossRef]
  34. The Marine Environment Protection Committee 2024 Guidelines on Life Cycle GHG Intensity of Marine Fuels (2024 LCA Guidelines). 2024. Available online: https://www.imo.org/en/ourwork/environment/pages/lifecycle-ghg---carbon-intensity-guidelines.aspx (accessed on 12 February 2026).
  35. Souza, L.; Seabra, J. Technical-economic and environmental assessment of marine biofuels produced in Brazil. Clean. Environ. Syst. 2024, 13, 100195. [Google Scholar] [CrossRef]
  36. Esfandiari, H.; Muri, H.; Kramel, D. Biomethanol as a Marine Fuel Within Land Use Sustainability Boundaries. Clean Technol. 2025, 7, 101. [Google Scholar] [CrossRef]
  37. Wei, H.; Zhang, Z.; Zhang, X.; Dong, F.; Yuan, W.; Chen, H. Overview for methanol and formaldehyde unregulated emissions of methanol fueled engines. J. Energy Inst. 2025, 120, 102089. [Google Scholar] [CrossRef]
  38. Guo, H.; Başhan, V.; Yu, C.; Bolat, F.; Demirel, H.; Tian, X. Effect of Methanol Injection Timing on Performance of Marine Diesel Engines and Emission Reduction. J. Mar. Sci. Eng. 2025, 13, 949. [Google Scholar] [CrossRef]
  39. Mallouppas, G.; Yfantis, E.; Ioannou, C.; Paradeisiotis, A.; Ktoris, A. Application of Biogas and Biomethane as Maritime Fuels: A Review of Research, Technology Development, Innovation Proposals, and Market Potentials. Energies 2023, 16, 2066. [Google Scholar] [CrossRef]
  40. Al-Kuwari, A.; Kucukvar, M.; Onat, N.; Al-Yafei, H.; AlNouss, A. Advancing sustainability in LNG-Powered electricity generation: A comprehensive life cycle sustainability assessment. Energy Convers. Manag. X 2025, 26, 100905. [Google Scholar] [CrossRef]
  41. Kuczyński, S.; Łaciak, M.; Szurlej, A.; Włodek, T. Impact of Liquefied Natural Gas Composition Changes on Methane Number as a Fuel Quality Requirement. Energies 2020, 13, 5060. [Google Scholar] [CrossRef]
  42. Kuittinen, N.; Koponen, P.; Vesala, H.; Lehtoranta, K. Methane slip and other emissions from newbuild LNG engine under real-world operation of a state-of-the art cruise ship. Atmos. Environ. X 2024, 23, 100285. [Google Scholar] [CrossRef]
  43. Wu, J.; Zhang, Y.; Yu, M.; Jiang, L. High-efficient boil-off gas storage using low-temperature activated carbon adsorption. Gas Sci. Eng. 2025, 144, 205765. [Google Scholar] [CrossRef]
  44. Wang, C.; Sun, D.; Shen, Q.; Duan, Y.; Huang, X. A re-liquefaction process of LNG boil-off gas using an improved Kapitsa cycle: Eliminating the BOG compressor. Energy 2024, 304, 131979. [Google Scholar] [CrossRef]
  45. Jiang, D.; Khivantsev, K.; Wang, Y. Low-Temperature Methane Oxidation for Efficient Emission Control in Natural Gas Vehicles: Pd and Beyond. ACS Catal. 2020, 10, 14304–14314. [Google Scholar] [CrossRef]
  46. Khan, M.; Lee, J.; Bashir, M.; Dissanayake, P.; Ok, Y.; Tong, Y.; Shariati, M.; Wu, S.; Ahring, B. Current status of biogas upgrading for direct biomethane use: A review. Renew. Sustain. Energy Rev. 2021, 149, 111343. [Google Scholar] [CrossRef]
  47. Gaj, K. Adsorptive Biogas Purification from Siloxanes—A Critical Review. Energies 2020, 13, 2605. [Google Scholar] [CrossRef]
  48. Karne, H.; Mahajan, U.; Ketkar, U.; Kohade, A.; Khadilkar, P.; Mishra, A. A review on biogas upgradation systems. Mater. Today Proc. 2023, 72, 775–786. [Google Scholar] [CrossRef]
  49. Aguilloso, G.; Arpia, K.; Khan, M.; Sapico, Z.; Lopez, E. Recent Advances in Membrane Technologies for Biogas Upgrading. Eng. Proc. 2024, 67, 57. [Google Scholar] [CrossRef]
  50. Tommasi, M.; Degerli, S.; Ramis, G.; Rossetti, I. Advancements in CO2 methanation: A comprehensive review of catalysis, reactor design and process optimization. Chem. Eng. Res. Des. 2024, 201, 457–482. [Google Scholar] [CrossRef]
  51. Kim, J. Ni Catalysts for Thermochemical CO2 Methanation: A Review. Coatings 2024, 14, 1322. [Google Scholar] [CrossRef]
  52. Ardolino, F.; Cardamone, G.; Parrillo, F.; Arena, U. Biogas-to-biomethane upgrading: A comparative review and assessment in a life cycle perspective. Renew. Sustain. Energy Rev. 2021, 139, 110588. [Google Scholar] [CrossRef]
  53. Vali, S.; Moral-Vico, J.; Font, X.; Sánchez, A. Adsorptive removal of siloxanes from biogas: Recent advances in catalyst reusability and water content effect. Biomass Convers. Biorefinery 2024, 14, 23259–23273. [Google Scholar] [CrossRef]
  54. Kızılkaya, Y.; Uyak, V. Adsorptive purification of volatile methyl siloxanes in a digester biogas stream. J. Chem. Technol. Biotechnol. 2021, 96, 3084–3093. [Google Scholar] [CrossRef]
  55. Zhang, W.; Wang, J.; Qin, G.; Kuntal, S.; Gong, F.; Yan, R. Review of the state-of-the-art of alternative marine fuels: A viable approach to zero-carbon shipping. Clean. Logist. Supply Chain 2025, 16, 100232. [Google Scholar] [CrossRef]
  56. Ao, X.; Gan, H.; Xin, M.; Cong, Y.; Lu, D.; Guo, A.; Wang, H. Numerical investigation on the effects of pilot fuel and natural gas injection pressures on methane slip in a large marine dual-fuel engine. Energy 2024, 312, 133675. [Google Scholar] [CrossRef]
  57. Xin, M.; Gan, H.; Cong, Y.; Wang, H. Numerical simulation of methane slip from marine dual-fuel engine based on hydrogen-blended natural gas strategy. Fuel 2024, 358, 130132. [Google Scholar] [CrossRef]
  58. Policano, M.; Lefferts, L.; Faria Jimmy, J. Renaissance of catalytic lean methane oxidation for sustainable maritime transportation. Catal. Rev. 2024, 1–81. [Google Scholar] [CrossRef]
  59. Nitta, Y.; Ichikawa, Y.; Niki, Y.; Masuda, A.; Hirata, K. Performance evaluation of methane oxidation catalyst for marine gas-engine in actual exhaust and simulated gas. Int. J. Engine Res. 2023, 25, 677–689. [Google Scholar] [CrossRef]
  60. Wang, J.; Alkhaledi, A.; Hughes, T.; Webley, P. Technoeconomic investigation of optimal storage pressure and boil-off gas utilisation in large liquid hydrogen carriers. Appl. Energy 2025, 384, 125356. [Google Scholar] [CrossRef]
  61. Passalacqua, M.; Traverso, A. From LNG to LH2 in Maritime Transport: A Review of Technology, Materials, and Safety Challenges. J. Mar. Sci. Eng. 2025, 13, 1748. [Google Scholar] [CrossRef]
  62. Fan, H.; Enshaei, H.; Jayasinghe, S. Safety philosophy and risk analysis methodology for LNG bunkering simultaneous operations (SIMOPs): A literature review. Saf. Sci. 2021, 136, 105150. [Google Scholar] [CrossRef]
  63. Gu, Y.; Zeng, Y.; Loh, H. Quantitative Risk Assessment of Liquefied Natural Gas Bunkering Hoses in Maritime Operations: A Case of Shenzhen Port. J. Mar. Sci. Eng. 2025, 13, 1494. [Google Scholar] [CrossRef]
  64. Grönholm, T.; Mäkelä, T.; Hatakka, J.; Jalkanen, J.-P.; Kuula, J.; Laurila, T.; Laakso, L.; Kukkonen, J. Evaluation of Methane Emissions Originating from LNG Ships Based on the Measurements at a Remote Marine Station. Environ. Sci. Technol. 2021, 55, 13677–13686. [Google Scholar] [CrossRef]
  65. Sagot, B.; Defossez, R.; Mahi, R.; Villot, A.; Joubert, A. An Engine Load Monitoring Approach for Quantifying Yearly Methane Slip Emissions from an LNG-Powered RoPax Vessel. J. Mar. Sci. Eng. 2025, 13, 1379. [Google Scholar] [CrossRef]
  66. Wang, Y.; Wright, L.; Boccolini, V.; Ridley, J. Modelling environmental life cycle performance of alternative marine power configurations with an integrated experimental assessment approach: A case study of an inland passenger barge. Sci. Total Environ. 2024, 947, 173661. [Google Scholar] [CrossRef]
  67. Cao, J.; Liu, Z.; Shi, H.; Dong, D.; Kang, S.; Bu, L. A Review of Marine Dual-Fuel Engine New Combustion Technology: Turbulent Jet-Controlled Premixed-Diffusion Multi-Mode Combustion. Energies 2025, 18, 3903. [Google Scholar] [CrossRef]
  68. Lehtoranta, K.; Vesala, H.; Flygare, N.; Kuittinen, N.; Apilainen, A.-R. Measuring Methane Slip from LNG Engines with Different Devices. J. Mar. Sci. Eng. 2025, 13, 890. [Google Scholar] [CrossRef]
  69. Delikonstantis, E.; Theofanidis, S.; Antzaras, A.; Georgiadis, A.; Yfanti, V.-L.; Varandili, S.; Michan, J.; Ramsay, W. Methane and nitrogen oxides abatement from marine exhaust gases: A review on available plasma-catalytic systems. Catal. Sci. Technol. 2025, 15, 4330–4351. [Google Scholar] [CrossRef]
  70. Shangguan, Y.; Tian, X.; Pang, K.-W.; Wang, S. Optimizing dual-fuel ship operations considering methane slip. Transp. Res. Part B Methodol. 2025, 198, 103247. [Google Scholar] [CrossRef]
  71. Duong, P.; Ryu, B.; Hau, N.; Jung, J.; Lee, J.; Kang, H. A novel designation of LNG solid oxide fuel cells combined system for marine application. Case Stud. Therm. Eng. 2024, 58, 104433. [Google Scholar] [CrossRef]
  72. Lehtoranta, K.; Kuittinen, N.; Vesala, H.; Koponen, P. Methane Emissions from a State-of-the-Art LNG-Powered Vessel. Atmosphere 2023, 14, 825. [Google Scholar] [CrossRef]
  73. Ushakov, S.; Stenersen, D.; Einang, P.M. Methane slip from gas fuelled ships: A comprehensive summary based on measurement data. J. Mar. Sci. Technol. 2019, 24, 1308–1325. [Google Scholar] [CrossRef]
  74. Ejder, E.; Dinçer, S.; Arslanoglu, Y. Decarbonization strategies in the maritime industry: An analysis of dual-fuel engine performance and the carbon intensity indicator. Renew. Sustain. Energy Rev. 2024, 200, 114587. [Google Scholar] [CrossRef]
  75. Tomos, B.; Stamford, L.; Welfle, A.; Larkin, A. Decarbonising international shipping—A life cycle perspective on alternative fuel options. Energy Convers. Manag. 2024, 299, 117848. [Google Scholar] [CrossRef]
  76. Swinbourn, R.; Li, C.; Wang, F. A Comprehensive Review on Biomethane Production from Biogas Separation and its Techno-Economic Assessments. ChemSusChem 2024, 17, e202400779. [Google Scholar] [CrossRef]
  77. Tiago, G.; Rodrigo, N.; Lourinho, G.; Lopes, T.; Gírio, F. Systematic and Bibliometric Review of Biomethane Production from Biomass-Based Residues: Technologies, Economics and Environmental Impact. Fuels 2025, 6, 8. [Google Scholar] [CrossRef]
  78. Cava, C.; Palone, O.; Cedola, L.; Borello, D. Assessment of suitable hydrogen carriers for maritime transport based on energy, environmental, geopolitical and cost implications. Int. J. Hydrogen Energy 2024, 110, 866–879. [Google Scholar] [CrossRef]
  79. Zhou, Z.; Tao, J. Hydrogen-powered vessels in green maritime decarbonization: Policy drivers, technological frontiers and challenges. Front. Mar. Sci. 2025, 12, 1601617. [Google Scholar] [CrossRef]
  80. Abdelghany, M.; Shafiqurrahman, A.; Al-Durra, A.; Mohamed, M.; Hu, J.; Vaccaro, A.; Gao, F.; El Moursi, S. Hydrogen energy systems for decarbonizing smart cities and industrial applications: A review. Renew. Sustain. Energy Rev. 2026, 226, 116370. [Google Scholar] [CrossRef]
  81. Ameli, H.; Strbac, G.; Pudjianto, D.; Ameli, M. A Review of the Role of Hydrogen in the Heat Decarbonization of Future Energy Systems: Insights and Perspectives. Energies 2024, 17, 1688. [Google Scholar] [CrossRef]
  82. Galletti, A.; Pasimeni, F.; Melideo, D.; Desideri, U.; Alkemade, F. Learning in green hydrogen production: Insights from a novel European dataset. Int. J. Hydrogen Energy 2025, 148, 149812. [Google Scholar] [CrossRef]
  83. Wang, X.; Cheng, T.; Hong, H.; Guo, H.; Lin, X.; Yang, X.; Nie, B.; Hu, Z.; Zou, J. Challenges and opportunities in hydrogen storage and transportation: A comprehensive review. Renew. Sustain. Energy Rev. 2025, 219, 115881. [Google Scholar] [CrossRef]
  84. Jayabal, R. Hydrogen energy storage in maritime operations: A pathway to decarbonization and sustainability. Int. J. Hydrogen Energy 2025, 109, 1133–1144. [Google Scholar] [CrossRef]
  85. Coelho, M.; Gaspar, G.; Surra, E.; Coelho, P.; Ferreira, A. Systematic Analysis of the Hydrogen Value Chain from Production to Utilization. Appl. Sci. 2025, 15, 8242. [Google Scholar] [CrossRef]
  86. Nayebossadri, S.; Walsh, M.; Smailes, M. An Overview of the Green Hydrogen Value Chain Technologies and Their Challenges for a Net-Zero Future. Hydrogen 2025, 6, 26. [Google Scholar] [CrossRef]
  87. Younus, H.; Hajri, R.; Ahmad, N.; Al-Jammal, N.; Verpoort, F.; Abri, M. Green hydrogen production and deployment: Opportunities and challenges. Discov. Electrochem. 2025, 2, 32. [Google Scholar] [CrossRef]
  88. Ahmad, A.; Nnabuife, S.; Oko, E.; Ibhadon, A. Comprehensive review of advances and challenges in hydrogen liquefaction. Next Sustain. 2025, 6, 100192. [Google Scholar] [CrossRef]
  89. Fan, X.; Cheng, Y. Hydrogen pipelines and embrittlement in gaseous environments: An up-to-date review. Appl. Energy 2025, 387, 125636. [Google Scholar] [CrossRef]
  90. Islam, A.; Li, Q.; Storimans, E.; Ton, K.; Alam, T.; Farhat, Z. Effect of microstructure on hydrogen permeation and trapping in natural gas pipeline steels. npj Mater. Degrad. 2025, 9, 70. [Google Scholar] [CrossRef] [PubMed]
  91. Naquash, A.; Agarwal, N.; Lee, M. A Review on Liquid Hydrogen Storage: Current Status, Challenges and Future Directions. Sustainability 2024, 16, 8270. [Google Scholar] [CrossRef]
  92. IEA. Global Hydrogen Review 2024; IEA: Paris, France, 2024; Available online: https://www.iea.org/reports/global-hydrogen-review-2024 (accessed on 15 January 2026).
  93. Navinkumar, T.; Bharatiraja, C. Sustainable hydrogen energy fuel cell electric vehicles: A critical review of system components and innovative development recommendations. Renew. Sustain. Energy Rev. 2025, 215, 115601. [Google Scholar] [CrossRef]
  94. Parola, N.; Peyrani, G.; Marocco, P.; Gandiglio, M.; Santarelli, M. Impact of control strategies on the degradation of hybrid hydrogen-battery powertrains in railway applications. Int. J. Hydrogen Energy 2025, 177, 151529. [Google Scholar] [CrossRef]
  95. Zhaka, V.; Samuelsson, B. Hydrogen as fuel in the maritime sector: From production to propulsion. Energy Rep. 2024, 12, 5249–5267. [Google Scholar] [CrossRef]
  96. Fan, H.; Abdussamie, N.; Chen, P.; Harris, A.; Gray, E.; Arzaghi, E.; Bhaskar, P.; Mehr, J.; Penesis, I. Two decades of hydrogen-powered ships (2000–2024): Evolution, challenges, and future perspectives. Renew. Sustain. Energy Rev. 2025, 219, 115878. [Google Scholar] [CrossRef]
  97. Hoecke, L.; Laffineur, L.; Campe, R.; Perreault, P.; Verbruggen, S.; Lenaerts, S. Challenges in the use of hydrogen for maritime applications. Energy Environ. Sci. 2021, 14, 815–843. [Google Scholar] [CrossRef]
  98. Ustolin, F.; Campari, A.; Taccani, R. An Extensive Review of Liquid Hydrogen in Transportation with Focus on the Maritime Sector. J. Mar. Sci. Eng. 2022, 10, 1222. [Google Scholar] [CrossRef]
  99. Hassan, I.; Ramadan, H.; Saleh, M.; Hissel, D. Hydrogen storage technologies for stationary and mobile applications: Review, analysis and perspectives. Renew. Sustain. Energy Rev. 2021, 149, 111311. [Google Scholar] [CrossRef]
  100. Aziz, M. Liquid Hydrogen: A Review on Liquefaction, Storage, Transportation, and Safety. Energies 2021, 14, 5917. [Google Scholar] [CrossRef]
  101. Letsios, K.; Charisiou, N.D.; Skodras, G.S.; Goula, M.A.; Douvartzides, S.L. Hydrogen Compression Choices for Tomorrow’s Refueling Stations: Review of Recent Advances and Selection Guide. Hydrogen 2026, 7, 25. [Google Scholar] [CrossRef]
  102. Zhang, T.; Uratani, J.; Huang, Y.; Xu, L.; Griffiths, S.; Ding, Y. Hydrogen liquefaction and storage: Recent progress and perspectives. Renew. Sustain. Energy Rev. 2023, 176, 113204. [Google Scholar] [CrossRef]
  103. Halder, P.; Babaie, M.; Salek, F.; Haque, N.; Savage, R.; Stevanovic, S.; Bodisco, T.; Zare, A. Advancements in hydrogen production, storage, distribution and refuelling for a sustainable transport sector: Hydrogen fuel cell vehicles. Int. J. Hydrogen Energy 2024, 52, 973–1004. [Google Scholar] [CrossRef]
  104. Zhang, J.; Meerman, H.; Benders, R.; Faaij, A. Comprehensive review of current natural gas liquefaction processes on technical and economic performance. Appl. Therm. Eng. 2020, 166, 114736. [Google Scholar] [CrossRef]
  105. Satyapal, S. Energy Requirements for Hydrogen Gas Compression and Liquefaction as Related to Vehicle Storage Needs. 2009. Available online: https://www.hydrogen.energy.gov/docs/hydrogenprogramlibraries/pdfs/9013_energy_requirements_for_hydrogen_gas_compression.pdf? (accessed on 20 January 2026).
  106. Ghafri, S.; Munro, S.; Cardella, U.; Funke, T.; Notardonato, W.; Trusler, J.; Leachman, J.; Span, R.; Kamiya, S.; Pearce, G.; et al. Hydrogen liquefaction: A review of the fundamental physics, engineering practice and future opportunities. Energy Environ. Sci. 2022, 15, 2690–2731. [Google Scholar] [CrossRef]
  107. Nachtane, M.; Faik, A. Innovations in hydrogen storage tanks: Advancing safety, sustainability, and smart monitoring for practical applications. Int. J. Hydrogen Energy 2025, 190, 152233. [Google Scholar] [CrossRef]
  108. Rahman, M.H.; Baldacci, R. Safety risks assessment of infrastructure challenges in liquid hydrogen transport in a multimodal network: An ISM-FIS-based analysis. Energy Convers. Manag. X 2026, 29, 101470. [Google Scholar] [CrossRef]
  109. Gao, X.; Chen, H.; Zhou, C.; Xiong, C.; Pu, W.; Zeng, T.; Men, J.; Lv, H.; Zhao, Y.; Chen, G. A review of safety risk management strategies for hydrogen refueling stations. Renew. Sustain. Energy Rev. 2026, 226, 116297. [Google Scholar] [CrossRef]
  110. Hmaimid, Z.; Thoppurathu Varghese, R.; Finger, D.C.; Guðlaugsson, B.; Costa, D.A.; Ahmed, T.; Arackal Narayanan, J. A comprehensive review on the compatibility of polymeric materials for hydrogen transportation and storage. Int. J. Hydrogen Energy 2025, 192, 152366. [Google Scholar] [CrossRef]
  111. Nguyen, L.-D.; Kim, M.; Do, K.H.; Han, Y. Boil-off of cryogenic liquid due to sudden loss of vacuum in a double-walled vacuum-insulated tank. J. Mech. Sci. Technol. 2025, 39, 4217–4226. [Google Scholar] [CrossRef]
  112. Liu, Y.; Zhou, P.; Jeong, B.; Wang, H. Design and optimization of a type-C tank for liquid hydrogen marine transport. Int. J. Hydrogen Energy 2023, 48, 34885–34896. [Google Scholar] [CrossRef]
  113. Schiaroli, A.; Claussner, L.; Campari, A.; Cirrone, D.; Linseisen, B.; Friedrich, A.; Ritter, E.; Kuznetsov, M.; Ustolin, F. A comprehensive review on liquid hydrogen transfer operations and safety considerations for mobile applications. Int. J. Hydrogen Energy 2025, 107, 164–182. [Google Scholar] [CrossRef]
  114. Alkhaledi, A.; Sampath, S.; Pilidis, P. A hydrogen fuelled LH2 tanker ship design. Ships Offshore Struct. 2022, 17, 1555–1564. [Google Scholar] [CrossRef]
  115. Elkafas, A.; Rivarolo, M.; Gadducci, E.; Magistri, L.; Massardo, A.F. Fuel Cell Systems for Maritime: A Review of Research Development, Commercial Products, Applications, and Perspectives. Processes 2023, 11, 97. [Google Scholar] [CrossRef]
  116. Radica, G.; Tolj, I.; Nyamsi, S.; Vidović, T. Performances of proton exchange membrane fuel cells in marine application. Int. J. Hydrogen Energy 2025, 142, 186–194. [Google Scholar] [CrossRef]
  117. Veldhuizen, B.; Biert, L.; Aravind, P.; Visser, K. Solid Oxide Fuel Cells for Marine Applications. Int. J. Energy Res. 2023, 2023, 5163448. [Google Scholar] [CrossRef]
  118. Wang, L.; Li, X.; Hong, C.; Guo, P.; Guo, S.; Yang, Z. Research and Development of Hydrogen-Fueled Internal Combustion Engines in China. ACS Omega 2023, 8, 48590–48612. [Google Scholar] [CrossRef]
  119. Agyekum, E.; Tarawneh, B.; Rashid, F. State-of-the-Art review of liquid organic hydrogen carriers for hydrogen storage and transport: Challenges and perspectives. Appl. Energy 2025, 400, 126555. [Google Scholar] [CrossRef]
  120. Spatolisano, E.; Restelli, F.; Pellegrini, L.; Cattaneo, S.; de Angelis, A.; Lainati, A.; Roccaro, E. Liquefied hydrogen, ammonia and liquid organic hydrogen carriers for harbour-to-harbour hydrogen transport: A sensitivity study. Int. J. Hydrogen Energy 2024, 80, 1424–1431. [Google Scholar] [CrossRef]
  121. Chu, C.; Wu, K.; Luo, B.; Cao, Q.; Zhang, H. Hydrogen storage by liquid organic hydrogen carriers: Catalyst, renewable carrier, and technology—A review. Carbon Resour. Convers. 2023, 6, 334–351. [Google Scholar] [CrossRef]
  122. Kojima, Y. Safety of ammonia as a hydrogen energy carrier. Int. J. Hydrogen Energy 2024, 50, 732–739. [Google Scholar] [CrossRef]
  123. Wei, H.; Müller-Casseres, E.; Belchior, C.; Szklo, A. Evaluating the Readiness of Ships and Ports to Bunker and Use Alternative Fuels: A Case Study from Brazil. J. Mar. Sci. Eng. 2023, 11, 1856. [Google Scholar] [CrossRef]
  124. Aziz, M.; Wijayanta, A.; Nandiyanto, A. Ammonia as Effective Hydrogen Storage: A Review on Production, Storage and Utilization. Energies 2020, 13, 3062. [Google Scholar] [CrossRef]
  125. Lee, J.; Lee, J.; Jeong, H.; Park, Y.-K.; Kim, B.-S. Catalytic ammonia decomposition to produce hydrogen: A mini-review. Chem. Eng. J. 2023, 475, 146108. [Google Scholar] [CrossRef]
  126. Xing, H.; Stuart, C.; Spence, S.; Chen, H. Fuel Cell Power Systems for Maritime Applications: Progress and Perspectives. Sustainability 2021, 13, 1213. [Google Scholar] [CrossRef]
  127. Gao, N.; Geng, Z.; Zhao, W.; Geng, L.; Dong, F.; Huang, D. Review on the combustion and emission characteristics of hydrogen engine. Int. J. Hydrogen Energy 2025, 143, 121–146. [Google Scholar] [CrossRef]
  128. Gu, B.; Zhou, P.; Chen, N.; Karvounis, P.; Theotokatos, G.; Yang, L. Hydrogen–diesel dual-fuel combustion in marine medium-speed engines: Knocking suppression by direct water injection at high hydrogen substitution ratios. Int. J. Hydrogen Energy 2026, 197, 152569. [Google Scholar] [CrossRef]
  129. Arcos, J.; Santos, D. The Hydrogen Color Spectrum: Techno-Economic Analysis of the Available Technologies for Hydrogen Production. Gases 2023, 3, 25–46. [Google Scholar] [CrossRef]
  130. Zhai, L.; Liu, S.; Xiang, Z. Ammonia as a carbon-free hydrogen carrier for fuel cells: A perspective. Ind. Chem. Mater. 2023, 1, 332–342. [Google Scholar] [CrossRef]
  131. IRENA. Shaping Sustainable International Hydrogen Value Chains; IRENA: Abu Dhabi, United Arab Emirates, 2024. [Google Scholar]
  132. Kruth, A.; Käding, S.; Wartmann, J. Renewable Ammonia for Global Energy Transition. Energy Technol. 2025, 13, 2400841. [Google Scholar] [CrossRef]
  133. Salmon, N.; Bañares-Alcántara, R. Impact of process flexibility and imperfect forecasting on the operation and design of Haber–Bosch green ammonia. RSC Sustain. 2023, 1, 923–937. [Google Scholar] [CrossRef]
  134. Smith, C.; Torrente-Murciano, L. Cost efficiency versus energy utilization in green ammonia production from intermittent renewable energy. Nat. Chem. Eng. 2025, 2, 261–272. [Google Scholar] [CrossRef] [PubMed]
  135. Ahsan, A.; Hussain, M.; Rashad, M.; Akhter, P.; Jamil, F.; Cho, K.; Park, Y.-K. Critical review on electrocatalytic reduction of nitrogen and nitrate to ammonia. J. Ind. Eng. Chem. 2025, 149, 313–336. [Google Scholar] [CrossRef]
  136. Tian, F.; Zhou, N.; Chen, W.; Zhan, J.; Tang, L.; Wu, M. Progress in Green Ammonia Synthesis Technology: Catalytic Behavior of Ammonia Synthesis Catalysts. Adv. Sustain. Syst. 2024, 8, 2300618. [Google Scholar] [CrossRef]
  137. Chang, W.; Jain, A.; Rezaie, F.; Manthiram, K. Lithium-mediated nitrogen reduction to ammonia via the catalytic solid–electrolyte interphase. Nat. Catal. 2024, 7, 231–241. [Google Scholar] [CrossRef]
  138. Mangini, A.; Fagiolari, L.; Sacchetti, A.; Garbujo, A.; Biasi, P.; Bella, F. Lithium-Mediated Nitrogen Reduction for Ammonia Synthesis: Reviewing the Gap between Continuous Electrolytic Cells and Stepwise Processes through Galvanic Li—N2 Cells. Adv. Energy Mater. 2024, 14, 2400076. [Google Scholar] [CrossRef]
  139. Zhang, J.; Li, X.; Zheng, J.; Du, M.; Wu, X.; Song, J.; Cheng, C.; Li, T.; Yang, W. Non-thermal plasma-assisted ammonia production: A review. Energy Convers. Manag. 2023, 293, 117482. [Google Scholar] [CrossRef]
  140. Qu, Z.; Zhou, R.; Sun, J.; Gao, Y.; Li, Z.; Zhang, T.; Zhou, R.; Liu, D.; Tu, X.; Cullen, P.; et al. Plasma-Assisted Sustainable Nitrogen-to-Ammonia Fixation: Mixed-phase, Synergistic Processes and Mechanisms. ChemSusChem 2024, 17, e202300783. [Google Scholar] [CrossRef] [PubMed]
  141. Collado, L.; Pizarro, A.; Barawi, M.; García-Tecedor, M.; Liras, M.; O’Shea, V. Light-driven nitrogen fixation routes for green ammonia production. Chem. Soc. Rev. 2024, 53, 11334–11389. [Google Scholar] [CrossRef]
  142. Brown, S.; Hu, J. Review of chemical looping ammonia synthesis materials. Chem. Eng. Sci. 2023, 280, 119063. [Google Scholar] [CrossRef]
  143. Fu, E.; Gong, F.; Wang, S.; Xiao, R. Chemical Looping Technology in Mild-Condition Ammonia Production: A Comprehensive Review and Analysis. Small 2024, 20, 2305095. [Google Scholar] [CrossRef]
  144. Lee, J.; Kim, S.; Kim, S.-H.; Baek, J.-H.; Seo, J.-M.; Lee, S.J.; Li, C.; Guan, R.; Jang, B.-J.; Han, G.-F.; et al. Mechanochemical ammonia synthesis enhanced by silicon nitride as a defect-inducing physical promoter. Nat. Commun. 2025, 16, 5703. [Google Scholar] [CrossRef] [PubMed]
  145. Solomon, J.B.; Lee, C.C.; Liu, Y.A.; Duffin, C.; Ribbe, M.W.; Hu, Y. Ammonia synthesis via an engineered nitrogenase assembly pathway in Escherichia coli. Nat. Catal. 2024, 7, 1130–1141. [Google Scholar] [CrossRef]
  146. Ebrahimzadeh, P.; Navidjouy, N.; Khorsandi, H.; Rahimnejad, M. Application of Bioelectrochemical System in Nitrogen Removal via Simultaneous Autotrophic Nitrification and Denitrification from Wastewater. ChemElectroChem 2024, 11, e202400432. [Google Scholar] [CrossRef]
  147. Alnajideen, M.; Shi, H.; Northrop, W.; Emberson, D.; Kane, S.; Czyzewski, P.; Alnaeli, M.; Mashruk, S.; Rouwenhorst, K.; Yu, C.; et al. Ammonia combustion and emissions in practical applications: A review. Carbon Neutrality 2024, 3, 13. [Google Scholar] [CrossRef]
  148. Ribeiro, C.; Santos, D. Transitioning Ammonia Production: Green Hydrogen-Based Haber–Bosch and Emerging Nitrogen Reduction Technologies. Clean Technol. 2025, 7, 49. [Google Scholar] [CrossRef]
  149. Pedersen, K.; Lewandowski, M.; Schulze-Netzer, C.; Pasternak, M.; Løvås, T. Ammonia in Dual-Fueled Internal Combustion Engines: Impact on NOx, N2O, and Soot Formation. Energy Fuels 2023, 37, 17585–17604. [Google Scholar] [CrossRef]
  150. Eyisse, E.; Nadimi, E.; Wu, D. Ammonia Combustion: Internal Combustion Engines and Gas Turbines. Energies 2025, 18, 29. [Google Scholar] [CrossRef]
  151. Zhou, X.; Li, T.; Chen, R.; Wei, Y.; Wang, X.; Wang, N.; Li, S.; Kuang, M.; Yang, W. Ammonia marine engine design for enhanced efficiency and reduced greenhouse gas emissions. Nat. Commun. 2024, 15, 2110. [Google Scholar] [CrossRef]
  152. Esquivel-Elizondo, S.; Walkowiak, B.; Sartzetakis, S.; Buma, B. Climate Impact of Direct and Indirect N2O Emissions from the Ammonia Marine Fuel Value Chain. Environ. Sci. Technol. 2025, 59, 9037–9048. [Google Scholar] [CrossRef]
  153. Machaj, K.; Kupecki, J.; Malecha, Z.; Morawski, A.; Skrzypkiewicz, M.; Stanclik, M.; Chorowski, M. Ammonia as a potential marine fuel: A review. Energy Strateg. Rev. 2022, 44, 100926. [Google Scholar] [CrossRef]
  154. Lankahaluge, A.; Graham, T.; Wang, H.; Bashir, M.; Blanco-Davis, E.; Wang, J. Formal Safety Assessment for Ammonia Fuel Storage Onboard Ships Using Bayesian Network. J. Mar. Sci. Eng. 2025, 13, 768. [Google Scholar] [CrossRef]
  155. Jang, H.; Mujeeb-Ahmed, M.; Wang, H.; Park, C.; Hwang, I.; Jeong, B.; Zhou, P.; Papadakis, A.; Giannakis, A.; Sykaras, K. Safety evaluation on ammonia-fueled ship: Gas dispersion analysis through vent mast. Int. J. Hydrogen Energy 2024, 83, 1060–1077. [Google Scholar] [CrossRef]
  156. Yang, L.; Gu, B.; Mujeeb-Ahmed, M.; Zhou, P.; Jeong, B.; Wang, H.; Mesbahi, A.; Yang, I. Effectiveness of mechanical ventilation in mitigating ammonia leaks: A safety assessment for ammonia-fuelled ships. Int. J. Hydrogen Energy 2025, 178, 151568. [Google Scholar] [CrossRef]
  157. Trangwachirachai, K.; Rouwenhorst, K.; Lefferts, L.; Albanese, J. Recent progress on ammonia cracking technologies for scalable hydrogen production. Curr. Opin. Green Sustain. Chem. 2024, 49, 100945. [Google Scholar] [CrossRef]
  158. Le, D.-D.; Nguyen, H.-L.; Yu, S.; Le, H.; Hoang, T.-D. Progress and outlook of solid oxide fuel cell technology for stationary power generation applications. Front. Energy Res. 2025, 13, 1650696. [Google Scholar] [CrossRef]
  159. Yuksel, O.; Blanco-Davis, E.; Hitchmough, D.; Shagar, G.; Spiteri, A.; Di Piazza, M.; Pucci, M.; Tsoulakos, N.; Armin, M.; Wang, J. Integrated Approach to Ship Electrification Using Fuel Cells and an Ammonia Decomposition System. J. Mar. Sci. Eng. 2025, 13, 977. [Google Scholar] [CrossRef]
  160. Wang, H.; Zhou, P.; Jeong, B.; Mesbahi, A.; Mujeeb-Ahmed, M.; Jang, H.; Giannakis, A.; Sykaras, K.; Papadakis, A. Life cycle analysis of ammonia fuelled ship—Case ship studies for marine vessels. J. Clean. Prod. 2025, 520, 146105. [Google Scholar] [CrossRef]
  161. Salehmin, M.; Kiong, T.; Mohamed, H.; Mahlia, T.; Aziz, N.; Timmiati, S.; Zakaria, Z. Transition pathway from blue to green ammonia production: Comparative insight into technoeconomic, environmental, and policy framework. Int. J. Hydrogen Energy 2025, 143, 147–178. [Google Scholar] [CrossRef]
  162. Masia, B.; Yang, M.; Cozzani, V. Risk Assessment of Ammonia Fueled Ships: Consequences on Human Health of Ammonia Releases from Damaged Fuel Storage Tanks. ACS Chem. Health Saf. 2024, 31, 503–520. [Google Scholar] [CrossRef]
  163. Park, E.; Seo, Y.; Han, S.; Cho, M. Hazard Identification of Ammonia FSS for Ammonia Fuelled Ammonia Carrier. J. Ocean Eng. Technol. 2024, 38, 402–413. [Google Scholar] [CrossRef]
  164. Yang, M.; Lam, J. Risk assessment of ammonia bunkering operations: Perspectives on different release scales. J. Hazard. Mater. 2024, 468, 133757. [Google Scholar] [CrossRef]
  165. Izelaar, B.; Ripepi, D.; Asperti, S.; Dugulan, A.I.; Hendrikx, R.; Böttger, A.; Mulder, F.M.; Kortlever, R. Revisiting the Electrochemical Nitrogen Reduction on Molybdenum and Iron Carbides: Promising Catalysts or False Positives? ACS Catal. 2023, 13, 1649–1661. [Google Scholar] [CrossRef]
  166. Choi, J.; Suryanto, B.; Wang, D.; Du, H.-L.; Hodgetts, R.; Ferrero Vallana, F.; MacFarlane, D.; Simonov, A. Identification and elimination of false positives in electrochemical nitrogen reduction studies. Nat. Commun. 2020, 11, 5546. [Google Scholar] [CrossRef] [PubMed]
  167. Blair, S.; Doucet, M.; Browning, J.; Stone, K.; Wang, H.; Halbert, C.; Avilés Acosta, J.; Zeledón, J.; Nielander, A.; Gallo, A.; et al. Lithium-Mediated Electrochemical Nitrogen Reduction: Tracking Electrode–Electrolyte Interfaces via Time-Resolved Neutron Reflectometry. ACS Energy Lett. 2022, 7, 1939–1946. [Google Scholar] [CrossRef]
  168. Kaur, G.; Zhu, H.; Dhawale, D.; Ju, H.; Biswas, S.; Kim, J.H.; Yoon, H.C.; Giddey, S. A review on intermediate temperature electrochemical synthesis of ammonia. Appl. Energy 2025, 393, 126092. [Google Scholar] [CrossRef]
  169. Murphy, E.; Liu, Y.; Matanovic, I.; Rüscher, M.; Huang, Y.; Ly, A.; Guo, S.; Zang, W.; Yan, X.; Martini, A.; et al. Elucidating electrochemical nitrate and nitrite reduction over atomically-dispersed transition metal sites. Nat. Commun. 2023, 14, 4554. [Google Scholar] [CrossRef]
  170. Li, L.; Tang, C.; Yao, D.; Zheng, Y.; Qiao, S.-Z. Electrochemical Nitrogen Reduction: Identification and Elimination of Contamination in Electrolyte. ACS Energy Lett. 2019, 4, 2111–2116. [Google Scholar] [CrossRef]
  171. Khan, R.U.; Yin, J.; Wang, S.; Hussein, M.; Alqurashi, Y.; Al Sulaie, S. A system theoretic quantitative risk assessment for port ammonia bunkering operations. Int. J. Hydrogen Energy 2025, 172, 151217. [Google Scholar] [CrossRef]
  172. Marques, L.; Vieira, M.; Condeço, J.; Sousa, H.; Henriques, C.; Mateus, M. Review of Power-to-Liquid (PtL) Technology for Renewable Methanol (e-MeOH): Recent Developments, Emerging Trends and Prospects for the Cement Plant Industry. Energies 2024, 17, 5589. [Google Scholar] [CrossRef]
  173. Pakdel, A.; Eslamloueyan, R. Techno-economic and sustainability assessment of the power to MeOH processes: The present and future perspective. Heliyon 2024, 10, e39860. [Google Scholar] [CrossRef] [PubMed]
  174. Kanchiralla, F.; Brynolf, S.; Malmgren, E.; Hansson, J.; Grahn, M. Life-Cycle Assessment and Costing of Fuels and Propulsion Systems in Future Fossil-Free Shipping. Environ. Sci. Technol. 2022, 56, 12517–12531. [Google Scholar] [CrossRef]
  175. Poulsen, L.; Skov, I.; Elliot, T.; Løkke, S. Life cycle assessment of Power-to-X integration in renewable energy systems. J. Clean. Prod. 2025, 513, 145713. [Google Scholar] [CrossRef]
  176. Wu, P.-C.; Lin, C.-Y. Feasibility and Cost-Benefit Analysis of Methanol as a Sustainable Alternative Fuel for Ships. J. Mar. Sci. Eng. 2025, 13, 973. [Google Scholar] [CrossRef]
  177. Cameli, F.; Delikonstantis, E.; Kourou, A.; Rosa, V.; Van Geem, K.; Stefanidis, G. Conceptual Process Design and Technoeconomic Analysis of an e-Methanol Plant with Direct Air-Captured CO2 and Electrolytic H2. Energy Fuels 2024, 38, 3251–3261. [Google Scholar] [CrossRef]
  178. Kong, Z.; Hooi, S.; Yang, A.; Shi, T.; Wong, B.; Sunarso, J. Illuminating the Future of E-Methanol: Solar Energy Pathways and Prospects. J. Chem. Eng. Jpn. 2025, 58, 2532867. [Google Scholar] [CrossRef]
  179. Akac, A.; Anagnostopoulou, A.; Kappatos, V. Investigation of methanol as long-term energy efficiency solution for maritime decarbonization in container vessels. Transp. Res. Procedia 2025, 83, 170–177. [Google Scholar] [CrossRef]
  180. Sollai, S.; Porcu, A.; Tola, V.; Ferrara, F.; Pettinau, A. Renewable methanol production from green hydrogen and captured CO2: A techno-economic assessment. J. CO2 Util. 2023, 68, 102345. [Google Scholar] [CrossRef]
  181. Zhang, J.; Zhang, Z.; Liu, D. Comparative Study of Different Alternative Fuel Options for Shipowners Based on Carbon Intensity Index Model Under the Background of Green Shipping Development. J. Mar. Sci. Eng. 2024, 12, 2044. [Google Scholar] [CrossRef]
  182. Kiouranakis, K.; Vos, P.; Zoumpourlos, K.; Coraddu, A.; Geertsma, R. Methanol for heavy-duty internal combustion engines: Review of experimental studies and combustion strategies. Renew. Sustain. Energy Rev. 2025, 214, 115529. [Google Scholar] [CrossRef]
  183. Karvounis, P.; Theotokatos, G.; Patil, C.; Xiang, L.; Ding, Y. Parametric investigation of diesel–methanol dual fuel marine engines with port and direct injection. Fuel 2025, 381, 133441. [Google Scholar] [CrossRef]
  184. Nia, S.; Shahbeik, H.; Shafizadeh, A.; Rafiee, S.; Hosseinzadeh-Bandbafha, H.; Kiehbadroudinezhad, M.; Tajuddin, S.; Tabatabaei, M.; Aghbashlo, M. Machine learning-driven optimization for sustainable CO2-to-methanol conversion through catalytic hydrogenation. Energy Convers. Manag. 2025, 325, 119373. [Google Scholar] [CrossRef]
  185. Sajnani, S.; Memon, M.; Memon, S.; Kumar, A.; Mehvish, D.; Ameen, S.; Zhou, W.; Liu, Y. CO2 to Methanol Conversion: A Bibliometric Analysis with Insights into Reaction Mechanisms, and Recent Advances in Catalytic Conversion. Processes 2025, 13, 314. [Google Scholar] [CrossRef]
  186. Kar, S.; Kim, D.; Annuar, A.; Sarma, B.; Stanton, M.; Lam, E.; Bhattacharjee, S.; Karak, S.; Greer, H.; Reisner, E. Direct air capture of CO2 for solar fuel production in flow. Nat. Energy 2025, 10, 448–459. [Google Scholar] [CrossRef]
  187. Li, K.; Cai, J.; Wang, Y.; Cheng, X.; Li, D.; Li, Z.; Zhao, H.; Tian, D.; Zhu, T.; Wang, H. Co-hydrogenation of CO2 and CO to methanol: A perspective. Carbon Neutral Syst. 2025, 1, 2. [Google Scholar] [CrossRef]
  188. Park, C.; Hwang, I.; Jang, H.; Jeong, B.; Ha, S.; Kim, J.; Jee, J. Comparative Analysis of Marine Alternative Fuels for Offshore Supply Vessels. Appl. Sci. 2024, 14, 11196. [Google Scholar] [CrossRef]
  189. Akbari, S.; Hakkaki-Fard, A.; Shafii, M.B. Techno-economic optimization of e-methanol production integrated with oxy-fuel power plants: An adaptive power management case study in Australia. Energy Convers. Manag. 2026, 347, 120569. [Google Scholar] [CrossRef]
  190. Sillman, J.; Ylä-Kujala, A.; Hyypiä, J.; Kärri, T.; Tuomaala, M.; Soukka, R. Feasibility assessment of e-methanol value chains: Temporal and regional renewable energy, costs, and climate impacts. Appl. Energy 2025, 391, 125887. [Google Scholar] [CrossRef]
  191. Wang, Z.; Liao, P.; Long, F.; Wang, Z.; Ji, Y.; Han, F. Maritime electrification pathways for sustainable shipping: Technological advances, environmental drivers, challenges, and prospects. eTransportation 2025, 26, 100462. [Google Scholar] [CrossRef]
  192. Katumwesigye, A.; Schwartz, H.; Gustafsson, M.; Hellström, M. A comparative technoeconomic and life cycle assessment of a fully battery-electric ROPAX ferry. J. Clean. Prod. 2025, 534, 146935. [Google Scholar] [CrossRef]
  193. Bugryniec, P.; Resendiz, E.; Nwophoke, S.; Khanna, S.; James, C.; Brown, S. Review of gas emissions from lithium-ion battery thermal runaway failure—Considering toxic and flammable compounds. J. Energy Storage 2024, 87, 111288. [Google Scholar] [CrossRef]
  194. Brötje, S.; Mühmer, M.; Schwedt, T.; Tran, A.; Ehlers, S. A case study of enhancing energy efficiency in battery-electric ferries through low-temperature heat pump integration. J. Mar. Eng. Technol. 2025, 1–10. [Google Scholar] [CrossRef]
  195. Brynolf, S.; Fridell, E.; Andersson, K. Environmental assessment of marine fuels: Liquefied natural gas, liquefied biogas, methanol and bio-methanol. J. Clean. Prod. 2014, 74, 86–95. [Google Scholar] [CrossRef]
  196. Gilbert, P.; Walsh, C.; Traut, M.; Kesieme, U.; Pazouki, K.; Murphy, A. Assessment of full life-cycle air emissions of alternative shipping fuels. J. Clean. Prod. 2018, 172, 855–866. [Google Scholar] [CrossRef]
  197. Stark, C.; Xu, Y.; Zhang, M.; Yuan, Z.; Tao, L.; Shi, W. Study on Applicability of Energy-Saving Devices to Hydrogen Fuel Cell-Powered Ships. J. Mar. Sci. Eng. 2022, 10, 388. [Google Scholar] [CrossRef]
  198. Güleroğlu, H.; Yumurtacı, Z. Life Cycle Assessment of Green Methanol Production Based on Multi-Seasonal Modeling of Hybrid Renewable Energy and Storage Systems. Sustainability 2025, 17, 624. [Google Scholar] [CrossRef]
  199. Jeong, B.; Jeon, H.; Kim, S.; Kim, J.; Zhou, P. Evaluation of the Lifecycle Environmental Benefits of Full Battery Powered Ships: Comparative Analysis of Marine Diesel and Electricity. J. Mar. Sci. Eng. 2020, 8, 580. [Google Scholar] [CrossRef]
  200. Moon, H.; Park, W.; Hendrickson, T.; Phadke, A.; Popovich, N. Exploring the cost and emissions impacts, feasibility and scalability of battery electric ships. Nat. Energy 2025, 10, 41–54. [Google Scholar] [CrossRef]
  201. Llamas-Orozco, J.A.; Meng, F.; Walker, G.S.; Abdul-Manan, A.F.N.; MacLean, H.L.; Posen, I.D.; McKechnie, J. Estimating the environmental impacts of global lithium-ion battery supply chain: A temporal, geographical, and technological perspective. PNAS Nexus 2023, 2, pgad361. [Google Scholar] [CrossRef]
  202. Zhang, H.; Maydison; Kang, H.; Kim, Y.-H.; Jang, J.; Han, Z.; Oh, D. Effective energy density in small vessels: A comparative study of diesel engines and battery electric propulsion systems. Int. J. Nav. Archit. Ocean Eng. 2025, 17, 100681. [Google Scholar] [CrossRef]
  203. Wei, S.; Kanchiralla, F.; Schulte, F.; Polinder, H.; Tukker, A.; Steubing, B. Life cycle assessment of hydrogen-based fuels use in internal combustion engines of container ships until 2050. Resour. Conserv. Recycl. 2026, 226, 108671. [Google Scholar] [CrossRef]
  204. Graziano, B.; Topaloglou, S.; Purayil, A.; Avisiati, I.; Christen, C.; Bouwstra, A.; von Rotz, B.; Heizer, V.; Rohner, L. WinGD’s ammonia engine technology for the new X-DF-A family. In Proceedings of the 31st CIMAC World Congress, Zurich, Switzerland, 19–23 May 2025; p. 329. [Google Scholar]
  205. Hult, J.; Sjöholm, J.; Westlye, F.R.; Ringsted, B.; Kaltoft, J.; Mayer, S. High efficiency ammonia combustion in the MAN B&W LGI-A marine two-stroke engine. In Proceedings of the 31st CIMAC World Congress, Zurich, Switzerland, 19–23 May 2025; p. 082. [Google Scholar]
  206. Sjöholm, J.; Ringsted, B.; Kryger, J.; Ishibashi, R.; Fukushima, T. Hydrogen-based ship propulsion; first ever large two-stroke engine tests with hydrogen. In Proceedings of the 31st CIMAC World Congress, Zurich, Switzerland, 19–23 May 2025; p. 097. [Google Scholar]
  207. DNV. Maritime Forecast to 2050—A Deep Dive into Shipping’s Decarbonization Journey; DNV: Høvik, Norway, 2025. [Google Scholar]
  208. Trillos, J.; Wilken, D.; Brand, U.; Vogt, T. Life Cycle Assessment of a Hydrogen and Fuel Cell RoPax Ferry Prototype BT. In Progress in Life Cycle Assessment 2019; Albrecht, S., Fischer, M., Leistner, P., Schebek, L., Eds.; Springer International Publishing: Cham, Switzerland, 2021; pp. 5–23. [Google Scholar]
  209. Fitz, A.; Gómez Trillos, J.; Torres, F. AIS-Based Estimation of Hydrogen Demand and Self-Sufficient Fuel Supply Systems for RoPax Ferries. Energies 2022, 15, 3482. [Google Scholar] [CrossRef]
  210. Fan, H.; Enshaei, H.; Jayasinghe, S.; Tan, S.; Zhang, C. Quantitative risk assessment for ammonia ship-to-ship bunkering based on Bayesian network. Process Saf. Prog. 2021, 41, 395–410. [Google Scholar] [CrossRef]
  211. Duong, P.; Kim, H.; Ryu, B.; Kang, H. A Quantitative Risk Analysis during Truck-to-Ship Ammonia Bunkering. Sustainability 2024, 16, 2204. [Google Scholar] [CrossRef]
Figure 1. Full-scale shipboard experimental platform used to evaluate FAME–diesel blends in marine service: (a) low-speed 5S60ME-C8 MAN-B&W main engine; (b) medium-speed 6DL-16 Daihatsu auxiliary engine; and (c) integrated common fuel system linking storage, transfer, supply, and return lines for heavy fuel oil, marine diesel oil, and bio-diesel blends (B10 and B30). The configuration is important because it enables controlled switching among fuels within the same ship architecture, allowing observed changes in fuel consumption and emissions to be interpreted primarily as fuel effects rather than hardware-induced differences. Reproduced from Ref. [27].
Jmse 14 00570 g001
Figure 2. System-level overview of the LNG and Bio-LNG pathway, showing upstream production routes, liquefaction, transport, and terminal handling, and end-use interfaces. The scheme includes integrating marine propulsion into the broader liquefied-methane value chain and distinguishing upstream pathway differences from the shared maritime bottlenecks that arise after liquefaction, including bunkering, onboard cryogenic storage, boil-off gas management, and engine use. The author’s own schematic is based on the reviewed literature.
Jmse 14 00570 g002
Figure 3. High-level map of the hydrogen value chain, linking renewable-electricity and natural-gas routes to hydrogen production, conditioning, storage, transport, and downstream conversion to derivative fuels such as ammonia and methanol. The scheme is intended to show that hydrogen’s climate and cost performance are determined by the interactions across multiple stages, not by production alone, including electrolyzer utilization, electricity carbon intensity, water and purity requirements, conditioning energy, boil-off or compression losses, and end-use conversion efficiency. For maritime applications, it therefore serves as a bottleneck map rather than a simple process diagram. The author’s own schematic is based on the literature reviewed.
Jmse 14 00570 g003
Figure 4. Two complementary dimensions of hydrogen sustainability and deployability: (a) indicative life cycle carbon footprints across major hydrogen production pathways (“hydrogen colors”), and (b) the international standards and regulatory framework relevant to liquid-hydrogen technologies. Panel (a) shows that hydrogen’s climate value is pathway-dependent rather than inherent to the fuel itself, while panel (b) shows that deployment at maritime scale also depends on certification, equipment standards, safety rules, and interface harmonization. Together, the two panels illustrate that hydrogen readiness is determined by both carbon intensity and governance maturity (reproduced from reference [98] CC BY 4.0 and reference [113] under Creative Commons CC-BY license).
Jmse 14 00570 g004
Figure 5. Scheme outlining the production, conversion, and utilization routes for green and blue ammonia. The author’s own schematic is based on the literature reviewed.
Jmse 14 00570 g005
Figure 6. E-methanol value chain, from renewable energy production to its end-use applications across various sectors. The author’s own schematic is based on the literature reviewed.
Jmse 14 00570 g006
Figure 7. (a) Geographical and operational parameters of the vessel on the Helsinki–Tallinn route. (b) Carbon footprint results of different vessel scenarios operating under different fuel pathways, reproduced from the work performed by Katumwesigye et al. [192] under the terms of the Creative Commons CC-BY license.
Jmse 14 00570 g007
Figure 8. Two-phase maritime decarbonization roadmap synthesizing the comparative results of Table 5. The first phase highlights near-term options with relatively high deployment readiness, including drop-in biofuels, LNG/Bio-LNG in established methane-fuel segments, and electrification in short-sea and port-centered applications. The second phase shows the progression toward lower-carbon but more infrastructure-intensive options such as e-methanol, hydrogen, and ammonia for deeper decarbonization. The figure is intended not as a single preferred pathway, but as a comparative summary of how technology readiness, achievable WtW GHG reduction, fuel-volume penalties, renewable-electricity demand, and bunkering requirements interact over time. The author’s own schematic is based on the literature reviewed, supported by the LLM notebook.
Jmse 14 00570 g008
Table 1. Methane slip evidence map for marine LNG dual-fuel propulsion.
EvidenceEngine ConceptMeasurement MethodLoadReported Methane Slip Metric
(Range/Point) *
Ref.
State-of-the-art onboard case (RoPax; “standard” vs. “new combustion concept”)LPDF 4-strokeOnboard exhaust; FTIR/GC methods reported on paper (tag: onboard direct)10%Standard engine: >12 g/kWh; New concept: <4 g/kWh[72]
Onboard direct25%6.7 g/kWh (standard engine case reported)
Onboard direct75%3.5 g/kWh (explicit point)
Onboard direct50–90%<4 g/kWh (reported as below 4 for ≥50% loads)
Newbuild cruise ship (sea trials + operational perspective)Onboard exhaust (tag: onboard direct; paper reports brake-specific slip vs. load)54–80%2.3–3.0 g/kWh[42]
Same newbuild cruise shipOnboard direct25%10 g/kWh
Onboard direct12%21 g/kWh
Cross-engine summary (measurement-data synthesis; useful for “literature envelope”)LPDF/LBSI groupsMeta-analysis of measurement datasets (tag: compiled measurement data)Cycle-weighted≈6.90 g/kWh (cycle-weighted average across 7 engines)[73]
In-service plume discrimination (many vessel passes; Baltic Sea lane)LPDF vs. HPDFRemote plume (stationary monitoring; plume ratio)Various (in-service)ΔCH4/ΔCO2 = 1–9% (LPDF); 0.1–0.5% (HPDF)[64]
* Unit basis gCH4/kWh.
Table 2. Comparative assessment of CGH2 (700 bar) and LH2 (20 K): Density, energy penalty, footprint, and operational bottlenecks.
FeatureCGH2 (Nominal: 700 Bar/70 MPa)LH2 (Nominal: ~20 K, ~1 Bar)Obs./Ref.
Reference conditions (basis)70 MPa, ~288–300 K (room-temp storage)~20–20.3 K, ~1 bar (near normal boiling point)[99]
Volumetric density (H2 only, not system)~39–40 kg/m3 (order of magnitude depends on T)~70.8–71.0 kg/m3[100]
Energy penalty: compression/liquefaction (typical today)Compression to 70 MPa: often ~1.7–6.4 kWh/kg depending on inlet pressure, staging, cooling, and station architectureLiquefaction: typically, ~11.9–15 kWh/kg-LH2 (≈35–45% of H2 LHV) for current processes, with recent review values around 13.8 kWh/kg-LH2[99,101,102,103,104]
Energy penalty: theoretical minimum work (thermo lower bound)~1.35 kWh/kg to 700 bar, depending on inlet state and idealizationThe theoretical minimum liquefaction work is much lower than practical plant consumption; modern analyses place the ideal minimum in the order of ~2.7 kWh/kg-LH2[105,106]
Storage weight (system-level trend, qualitative)High (thick-walled/composite pressure vessels; high structural mass fraction)Low since it often has a lower structural mass per kg H2, but it requires vacuum-jacketing + insulation, so its application is dependent[107]
Space requirement (system-level trend, qualitative)Large volume for the same H2 mass vs. LH2More compact volume for the same H2 mass (higher volumetric density)[99,100]
Key operational risks (typical)High pressure, permeation/leaks, rapid release hazardsBoil-off losses, cryogenic hazards, material compatibility/embrittlement considerations in hydrogen service[108,109]
Chemical/technological bottlenecksMaterial compatibility under high pressure; hydrogen permeation through polymers/elastomers; sealing durability; hydrogen-assisted cracking/embrittlement in susceptible alloys; fast-fill thermal managementVacuum-jacket integrity; insulation degradation; boil-off management; vent/reliquefaction systems; ortho-para conversion heat effects; cryogenic compatibility of seals and structural materials[106,110,111]
Peer-reviewed references support all quantitative entries in Table 2; where a range is reported, it reflects representative values compiled from the literature under different operating conditions and process configurations.
Table 3. Marine-relevant conversion performance (fuel cells vs. internal combustion engine (ICE)).
Conversion Route (Marine-Relevant)Typical Net Efficiency (LHV)Power Density (Indicative)Dynamic Response/Start-UpDurability/Lifetime (Indicative)Key Maritime Constraints
(What Drives Design)
Ref.
PEMFC
(H2, low-temperature)
50–60% electrical (typical range)High among FC options (compact vs. SOFC/MCFC); examples of ~0.43 kW/kg reported in FC literatureFast start-up, good load-following; often hybridized with batteries for transientsDemonstrations and product targets span thousands of hours; durability is a primary barrier in maritimeRequires high-purity H2 (CO/S sensitivity), water/thermal management, marine air/salt/mist protection, integration with H2 storage and ventilation[126]
SOFC (high-temperature; H2/NH3-cracked/reformate)50–60% electrical (standalone); up to ~65% in hybrid SOFC concepts reported in reviewsLower power density than PEMFC at the system level due to hot balance-of-plant/reforming/insulationSlow start-up (up to hours); prefers quasi-steady operation to avoid thermal stressPeer-reviewed maritime FC reviews report >30,000 h achieved for some SOFC/MCFC plants; stack lifetime commonly about ~40,000 h quoted in maritime FC reviewThermal integration dominates (waste heat recovery opportunity), cycling constraints, insulation/exhaust routing, fuel processing, and impurity tolerance[117,126]
H2-ICE (spark-ignited/direct-injection concepts; marine-adaptable)Modern H2-ICE literature reports ~40–45% BTE achievable under optimized ultra-lean/advanced strategiesHigh (engine + after-treatment are power-dense); packaging is often easier than FC + large balance-of-plantVery fast transients, robust load-following (good for propulsion)Durability leverages mature ICE platforms; research engines show >1000 h test accumulation reported in peer-reviewed papersNOx control (ultra-lean, EGR, water injection, after-treatment); pre-ignition/knock/backfire; hydrogen storage dominates ship-level feasibility[118,127]
Marine medium-speed dual-fuel (H2-diesel) as a transitional routeSmall but measurable efficiency gains reported (example: ~1–3% indicated efficiency improvement vs. diesel baseline under specific controls)High (retains conventional engine hardware)Fast, like diesel; control complexity rises at high H2 substitutionDurability close to diesel platform; injector/combustion system adaptations neededKnock suppression enabling higher H2 substitution; water injection/injection timing becomes a key lever; NOx trade-offs[128]
Table 4. Electrochemical ammonia-production pathways vs. Haber–Bosch: Comparative advantages, limitations, and implications for the maritime decarbonization narrative.
PathwayCore Concept (Feed + Cell)Typical Operating WindowAdvantage vs. Haber–Bosch (HB)
(Where It Could Win)
Main Disadvantages vs. HB (Codes)ImpactRef.
Direct N2 electroreduction (eNRR), aqueous/proticN2 + H2O in aqueous electrolyte; cathodic NH3 formation~ambient–<100 °C;
~1 atm
Simple “air/water/e” concept; modular; renewables-friendly in principleDominant HER; low rates; contamination; scale-up unclear (SEL, QA, EE, STAB)Long-horizon R&D: attractive conceptually, but currently weak evidence base for scalable performance; use as a watchlist, not near-term supply solution[165]
Direct N2 electroreduction, non-aqueous/aprotic (incl. ionic liquids)N2 in aprotic media to suppress HER; controlled proton donorambient–moderate TMay reduce HER competition; tunable solvationElectrolyte complexity; stability; still limited validated performance (SEL, QA, STAB, EE)Same conclusion as aqueous eNRR, but it motivates why verification protocols and system design matter[166]
Lithium-mediated N2 reduction (Li-NRR)Li plating + SEI chemistry activates N2; proton donor yields NH3Near ambient; non-aqueousAmong the most promising electrochemical routes for rate/FE potential; credible scaling trajectory if stabilizedLi handling; electrolyte management; continuous operation + efficiency are bottlenecks (STAB, EE, OPS, MAT)Best framed as the leading electrochemical contender for direct N2 → NH3, but still materials + process integration before it can compete with HB[137,167]
Intermediate-T proton-conducting ceramic cell
(PCEC/membrane electrochemical synthesis)
N2 at cathode; H+ transported through ceramic electrolyte; electrochemical reactor~250–450 °C (typ.)Higher kinetics than ambient; clear separation of half-reactions; electrified reactor pathwayCeramic durability, sealing/thermal cycling, interface performance (MAT, STAB, EE)Supports a mid-T electrochemical reactor storyline: potentially more industrializable than ambient eNRR, but still pre-commercial[168]
Molten-salt electrochemical NH3 (molten hydroxide/phosphate; variants with H-permeable membranes)N2 + H2O/H2 in molten electrolyte; sometimes membrane-assisted H delivery~200–400 °C (system-dependent)High ionic conductivity; alternative N-activation chemistry; process-intensification potentialCorrosion/materials handling; long-run stability; engineering complexity (MAT, STAB, OPS, EE)Best as niche/cluster option pending materials solutions; strengthens infrastructure + materials co-evolution [168]
Electrochemical nitrate reduction to NH3 (NO3RR) Reduce   N O 3 → NH3 in aqueous systems (wastewater/brines); paired with OERAmbientOften higher selectivity/rates than N2 fixation; co-benefit: water remediation; decentralizedNot air-to-ammonia; depends on nitrate stream; separation and life cycle depend on source (FEED, SEP, EE)Reframes ammonia as nitrogen circularity + local production: potentially relevant near ports/industrial clusters with nitrate streams[169,170]
Readiness: H/M/L (relative to industrial HB). Constraint codes: SEL selectivity, HER hydrogen evolution reaction, QA quantification/false positives, EE energy efficiency, STAB durability/continuous operation, MAT materials/corrosion, OPS operability/safety, FEED feedstock constraint, SEP separation/purification, FE Faradaic efficiency.
Table 5. Engineering mitigation matrix for ammonia-fueled ships and bunkering systems: Representative safeguards, evidence basis, and boundary conditions.
Mitigation
Category
Principal Risk
Addressed
Representative Engineering/Operational MeasuresKey Boundary Conditions/LimitationsImplication for
Deployability
Ref.
Arrangement, segregation, and compartmentalizationCrew exposure and toxic-cloud propagation from leaks in machinery spaces, fuel preparation rooms, and transfer areasSegregated fuel rooms; double-walled or secondary-contained piping; physical separation of tanks, valve stations, and occupied spaces; minimization of ammonia inventory in enclosed spaces; dedicated hazardous zones and protected escape routesEffectiveness depends on vessel layout, enclosure geometry, retrofit space, and safe access/egress designImproves safety case, but reduces retrofitability and usable space; more favorable in newbuilds[163]
Leak detection, shutdown logic, and interlocksDelayed identification of releases and escalation during bunkering or onboard transferRedundant ammonia detectors; alarm zoning; automatic emergency shutdown; fail-safe valve closure; permissives/interlocks for transfer, purge, and ventilation sequences; continuous monitoring in fuel rooms and vent discharge areasSensor placement, detection threshold, response time, maintenance quality, and human–machine integration strongly affect performanceEssential for approval and routine operation, but increases systems complexity and verification burden[164]
Ventilation, extraction, and controlled discharge/exhaust treatmentAccumulation of toxic concentrations in enclosed spaces and unsafe vent release pathsMechanically forced ventilation sized to leak scenarios; directional airflow; optimized intake/exhaust placement; local extraction at likely leak points; vent masts; controlled discharge routing; where applicable, treatment/scrubbing of contaminated exhaust streamsHighly scenario-specific: enclosure geometry, meteorology, release location/rate, and validation quality matter; ventilation alone is insufficientNecessary but not sufficient; increases design and approval complexity and may add auxiliary power demand[155,156]
Materials compatibility, sealing, and corrosion controlLoss of containment through seal degradation, valve/piping failure, corrosion, or incompatible materialsAmmonia-compatible metals, elastomers, gaskets, hoses, and seals; minimized leak-prone joints; robust valve/flange specifications; inspection and replacement intervals; purge-compatible component designDepending on component qualification, marine vibration/thermal cycling, maintenance discipline, and life cycle inspectionImproves containment and reliability, but raises cost and qualification requirements[154,163]
Bunkering-transfer safeguards and exclusion-zone designToxic release during connection, transfer, hose/coupling failure, or emergency disconnectionStandardized dry/disconnect couplings; double isolation and bleed; purge procedures; transfer sequencing; ESD at ship/shore interface; release-scale-specific exclusion zones; scenario-based bunkering proceduresStrongly site-specific: quay layout, nearby operations/population, meteorology, transfer mode, and port governance determine the feasible risk envelopeMajor determinant of port readiness; early deployment is most plausible in dedicated corridors and segregated terminals[164,171]
Operational procedures, emergency response, and crew preparednessHuman error, delayed evacuation, ineffective response, and escalation after a leakCompetency-based training; bunkering checklists; permit-to-work systems; emergency drills; PPE and escape equipment; shelter-in-place and evacuation procedures; incident-command protocols; testing of safety-critical systemsPerformance depends on training quality, staffing, procedural discipline, and rehearsal frequencyStrong effect on practical deployability; favors early adoption by highly trained operators in controlled corridors[154,171]
Note: The cited literature is representative rather than exhaustive. Effectiveness depends on boundary conditions, including vessel layout, enclosure geometry, release scale, meteorology, transfer mode, retrofit constraints, and crew/port operational maturity.
Table 6. Comparative assessment of maritime fuel pathways: indicative WtW GHG-reduction potential, deployment bottlenecks, and pathway-specific constraints for maritime decarbonization.
CriterionBiofuels (FAME/HVO, Bio-Methanol)Methane-Based Liquefied Fuels
(LNG/Bio-LNG)
HydrogenAmmonia (NH3, ICE/FC)E-MethanolElectrification
Indicative well-to-wake (WtW) GHG reduction vs. heavy fuel oil (HFO)Typically, ~10–80% WtW GHG reduction versus HFO; advanced/waste-based pathways can reach ~60–90%+, while crop-based routes may perform worse when land-use change is includedLNG usually provides ~0–20% reduction vs. HFO; high-share Bio-LNG blends can reach ~60–80%, provided methane slip and upstream leakage are minimizedGreen H2 can achieve ~70–90%+ reduction, especially in fuel cells; results depend strongly on electrolyzer efficiency and electricity carbon intensityGreen NH3 can deliver ~60–90% reduction if NOx, N2O, and NH3 slip are tightly controlled; performance worsens with fossil electricityCan achieve ~70–95% reduction when made with DAC/biogenic CO2 and near-zero-carbon electricity; benefits decline sharply with fossil CO2 or carbon-intensive powerFull-electric systems can reach ~80–95% reduction on low-carbon grids; battery life cycle impacts matter, but grid carbon intensity is the dominant factor
Sensitivity of climate performanceVery high sensitivity to feedstock sustainability, ILUC, process energy, hydrogen source for HVO, and allocation rules; upstream assumptions dominate resultsVery high sensitivity to methane slip and upstream gas leakage; small assumption changes can shift outcomes from benefit to penaltyHigh sensitivity to electricity, carbon intensity, and renewable share for electrolysis, compression, and liquefaction; non-CO2 effects from H2 leakage remain uncertainHigh sensitivity to electricity mix and to direct/indirect N2O and NH3 emissions; poor emission control can erase benefitsHigh sensitivity to CO2 source and electricity mix; local pollutants matter, but climate results are mainly driven by power and carbon sourcingVery high sensitivity to grid carbon intensity over battery life; production, lifetime, and recycling are important but usually secondary
Onboard energy density penalty vs. HFO (volume basis)Low penalty; FAME/HVO are near-drop-in fuels with energy density relatively close to MGO. Bio-methanol requires ~2.0–2.5× the fuel volume of HFO but remains easy to store as an ambient liquidModerate penalty; requires more tank volume than HFO but less than hydrogen, with added cryogenic-tank requirementsHigh penalty; LH2 typically requires ~4–6× the tank volume of HFO, and compressed H2 may require even more, strongly affecting layout and cargo spaceIntermediate penalty; usually requires ~2–3× the tank volume of HFO plus added safety and segregation measuresModerate penalty; requires ~2.0–2.5× the tank volume of HFO but is easier to integrate than cryogenic or high-pressure fuelsVery high penalty; batteries have much lower energy density than liquid fuels, restricting most applications to short-sea or harbor use
TRL/maturity for deep-sea main propulsionHigh maturity for FAME/HVO blends and drop-in use; bio-methanol is commercially viable, but scale-up depends on sustainable supply and certificationHigh maturity; dual-fuel engines and bunkering are commercial for deep-sea use, while Bio-LNG deployment is limited mainly by fuel supplyPilot to early-commercial; storage and fuel-cell systems are demonstrated, but large-ship integration, durability, and scale-up remain unresolvedEmerging technology; engines are at pilot/early-commercial stage, while fuel-cell routes remain under development, and deployment is limited by safety and emissions controlEarly commercial; methanol-ready engines and retrofits are available, with fuel supply at scale as the main constraintLow–moderate maturity for deep-sea propulsion; batteries are established for hybrid and short-sea use, but not for standalone deep-sea propulsion
TRL/maturity for short-sea, ferry, and port segmentsVery high maturity; blends and HVO are readily deployable in ferries and short-sea vessels with minimal hardware changes. Bio-methanol is viable where compatible engines and infrastructure existHigh maturity; LNG short-sea vessels are already commercial, with existing bunkering infrastructure. Bio-LNG can use the same platform, but is supply-constrainedDemonstration to early commercial; fuel-cell ferries and inland vessels are operating, but deployment remains route-specific and nicheEarly demonstration; coastal and auxiliary applications are under development, but maritime use is still pre-commercialEarly commercial; short-sea methanol vessels are entering service through both retrofits and newbuildsCommercial and expanding; batteries are widely used in ferries, harbor craft, and hybrids, with strong learning effects already underway
Dominant unregulated species and local pollutants of concernFAME may slightly raise NOx and deposits, but usually lowers SOx, PM, and black carbon. HVO generally reduces soot. Bio-methanol shares methanol-related formaldehyde and unburned MeOH concernsMethane slip dominates; CH4 from engines and supply chains is the main issue, while NOx and some PM depend on engine and after-treatmentVery low direct local pollutants at point of use, especially in fuel cells; key concerns are H2 leakage and some system-specific by-productsNOx, N2O, and NH3 slip dominate; toxicity and accidental-release risk are also central concernsFormaldehyde and unburned methanol are the main unregulated pollutants; after-treatment is needed to avoid air-toxic impactsNo exhaust emissions, but major concerns include thermal runaway, toxic/flammable gas release, fire/smoke, and electrolyte decomposition products
Key shipboard safety and handling bottlenecksSimilar to conventional fuels; main issues are stability, water uptake/microbial growth, and cold-flow. Bio-methanol also needs flammability/toxicity controlsCryogenic handling, BOG management, and gas safety dominate; ventilation, detection, and emergency systems are essentialCryogenic/high-pressure storage, leakage/embrittlement, and ignition behavior are key challengesToxicity, corrosiveness, and release risk dominate; segregation, ventilation, and leak detection are essentialFlammability, material compatibility, and toxic products are the main concernsThermal runaway, gas release, and propagation risk are the main safety bottlenecks
Port/bunkering/charging and grid readinessHigh readiness; existing liquid-fuel infrastructure is largely usable, with added needs for compliance, traceability, and compatibility controlHigh but uneven readiness; LNG bunkering is established and expanding, while Bio-LNG requires traceable and segregated supply chainsEarly-stage readiness; pilot bunkering exists, but standards, logistics, and large-scale port infrastructure remain immatureLow readiness; no mature bunkering network exists, and toxicity/safety requirements are major barriersModerate readiness; existing methanol logistics help, but large-scale marine bunkering standards are still developingModerate, site-specific readiness; charging exists in some ports, but broad uptake needs stronger grids and MW-class charging
Primary scalability constraints Feedstock-constrained by sustainable biomass availability, cross-sector competition, and certification/ILUC requirementsMixed scalability; fossil LNG is available but not deeply future-proof, while Bio-LNG is limited by sustainable bio-methane and low-leak supply chainsElectricity- and infrastructure-constrained; scaling needs very large volumes of low-carbon power, water, and new transport/storage systemsElectricity- and synthesis-constrained; green NH3 competes for renewable H2 and power, and also with fertilizer demandElectricity- and CO2-constrained; scaling depends on renewable power and sustainable carbon sourcesMaterial- and grid-constrained; battery supply chains, manufacturing, recycling, and port-grid upgrades
Key assumptions and boundary conditions affecting comparabilitySensitive to feedstock, land use, process energy, and HVO hydrogen source; comparable only under explicit allocation and certification assumptionsSensitive to methane leakage, engine/load conditions, and measurement basis; Bio-LNG also depends on bio-methane origin and traceability assumptionsSensitive to production route and electricity carbon intensity, including compression/liquefaction energy; comparisons should state storage and route assumptionsSensitive to hydrogen/electricity origin and to NOx, N2O, and NH3 slip assumptions; technology and safety assumptions also matterSensitive to electricity mix, CO2 source, and synthesis efficiency; interpretation also depends on emission-control and carbon-accounting assumptionsSensitive to grid intensity, charging profile, battery life, and system boundary; route and port-grid assumptions are also critical
Ref.[21,23,26,29,30,31,32][10,64,68,195,196][12,174,197][10,151,152,160,174,196][10,174,196,198][192,199,200,201,202]
Table note: Reported WtW ranges are indicative and compiled from studies using different methodological assumptions. Unless otherwise specified in the cited source, comparability is primarily conditioned by (a) upstream electricity/feedstock origin and processing pathway; (b) life cycle-accounting boundary and chain-of-custody/guarantees-of-origin assumptions; (c) treatment of non-CO2 emissions and control technologies (e.g., methane slip, NOx, N2O, NH3, formaldehyde); and (d) vessel, route, load, and storage-penalty context.
Table 7. Synthesis of decarbonization pathways and transition readiness indicators for maritime shipping.
PathwayIndicatorValue (Headline)Unit/BoundaryReadiness (T/R/I)Key Constraints
Bio-LNGFleet adoptionExisting 1539; Orderbook 966Vessels (incl. cargo-fuel users)H/H/MMethane slip sensitivity; fuel availability
Bio-MeOH/e-MeOHExisting 70; Orderbook 336Vessels (incl. cargo-fuel users)M/M/LSupply scale, flammability, and limited engines
NH3Existing 3; Orderbook 38VesselsL/M/LToxicity; interim guidance; nascent ports
H2Existing 8; Orderbook 33VesselsL/L/LCryogenic/HP storage; approval by alt design
Biofuels (FAME/HVO)OperabilityDrop-in potential (qual.)Relative to MGO (properties)H/H/HFeedstock sustainability; cold flow (FAME); lubricity (HVO)
IMO NZF
(Net-Zero Framework)
Policy stringency−21% GFI by 2030Requirement framing (pending final adoption)—/M/—Implementation detail: credit market dynamics
Wind-assisted propulsion
Systems (WAPSs) *
Efficiency impact5–20% typical; up to ~30% (fav.)Fuel/energy per nm (context-dependent)M/M/HRoute/wind dependence; retrofit integration
Onboard Carbon Capture
(OCC) *
Abatement potential>75 MtCO2 with ~20 portsVoyages starting/ending in 2024M/M/LPort offloading network; energy penalty
Readiness key (T/R/I): technology/rules/infrastructure; H/M/L = high/medium/low. Comparability note: Headline values and readiness assessments are interpretative synthesis indicators and should be read alongside the underlying assumptions on fuel origin, life cycle accounting boundary, non-CO2 emissions control scenario, and operational context. For pathway comparisons involving GHG performance or deployment feasibility, ship type, route length, load profile, bunkering/charging availability, and guarantees-of-origin/traceability conditions can materially affect interpretation. * Examples for comparison purposes. Not considered in the present review. Values are compiled from reference [207].
Disclaimer/Publisher’s Note: The statements, opinions and data contained in all publications are solely those of the individual author(s) and contributor(s) and not of MDPI and/or the editor(s). MDPI and/or the editor(s) disclaim responsibility for any injury to people or property resulting from any ideas, methods, instructions or products referred to in the content.