3.1. Development of Wake Around a Transom Stern Vessel
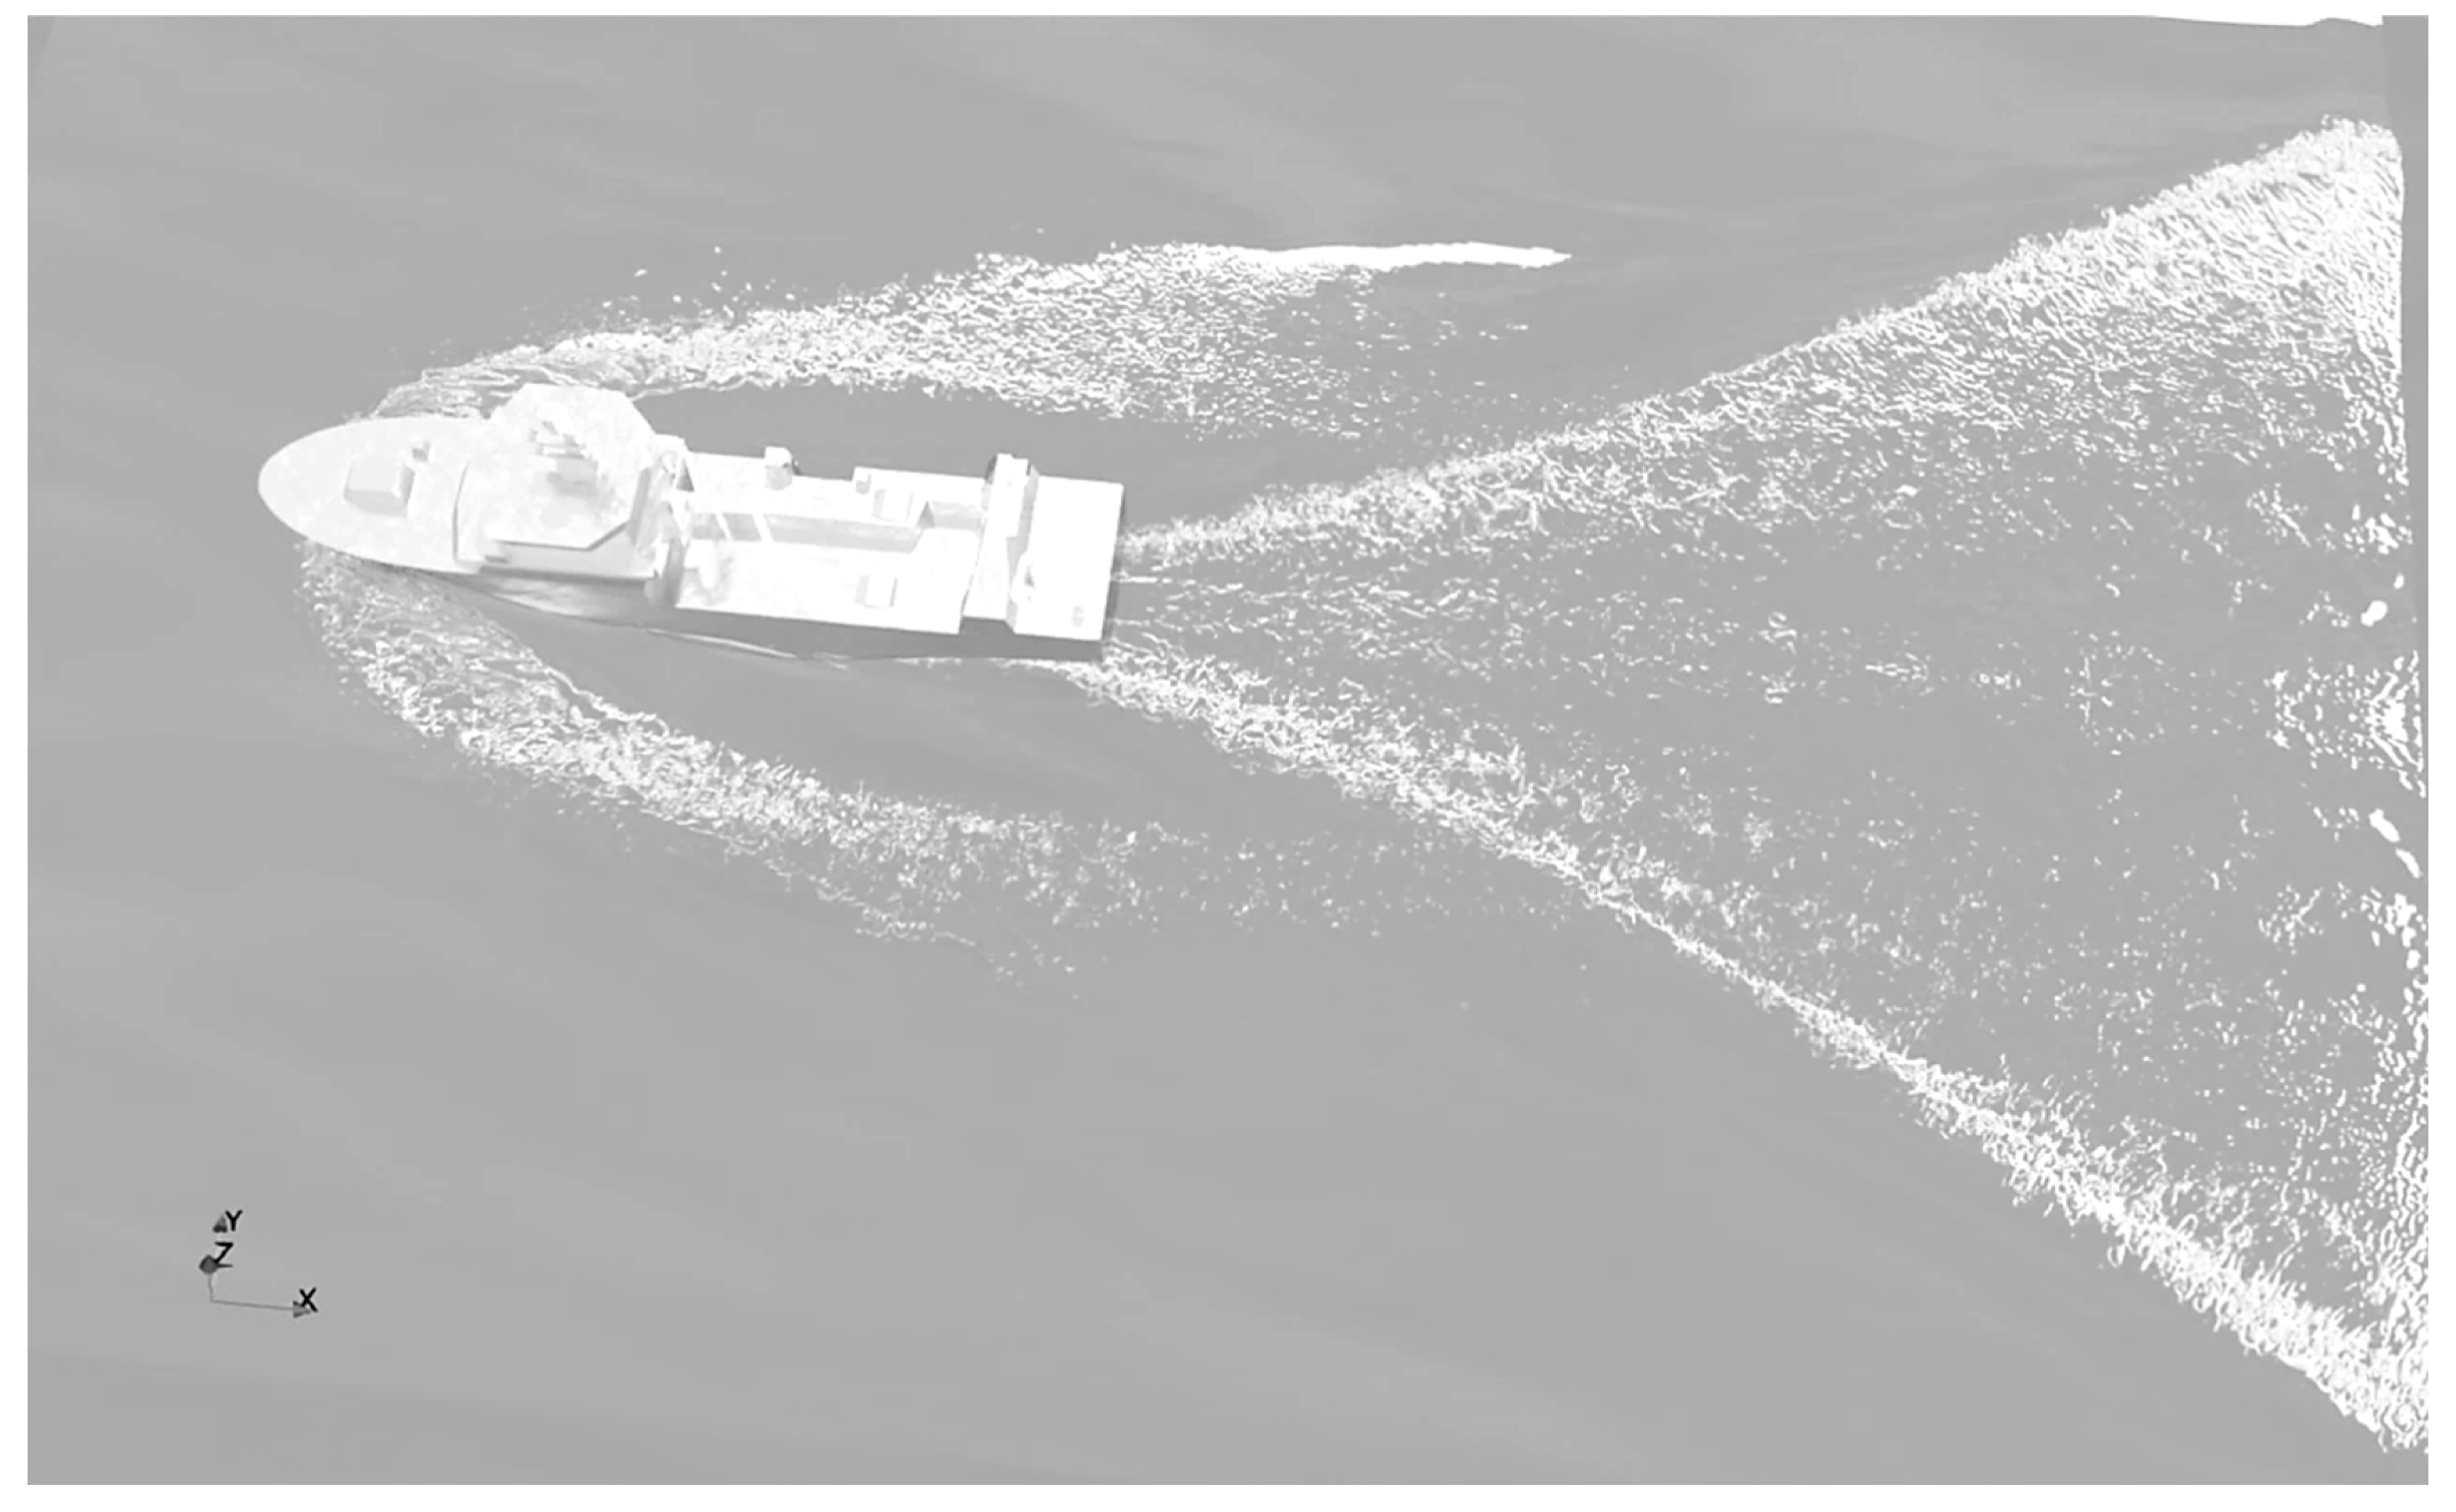
As depicted in
Figure 6, the visualization captures the fully developed free-surface flow field, where the transient startup effects have dissipated. In the fully developed flow regime, the wake extends downstream, forming a broad V-shaped envelope of diverging waves. The simulation effectively resolves fine-scale wave breaking and air entrainment, highlighting the complex interaction between the hull and the surrounding flow.
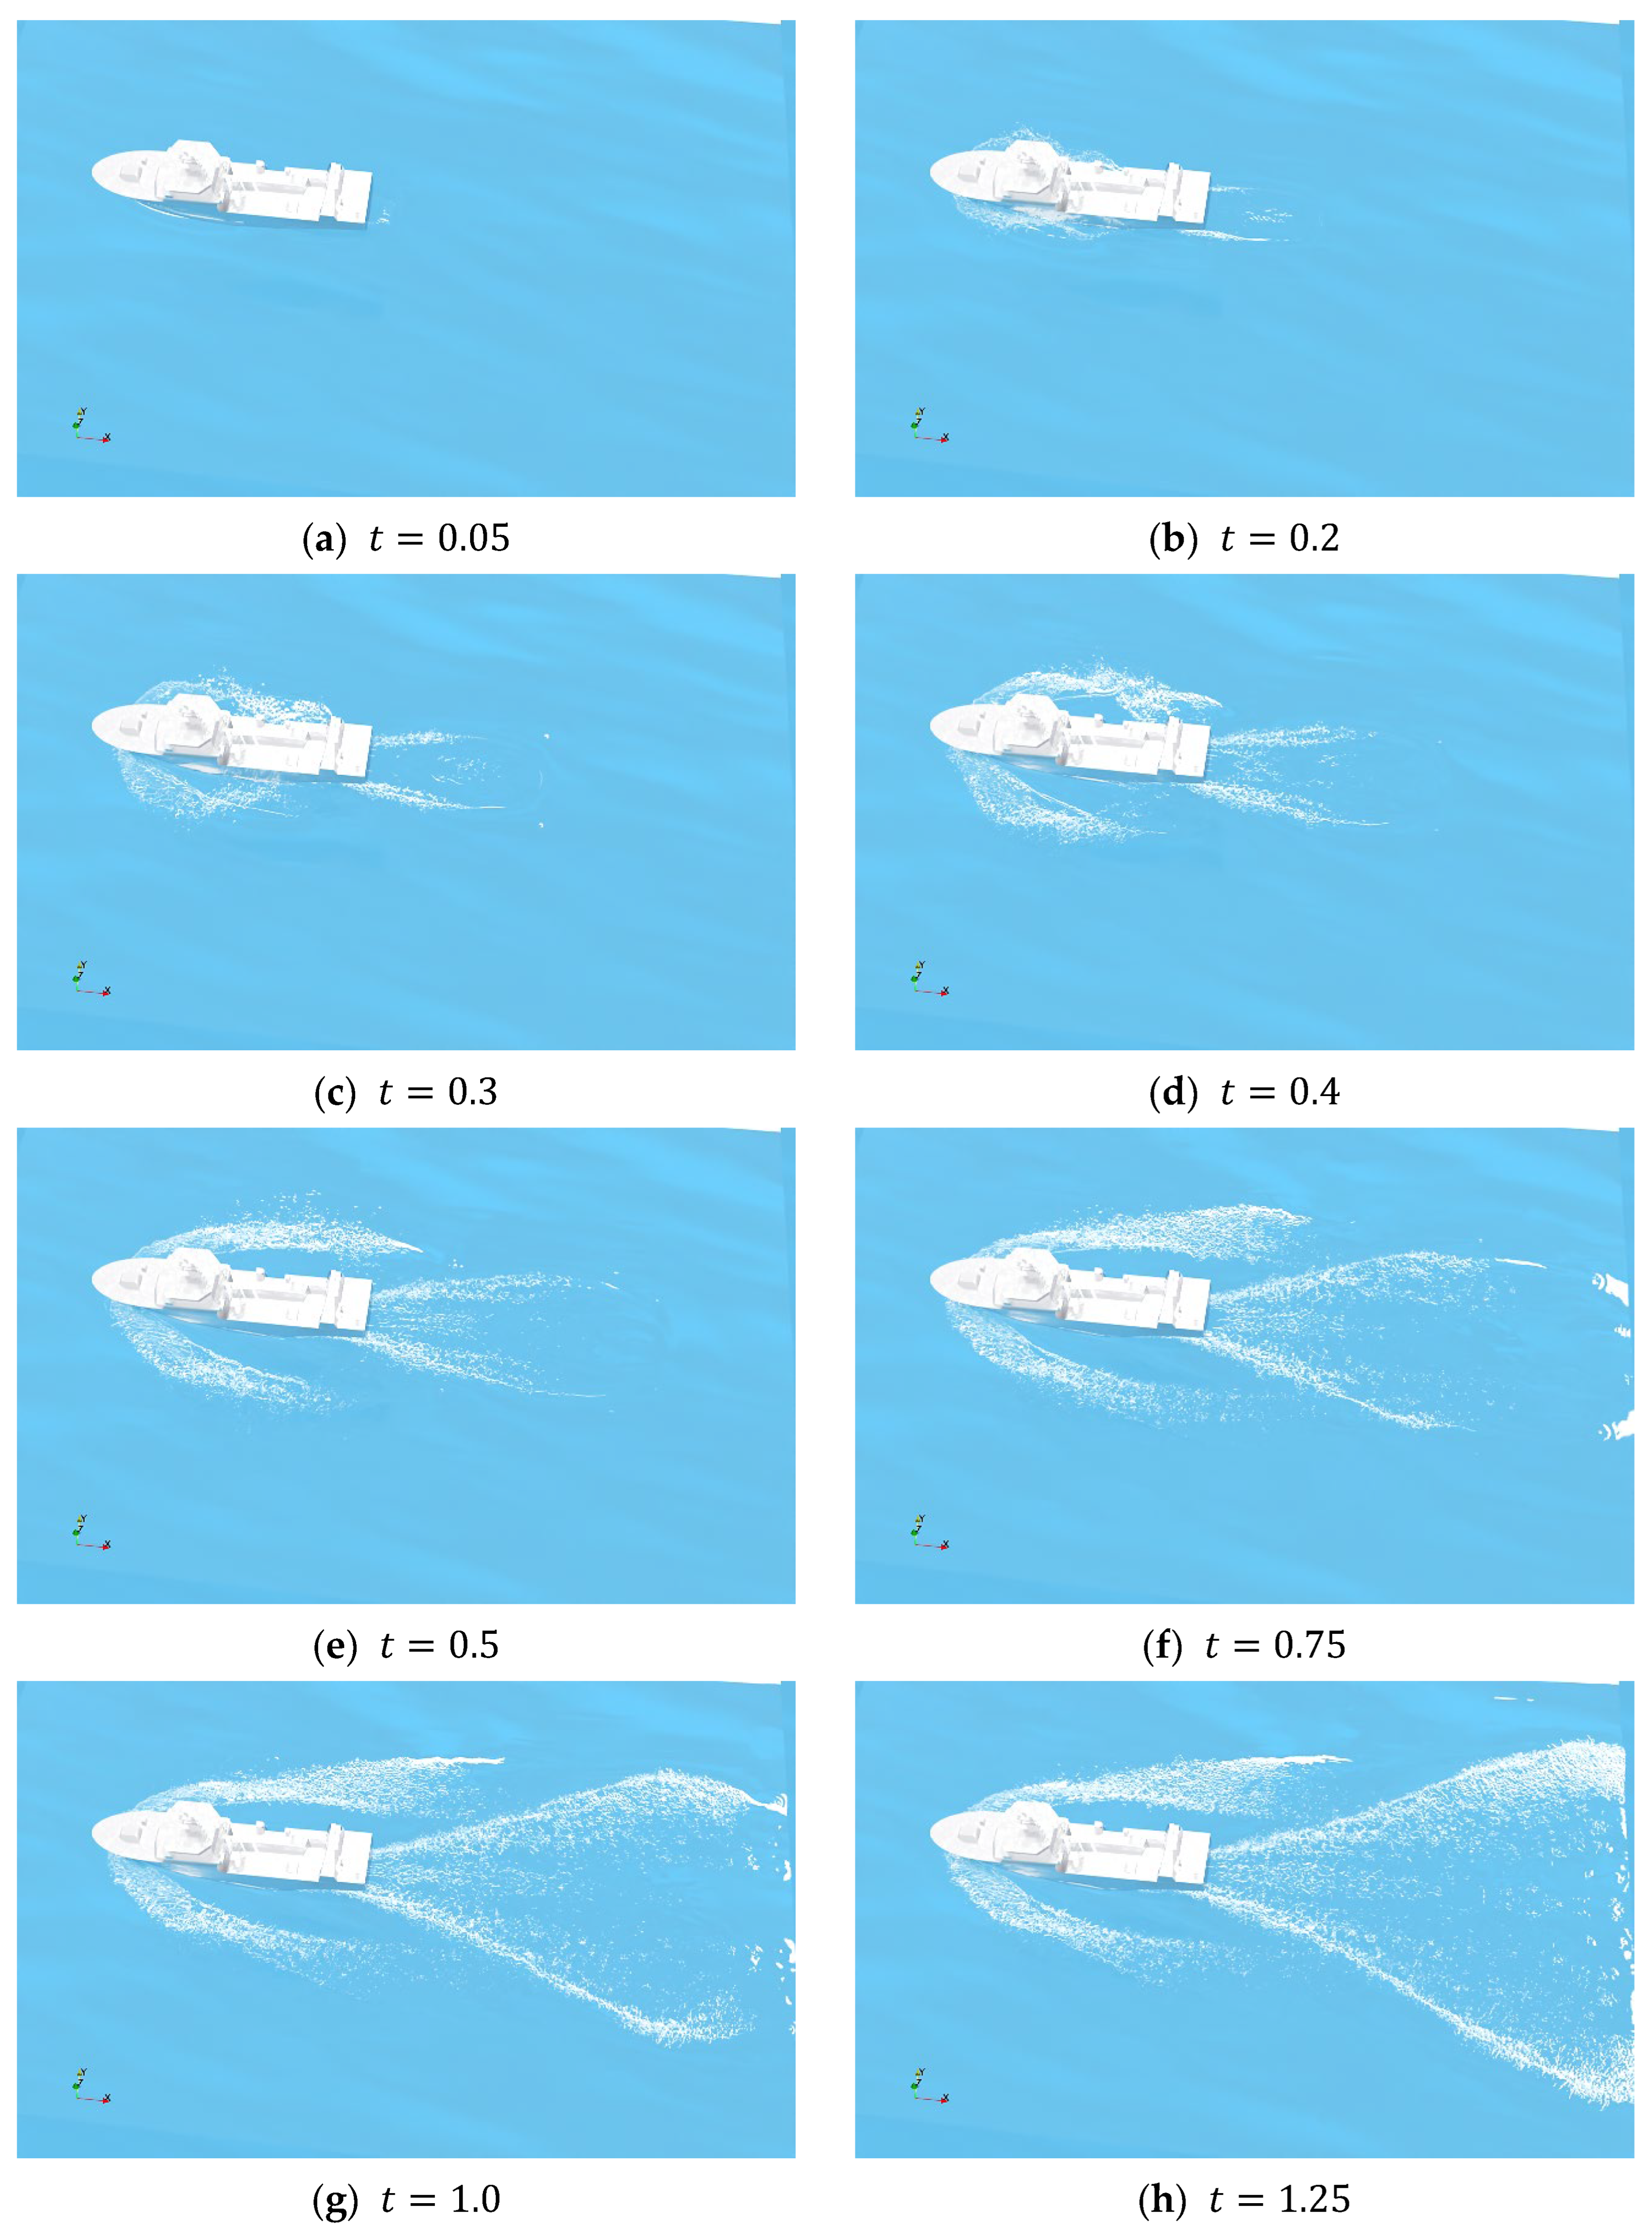
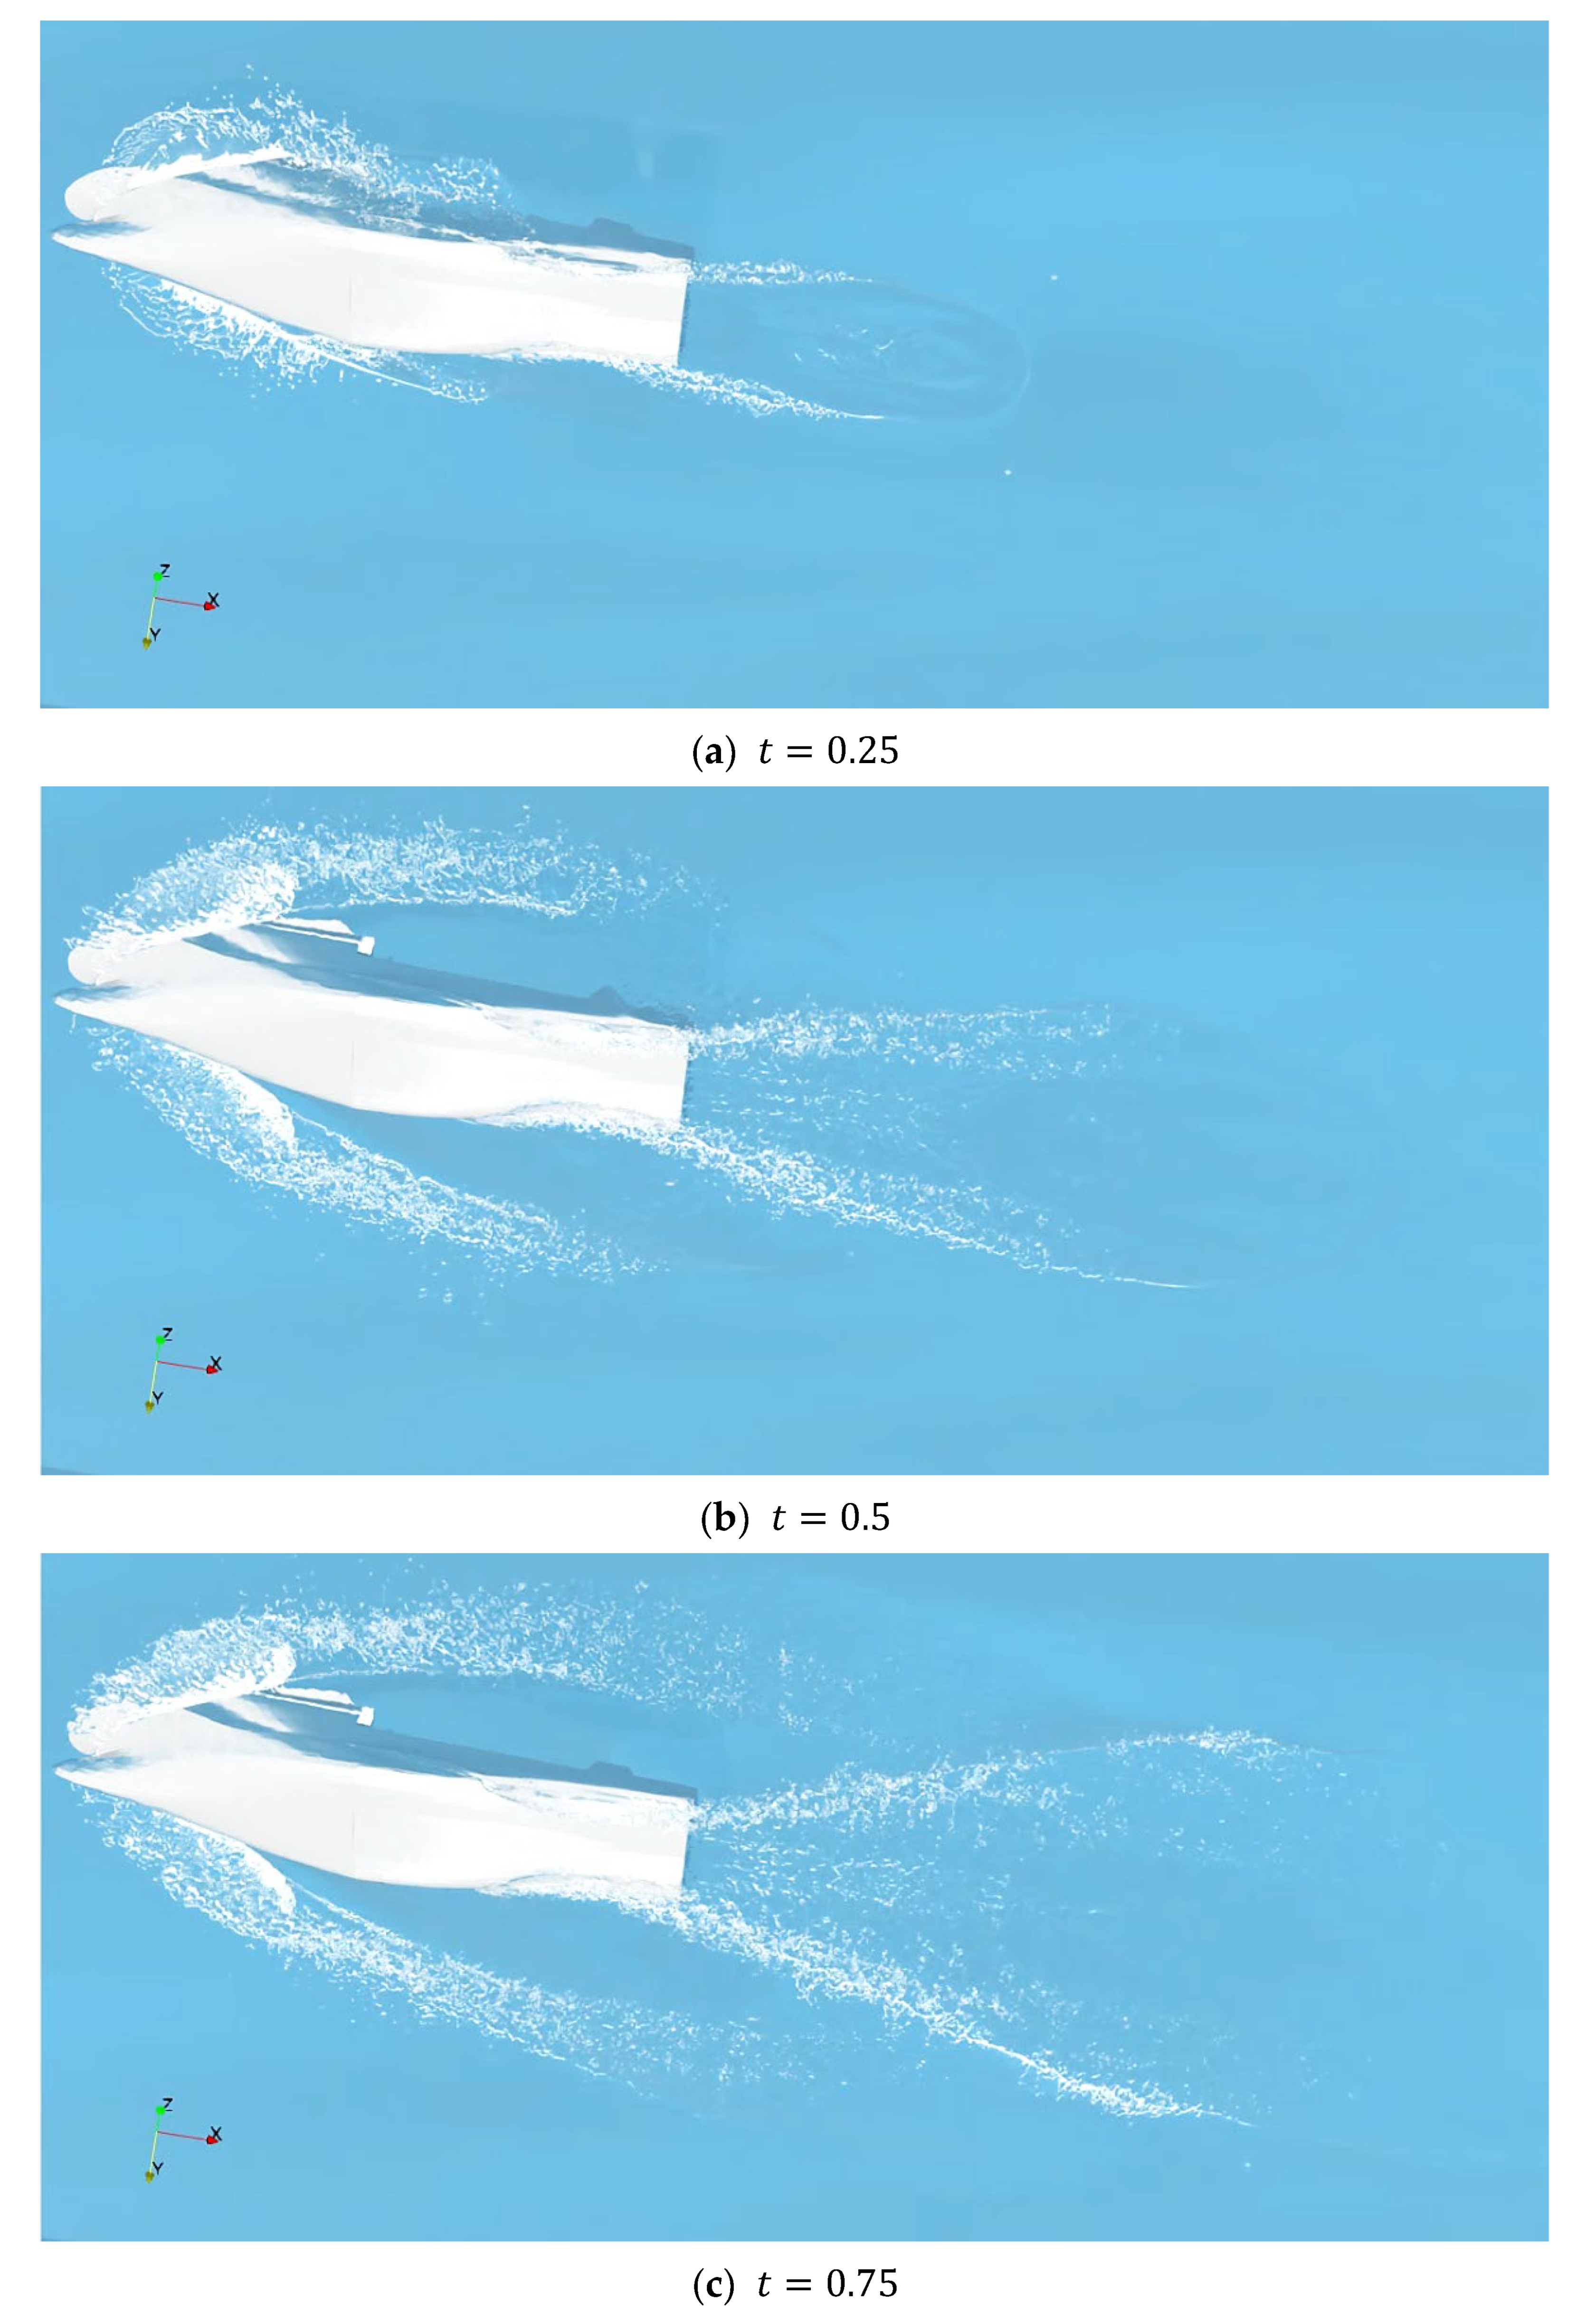
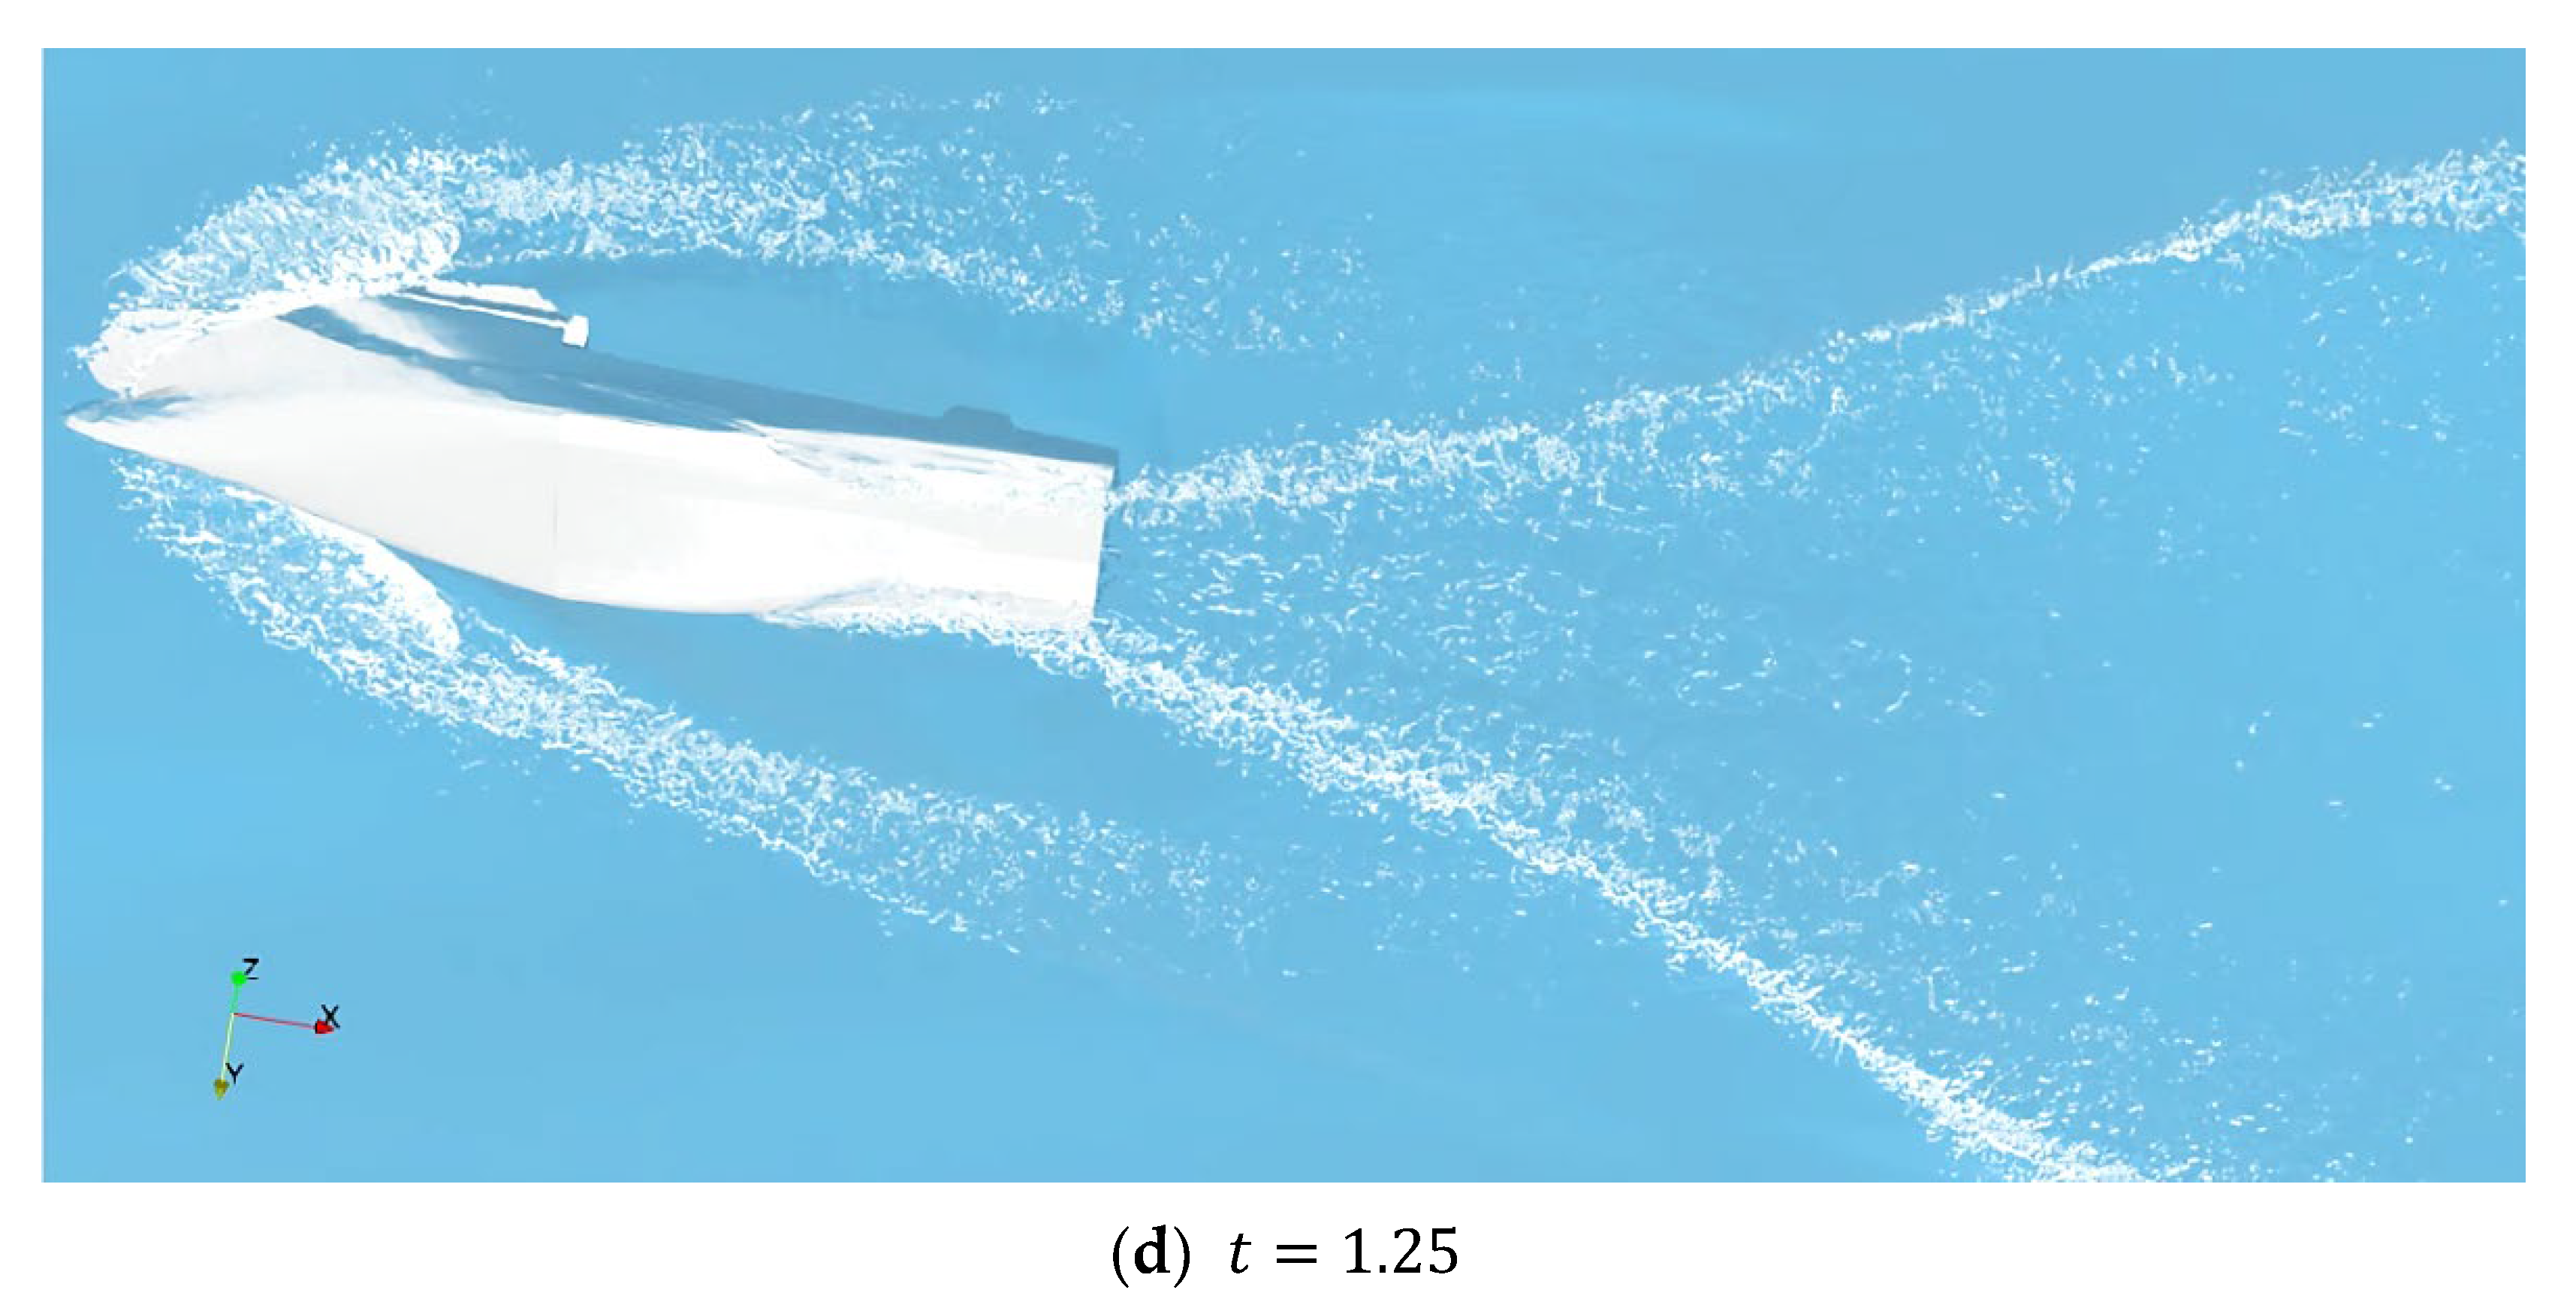
Figure 7 illustrates the temporal evolution of the wake behind the transom stern vessel, capturing the interaction of the hull on the flow
to
. The development process can be categorized into three distinct phases: for the initial formation phase (
), at
(
Figure 7a), the wake is in its nascent stage. Only minor disturbances are visible aft of the stern, marking the onset of flow separation. By
(
Figure 7b), these initial instabilities evolve into more pronounced bubbly structures. The vortices generated at the transom begin to interact, leading to the elongation of the bubbly flow region downstream.
For transitional and expansion phase (
): As the simulation progresses to
(
Figure 7c), the wake exhibits significant development, characterized by the emergence of larger, coherent trailing vortices. By
(
Figure 7d), a clear recirculation zone establishes at the stern, signaling the transition from initial chaotic turbulence to more organized vortex structures. From
(
Figure 7e,f), the wake expands laterally. This period is marked by intense turbulent mixing and strong shear layers. The interaction between large-scale vortices and the surrounding potential flow intensifies, causing the breakdown of large coherent structures into finer turbulent scales.
For the fully developed phase (
): At
(
Figure 7g), the distinct vortical regions become clearly stratified, extending further downstream. Ultimately, at
(
Figure 7h), the flow field achieves a quasi-steady state. In this fully developed regime, transient startup effects have dissipated, and the wake manifests as a broad, V-shaped envelope of diverging waves, extending into the far field.
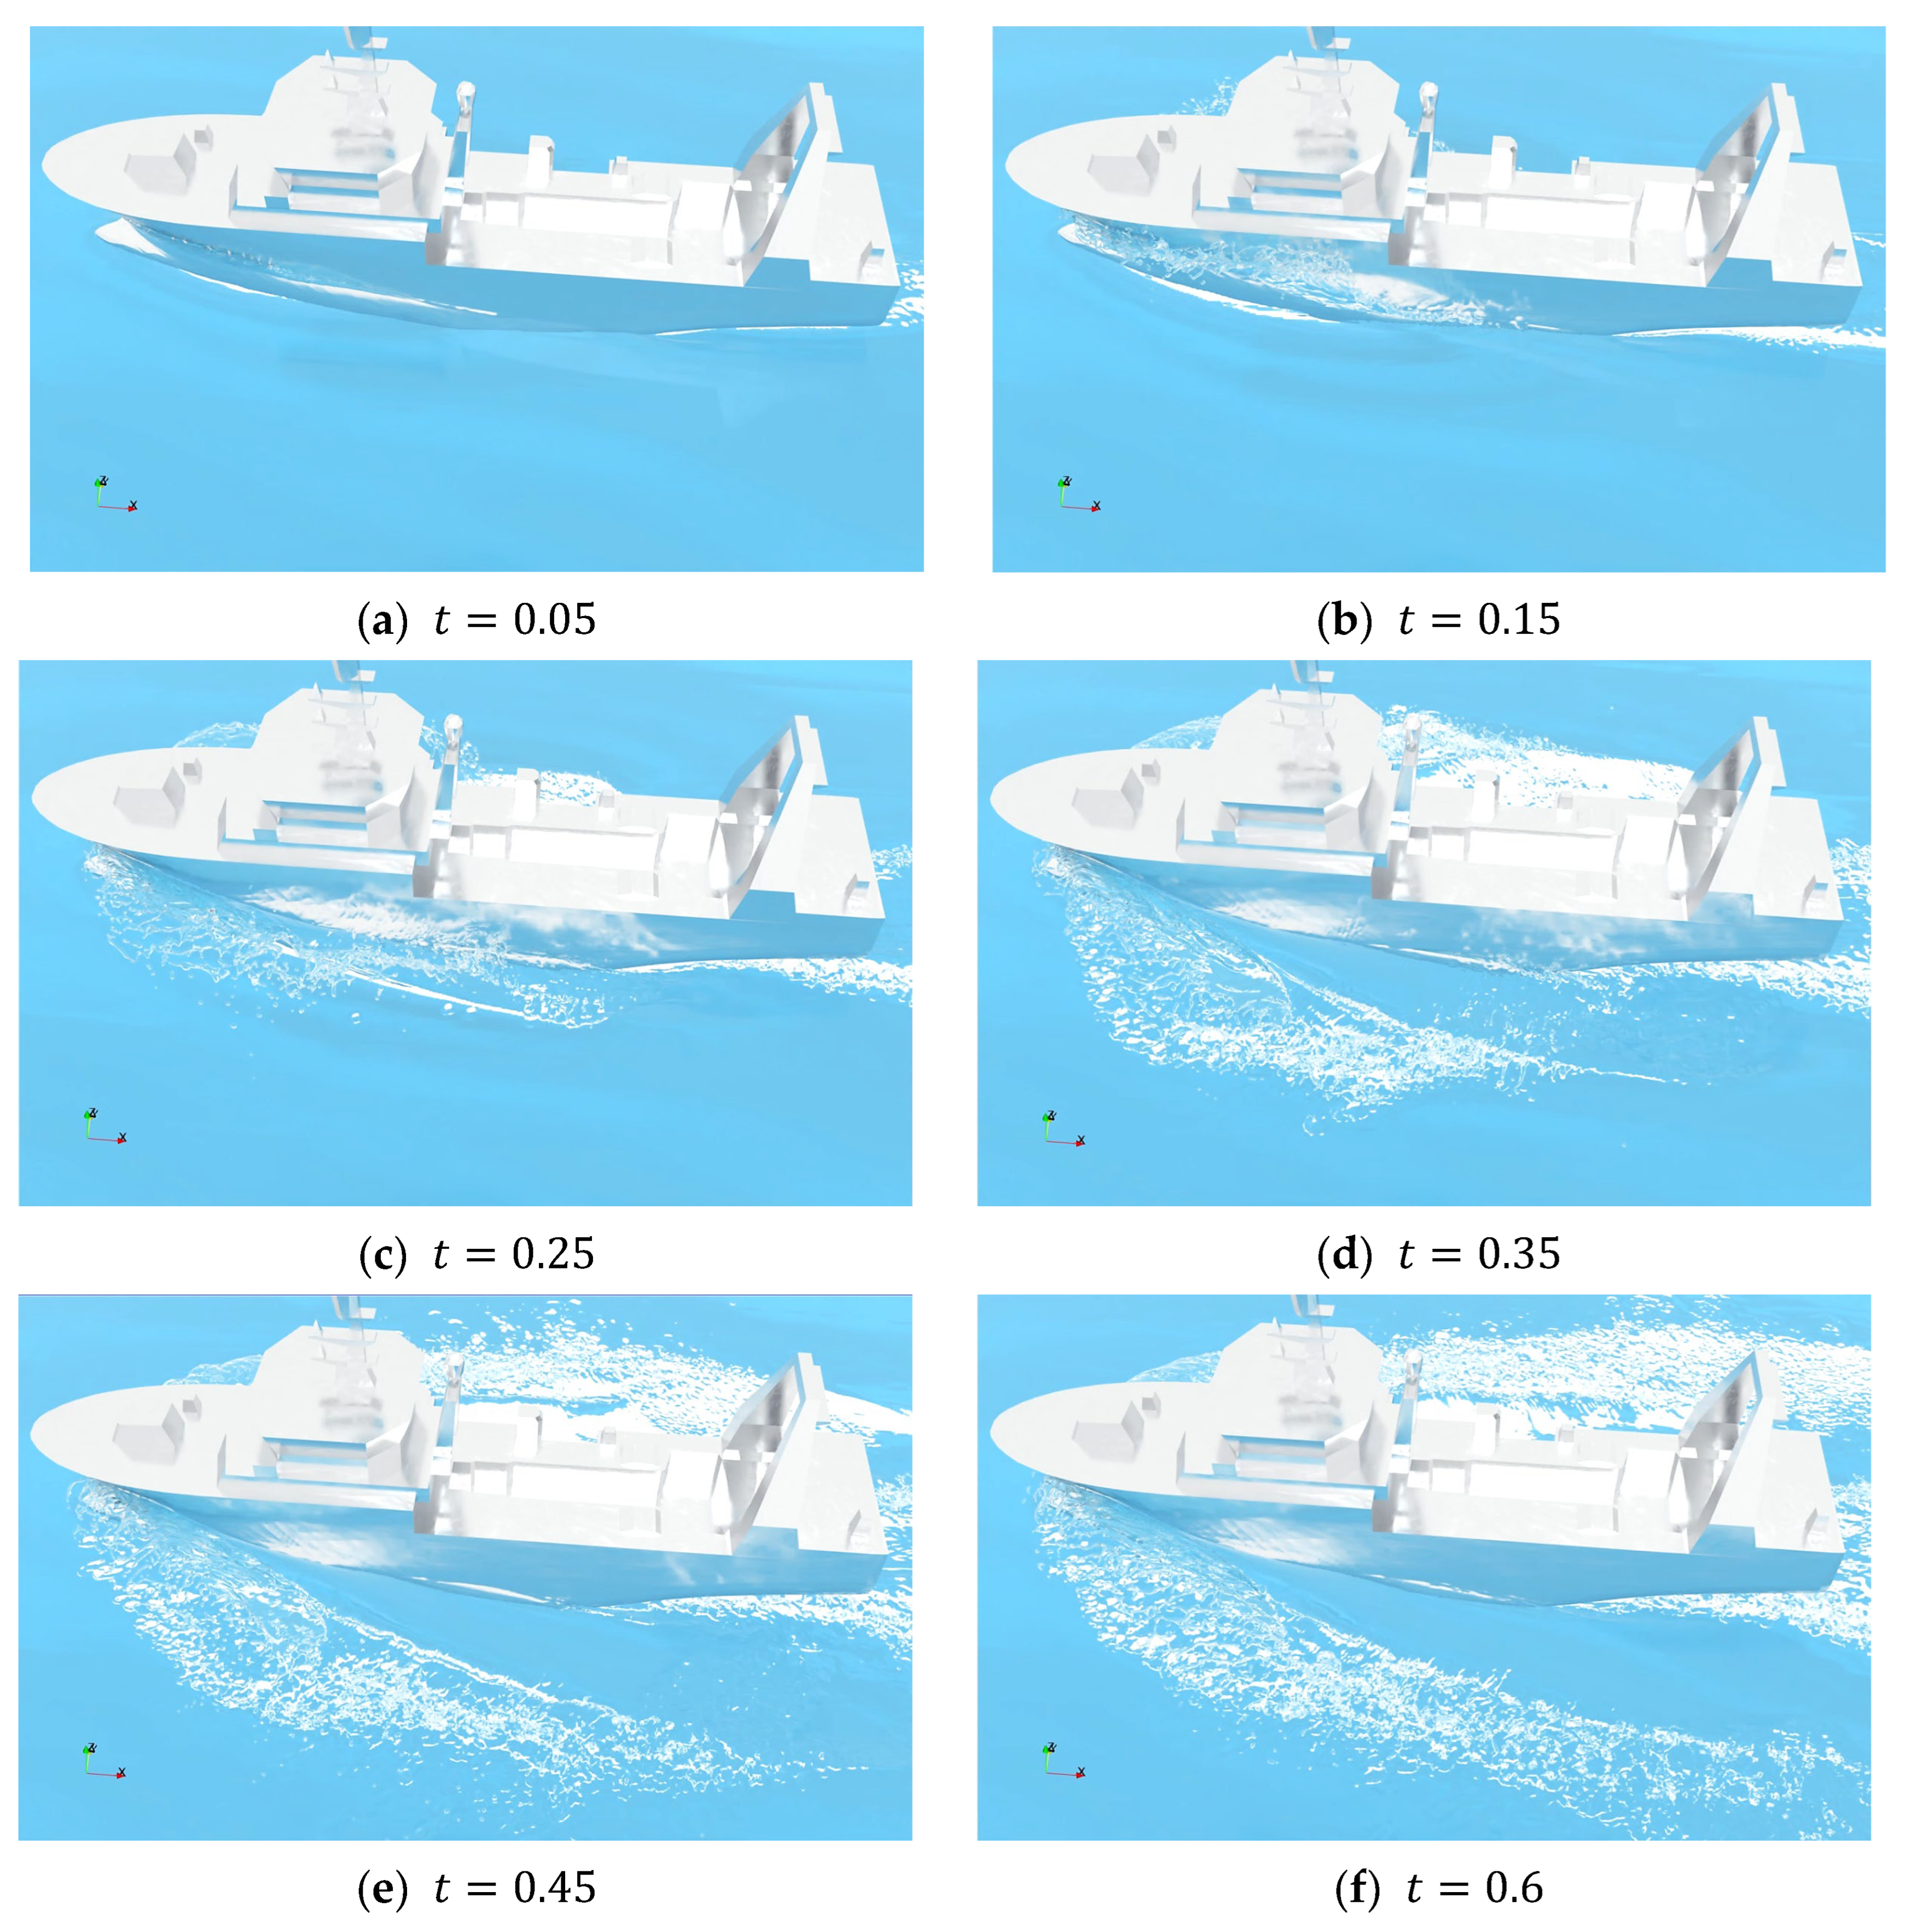
Figure 8 illustrates the temporal evolution of the bow wave breaking process, from the initial transient stage to a quasi-steady state. As the vessel advances, the stagnation pressure at the stem induces a significant elevation of the free surface, leading to the formation of a steep bow wave. Due to the high Froude number, the wave profile rapidly steepens and becomes unstable, which is clearly captured in the visualization. In the early stages (
Figure 8a–c), the water surface ahead of the stem rises sharply due to the impulsive motion of the hull, causing a coherent wave crest to form and steepen. As the flow develops, the steepness of the bow wave increases to the point where it exceeds the stability limit. At the onset of breaking (
Figure 8d), the wave crest starts to overturn and plunge both forward and sideways, initiating the air entrainment process. In the later stages (
Figure 8e,f), the breaking bow wave stabilizes into a continuous structure. The resulting white water and foam propagate along the hull sides, interacting with the shoulder wave.
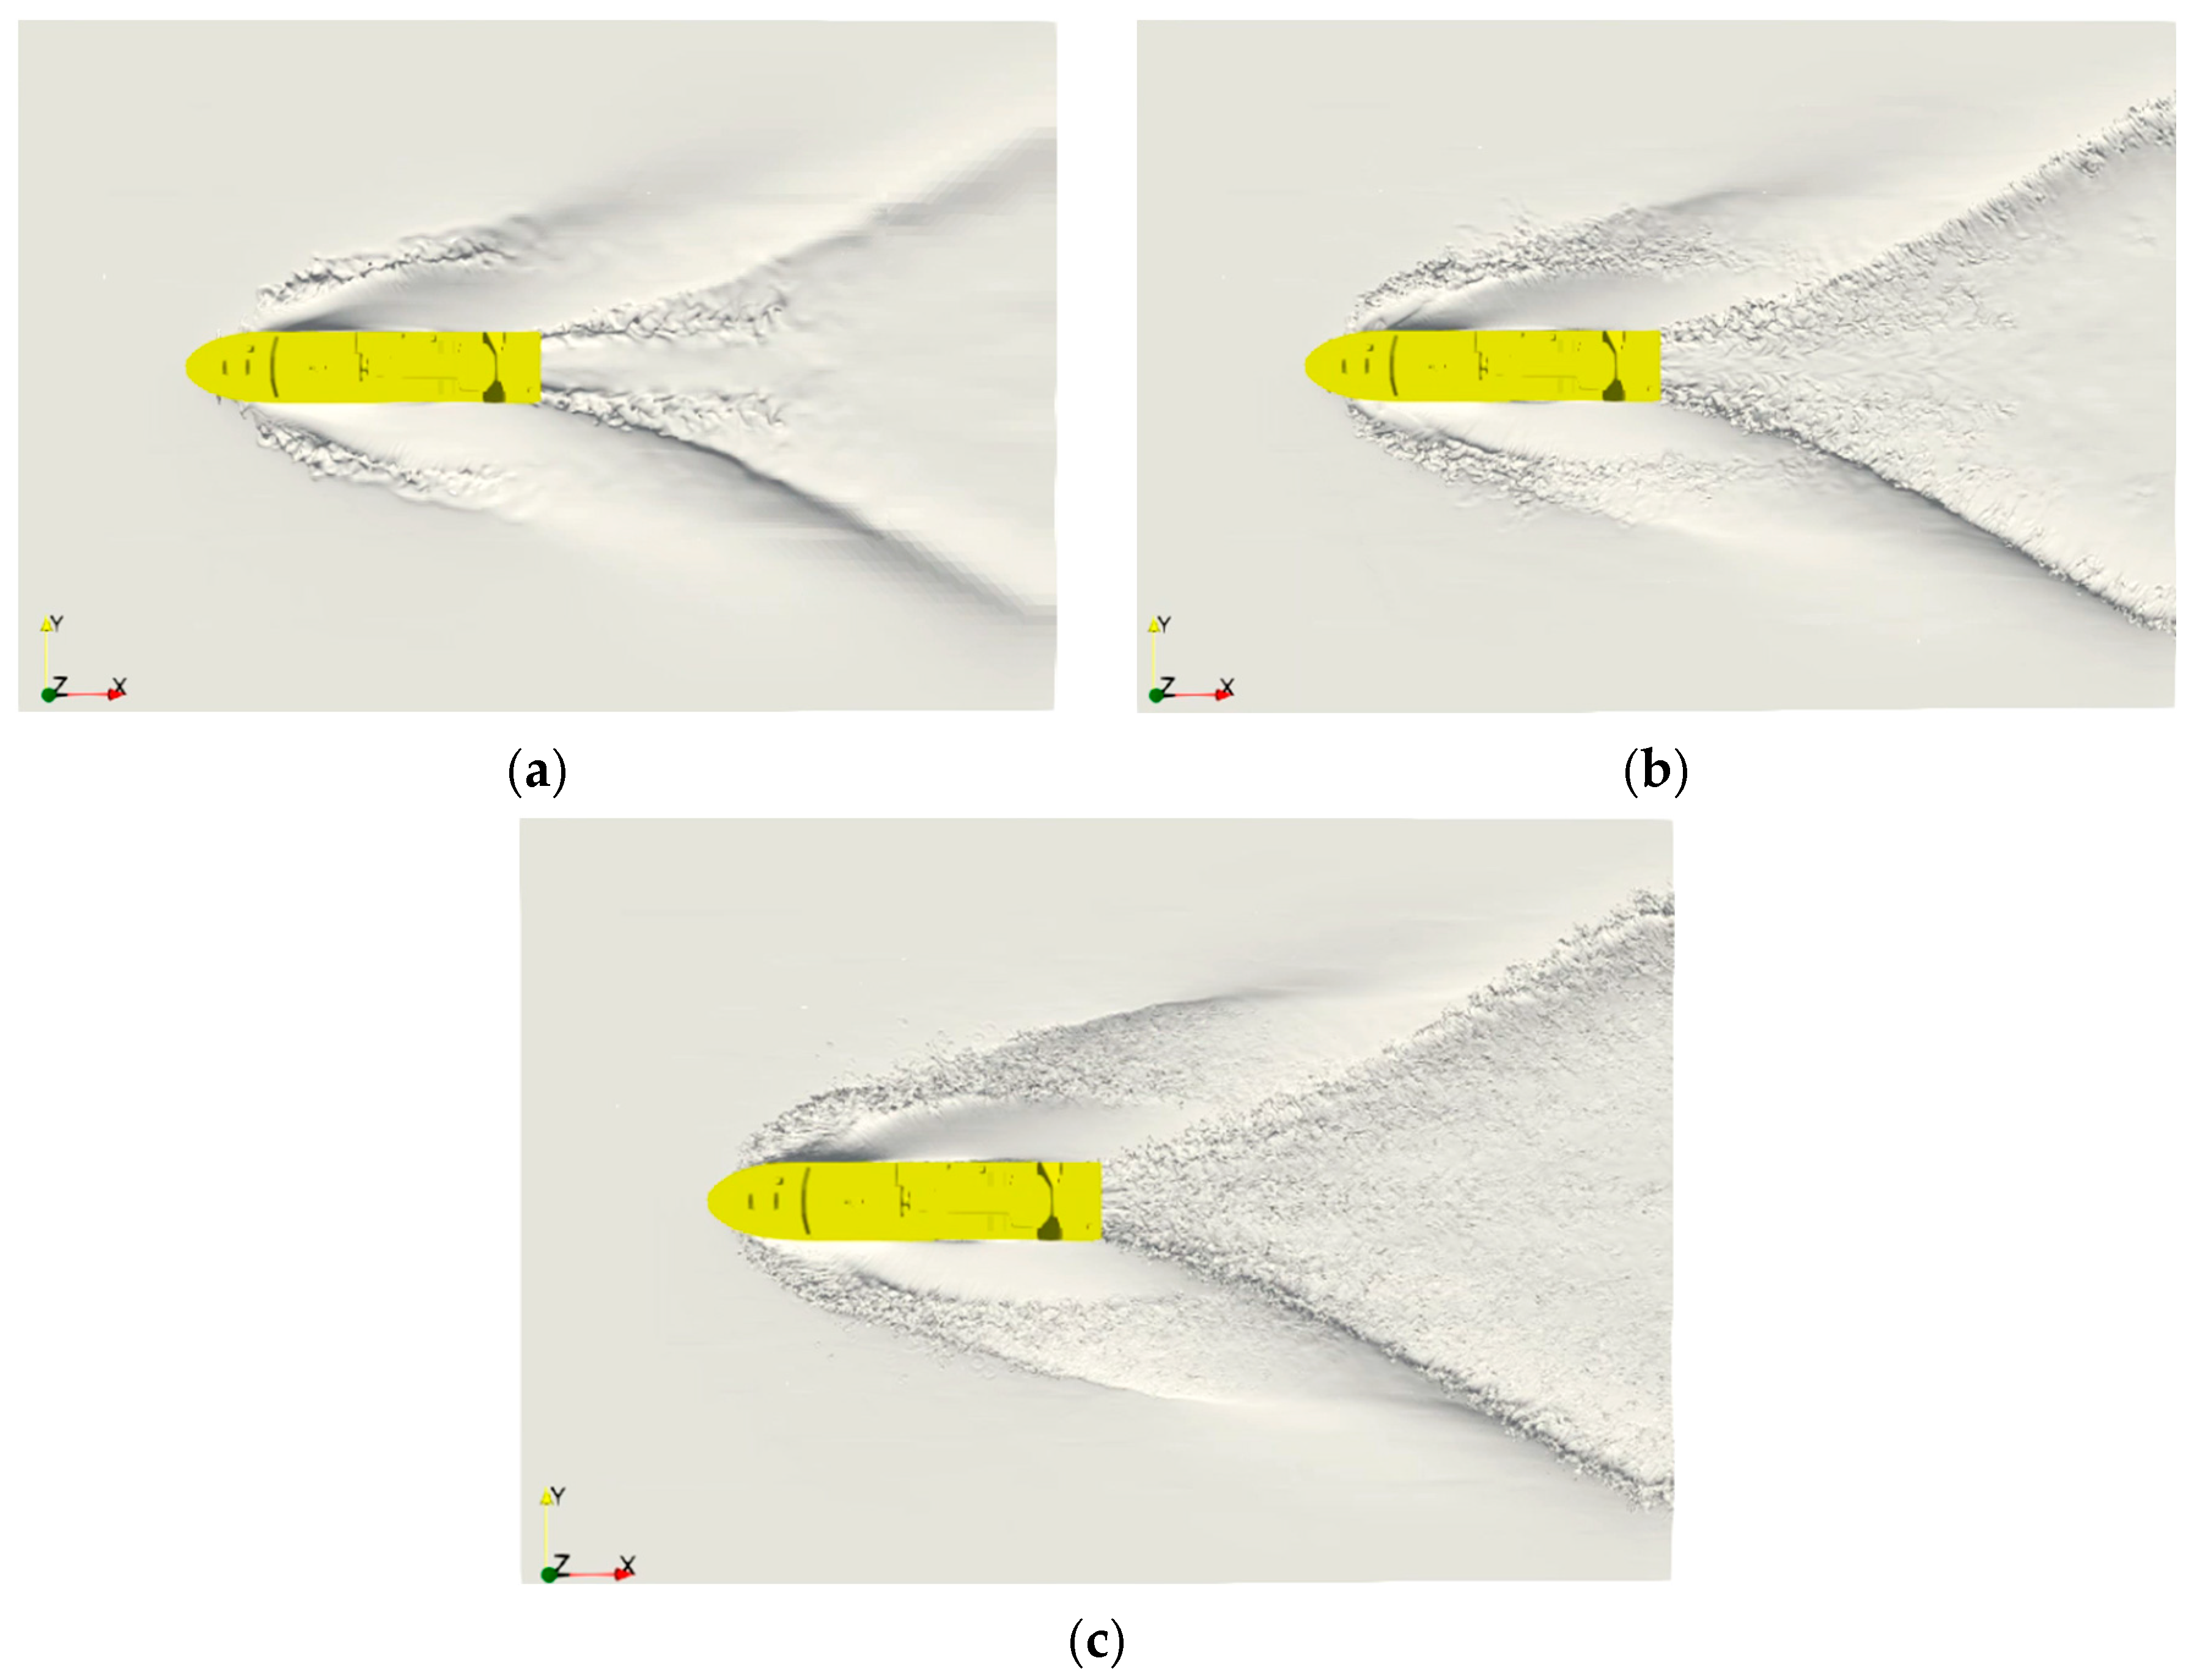
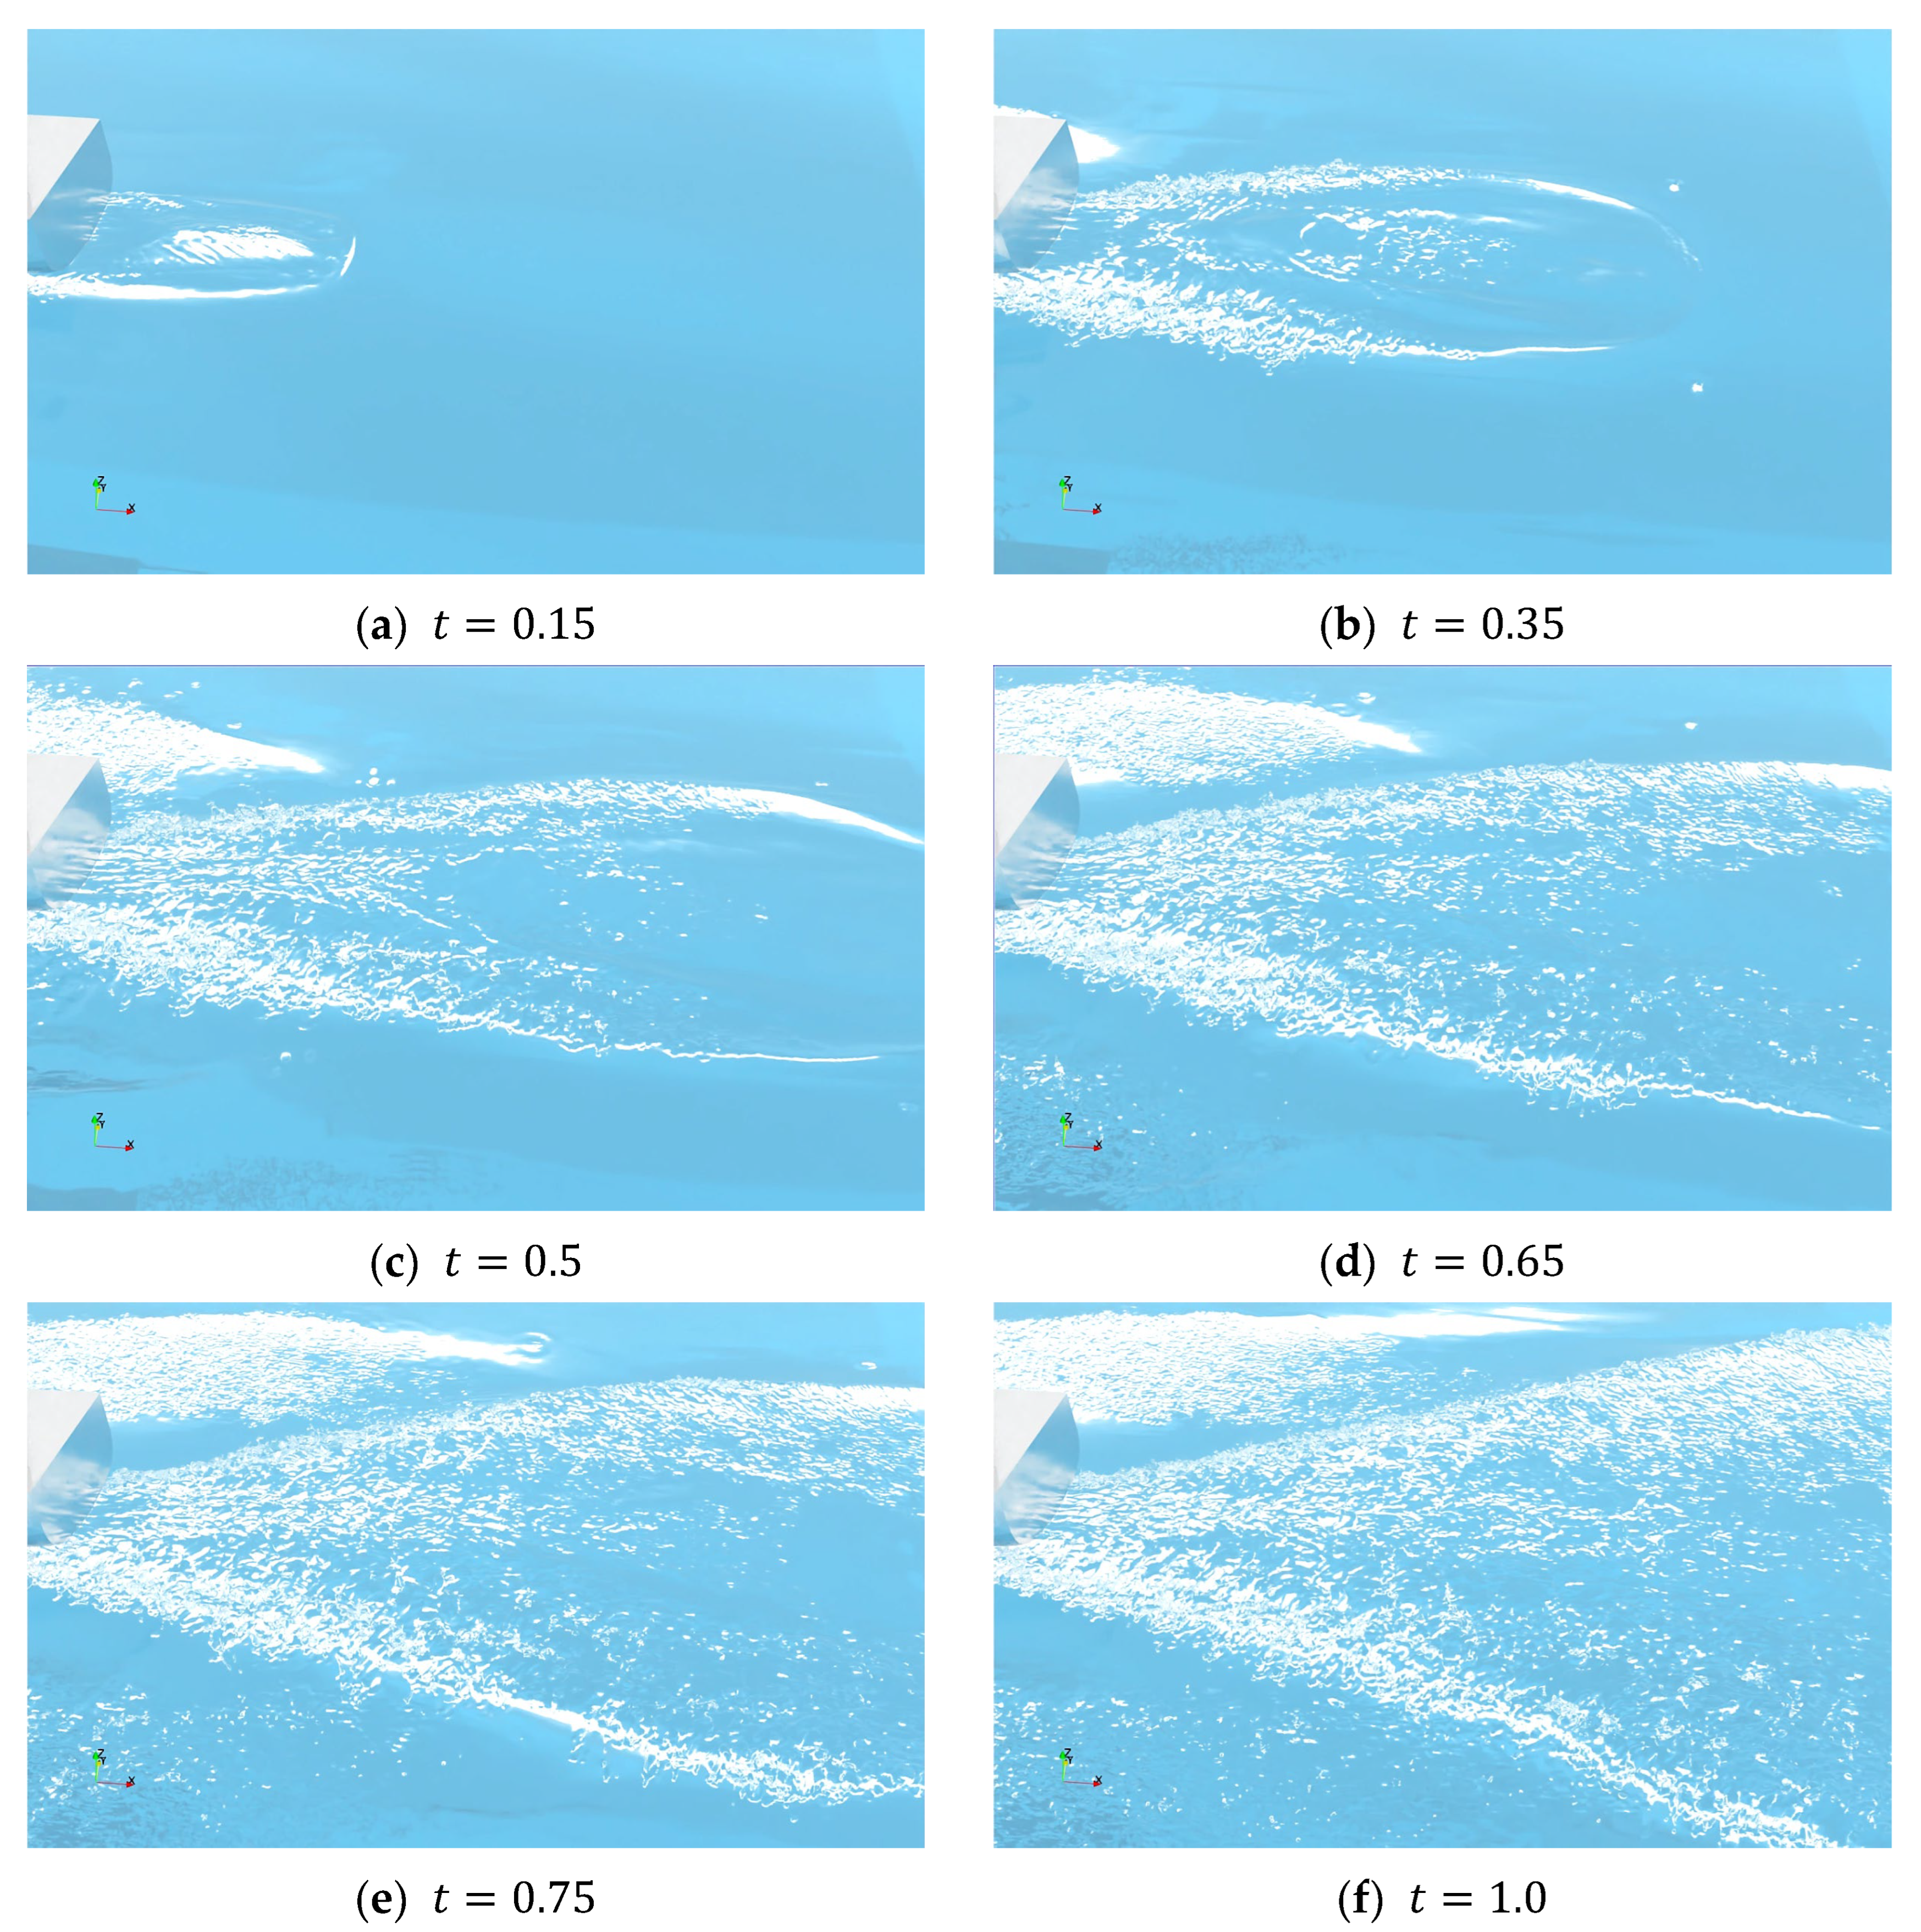
Figure 9 provides a magnified view of the near-field wake evolution aft of the transom stern, capturing the transition from initial flow separation to a fully developed turbulent wake state. In the early stage (
Figure 9a), the flow separates cleanly from the sharp bottom edge of the transom, with a distinct transom hollow visible immediately behind the stern. By
(
Figure 9b), the converging flow from beneath the hull and the sides meets the centerline, causing a rapid elevation of the free surface, which manifests as the onset of a “rooster tail” structure. As the flow develops (
Figure 9c), the rooster tail becomes unstable and breaks violently. This breaking process is marked by intense air entrainment (visualized as white regions), where large volumes of air are captured and fragmented into bubbles. By
(
Figure 9d), the wake expands laterally as spilling breakers develop along the leading edges of the diverging waves. The interaction between these breaking waves and the surrounding flow generates a highly convoluted interface and introduces significant vorticity, creating the complex surface textures and the characteristic V-shaped turbulent wake observed downstream. In the final stages (
Figure 9e,f), the wake achieves a quasi-steady state. The chaotic breaking at the rooster tail transitions into a continuous stream of bubbly flow that convects downstream. A prominent V-shaped diverging wave pattern is clearly formed, delineating the turbulent wake region.
3.2. Wake Characteristics Across Different Froude Number Conditions
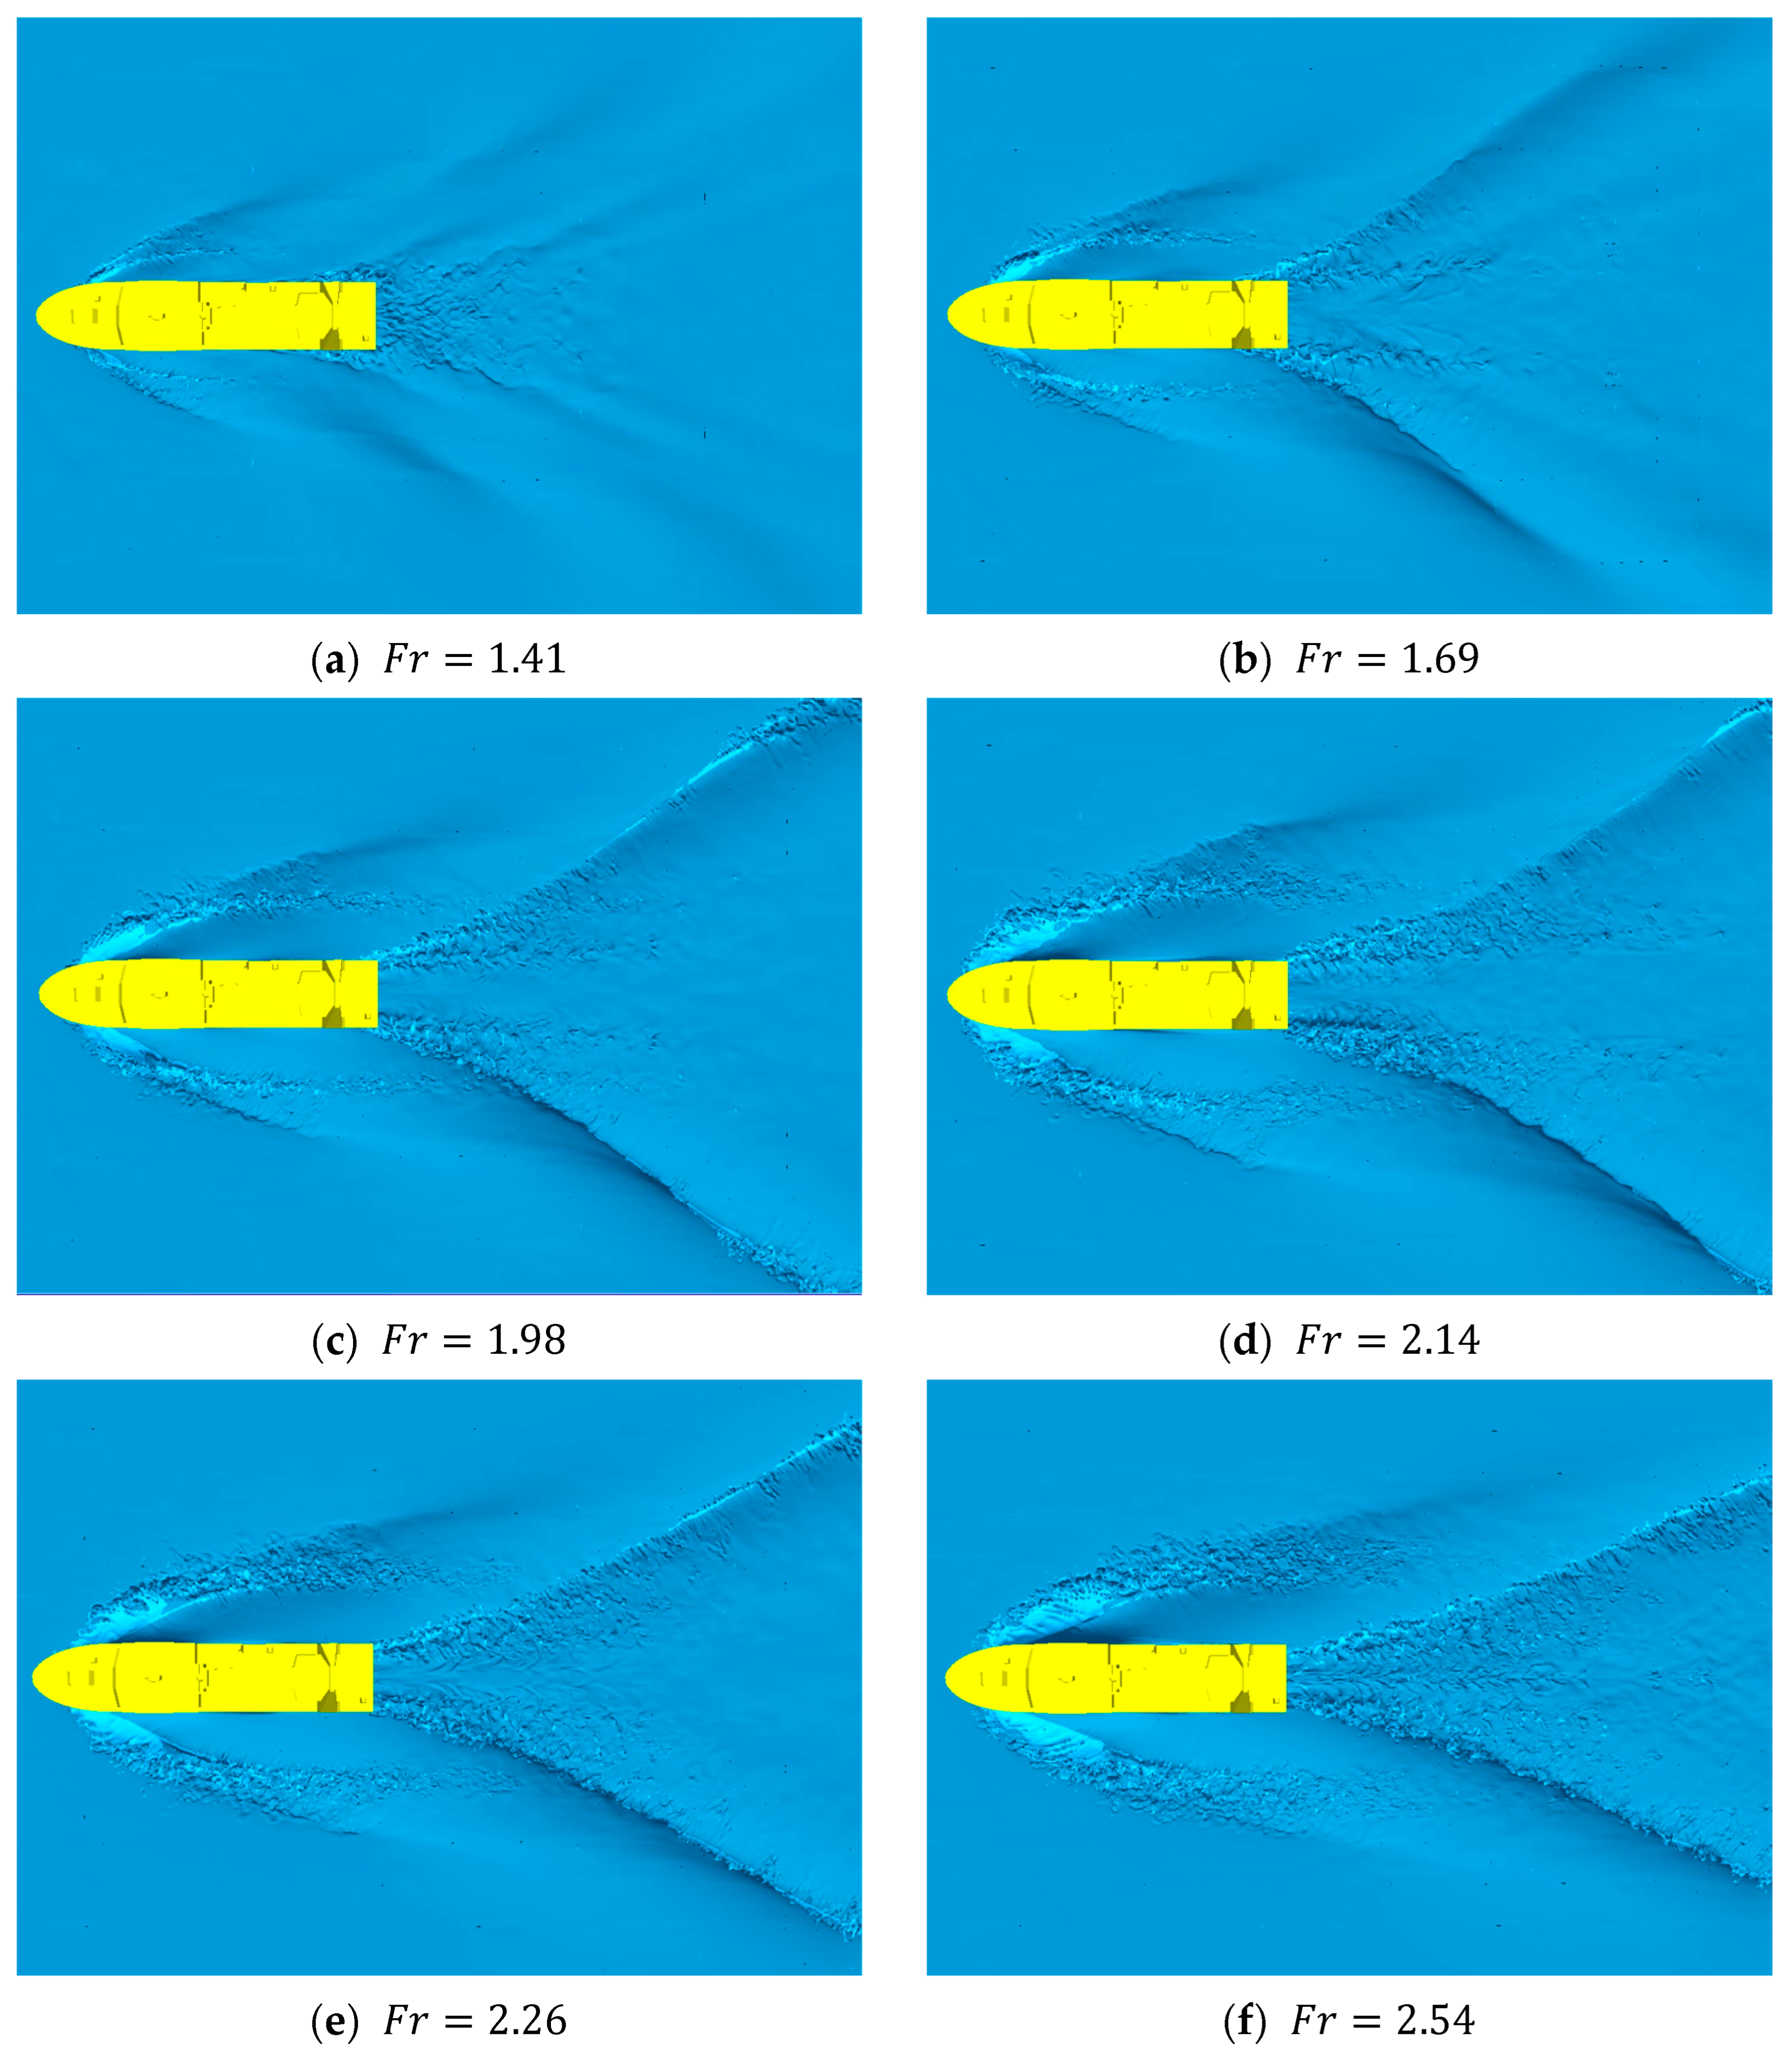
Figure 10 presents a comparative visualization of the steady-state free-surface topology across a range of velocities. As the speed increases, distinct changes in the wake characteristics are observed. At lower velocities (
Figure 10a,b), the wake remains relatively calm, with air entrainment confined to the immediate vicinity of the transom. The wake pattern is diffuse, with a wider spreading angle. The diverging waves propagate more broadly, and the V-shaped envelope appears more obtuse. As the velocity increases to
and beyond (
Figure 10c–f), there is a marked intensification of interfacial instability. The white aerated regions expand significantly, indicating that higher Froude numbers induce more violent wave breaking and stronger turbulent mixing. The wake envelope shows a clear narrowing trend. The diverging wave arms align more closely with the centerline, effectively reducing the apparent wake angle.
At the highest speeds, the flow enters a specific high-speed regime within the investigated range. The wake is characterized by intense, chaotic wave breaking that extends significantly downstream. The diverging wave crests become sharper and more persistent compared to the lower-speed cases, forming a more acute V-shape. In this study, the “wake spreading angle” is defined as the local orientation of these diverging wave crests relative to the ship’s centerline. This near-field hydrodynamic feature is distinct from the global Kelvin wake envelope angle, as the latter governs the far-field wave boundary which typically forms beyond the current computational domain. As the Froude number increases, the energy of the near-field wake becomes more concentrated along these diverging arms. This transition is a characteristic feature of high-Froude-number flows, where the transverse wave components diminish and the diverging waves dominate, sweeping back more aggressively relative to the vessel’s path.
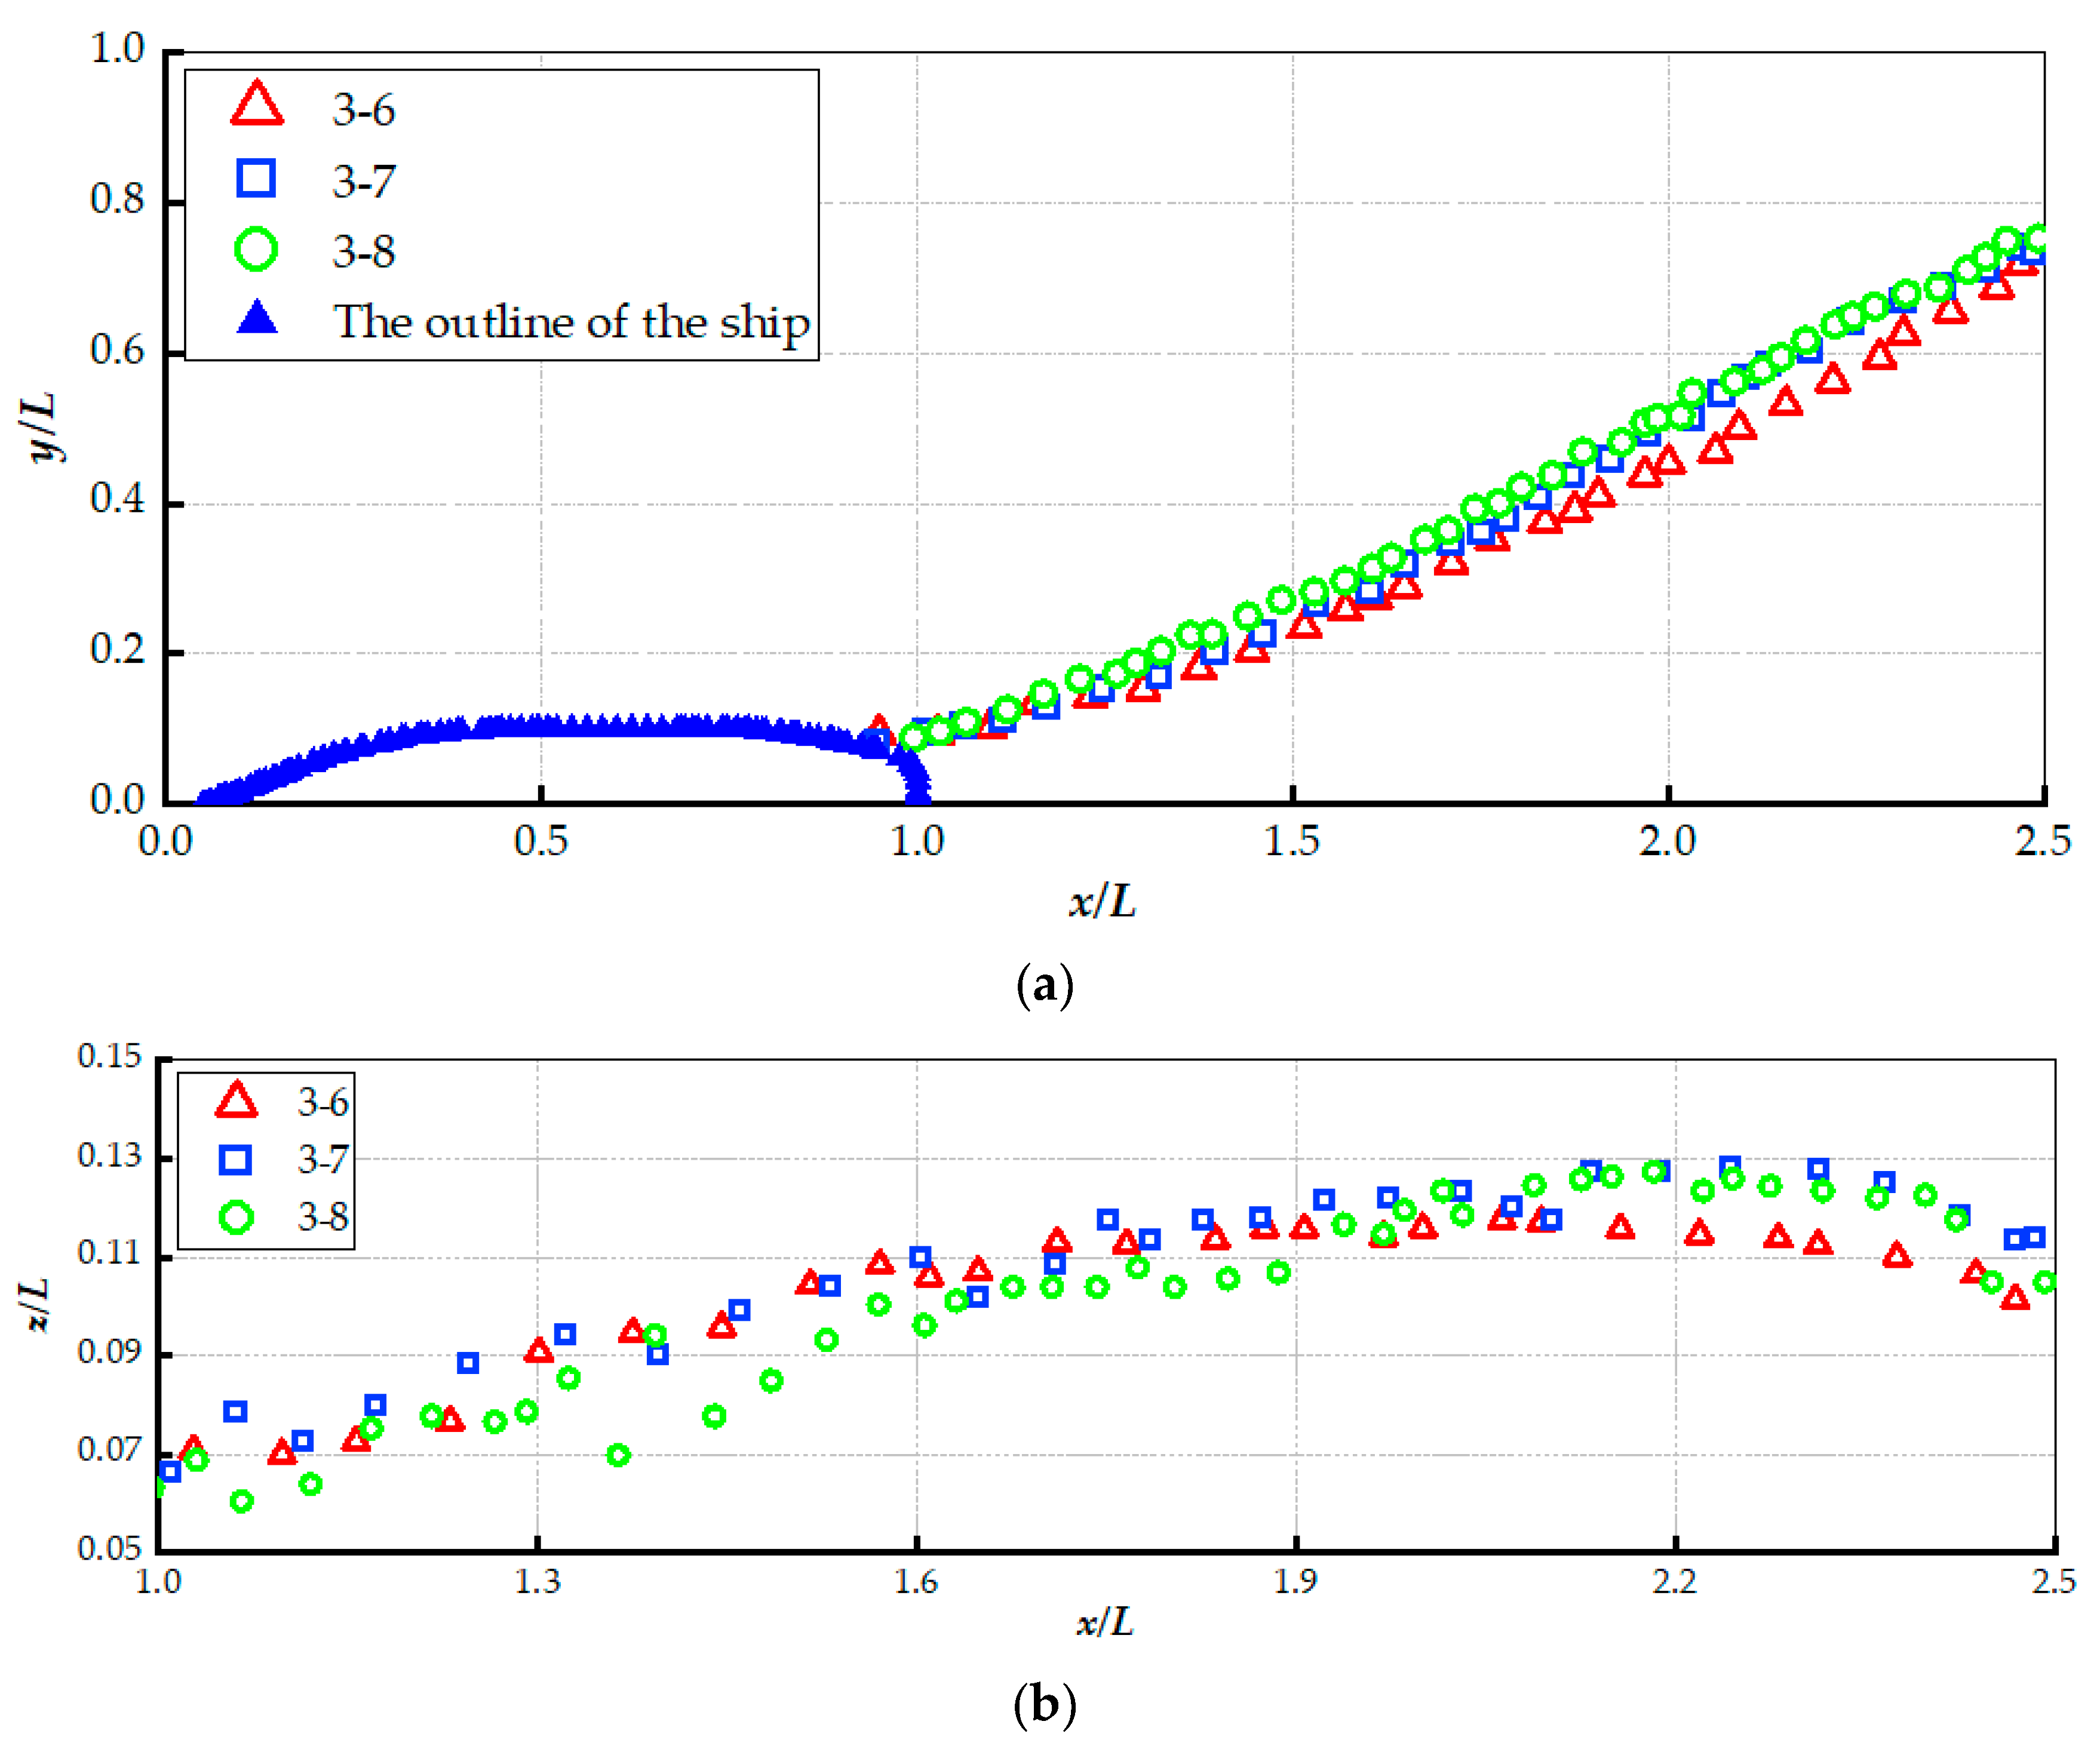
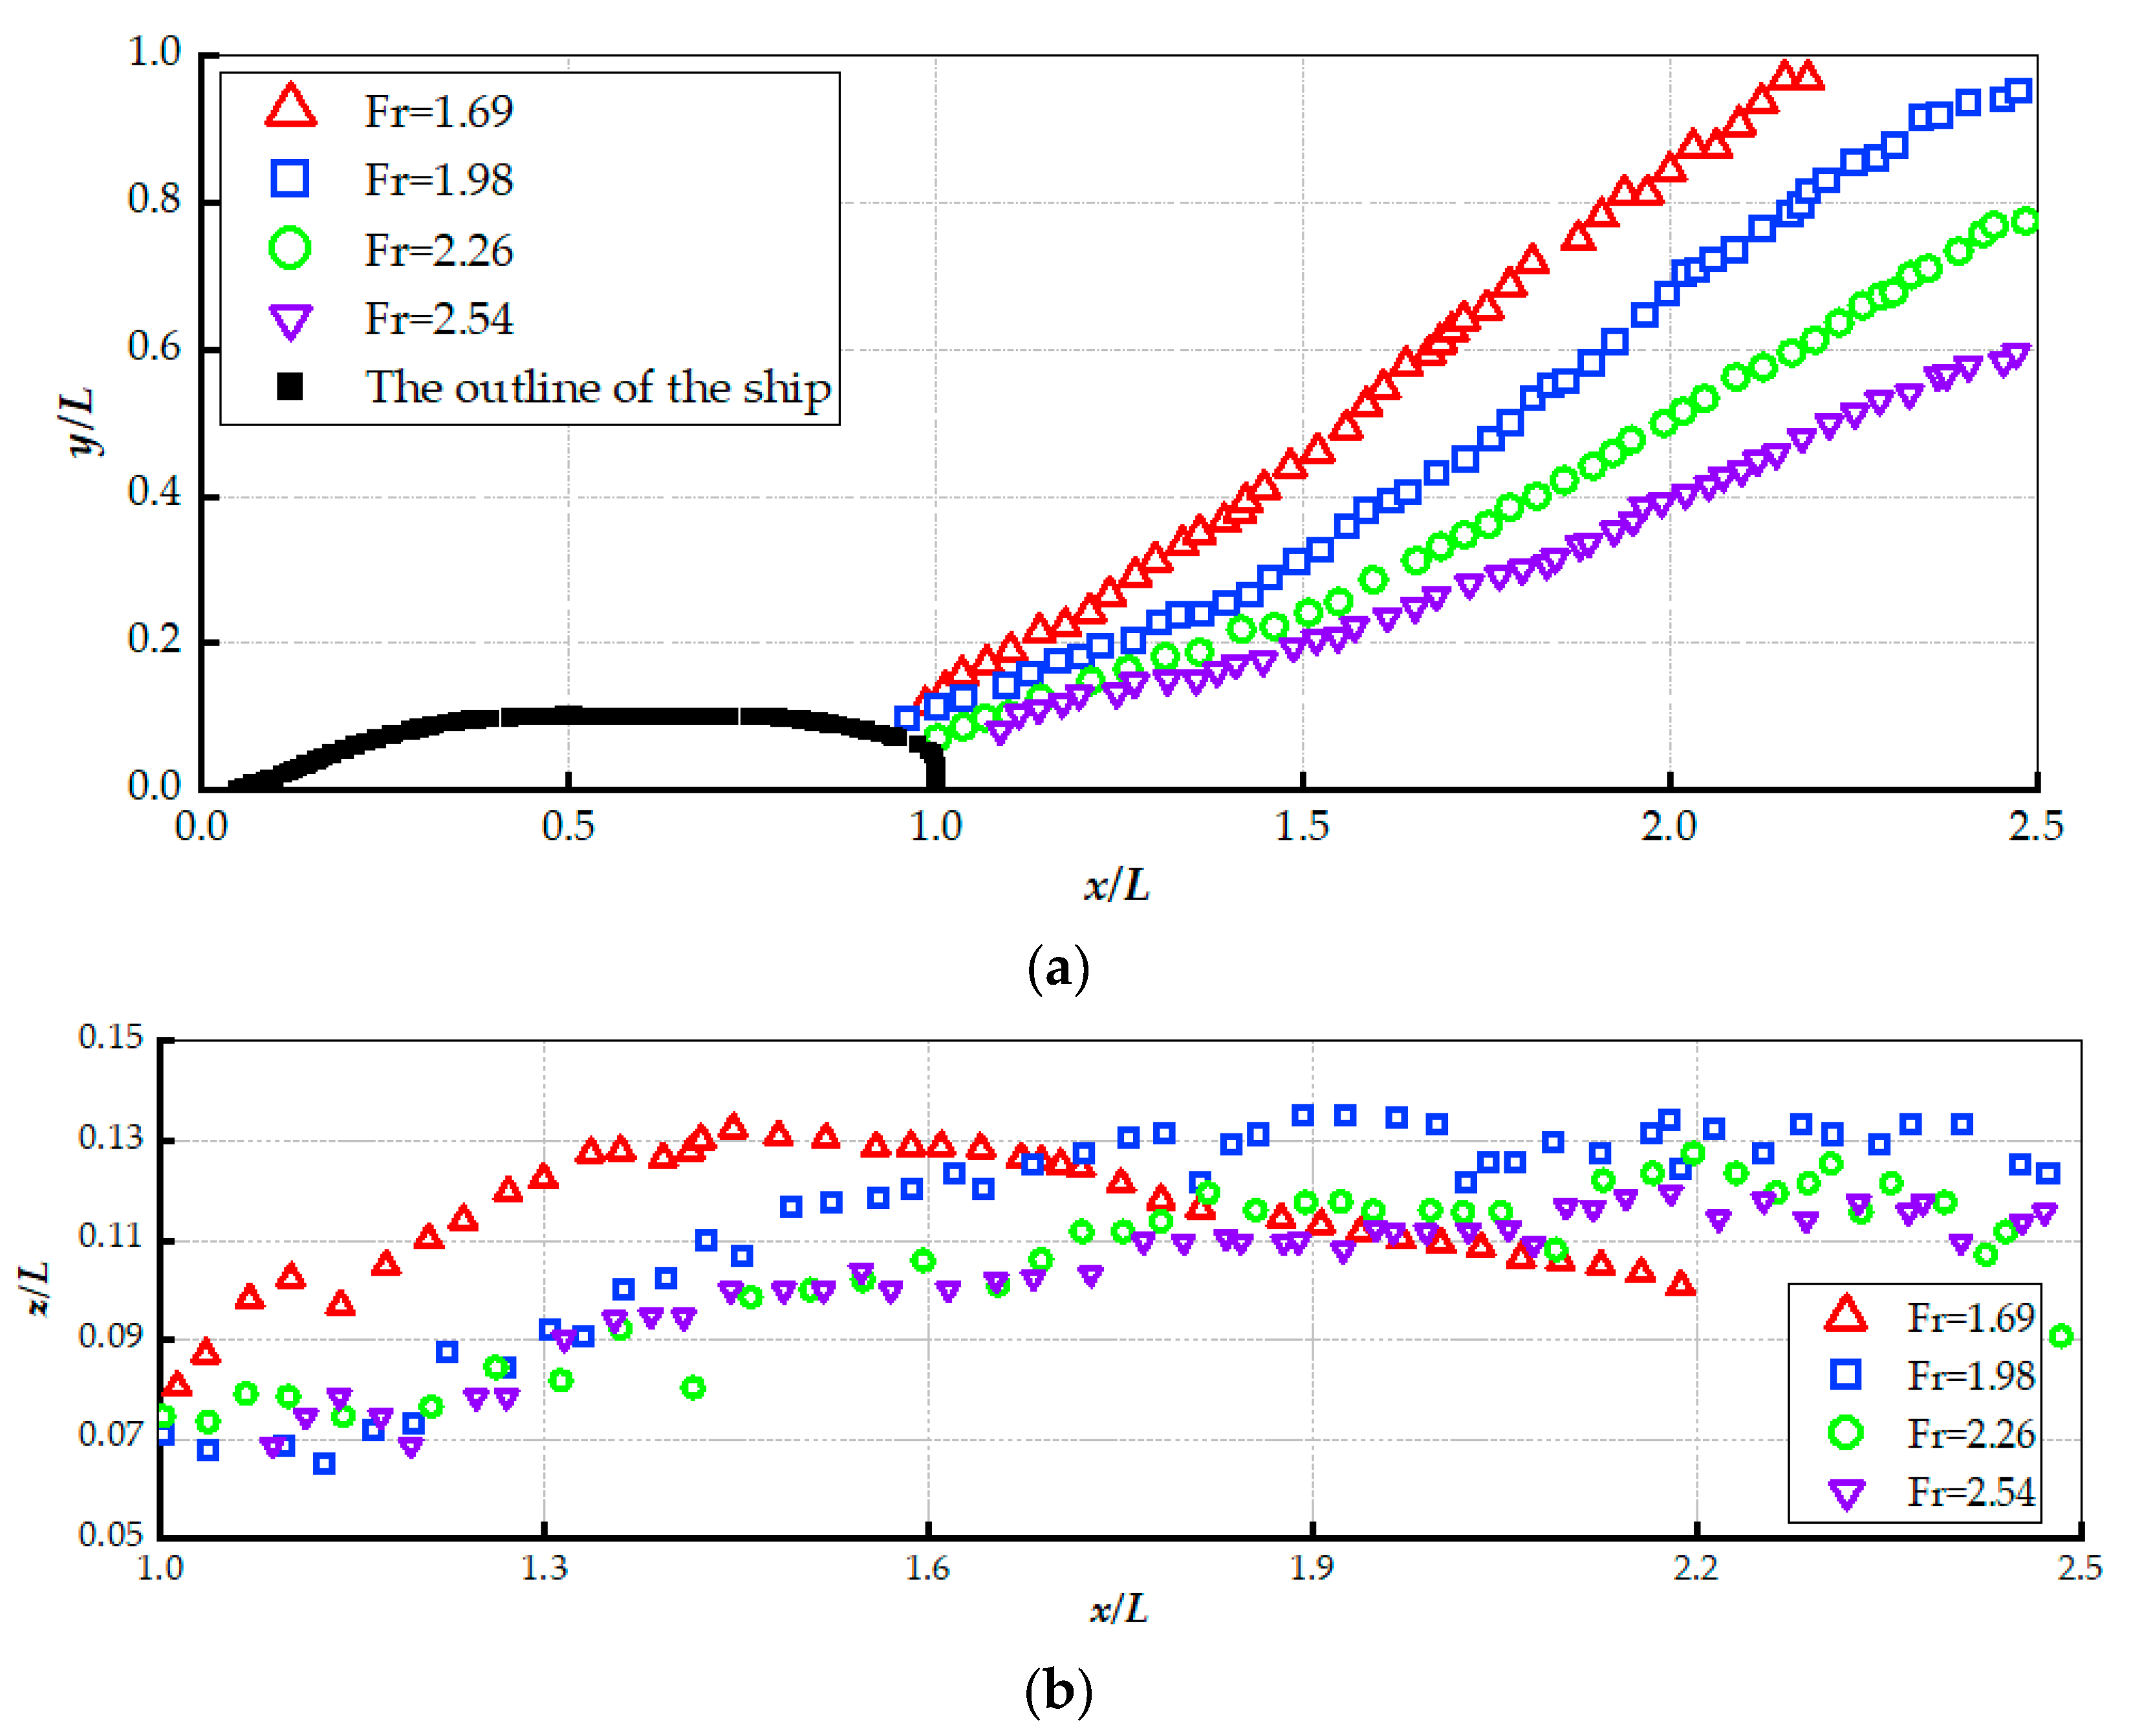
To further quantify the effect of Froude number on wake topology, the spatial trajectories of the wake envelope are extracted and plotted in
Figure 11.
Figure 11a clearly illustrates the narrowing trend of the wake envelope as the Froude number increases from
to
, consistent with observations in
Figure 10. At lower speeds (e.g.,
, red triangles), the wake exhibits a larger spreading angle, extending significantly in the transverse direction. As the Froude number increases, the wake envelope progressively contracts towards the centerline. This data quantitatively demonstrates the “wake narrowing” phenomenon, where the hydrodynamic energy becomes increasingly confined to a narrower sector behind the vessel at higher speeds.
Figure 11b illustrates the centerline wave elevation (
) to characterize the development of the generated stern wave. A clear phase shift is observed in the wave profile. As the Froude number increases, the location of the primary wave crest moves significantly downstream (to larger
values). At lower Froude numbers, the wave crest is steep and close to the transom. However, as the flow transitions to the highest Froude numbers (
and
), the downstream migration of the peak slows down, and the wave profile begins to stabilize and flatten. This indicates that the vessel has entered a relatively stable wave regime, in which the stern wave manifests as an elongated, steady streak rather than a steep, breaking crest.
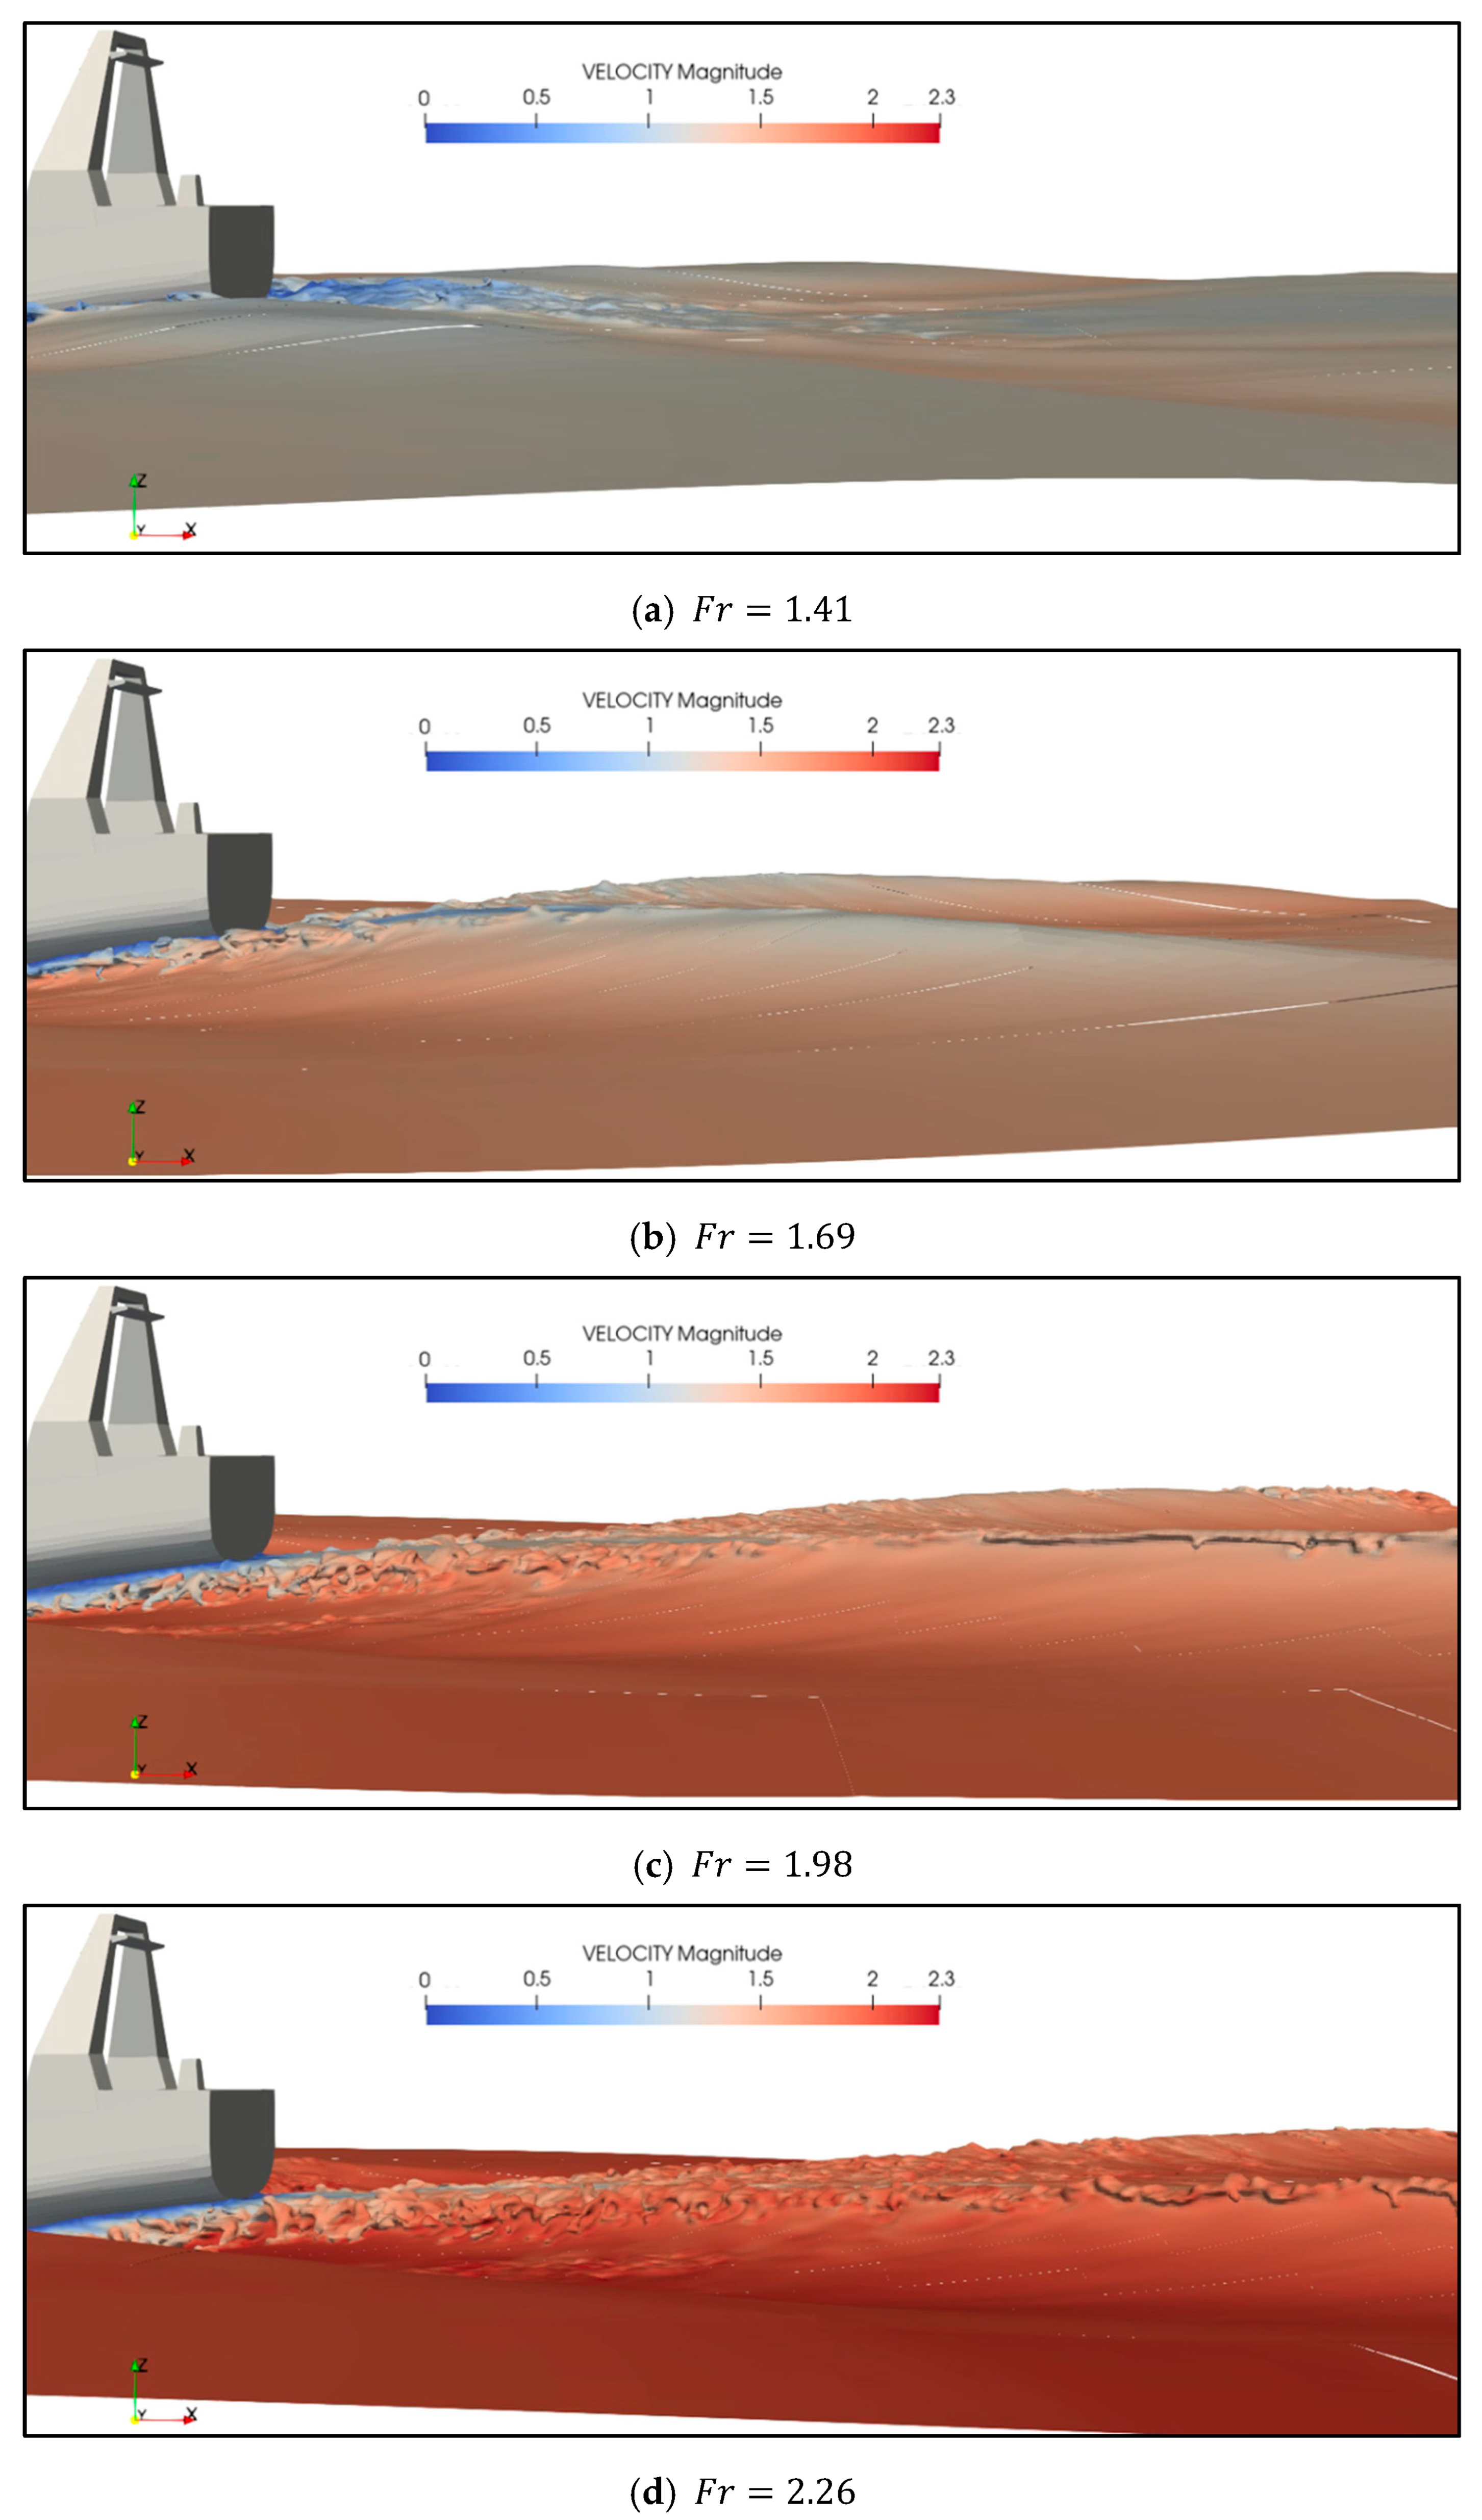
Figure 12 visualizes the three-dimensional topology of the free surface colored by velocity magnitude at four different speeds. For
, the primary wave crest forms immediately aft of the transom, indicating a relatively low Froude number regime where the wavelength is short. The high-speed region is confined to a small area near the hull and the first wave crest. The velocity decays rapidly as the wake spreads. As the speed increases, the rooster tail significantly elongates. The peak of the wave crest moves further downstream, effectively increasing the virtual length of the hull. The wave slope becomes more gradual, transitioning into a long, stable high-speed wake.
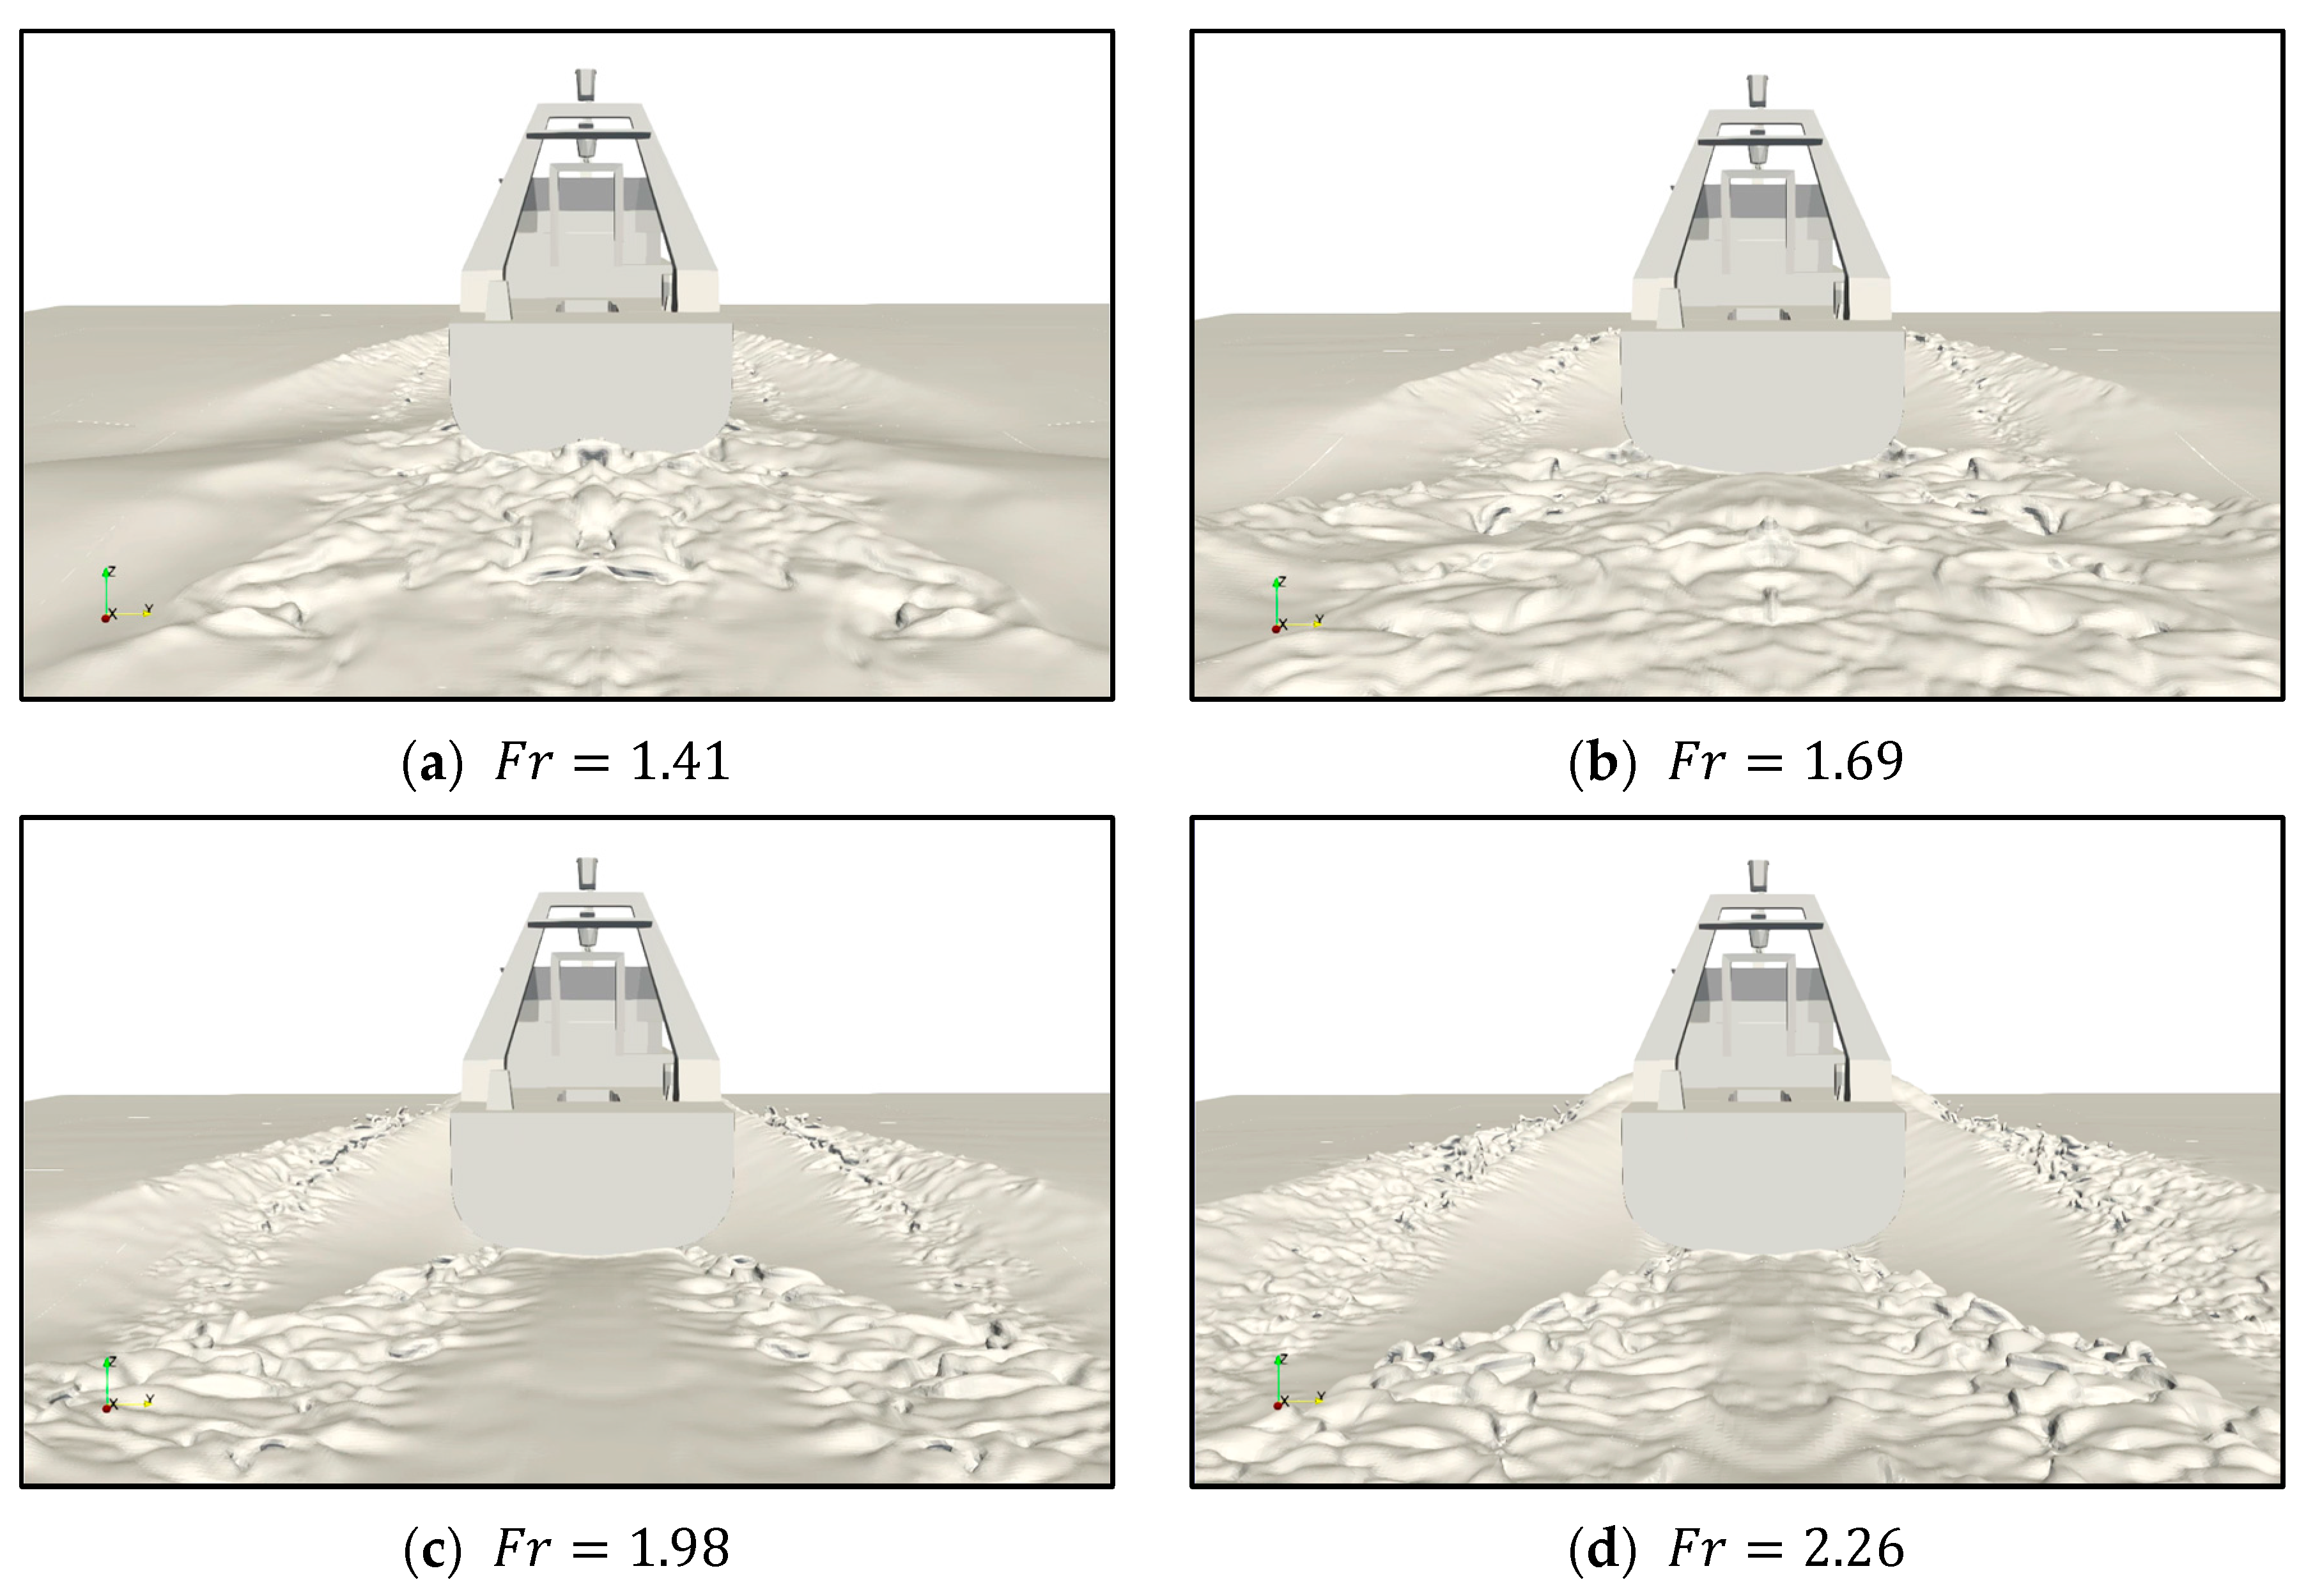
The Froude number based on the transom draft,
, plays a critical role in the transition of the flow regime at the stern. As illustrated in
Figure 13, a primary observation is the distinct transition in the transom ventilation state. At the lowest velocity (
), the flow exhibits a “wetted” regime, where the hydrodynamic forces are insufficient to clear the stern, resulting in a chaotic recirculation zone that keeps the transom face partially immersed. Conversely, as the velocity increases to
, the flow transitions to a fully “dry” regime, characterized by clean flow separation from the sharp bottom edge of the transom and complete ventilation of the stern area. In addition, in the low-speed wetted regime, the free surface immediately aft of the hull is highly irregular and turbulent due to the unsteady interaction between the backflow and the main stream. However, in the high-speed dry regime, a stable “transom hollow” develops, where the free surface appears remarkably smooth. This smoothness indicates a coherent flow region prior to the onset of turbulent breaking further downstream.
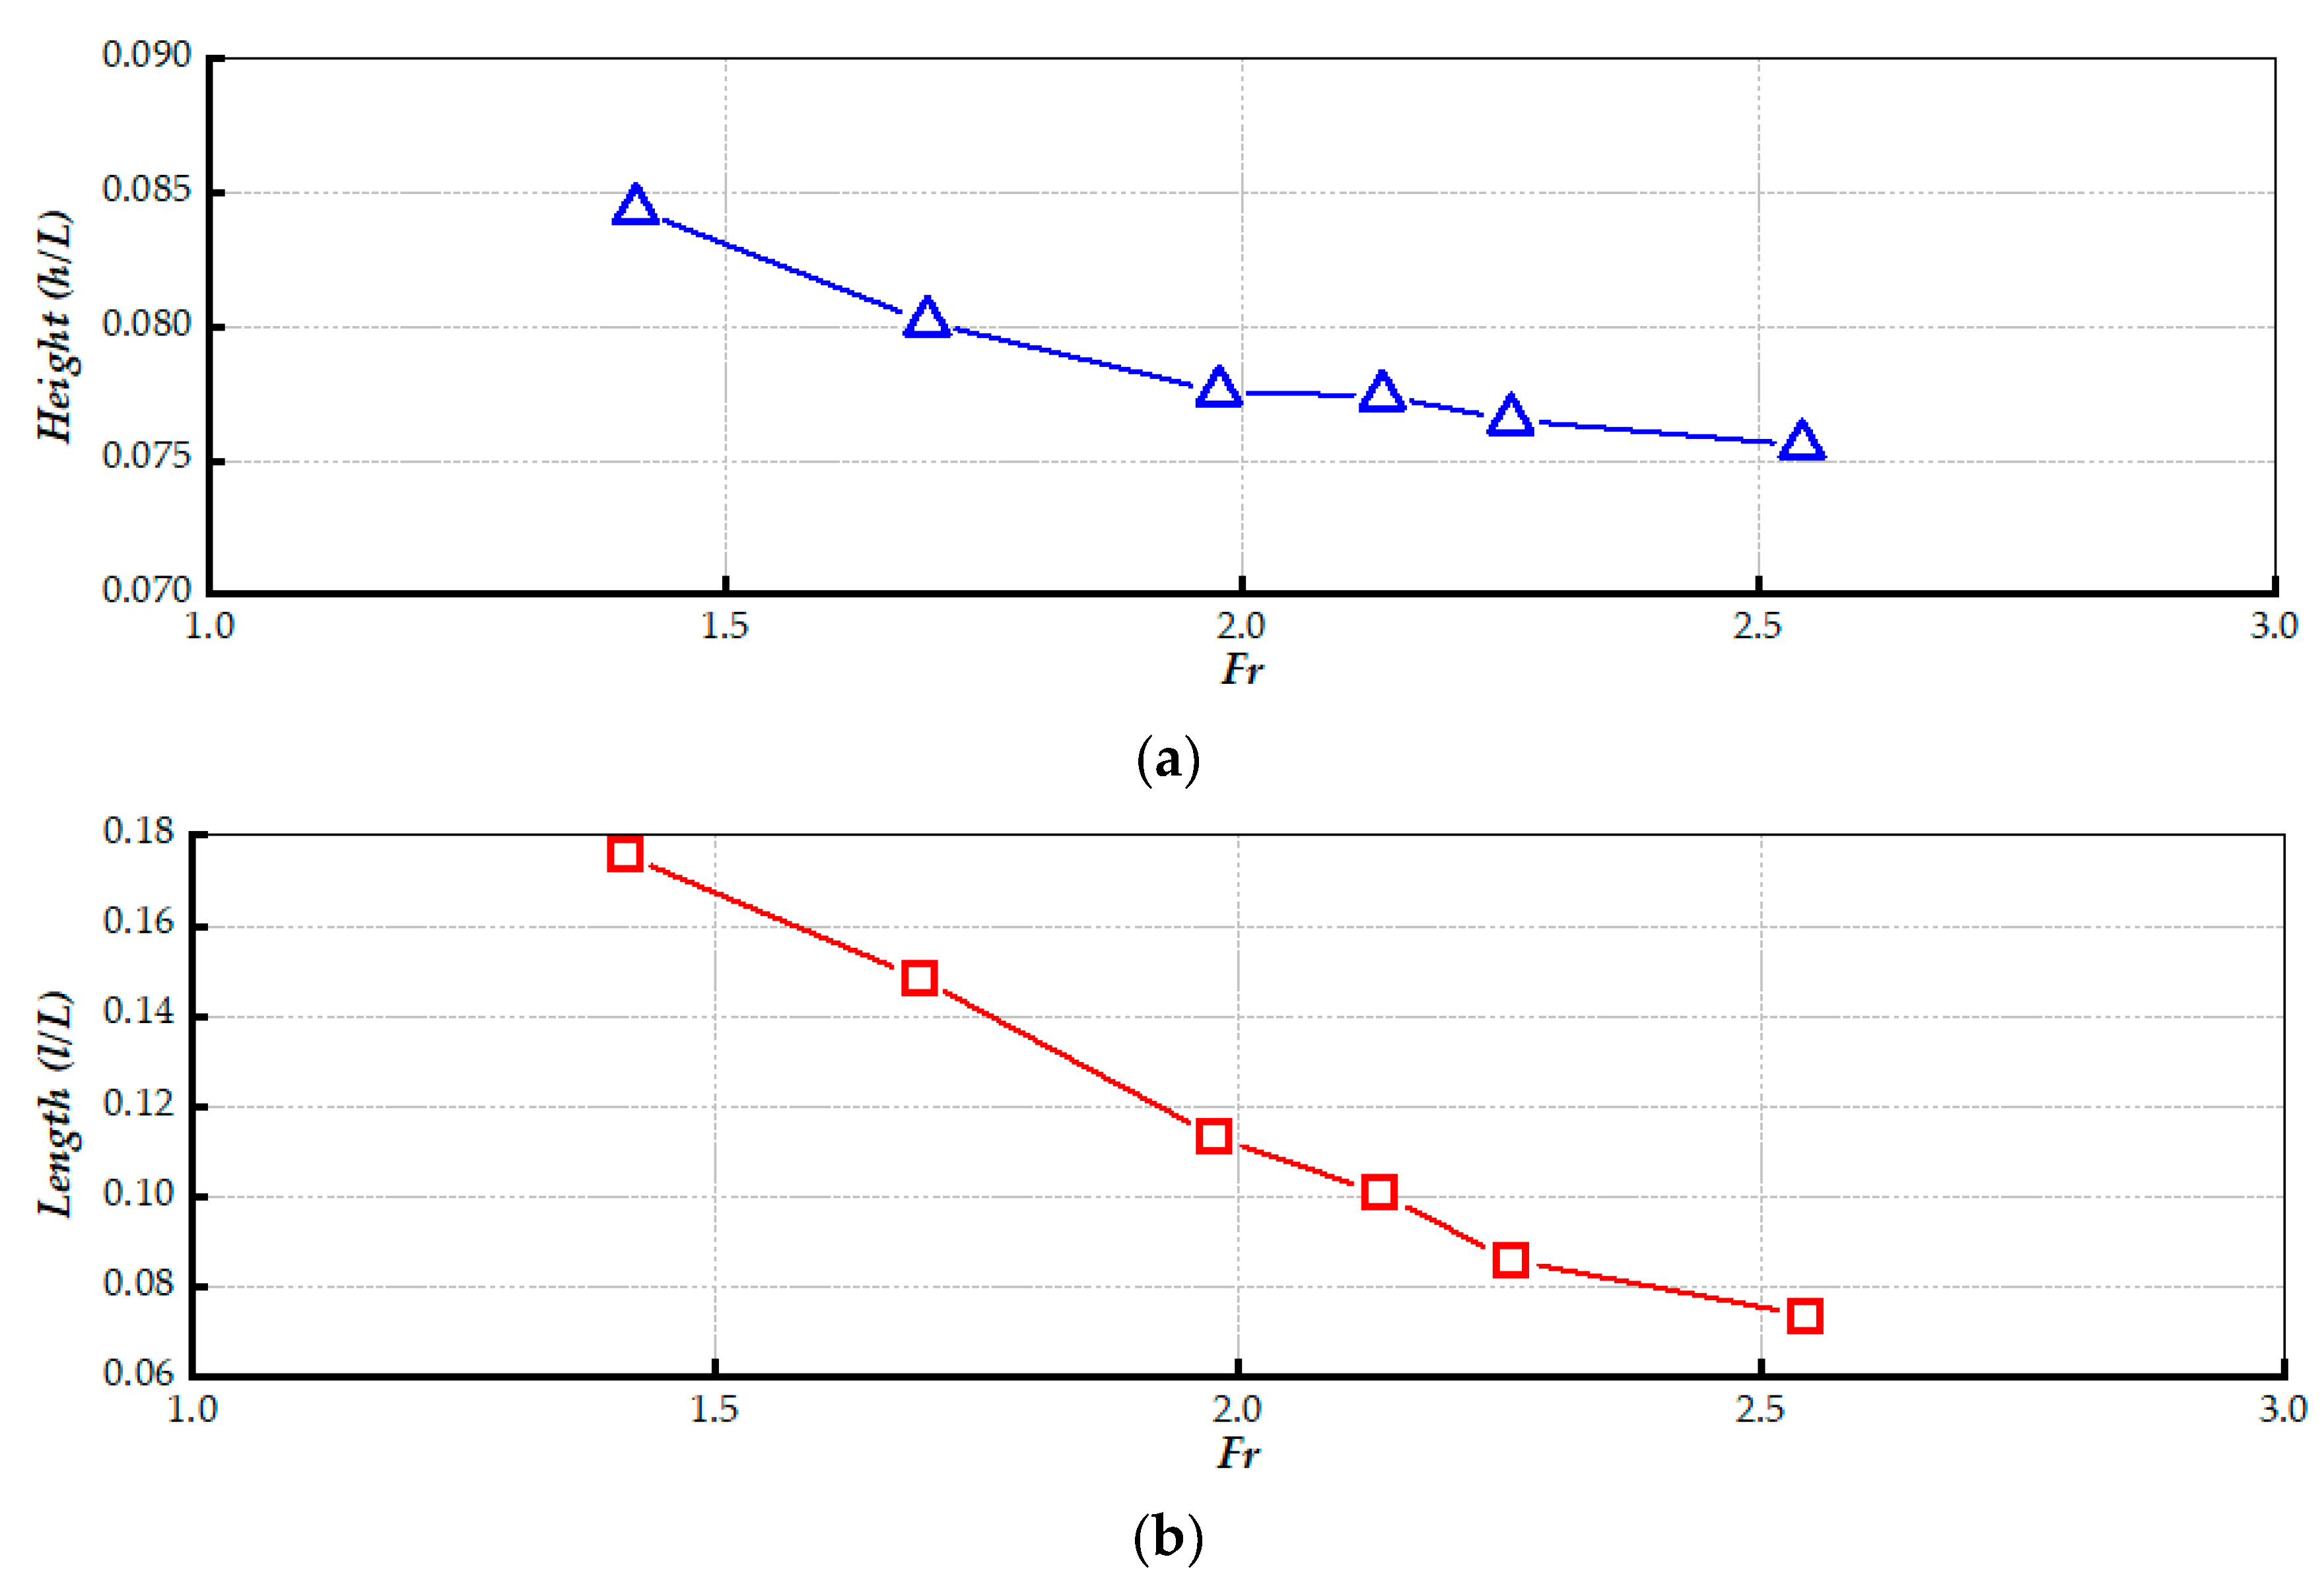
To further characterize the hydrodynamic response of the free surface, the variations in the wave height immediately aft of the stern and the diverging wave characteristic length are plotted against the Froude number in
Figure 14. In the lower Froude number range, the wave height is relatively high, corresponding to the wetted flow regime. At these speeds, the transom is partially immersed, and the recirculation of the flow causes the water level to rise against the stern face. However, as the Froude number increases, a sharp, monotonic decrease in wave height is observed. This rapid decay marks the transition from a wetted to a fully dry (ventilated) regime. As the flow separates cleanly from the bottom edge of the transom, a “transom hollow” is formed, causing the local water level to drop significantly.
Figure 14b depicts the variation in the diverging wave characteristic length with respect to the Froude number. A strong inverse correlation is observed, where the characteristic length drops steeply. This significant monotonic reduction serves as quantitative confirmation of the wake narrowing phenomenon described earlier. It indicates that as the ship speed increases, the lateral extent of the diverging waves diminishes rapidly, confining the wake energy to a narrower spatial envelope immediately aft of the stern.
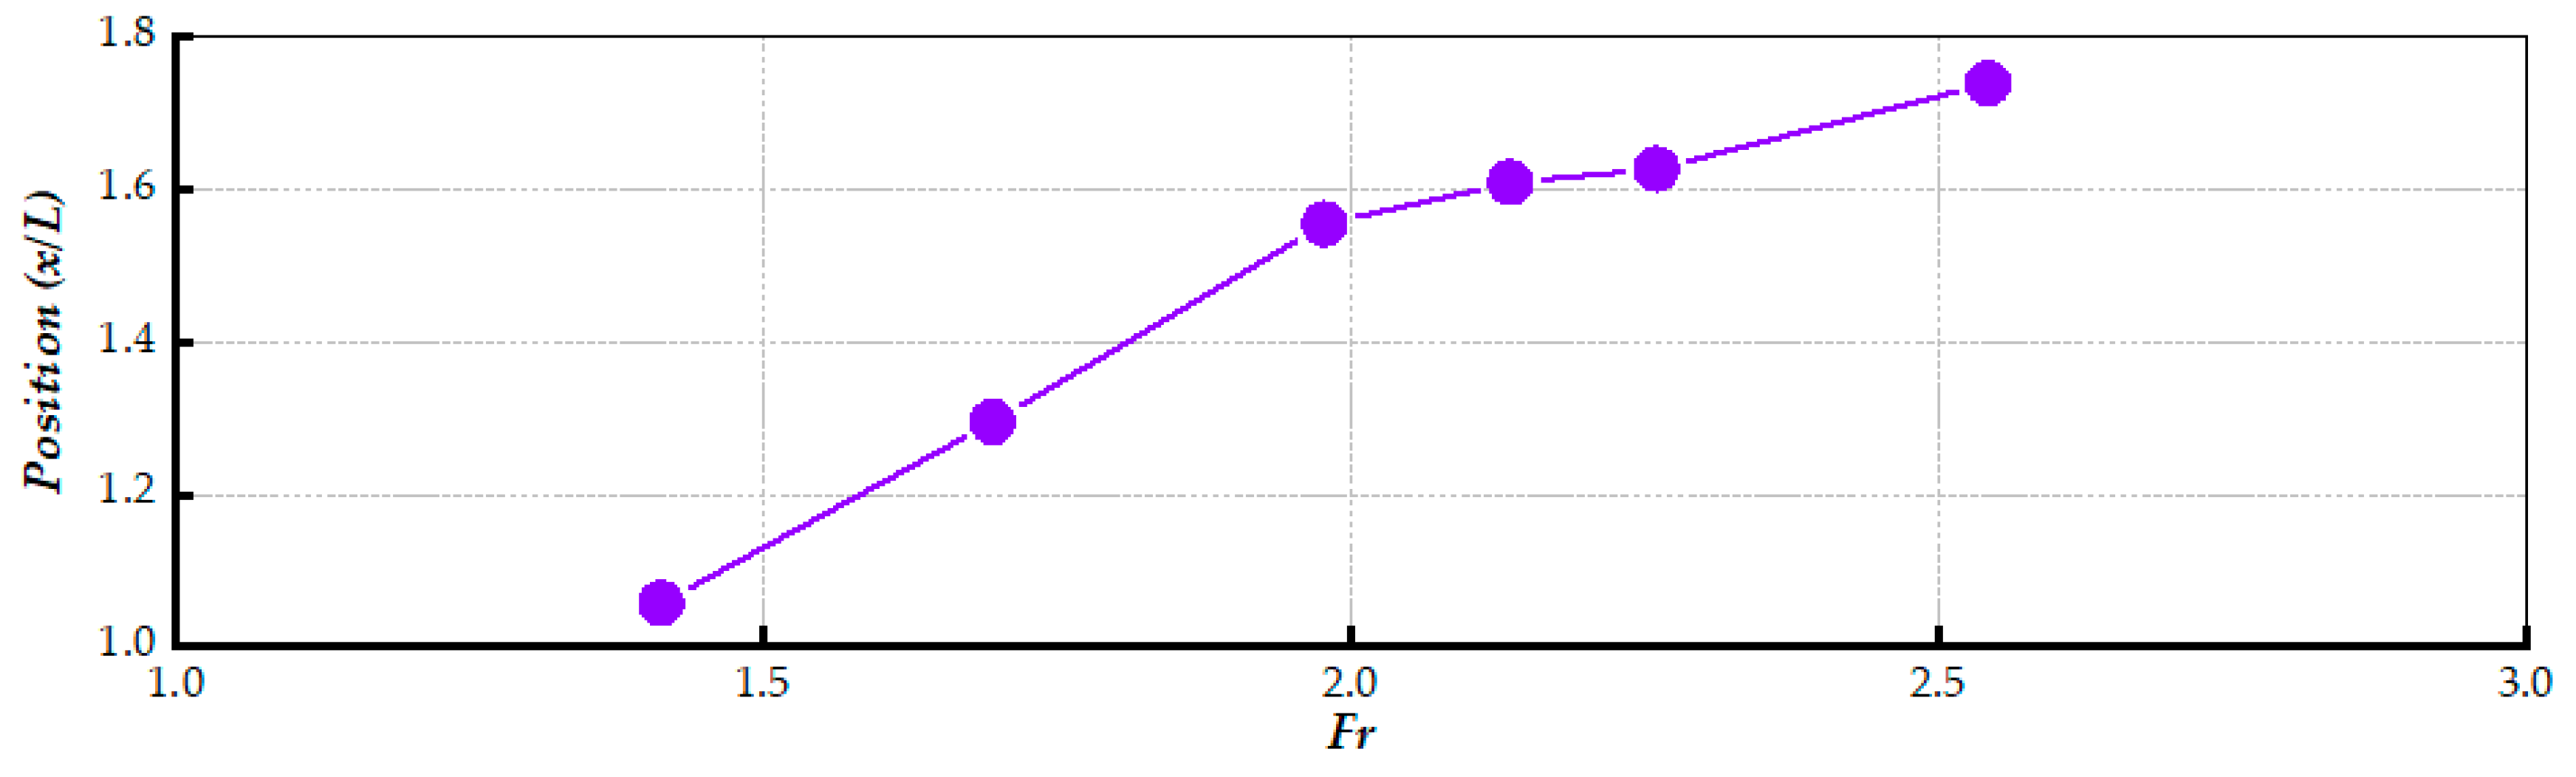
Figure 15 quantitatively depicts the longitudinal migration of the primary wave crest (rooster tail peak) as a function of the Froude number. A distinct monotonic increasing trend is observed: as the Froude number rises from
to
, the non-dimensional position of the wave crest (
) shifts significantly downstream, from approximately
to
This downstream shift is intrinsically governed by the dispersive nature of surface gravity waves. According to linear wave theory, the wavelength of the steady ship wake scales with the square of the velocity (
). Consequently, as the vessel speed increases, the generated stern wave system elongates. The fluid momentum carries the free-surface disturbance further downstream before gravity can restore it to form the first peak, resulting in the observed lag in the crest position.
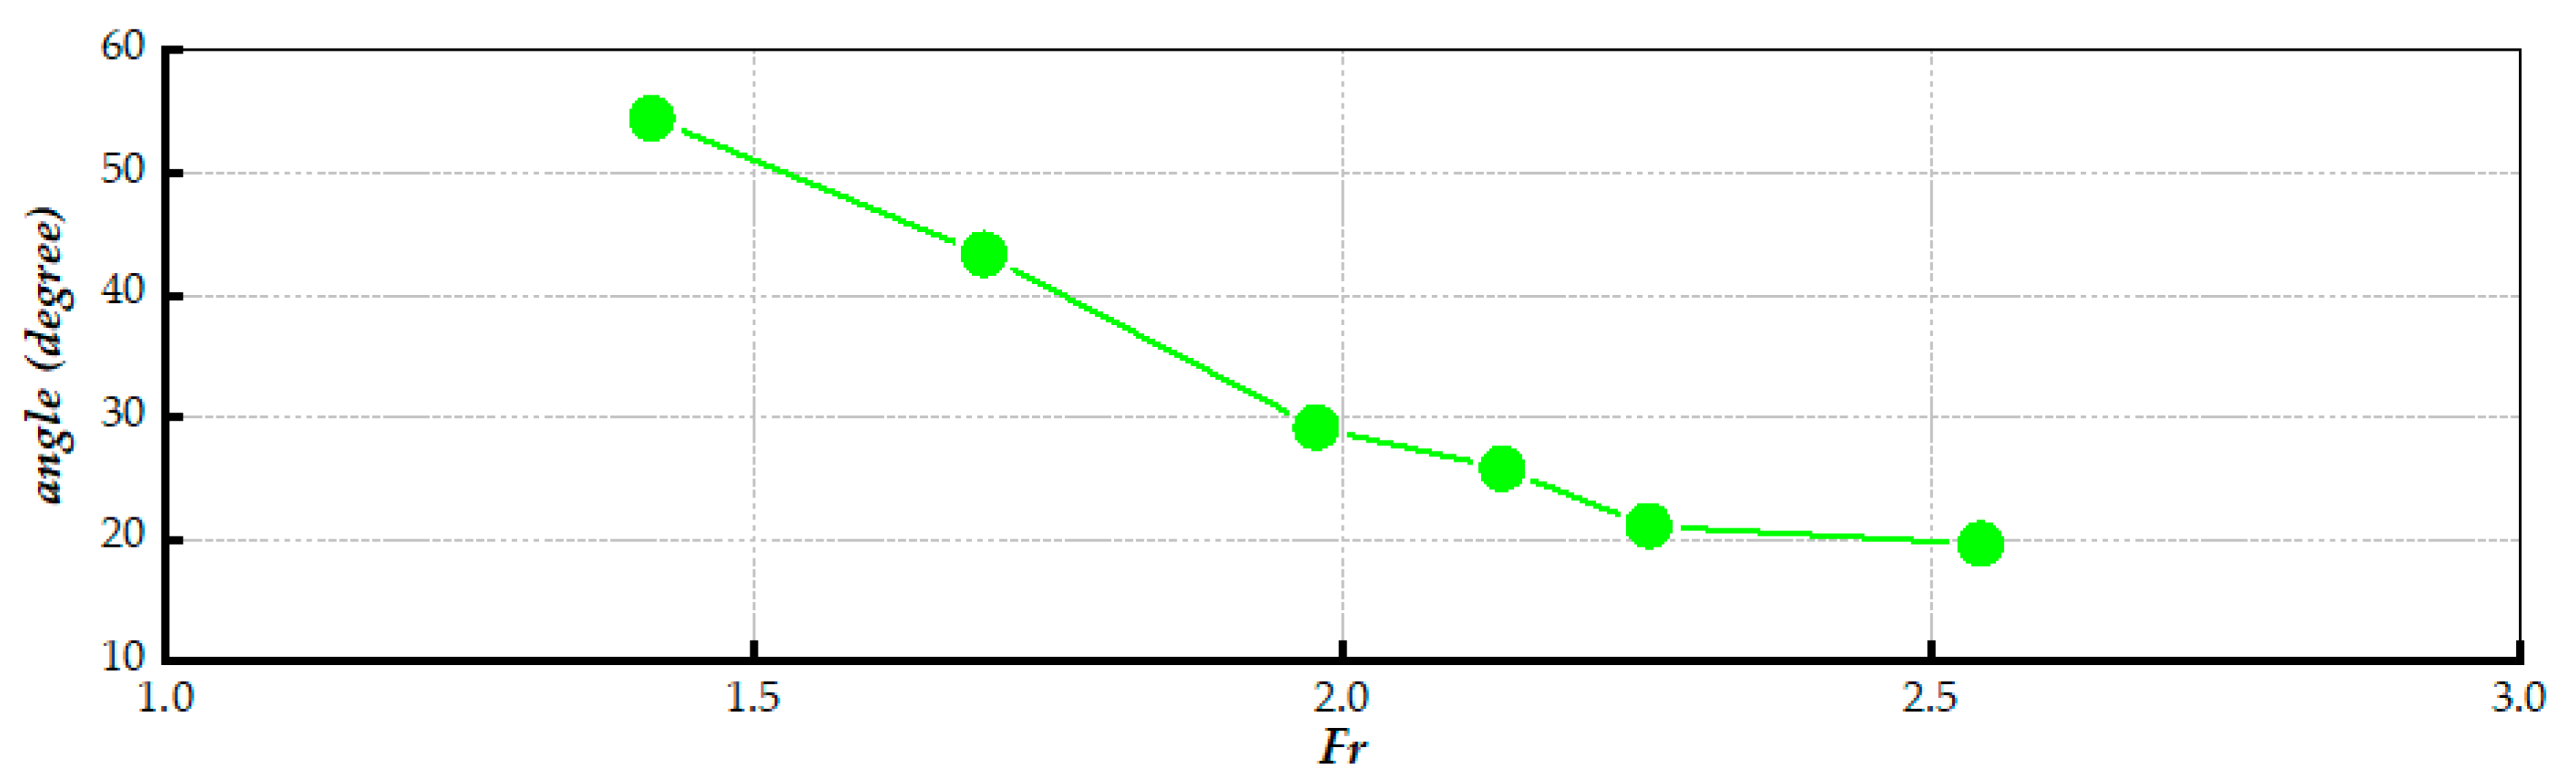
Figure 16 quantifies the relationship between the Froude number and the wake spreading angle. In the speed range (
), the angle declines sharply from approximately
to
, providing quantitative confirmation of the rapid lateral contraction of the wake envelope as velocity increases. As the flow transitions to the high-speed regime
, this narrowing trend persists, although the rate of decrease becomes more gradual. Unlike the fixed angle predicted for low-speed Kelvin wakes, the observed spreading angle continues to diminish with increasing
. This behavior is consistent with linear wave theory, which suggests that for high-speed vessels, the effective wave envelope angle asymptotically approaches zero in the limit of an infinite Froude number, reflecting the high concentration of wave energy within an increasingly narrow sector aft of the hull.
3.3. Air Entrainment
Figure 17 presents the temporal evolution of the underwater bubble distribution (
to
), clearly delineating the primary sources and transport mechanisms of air entrainment around the hull. The visualization reveals that bubble generation is predominantly localized in two distinct hydrodynamic zones: the bow region and the stern wake. At the fore of the vessel, a continuous stream of bubbles originates near the stem. This phenomenon is directly attributed to the plunging breaking of the bow wave, where the overturning wave crest impacts the undisturbed free surface. The entrapped air is fragmented into polydisperse bubbles, which are subsequently captured by the flow and advected downstream along the hull flanks, forming elongated bubble streamers that mark the ship’s track.
In contrast to the streamlined flow at the bow, the stern region exhibits a much more voluminous and turbulent bubble structure. A massive cloud of bubbles is generated immediately aft of the transom, resulting from the complex interaction between the high-speed flow separation and the violent breaking of the rooster tail. As the simulation progresses to a fully developed state (), turbulent diffusion dominates the wake dynamics. The stern bubble cloud expands significantly in both lateral and vertical directions, ultimately forming a dense, V-shaped bubbly wake. This wake structure persists far downstream, merging with the advected bow streamers to constitute the comprehensive underwater acoustic and hydrodynamic footprint of the vessel.
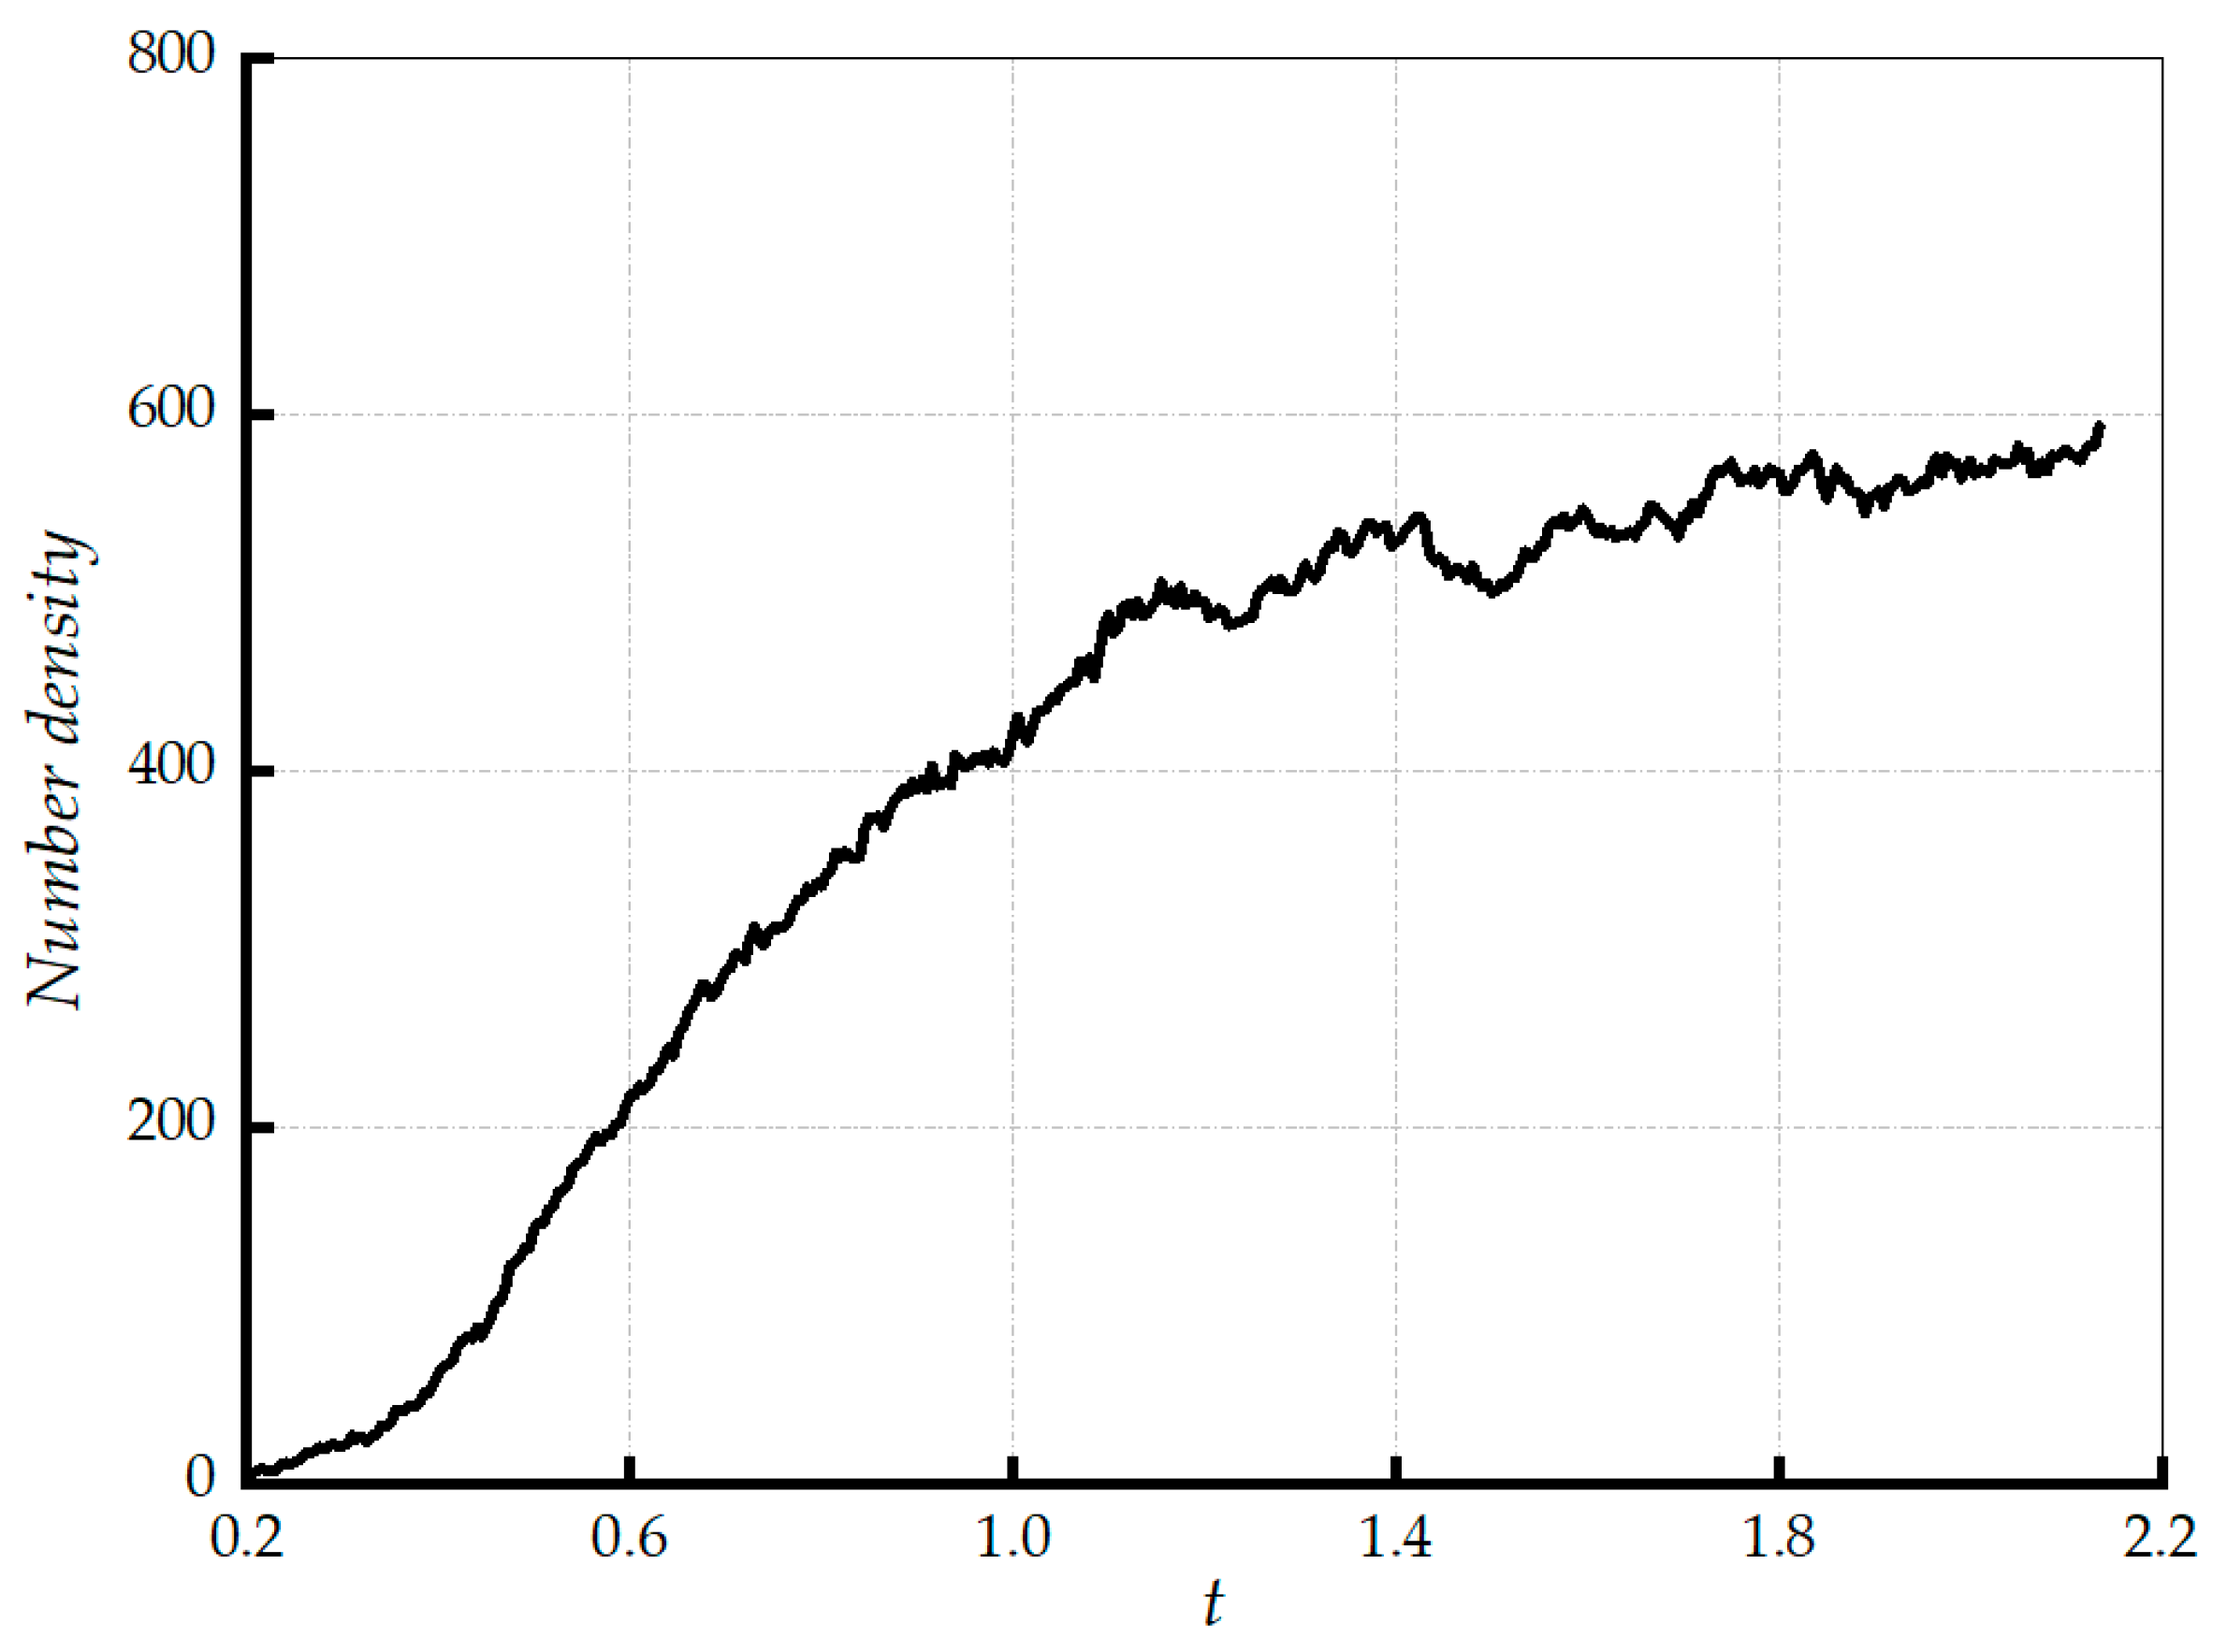
Figure 18 plots the time history of the total underwater bubble number density. The underwater bubble number density is defined as the total number of discrete air bubbles identified by the interface-capturing method divided by the total volume of the computational domain. This density provides a macroscopic measure of the bubble population within the vessel’s wake region. The evolution is characterized by an initial phase of rapid accumulation (
) driven by the onset of wave breaking and air entrainment. Following this, the growth rate decays, and the curve reaches a stable plateau, oscillating around a constant mean value. This asymptotic behavior indicates that a dynamic equilibrium between bubble generation and dissipation has been established.
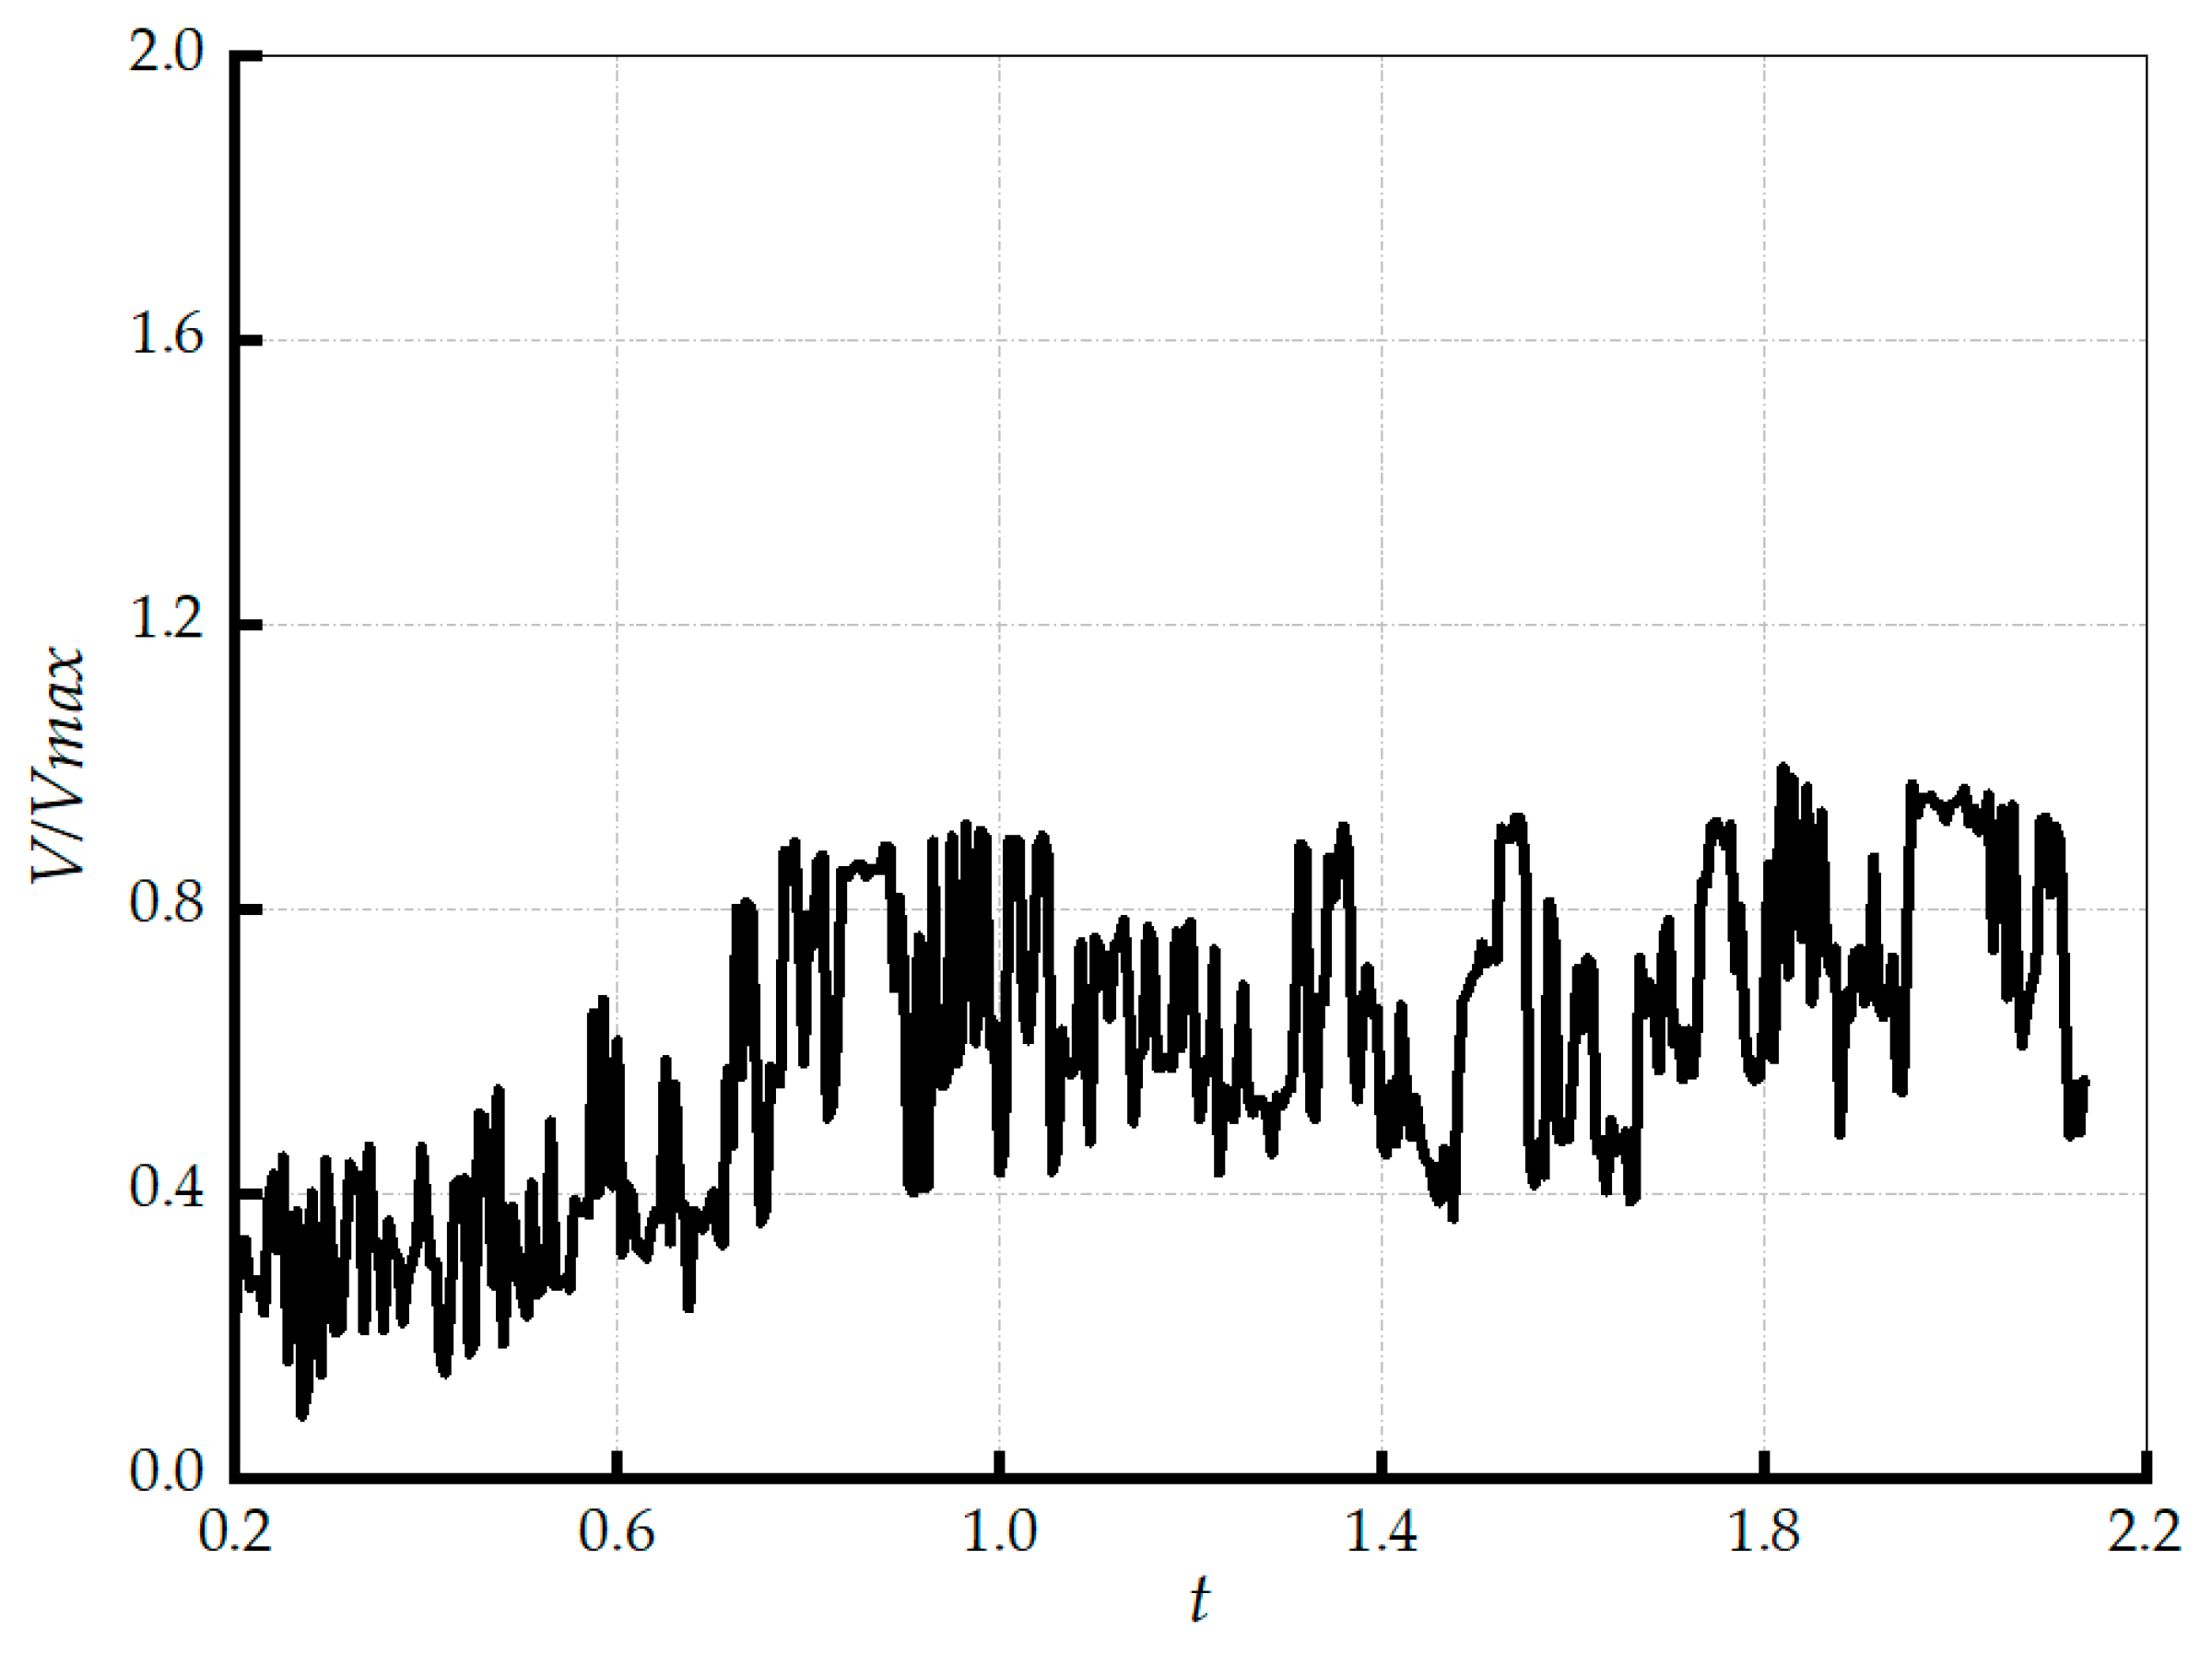
Figure 19 presents the temporal evolution of the normalized total entrained air volume. In contrast to the stable convergence of the bubble number density, the volume history exhibits pronounced high-frequency oscillations throughout the simulation. These fluctuations are physically attributed to the highly unsteady dynamics of large-scale air cavities; the continuous cycle of large void formation, rapid fragmentation into smaller bubbles, and sudden degassing at the free surface causes significant instantaneous variations in the total integral volume, preventing the curve from settling into a smooth steady state.
3.4. Turbulent Vortex Structures
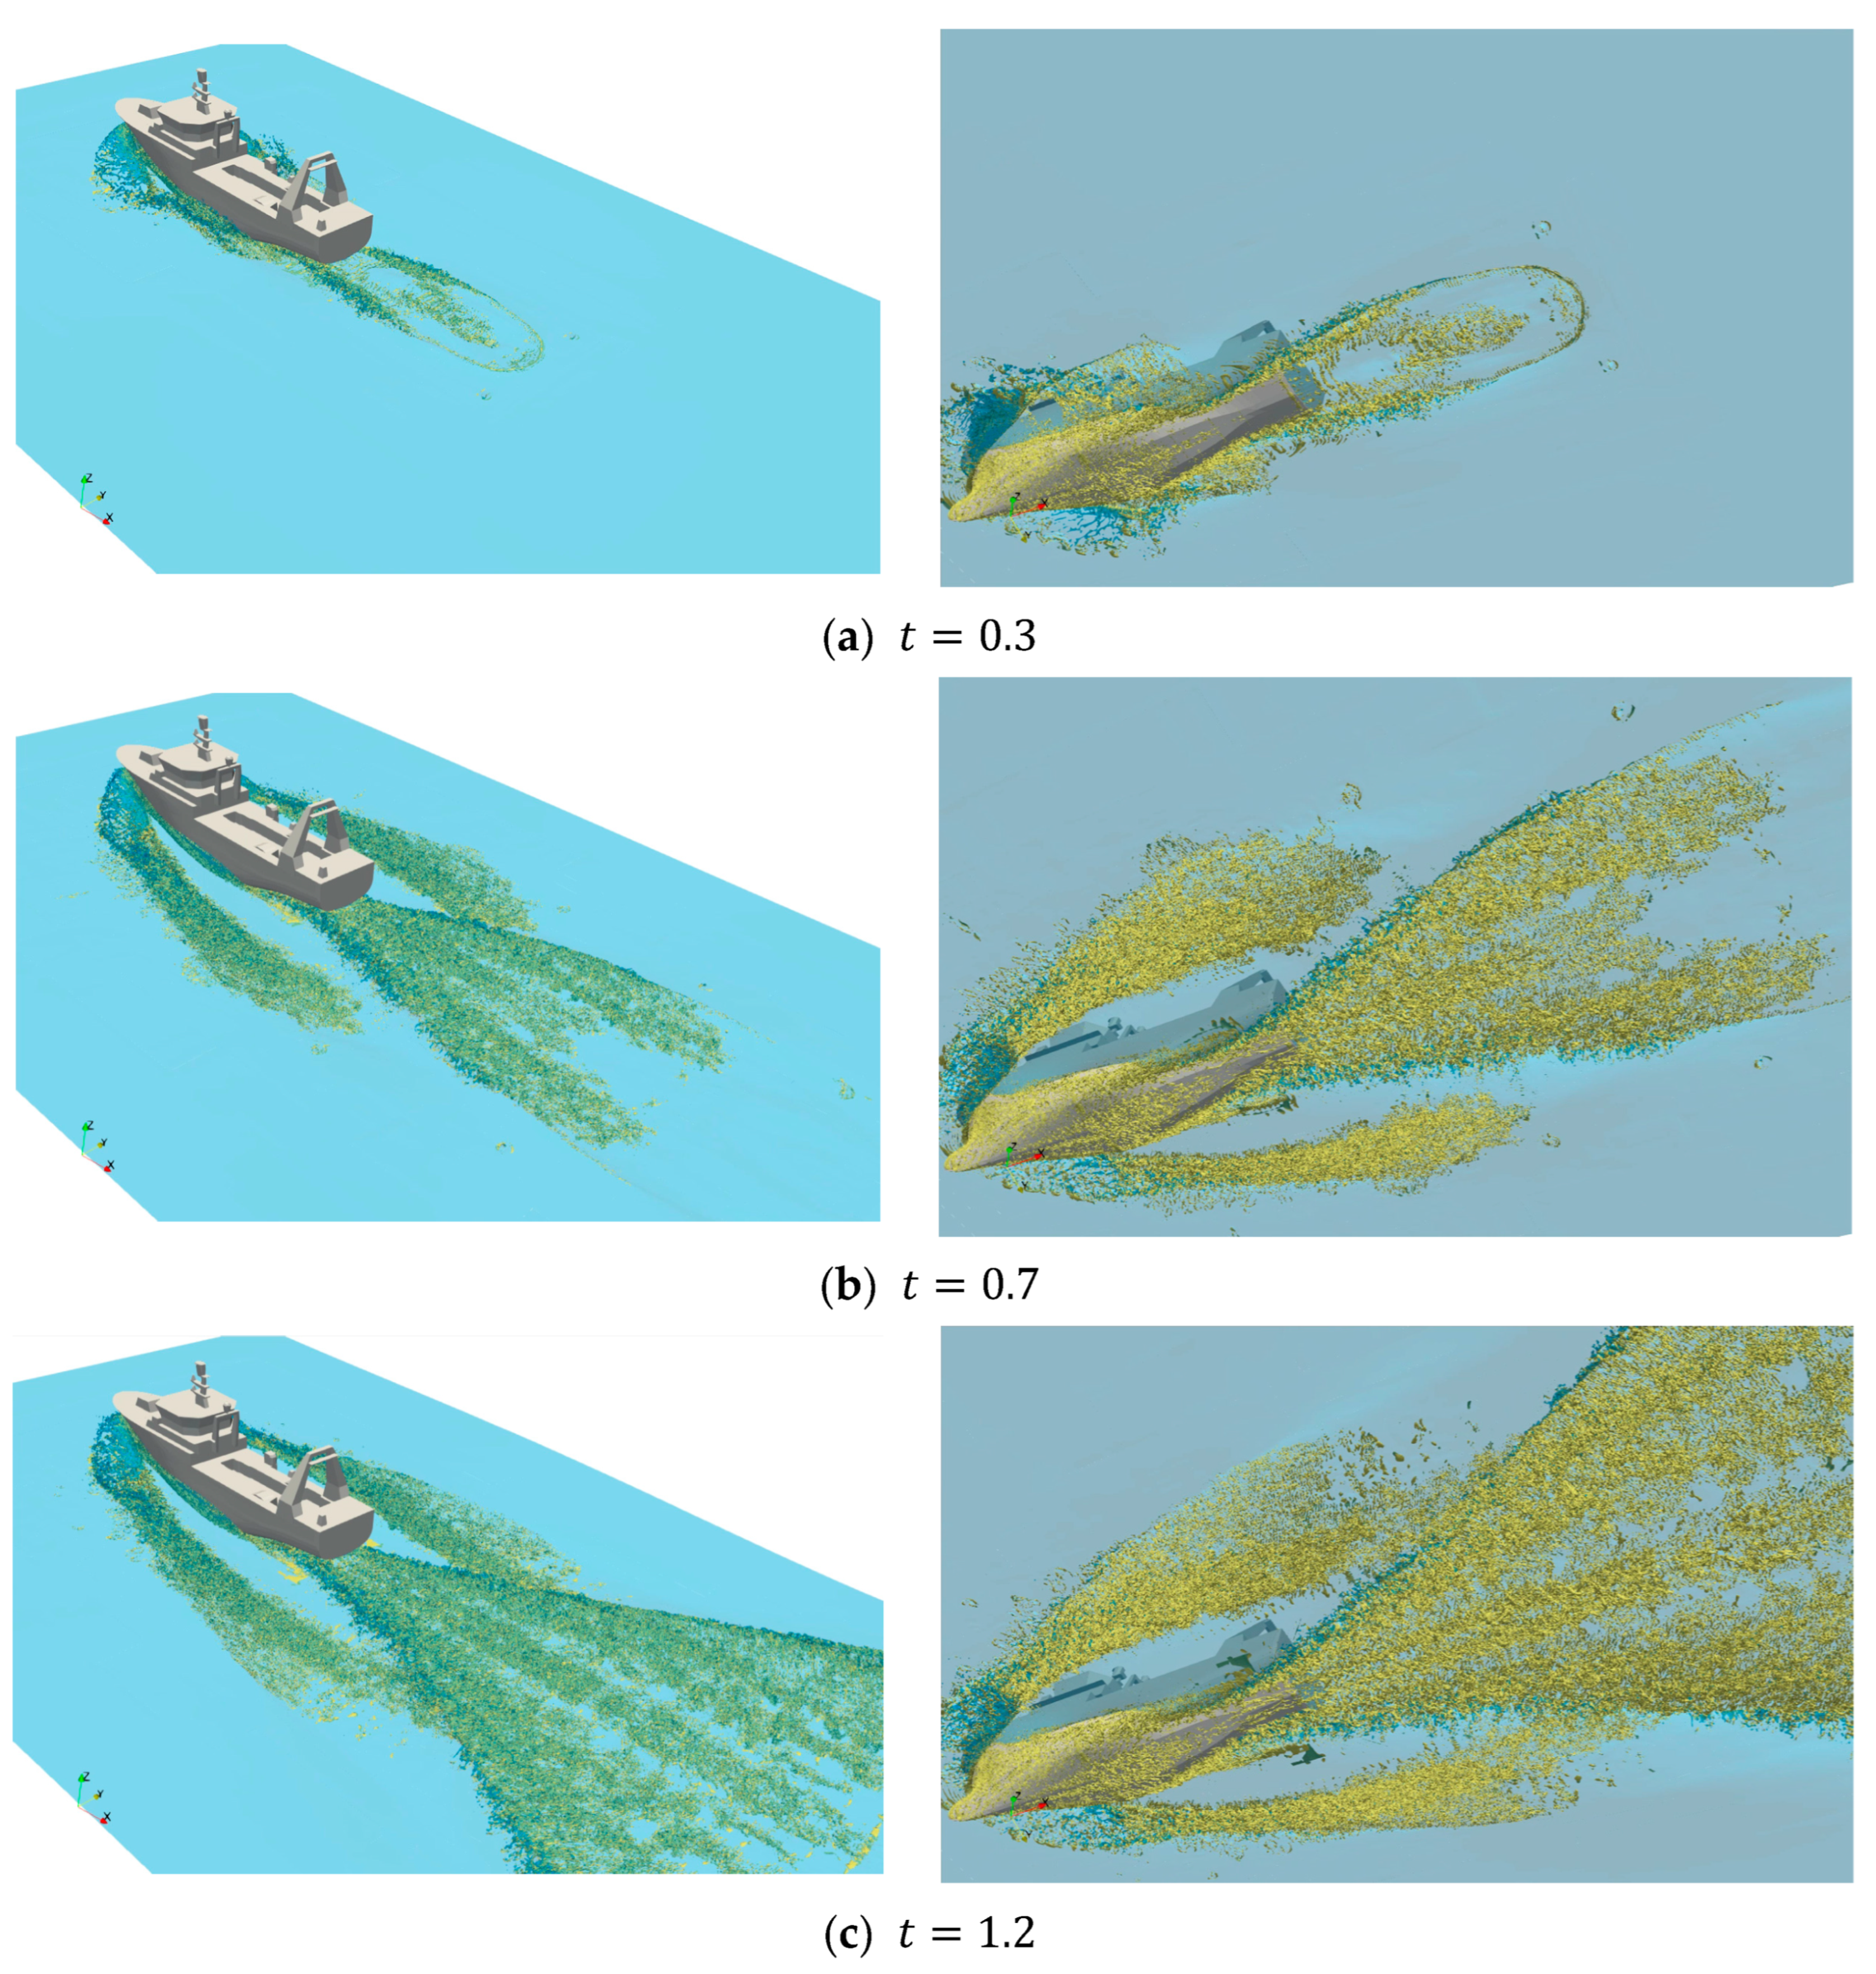
Figure 20 illustrates the spatiotemporal evolution of coherent turbulent structures around the hull, identified using the Q-criterion isosurfaces (shown in yellow). This visualization provides a fundamental hydrodynamic explanation for the interface breaking and air entrainment phenomena observed in the previous sections. The distribution of these vortex structures exhibits a strong spatial correlation with the regions of intense free-surface deformation, confirming that the generation of underwater bubble flows is intrinsically driven by high-vorticity dynamics. At the bow region, a cluster of intense vortex structures is generated immediately upon the ship’s impact with the water. As the bow creates a plunging breaker, the overturning free surface generates strong shear layers that roll up to form primary spanwise vortices. These structures subsequently break down into complex three-dimensional streamwise vortices due to instability and are advected downstream along the hull flanks. This mechanism directly accounts for the continuous “bubble streamers” observed in
Figure 17, as the persistence of these high-vorticity structures maintains the air entrainment process along the ship’s sides.
In the stern region, the visualization reveals a more voluminous and chaotic accumulation of vortex structures, which serves as the primary engine for the massive wake air entrainment. The sharp edge of the transom stern induces a massive flow separation, resulting in the shedding of shear layers that rapidly evolve into large-scale turbulent eddies. Simultaneously, the breaking of the rooster tail wave injects high turbulent kinetic energy into the flow. The yellow isosurfaces in
Figure 20c clearly depict this complex interaction, where the wake is dominated by hairpin-like vortices and turbulent coherent structures. The spilling breakers occurring along the diverging wave fronts are primarily responsible for the physical disintegration of the free surface. These breaking processes introduce intense vorticity and turbulence into the flow, where the resulting hydrodynamic forces overcome surface tension, leading to the entrapment and entrainment of large volumes of air into the wake. The temporal sequence from
to
highlights the downstream convection and lateral expansion of these structures, eventually establishing a fully developed, V-shaped turbulent wake that sustains the dispersion of microbubbles far behind the vessel.
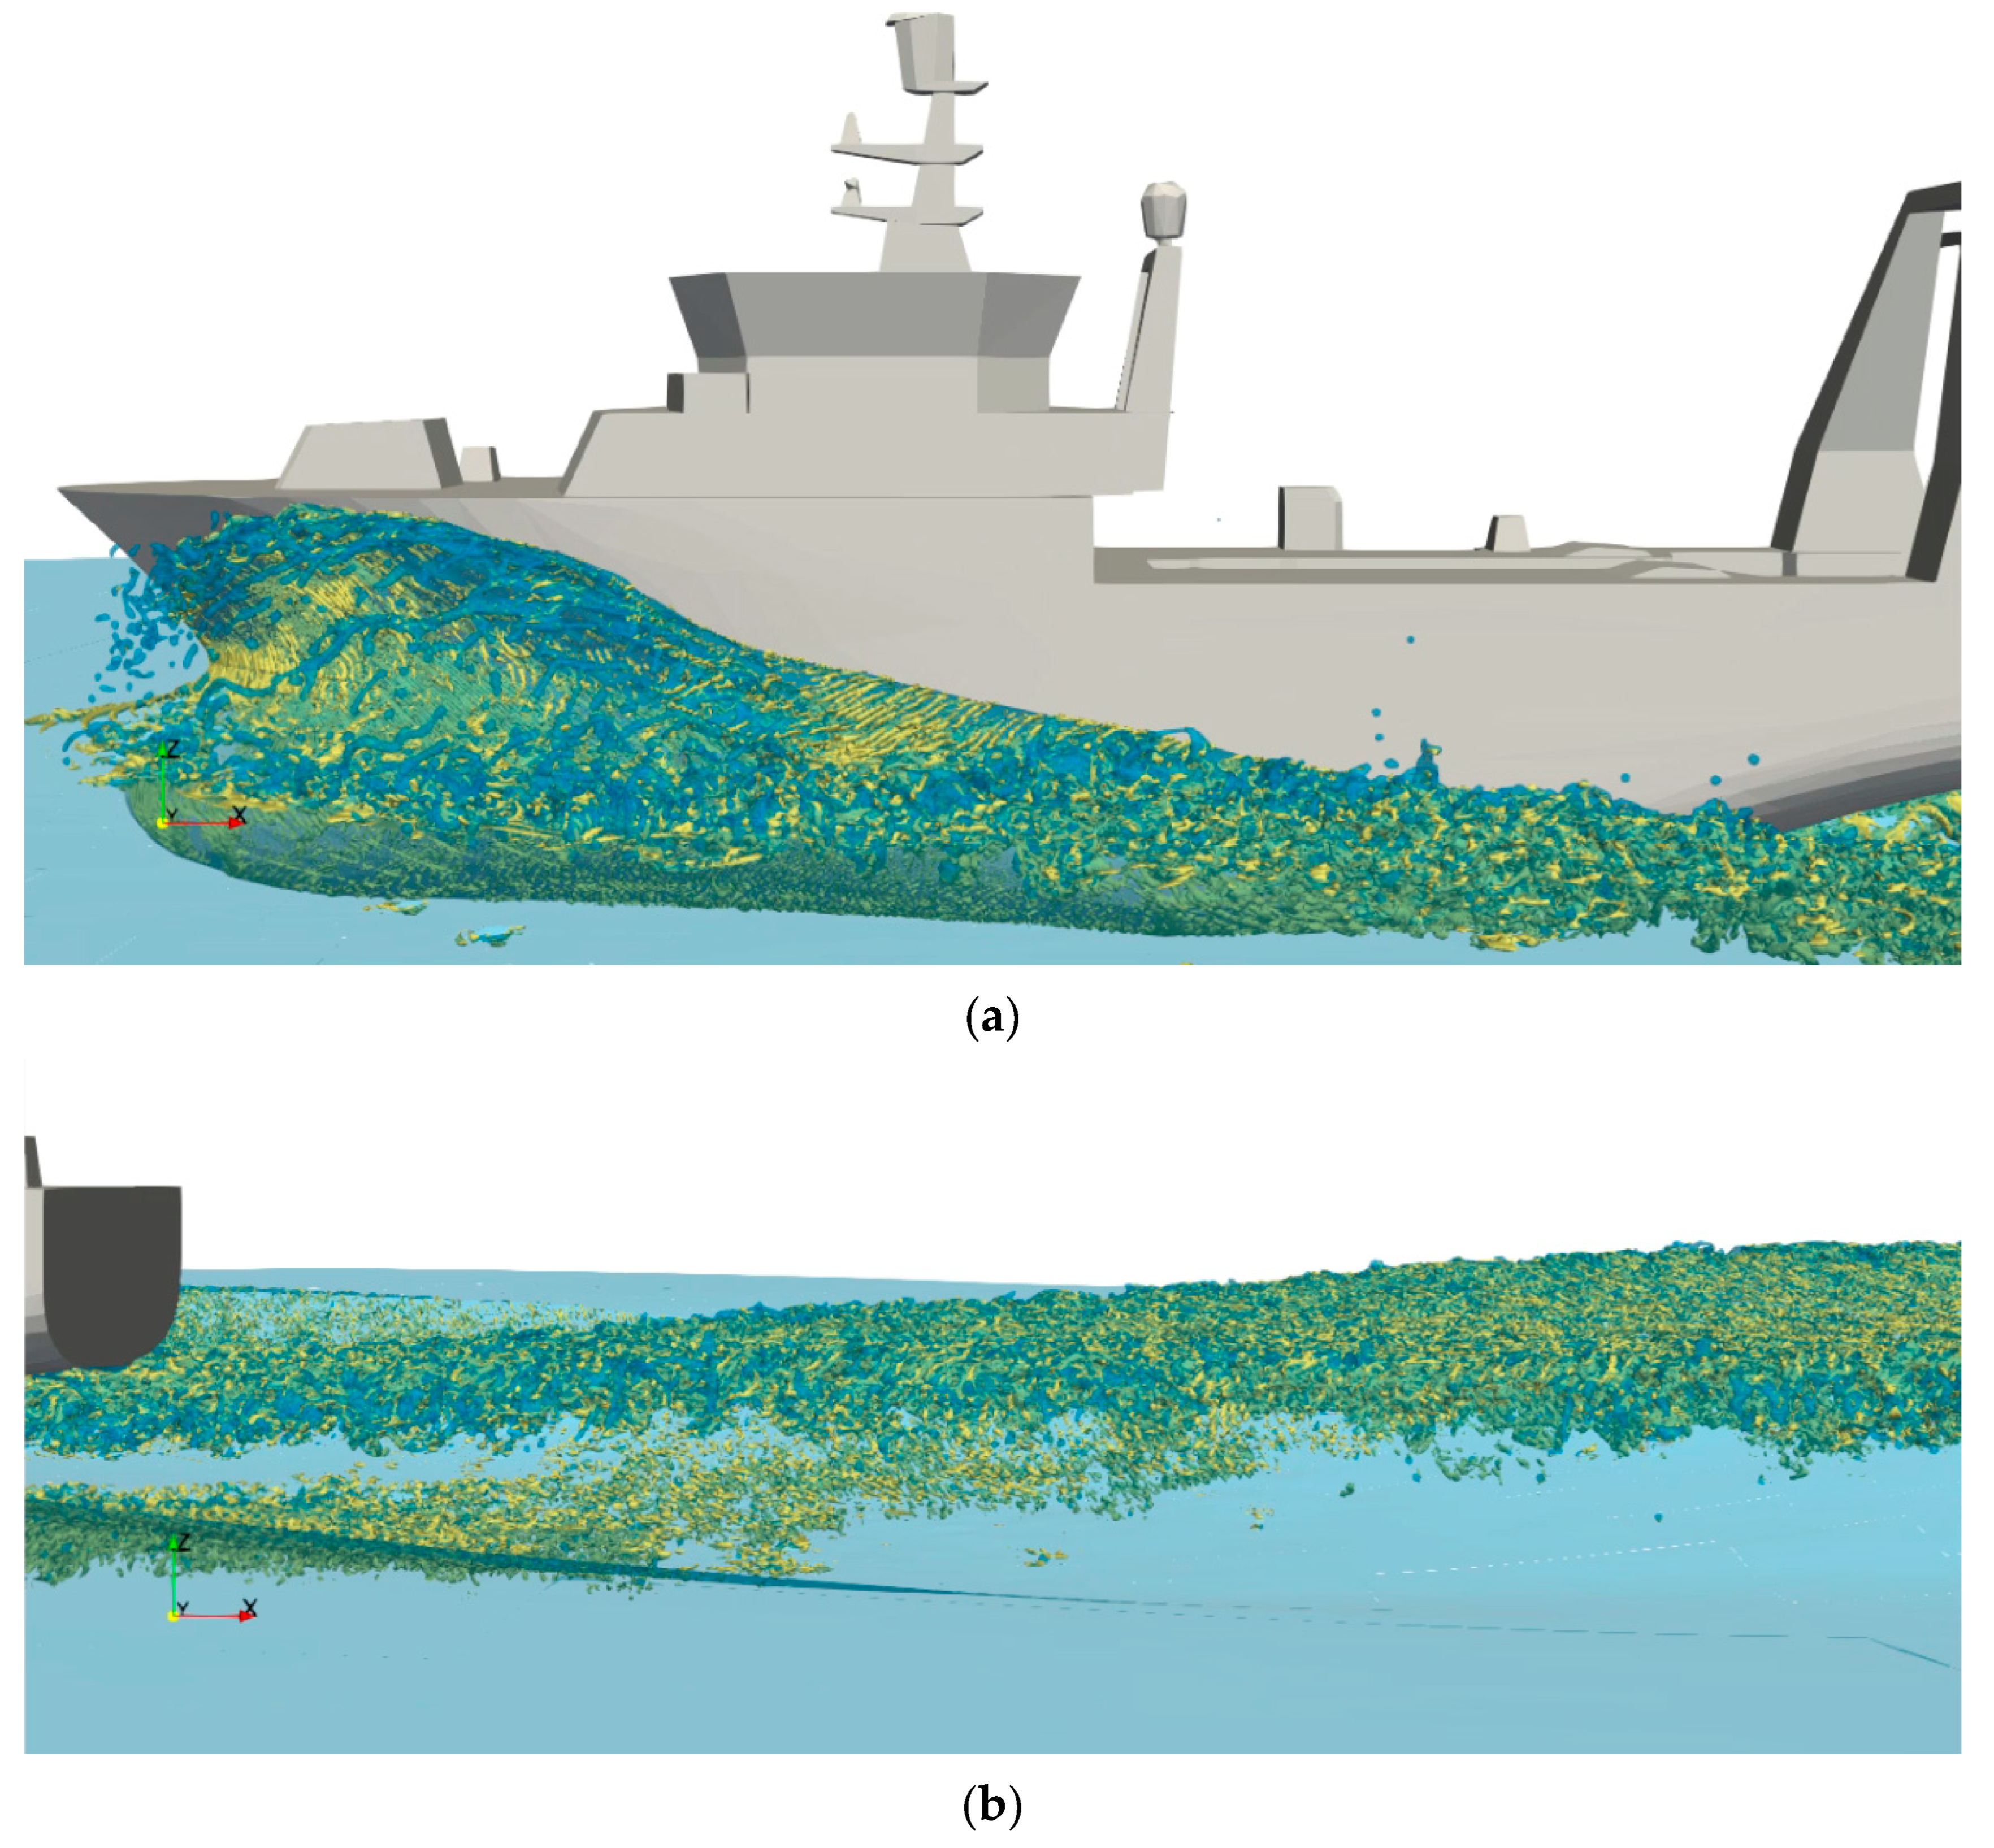
Figure 21 provides a magnified view of the coherent vortex structures critical to air entrainment. In the bow region (
Figure 21a), the plunging breaking of the bow wave generates a high-density cluster of turbulent structures. These vortices do not dissipate immediately but adhere to the hull surface and are advected downstream, forming the hydrodynamic basis for the bubble streamers. In the stern region (
Figure 21b), the flow is dominated by massive separation from the sharp transom edge. This creates a thick, chaotic shear layer composed of dense, small-scale eddies. These structures constitute the turbulent core of the wake, driving the violent interface fragmentation and sustaining the volumetric air entrainment aft of the vessel.