1. Introduction
Shipping and maritime operations account for 2.89% of Greenhouse Gas (GHG) emissions and are linked to 250,000 premature deaths worldwide [
1,
2]. Cruise ships, in particular, combine high propulsion and hotel loads with concentrated local emissions along busy and populated routes. From 2019 to 2022, the >5000-Gross Tonnage (GT) cruise ship fleet operating in Europe grew from 173 to 218; and even with broader liquefied natural gas (LNG) adoption, carbon dioxide (CO
2) and nitrogen oxides (NO
x) emissions increased by ~17% and ~8%, respectively, while methane emissions increased by ~500%. Only sulfur oxides (SO
x) decreased by 62% [
2]. Port cities, such as Rotterdam and Barcelona, already experience some of Europe’s highest cruise-related SO
x concentrations [
2], underscoring the urgent need for zero-emission propulsion alternatives.
Various low- and zero-emission fuels have been considered for cruise ships, including battery-electric systems and alternative fuels. Battery-electric propulsion has achieved success in ferries and small passenger vessels; however, the low energy density of these systems imposes severe payload penalties and multi-hour recharge intervals [
3].
Other alternative fuels can improve energy density while reducing GHG emissions, though each comes with its own tradeoffs. LNG, for instance, approaches the energy density of marine gas oil and enables dual-fuel operation that eliminates SO
x and reduces particulate matter (PM) and NO
x emissions, but methane slip remains a critical issue for spark-ignition engines, and the −162 °C cryogenic storage complicates bunkering and handling [
4]. Methanol is an ambient-temperature liquid compatible with internal combustion engines (ICE) or Direct Methanol Fuel Cells; however, fossil-based methanol yields limited CO
2 reduction, and e-methanol introduces toxic bunkering requirements [
5,
6]. Ammonia is carbon-free at the point of use and can reduce ship CO
2 emissions while offering dual fuel capabilities, such as retrofitted ICEs [
7] or proton exchange membrane fuel cells (PEMFCs) with an ammonia cracker. However, its toxicity presents serious safety constraints [
8,
9,
10]. Sustainable biofuels (e.g., bio-LNG) can reduce life-cycle GHG emissions by ~50–80% and can be used in existing ICE, though supply-chain limitations remain significant (currently covering only ~0.6% of shipping fuel demand) [
11]. Nuclear small modular reactors (SMRs) offer zero stack emissions and months-long endurance, as demonstrated in submarines and icebreakers, but unresolved nuclear waste disposal, high capital expenditure (CAPEX), and strong public/political opposition hinder their adoption [
12].
Hydrogen has emerged as a promising zero-carbon marine fuel due to its high gravimetric energy density and clean conversion pathways [
13]. It can be used in fuel cells (producing only electricity and water) or in combustion engines and boilers [
14,
15]. When used in fuel cells, hydrogen enables fully zero-emission operation. However, the main challenge remains in hydrogen storage, limiting vessel range in retrofits or requiring new ship construction [
16]. Electrode and electrolyte degradation and mechanical damage to the membrane electrode assembly are also important challenges, reducing efficiency and lifetime while increasing costs [
17]. Storage options include 350–700 bar compressed gas, −253 °C liquid hydrogen (LH
2), cryo-compressed systems, and chemical/physical carriers (e.g., borohydrides, metal hydrides). Each solution presents trade-offs between volumetric density, energy requirements, safety, and system complexity [
18]. For example, although LH
2 is considered a highly suitable storage technology for the maritime sector, boil-off losses of up to ~20% can occur during each LH
2 refueling operation [
19], which results in economic losses and leads to indirect radiative forcing that affects the climate [
20]. Strategies to mitigate these issues include high-efficiency engines, optimized operations, capture/use of boil-off (instead of venting), and shore-to-ship power; LH
2 systems should also use double-walled vacuum-insulated tanks with active boil-off control and well-placed H
2 sensors near vent leak points [
21,
22].
Multiple studies have demonstrated the technical feasibility of PEMFC-based powertrains, including for large cruise ships [
13,
16,
23]. System efficiency can be boosted through system hybridization using low-temperature PEMFC or higher-temperature solid oxide fuel cells (SOFCs) [
24,
25]. Additionally, high-temperature fuel cells can be used as the topping cycle in two- or three-stage combined cycle systems, raising overall efficiency [
26]. Previous studies have explored specific powertrain architectures, such as ammonia-SOFC systems, which face modest cargo loss penalties (~2.9%) [
27]. Fifty hydrogen-powered vessels have been developed and demonstrated over the past 20 years around the world, ranging from ferries to research ships [
28]. Demonstrations include a 360 kW PEMFC ferry with 100 kWh battery and ~250 kg H
2 capacity, achieving 300 NM of range, enough for 2 days of operation [
29]; a tourist boat powered by a 50 kW PEMFC and a 47 kWh battery in Korea [
30]; and a 500 kW PEMFC passenger vessel in China [
31]. Notably, the AIDAnova pilot cruise project employed methanol-reforming fuel cells (~500 kW; >35,000 h module lifetime) [
32], while hybrid concepts such as that used on Allure of the Seas achieved 17.5% primary energy savings by integrating steam cycles, absorption chillers, organic Rankine cycles, and LNG/bio-LNG fuel cells, meeting the EU-2035 savings target of 14.5% [
33]. Alternative maritime powertrains still lack long-term real-world validation and face several barriers versus conventional systems, including higher costs, limited operational track records, limited feasibility analysis, policy uncertainty, space penalties, and a lack of mature standards [
34].
Beyond onboard zero-emission propulsion systems, shore-to-ship power (also referred to as “cold ironing”) offers a proven method for eliminating emissions during port stays. By connecting to shore-side electricity, vessels can shut down onboard generators, achieving local CO
2, NO
x, SO
x and PM emissions reductions of up to 98% during berthing [
35]. Large-scale adoption across major ports could yield annual economic benefits in the tens to hundreds of millions of USD and significant operator cost savings [
36]. Consequently, integrating shore power capability is a low-cost key enabler for zero-emission operations, especially if environmental regulations target localized pollutants such as PM, NO
x, or Black Carbon [
37].
While alternative powertrains for maritime applications have been widely studied, there are no dynamic simulations of 100% LH2-based power generation systems for large-scale cruise ships operating over long routes.
The present work addresses these presented gaps by dynamically simulating an LH2-based tri-generation power system for a full-scale cruise ship along a representative route. The main contribution lies in the system-level integration of PEM fuel cell power generation with controlled catalytic combustion of residual hydrogen, multi-stage waste heat recovery, and LH2 cold energy recovery, enabling coordinated management of electrical, thermal, and cooling generation and demand under dynamic operating conditions.
In addition, this study presents, to the authors’ knowledge, the first route-based dynamic simulation of such an integrated LH2 tri-generation system applied to a large-scale cruise ship, quantifying hydrogen consumption, storage requirements, operational range, and system efficiency under seasonal conditions.
2. Methodology and Modeling
2.1. Reference Ship
The reference ship for the current study is Royal Caribbean’s
Oasis of the Seas, a large cruise ship representative of current ultra-large passenger ship designs and power demands [
38,
39]. The characteristics of this ship are presented in
Table 1.
The ship is propelled using three azipod-type electrical power-producing engines. The electrical power used for the ship propulsion and the electrical hotel demands is generated using six Wärtsila Corp. (Helsinki, Finland) 46F-series diesel generator engines: three Wärtsilä 16V46 engines and three Wärtsilä 12V46 engines [
40], as presented in
Table 2The ship has six Aalborg EX heaters [
41], marine economizers that recover waste heat from the engine’s exhaust. Additionally, it has two auxiliary oil-fired heaters (Aalborg OM-TCi [
42]) that provide additional heat.
Table 3 summarizes the estimated rated power of each component, along with the specific volumetric power density values derived from technical datasheets of representative marine systems and the corresponding estimated component volumes.
2.2. Systems Overview
An integrated, time-resolved model of a zero-emission power and energy system is developed for Royal Caribbean’s
Oasis of the Seas and applied to evaluate performance for operating a representative 7-day Mediterranean itinerary. The proposed ship powerplant is a hydrogen PEMFC tri-generation system that produces electricity, heating and cooling for
Oasis of the Seas, as presented schematically in
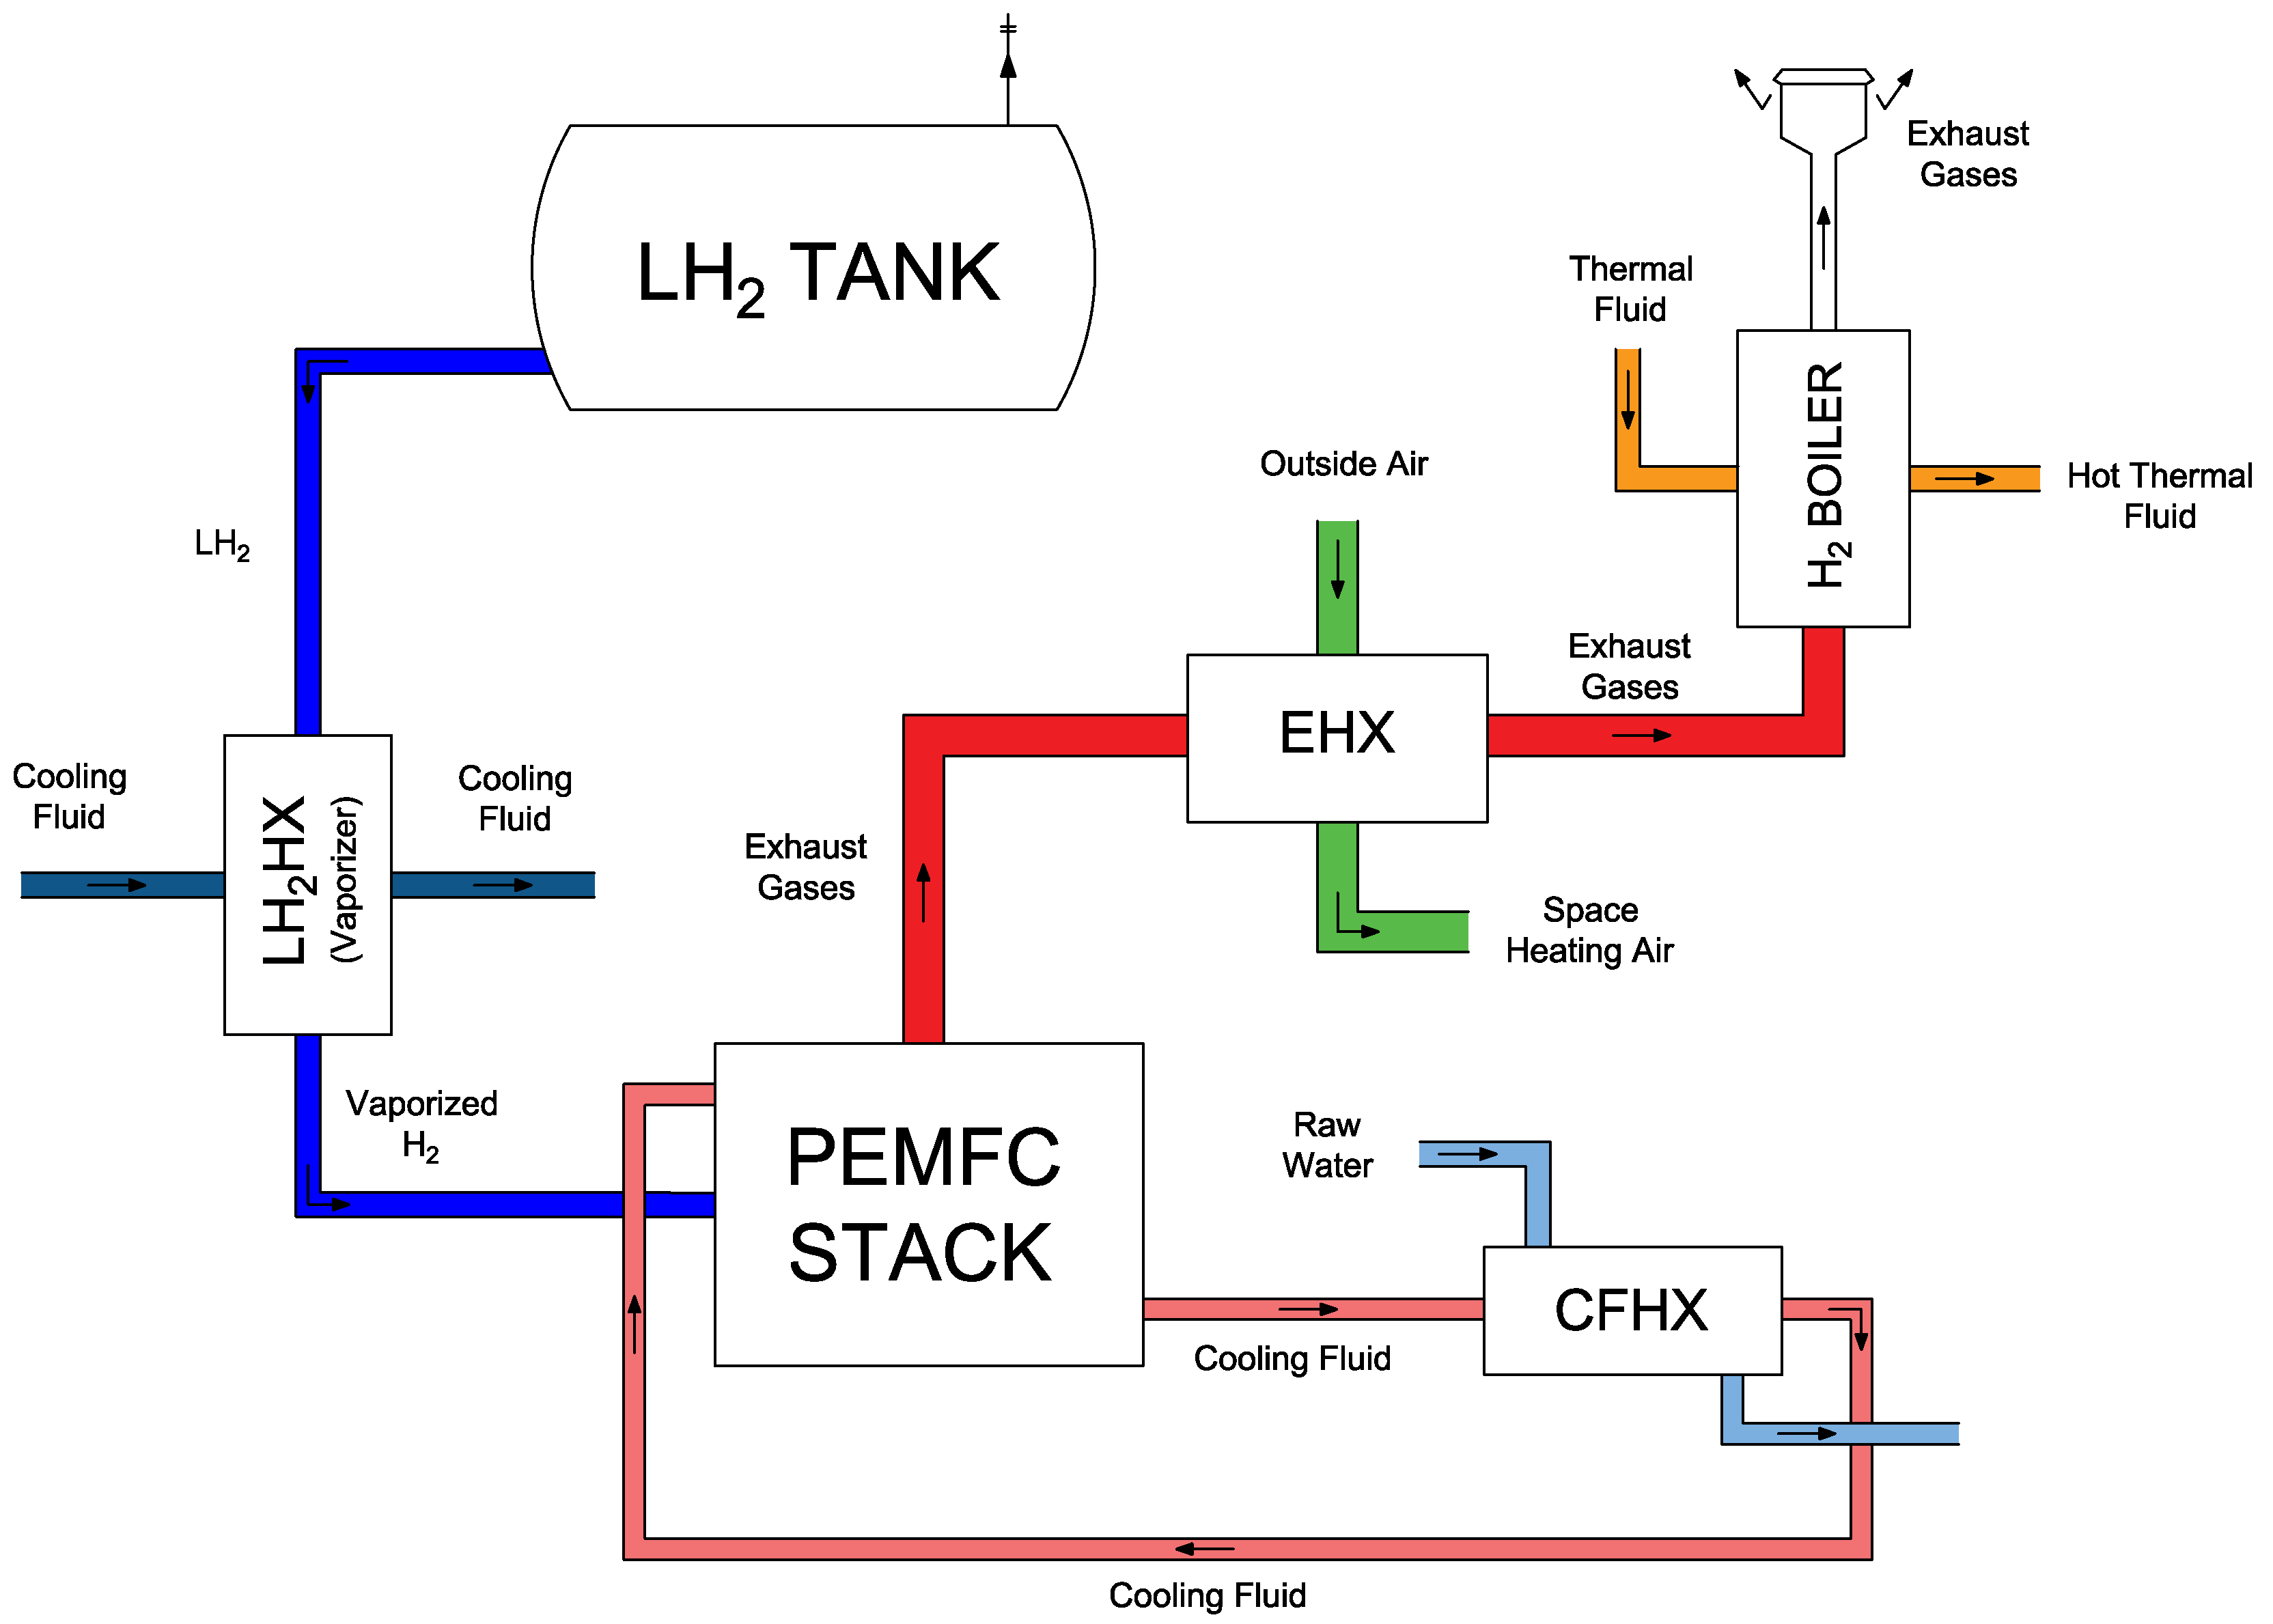
Figure 1. PEMFC stacks feed a low-voltage DC bus that supplies propulsion and hotel electrical loads, with a battery pack for smoothing fast transients. Hydrogen is stored on board as cryogenic liquid and vaporized and warmed to near ambient temperatures for use in the fuel cell. Three heat exchangers are used to generate useful thermal products—space heating and 55 °C domestic hot water (DHW) are produced by recovering heat from the fuel cell exhaust (EHX) and coolant loop (CFHX), and space cooling is produced by dumping heat from a coolant to the liquid hydrogen used as fuel. A catalytic hydrogen boiler (4 MW, η ≈ 0.95) burns residual H
2 from fuel cell operation to provide additional heat when needed. A 45 GJ thermal energy storage unit with paraffin wax buffers between heat production and demand. Overall operation is coordinated by controllers that regulate propulsion power and hydrogen utilization, while the battery stabilizes a 100 VDC bus.
2.3. Modeling Framework
A modular dynamic simulation model was developed to evaluate the performance of the proposed tri-generation system under realistic operating conditions. The framework was implemented in MATLAB R2025a/Simulink using a combination of custom component models and physical modeling libraries. The model structure is organized into four modules:
Demand Module: Reads propulsion and hotel load time series derived from the operational profile.
Generation and Storage Module: Simulates the performance of the PEM fuel cell stacks, battery, and power electronics.
Thermal Management Module: Models heat recovery, thermal storage, and the hydrogen burner.
Control Module: Implements supervisory control to coordinate power and heat flows.
The simulation advances step-by-step through a representative one-week voyage, using the variable time step ODE45 solver to capture transient behavior without unnecessary computational burden. At each step, propulsion demand and hotel loads are imposed, and the controller allocates generation and storage resources to meet them. Outputs include instantaneous electrical power, heat recovered, hydrogen consumed, and the state of charge of both electrical and thermal storage systems.
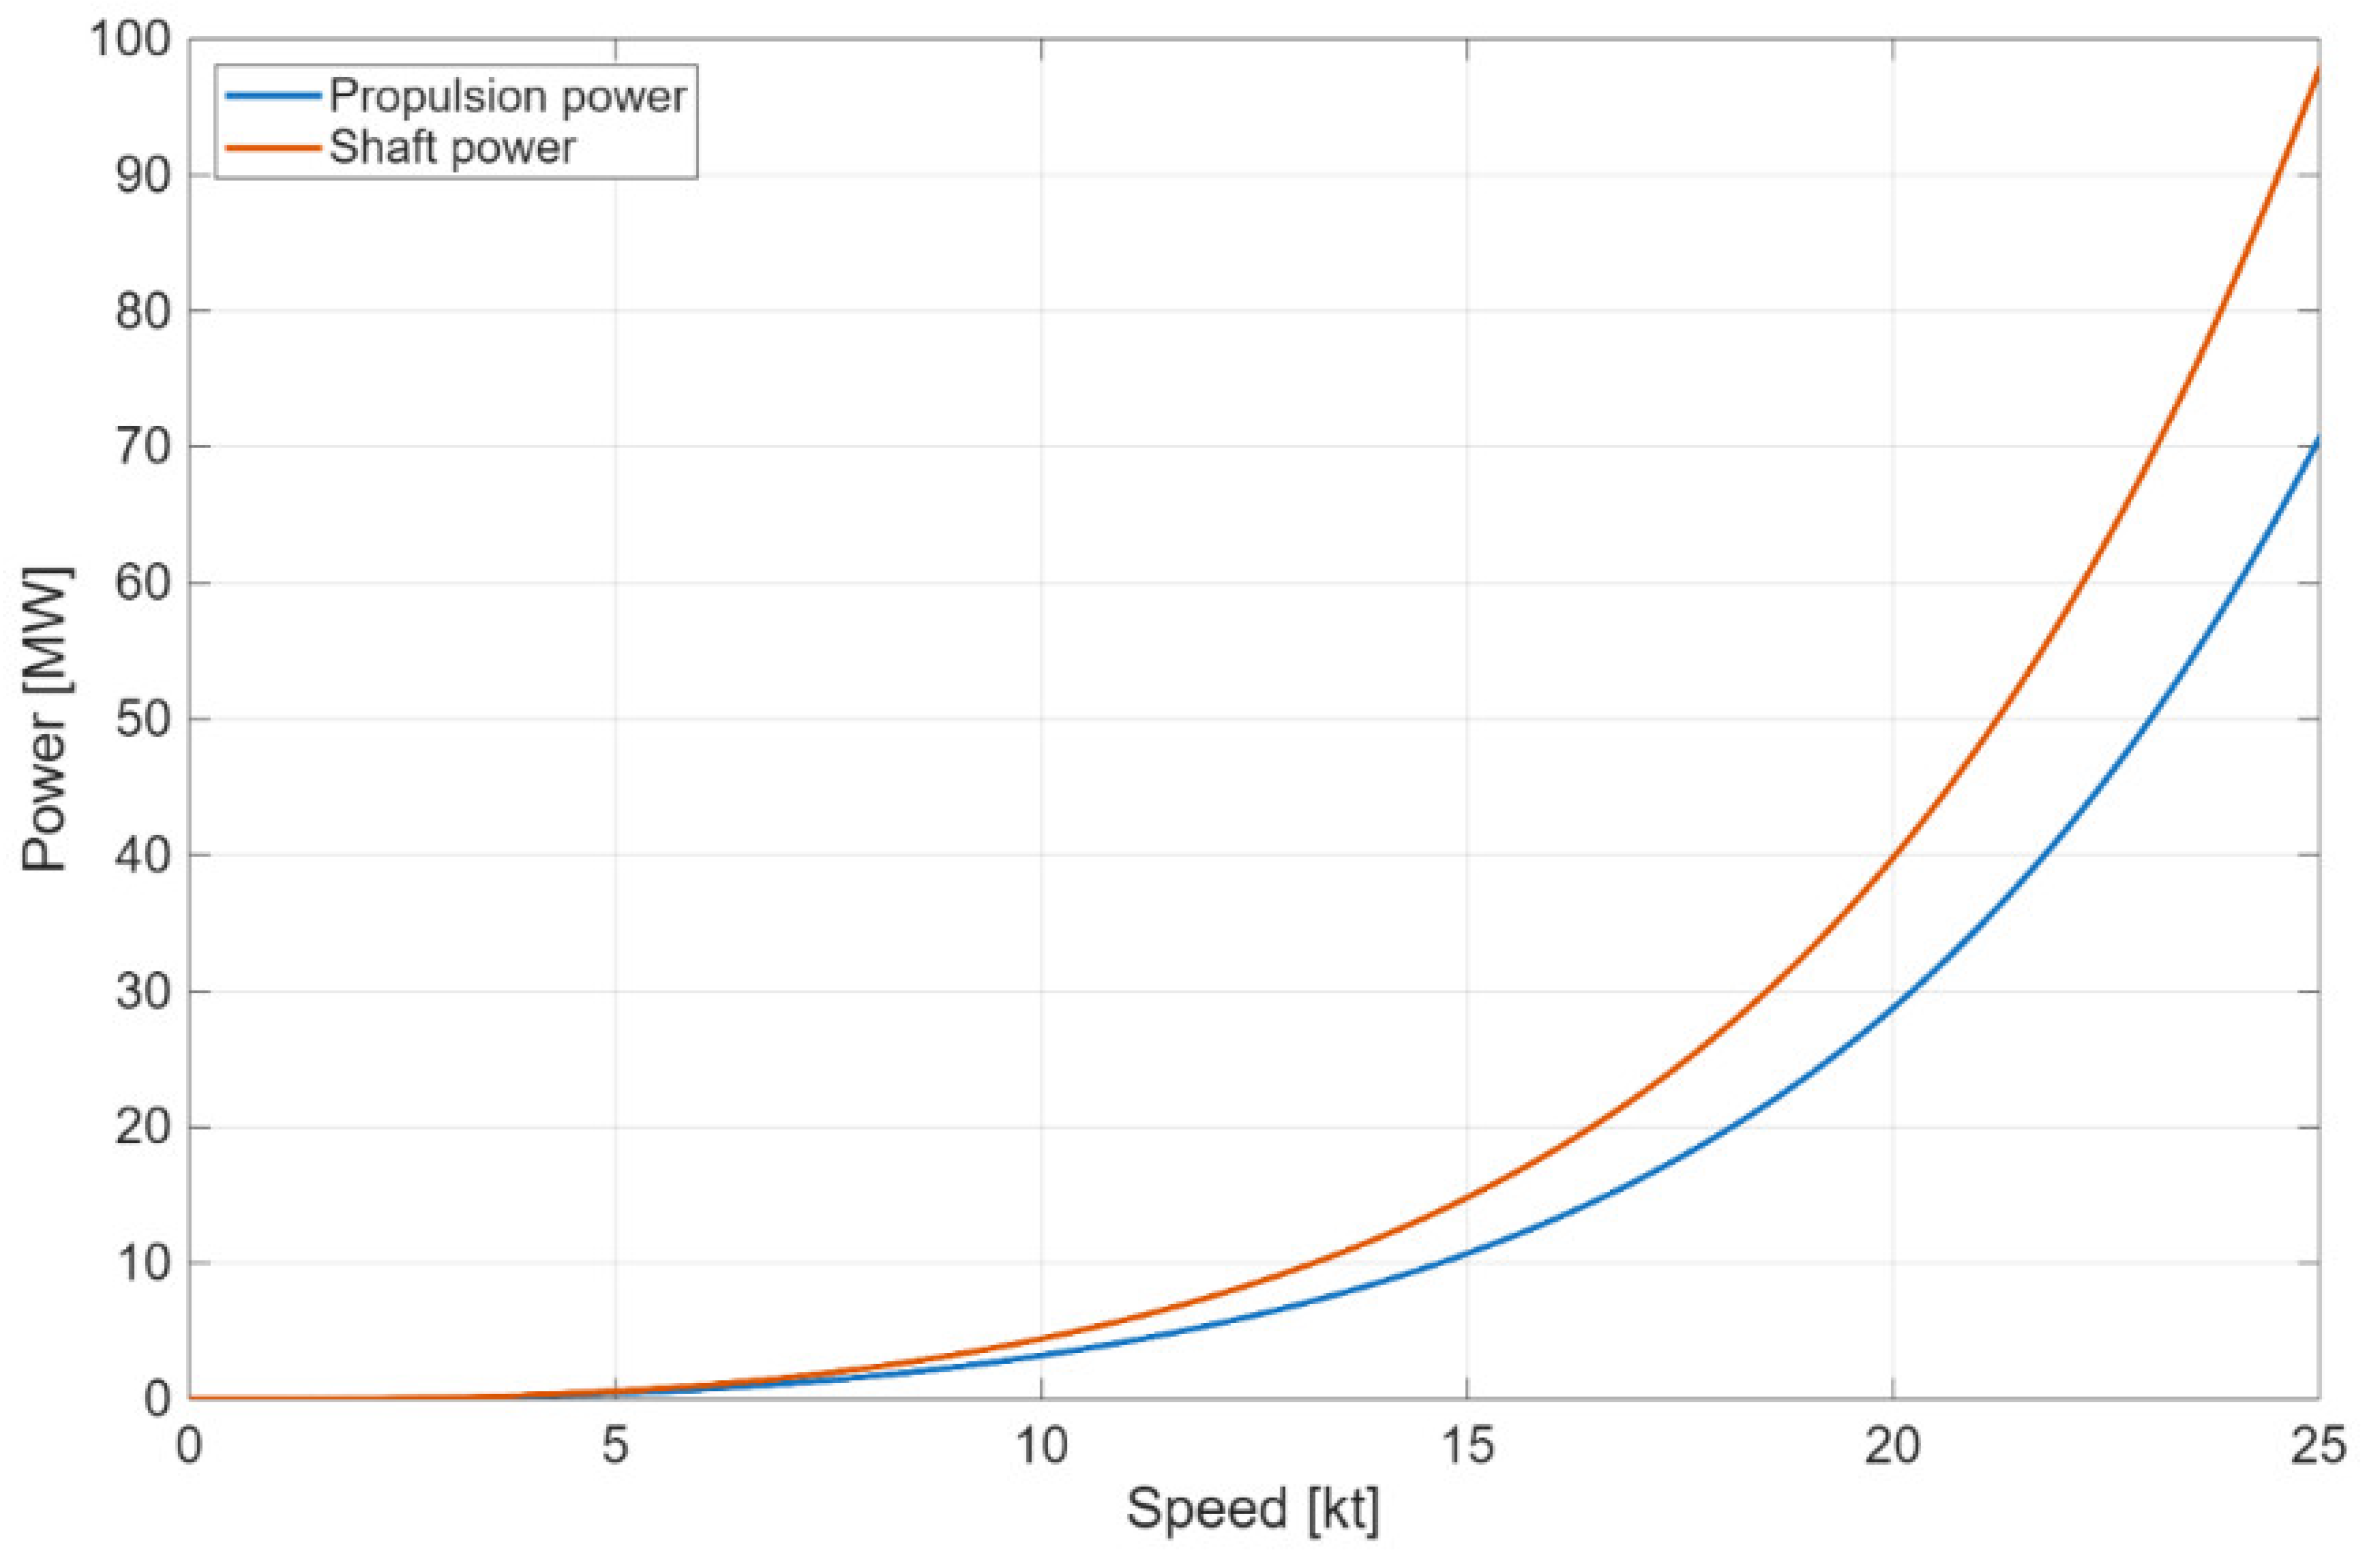
In order to reduce model complexity, we do not capture sub-second electrical transients and assume that the DC bus voltage is tightly regulated by power electronics and supported by the battery. We also assume that vessel hydrodynamic effects are captured with a power–speed curve.
The following subsections describe the key component models in more detail.
2.4. Proton Exchange Membrane Fuel Cell Model
PEMFCs operate by converting the chemical energy of hydrogen directly into electricity through an electrochemical process that takes place across a solid polymer electrolyte membrane. PEMFCs are the most popular and mature fuel cells currently available [
44], and are the most common fuel cell used in maritime applications [
28]. The fuel cell consists of an anode and a cathode that are separated by a polymer electrolyte. Hydrogen in the anode goes through the H
2 → 2H
+ + 2e
− half reaction, where the H
+ travels through the electrolyte to the cathode and the e
− travels through an external circuit connecting the anode and cathode, providing electricity. Both the ions and electrons arrive at the cathode and react with oxygen through ½O
2 + 2H
+ + 2e
− → H
2O, producing water as the only fuel cell byproduct.
The PEMFC model is based upon the work of O’Hayre et al. [
14] and consists of a 0-D quasi-static PEMFC stack model that simulates the energy and mass balances, capturing the voltage–current behavior of the fuel cell. This modeling approach is widely used in system-level PEMFC studies because it captures the dominant electrochemical loss mechanisms with low computational cost, making it well-suited for dynamic feasibility and energy-integration analyses.
The voltage–current relationship is derived from well-established semi-empirical formulations and the literature-reported parameter values [
14], rather than from calibration against new experimental data. Accordingly, the model is intended to provide nominal, design-point performance estimates for system-level assessment, rather than probabilistic or lifetime performance predictions, with uncertainty dominated by the estimation of propulsion and hotel load profiles rather than by second-order electrochemical parameter variations.
2.4.1. Thermodynamic Potential and Cell Losses
The standard-state reversible voltage from the reaction Gibbs free energy is used to determine the maximum open-circuit voltage at STP. However, since the PEMFC will not operate at STP and will be operating at a certain extent of reaction (utilization), the reversible voltage is modeled by the Nernst Equation:
where
is the reversible cell voltage at non-standard conditions,
is the standard-state free-energy change in the reaction,
is the number of moles of electrons transferred, and
is Faraday’s constant (96,400 C/mol).
represents the entropy change in the reaction at non-standard conditions,
is the actual temperature, and
is the standard-state temperature (298 K).
denotes the ideal gas constant (8.314 J/K/mol),
is the activity of species
, and
is the stoichiometric coefficient of species
.
The cell voltage is affected by different types of losses. Electrochemical kinetic or activation losses occur due to slowness and non-ideality of the electrochemical reactions at the electrodes. To model these losses, the Tafel form of the Butler–Volmer equation has been used, which is considered valid for typical operation of PEMFC at reasonably high current densities [
14]:
where
is the activation overvoltage,
is the exchange current density, and
is the current density.
represents the reference reactant surface concentration, while
is the actual reactant surface concentration. Finally,
is the charge transfer coefficient, which can range between zero and 1, but is set here to 0.5.
Ion conduction through the membrane (and electronic conduction through other fuel cell components) introduces voltage losses proportional to the current density of the cell and the Area Specific Resistance (
) of the membrane:
The ASR is mainly dominated by proton transport across the Nafion membrane. Its ionic conductivity,
, depends upon the membrane local water content,
, and temperature,
. The total membrane resistance is obtained by integrating through its thickness,
:
The ASR is a normalized resistance by the active cell area,
, therefore:
This modeling approach reproduces the intermediate, linear region of the PEMFC polarization curve and allows sensitivity analysis with respect to membrane hydration, thickness, and operating temperature.
At high current densities, the electrochemical reaction rate at the catalyst layer exceeds the rate at which reactants can be transported from the bulk gas channels to the active sites, causing a local drop in reactant concentration and voltage. This effect is known as concentration polarization or mass transport losses, and has been modeled using a logarithmic expression derived from Fick’s law and the Nernst equation:
This equation is expressed in terms of the limiting current density,
, which corresponds to the current density where the reactant concentration at the catalyst layer approaches zero due to transport limitations. It has been modeled from the reactant diffusion flux through the gas diffusion layer (GDL), as follows:
where
is the effective diffusion coefficient, accounting for the porosity and tortuosity of the GDL,
is the bulk reactant concentration, and
is the anode thickness.
Concentration losses are typically minimal until cell current density, , approaches .
2.4.2. Polarization Curve
The actual cell voltage has been modeled as the reversible thermodynamic potential minus the activation, ohmic and concentration losses:
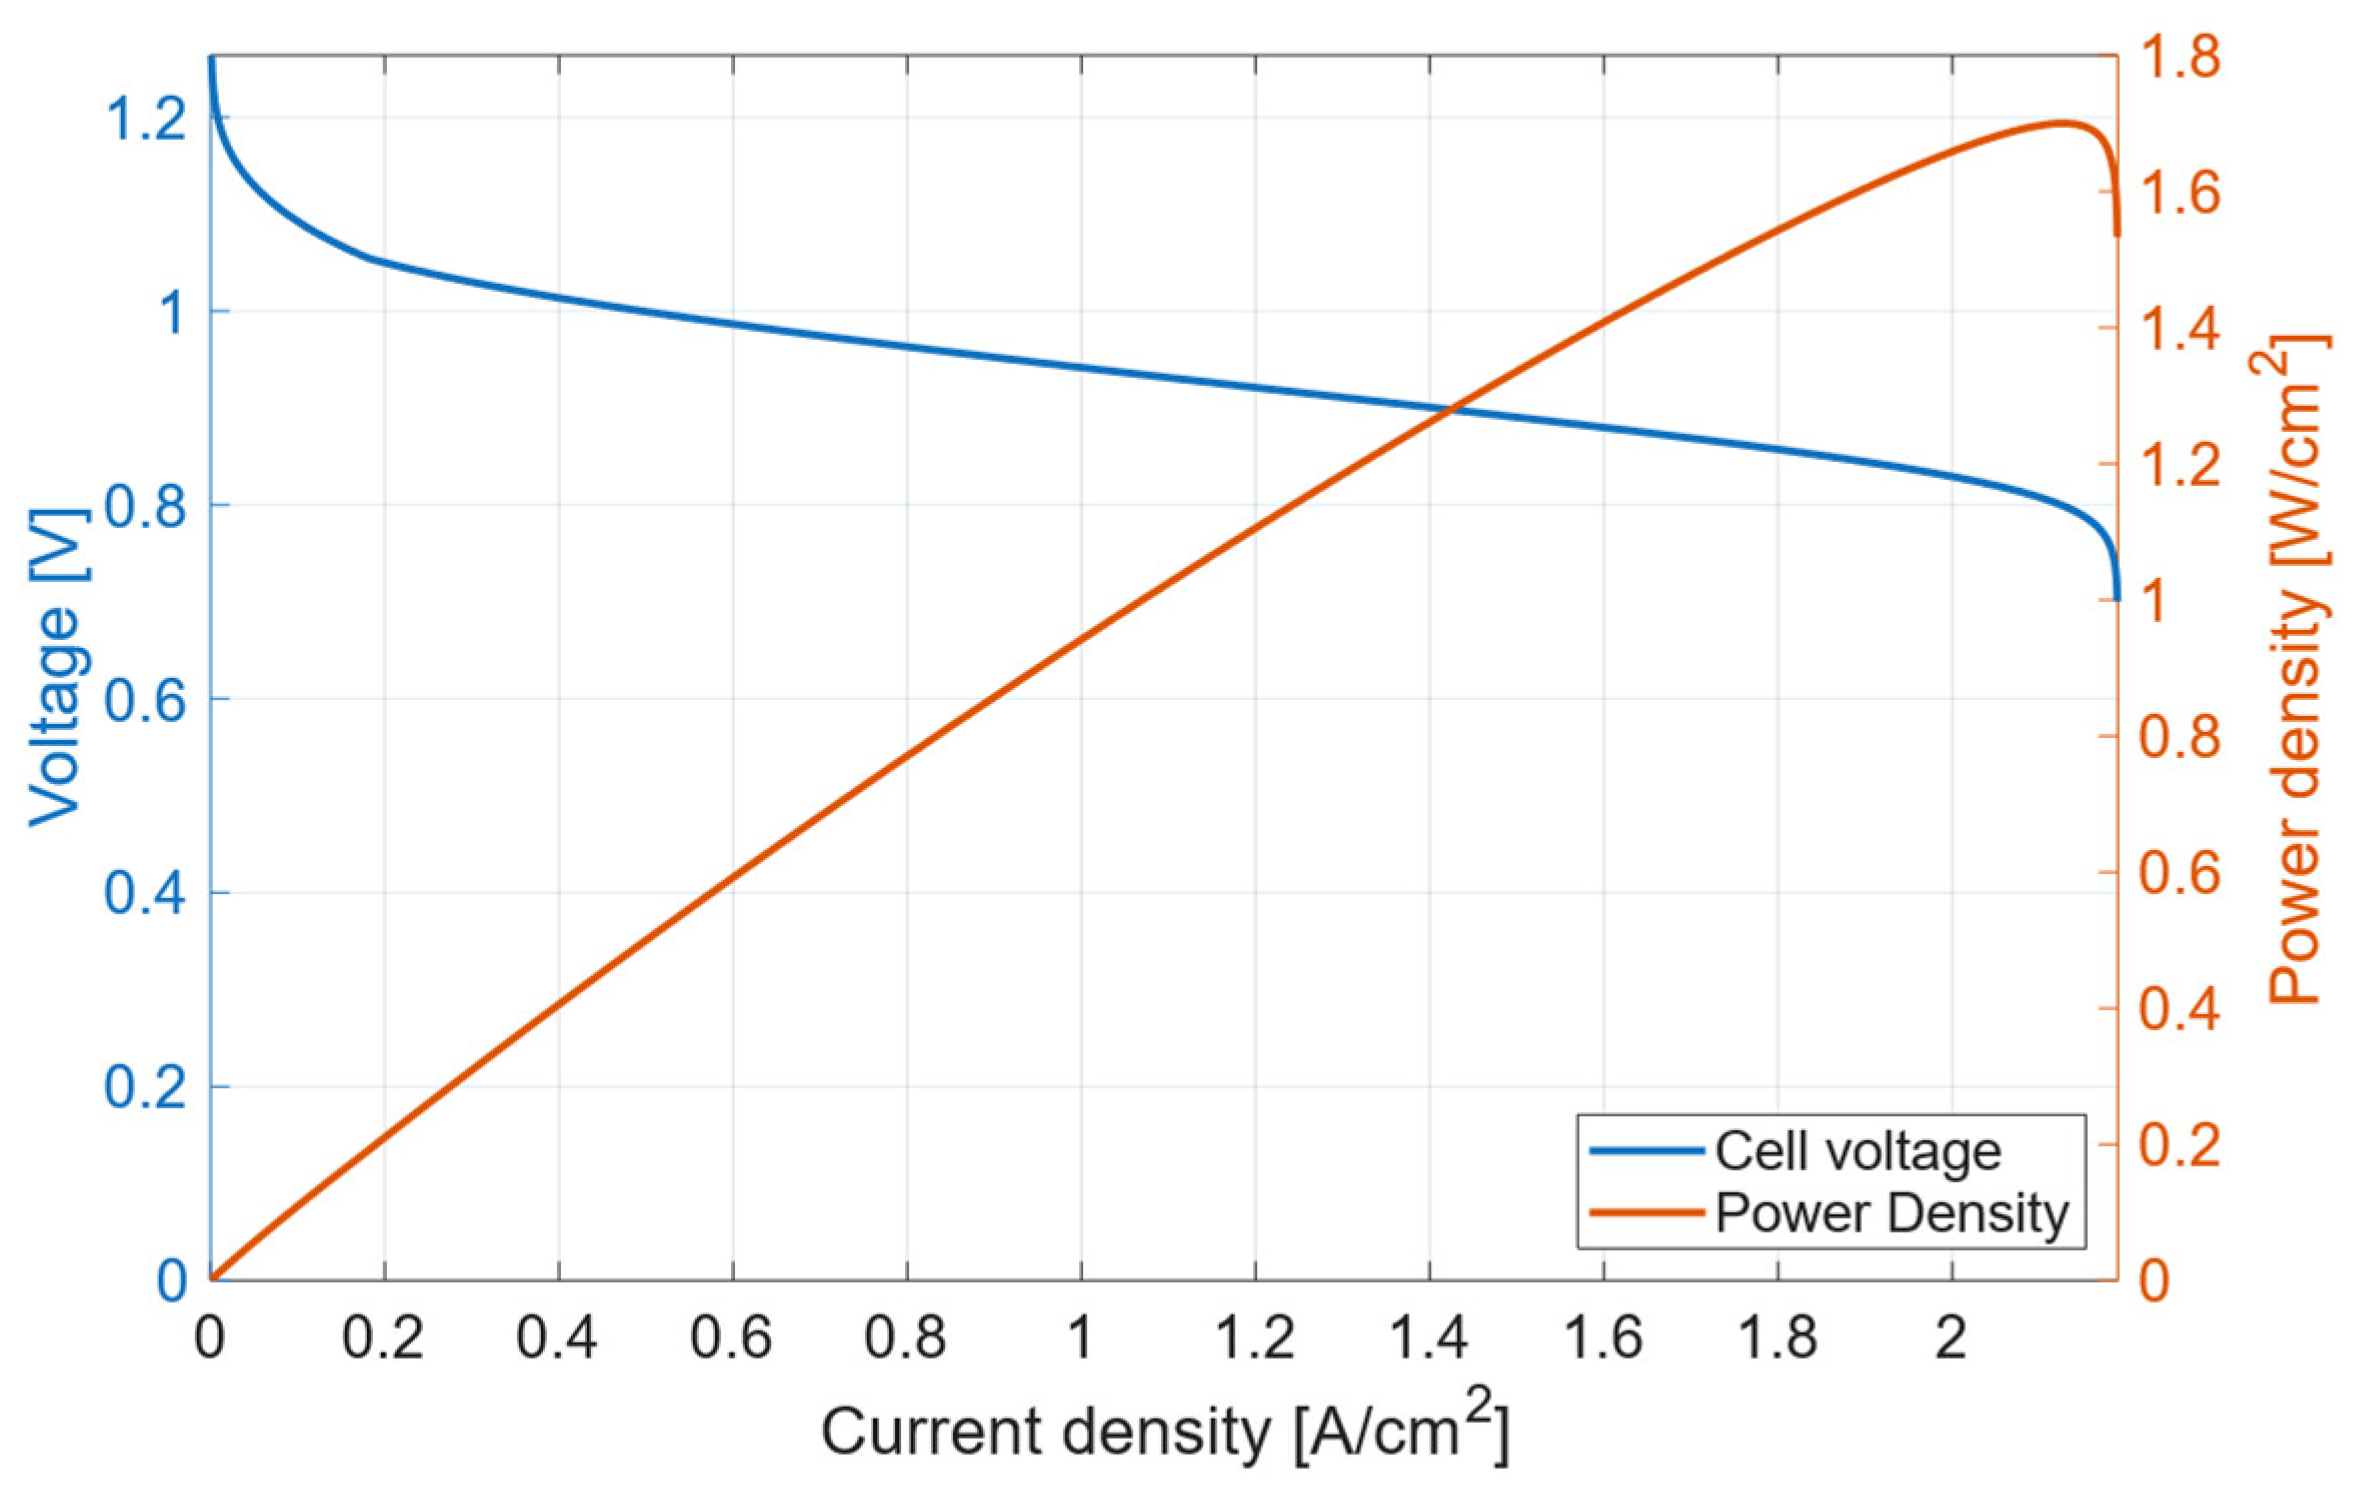
The modeled polarization curve and power density for a single cell and a hydrogen utilization of 0.95 are presented in
Figure 2.
2.4.3. Effect of Hydrogen Utilization on Voltage and Electrical Efficiency
Hydrogen utilization,
, is defined as the ratio between the reacted hydrogen mass flow rate,
, and the total hydrogen mass flow rate supplied at the anode inlet,
, which accounts for both consumed and unreacted hydrogen in the fuel cell:
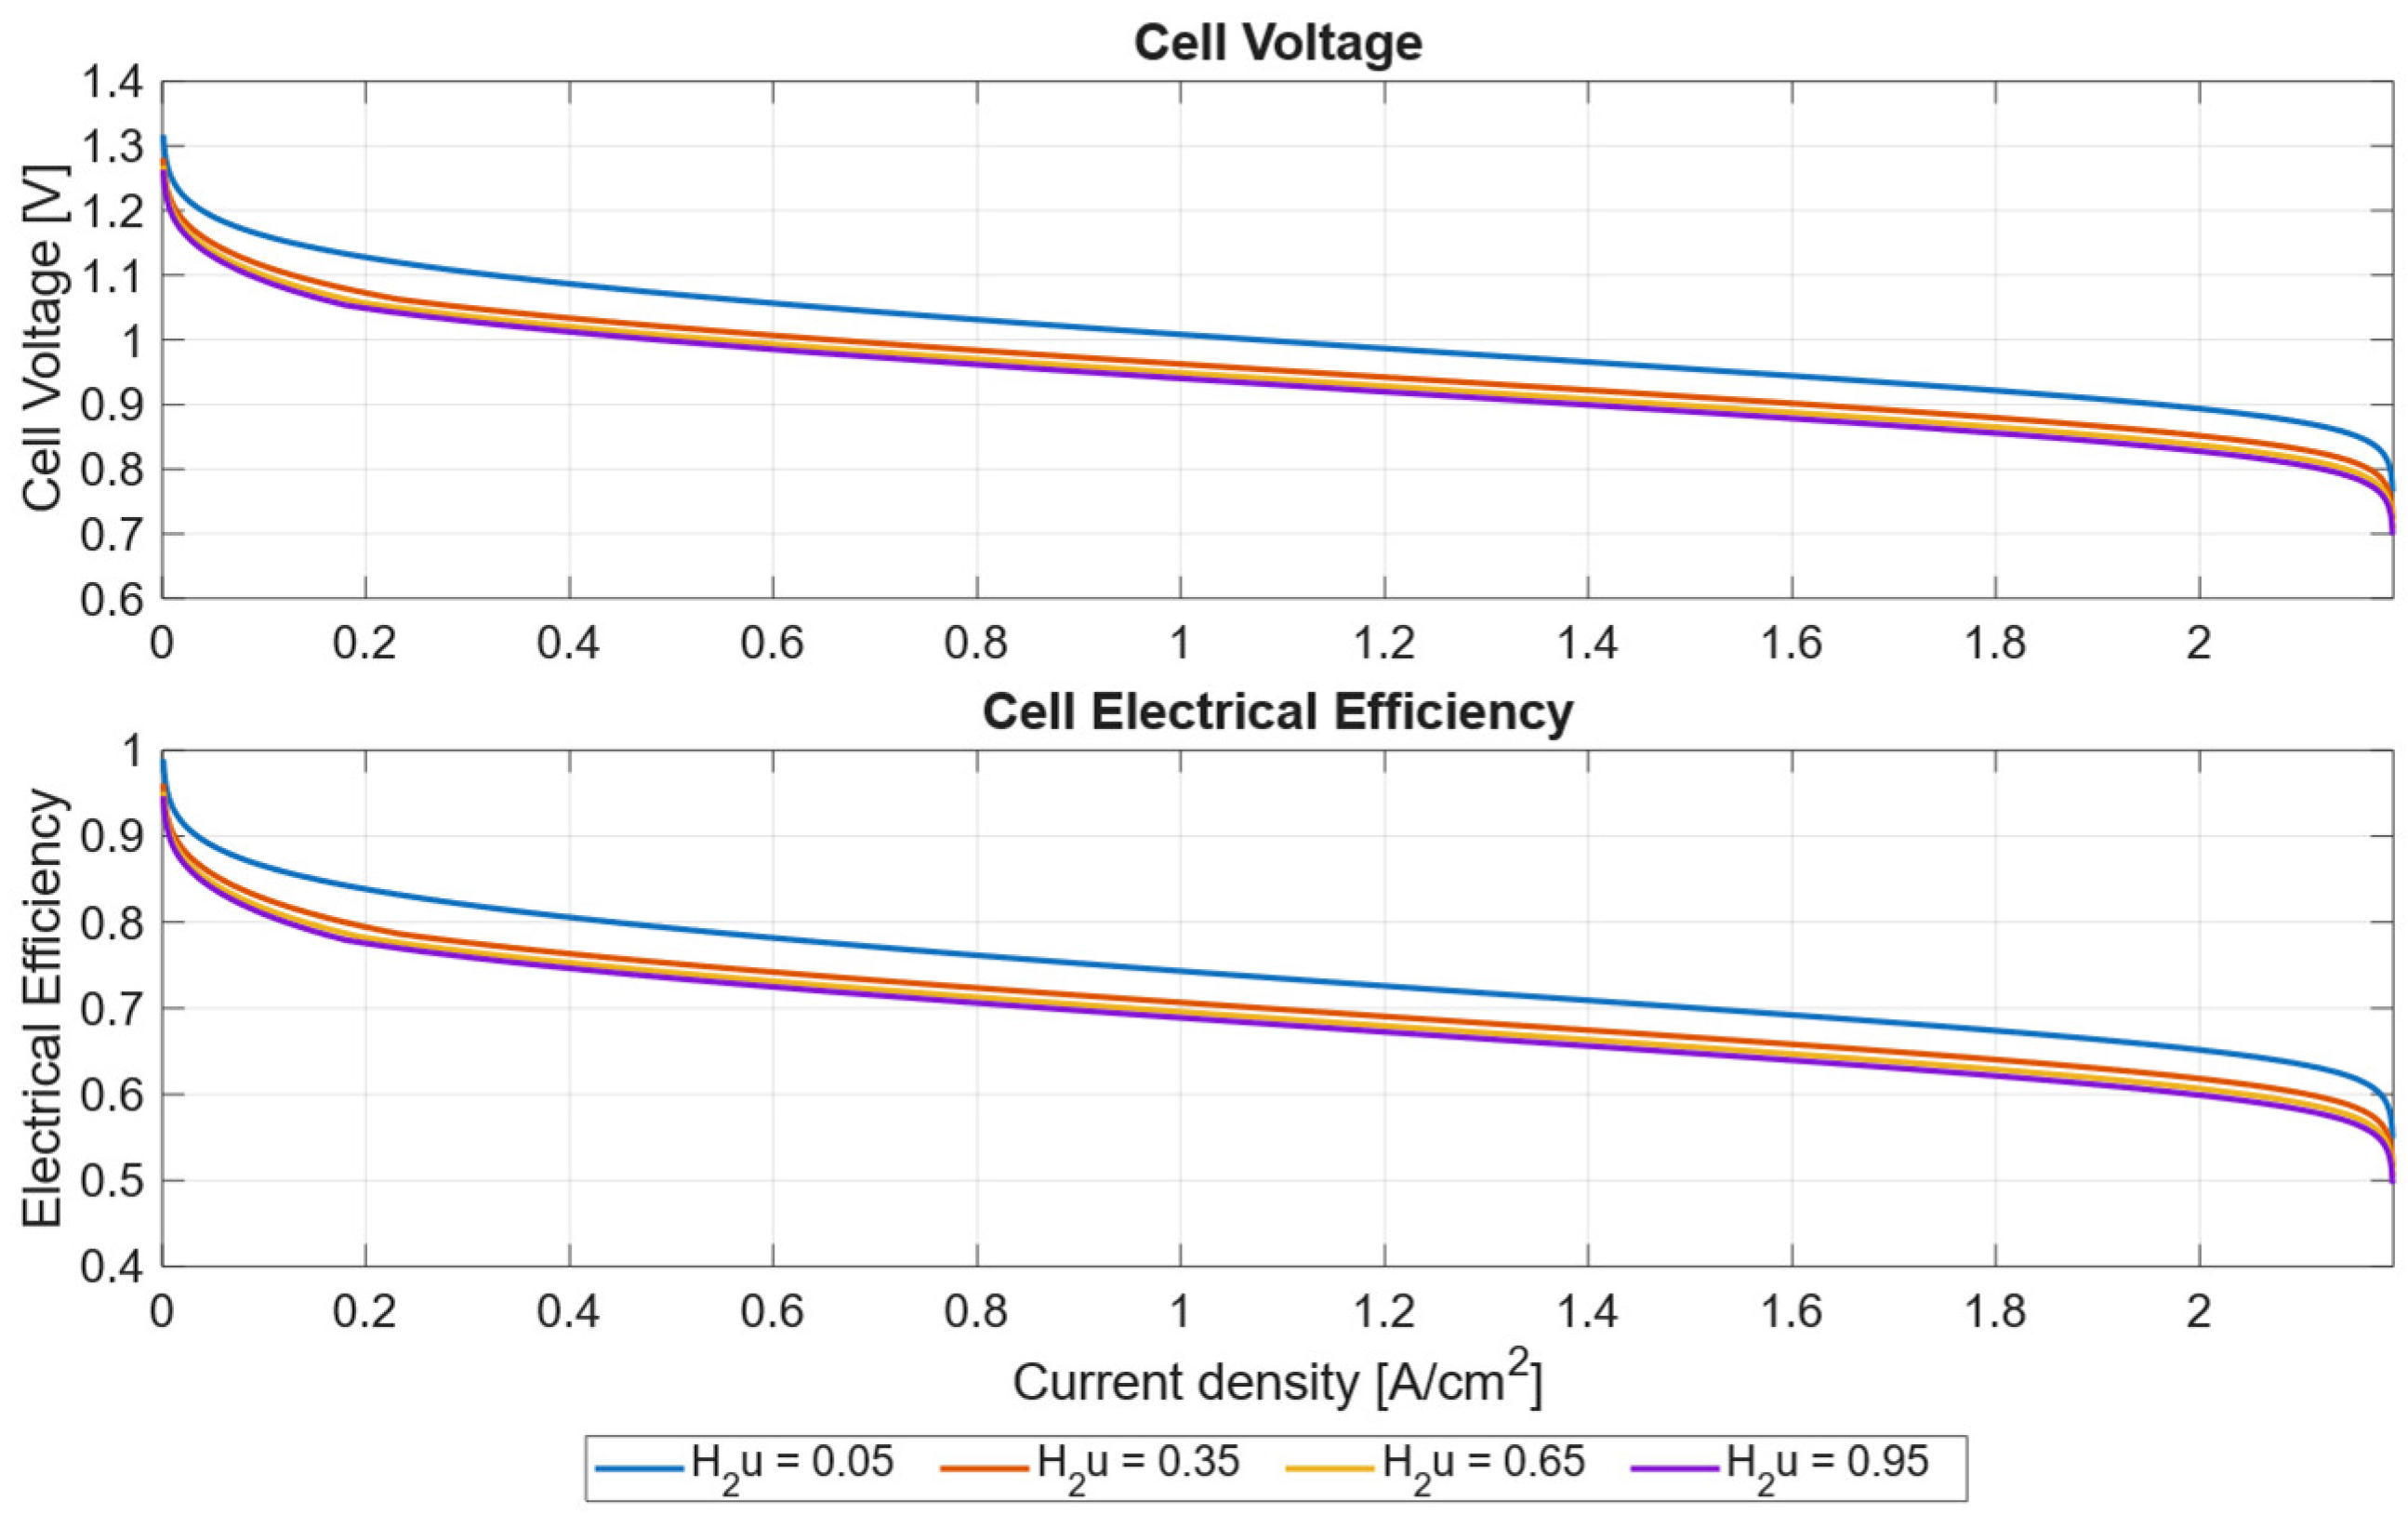
Hydrogen utilization directly affects PEMFC cell voltage and electrical efficiency by modifying local reactant concentrations at the anode. For a given current density, lower hydrogen utilization increases hydrogen partial pressure at the catalyst layer, raising the Nernst reversible cell voltage (Equation (1)) and resulting in a higher operating voltage. Higher hydrogen concentration also improves reaction kinetics by reducing activation and concentration overpotentials.
Figure 3 shows how, at lower hydrogen utilization, cell voltage can increase by up to 0.67 V, while the electrical efficiency increases by up to 5.5%.
While lower hydrogen utilization increases cell voltage and electrical efficiency, it is generally not desirable under standard operating conditions, as it leads to a higher hydrogen content in the anode exhaust, which is typically lost. However, reduced utilization can become advantageous when the chemical energy of hydrogen in the exhaust is recovered (e.g., through thermal recovery or downstream utilization), allowing the voltage and efficiency benefits to be exploited without incurring a net system-level efficiency penalty.
2.4.4. PEMFC Power Plant Configuration
The fuel cell power plant consists of 330 identical PEMFC stacks. Each stack comprises 120 cells connected in series, with an active area of 1250 cm
2 per cell, operating at a nominal pressure of 3 bar. The adopted parallel PEMFC configuration follows established high-power multi-stack fuel cell system (MFCS) architecture and energy-management frameworks [
45], which emphasize modular, parallel operation to achieve scalability and reliability under large and dynamic load demands.
After accounting for the balance of plant and parasitic loads, the power plant provides a total installed electrical power of 76.1 MW and an associated thermal power of 28.9 MW. At the nominal operation point (j = 1 A/cm
2,
= 0.95), the PEMFC plant has a total combined heat and power (CHP) efficiency of 78% (LHV). The recovered heat is directed to the ship’s thermal management system through dedicated exhaust and coolant heat exchangers, as described in
Section 2.5.
The PEMFC CHP efficiency is defined by Equation (10):
Hydrogen consumption is computed from Faraday’s law, as follows:
where
is the total current,
is Faraday’s constant, and
is the hydrogen utilization ratio. The utilization is dynamically adjusted between 0.05 and 0.95 to balance electrical and thermal demands. This is a novel approach to operating the fuel cell plant, which allows for lower utilization at times when thermal demand is high, increasing the hydrogen content in the exhaust, and therefore increasing the downstream catalytic burner heat generation while synergistically increasing the voltage and efficiency of the fuel cell to produce combined heat and power. Typically, the flow of fuel to the burners for heat production would be separate from the fuel flow to the power generators.
Dynamic behavior is approximated with a first-order lag on voltage response (τ = 60 s) to reflect the stack’s finite ramp rate due to gas diffusion and membrane hydration transients. This delay ensures that short-term load fluctuations are absorbed by the 100 kWh battery connected to the DC bus, while the PEMFC responds over more realistic and longer time scales. Parameter calibration was performed by fitting polarization and efficiency curves to experimental data from large-format marine PEMFC stacks.
To reduce model complexity, balance-of-plant components are assumed to operate with constant efficiency where the parasitic load changes linearly with fuel stack output. The PEMFC block thus outputs net DC power, hydrogen consumption, and recoverable heat.
2.5. Heat Recovery System Model
Two subsystems recover heat from the fuel-cell plant and fuel storage, as shown in
Figure 1. First, the Exhaust Heat Exchanger (EHX) recovers sensible heat from the moist PEMFC cathode exhaust and transfers it to a fresh-air stream supplied to the ship’s conditioned spaces. We model the EHX as a gas-to-gas plate heat exchanger. The EHX works together with a liquid-to-liquid plate Cooling Fluid Heat Exchanger (CFHX) that captures jacket-coolant heat used to warm up DHW. Total waste heat recovery is modeled as the sum of contributions from the Exhaust Heat Exchanger and the cooling fluid heat exchanger. Both the EHX and CFHX have been modeled using the heat exchanger equation:
where
is the heat exchanger heat flow,
is the number of species in the hot stream (exhaust gases),
is the molar flow rate of species
, and
is the molar heat capacity.
and
are the outlet and inlet temperatures of the hot stream, respectively, and
is the heat exchanger’s effectiveness (
= 0.85).
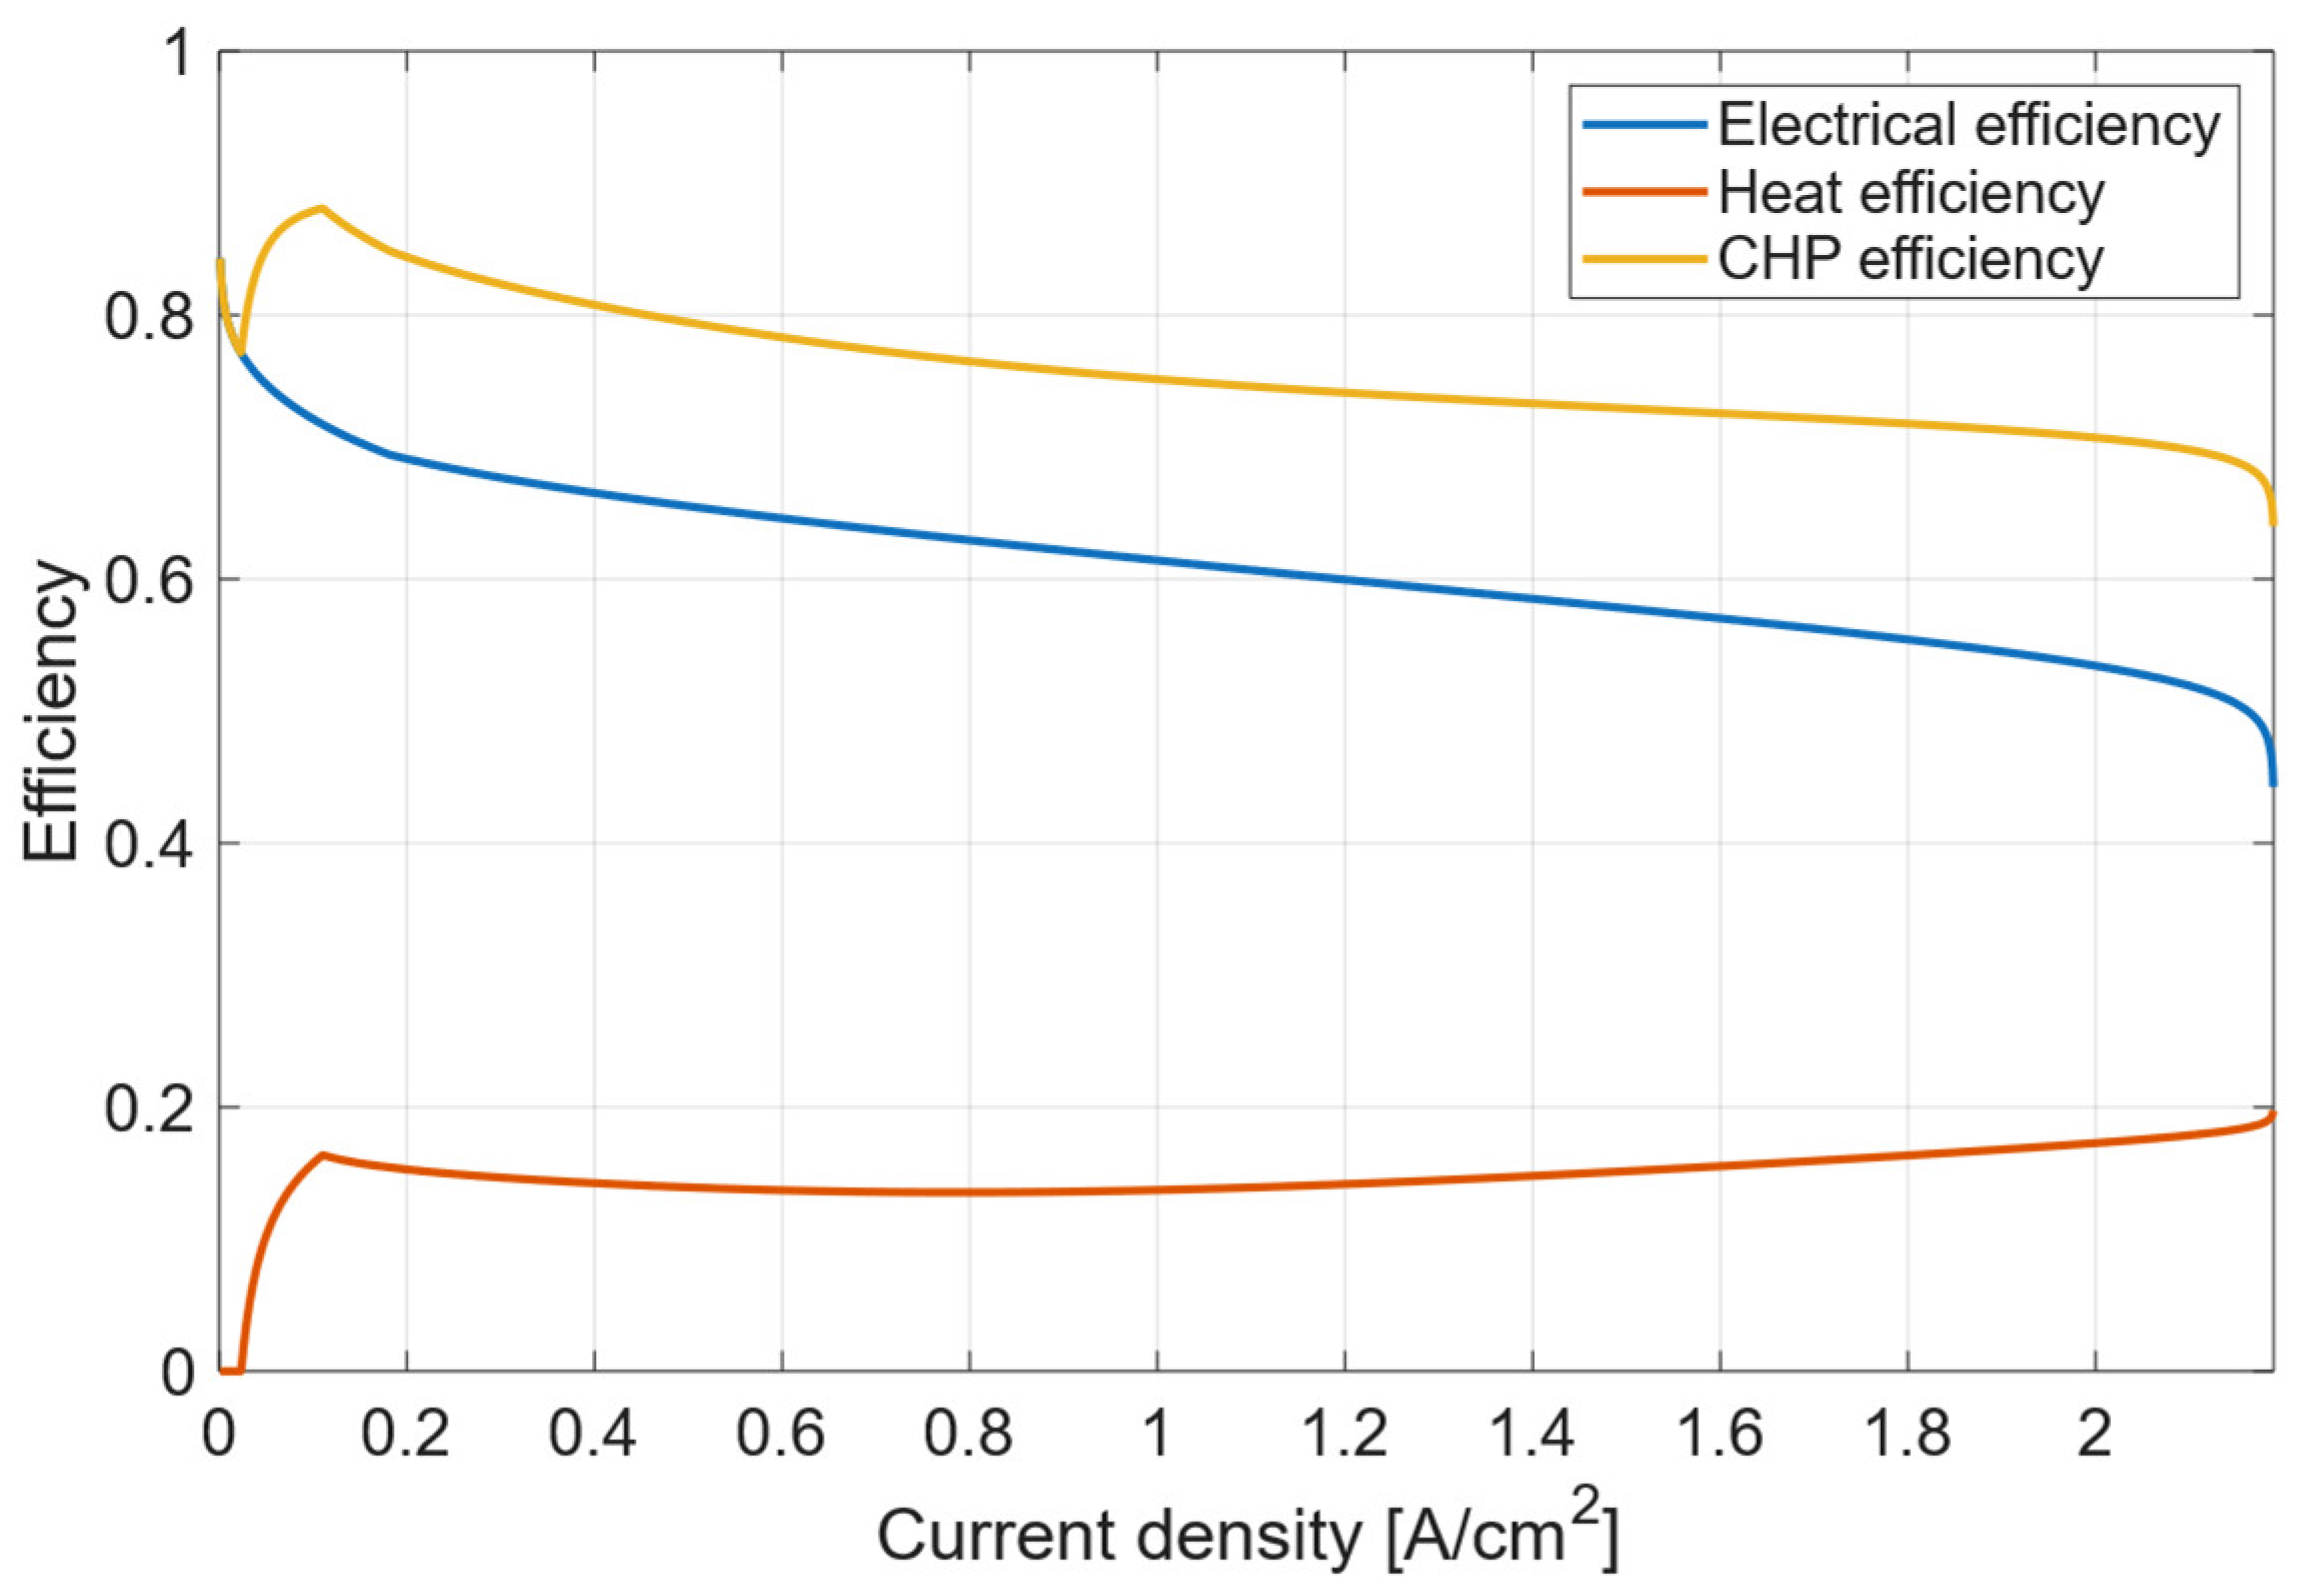
Performance characteristics of the heat recovery system, the electrical efficiency, heat efficiency and combined heat and power (CHP) efficiency of the system as a function of PEMFC current density are shown in
Figure 4.
2.6. Hydrogen Burner Model
The burner is represented as a catalytic boiler, converting hydrogen to thermal energy with a high efficiency ( = 0.95).
The expression used to calculate the heat flow generated by the hydrogen boiler is the following:
where
is the heat flow from the combustion of exhaust hydrogen,
is the molar flow rate of unreacted hydrogen in the exhaust,
is the higher heating value of hydrogen, and
is the boiler efficiency.
This modeling approach omits flame dynamics, pressure drops, or start-up transients, since at the system level, the relevant evaluation metric is the modulated thermal power output.
2.7. Thermal Energy Storage System
In order for the Nernst potential to be positive and nonzero, the PEMFC cannot fully utilize hydrogen flowing into the anode. The energy system in
Figure 1 shows the hydrogen-containing anode exhaust flowing into a catalytic hydrogen boiler to harness the remaining energy content in the exhaust, complementing the EHX and CFHX. In a catalytic hydrogen burner, the hydrogen–oxygen combustion reaction is flameless, resulting in a substantially lower reaction temperature: ~300 °C, compared to ~2200 °C in a direct combustion boiler [
46,
47]. Because of the lower temperatures, NO
x emissions are low, and the reaction temperature and heat output are easier to control.
Furthermore, a thermal energy storage system (TESS) unit integrated with the ship thermal-fluid loop has been incorporated. The TESS provides buffering between variable thermal generation and loads, storing surplus heat during low-demand periods and releasing it when the EHX and CFHX cannot provide enough heat to meet the thermal demands.
The phase change thermal storage unit is designed to buffer low-grade waste heat and supply hot water at approximately 55 °C, representative of domestic and auxiliary thermal demands. Paraffin-based phase change materials (PCMs) were selected due to their technological maturity, favorable latent heat density, and availability of commercial formulations with phase change temperatures in the 50–60 °C range, which aligns well with the targeted hot water temperature [
48]. When the recovered heat from the EHX and CFHX is not enough to meet the thermal loads, and no energy is available in the TESS, the control system will decrease the PEMFC H
2 utilization, increasing the H
2 content in the exhaust and, consequently, increasing the heat generation in the burner.
In the model, the PCM-based TESS is represented as a lumped node with a single uniform temperature,
. The TESS exchanges heat with the thermal-fluid circuit through a dedicated plate heat exchanger, while ambient losses are modeled as a constant conductance term,
. Since the system is designed to work within the PCM mushy phase change zone, and low temperature variations are expected, a constant effective heat capacity
has been considered. The TESS energy balance is obtained by the following:
where
is the mass of the phase change material,
represents the surplus heat flow from the heat recovery system and boiler, while
is the discharge heat flow from the TESS to the secondary loop.
The stored thermal energy and the state of charge of the TESS are defined by the following:
where
denotes the actual energy content of the TESS.
and
are the minimum and maximum operating temperatures of the TESS, respectively.
is the maximum energy content, and
is the TESS state of charge.
The model does not attempt to resolve detailed phase-change thermodynamics or piping and flow hydraulics; instead, it captures net energy flows. Heating loads are served first from available recovered heat directly, then from the stored heat in the TESS, and, finally, from the burner, if needed. Surplus heat beyond TESS capacity is rejected. The capacity of the storage system is 45 GJ, with the TESS working fluid being paraffin wax and yielding a storage unit size of 250 m
3 [
48].
Regarding durability, paraffin-based PCMs are widely reported to exhibit stable thermal performance over ~10,000 melt–freeze cycles [
49], depending on formulation and operating conditions. Based on the expected vessel operating profile, this corresponds to an estimated PCM service life exceeding 25 years.
2.8. LH2 Cooling Energy Recovery System
A cooling energy recovery system is integrated to synergistically garner cooling power from the LH2, as it is necessarily warmed from cryogenic storage (~21 K) to near ambient temperature prior to PEMFC delivery. Instead of rejecting this cooling energy to the ambient exterior of the ship, the hydrogen stream is routed through a two-stage heat-exchanger train, recovering up to 1.5 MW of cooling (at peak LH2 flow rates) to offset vapor compression refrigeration air conditioning loads. The two heat exchangers required to accomplish this are as follows:
LH
2HX-1: 40–80 K. Closed helium loop with a brazed-aluminum plate–fin heat exchanger (HX effectiveness ≈ 0.85) [
50,
51]. Helium’s low boiling point (4.2 K) and good thermal conductivity enable efficient cryogenic heat transfer without freezing or phase-change issues. The HX is housed in a compact cold box to minimize heat leaks.
LH
2HX-2: 80–250 K. A calcium chloride brine solution is used through a plate-and-frame heat exchanger (HX effectiveness ≈ 0.75) [
52,
53]. This staged design recovers cold efficiently over a wide temperature span without oversized equipment.
Above 250 K, cooling energy is not recovered.
The total recovered cold energy flow is modeled as a function of hydrogen mass flow rate and enthalpy gain. The expression used is the following:
where
is the total recovered cold power,
is the hydrogen consumption mass flow rate,
and
are the specific enthalpies of parahydrogen at the outlet and inlet, respectively, and
represents the combined effectiveness of the multi-stage heat exchangers, with a value of 0.7.
For parahydrogen at 5 bar, warming from 40 K to 250 K yields an enthalpy increase of 3.07 MJ kg−1. At a mass flow rate of 0.7 kg s−1 and = 0.7, this corresponds to 1.5 MW of recovered cooling power at full flow. This two-stage system captures most of the LH2 cold exergy with relatively compact, marine-compatible components.
2.9. Cooling Power Model
The ship’s cooling power is supplied by an electrically driven vapor-compression refrigeration system (chiller), which provides chilled water for the air-conditioning and refrigeration systems. The chiller is modeled as a steady-state component with a constant coefficient of performance (COP = 4), representative of marine-grade systems operating under moderate ambient conditions.
The required electrical power for a given cooling load is calculated by the following equation:
where
is the chiller’s electrical power consumption and
is the instantaneous cooling power demand of the ship.
is the coefficient of performance of the electrical vapor compression refrigeration system.
The vapor-compression chiller operates purely as an electrical load on the power generation system, assuming a constant COP, with no thermal coupling to waste-heat recovery, and its rejected heat is dissipated overboard. Consequently, it increases the ship’s hotel power demand and hydrogen consumption indirectly.
2.10. Control System Architecture
The tri-generation system is coordinated by a control architecture that manages the electrical and thermal subsystems such that all energy demands throughout the vessel and throughout the voyage are satisfied while maintaining stable, efficient operation under dynamic conditions. The control structure is organized into two main feedback loops that operate on different time scales and in different physical domains:
Electrical Power Control Loop. This loop regulates the balance between the fuel-cell stack, the battery, and onboard electrical loads. The controller continuously adjusts the stack current to match total electrical demand from propulsion, hotel services, and auxiliary systems. The battery functions as a fast-response buffer, absorbing short-term load variations that exceed the fuel cell’s ramp-rate capability. This maintains DC-bus stability and prevents excessive transients in the stack, allowing it to operate near optimal efficiency.
Thermal Management Control Loop. The second loop manages the distribution of hydrogen energy between electrical and thermal generation. When excess heat is available, the controller increases utilization, directing less hydrogen toward the burner. Conversely, during heat deficits, utilization decreases so that a larger fraction of the hydrogen is passed through the PEMFC and directed to the burner. At the same time, reducing hydrogen utilization increases the PEMFC voltage and efficiency.
Together, these control layers form a hierarchical supervisory control system that meets the constraints of:
Ship propulsion and hotel electrical demand that are always met;
Thermal balance and heat-storage management within capacity limits;
Minimization of hydrogen consumption through coordinated operation of the fuel-cell stack, burner, and TESS.
This utilization-based strategy leverages the inherent coupling between hydrogen utilization, PEMFC voltage, and electrical efficiency to improve system-level performance under high thermal demand. While conventional PEMFC systems favor high utilization, the proposed tri-generation architecture alters this trade-off by the presence of a downstream catalytic hydrogen burner. As a result, operating at lower utilization (normally undesirable) becomes advantageous when thermal demand is high, enabling a synergistic improvement in electrical efficiency and heat availability not achievable in conventional fuel-cell power systems.
Logical constraints limit burner output, enforce safe utilization bounds, and prevent overcharging or depletion of the TESS. A shore-power operational mode is included for port conditions, where 80% of electrical demand is assumed to be met by shore power.
Overall, the coordinated control approach demonstrates the feasibility of collaborative multi-reactor operation under coupled electro-thermal loading conditions, extending established MFCS energy-management concepts [
48] to a shipborne tri-generation application.
2.11. LH2 Safety Considerations and Boil-Off
Key hazards associated with LH
2 include leakage, accumulation in enclosed or semi-enclosed spaces, and ignition risk. While IMO regulations do not include hydrogen [
54] and hydrogen-based vessels require non-standard design approval processes through the “International Code for Safety for Ships Using Gases or Other Low-Flashpoint Fuels” in the IGF-Code [
55], cryogenic fuel handling is already well established in maritime applications through the widespread use of LNG-fueled vessels and existing bulk LH
2 tanker ships. These provide relevant operational experience in managing risks associated with cryogenic handling, while additional considerations must be implemented to mitigate hydrogen-associated risks, such as hydrogen embrittlement and hydrogen’s higher flammability range, which shows lower ignition energy compared to LNG [
56,
57].
Therefore, safety design will require leakage detection (assuming sensor placement near potential leak sources and in enclosed or elevated spaces), possible inertization of enclosed spaces, explosion and fire protection, and safe venting mechanisms [
58].
From an operational perspective, LH
2 storage is assumed to use double-walled, vacuum-insulated tanks with multilayer insulation (MLI), consistent with current industrial practice [
22]. Under these assumptions, boil-off gas (BOG) is not expected to require venting, as modern tanks achieve BOG rates below ~0.5%/day and continuous fuel cell operation prevents sustained pressure rise [
59]. While boil-off may require venting during LH
2 refueling operations if not optimized [
19], these losses affect the net hydrogen delivered but do not impact onboard tank volume or system feasibility, as the storage tanks can still be fully filled. As a conservative measure, an overpressure protection pathway is included: if the tank approaches its maximum allowable working pressure (MAWP), vapor-phase hydrogen is routed to the catalytic burner for heat recovery or controlled disposal.
2.12. Tri-Generation Power Plant Specifications and System Efficiency
The proposed hydrogen tri-generation system consists of a PEMFC-based power generation plant, a thermal energy storage system (TESS), battery energy storage (BESS), low-temperature heat exchangers for waste heat recovery and rejection, and a LH2 tank.
Table 4 summarizes the rated power of each component, along with the specific volumetric power density values derived from technical datasheets of representative commercial systems and the corresponding estimated component volumes.
The liquid hydrogen storage tank capacity will be determined in
Section 4 based on the results obtained from the simulation.
System efficiency is evaluated on an instantaneous basis and defined as the ratio between the total useful energy supplied and the chemical energy input from liquid hydrogen consumption, based on its LHV. The useful energy includes electrical power supplied to propulsion and hotel loads by the PEMFC and BESS, recovered thermal energy delivered to heating demands by the catalytic burner and TESS, and cooling energy delivered to HVAC systems. The total system-level efficiency is defined by Equation (19):
Balance-of-plant losses are already accounted for in the net electricity and thermal flows, and comprise PEMFC air compressor and refrigerant pump power, constant mechanical and electrical efficiencies for propulsion motors and power electronics, and auxiliary loads associated with system operation. Constant component efficiencies are assumed, consistent with the system-level, pre-design scope of the study. All assumed efficiency values and parameters are documented in the openly accessible model repository.
4. Results and Discussion
This section presents the simulation outcomes of the proposed hydrogen tri-generation system for a representative large cruise ship. Results are reported for both summer and winter scenarios to capture seasonal variability in propulsion, hotel, and thermal loads. The results presented in this study should be interpreted as nominal design-point estimates, as degradation effects such as PEMFC catalyst aging and battery and thermal energy storage cycle stability are not explicitly modeled. This is consistent with the pre-design, system-level scope of the analysis.
The discussion is organized into subsections addressing demand profiles, power generation, efficiency, storage dynamics, hydrogen consumption and shore-to-ship integration, and broader feasibility implications.
4.1. Power Demands
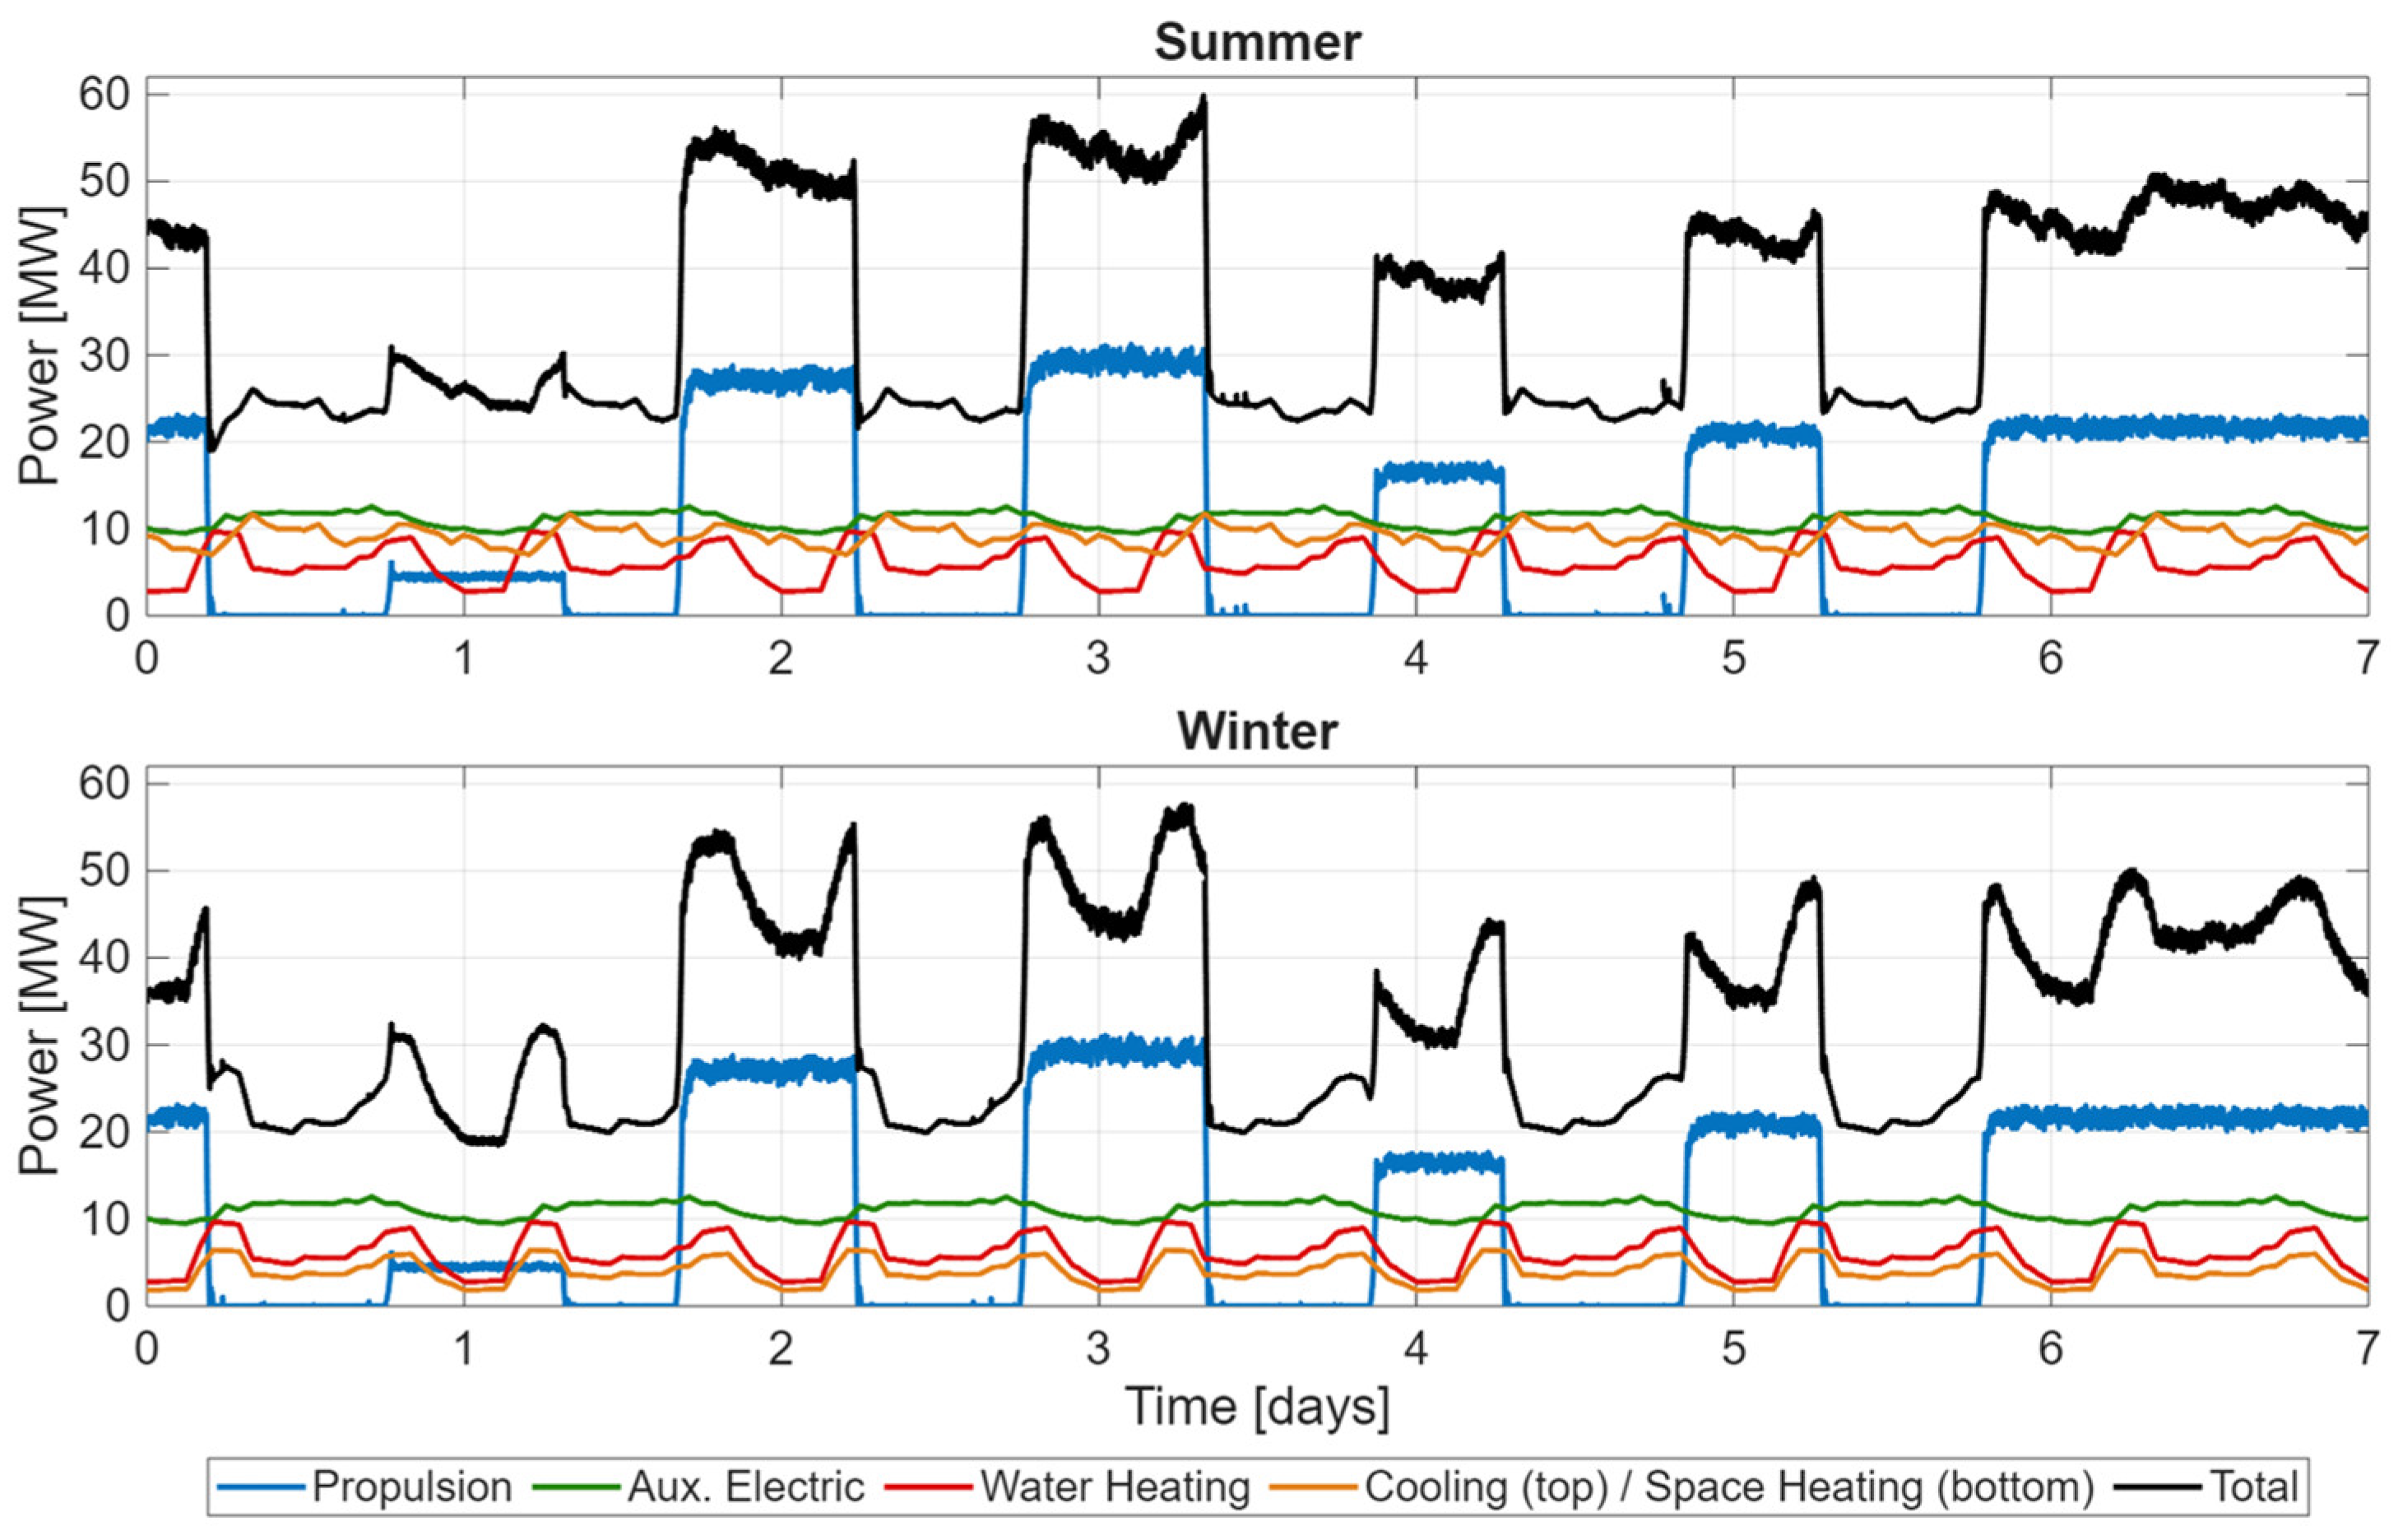
Figure 7 shows the propulsion, auxiliary, and thermal demand profiles for both summer and winter scenarios, highlighting how ambient conditions reshape the overall load composition without altering the propulsion schedule.
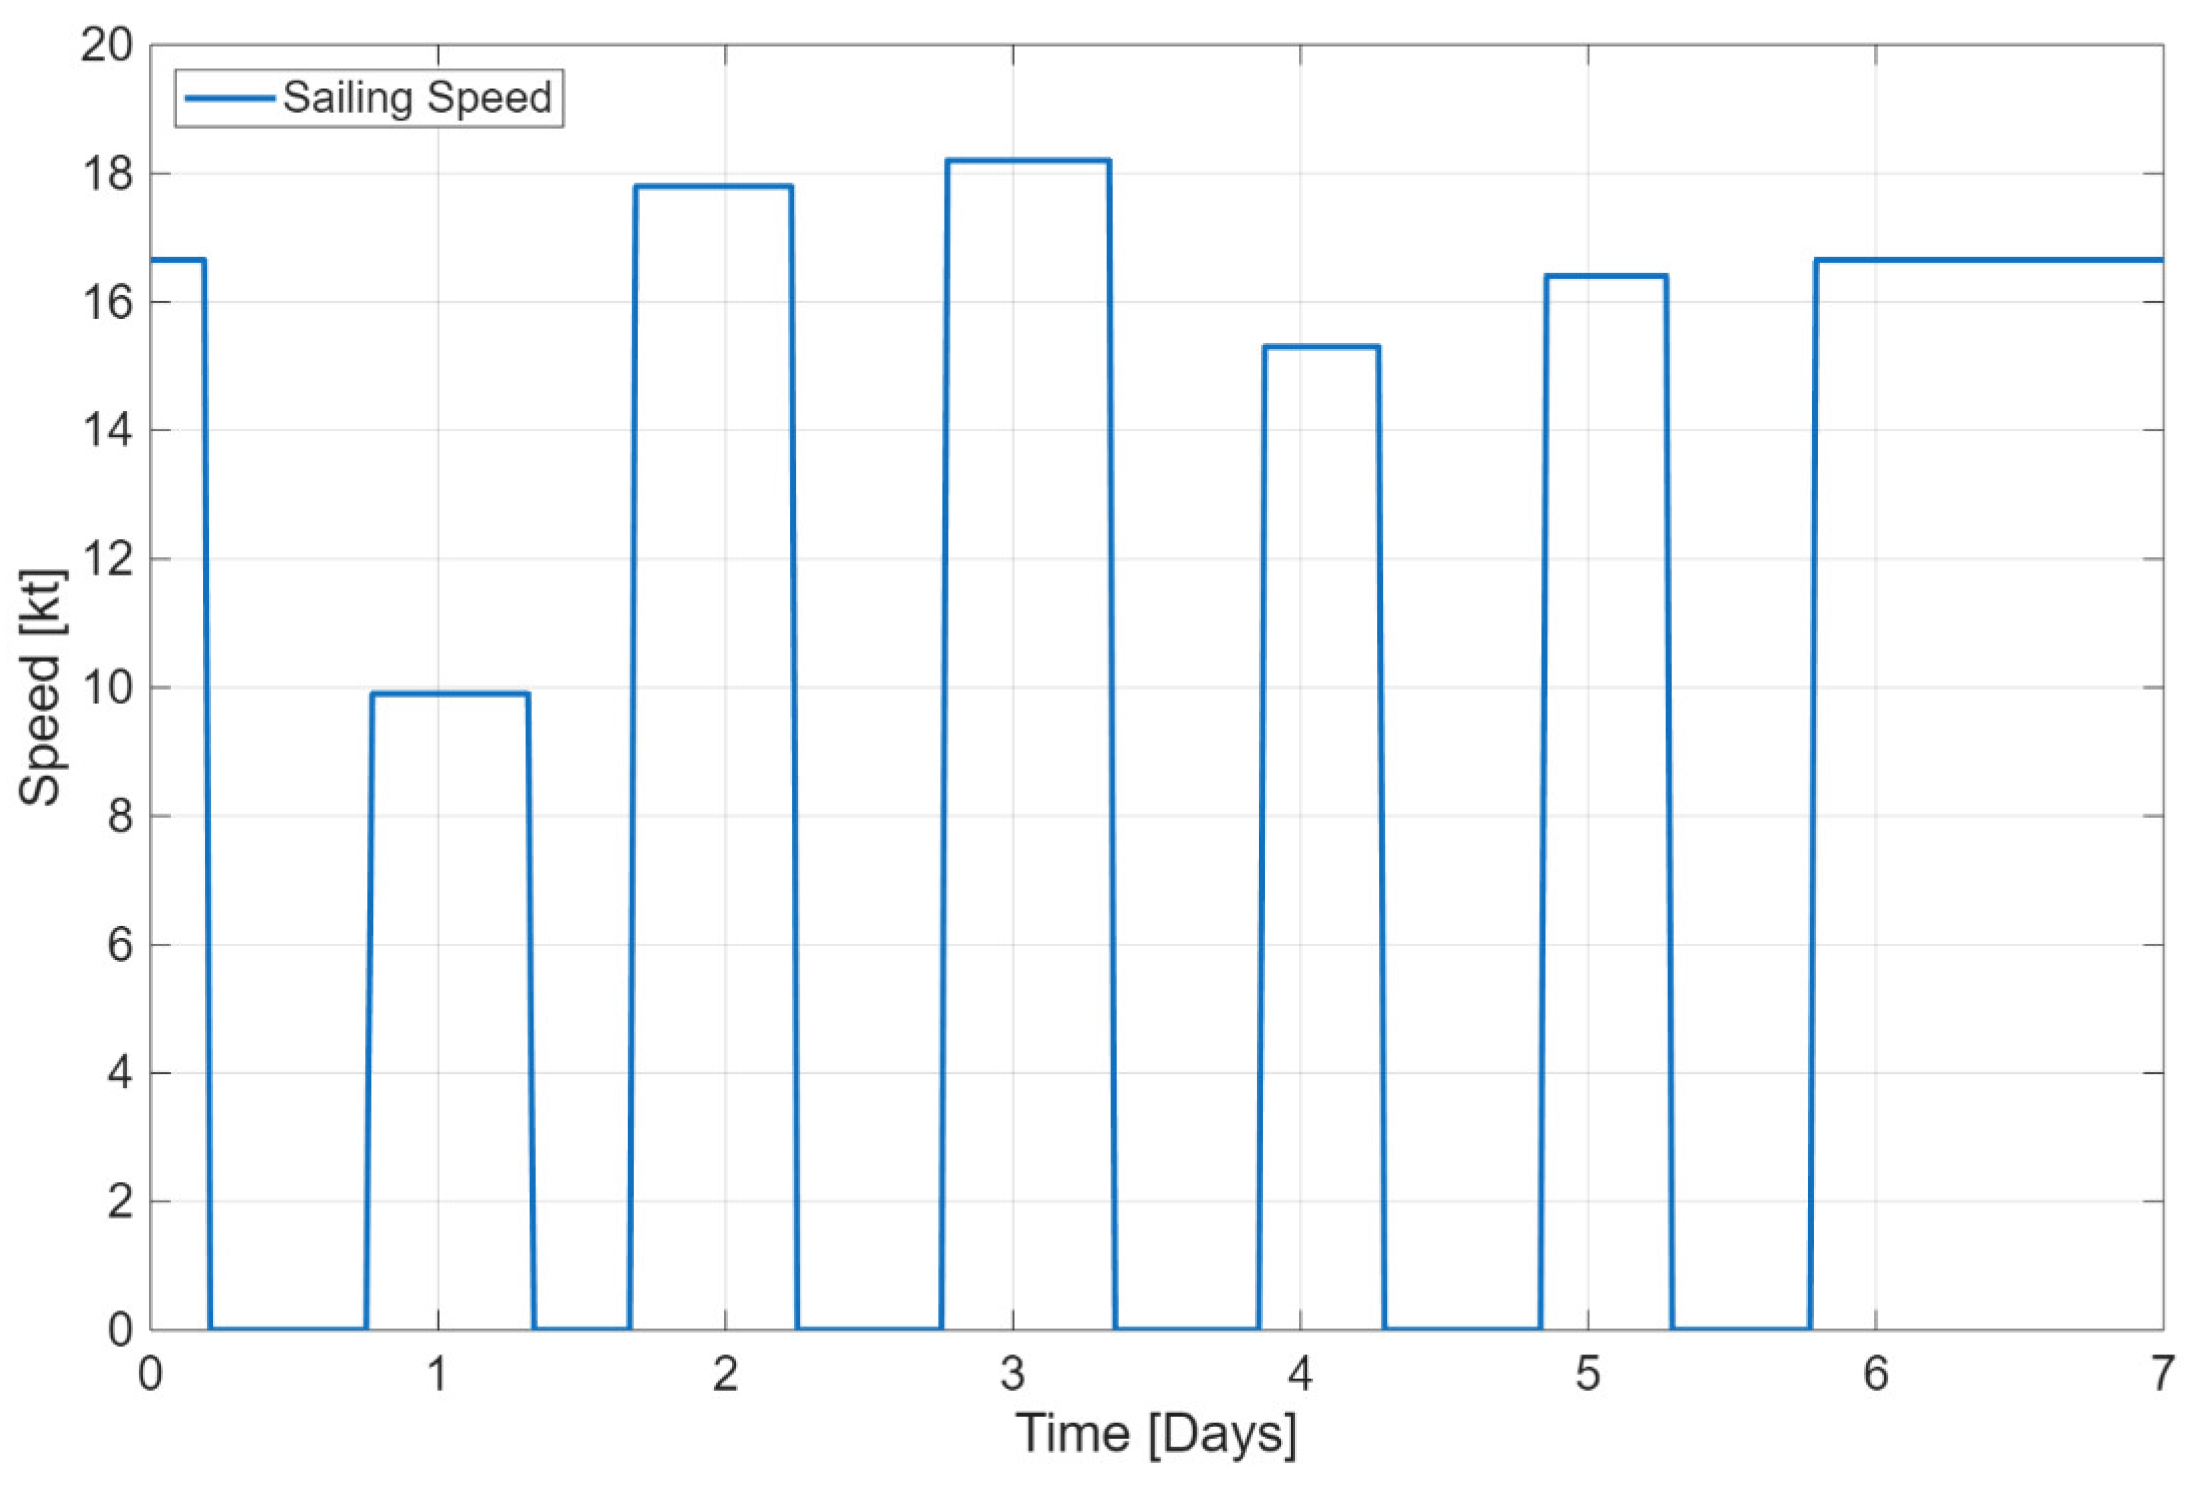
An important feature of the load profile is the recurrent daily propulsion pattern, which reflects the ship’s speed schedule. Propulsion power ramps up sharply in the evening, as the ship departs port. As the ship accelerates to cruising speed (≈21–22 knots), the propulsion load stabilizes at approximately 30–35 MW. This steady-state navigation period typically extends from the evening through the night. In the early morning, as the vessel approaches port and speed is reduced, propulsion power drops rapidly, reaching zero during port stays. These step changes align with departure and arrival events and dominate the overall shape of the daily power curve. Because propulsion power scales approximately with the square of ship speed, small variations in velocity (e.g., ±2 knots) dictated by the cruise itinerary (schedule and sailing distance) result in significant changes in power demand, which explains the differences in propulsion load between days.
The summer scenario exhibits peak total loads of about 61 MW, with the highest demand occurring when propulsion and cooling coincide. During nighttime sailing, propulsion alone represents more than half of the total energy requirement, while air-conditioning demand peaks around 11–12 MW. Hot water demand shows pronounced peaks in the early morning and evening, driven by passenger activity. Auxiliary electrical demand remains relatively constant between 9 and 12.5 MW, reflecting the hotel’s baseload. Even during port stays, total demand rarely falls below 25 MW, primarily to support cooling and hotel services.
In the winter scenario, propulsion follows the same speed schedule and maintains similar peak values (≈30.6 MW), but the thermal profile shifts significantly. Cooling is negligible, replaced by space heating between 2 and 6 MW, which peaks in the early morning when ambient temperatures are lowest. Hot water demand remains comparable to summer (largely proportional to passenger occupancy), contributing to a combined thermal load exceeding 15 MW during peak periods. As a result, the winter total load reaches a slightly lower peak of 57.6 MW, but with a much larger share of thermal energy.
This contrast underscores a clear seasonal asymmetry: summer demand is electrically dominated, where propulsion and cooling power are the main contributors to power demand. Conversely, winter shows a more balanced split between electrical and thermal loads, with heating concentrated in morning and nighttime hours. Although the propulsion profile remains constant across seasons, the hotel energy demand modifies the timing and magnitude of daily peaks, shaping how the overall tri-generation system must be managed.
4.2. Power Generation and System Efficiency
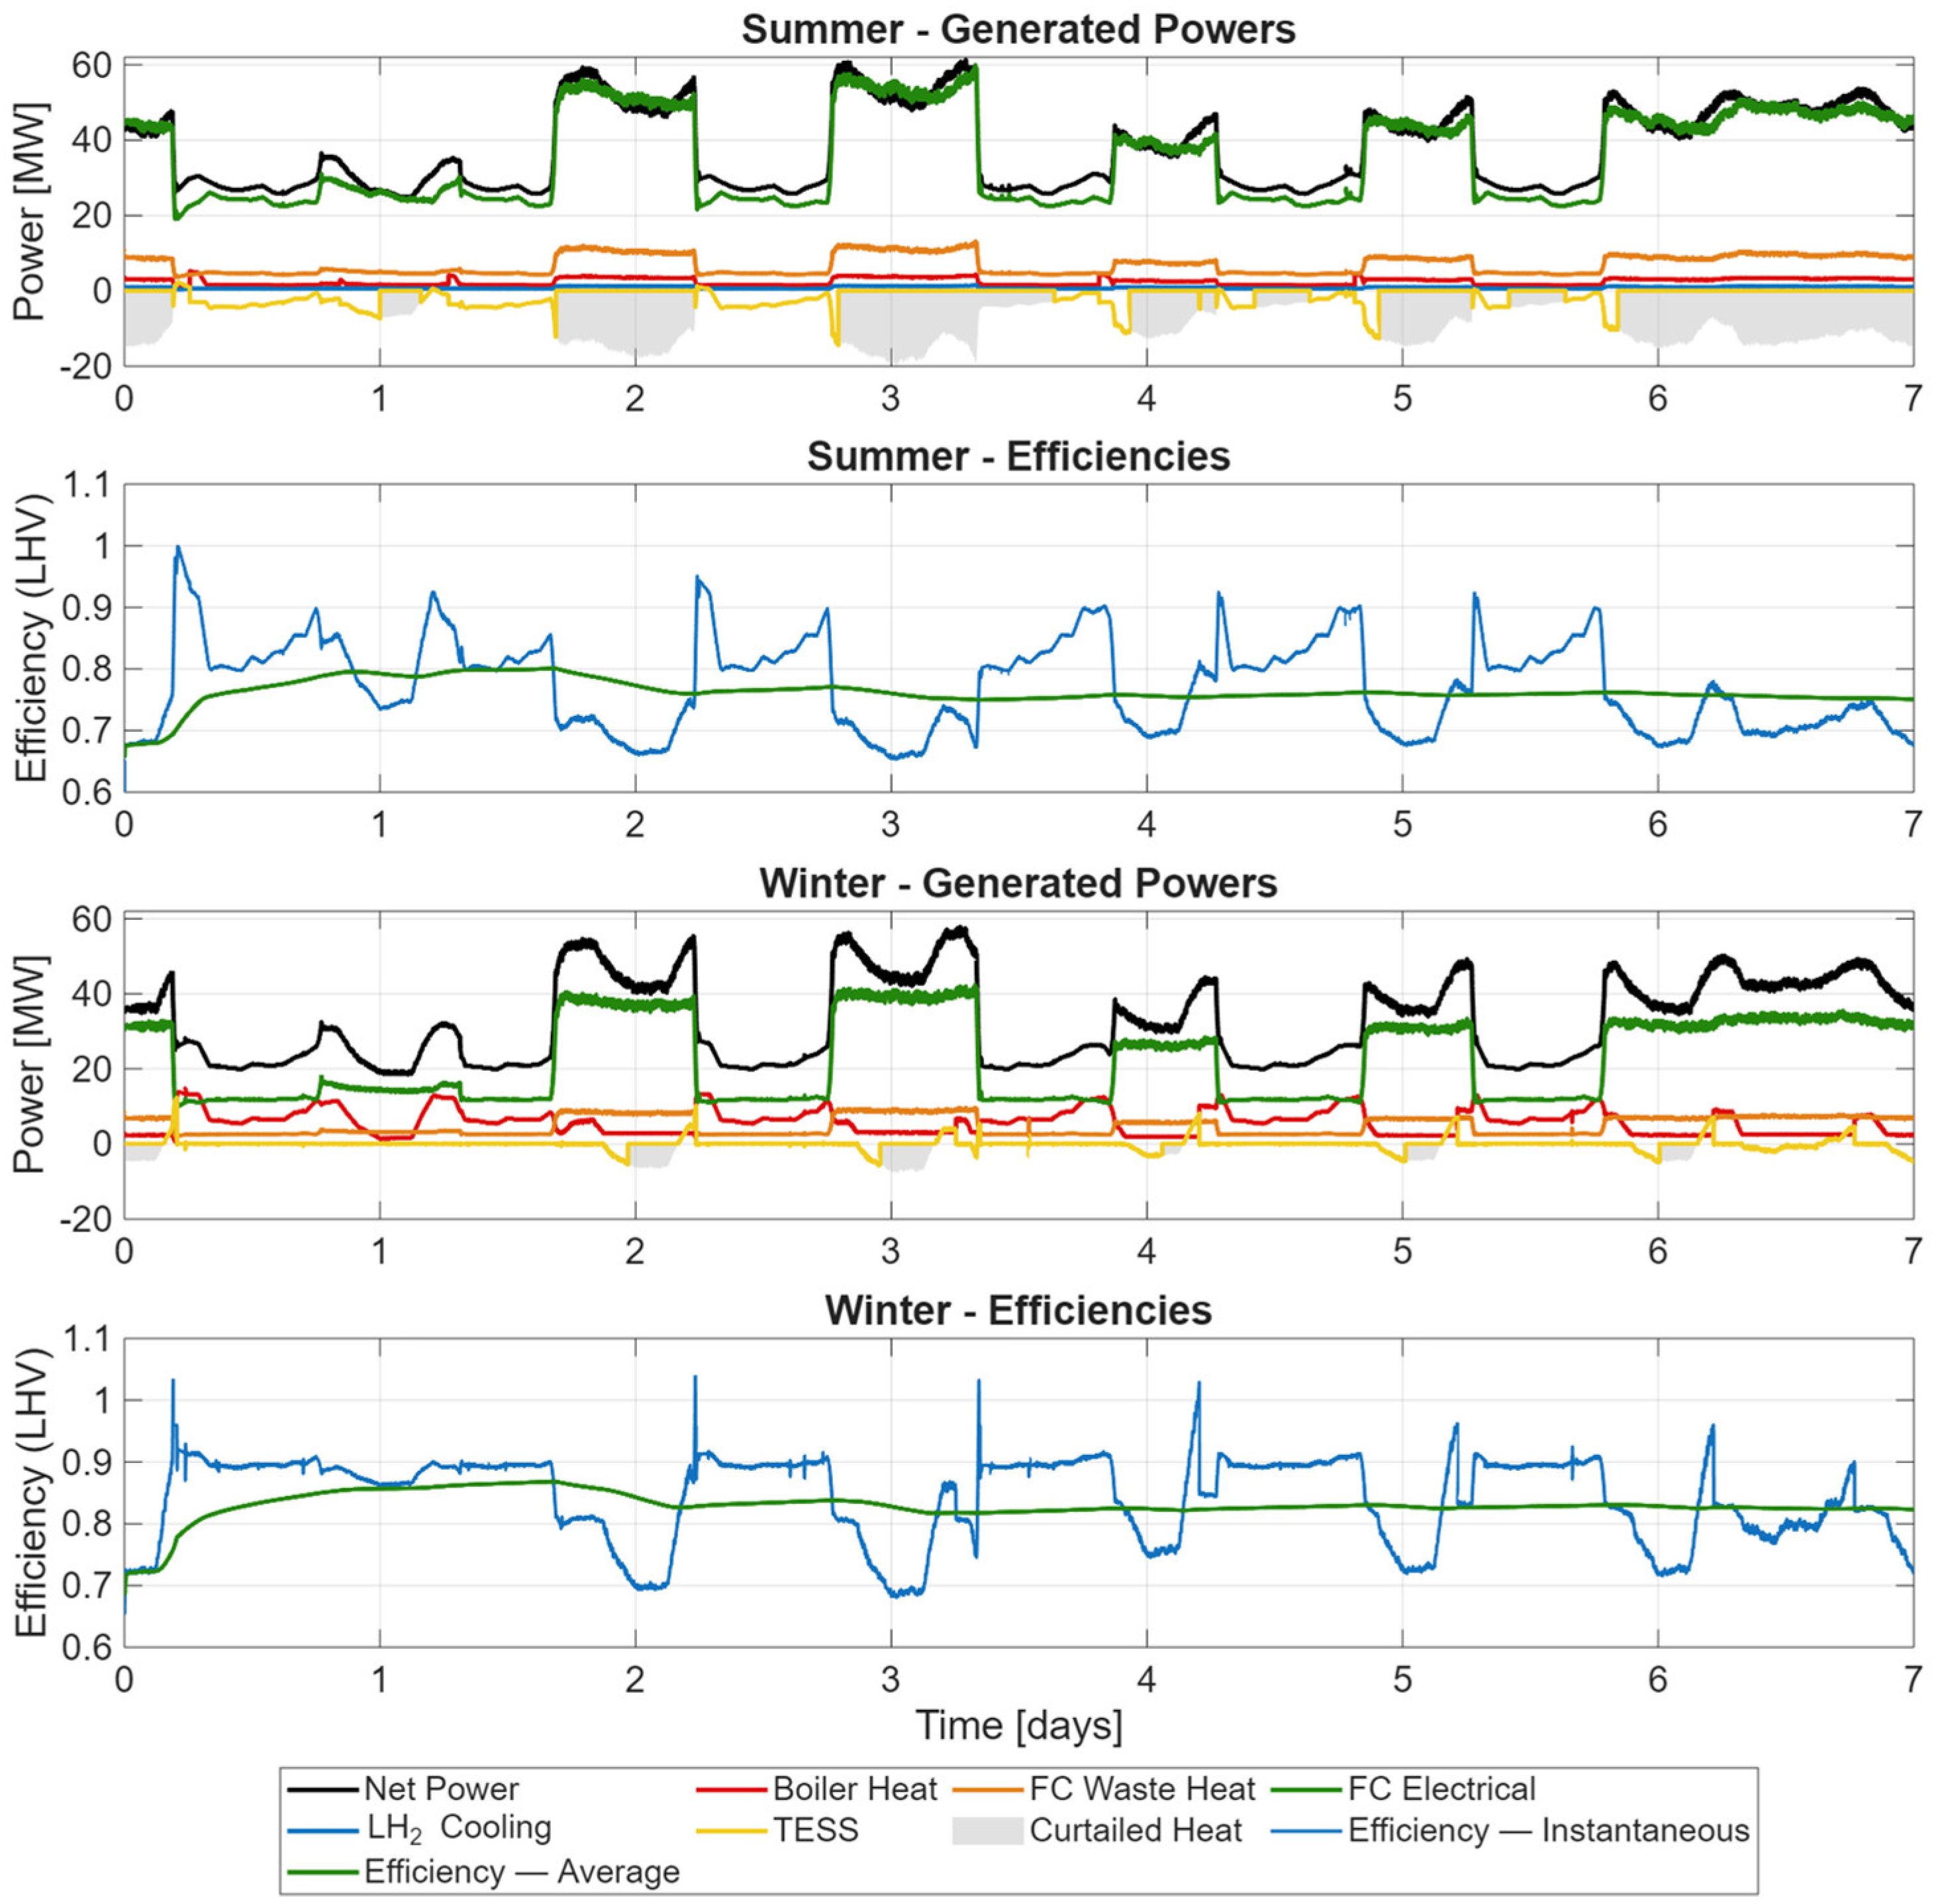
Figure 8 presents the simulated power generation and corresponding system efficiencies of the hydrogen tri-generation system for both summer and winter operation. Each case shows the dynamic coupling between the PEMFC electrical output, waste-heat recovery, boiler operation, and overall system efficiency on a lower-heating-value (LHV) basis. System efficiency comprises the efficiency of the PEMFC stack as well as catalytic burner, cold energy recovery, TESS and BESS contributions.
The PEMFC system is the central energy source, providing about 25 MW during port operations and 35–50 MW during cruising, with a maximum of 59.7 MW. Given the installed capacity of 76.1 MW, it operates at roughly 78% of its rated capacity at peak and about 50% on average, matching its design point. Waste-heat recovery ranges from 5 MW at low load conditions to 10–15 MW at cruise, as thermal generation scales with electrical output. The hydrogen boiler, fed by the unreacted hydrogen from the PEMFC stacks, provides a steady ~1 MW baseline and up to 5–8 MW during heating peaks. The battery contributes minimally, with outputs below 0.2 MW, serving mainly to stabilize the DC bus.
In the summer scenario, high PEMFC power that coincides with low heating demand conditions causes systematic thermal surpluses. When the TESS reaches full charge, excess heat must be curtailed—up to 18 MW on several occasions. These curtailment periods coincide with the CHP efficiency drops visible in
Figure 8, as waste heat that cannot be used or stored no longer contributes to useful output. Average CHP efficiency reaches ~75%, with instantaneous values typically between 70 and 80% and never below 65%. Minor efficiency increases occur when LH
2 cold-energy recovery provides part of the cooling demand without additional fuel input.
In contrast, during winter operation, higher thermal demand absorbs nearly all waste heat and anode off-gas burner heat, while direct hydrogen fueling of the boiler supplements heating needs. No curtailment occurs, and the TESS dynamically shifts surplus heat from high-output to low-output periods. Overall power plant system efficiency (described in Equation (19)) improves to ~82% on average, with instantaneous peaks occasionally exceeding 100% when the TESS discharges stored energy without requiring new hydrogen input. This apparent “super-efficiency” reflects the contribution of prior stored heat. The hydrogen boiler’s ~110% LHV efficiency further enhances cogeneration performance.
Overall, the seasonal contrast demonstrates the system’s flexibility. In summer, high electrical output leads to unavoidable excess heat and lower total efficiency; in winter, complete heat utilization and TESS assistance raise performance. Compared with conventional marine diesel gensets with heat recovery (55–65% efficiency), the proposed hydrogen-based tri-generation system achieves 75–82%, highlighting the benefits of integrating PEMFC power, waste-heat recovery, hydrogen combustion, and LH2 cooling energy utilization within a unified zero-emission marine energy system.
4.3. Thermal Energy Storage System Dynamics
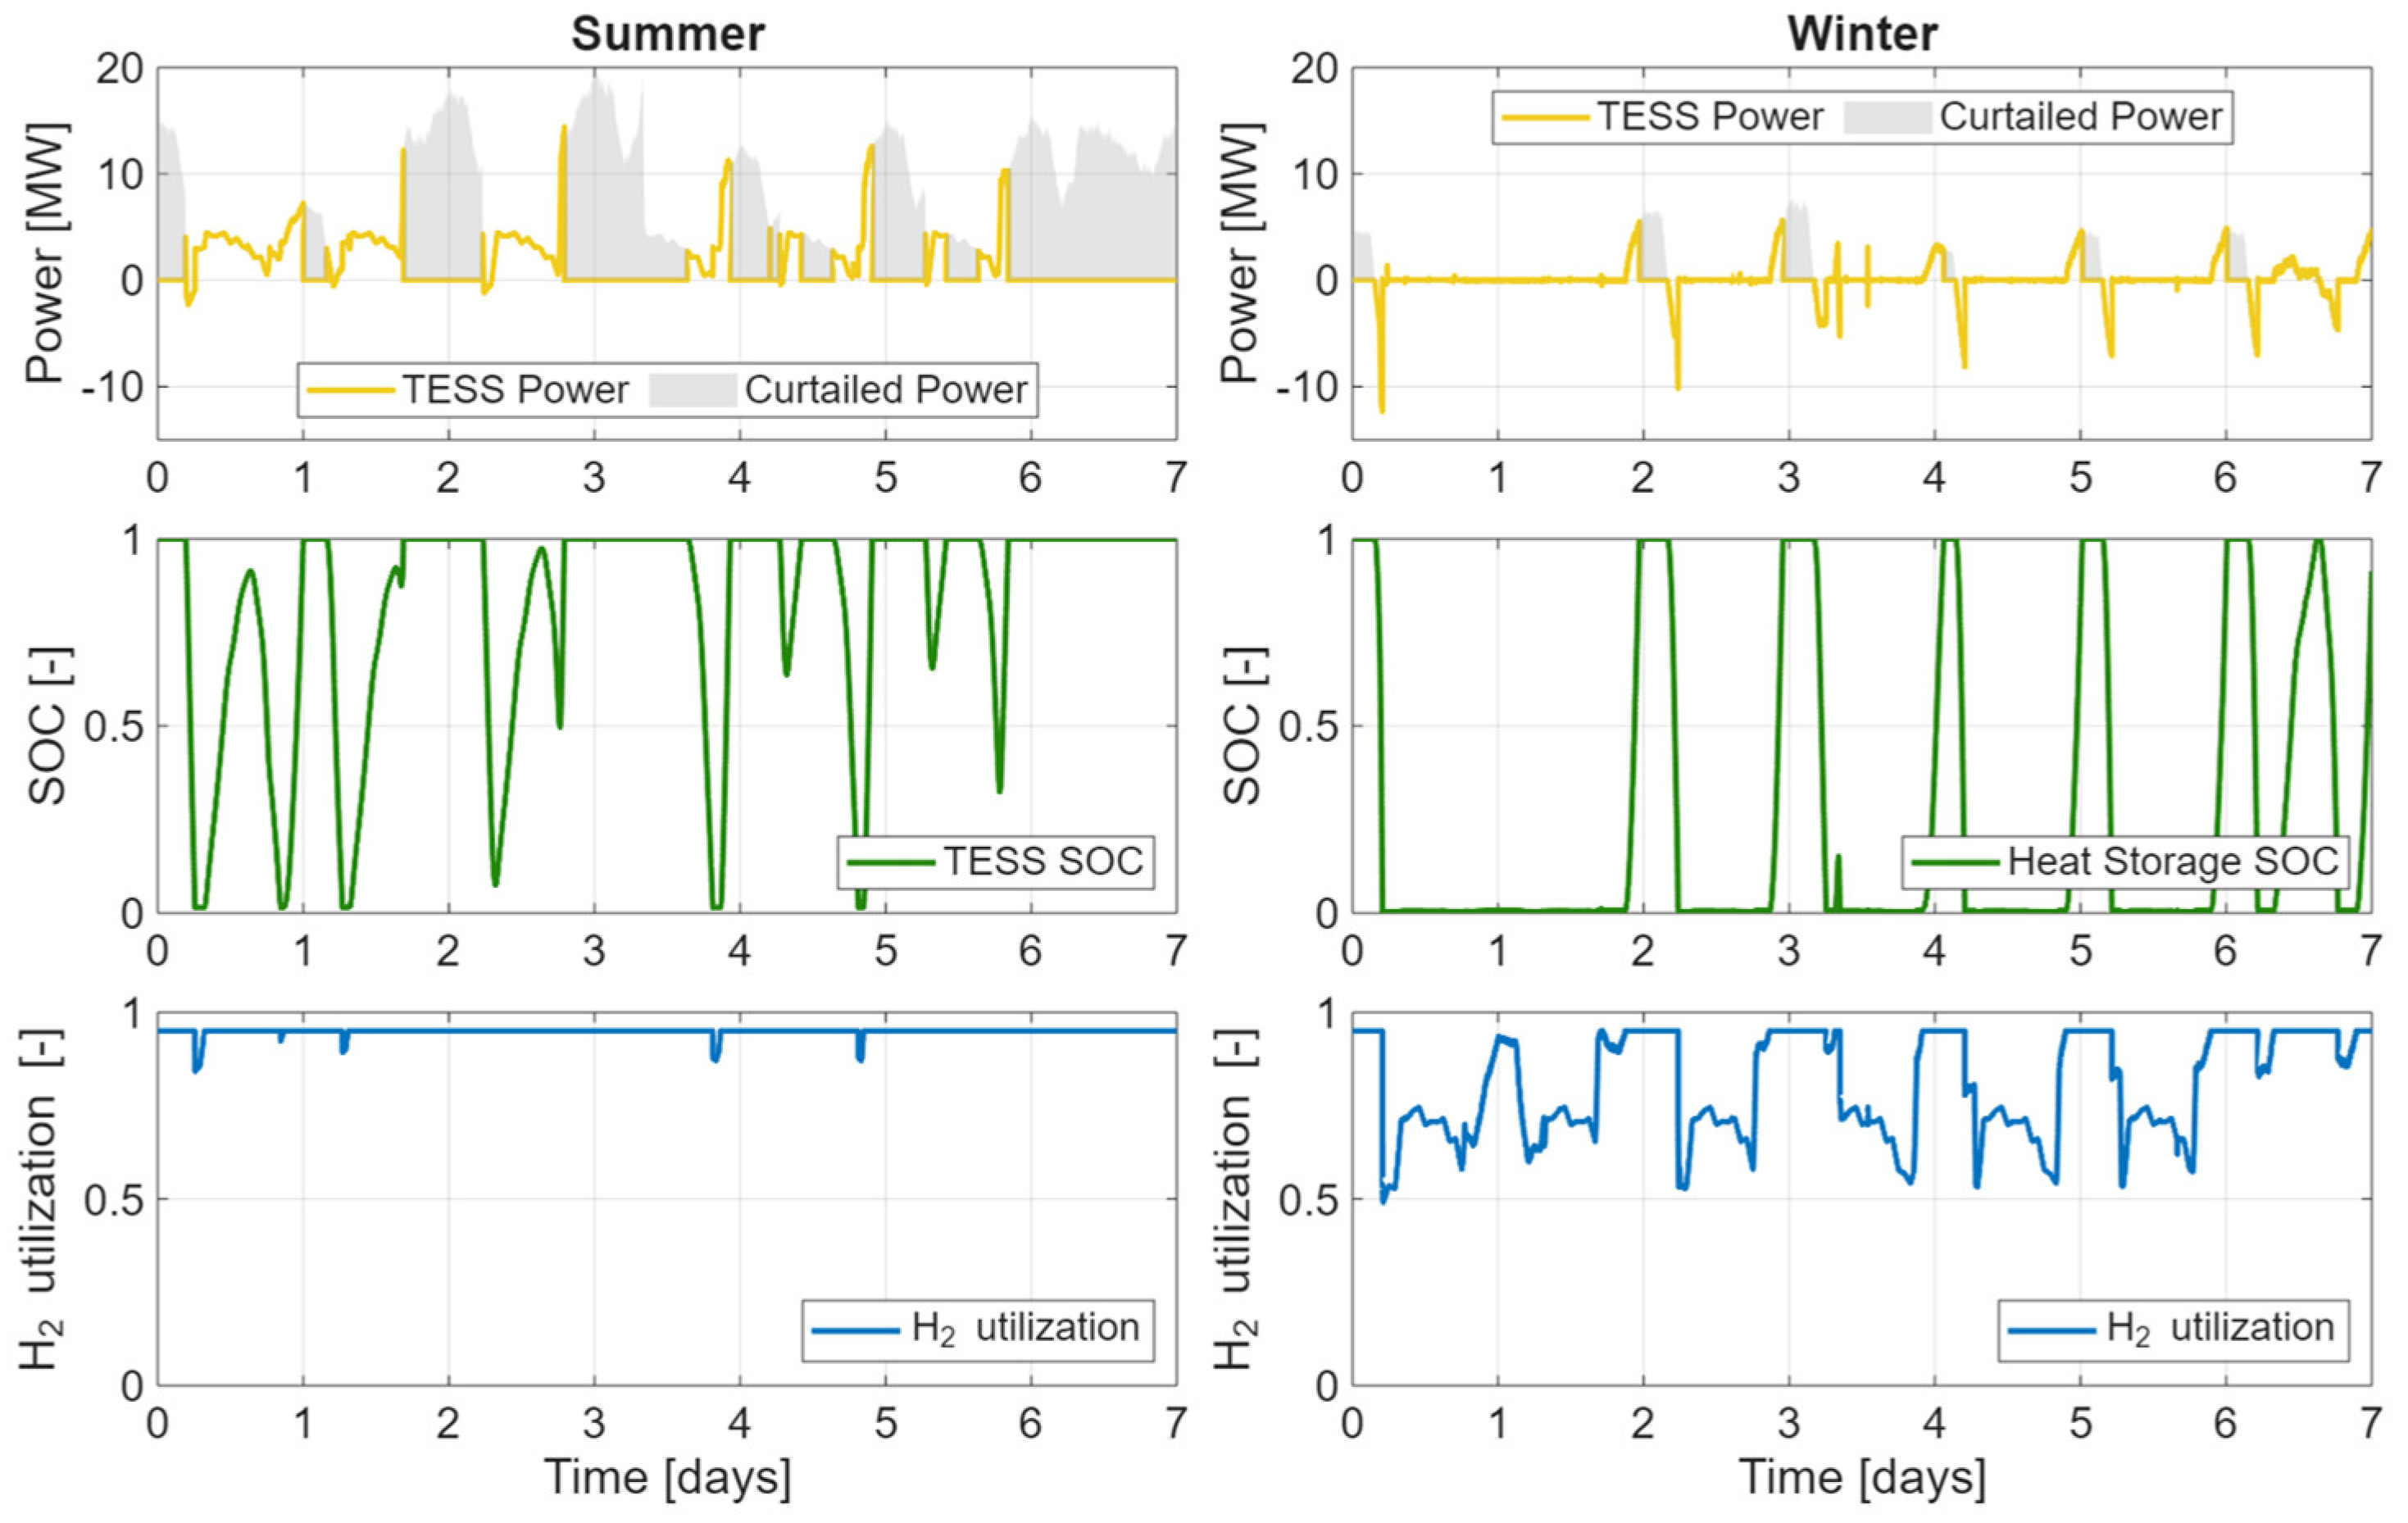
The behavior of the 45 GJ TESS reflects the balance between waste heat recovery, thermal demand, and hydrogen utilization control. As shown in
Figure 9, TESS dynamics are significantly different between summer and winter.
In summer, when electrical demand peaks during cruising, waste heat recovery from the PEMFC reaches its maximum, rapidly charging the TESS. The State of Charge (SOC) frequently rises to 1.0, indicating full storage capacity. When this occurs, heat from the fuel cell is curtailed. This is clearly visible at the beginning of several sailing legs (for example, on Days 2, 4, and 7, where the TESS SOC remains at 1.0 for extended periods and the curtailed heating power spikes above 10 MW. Even with maximum hydrogen utilization (0.95), the thermal output tied to electrical generation forces this curtailment. Because heating thermal demand is low, hydrogen utilization remains nearly constant throughout the week, with very limited modulation. Short periods of SOC depletion occur during early mornings or port stays, when hot water demand peaks and waste heat recovery is low due to the lower operation point of the PEMFC. These rare events trigger a slight decrease in utilization to supply extra boiler heat, but the TESS otherwise spends most of the voyage fully charged.
In winter, the system exhibits much more dynamic cycling. The higher thermal demand causes the TESS to charge during nighttime cruising—when electrical generation and waste heat recovery are higher—and discharge rapidly during port stays. Every morning, the SOC reaches 0, at which point the controller lowers hydrogen utilization to increase the hydrogen content in the anode off-gas, ramping up boiler output to meet the deficit. Curtailment is virtually absent in this scenario since nearly all recovered waste heat is used to cover heating loads.
Overall, this contrasting behavior highlights the seasonal asymmetry of the system: summer operation is characterized by thermal surpluses and curtailment, while winter relies on intensive thermal storage cycling and dynamic hydrogen utilization control. These interactions play a central role in the overall thermal system dynamics and ship efficiency, underscoring the potential to improve summer operation through strategies that better utilize excess heat.
4.4. Battery Energy Storage System Dynamics
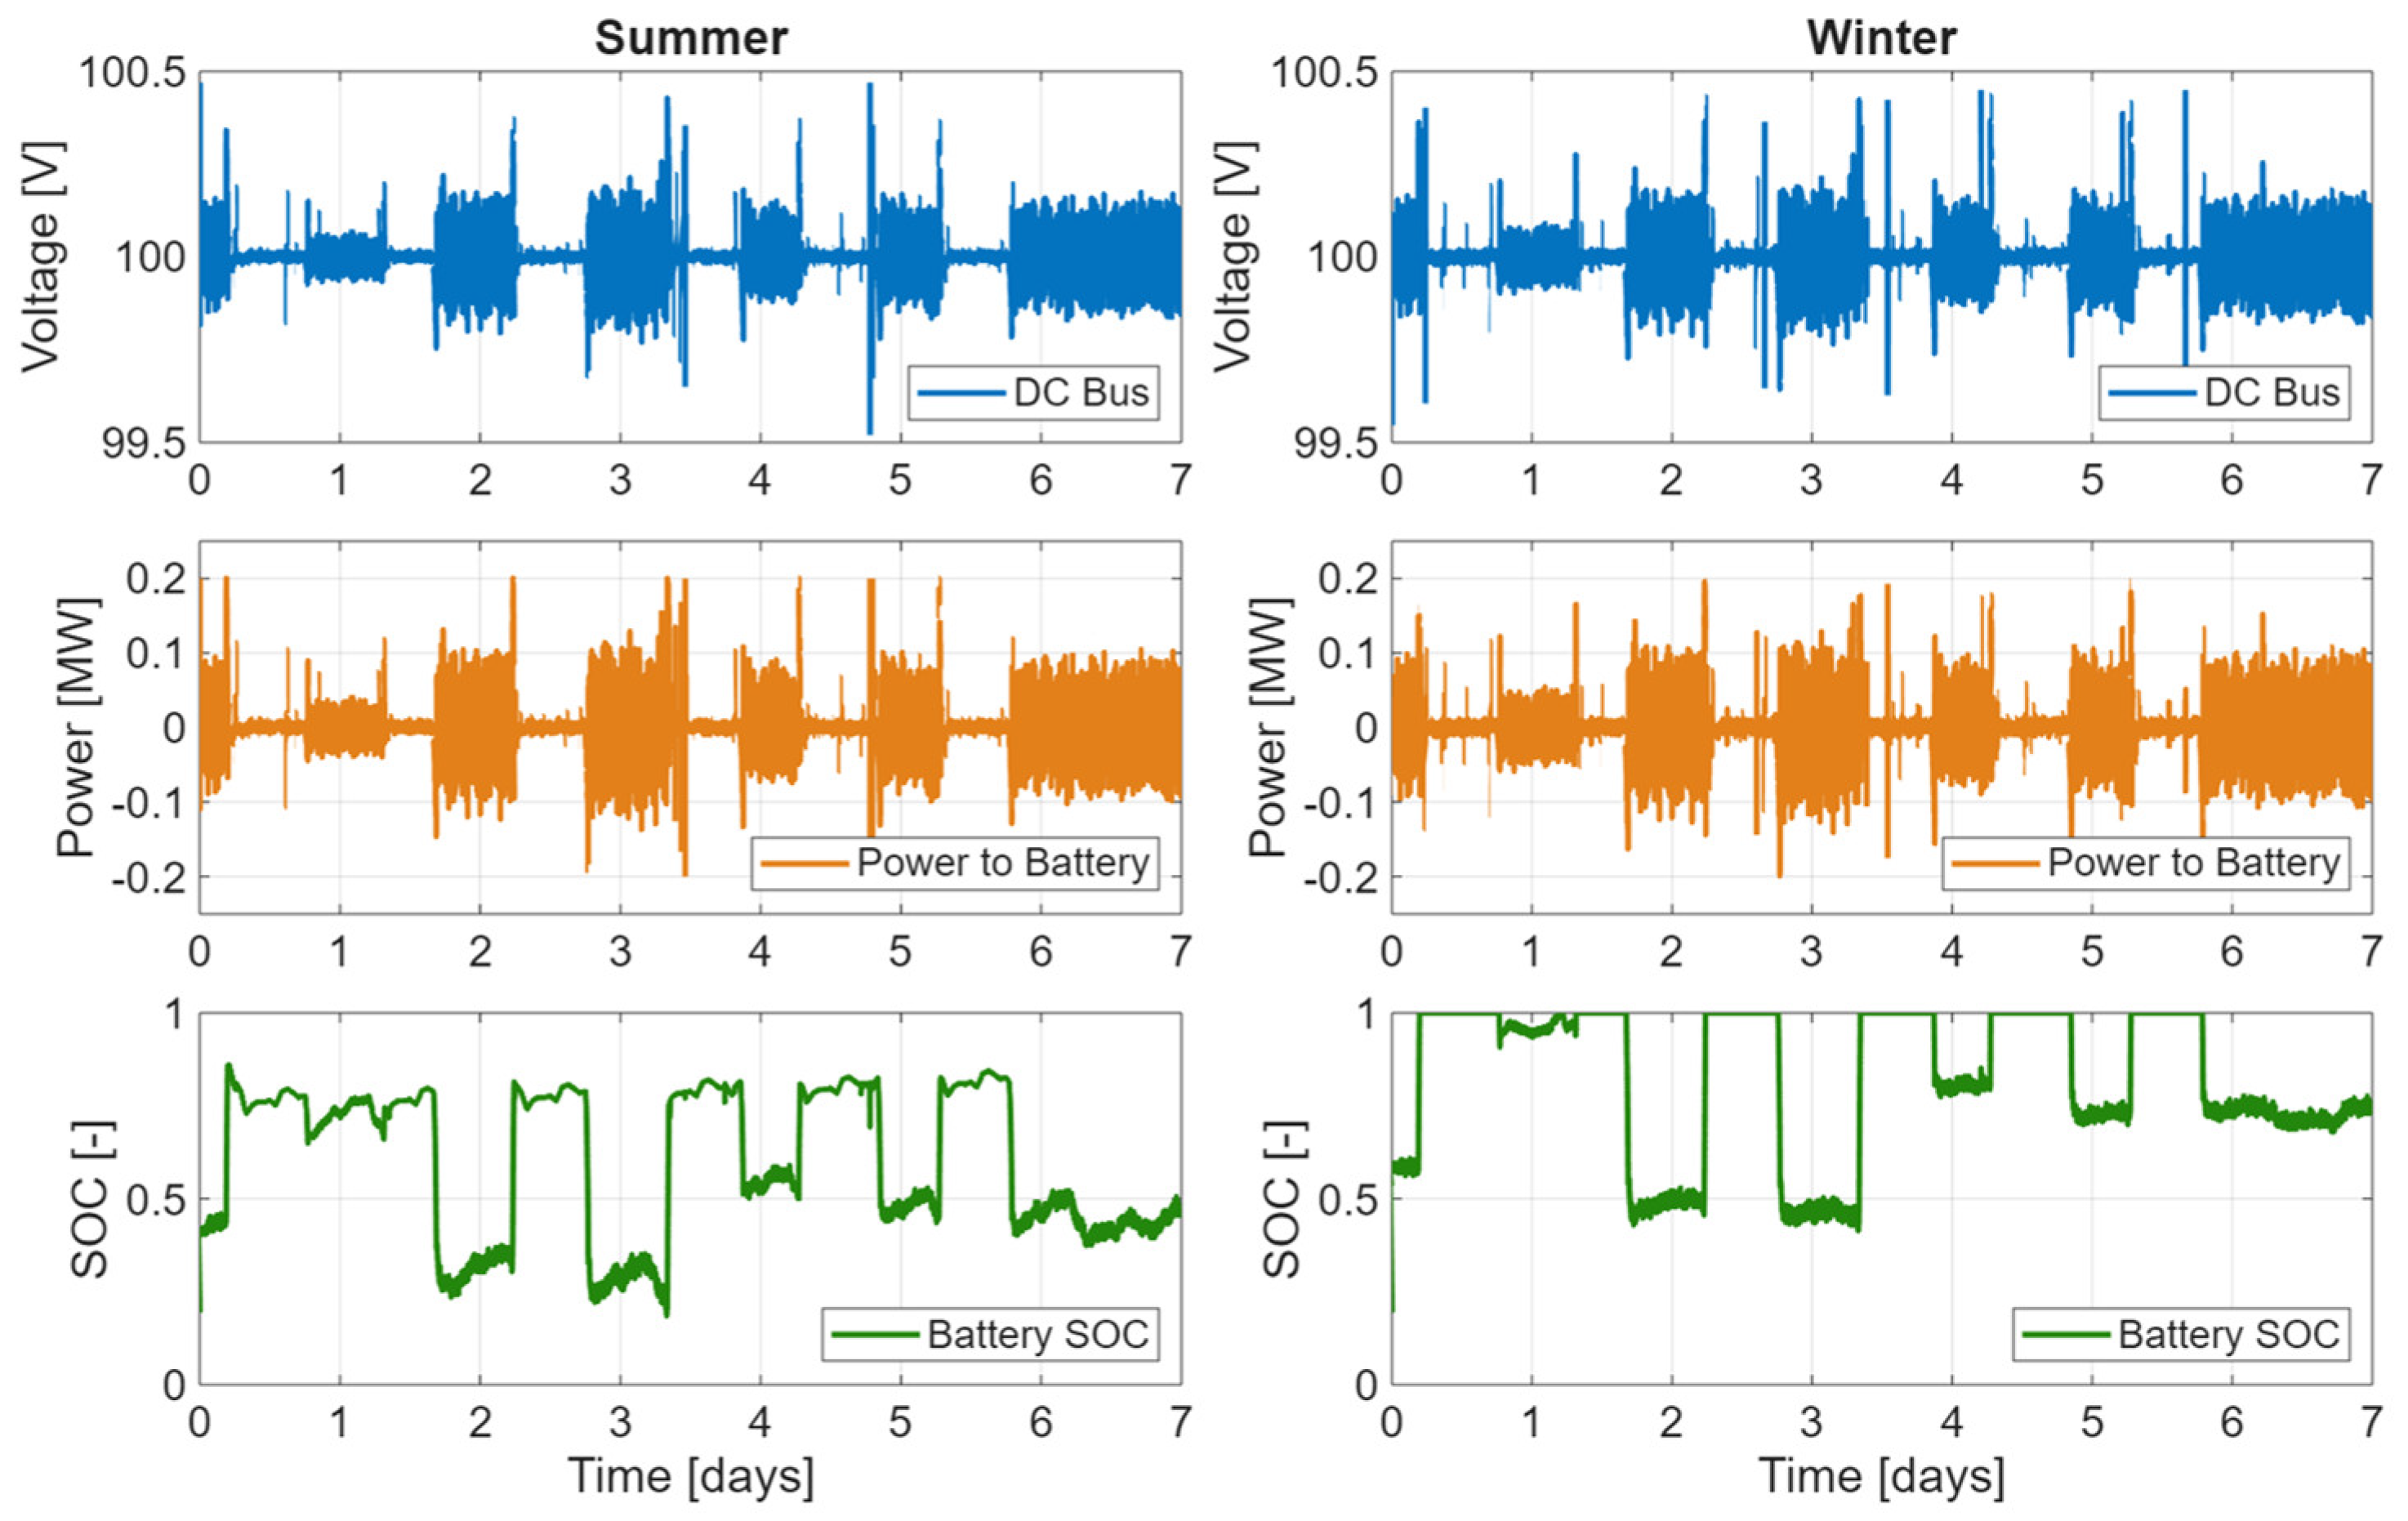
The BESS serves primarily as a DC-bus stabilization device within the tri-generation system rather than a significant power source at any particular time. As shown in
Figure 10, the 300 kWh lithium-ion battery buffers rapid load variations that the PEMFC stacks cannot follow due to their limited ramp rate, maintaining stable system operation.
The DC bus voltage remains tightly regulated between 99.5 V and 100.5 V, with fluctuations below ±0.5% of the nominal value. These small deviations align with rapid propulsion power changes.
Battery power does not exceed ±0.2 MW, although it is a significant power flow relative to its capacity, indicating that it is properly sized for transient management rather than for load shifting. Battery SOC fluctuates between 30% and 100%, following short, frequent charge–discharge cycles. Summer exhibits slightly sharper fluctuations due to higher electrical loads and transients, whereas winter shows smoother patterns reflecting lower average electrical demand and transients.
While the BESS contribution to total energy is small, it plays a critical role in voltage stabilization, protecting the PEMFC from rapid power ramps and maintaining reliable DC = bus operation. These results confirm that a modest-capacity battery can effectively provide short-term power buffering in marine PEMFC-based power generation systems, avoiding unnecessary oversizing and preserving space and weight.
4.5. Hydrogen Consumption and Shore-to-Ship Power Integration
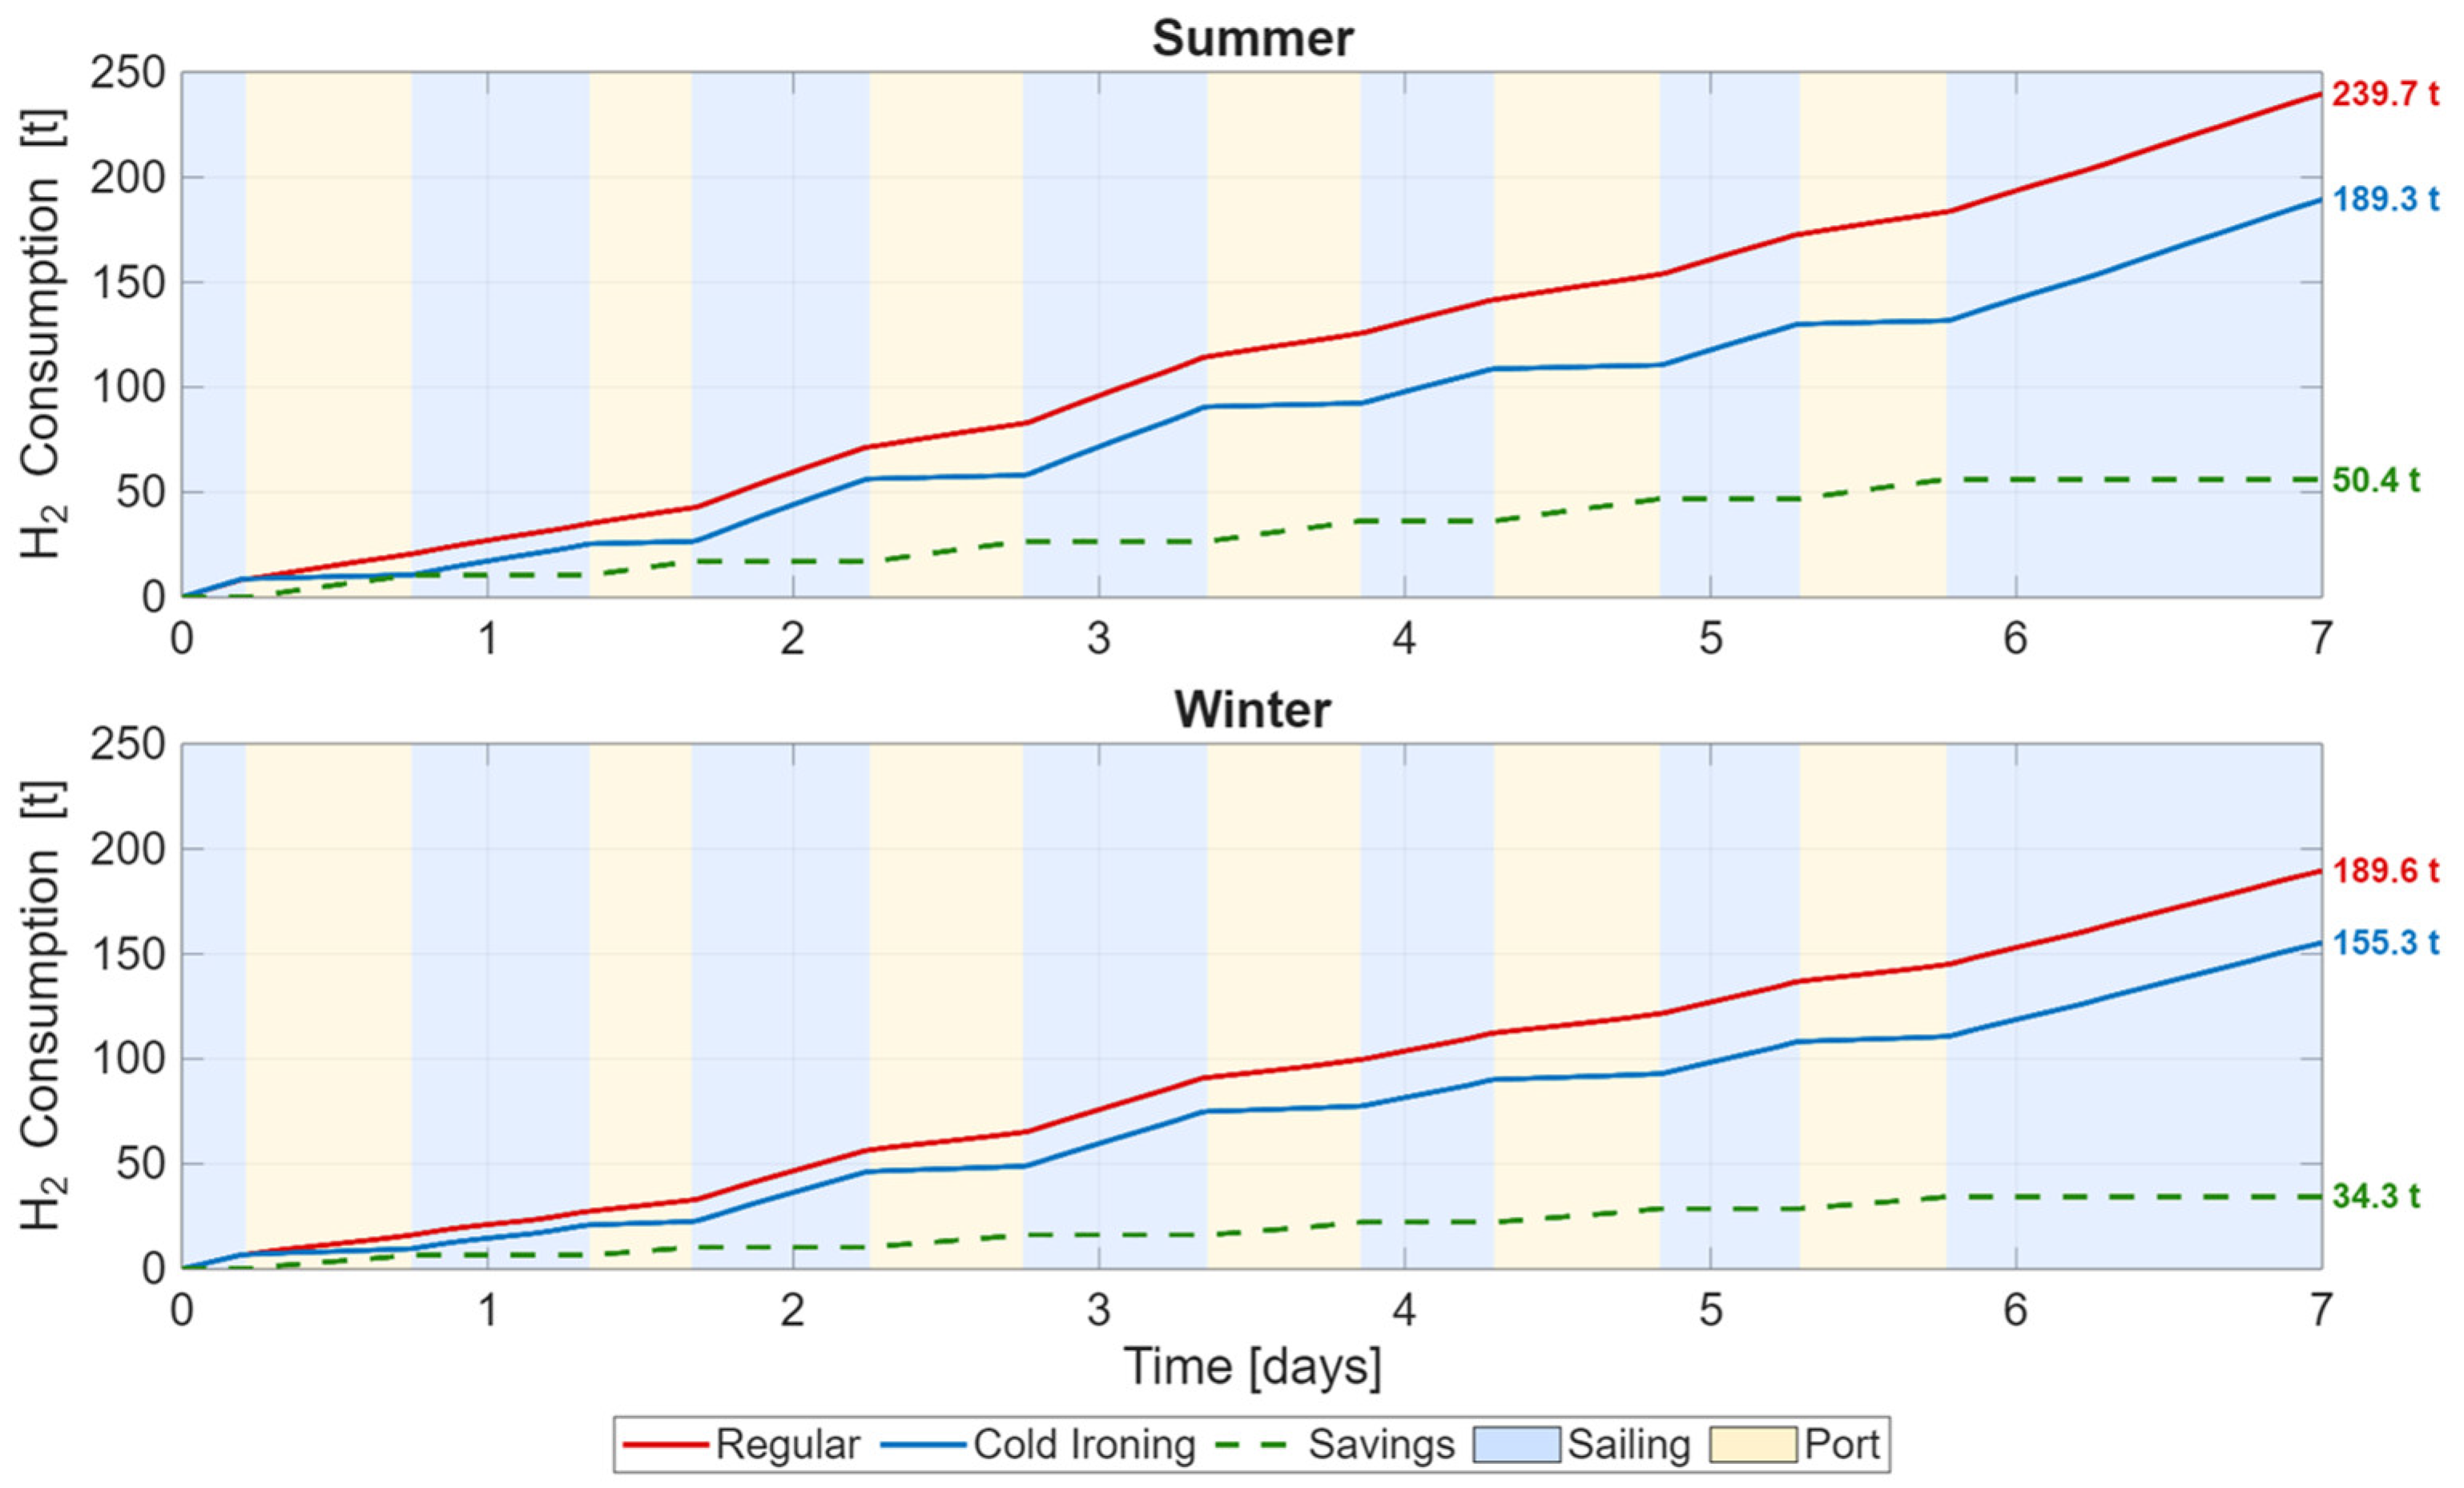
In summer, utilization stayed near 0.95 for most of the voyage, reflecting high recovered heat for low thermal demands; burner activation was limited to four brief instances when TESS depleted. Total consumption was 239,724 kg (34,246 kg/day, 153.5 kg/NM, 1427 kg/h average, including berths), peaking at 0.73 kg/s.
Winter fuel requirements are lower, driven by lower power demands and higher efficiency operation: 189,587 kg for the 7-day route (27,084 kg/day, 121.4 kg/NM), with peaks at 0.56 kg/s. Lower utilization shifted ~10–15% more energy to burning, contributing to higher system efficiency.
The analysis also considered shore-to-ship (cold ironing) integration during port stays. Cruise vessels typically spend ~40% of their operating time docked, during which propulsion loads are zero, but hotel loads remain. The fuel consumption is shown in
Figure 11:
While the model has assumed only 80% of the hotel load to be powered from the shore, the results show substantial benefits in terms of LH2 consumption.
Summer: Reductions of up to 21.0% in hydrogen consumption (≈50.4 t of LH2 saved over the 7-day route).
Winter: While the absolute savings are lower (~34 t LH2), relative savings are similar to the summer scenario (~18.1% fuel savings due to cold-ironing).
By eliminating in-port consumption, the required hydrogen storage volume and weekly bunkering frequency could be potentially reduced by around 20%. Shore power is therefore not merely a complementary measure, but a critical enabler for practical deployment, reducing both operational costs and tank sizing constraints.
Table 7 summarizes these results.
4.6. System Size Estimation and Onboard Integration
The volumetric characteristics of the diesel-based
Oasis of the Seas’ power plant and HFO storage, along with the estimated volumetric requirements for the proposed hydrogen tri-generation system, are summarized in
Table 3 and
Table 4, respectively.
As detailed in the previous section, the simulation results provide the LH
2 consumption for the operational scenarios analyzed. To estimate the required tank capacity, the summer scenario is used, as it represents the worst-case fuel demand. Assuming an LH
2 storage system density of 55 kg/m
3 [
67], the required tank volume for a one-week range plus a 30% reserve is approximately 5660 m
3. Extending the range to two weeks increases the required volume to 11,320 m
3, which is about 66% larger than the current HFO storage volume. However, if shore-to-ship power is implemented, the required LH
2 tank volume decreases to 8950 m
3, significantly improving the feasibility of such a zero-emissions propulsion system and fuel integration into a cruise ship.
A comparison between the estimated volumes required for the existing diesel-based and proposed hydrogen-based systems is presented in
Table 8:
The total volume required for the hydrogen tri-generation system remains comparable to that of the current HFO-based installation. The PEMFC plant is more compact and energy-dense than the diesel generator rooms, freeing up internal space and simplifying system arrangement. However, this benefit is offset by the lower volumetric energy density of an LH2 storage system compared to HFO, which makes fuel storage the main spatial limitation.
For a two-week range, the hydrogen system is about 25% larger than the diesel configuration. However, with shore-to-ship power, the total volume is comparable to the current diesel-based power plant, resulting in an essentially equivalent volumetric footprint.
Thus, shore-to-ship power is a critical enabler for the deployment of hydrogen systems in large cruise vessels. By reducing the onboard hydrogen storage requirement, it balances the volumetric penalty of LH2 storage systems, facilitates integration into existing ship layouts, and enhances operational flexibility.
For new-builds, dedicated compartments for LH2 storage and auxiliaries can be incorporated during design, whereas for retrofits, the availability of shore power may ultimately determine the technical and spatial viability of hydrogen integration.
4.7. Limitations of the Work
While the results of this study demonstrate the feasibility and operational effectiveness of the proposed hydrogen tri-generation system, several limitations must be acknowledged:
First, the energy demand profiles used in the simulations were extrapolated from data obtained for a smaller-sized cruise ship. Although this approach provides a reasonable approximation of typical propulsion and hotel loads, the real load profiles may differ from the extrapolations.
Second, this work is a theoretical system-level analysis that does not account for practical engineering constraints. Factors such as equipment layout, safety systems, redundancy, ventilation, and regulatory compliance are not considered.
Third, degradation and aging effects are not modeled. PEMFC performance decay and energy storage cycling stability are neglected, and results should therefore be interpreted as nominal design-point estimates rather than lifetime predictions.
Fourth, the study does not include an economic analysis. The capital and operational cost implications, hydrogen price sensitivity, port infrastructure requirements, and overall cost competitiveness compared to alternative fuels were not assessed. Incorporating these aspects will be essential for guiding future commercial and policy decisions.
Fifth, the component models, including the thermal and control subsystems, are aggregated representations. While they effectively capture system interactions, they do not reflect detailed mechanical design constraints such as piping layouts, heat exchanger sizing, pressure drops, etc. Similarly, the control strategy is simplified for dynamic stability rather than hardware implementation.
Finally, while the model incorporates a shore-to-ship power connection (cold ironing) during port stays, it is modeled in a simplified way and does not consider operational scheduling, grid infrastructure constraints, or cost optimization.
5. Summary and Conclusions
This study developed a dynamic modeling framework for a hydrogen-fueled tri-generation system for zero-emission cruise ships. The system integrates PEM fuel cells, liquid hydrogen storage, a hydrogen burner, and thermal and cold energy recovery units coupled with a thermal energy storage system. By coupling the electrical and thermal subsystems, the model captures the dynamic interaction between propulsion demand, hotel loads, and waste-heat utilization along realistic voyage profiles.
Results show that the proposed power plant can reliably provide both propulsion and hotel power with high efficiency and stable operation. Under nominal conditions, the tri-generation system achieves electrical efficiencies above 50% and total cogeneration efficiencies up to 82% in winter when waste heat is fully utilized. The hydrogen burner plays a critical role in maintaining energy balance during high heating demand, while the TESS buffers temporal mismatches between heat generation and demand, reducing thermal curtailment.
Seasonal analyses highlight the system’s operational flexibility. In winter, higher thermal demand increases boiler use and overall efficiency; in summer, it is LH2 cold energy recovery that reduces fuel consumption. Total LH2 consumption is 239.7 t/week in summer and 189.6 t/week in winter, due to higher thermal load share and cogeneration efficiency.
The integration of shore-to-ship power during port stays cuts hydrogen consumption by 21.0% in summer (≈50 t/week) and by 18.1% in winter (≈34 t/week). Beyond reducing operational costs, shore power reduces LH2 storage requirements and extends refueling intervals, representing a critical enabler for the practical deployment of zero-emission cruise ships.
The system size estimation confirms the feasibility of the system on large ships. The tri-generation power plant is compact (~1300 m3) compared to conventional diesel power plants (~3200 m3). The main volumetric constraint is LH2 storage, requiring ~11,300 m3 for two weeks of autonomy (including a 30% reserve), decreasing to ~9000 m3 with shore-to-ship power. The total combined volume (~10,250 m3) is then comparable to that of existing diesel systems (~10,000 m3).
Overall, the results demonstrate that a hydrogen-based tri-generation system can feasibly replace conventional marine diesel plants while achieving zero in-port and in-transit emissions. The combination of high efficiency, shore-power integration, and manageable storage volume confirms the technical viability of liquid hydrogen as a primary energy carrier for next-generation cruise ships.
6. Future Work
A key next step in this research will be to extend the model to simulate alternative low-emissions fuels, particularly ammonia and methanol, which, along with liquid hydrogen, are considered the most promising energy carriers for maritime decarbonization. Ammonia and methanol offer higher volumetric energy densities than liquid hydrogen, potentially reducing storage volume and easing onboard integration and bunkering logistics, while maintaining compatibility with similar tri-generation architectures.
The model should incorporate reformer dynamics, conversion efficiencies, and emissions impacts, enabling a systematic comparison of liquid hydrogen, ammonia, and methanol under identical operational scenarios. This will allow for evaluating trade-offs between energy efficiency, infrastructure compatibility, and environmental performance.
In parallel, future work should focus on improving model fidelity through the inclusion of uncertainty and sensitivity analyses, as well as degradation and aging models for PEM fuel cells and energy storage systems. Acquiring real time-resolved power demand data from operating cruise ships will be essential to refine the dynamic load representation and to better validate simulated propulsion and hotel load profiles, while allowing the identification of temperature optimization strategies to enhance system reliability and durability.
Further work should also address practical integration and safety considerations, including detailed assessment of component layout, safety clearances, ventilation requirements, hydrogen dispersion behavior, and sensor placement optimization in enclosed ship spaces. Compliance with applicable maritime safety regulations and classification society guidelines will be critical for practical deployment.
Coupled with techno-economic and spatial feasibility analyses, these developments will provide a good and thorough understanding of how different zero- and low-carbon fuels can support the transition to large-scale, zero-emission cruise ships.