Article

Techno-Economic Assessment of Integrated CO2 Liquefaction and Waste Energy Recovery Using Low-GWP Zeotropic Mixtures for Maritime Applications


by
Luis Alfonso Díaz-Secades
1,*,
Aitor Nicolás Fernández Álvarez
1,
Raquel Martínez Martínez
1,
Pablo A. Rico Lázaro
1,
Jonas W. Ringsberg
2 and
C. Guedes Soares
3
1
Department of Marine Science and Technology, University of Oviedo, 33003 Oviedo, Spain
2
Department of Mechanics and Maritime Sciences, Division of Marine Technology, Chalmers University of Technology, SE-41296 Gothenburg, Sweden
3
Centre for Marine Technology and Ocean Engineering (CENTEC), Instituto Superior Técnico, Universidade de Lisboa, Av. Rovisco Pais, 1049-001 Lisboa, Portugal
*
Author to whom correspondence should be addressed.
J. Mar. Sci. Eng. 2026, 14(5), 420; https://doi.org/10.3390/jmse14050420
Submission received: 28 January 2026 / Revised: 15 February 2026 / Accepted: 20 February 2026 / Published: 25 February 2026

Abstract

The increasing regulatory pressure on the maritime sector to decarbonize, driven in part by market-based mechanisms at the European level, is accelerating the development of onboard carbon management and energy-efficiency solutions. In this context, this study evaluates an integrated architecture that combines a CO2 liquefaction system with organic Rankine cycles. The system captures 66% of the total CO2 emitted by ship engines and is capable of recovering up to 2600.8 kW of energy from onboard hot and cold sources. To identify the most suitable working fluids, an extensive screening of 208 low-GWP zeotropic mixtures is conducted, assessing their thermophysical behavior and energy recovery performance. A detailed thermo-economic assessment is undertaken, including the calculation of CO2-equivalent savings, GHG abatement cost, and payback periods. To account for fuel price variability, probabilistic modelling based on Monte Carlo sampling is applied to estimate the distribution of discounted payback outcomes. The results demonstrate that Novec 649-based zeotropic mixtures combined with the proposed architecture reduce fuel consumption and enhance onboard CO2 management while remaining safe and economically viable across a wide range of operating scenarios.

1. Introduction

Climate change represents a critical challenge for all industries worldwide and is central to the commitments adopted by the parties to the Paris Agreement. Scientific evidence is unequivocal: the rise in global mean temperature from 1850–1900 to 2011–2020 is primarily driven by anthropogenic greenhouse gas (GHG) emissions [1]. In response, regulatory frameworks are becoming increasingly stringent across industrial sectors. In this context, maritime transport currently accounts for approximately 2.89% of global GHG emissions and, in the absence of corrective measures, these emissions are projected to rise significantly over the coming decades [2]. This lack of mitigation, combined with the accelerated decarbonization of other industries, could raise the sector’s contribution to total global emissions to as much as 17% [3].
To address the growing urgency to reduce emissions, regulatory action in the maritime sector has been intensified at both the international and regional levels. The International Maritime Organization (IMO) has introduced a series of measures aimed at enhancing energy performance, most notably the Carbon Intensity Indicator (CII), which evaluates vessel efficiency in grams of carbon dioxide (CO2) per unit of transport work [4,5]. Additionally, IMO is progressing toward market-based mechanisms, including forthcoming Life-Cycle Assessment (LCA) guidelines and the IMO Net-zero Framework, both of which are expected to significantly influence fuel selection and operational strategies across the industry [6,7]. At the European level, regulatory pressure is even more stringent. The EU Monitoring, Reporting and Verification (MRV) system mandates detailed reporting of ship emissions and, following its amendment through Regulation (EU) 2023/957, now extends this requirement to methane (CH4) and nitrous oxide (N2O). Furthermore, the inclusion of maritime transport in the EU Emissions Trading System (EU ETS) constitutes one of the major economic drivers for decarbonization, directly linking ship emissions to greenhouse-gas pricing and thereby creating strong incentives for both operational improvements and the adoption of cleaner technologies [8,9].
These pollution reduction imperatives require the maritime sector not only to transition away from conventional fossil fuels but also to enhance energy efficiency. In the short term, improving a vessel’s efficiency directly lowers CO2 emissions, while in the longer term it provides significant economic benefits, as alternative low-carbon fuels are expected to remain substantially more expensive than their conventional counterparts [10]. To promote the deployment of energy-efficiency solutions, IMO issued the Guidance on Treatment of Innovative Energy Efficiency Technologies, facilitating their integration onboard ships [11]. Beyond solutions such as photovoltaics and wind-assisted propulsion, waste heat recovery has been identified as a promising alternative to generate electrical power from otherwise unused thermal energy.
Several thermodynamic cycles can be adapted to the operational conditions of each individual vessel. For instance, Mondejar et al. [12] reported that onboard Organic Rankine Cycle (ORC) systems recovering engine exhaust gas waste heat can reduce fuel consumption by approximately 10 to 15%, thereby simultaneously advancing decarbonization and operational cost savings. Likewise, Díaz-Secades et al. [13] proposed a waste energy recovery system for an LNG carrier that recovers both waste heat and cold energy, lowering annual fuel consumption and associated CO2, CH4, and N2O emissions, with a total reduction of over 7000 ton of CO2-equivalent. This system achieved an abatement cost below the prevailing EU ETS allowance price, making it more economically attractive than purchasing EU emission allowances.
By increasing the usable energy extracted from fuel, these energy recovery systems can support existing onboard energy demands while also providing additional power for carbon capture and storage (CCS) systems. These technologies are particularly valuable for reducing airborne emissions and enabling the sale or reuse of CO2 in applications such as synthetic fuel production. However, they require significant energy for processes like liquefaction or solvent regeneration. Integrating waste energy recovery systems can supply these additional needs, minimizing any increase in fuel consumption and allowing CCS to capture the majority of CO2 emissions [14].
In addition to conventional emissions from engines, boilers, and incinerators, the use of organic fluids onboard ships is increasingly scrutinized due to their high global warming potential (GWP) [15]. Many shipboard systems including refrigeration, air conditioning, and energy-efficiency technologies such as ORCs rely on these fluids as heat-transfer media to adapt to different thermal energy grades. Historically, chlorofluorocarbons (CFCs), hydrochlorofluorocarbons (HCFCs), and hydrofluorocarbons (HFCs) have been widely employed in thermal systems. However, CFCs and HCFCs were progressively eliminated following the adoption of the Montreal Protocol, and HFCs are currently subject to international phase-down measures due to their elevated GWP [16]. This has driven the search for low-GWP alternatives, including CO2, ammonia (NH3), and hydrocarbons [17,18]. While these alternatives can significantly reduce emissions, each carries trade-offs in flammability and toxicity, making system design and onboard safety critical. This reveals a research gap in the systematic evaluation of ultra-low GWP zeotropic mixtures capable of simultaneously meeting thermodynamic efficiency, onboard safety requirements, and environmental compliance.

1.1. Literature Review

1.1.1. Onboard Carbon Capture, Liquefaction, and Storage

Although many studies position alternative low-carbon fuels as the primary long-term decarbonization pathway for shipping, waste energy recovery and carbon capture are essential complementary strategies for achieving net-zero emissions. Recent technical and economic assessments consistently identify post-combustion capture combined with cryogenic CO2 liquefaction as a promising solution for ship-based carbon management, particularly on LNG fueled vessels [19,20]. A key advantage of this approach lies in the favorable thermodynamic match between the cooling duty required for CO2 liquefaction and the cold energy released during LNG regasification, which can be recovered and utilized to reduce the power demand of the capture system [21].
Although the field is still emerging, several authors have already investigated post-combustion cryogenic carbon capture for marine applications [22]. Awoyomi et al. [23] analyzed the liquefaction of CO2 from a Wärtsilä 9L46DF marine engine by recovering the cold energy available from LNG. Their work also included an economic assessment in which the capture cost is selected as the main economic indicator. The sensitivity assessment indicated that, at a capture rate of 90%, the capture cost does not fall below 117 USD per ton. These results are consistent with the findings of Ros et al. [24], who evaluated a combined process that integrates monoethanolamine solvent absorption with subsequent CO2 liquefaction by utilizing the cold energy released during the regasification of LNG used as fuel. Their study reported a capture cost of 119 Euro per ton (equivalent to 139 USD per ton). More recently, Li et al. [25] performed a simulation study for a 250,000 DWT bulkcarrier fueled by LNG. Their results indicated that the system could capture up to 253 tons of CO2 per voyage, further supporting the technological feasibility of cryogenic carbon capture in marine propulsion.
Taken together, these studies place the technology slightly above the current GHG pricing mechanism for maritime transport, the EU Emission Trading System. However, given their proximity to present carbon market values, the technology could become economically viable in the mid-term [20,26]. Collectively, previous research confirms the technical feasibility of shipboard CO2 capture and liquefaction. Nevertheless, most existing assessments address either capture cost optimization or LNG cold energy utilization independently, without systematically evaluating integration with waste heat recovery architectures, working fluid selection strategies, and evolving maritime regulatory constraints within a unified framework.

1.1.2. Waste Energy Recovery Systems

Beyond the cold energy recovered during LNG regasification, waste heat recovery can supply part of the additional energy required by onboard carbon capture or other auxiliary systems. The organic Rankine cycle has been extensively investigated for the recovery of waste thermal energy across different temperature levels and, when combined with an appropriate working fluid, is capable of exploiting low-grade thermal sources that would otherwise remain unused.
A key determinant of ORC efficiency is the selection of a working fluid that closely matches the temperature profile of the waste energy source [27]. In this context, zeotropic mixtures offer superior thermal matching compared with pure fluids due to their temperature glide during phase change, enabling non-isothermal evaporation and condensation. This behavior reduces exergy destruction in the heat exchangers, ultimately yielding higher power output and overall efficiency [28,29].
Numerous studies have demonstrated the thermodynamic advantages of binary mixtures in waste energy recovery applications. Oyewunmi et al. [30] proposed a decane–butane mixture that reduced the cost per kilowatt by approximately 20 to 30%, a result attributed to enhanced heat transfer and reduced component size. Wang et al. [31] used other zeotropic formulations, including R245fa combined with R141b, and reported optimized thermal and exergy efficiencies of 5.58 and 23.20%, respectively, at the corresponding optimal mixing ratios. Similar gains have been reported for R413A, which can deliver up to 20% higher power output and 16% improvement in overall system efficiency [32]. Li et al. [33] evaluated eight CO2-based binary mixtures for recovering LNG cold energy utilizing an ORC and, through genetic algorithm optimization, demonstrated that such mixtures markedly outperform pure CO2, with CO2-R134a achieving the highest power output of 13.50 kW. All in all, these studies confirm that zeotropic mixtures can substantially improve thermodynamic performance compared with pure fluids. However, most investigations focus primarily on efficiency optimization within isolated ORC configurations, often without addressing maritime-specific constraints such as onboard safety, ultra-low GWP requirements, spatial limitations, or integration with other systems like CCS.
Overall, the selection of zeotropic fluid mixtures that closely match the temperature profile of the energy source is fundamental to maximizing efficiency in maritime ORC applications [34]. Nevertheless, most formulations rely on mixtures that either exhibit high GWP or pose safety concerns on board ships, particularly if used in enclosed spaces [35]. Consequently, a clear research gap remains regarding the suitability of zeotropic mixtures for waste energy recovery in shipboard systems. Comprehensive studies that simultaneously evaluate thermodynamic performance, operational safety, and environmental impact are still lacking, leaving substantial uncertainty about their practical implementation and optimization [36]. In addition, existing studies typically assess carbon capture systems, waste heat recovery, or working fluid optimization in isolation. A fully integrated framework combining onboard CO2 liquefaction, cold and waste heat ORC subsystems, ultra-low GWP zeotropic mixture screening, and techno economic evaluation under maritime regulatory constraints is still missing in the literature. Moreover, few works incorporate probabilistic economic assessment to account for fuel price volatility and carbon pricing mechanisms. Addressing this gap is essential to determine whether integrated energy recovery and carbon management systems can provide regulation resilient solutions for long-term maritime decarbonization.
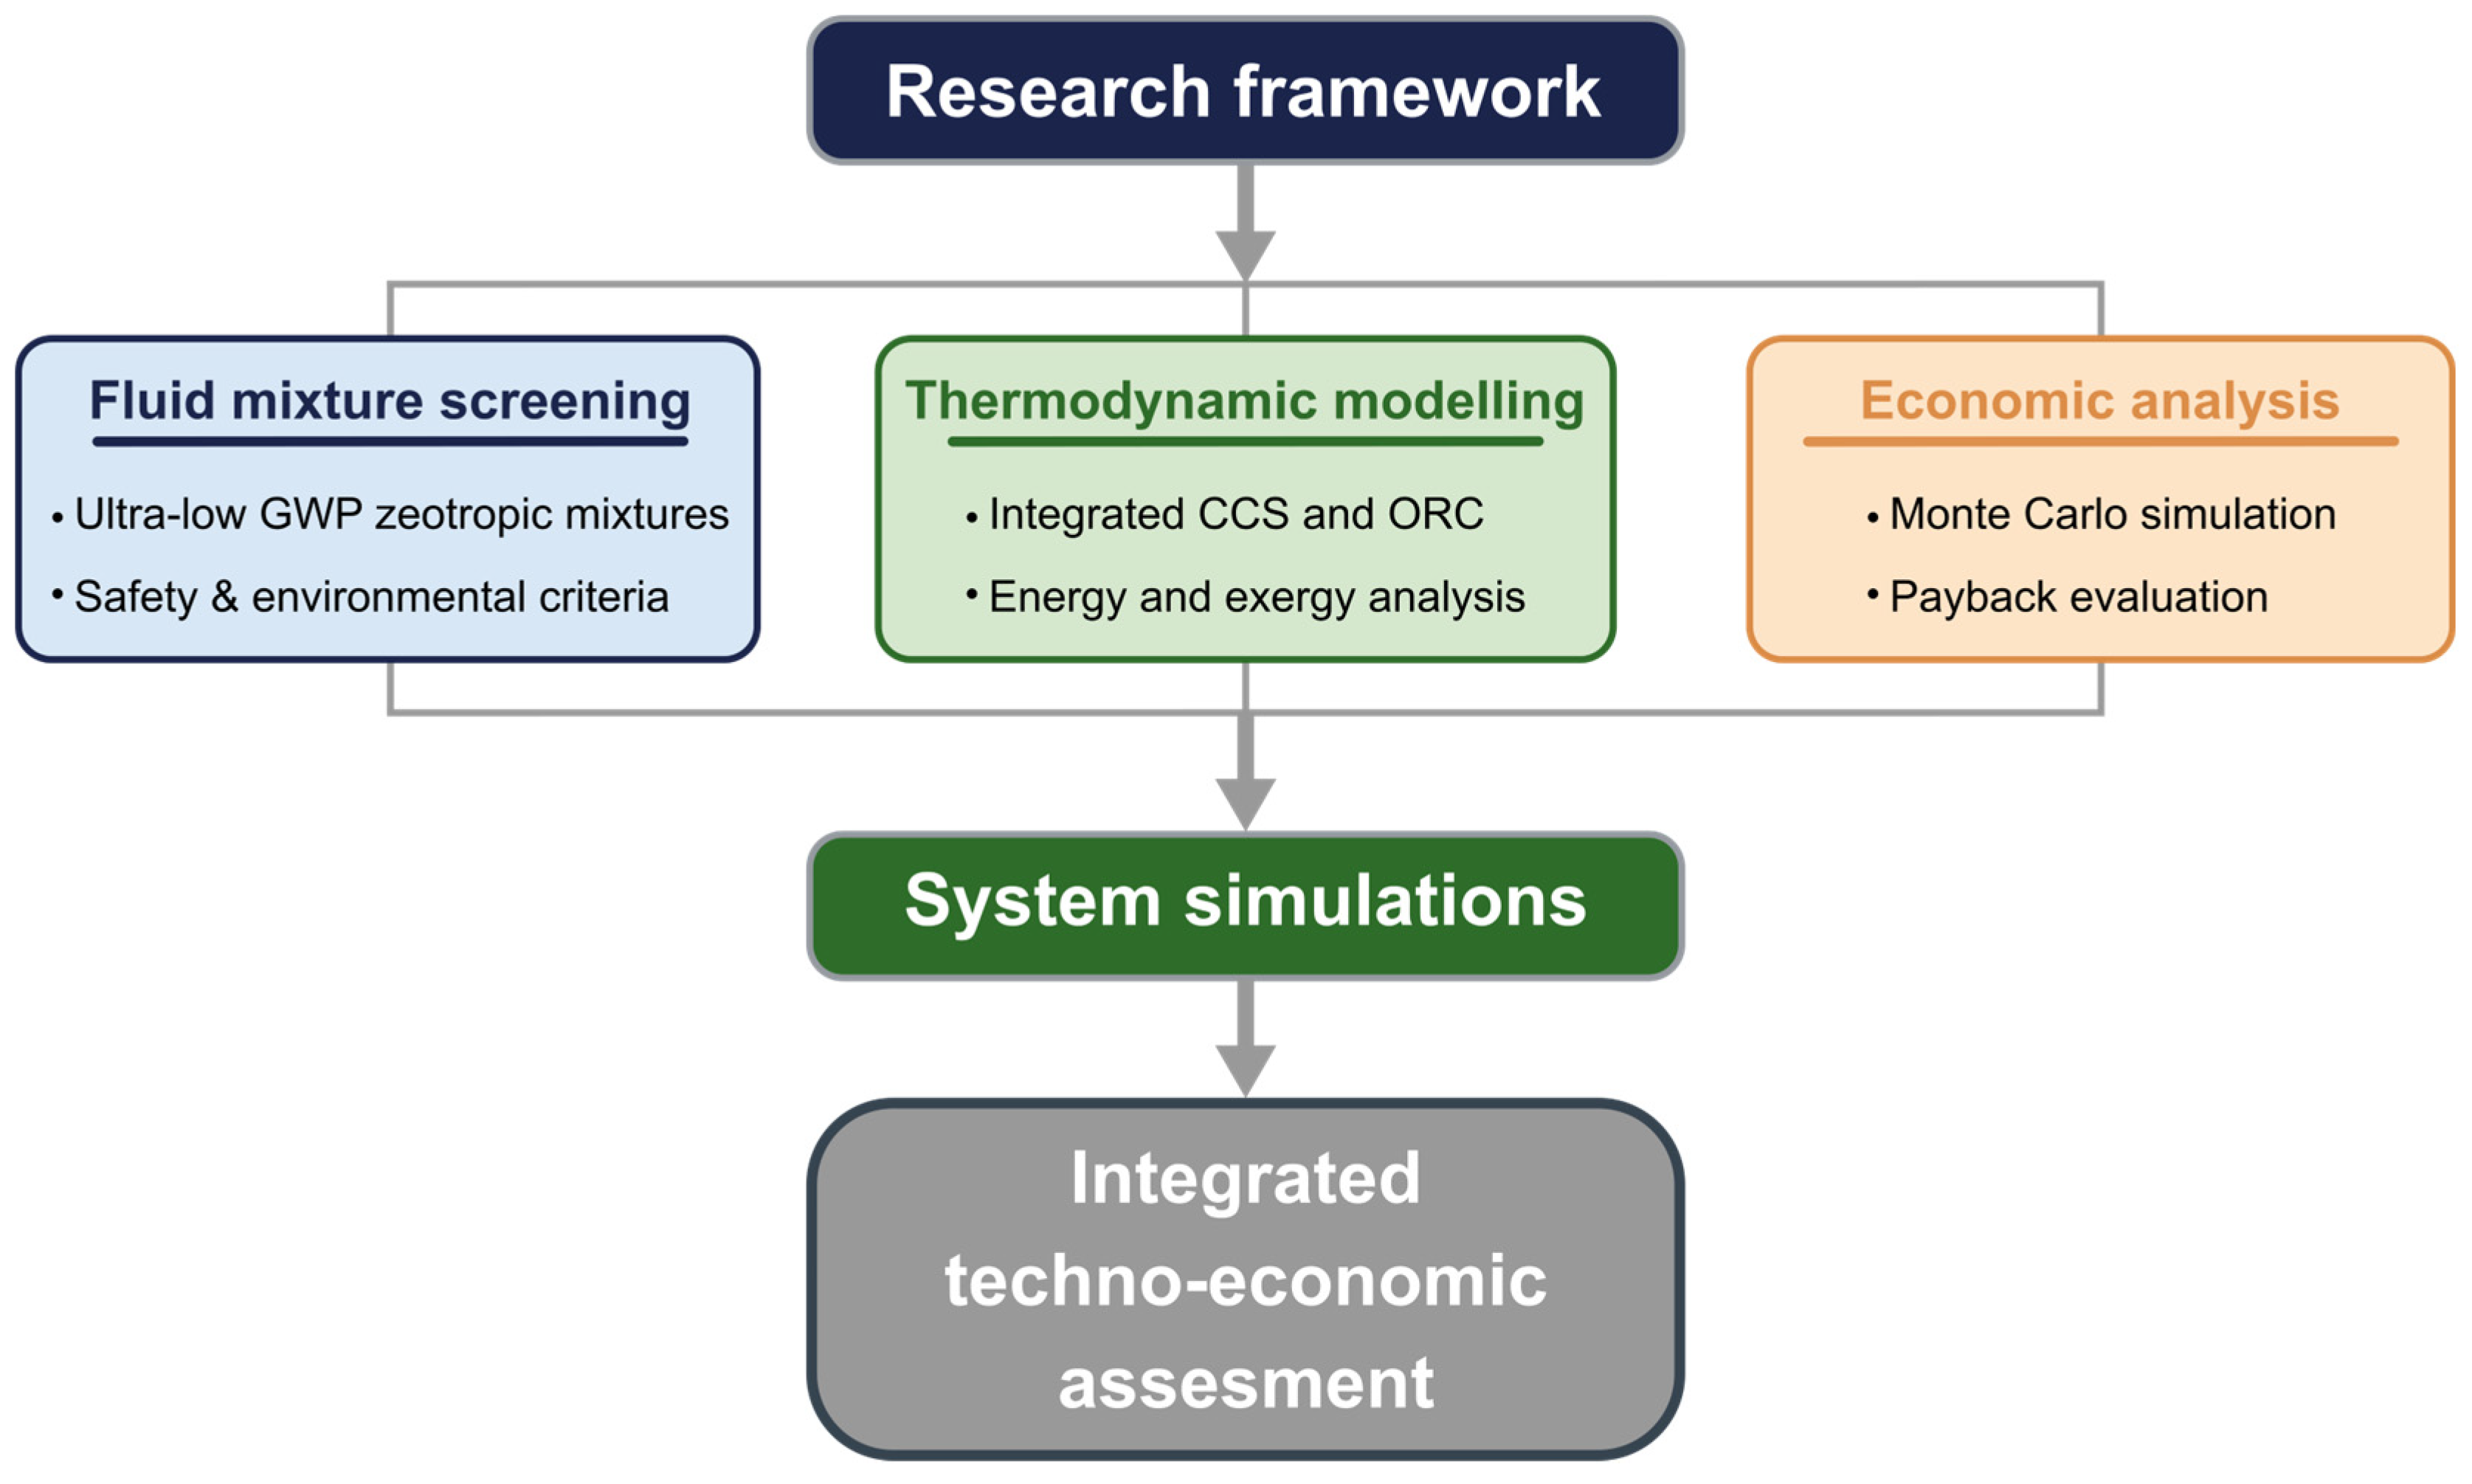
The primary objective of this paper is to identify zeotropic mixtures that offer the best performance in terms of energy recovery while maintaining low environmental impact and safe operability. A secondary objective is to assess the potential synergies between CO2 liquefaction and waste energy recovery systems. To do so, a CO2 liquefaction system integrated with waste energy recovery, incorporating both cold energy and waste heat ORCs, is proposed and applied to a case study vessel. To clarify the sequence of processes carried out to achieve these objectives, Figure 1 presents the methodological framework adopted in this study.
The remainder of this paper is organized as follows. Section 2 outlines the methodology used for the selection of working fluids and for the subsequent performance, environmental, and economic assessments. Section 3 presents and discusses the results obtained under the scenarios examined. Finally, Section 4 summarizes the principal findings and conclusions of the study.

2. Materials and Methods

2.1. Case Study Vessel

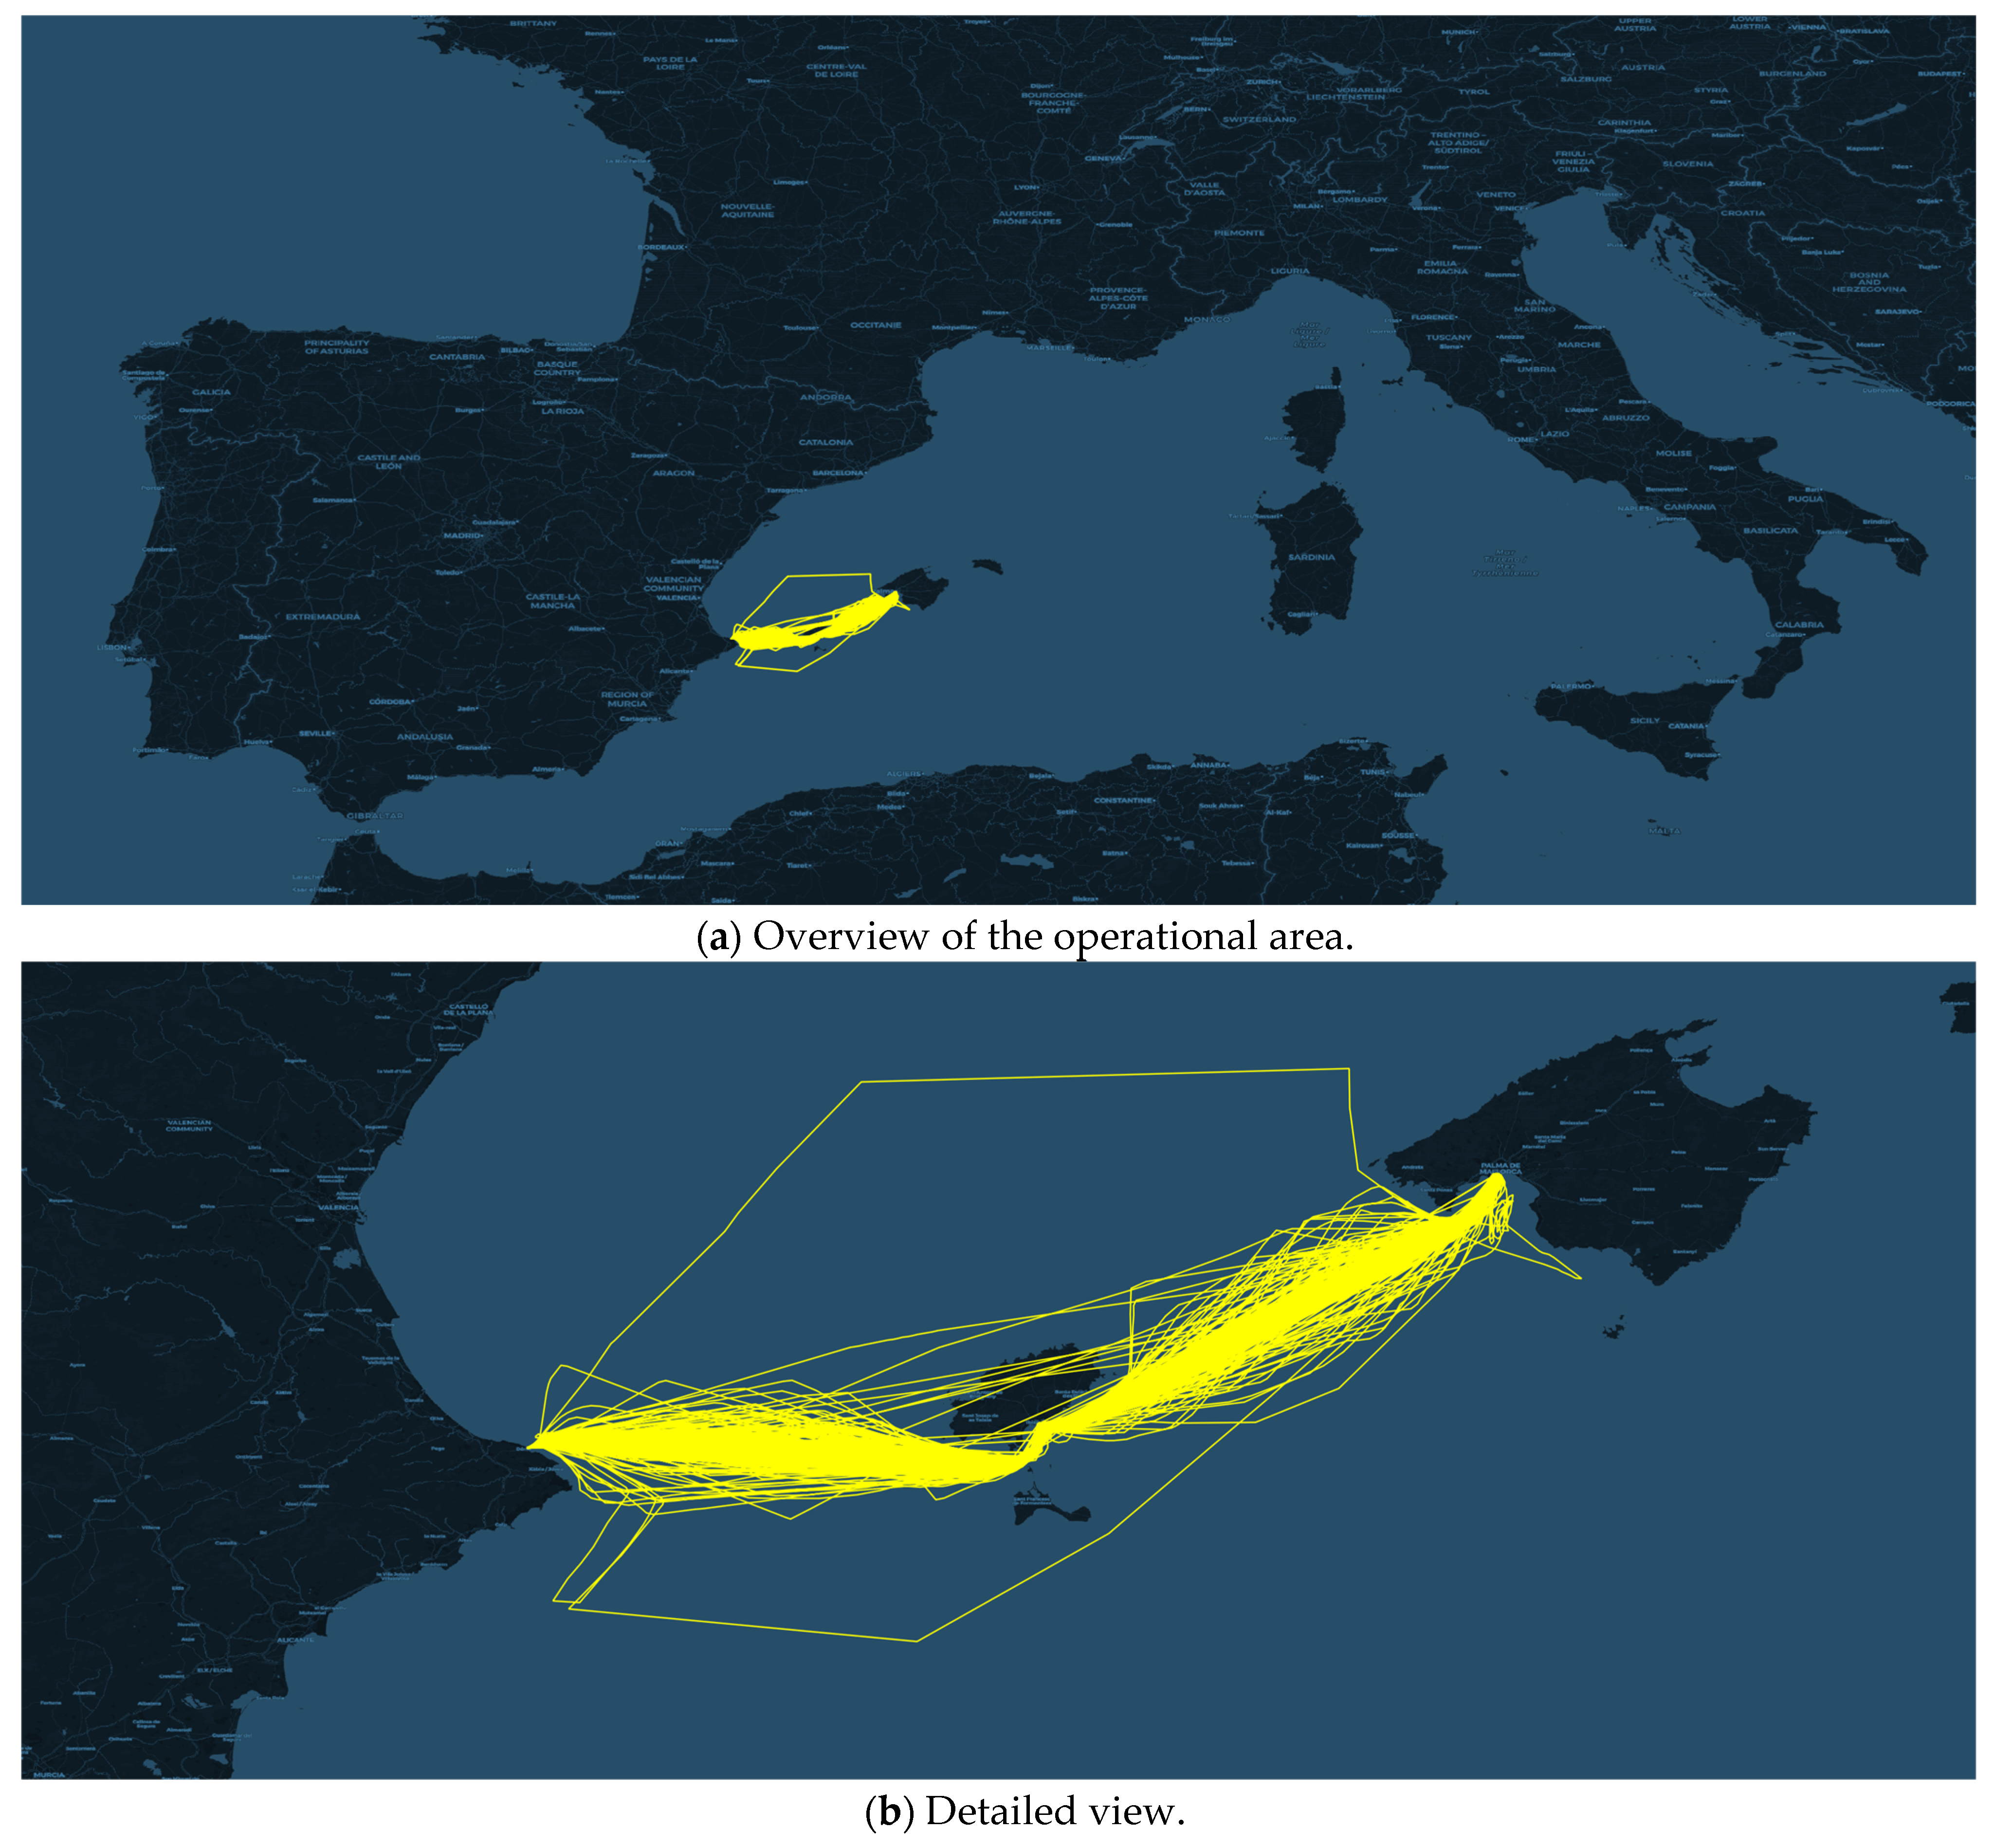
The case study focuses on a high-speed craft (HSC) ferry operating in the Mediterranean Sea, performing two round trips per day with a total daily distance of approximately 240 nautical miles. The vessel transports passengers, cars, and small trucks between the mainland and the Balearic Islands. To define the operational profile and constraints of the reference vessel in relation to air and seawater temperatures, the routes covered during the past three years (2023–2025) are retrieved and presented in Figure 2.
Environmental conditions along the route are derived from monthly average air and seawater temperature data available from the Spanish Meteorological Agency [38] and summarized in Table 1.
The propulsion system comprises four Wärtsilä 16V31DF engines (Wärtsilä Corporation, Helsinki, Finland) operating on LNG, two auxiliary SGE-24SL engines (Guascor Energy, Zumaia, Gipuzkoa, Spain) also running on LNG, and two 139 kW auxiliary engines operating on diesel fuel. The use of the latter is limited to periods when additional power is required, as LNG is prioritized as the primary fuel. A summary of propulsion engines specifications is given in Table 2.
Table 2 presents the exhaust gas parameters, which serve as the source of CO2 for the CCS system, and the waste thermal energy used in the calculations of this study. While the low-temperature thermal potential from LNG fuel regasification is utilized in both the cold energy ORC and the Heating, Ventilation, and Air Conditioning (HVAC) system, the engine jacket water provides the source of heat for the waste heat ORC. For these calculations, the vessel is assumed to operate at 85% load, which corresponds to its typical operating condition.
Given that it is a passenger vessel, the HVAC system represents a significant component of the overall energy demand, as it ensures passenger comfort throughout the voyage. The vessel has a total cooling requirement of 120 kW, distributed between the glazed passenger lounge and the accommodation areas, including the crew quarters and the upper deck cabins for technical staff. To complement the ORC systems and evaluate the potential benefits of replacing the current R407C with more environmentally friendly refrigerants, the study also explores the use of zeotropic mixtures in the HVAC system, assessing their impact on the Total Equivalent Warming Impact (TEWI) metric.

2.2. System Configuration

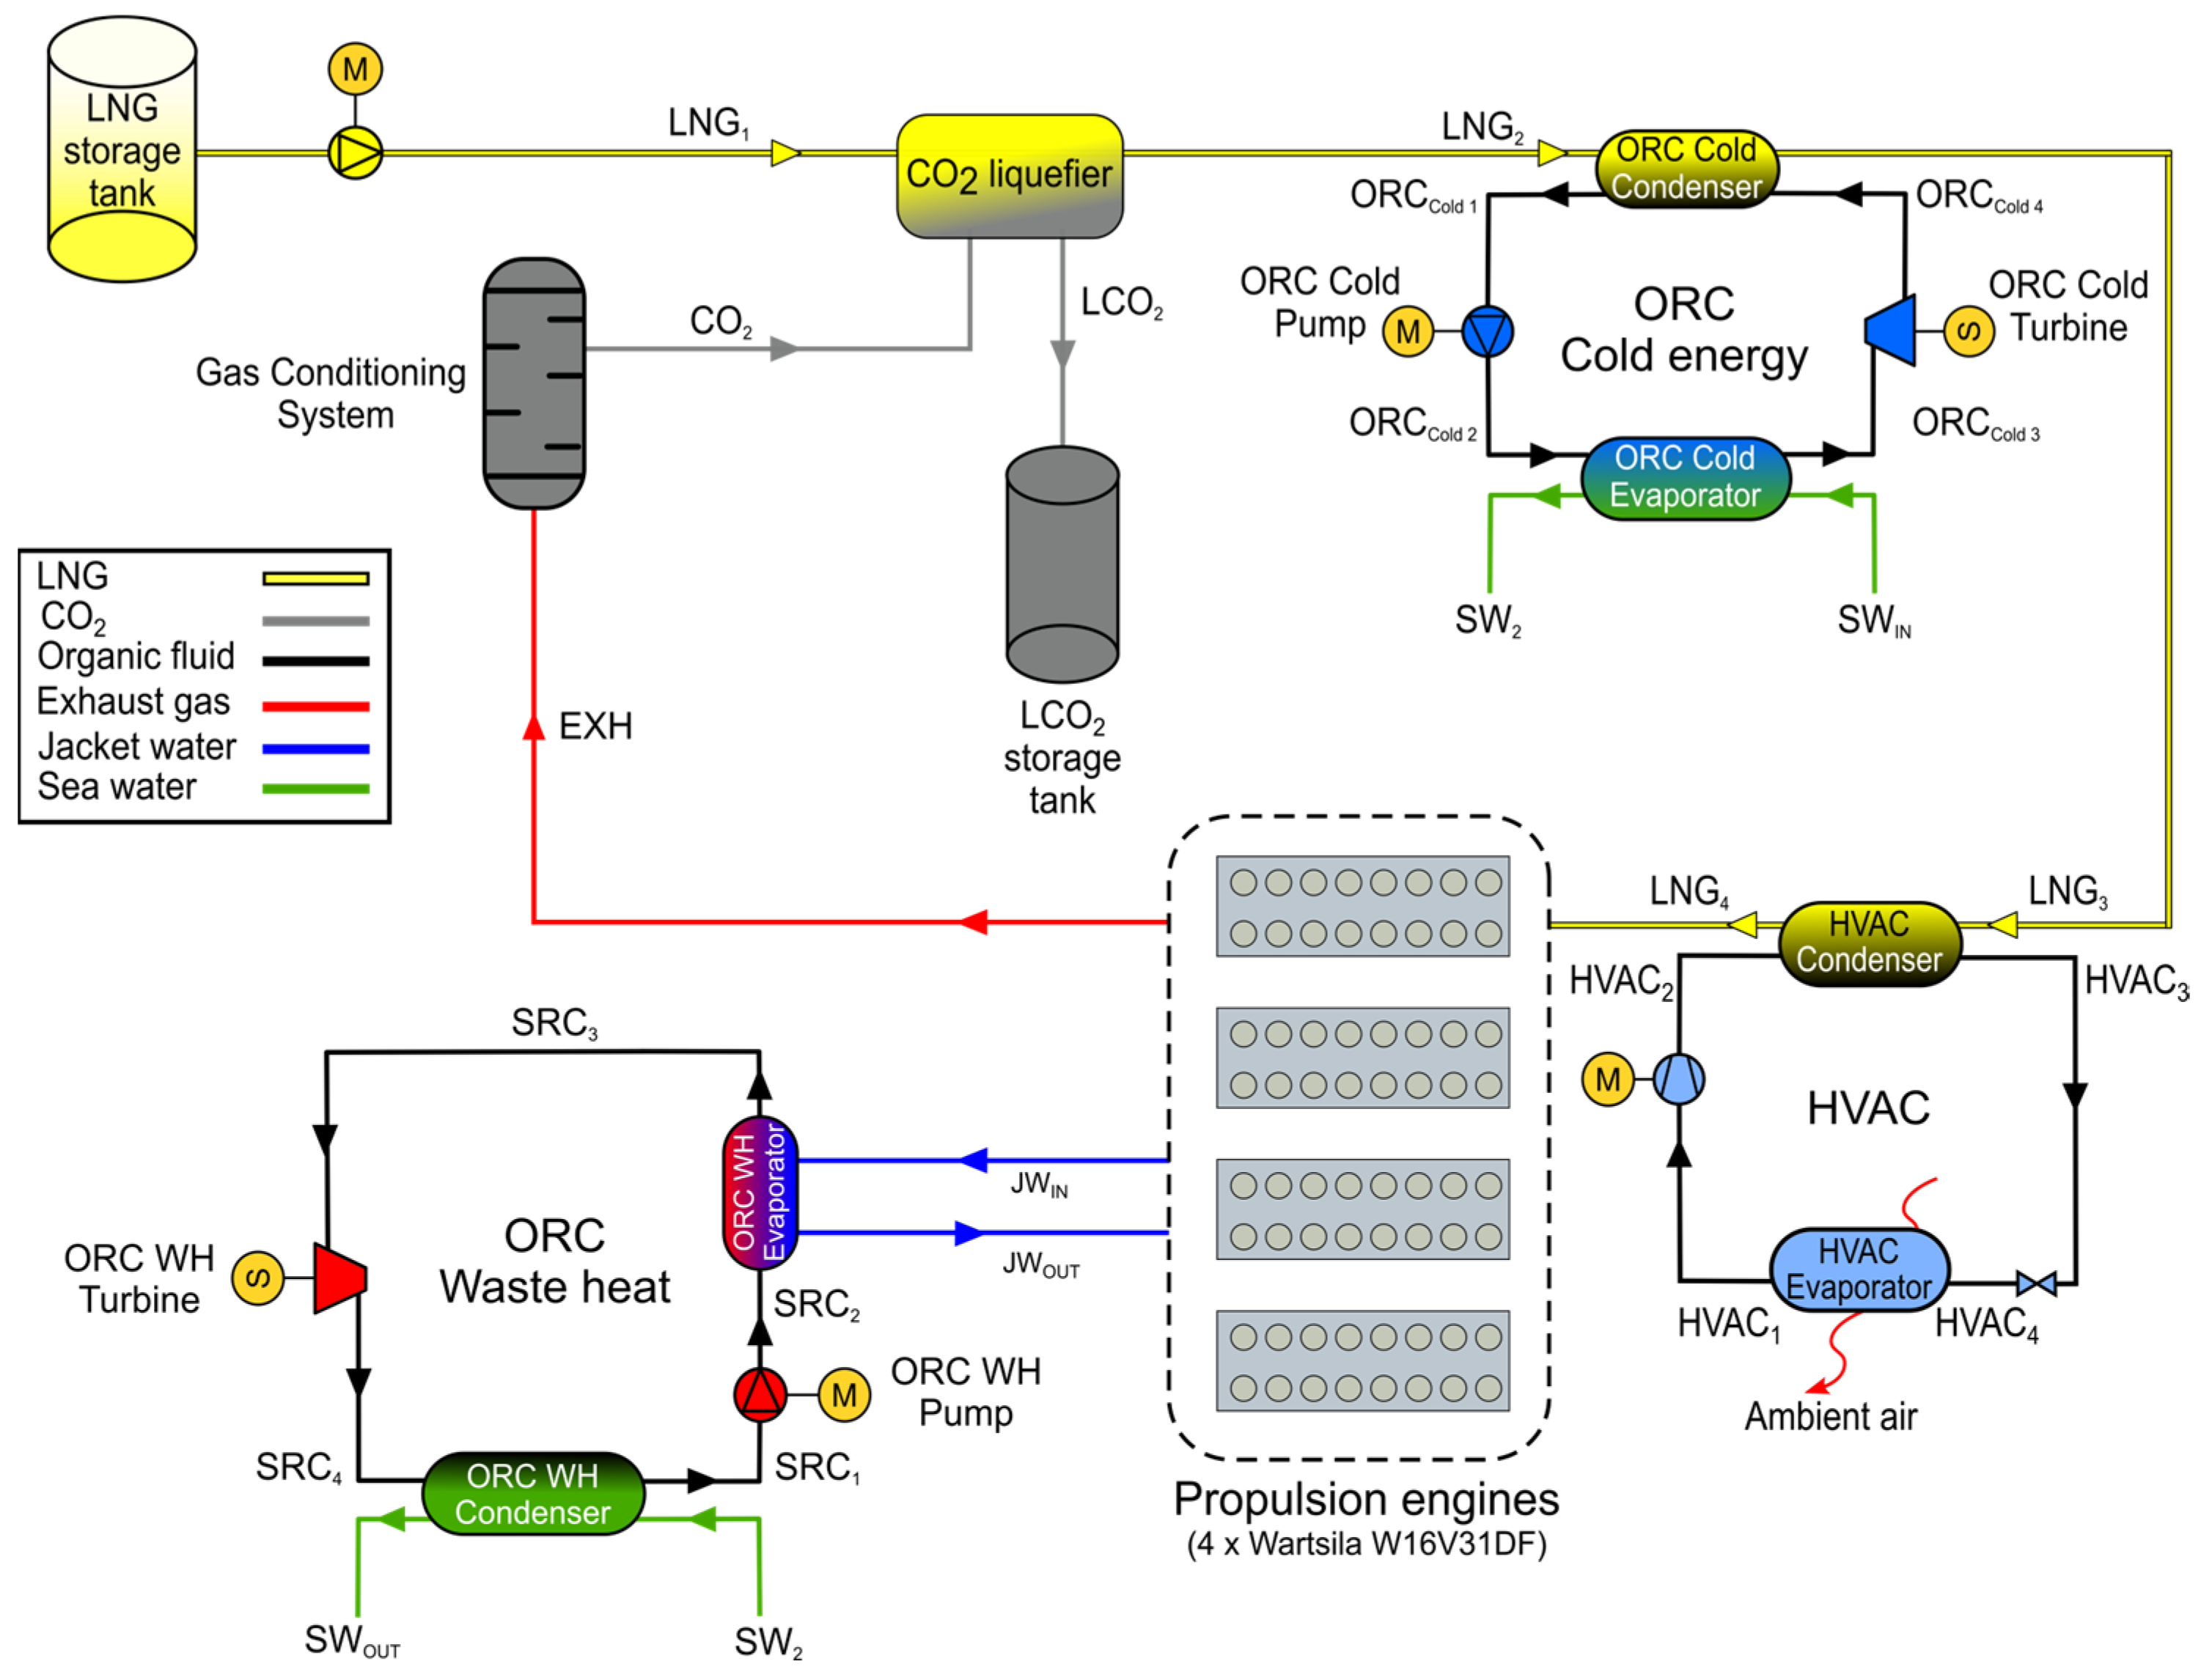
Figure 3 presents the configuration of the integrated energy recovery system, which provides electrical power and cooling capacity onboard while supporting GHG mitigation. Considering the variety of waste energy streams produced by the case study engine, including cold energy released during LNG vaporization and waste heat from sources such as exhaust gases and engine jacket water, maximization of energy recovery performance requires the coordinated operation of several interacting subsystems.
The system depicted in Figure 3 comprises a CO2 capture and storage subsystem based on cryogenic liquefaction, coupled with two organic Rankine cycles: one dedicated to recovering the residual cold energy of LNG and the other to harnessing the waste heat from the engines. Additionally, the remaining cold energy from LNG regasification is utilized to support the vessel’s HVAC system.

2.2.1. Mathematical Modeling, Assumptions, and Operational Constraints

Numerical simulation and performance assessment of the proposed waste energy recovery system are implemented using Python 3.11.7, while fluid properties are retrieved from the REFPROP 10.0 database [41]. The following assumptions are adopted in the development of the mathematical model, in line with established practices reported in the literature:
  • Air and seawater temperatures correspond to conditions at the ports visited by the vessel, as reported in Table 1 [38].
  • Working fluids, zeotropic mixtures, in all subsystems are assumed to remain thermally and chemically stable under all operating conditions [42].
  • Thermal losses are considered negligible, and all valves in the system are treated as adiabatic [43,44].
  • The gas conditioning process is outside the scope of this work; thus, it is assumed that the CO2 stream exits the Gas Conditioning System (GCS) at 15 bar and 303.15 K [45,46].

2.2.2. Exhaust Gas Aftertreatment and Carbon Capture and Storage System

First, the exhaust gases discharged from the engines are collected and directed to the GCS, where carbon dioxide is purified and separated from the main exhaust stream. After cleaning, the gas is cooled to 303.15 K and then compressed to 15 bar to prepare it for the liquefaction stage. The purified CO2 enters the liquefaction unit in gaseous form and leaves in liquid form at 243.15 K. At this point, residual N2, O2, and other non-condensable species remain in the gaseous phase and are separated from the condensing CO2. The mass flow rate of CO2 produced by combustion is determined using the stoichiometric ratio of 2.75 kg of CO2 per kilogram of CH4, as stated per IMO [47]. Based on the fuel consumption of the engines, this corresponds to 370.66 tons of CO2 per day of operation. Given the size and operational constraints of the HSC considered in this case study, the system is designed to capture up to 66% of this amount, totaling a volume of 244.63 m3 of liquid CO2. As the calculation incorporates the worst expected operating day, a 250 m3 storage tank filled to 98% provides sufficient capacity to accommodate all liquefied CO2 generated within a 24 h cycle. Under the conditions set, the storage tank must be unloaded once per day.
The cooling energy required in the liquefier, Q C O 2 ˙ , and the corresponding destruction of exergy resulting from this heat exchange are evaluated:
Q C O 2 ˙ = m C O 2 ˙ · C p C O 2 · T L C O 2 T C O 2
I C O 2 ˙ = m C O 2 ˙ · T a m b · Δ S C O 2
Δ S C O 2 = C p C O 2 · l n T L C O 2 T C O 2 R · l n P L C O 2 P C O 2
I C O 2 L N G ˙ = m L N G ˙ · h L N G 2 h L N G 1 T a m b · s L N G 2 s L N G 1
I C O 2 t o t a l ˙ = I C O 2 ˙ + I C O 2 L N G ˙
where R is the CO2 constant and has a value of 0.1889 kJ/kg·K [41]. The enthalpies and entropies of LNG stream are denoted as h L N G 1 and h L N G 2 , and s L N G 1 and s L N G 2 , respectively. These properties are determined based on the known inlet temperature T L N G 1 and pressure P L N G 1 . The outlet temperature, T L N G 2 , is calculated from Q C O 2 ˙ , while an outlet pressure 0.1 bar lower than P L N G 1 is adopted to account for the internal pressure drop across the CO2 liquefier. This cooling process enables the recovery of the CO2 generated by the ship engines, which can then be directed to a dedicated storage tank. The liquefied CO2 is subsequently routed to the onboard storage tank.

2.2.3. Cold Energy Organic Rankine Cycle

The second LNG heat exchanger operates as part of a dedicated low-temperature ORC aimed at exploiting the remaining low-temperature thermal potential of the LNG stream, whose temperature at this stage is approximately 263 K. Even after partial heat exchange, the LNG retains sufficiently low thermal conditions to be utilized by selected zeotropic working fluids capable of stable operation near 200 K without solidification risk [41]. Through this arrangement, additional electrical power is generated from the residual exergy available in the LNG stream after supplying cooling to the onboard CCS unit. Cold energy exchanged during ORC condensation, as well as the corresponding exergy destruction, is evaluated:
Q O R C c o l d c o n d ˙ = m L N G ˙ · ( h L N G 3 h L N G 2 )
I O R C c o l d c o n d L N G ˙ = m L N G ˙ · h L N G 3 h L N G 2 T a m b · s L N G 3 s L N G 2
I O R C c o l d c o n d z e o t r o p i c ˙ = m O R C c o l d ˙ · h O R C c o l d 1 h O R C c o l d 4 T a m b · s O R C c o l d 1 s O R C c o l d 4
I O R C c o l d c o n d t o t a l ˙ = I O R C c o l d c o n d L N G ˙ + I O R C c o l d c o n d z e o t r o p i c ˙
The amount of recoverable LNG thermal energy is calculated from the natural gas mass flow rate and the enthalpy difference between the inlet and outlet of the corresponding heat exchanger, represented by h L N G 2 and h L N G 3 , respectively. Consistent with the remaining heat exchangers in the system, a minimum temperature approach of 10 K is enforced as the design pinch constraint. Exergy destruction within the ORC condenser is evaluated by accounting for irreversibilities on both the natural gas side and the working fluid side. For the natural gas stream, the specific entropies at the inlet and outlet, s L N G 2 and s L N G 3 , are employed. On the organic mixture side, the thermodynamic properties at the condenser inlet and outlet are represented by the specific enthalpies h O R C c o l d 1 and h O R C c o l d 4 , and the specific entropies s O R C c o l d 1 and s O R C c o l d 4 , correspondingly.
At the condenser outlet, the organic mixture is subsequently pressurized by a pump. The pump power demand and associated irreversibilities in the low-temperature ORC are evaluated through the following expressions:
W O R C c o l d p u m p ˙ = m O R C c o l d ˙ ·   v O R C c o l d · P O R C c o l d 2 P O R C c o l d 1 ε O R C c o l d p u m p
P O R C c o l d 2 = R e d u c e d   p r e s s   ·   P c r i c o n d e n b a r
I O R C c o l d p u m p ˙ = m O R C c o l d ˙ · T a m b · s O R C c o l d 2 s O R C c o l d 1
Power input to the pump is evaluated based on the mass flow of mixture, m O R C c o l d ˙ , specific volume of the zeotropic fluid at the condenser outlet, υ O R C c o l d , and the pressure difference between the pump inlet and outlet, P O R C c o l d 1 and P O R C c o l d 2 , respectively. P O R C c o l d 2 is determined as a function of the critical condensation pressure (cricondenbar) of the zeotropic mixture at the specified composition. The associated exergy destruction is estimated using the specific entropy values of the fluid at the same locations, s O R C c o l d 1 and s O R C c o l d 2 . Once the organic mixture in the low-temperature ORC subsystem has been pressurized, seawater provides the thermal input to the evaporator of this cycle. The disposed cold energy from the ORC cold stream, along with the corresponding exergy destruction, is determined:
Q O R C c o l d e v a p ˙ =   m O R C c o l d ˙ · C p O R C c o l d · T O R C c o l d 3 T O R C c o l d 2
I O R C c o l d e v a p z e o t r o p i c ˙ = m O R C c o l d ˙ · h O R C c o l d 3 h O R C c o l d 2 T a m b · s O R C c o l d 3 s O R C c o l d 2
I O R C c o l d e v a p s w ˙ = Q O R C c o l d e v a p ˙ · 1 T a m b T a v g O R C c o l d e v a p  
I O R C c o l d e v a p t o t a l ˙ = I O R C c o l d e v a p z e o t r o p i c ˙ + I O R C c o l d e v a p s w ˙
Cold energy recovered by the low-temperature ORC subsystem is transformed into electrical power and the part not used and evacuated to the seawater is expressed as Q O R C c o l d e v a p ˙ . The specific enthalpy and entropy of the cold ORC working fluid at the evaporator inlet and outlet are represented by h O R C c o l d 2 and h O R C c o l d 3 , and s O R C c o l d 2 and s O R C c o l d 3 , respectively. Exergy destruction in the evaporator is determined using the logarithmic mean temperature difference method, represented by T a v g O R C c o l d e v a p . This is calculated with the inlet and outlet temperatures of the zeotropic mixture and seawater. Total irreversibilities within the evaporator are calculated as the sum of those generated by both interacting fluid streams.
In the concluding stage of the cold ORC, the working fluid, already pressurized and preheated, is expanded by a turbine, enabling the conversion of LNG cold energy into electrical power. The generated power and the corresponding exergy destruction are evaluated:
W O R C c o l d ˙ = m O R C c o l d ˙ · h O R C c o l d 4 h O R C c o l d 3 ·   ε O R C c o l d ·   ε g e n
I O R C c o l d ˙ = m O R C c o l d ˙ · T a m b · s O R C c o l d 4 s O R C c o l d 3
Specific enthalpies of the working mixture at the inlet and outlet of the expander are denoted as h O R C c o l d 3 and h O R C c o l d 4 , respectively. Electrical power production is determined by considering the isentropic efficiency of the expander, ε O R C c o l d , together with the efficiency of the electric generator, ε g e n . The assessment of exergy destruction is based on the specific entropy values of the zeotropic mixture at the same points, represented by s O R C c o l d 3 and s O R C c o l d 4 , respectively.

2.2.4. HVAC Cooling Services

As generally found in passenger ferry ships, the reference vessel is fitted with a HVAC system designed to maintain passenger comfort during voyages across different seasonal conditions, particularly during summer operations. This section proposes the integration of a cold energy source and the replacement of the conventional working fluid, originally R407C, with alternative ultra-low GWP zeotropic organic mixtures. This modification aims to minimize the likelihood of increased atmospheric pollution, especially in the event of refrigerant leakage. To further enhance the HVAC performance and maximize the utilization of waste cold energy, the proposed configuration incorporates cooling from LNG regasification through a counterflow heat exchanger, where the refrigerant mixture circulates on one side and LNG at a lower temperature on the other (see Figure 3).
Within this system, a compressor ensures continuous circulation of the working fluid in a closed loop formed by an evaporator, a condenser, and an adiabatic expansion valve. The performance of the HVAC system is calculated as follows:
Q H V A C c o n d ˙ = m L N G ˙ · h L N G 4 h L N G 3
ε H V A C c o m p r e s s o r = h H V A C 2 s h H V A C 1 h H V A C 2 h H V A C 1
W H V A C c o m p r e s s o r ˙ = m H V A C ˙ · h H V A C 2 h H V A C 1
Here, Q H V A C c o n d ˙ represents the heat rejected in the condenser, which functions as the interface for extracting the cold energy provided by the LNG fuel line. The stream flow rate of the organic working mixture is denoted by m H V A C ˙ , and the remaining terms correspond to the specific enthalpies of the fluid at the condenser and pump inlet and outlet sections. A pressure drop of 0.1 bar is assumed at the evaporator outlet. By knowing the efficiency of the compressor, ε H V A C c o m p r e s s o r , the effective enthalpy at the compressor outlet can be determined. Enthalpies at the inlet and outlet of the compressor, h H V A C 1 and h H V A C 2 , together with the mass flow rate of the zeotropic mixture, are then used to calculate the work supplied to the compressor.
In terms of irreversibilities, the main components of the HVAC system where exergy destruction should be examined to enhance overall efficiency are the LNG evaporator and the compressor. By determining the amount of heat transferred in the heat exchanger and the energy required by the compressor, the corresponding exergy destruction can be calculated:
I H V A C c o n d L N G ˙ = m L N G ˙ · h L N G 4 h L N G 3 T a m b · s L N G 4 s L N G 3
I H V A C c o n d z e o t r o p i c ˙ = Q H V A C c o n d ˙ · 1 T a m b T a v g H V A C c o n d  
I H V A C c o n d t o t a l ˙ = I H V A C c o n d L N G ˙ + I H V A C c o n d z e o t r o p i c ˙
I H V A C c o m p r e s s o r ˙ = m H V A C ˙   ·   T a m b   ·   ( S H V A C 2 S H V A C 1 )

2.2.5. Waste Heat Organic Rankine Cycle

Four-stroke internal combustion engines achieve high conversion efficiencies; however, close to half of the chemical energy supplied by the fuel is ultimately released as heat at various temperature levels instead of being converted into shaft work. For marine diesel engines, waste heat is mainly rejected through the exhaust gases and the jacket cooling water, both of which present opportunities for partial recovery through Rankine cycles, converting thermal energy into useful power. To simplify the system and reduce component count, this work introduces an ORC-based waste heat recovery layout that combines a jacket water preheating stage with an exhaust gas evaporator, as shown in Figure 3.
The waste heat ORC begins at the condenser outlet, where the zeotropic mixture temperature is determined as a function of seawater temperature, with a specified pinch point of 20 K. At this stage, the fluid remains in the saturated liquid phase. It subsequently enters the cycle pump, where its pressure is increased. The required pumping power and the corresponding exergy destruction are calculated:
W O R C W H p u m p ˙ = m O R C W H ˙ ·   v O R C W H · P O R C W H 2 P O R C W H 1 ε O R C W H p u m p
P O R C W H 2 = R e d u c e d   p r e s s   ·   P c r i c o n d e n b a r
I O R C W H p u m p ˙ = m O R C W H ˙ · T a m b · s O R C W H 2 s O R C W H 1
In this context, the mass flow rate of working fluid mixture circulating inside the subsystem is denoted by m O R C W H ˙ , and its specific volume is represented by v O R C W H . The pressures at the condenser outlet and at the pump discharge are indicated by P O R C W H 1 and P O R C W H 2 , with the latter expressed as a function of the maximum condensation pressure ( P c r i c o n d e n b a r ). The efficiency of the pump is designated as ε O R C W H p u m p , while s O R C W H 1 and s O R C W H 2 denote the mixture’s specific entropy upstream and downstream of the pump.
Upon completion of the pumping stage, the zeotropic mixture flows through the evaporator, where it absorbs thermal energy from the engine jacket water used for cooling internal components. The recoverable thermal energy at this stage, as well as the exergy destruction associated with this heat exchange, is determined:
Q O R C W H e v a p ˙ =   m J W ˙ · C p J W · T J W o u t T J W i n
The amount of heat recovered from the jacket water flow exiting the engines depends on the inlet temperature of the auxiliary engine jacket cooling water, T J W i n , which based on onboard measurements is set at 369.15 K. The outlet temperature, T J W o u t , is fixed at 328.15 K, corresponding to the lowest temperature allowed by the engine manufacturer to prevent issues related to cold combustion.
The recovered thermal energy from the jacket water is supplied to the organic zeotropic mixture to increase its temperature prior to the evaporation stage. The irreversibilities associated with this heat exchange are quantified by summing the exergy destruction occurring in both interacting fluid streams:
I O R C W H e v a p J W ˙   =   m J W ˙   ·   h J W o u t     h J W i n     T a m b   · s J W o u t     s J W i n
I O R C W H e v a p z e o t r o p i c ˙ = m O R C W H ˙ · h O R C W H 3 h O R C W H 2 T a m b · s O R C W H 3 s O R C W H 2
I O R C W H e v a p t o t a l ˙ = I O R C W H e v a p J W ˙ + I O R C W H e v a p z e o t r o p i c ˙
where the enthalpies and entropies at the inlet and outlet of the preheater are denoted as h J W i n , h J W o u t , s J W i n , and s J W o u t , respectively. For the assessment of exergy destruction associated with the organic mixture, the specific enthalpies and entropies at the preheater inlet and outlet, h O R C W H 2 , h O R C W H 3 , s O R C W H 2 , and s O R C W H 3 , are employed.
After evaporation, the zeotropic fluid is directed into the waste heat ORC turbine, where it expands down to the condensation pressure under subcritical cycle conditions. During the expansion process, shaft work is generated and later transformed into electricity by means of an alternator. The resulting turbine power in the waste heat ORC, together with the corresponding exergy losses, is then evaluated:
W O R C W H t u r b i n e ˙ =   m O R C W H ˙ · h O R C W H 4 h O R C W H 5 s ·   ε O R C W H t u r b i n e ·   ε g e n
I t u r b i n e O R C W H ˙ = m O R C W H ˙ · T a m b · s O R C W H 5 s s O R C W H 4
Power generated by the turbine directly depends on the specific enthalpies at the inlet and outlet, h O R C W H 4 and h O R C W H 5 s , respectively. Turbogenerator mechanical and electrical efficiencies are represented by ε O R C W H t u r b i n e and ε g e n . The irreversibilities in this stage are influenced by the mass flow rate of the zeotropic mixture, the ambient temperature, and the actual specific entropy values at the inlet and outlet of the expansion process, s O R C W H 4 and s O R C W H 5 , respectively.
After expansion, the total mass flow of zeotropic mixture utilized in the waste heat ORC enters the condenser, where it is returned to a saturated liquid state. The heat rejected to the seawater together with the associated irreversibilities are calculated:
Q O R C W H c o n d ˙ = m O R C W H ˙ · h O R C W H 5 h O R C W H 1
I O R C W H c o n d z e o t r o p i c ˙ = m O R C W H ˙ · h O R C W H 5 h O R C W H 1 T a m b · s O R C W H 5 s O R C W H 1
I O R C W H c o n d s w ˙ = m s w ˙ · h S W o u t h S W i n T a m b · s S W o u t s S W i n
I O R C W H c o n d t o t a l ˙ = I O R C W H c o n d z e o t r o p i c ˙ + I O R C W H c o n d s w ˙
To calculate the heat extracted by the seawater, Q O R C W H c o n d ˙ , the specific enthalpies of the steam at the condenser inlet and outlet, h O R C W H 5 and h O R C W H 1 , are used. Exergy destruction associated with heat transfer on the zeotropic mixture side is evaluated using the specific entropies at the inlet and outlet, s O R C W H 5 and s O R C W H 1 , respectively. Exergy losses on the seawater side are governed by its mass flow rate, m s w ˙ , together with its thermodynamic properties at the condenser boundaries. These properties include the inlet enthalpy and entropy, h S W i n and s S W i n , and h S W o u t and s S W o u t , respectively.

2.2.6. Seawater Cooling System

The proposed system requires cooling at several stages, all of which are provided by seawater. To enhance the utilization of this thermal resource, seawater is first drawn from the surroundings and supplied to the cold ORC, where its temperature is reduced. This step is advantageous because the cooled stream then enters the condenser of the waste heat ORC, allowing the zeotropic mixture to condense at a lower temperature than would be possible with ambient seawater. After completing this process, the seawater is discharged overboard.
Constant parameters of the CO2 liquefaction and waste energy recovery system are summarized in Table 3:
Regarding the parameters that vary and are analyzed in the system’s sensitivity study, Table 4 summarizes these variables:

2.3. Organic Fluid Zeotropic Mixtures Selection Process

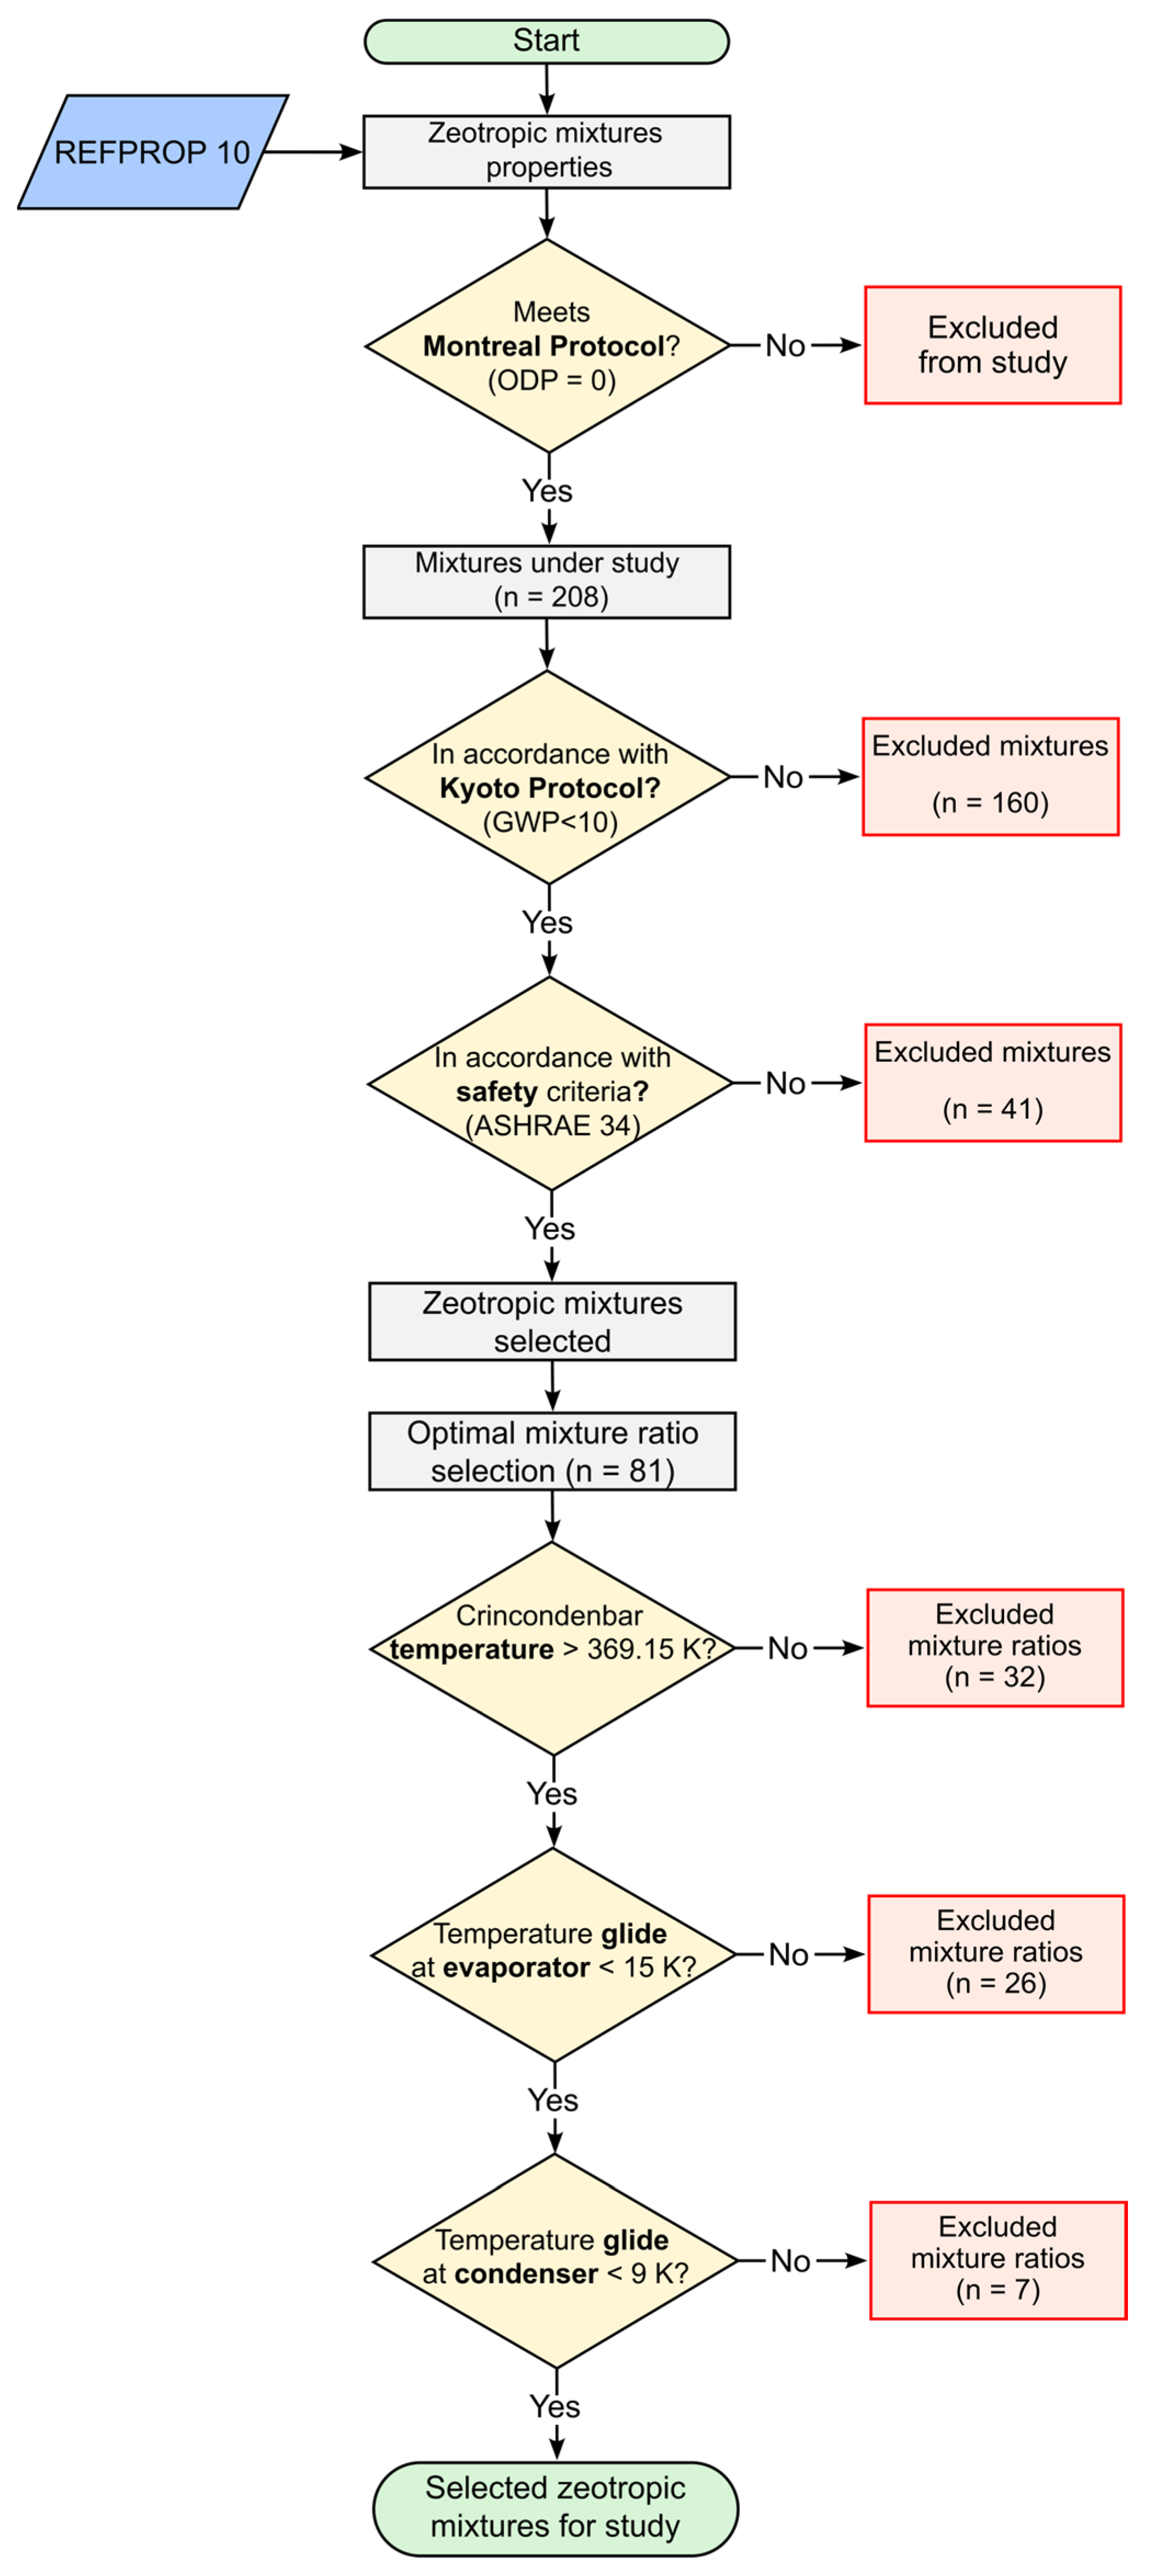
To maximize waste energy recovery through ORCs, the identification of an appropriate working fluid plays a decisive role. Although pure fluids and azeotropic mixtures often perform well, zeotropic mixtures typically offer superior energy recovery potential due to their improved thermal match with the heat sources [53]. In this study, 208 zeotropic mixtures are analyzed (listed in Table A1) to identify those most suitable for recovering both cold energy and low-grade heat in marine applications. This aspect is particularly relevant because the waste energy recovery system is located inside the engine room, an enclosed space with limited ventilation, where low flammability and toxicity are essential. Furthermore, ship motions such as hogging and sagging can increase the likelihood of leakage compared to stationary land-based systems. For these reasons, special consideration is given to safety and environmental impact when selecting zeotropic mixtures for evaluation. The complete fluid selection procedure is illustrated in Figure 4.
The first screening criterion focuses on environmental impact. Fluids with any ozone depletion potential (ODP > 0) are eliminated, as they are noncompliant with the Montreal Protocol [54]. In accordance with the Kyoto Protocol and aligned with European Union regulations, only zeotropic mixtures with an ultra-low global warming potential (GWP ≤ 10) are retained for further evaluation [55,56].
The second screening step addressed operator safety, following the guidelines of ASHRAE Standard 34 [57]. Fluids exhibiting excessive flammability or toxicity, which may pose hazards to operators through inhalation, ingestion, or dermal contact, are excluded (particularly categories above A2L and all in the B group).
Application of the environmental criteria led to the exclusion of 160 mixtures due to their non-compliance with these requirements. The subsequent application of the safety criteria eliminated an additional 41 mixtures. After this two-stage screening process, a shortlist of 9 candidate zeotropic mixtures is retained for further evaluation.
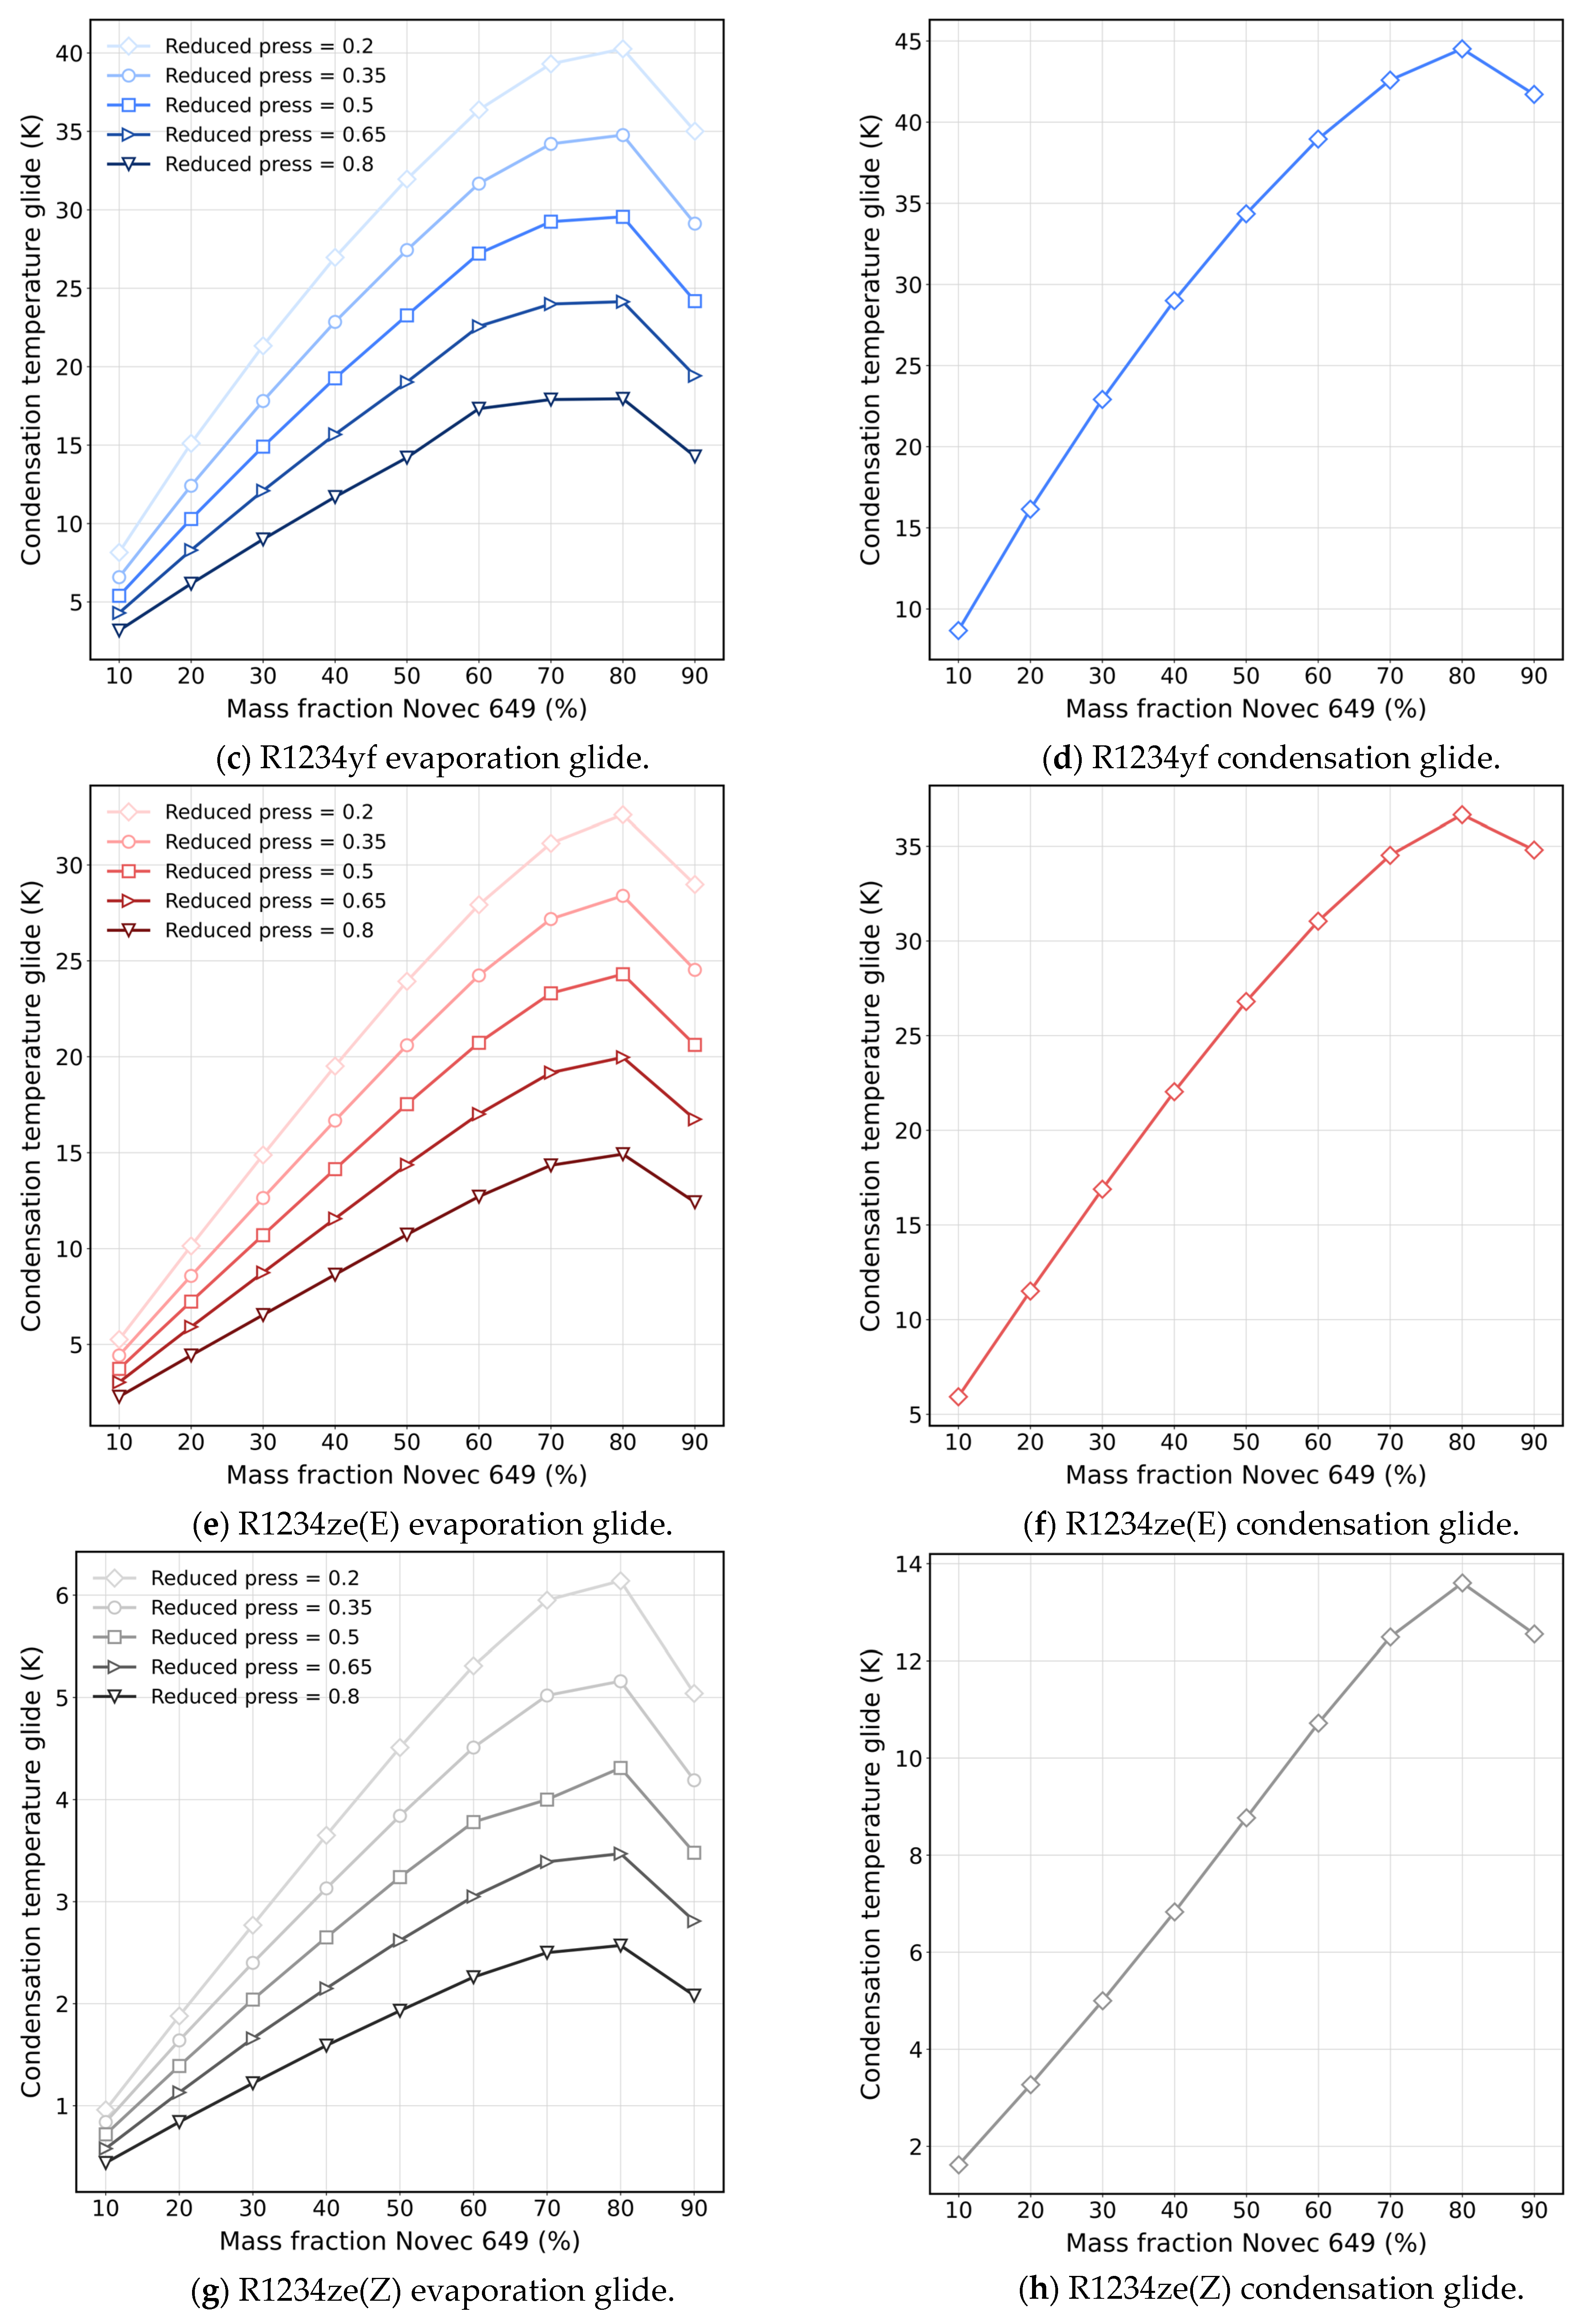
In the final selection stage, thermophysical properties of the shortlisted mixtures are analyzed to ensure their suitability for low-temperature heat and cold energy recovery. The maximum pressure at which vapor–liquid equilibrium exists (cricondenbar) is evaluated for each mixture to prevent supercritical operation while enabling effective heat absorption from the available thermal sources. Mixtures whose critical temperature at the cricondenbar point are well aligned with the temperature level of the waste heat stream supplying the ORC are identified. This selection is further refined by assessing the temperature glide across mass fractions from 0 to 1 in increments of 0.1. Mixtures exhibiting an excessive temperature glide are discarded. However, if a zeotropic mixture met all other selection criteria and displayed a glide below 15 K in the evaporator and below 9 K in the condenser, albeit only within certain composition ranges, it is retained, and the analysis is limited to those suitable regions.
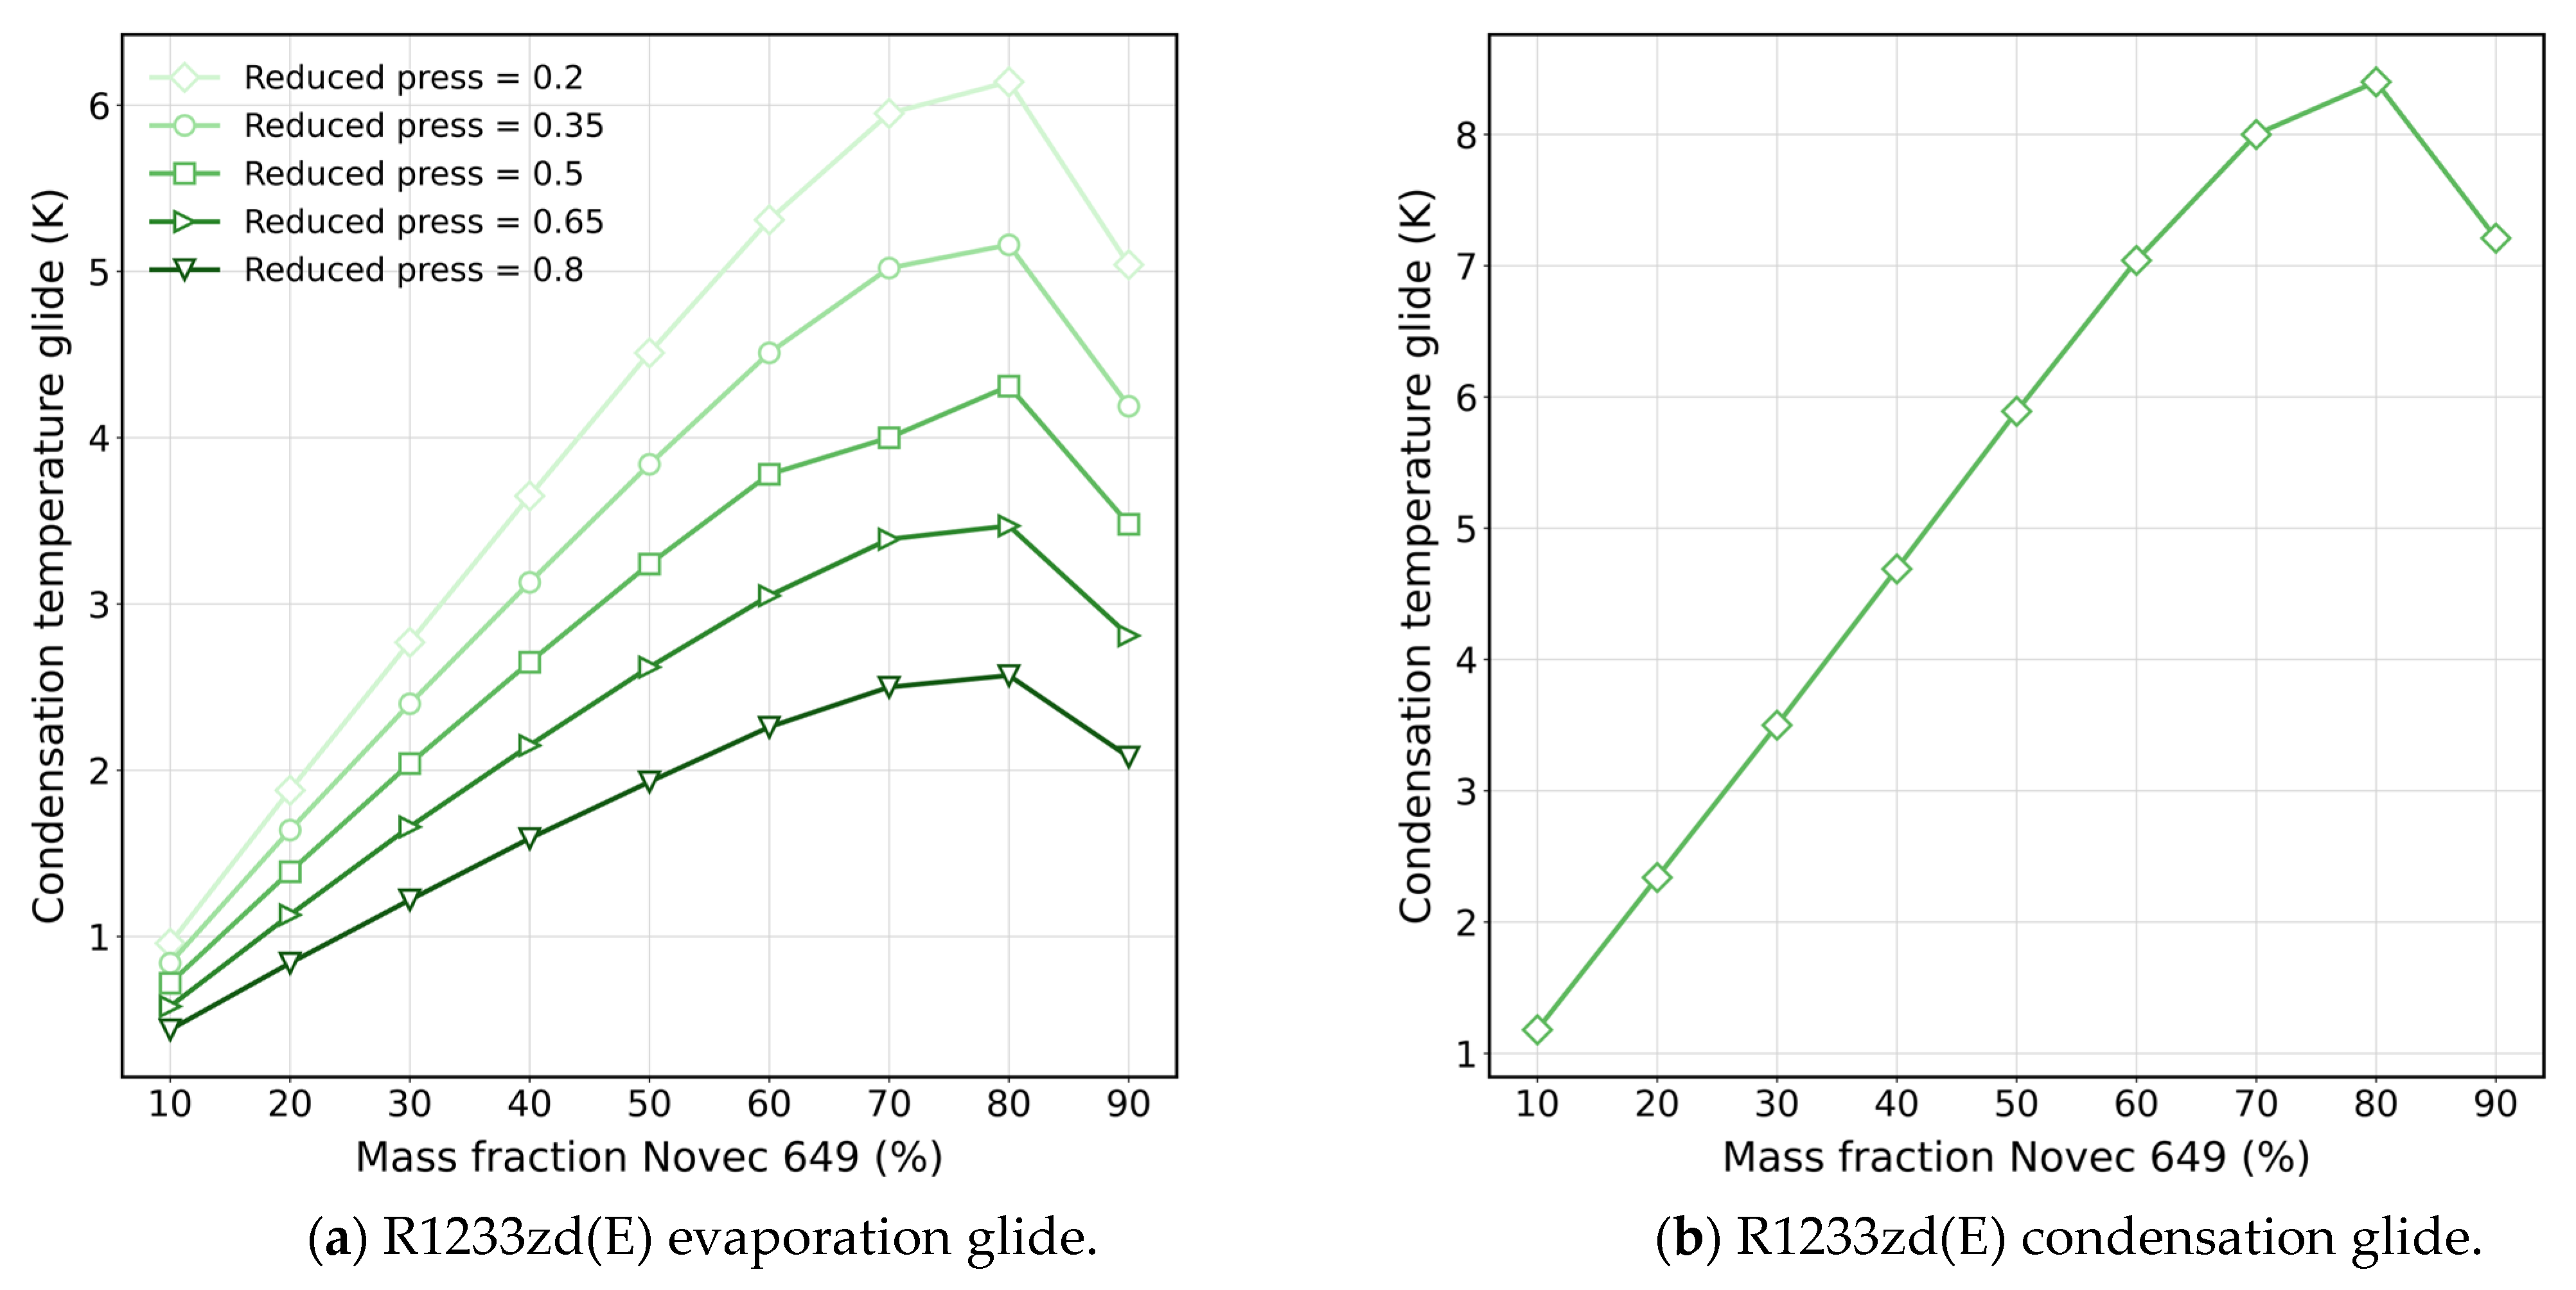
Figure 5 shows the temperature glide profiles of the working fluids during the evaporation and condensation stages for both the cold energy and waste heat recovery ORCs. The glides corresponding to each stage are the same in both configurations. This behavior arises because pressures are constrained within the same range for each fluid. The figure further indicates that the temperature glide attains its highest values at certain intermediate refrigerant mass fractions. When the mass fraction approaches either zero or one, the mixture properties converge toward those of a pure fluid, leading to a reduction in temperature glide.
The zeotropic mixtures that successfully passed all screening steps are implemented in the thermodynamic model across their feasible mass fractions. The optimal mixture ratio of each zeotropic fluid, corresponding to the highest energy recovery, is selected for final energy, environmental, and economic assessment.
As a result of applying this methodology, Table 5 presents the zeotropic mixtures selected for examination in this study.
Although carbon dioxide mixtures with R1233zd(E), R1234yf, R1234ze(E), and R1234ze(Z) are initially considered suitable, the evaluation of the temperature glide in both evaporator and condenser showed values between 40 and 90 K, which are excessively high for effective heat transfer processes. Consequently, the thermodynamic evaluation focuses on Novec 649-based zeotropic mixtures, as summarized in Table 5.

2.4. Environmental Assessment

The deployment of energy efficiency technologies in the maritime sector responds to both environmental and economic imperatives. A primary objective of such systems is to reduce air pollutant emissions, thereby ensuring compliance with IMO regulations. The proposed system simultaneously provides cold energy and electrical power to the vessel, enabling either an increase in onboard energy availability at constant fuel consumption or a reduction in fuel use while maintaining the same level of service. This improvement in energy efficiency directly translates into lower pollutant emissions.
In this study, the environmental performance of the proposed system is evaluated by estimating potential reductions in carbon dioxide (CO2), methane (CH4), and nitrous oxide (N2O) emissions, in accordance with the European Monitoring, Reporting, and Verification framework established under Regulation (EU) 2023/957, effective from 1 January 2024 [8,9]. Emission factors for CO2, CH4 and N2O are taken from the Fourth IMO Greenhouse Gas Study and reports published by the International Council on Clean Transportation [2,58]. Once all emissions are determined, total CO2-equivalent emissions are calculated using GWP values provided by the Intergovernmental Panel on Climate Change [59].
These estimates of CO2-equivalent emissions are particularly relevant for the subsequent economic assessment, as they influence GHG pricing mechanisms, operational costs, and potential financial benefits.

Total Equivalent Warming Impact

In addition to the direct emission reductions obtained through the implementation of the waste energy recovery system, further long-term environmental advantages arise from exploiting onboard cold energy and replacing the original working fluid with an ultra-low GWP alternative. This broader effect is quantified using the Total Equivalent Warming Impact metric, which incorporates both direct emissions, mainly related to potential refrigerant leakage during system operation, and indirect emissions linked to the energy consumption required to satisfy refrigeration or HVAC cooling loads [60]. Within the present analysis, TEWI is expressed in kilograms of CO2-equivalent and is used as a benchmarking indicator for evaluating the environmental performance of the selected organic fluids relative to the original system configuration:
T E W I = G W P · L 100 · n · m + G W P · m · 1 α + n · E a n n u a l · β
The initial term of the TEWI formulation accounts for possible refrigerant leakages. In this expression, G W P denotes the global warming potential of the working fluid, L represents the annual leakage rate (kg/year), n is the assumed remaining lifetime of the system (taken as 20 years, reflecting the operational age of the case study vessel), and m denotes the total refrigerant charge required for system operation. The second term accounts for recovery losses at the end of the equipment’s service life, where α is the recovery factor, which corresponds to the proportion of refrigerant recovered and recycled before final disposal. The third term considers indirect emissions associated with electrical energy use throughout system operation. In this case, E a n n u a l denotes the total annual electricity usage, and β is the CO2 emission factor, expressing the amount of CO2 emitted per unit of electricity generated (kg CO2/kWh). The values of L and α vary depending on the specific organic fluid and are provided in Table 6.

2.5. Economic Assessment

The second major objective influenced by the implementation of energy efficiency systems is the economic performance of the vessel. This impact can be assessed from several perspectives. Increasing the amount of useful energy extracted from the same quantity of fuel reduces overall consumption, which becomes particularly relevant as the maritime sector transitions toward alternative fuels whose prices are expected to be higher than those of conventional marine fuels [63]. Beyond the direct savings associated with reduced fuel use, energy efficiency technologies also support the industry’s compliance with emerging market-based mechanisms, such as the already in-force European Union Emissions Trading System, that assign a monetary cost to CO2-equivalent emissions derived from CO2, CH4, and N2O, as analyzed in the environmental assessment.
Regulatory instruments such as the EU ETS and the forthcoming IMO Net-Zero Framework establish financial incentives for emission reduction by generating revenues from emitters that exceed predefined emission allowances. Within this regulatory context, the present study evaluates the Greenhouse Gas Abatement Cost (GHG-AC) of the proposed system. This indicator expresses the monetary cost required to abate one ton of CO2-equivalent emissions and provides a benchmark for judging the system’s competitiveness against existing carbon pricing mechanisms. Lower GHG-AC values indicate a more economically attractive technology when compared with the cost of emission allowances, such as EU ETS credits or IMO Remedial Units. The calculation of GHG-AC is based on the total system cost:
C t o t a l = C C O 2 + C H V A C + C O R C c o l d + C O R C W H
C = C p · F B M
log C p = K 1 + K 2 · log X + K 3 · l o g X 2
F B M = B 1 + B 2 · F M · F P
log F P = C 1 + C 2 · log P + C 3 ( log P ) 2
C P 2025 = C P r e f · C E P C I 2025 C E P C I r e f
In these expressions, C P represents the base equipment cost, B M is the bare module factor, F M is the material factor, F P is the pressure factor, and P denotes the design pressure [64]. The capacity parameter is designated as X . Additional cost correction factors, K n , C n , and B n , are provided in Table 7.
To account for present market conditions, all base equipment costs C P r e f are adjusted using the Chemical Engineering Plant Cost Index (CEPCI). For this purpose, a CEPCI value of 798.6 is adopted for 2025, while a value of 607.5 is used for the reference year, as the original cost correlations are developed based on 2017 price levels [65].
The calculation of the GHG-AC incorporates both the capital expenditure (CAPEX) associated with the installation of the waste energy recovery system and the annual operating expenditure (OPEX) over its operational lifetime, n , defined as 20 years for the case study vessel. This also accounts for savings derived from reduced fuel consumption in the production of electrical power and cooling. In this study, the average LNG fuel price is assumed to be 720 Euro/ton over one year [66].
Economic benefits resulting from CO2-equivalent emissions abatement are likewise included, specifically through reduced payments to the EU ETS. A weighting factor of 1 is applied to account for the vessel’s operational time within EU waters. This represents a specific case, as the vessel operates entirely within the Mediterranean Sea, as illustrated in Figure 2. The GHG-AC metric also considers the economic effect of time on capital by discounting CO2-equivalent savings over the system’s lifetime:
G H G A C =   C A P E X + O P E X y e a r · n F u e l s a v i n g s · F u e l p r i c e C O 2 s a v i n g s · C O 2 E U   E T S · E U w e i g h t · n   C O 2 s a v i n g s ·   1 + r n
The total system cost,   C t o t , calculated using the parameters in Table 7, represents the CAPEX of the proposed system, while the OPEX is estimated as 6% of the CAPEX [67]. The operational lifespan is assumed to be 20 years, corresponding to the remaining lifespan of the vessel. Average price of EU Emission Allowances (EUAs) during the previous year is 82.89 Euro/EUA so this is utilized [68]. In the GHG-AC equation, r denotes the discount rate, which is set at 5% [69]. EU weighting factor is considered to be 100%, reflecting that the vessel operates exclusively in the western Mediterranean throughout the year.
To evaluate the economic feasibility of the proposed waste energy recovery system, both payback period and discounted payback period are calculated. The payback period represents the number of years required for the cumulative net annual savings generated by the system to equal the initial investment:
P a y b a c k =   C A P E X   A n e t
where the capital expenditure is divided by the net annual savings, A n e t , obtained from fuel savings and avoided emission costs after subtracting operational expenses.
The discounted payback period is also calculated as it incorporates financial discounting to reflect the impact of time on future cash flows. It identifies the first year T in which the cumulative discounted savings equal or exceed the initial investment:
t = 1 T A n e t 1 + r t   C A P E X
These two metrics provide a consistent framework to assess investment recovery under both nominal and discounted economic conditions.
To account for the uncertainty associated with LNG fuel prices, a Monte Carlo simulation is conducted to evaluate the variability of the discounted payback period for the proposed recovery system. A total of 100,000 iterations are performed, with fuel prices randomly sampled from a uniform distribution ranging from 400 to 1200 Euro per ton. For each scenario, annual net cash flows are calculated as the sum of fuel cost savings and avoided EU ETS payments, minus operating expenditures. The discounted payback period for each iteration is then computed by accumulating these cash flows over a 20-year project horizon at a discount rate of 5% [70]. The simulation results are subsequently aggregated to obtain the median discounted payback across all iterations and to assess the proportion of cases achieving full investment recovery within the project lifetime.

3. Results and Discussion

This section outlines the results related to carbon capture, zeotropic mixture selection and the corresponding thermodynamic, environmental, and economic performance.

3.1. Model Validation

3.1.1. Carbon Capture

The carbon capture liquefaction unit operates by recovering cold energy released during the regasification of the LNG fuel supplied to the ship engines. Since this subsystem functions exclusively as a cold energy source for the CO2 liquefaction process, the recovered cold energy is quantified using Equation 1. The calculation is based on a straightforward energy balance supported by thermophysical properties obtained from REFPROP 10.0 [41]. Due to the absence of complex internal dynamics, control interactions, or transient behavior, analytical evaluation is sufficient and no additional empirical validation is required for this component.

3.1.2. Cold Energy Organic Rankine Cycle

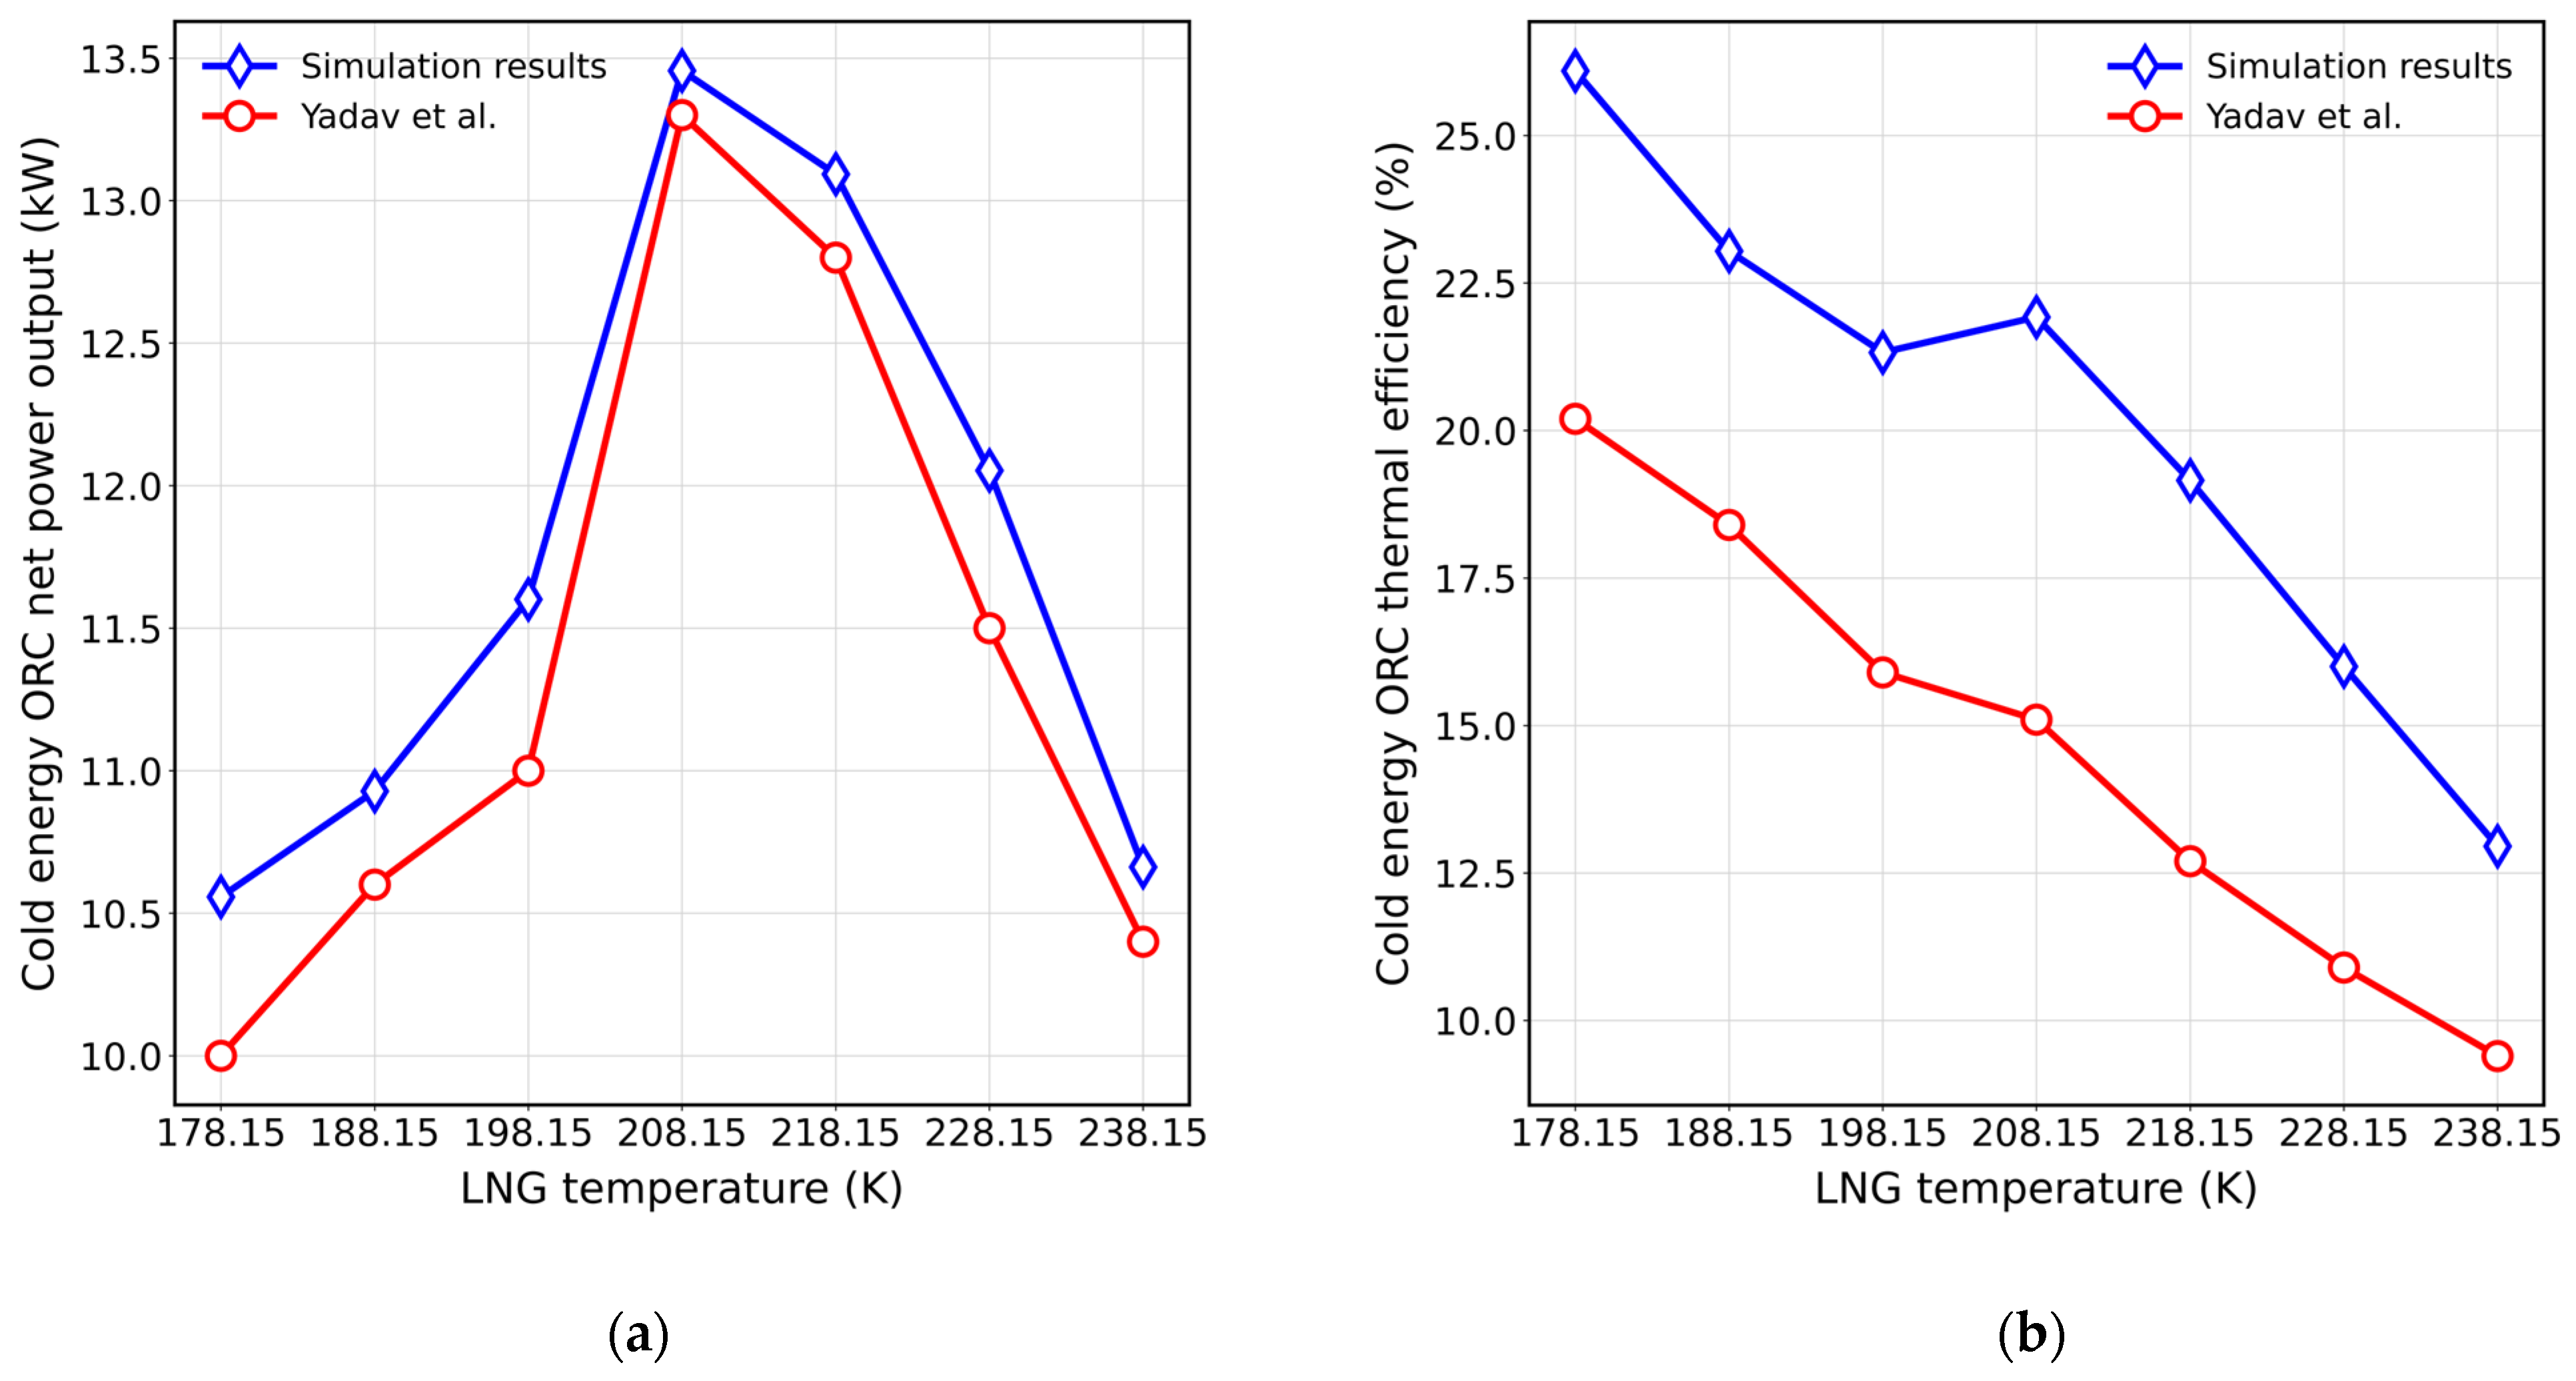
To validate the proposed cold energy ORC, the study by Yadav et al. [71] is used as a reference. In this work, a LNG stream provided cold energy to a single-stage ORC operating with ethane, classified as A3 by the ASHRAE Standard 34 and thus flammable. For consistency, the same working fluid is employed in the present validation. The comparison, shown in Figure 6, demonstrates a close agreement between the proposed model and the reference data. The largest divergence occurs in the thermal efficiency, with a relative error of 0.61%. This value is well below the uncertainty levels typically reported in steady-state ORC thermodynamic modeling studies, where deviations within 1–5% are generally considered acceptable due to differences in thermophysical property databases [67,72].

3.1.3. HVAC

To verify the reliability of the enhanced HVAC system model, a validation study is carried out using manufacturer specifications as the performance reference. In this improved configuration, an LNG heat exchanger supplies additional cooling energy to the HVAC system, thereby reducing the power demand of the compressors. The baseline operation of the system, which utilizes R407C as the working fluid, is reproduced in the simulation environment. The validation focuses on three primary performance indicators: compressor power consumption, cooling capacity at the evaporator, and heat rejection at the condenser. Table 8 provides a comparison between the manufacturer data and the simulated results, together with the corresponding relative errors for each metric.
Table 8 shows that the relative error for all evaluated performance indicators remains below 3%, demonstrating strong agreement between the simulation results and the manufacturer data. Deviations of this magnitude are generally considered acceptable in HVAC system modeling and validation studies [73].

3.1.4. Waste Heat Organic Rankine Cycle

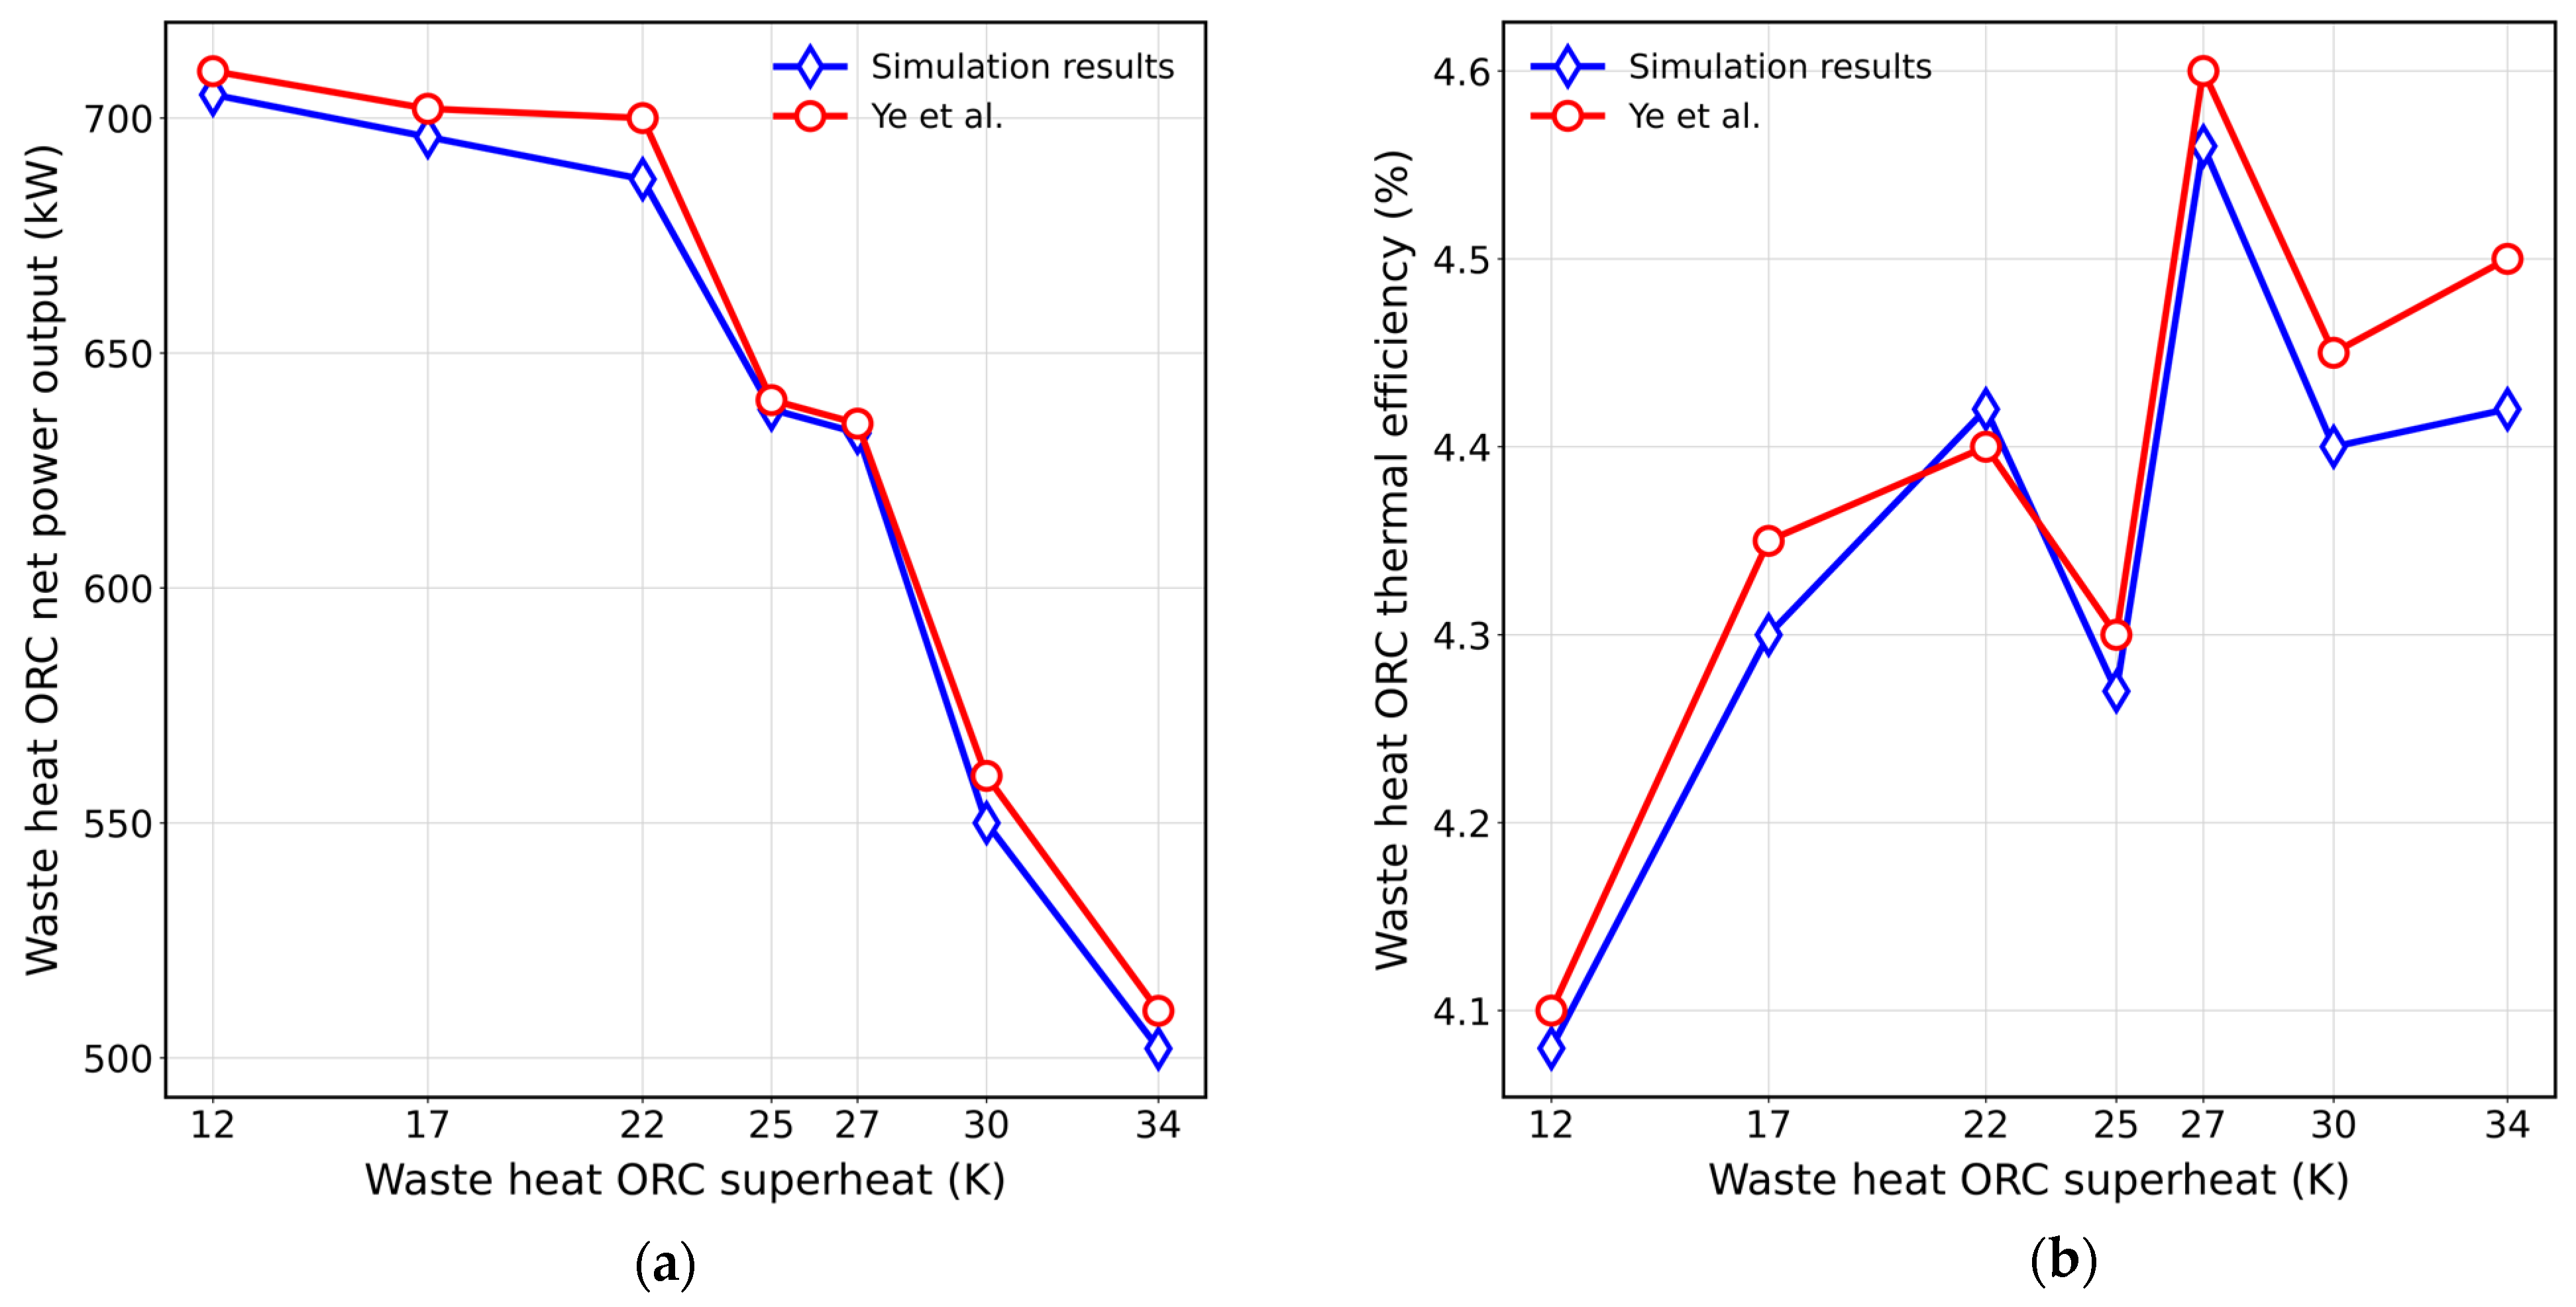
To the best of the authors’ knowledge, no waste heat recovery ORCs have previously been investigated using Novec 649-based zeotropic mixtures. Therefore, to verify the accuracy of the proposed waste heat ORC model, an additional simulation is carried out with pure R1234ze(Z) as the working fluid. The simulation outcomes are compared with the reference data reported by Ye et al. [74], as illustrated in Figure 7. The comparison shows excellent agreement, with the largest relative deviations in output power and thermal efficiency being 1.86 and 1.78%, respectively. These deviations remain well below the commonly accepted threshold of 5%, which confirms the reliability of the developed system.

3.2. Performance Assessment

Section 3.2 presents a parametric sensitivity analysis of the integrated system performance with respect to the most influential operating parameters.

3.2.1. Carbon Capture and Storage System

The cold energy available from LNG during its regasification provides 363.1 kW of thermal capacity, which is utilized to liquefy 66% of the CO2 contained in the exhaust gas stream. Within this process, the heat exchanger has 65.8 kW of irreversibilities. Although the LNG stream contains sufficient cold energy to liquefy a larger fraction of CO2, the amount recovered is ultimately limited by the capacity of the onboard storage tank, which in turn is constrained by the space available on the HSC vessel. Such magnitudes are consistent with previously reported studies in maritime CCS applications [75], where storage constraints are frequently identified as a practical limiting factor.

3.2.2. Cold Energy Organic Rankine Cycle

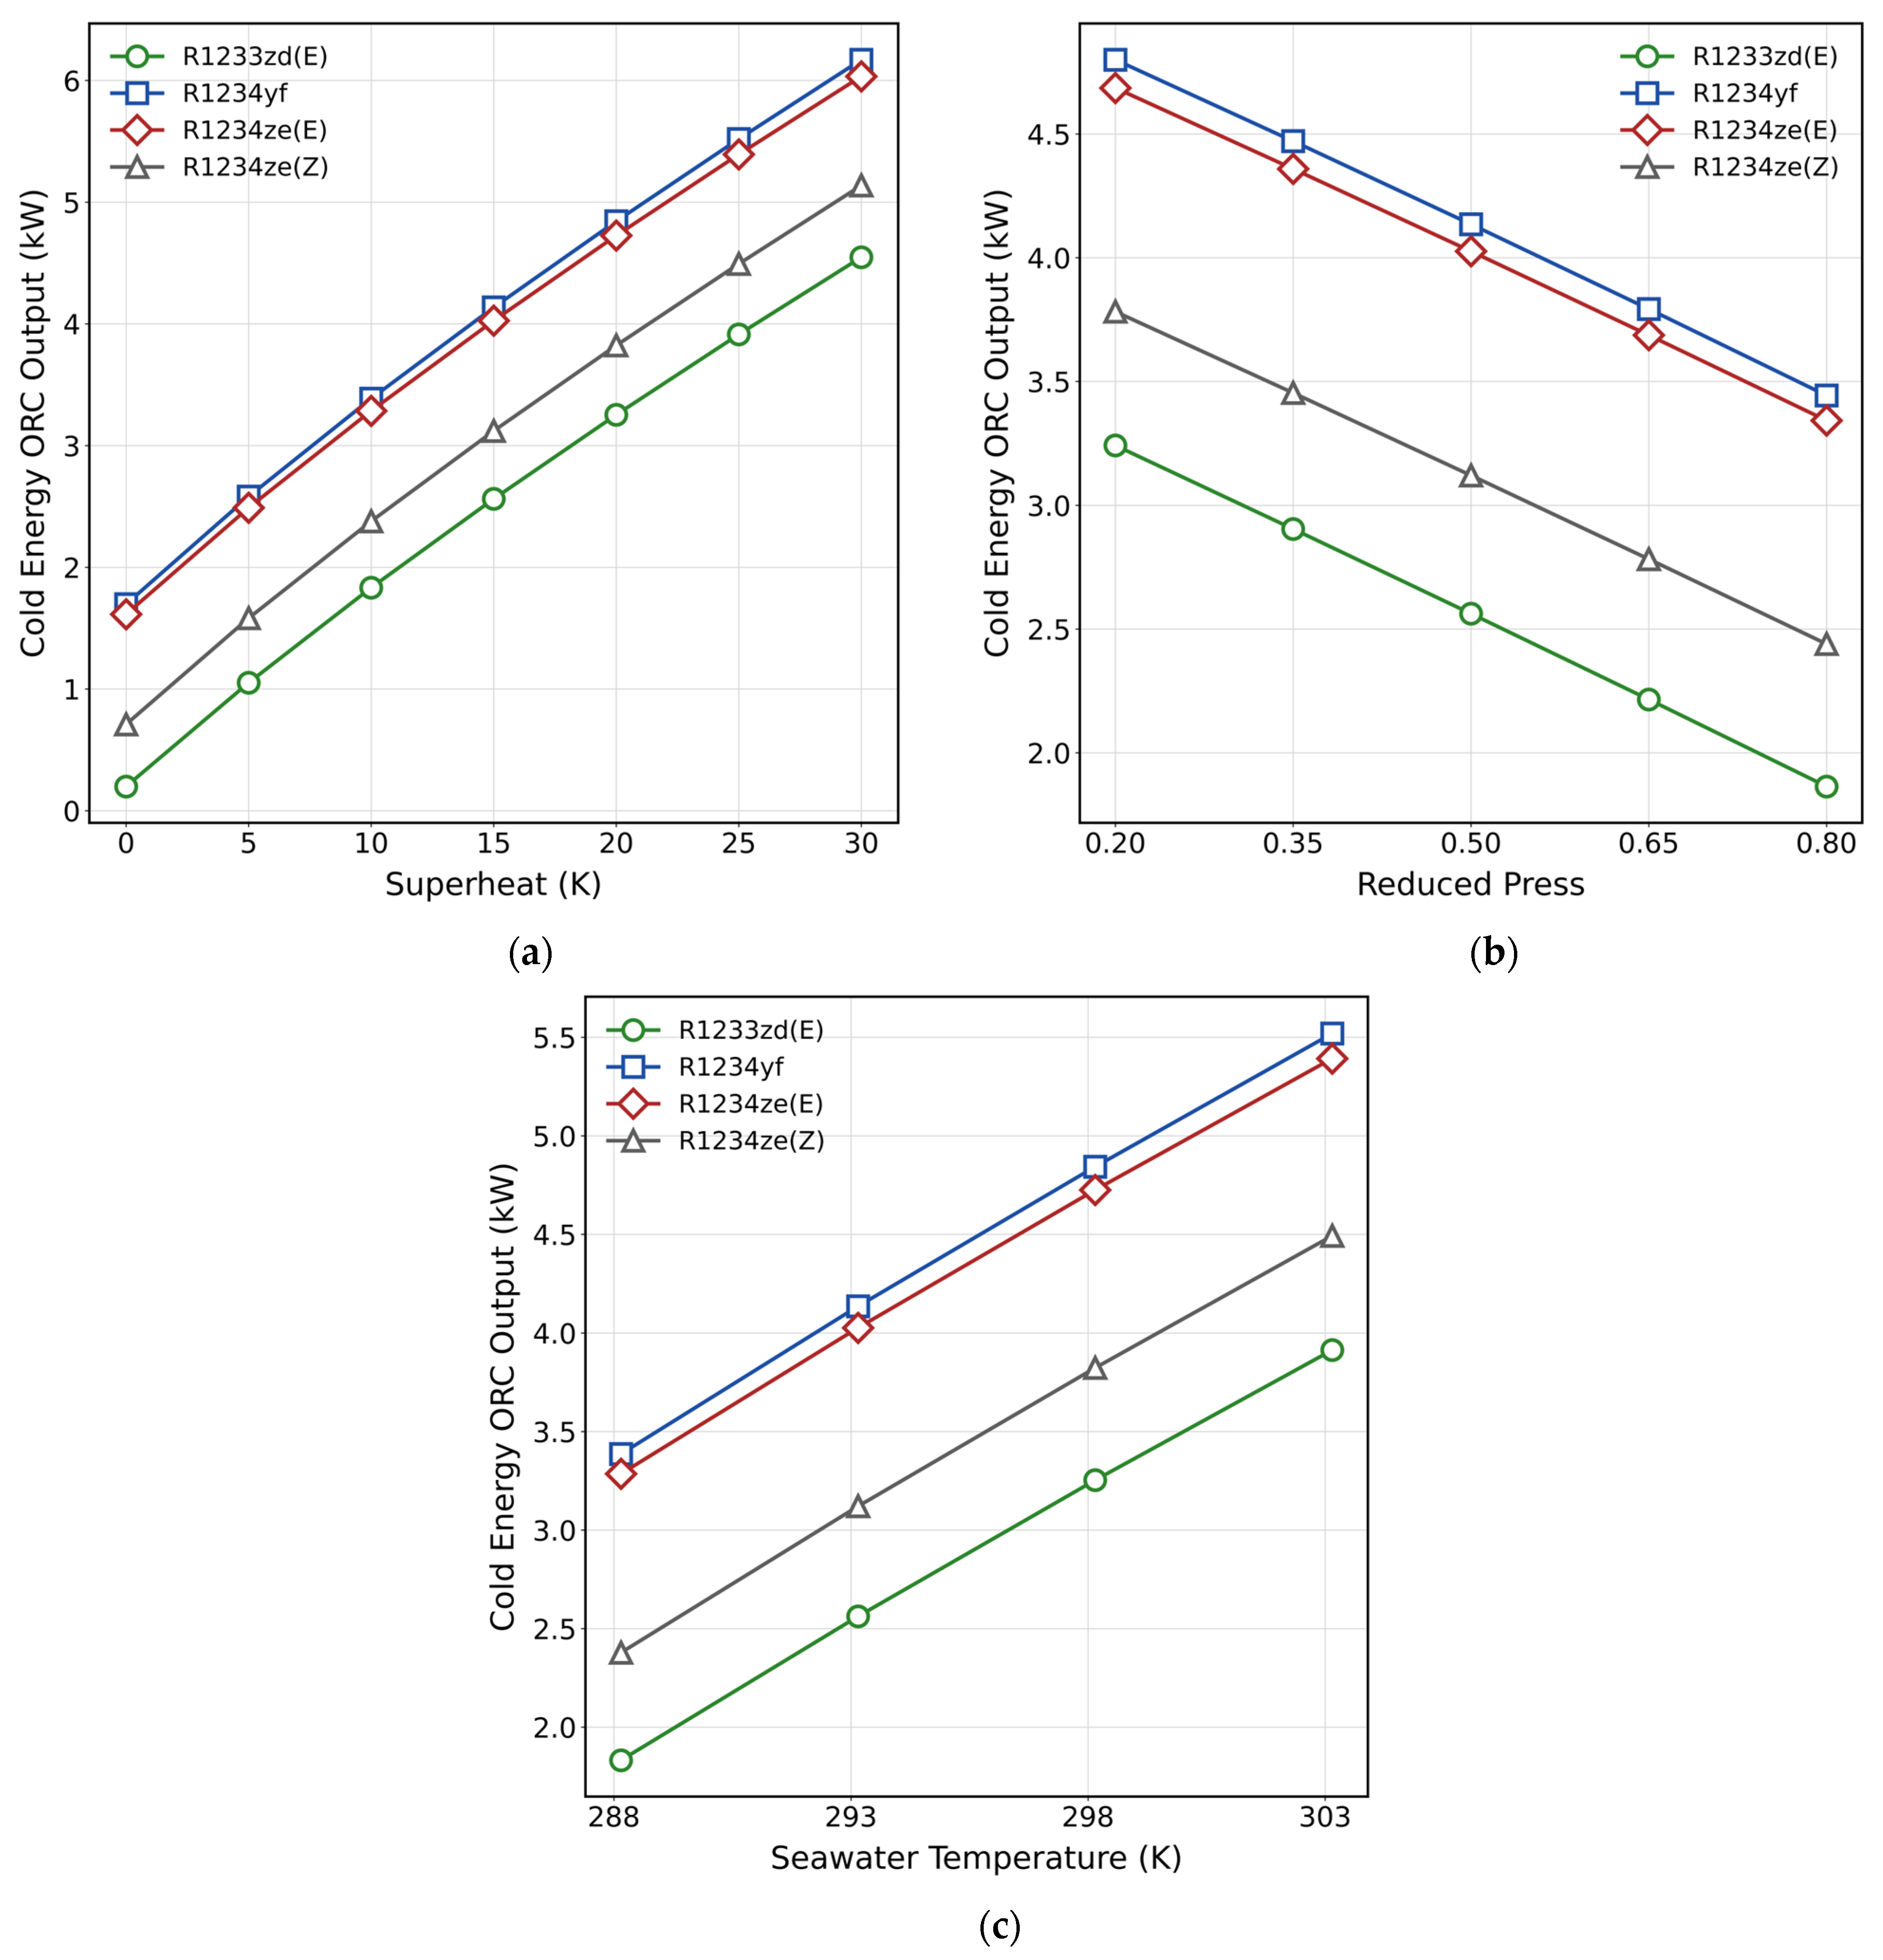
To quantify the electrical power generated from the recovered cold energy in the cold energy ORC, ambient boundary conditions are defined using representative average temperatures for the vessel operating region. Air and seawater temperatures are therefore set to 293.15 K. When assessing the influence of superheat, the reduced pressure is maintained at a value of 0.5. Conversely, when examining the effect of reduced pressure, the superheat is held constant at 15 K. In the analysis of seawater temperature sensitivity on cold ORC performance, the system is evaluated with a superheat of 15 K and a reduced pressure of 0.5. Figure 8 presents the resulting variations in power output as these boundary conditions are modified.
From Figure 8, it is observed that increasing superheat improves the power output of the cold energy ORC. Although the four zeotropic mixtures exhibit very similar behavior, with an average rise of approximately 0.13 kW per K of added superheat, the highest power output is obtained with R1234yf, closely followed by R1234ze(E). When examining the effect of the evaporation pressure, an increment in the reduced pressure results in a decline in the recovered power. All mixtures experience a similar reduction rate of about 0.23 kW for each increase of 0.1 in reduced pressure. This reduction reflects the greater pump work required at higher pressures, which decreases the net available power. Similar sensitivity to evaporation pressure has been reported in other LNG-based cold energy recovery systems, where excessive pressure levels reduce net power due to increased compression work [76].
The influence of seawater temperature follows expected thermodynamic trends. Warmer seawater enhances performance because it increases the temperature difference between the cold energy source and sink in the ORC [70]. However, seawater temperature cannot be controlled by onboard crewmembers. Therefore, the evaporation pressure is identified as the most critical parameter for optimizing the cold energy ORC.

3.2.3. HVAC Cooling Services

The retrofit of the HVAC system, incorporating cold energy recovered from the heating of the natural gas used as engine fuel, reduces the work required by the system compressor, ultimately improving the overall energy efficiency of the system. Table 9 presents the compressor power consumption for each of the evaluated zeotropic mixtures.
The savings achieved by incorporating the cold energy source are substantial and are reflected in the reduced work required by the compressor, which is reduced to 32.3% in the worst-case scenario, corresponding to the mixture of Novec 649 and R1233zd(E). In addition to this clear benefit, replacing R407C, which has a GWP of 1700, with fluids having a GWP below 4 significantly reduces the environmental impact in the event of a leakage [61].

3.2.4. Waste Heat Organic Rankine Cycle

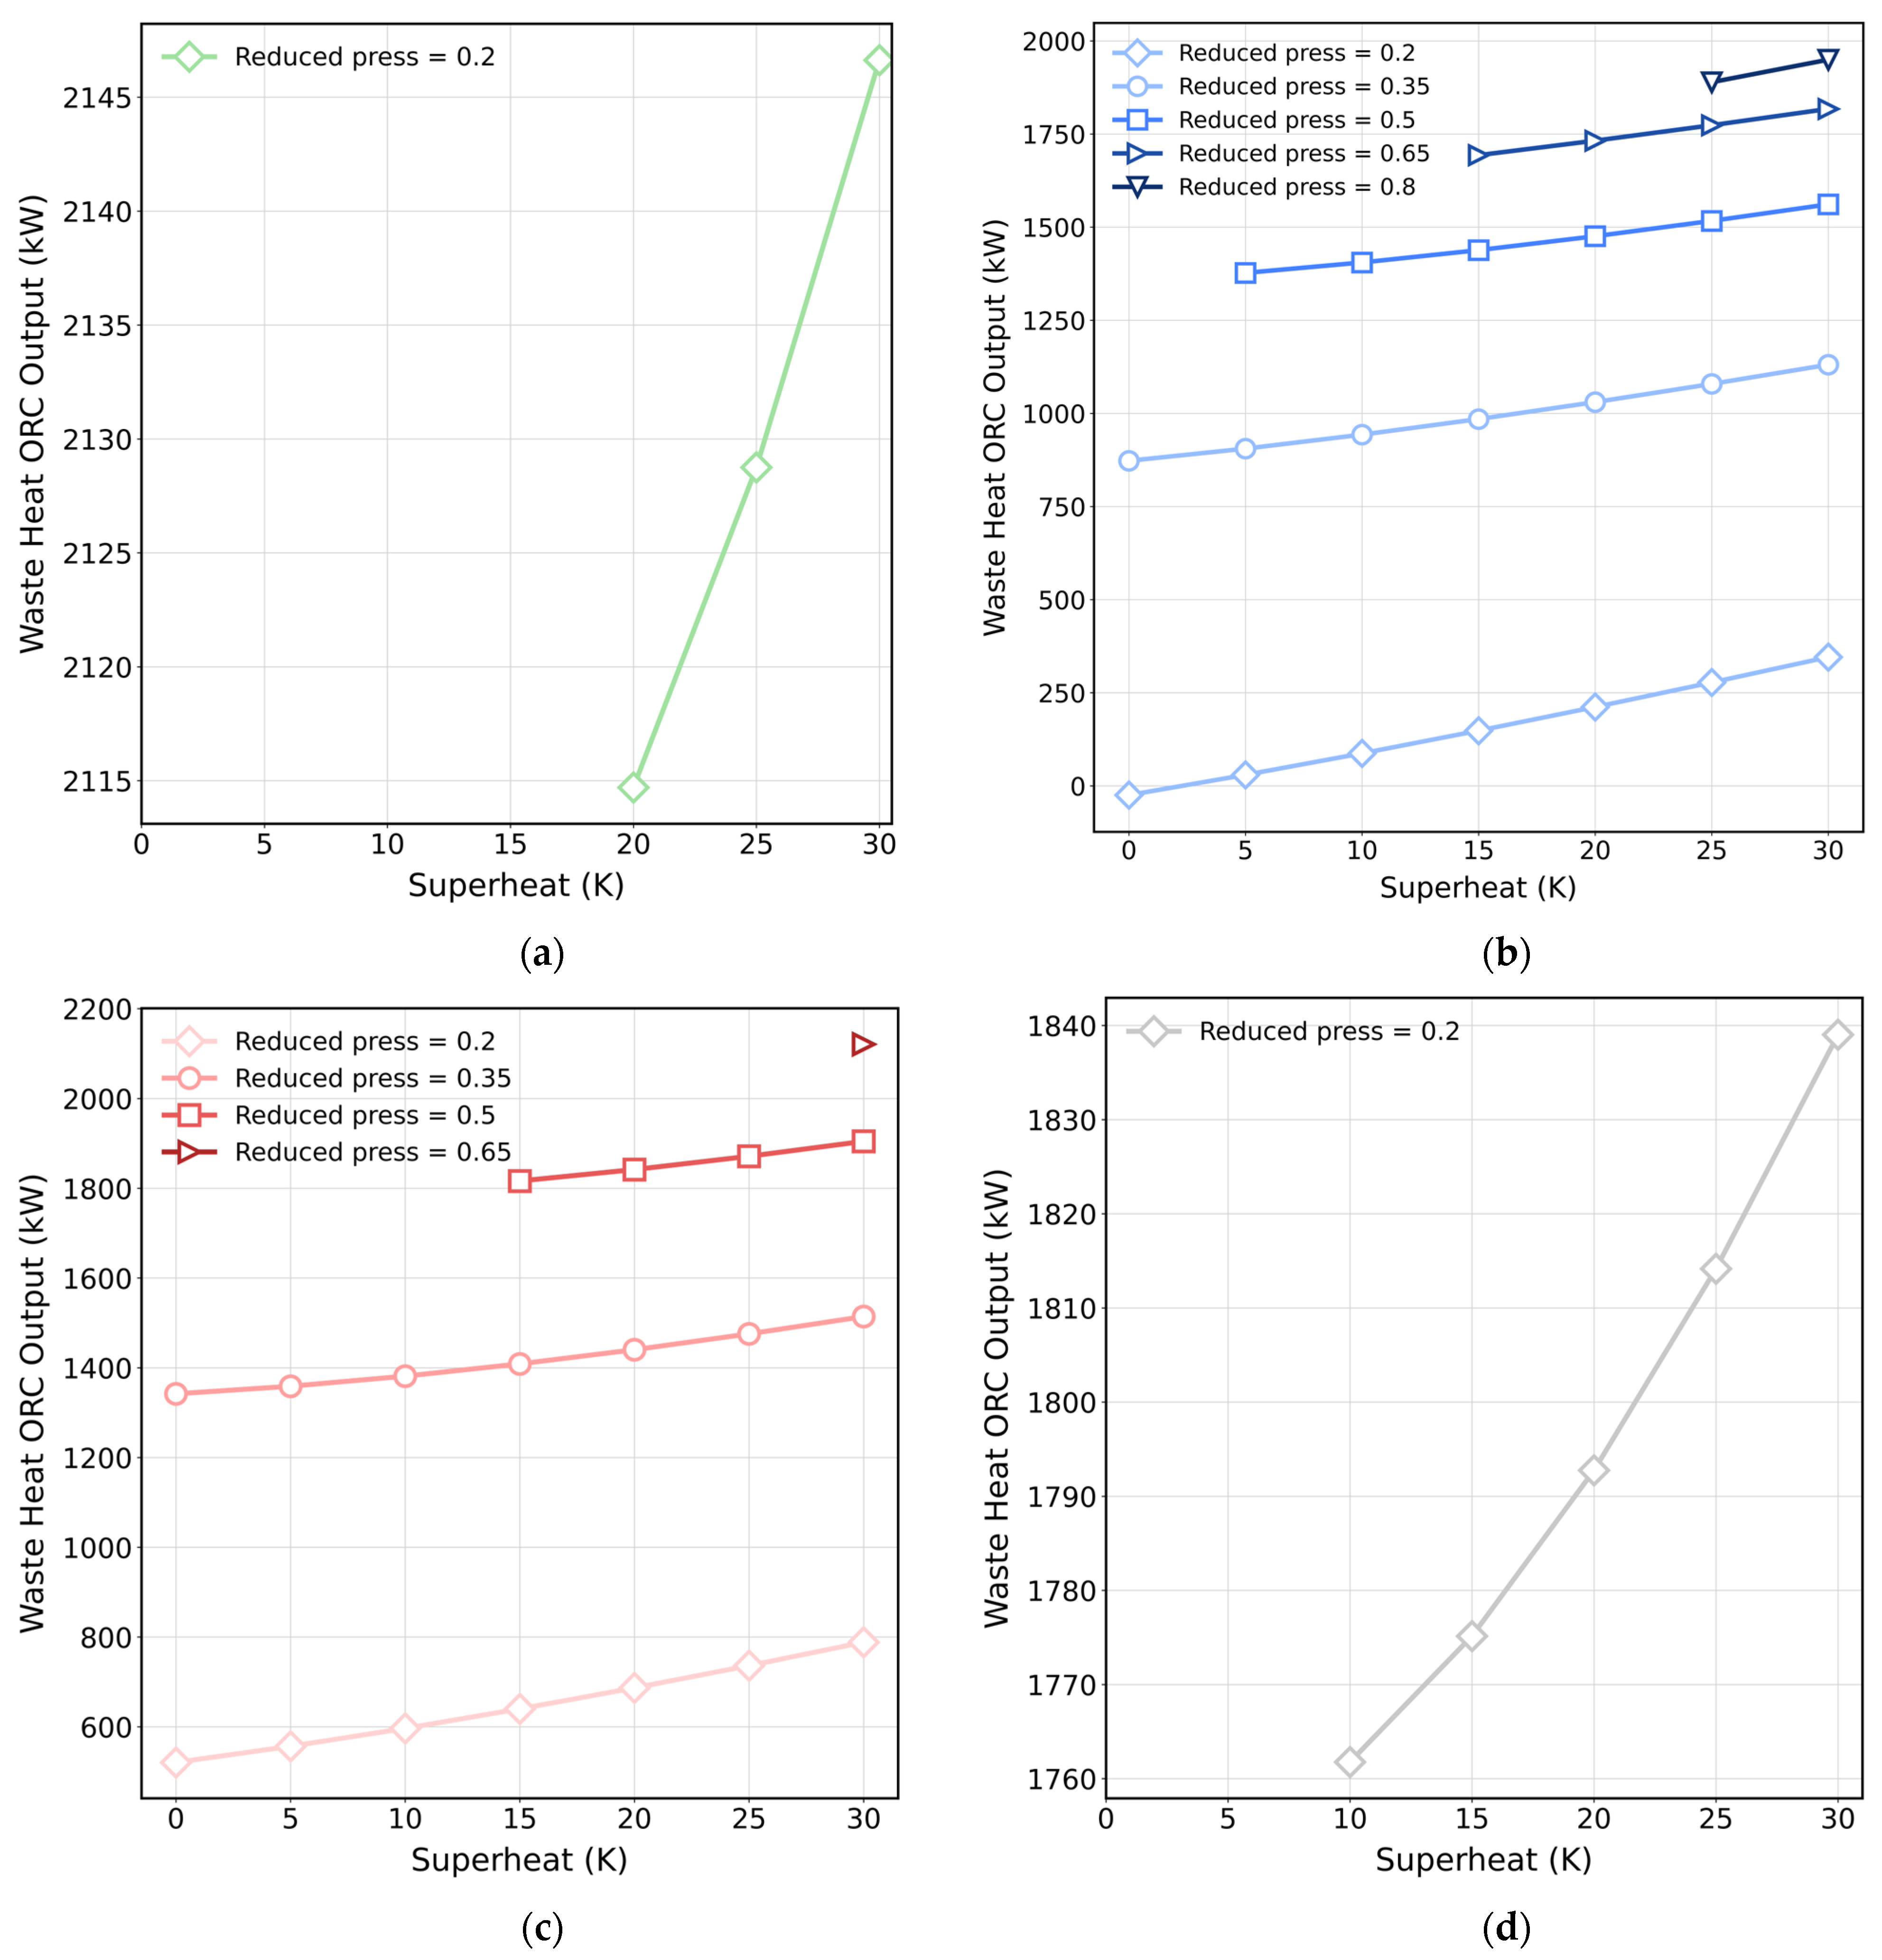
For the evaluation of the waste heat ORC, a methodology similar to that applied in the cold energy ORC case is initially considered. However, the thermophysical behavior of the zeotropic mixtures introduces operational constraints that limit feasible cycle configurations. In particular, when a high reduced pressure is selected, a considerable degree of superheat is required to ensure that expansion occurs entirely within the vapor region. These limitations vary among the investigated Novec 649-based mixtures. Figure 9 illustrates the influence of superheat on the power output of the four candidate mixtures at the reduced pressure levels where expansion remains in the vapor phase. For this analysis, air and seawater temperatures are held constant at 293.15 K, as their effect on turbine power output is marginal compared with the dominant influence of superheat and reduced pressure.
Apart from the limitations imposed by temperature glide, employing Novec 649-based zeotropic mixtures in a low-grade waste heat ORC introduces additional operational challenges. The mixtures listed in Table 5 are not efficient under all pressure levels, since expansion may occur within the two-phase region. This condition requires higher superheat to ensure full vapor expansion, and in some cases the working fluid becomes unsuitable for proper ORC operation. Such limitations are widely documented in ORC design literature, where two-phase expansion is avoided to prevent turbine blade erosion and efficiency losses [77]. The need for additional superheat to guarantee dry expansion aims to maintain vapor-phase expansion and protect turbomachinery integrity [78]. Among the fluids assessed, R1234yf demonstrates the greatest operational flexibility, remaining fully usable across the entire range of reduced pressures analyzed (0.2 to 0.8) and only requiring superheating when the reduced pressure exceeds 0.5 times the cricondenbar pressure. Under those conditions, the waste heat ORC equipped with R1234yf reaches 1949.4 kW of power output.
R1234ze(E) also exhibits robust performance, although at a reduced pressure of 0.65 it requires a superheat of 30 K to maintain the expansion in the vapor region, achieving 2120.9 kW. On the other hand, both R1233zd(E) and R1234ze(Z) are limited to operation at 0.2 times the cricondenbar pressure. While this may appear restrictive, the mixture of Novec 649 with R1233zd(E) can recover 2146.7 kW with 30 K of superheat at these lower pressures, which can be advantageous for system design since piping and components do not need to withstand the higher pressures required by R1234yf and R1234ze(E) to reach similar power levels. Overall, superheat enhances the thermodynamic performance of all zeotropic mixtures considered.
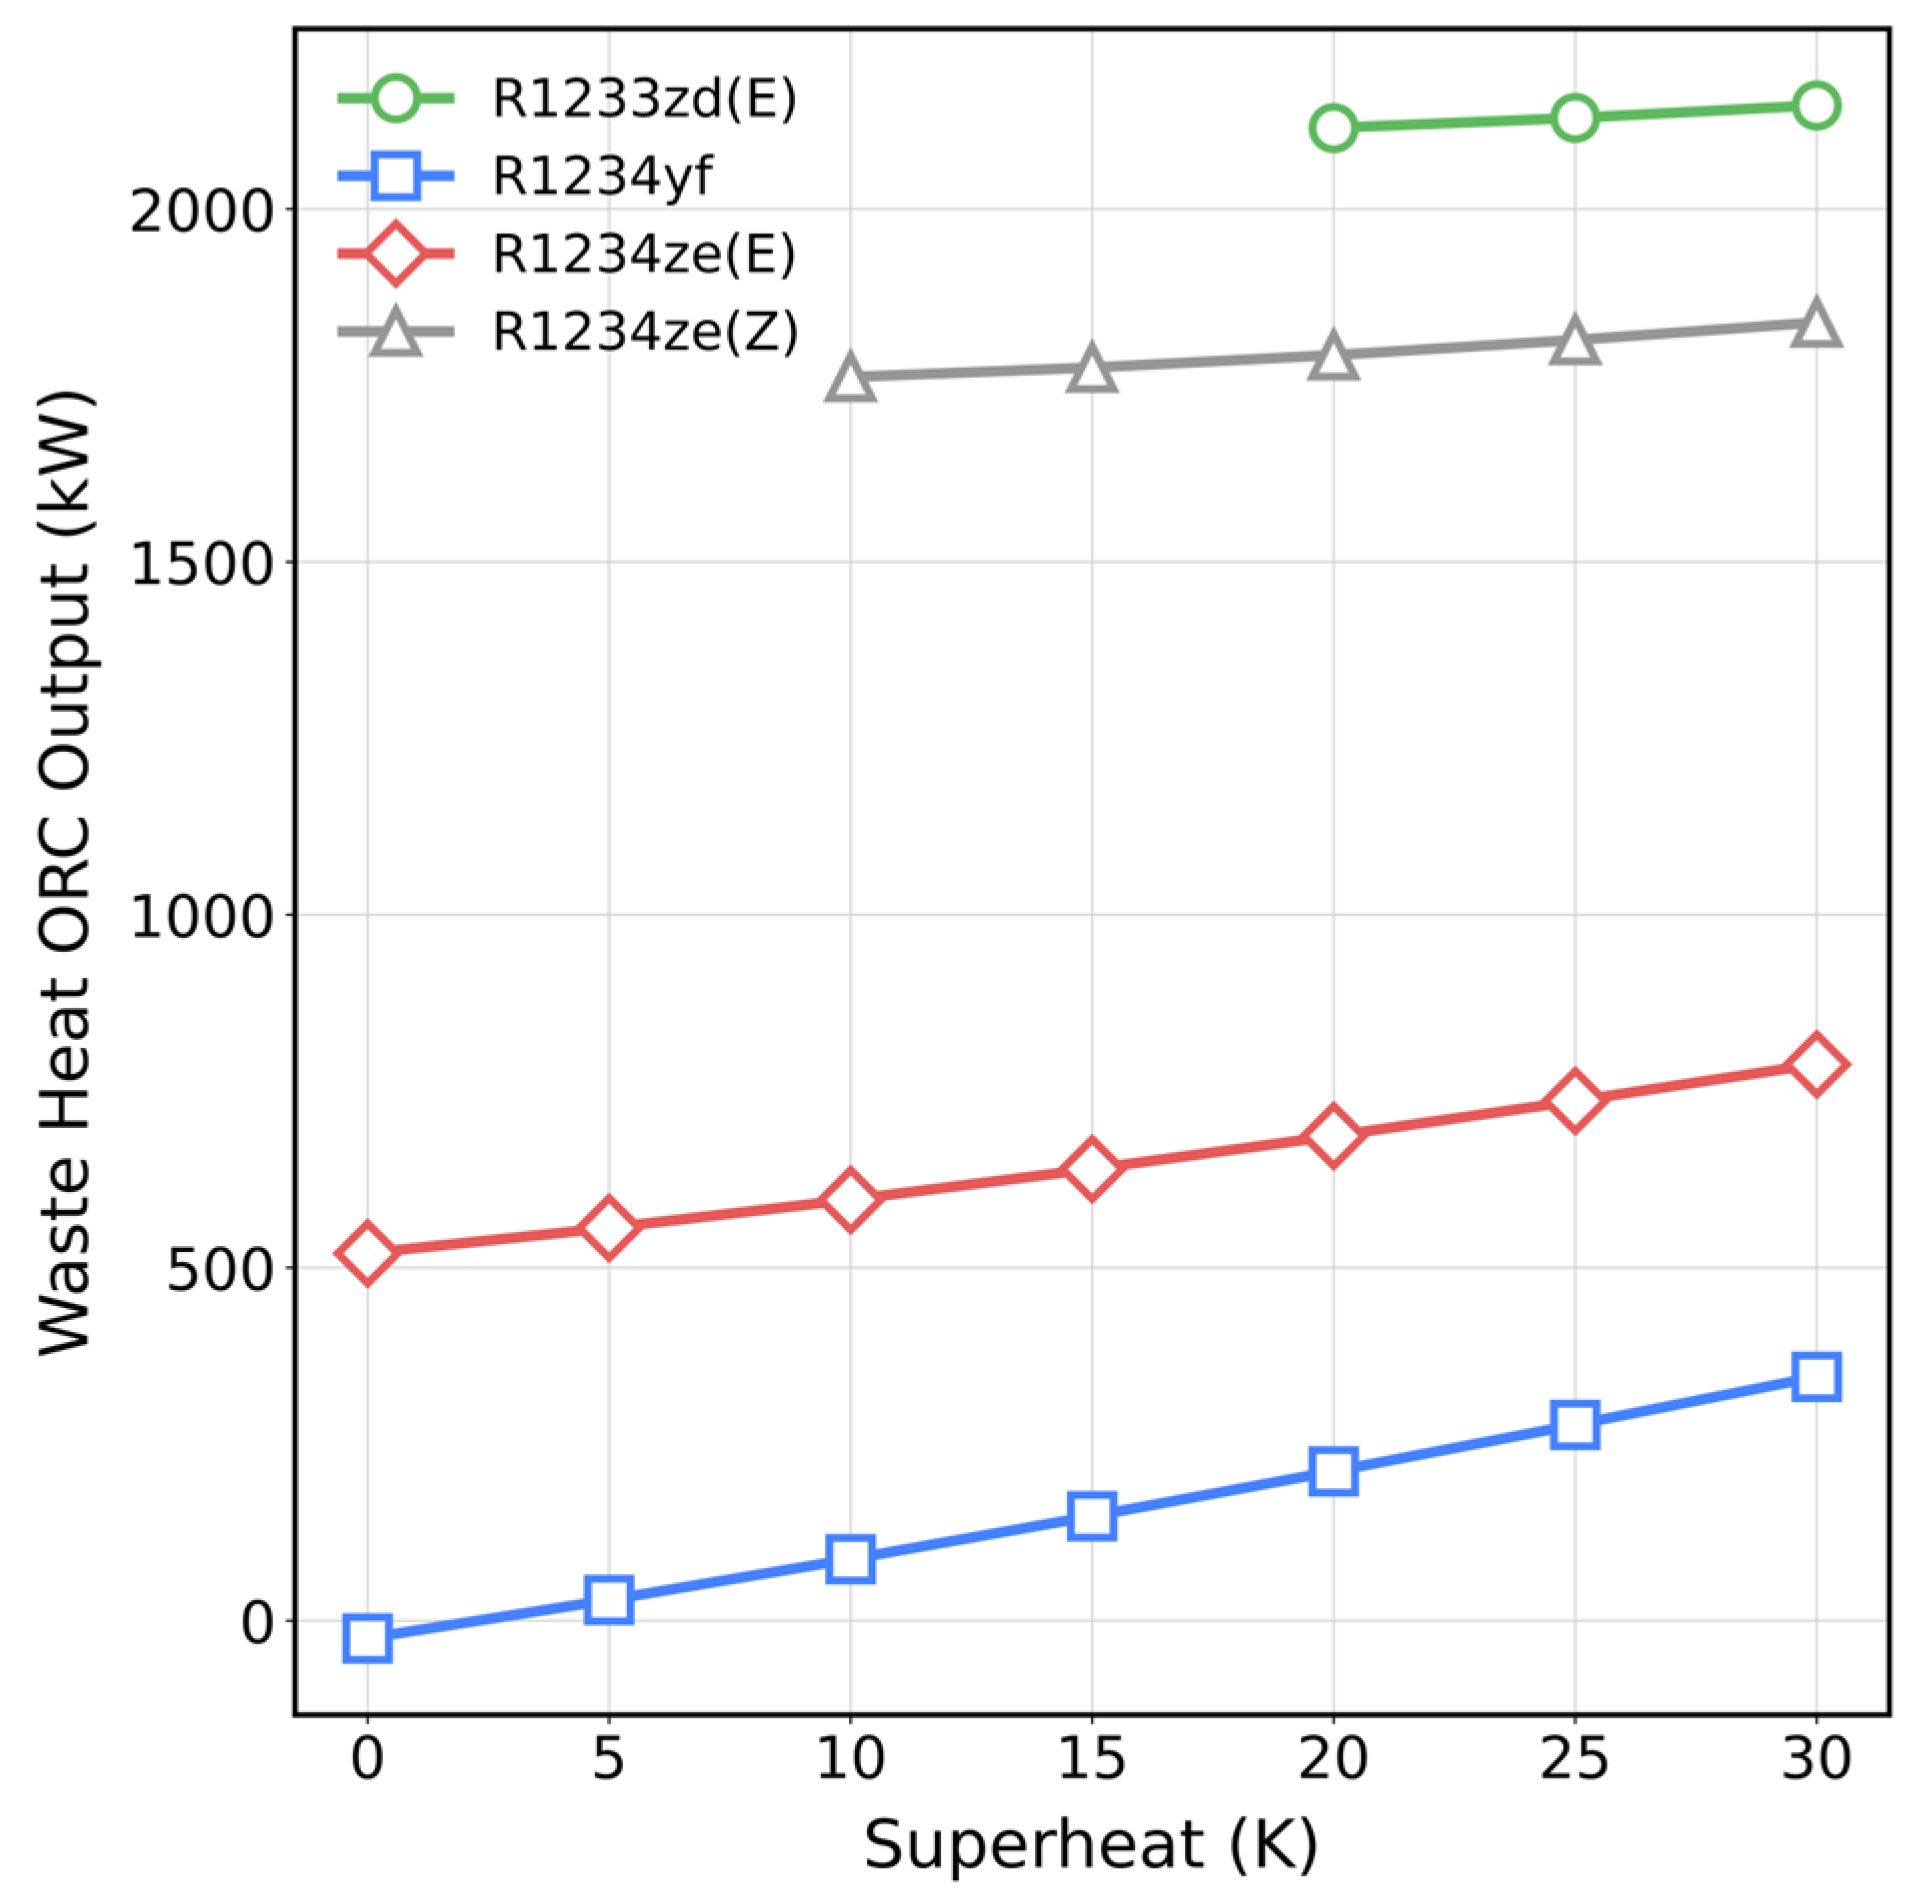
To enable a fair comparison of power output among the candidate working fluids, the reduced pressure is fixed at a value of 0.2 while air and seawater temperatures are maintained at 293.15 K. A sensitivity analysis is then performed to examine the influence of superheat on the waste heat ORC electrical output. The selection of a reduced pressure of 0.2 is based on its suitability across all four Novec 649-based zeotropic mixtures, as it allows a wider allowable superheat range while ensuring vapor phase expansion. Figure 10 presents the resulting variations in power production as a function of superheat for each candidate mixture.
The comparison presented in Figure 10 illustrates the observations discussed above. Although the range of operating conditions is more restricted, when evaluated at the same reduced pressure, the most versatile fluids recover substantially less power than the more constrained mixtures. Notably, the differences between R1233zd(E) and R1234yf, the most versatile mixture, are significant. When both mixtures are subjected to the same superheat and reduced pressure, the mixture containing R1233zd(E) produces 6.2 times more power (2146.7 kW compared with 345.5 kW, respectively).
The observed performance differences between R1234yf and R1234ze(E) are directly linked to their distinct thermophysical properties. R1234ze(E) exhibits a higher critical temperature (382.52 K) and critical pressure (36.35 bar) compared with R1234yf (367.85 K and 33.82 bar, respectively) [17]. The higher critical temperature allows R1234ze(E) to operate further from the critical region under the examined waste heat conditions, which can enhance the expansion work output at moderate reduced pressures. Conversely, the lower critical temperature of R1234yf results in higher vapor pressures at comparable operating temperatures, as it can be observed in Figure 9b, contributing to greater operational flexibility across a wider reduced pressure range. These differences in saturation curve behavior and proximity to critical conditions influence the required superheat to ensure dry expansion and ultimately explain the variations observed in power output and feasible operating envelopes.

3.2.5. Overall System Performance and Sensitivity Analysis

After evaluating the overall power production of the entire waste energy recovery system using each of the four zeotropic mixtures, their performance is ranked from highest to lowest power output as follows: R1233zd(E), R1234ze(E), R1234yf, and R1234ze(Z). Even the least effective mixture, R1234ze(Z), can achieve a significant recovery of 2301.4 kW if the evaporation pressure is controlled. The best-performing working fluid is the Novec 649 and R1233zd(E) mixture with a mass fraction of 10 to 90%. Under the operating conditions of a reduced pressure of 0.2 and a superheat level of 30 K in the waste heat ORC, this mixture generated a total recovered power of 2600.8 kW.
To assess the robustness of these results with respect to modeling assumptions, a dedicated sensitivity analysis was conducted on turbomachinery isentropic efficiencies. A variation of ±10% in turbine isentropic efficiency resulted in a change of 8.47% in total recovered power. In contrast, an equivalent ±10% variation in pump efficiency produced a substantially smaller impact of approximately 0.23% in net system power output. The comparatively limited influence of pump efficiency is consistent with the relatively low specific compression work of liquid phases compared with turbine expansion work in ORC systems.
Since evaporation pressure was identified as a critical optimization parameter, its coupling with condensation temperature was further examined. For the waste heat ORC, reduced-pressure sweeps were repeated at seasonal seawater inlet temperatures from Table 1. The results show that increasing condensation temperature reduces the achievable net power output due to higher condensing pressure, while the optimal reduced pressure remains consistently at 0.2 across the examined range. For the cold energy ORC, similar analyses performed at different LNG inlet temperatures show only marginal sensitivity of overall system power to reduced pressure variations under realistic LNG temperature fluctuations. These findings confirm that evaporation pressure remains the dominant optimization parameter, with limited coupling effects under typical maritime boundary conditions. In all tested cases, the relative ranking of the zeotropic mixtures remained unchanged.
Regarding the CO2 capture rate, it is noted that the available LNG cold energy is thermodynamically sufficient to liquefy up to 100% of the carbon dioxide contained in the exhaust stream. However, the adopted capture rate of 66% is constrained by onboard storage capacity. Consequently, variations in capture rate primarily affect storage logistics and economics rather than the net thermodynamic performance of the integrated system.
Although the present assessment is based on a specific high-speed craft operating under defined Mediterranean environmental conditions and nominal engine load, the integrated CCS–ORC concept is inherently scalable. Vessels with larger engine power ratings and higher exhaust mass flow rates, such as container ships or tankers, would be expected to exhibit greater absolute energy recovery potential due to increased thermal availability. It is also acknowledged that real maritime operation involves variable vessel speeds and fluctuating engine loads, which directly affect fuel consumption rate, exhaust gas temperature and mass flow rate, and consequently the thermal input to the energy recovery system. Under part-load conditions, a reduction in available thermal energy would decrease absolute recovered power. Nevertheless, thermodynamic principles governing working fluid selection, temperature matching and performance trends are not expected to change. Therefore, while the numerical values reported are case specific, the methodological framework and qualitative conclusions are considered transferable to other ship categories and operational scenarios.

3.2.6. Exergy Destruction Assessment

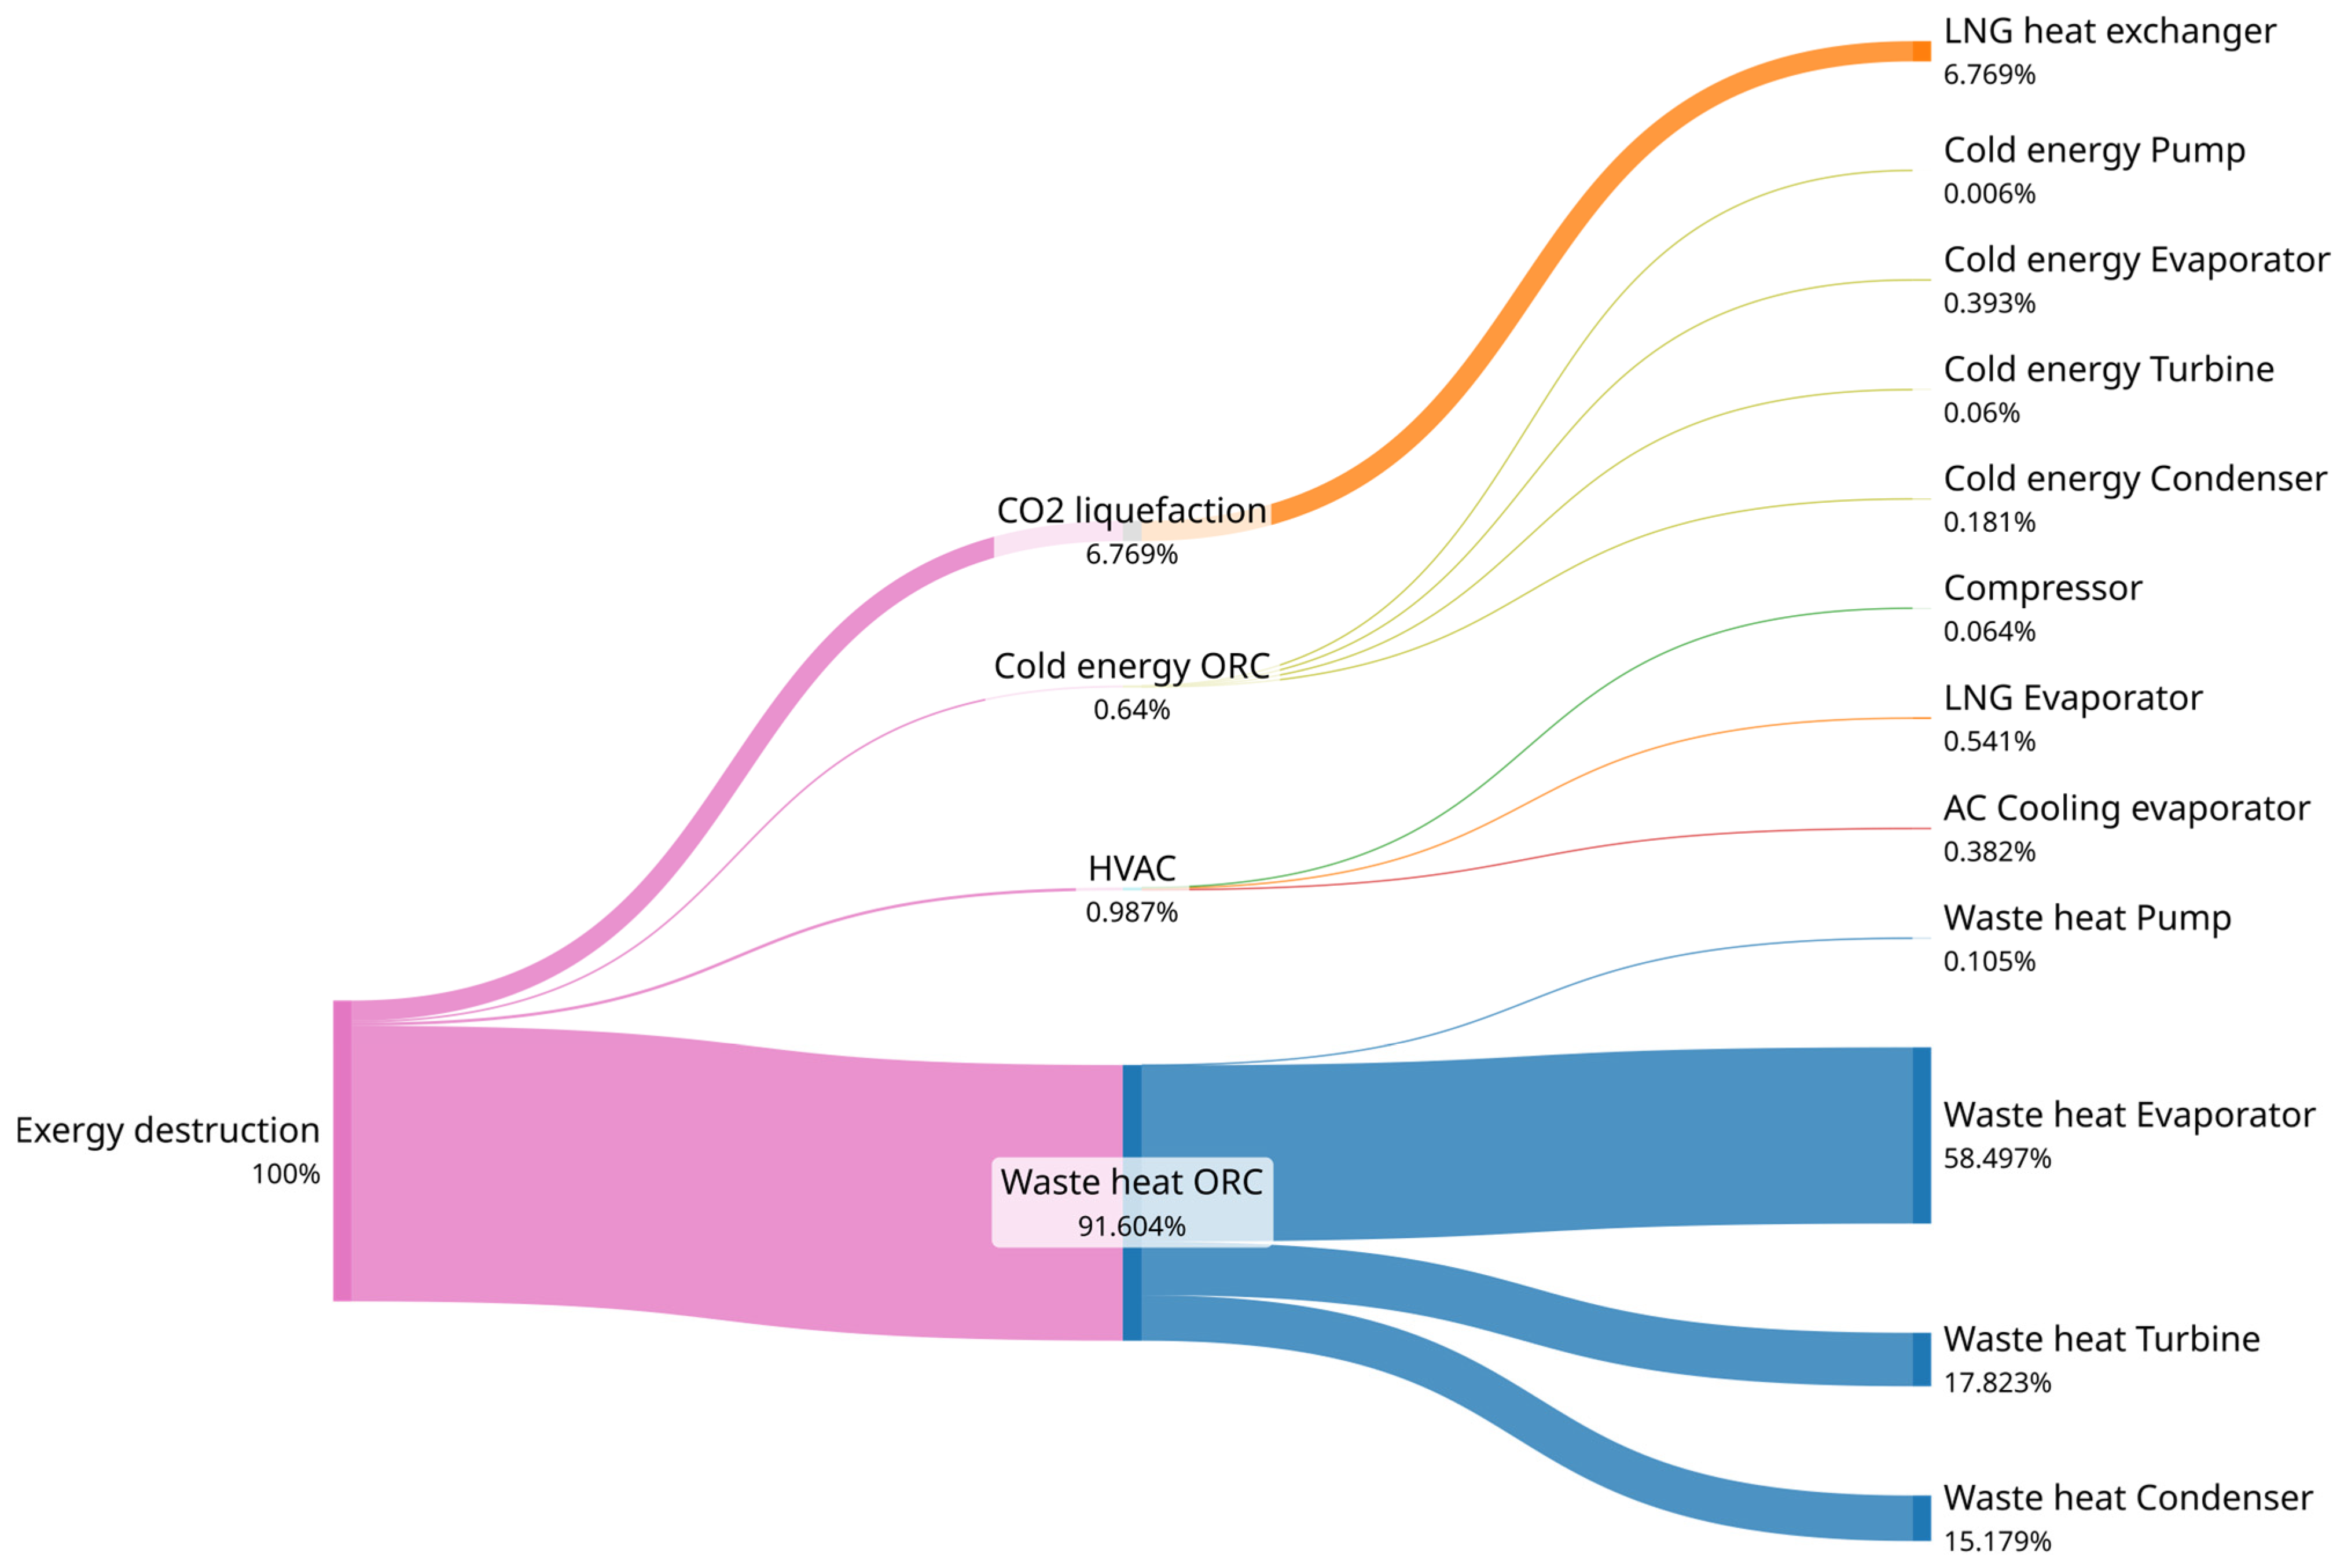
To identify improvement opportunities within the proposed system, an exergy destruction analysis is performed. Using the zeotropic mixture Novec 649 and R1233zd(E) under the previously identified optimal operating conditions for maximum power recovery, the exergy destruction in each subsystem component is quantified. This assessment indicates where usable energy is lost and therefore provides the basis for future system optimization. Figure 11 presents a Sankey diagram illustrating how exergy destruction is distributed across the main components of the system.
The waste heat ORC is responsible for the vast majority of the exergy destruction, accounting for 91.6% of the total. Within this subsystem, the evaporator is the most significant contributor, with 58.5% of overall exergy destruction. This behavior is consistent with the inherent irreversibilities associated with heat transfer across large temperature gradients and phase change processes characteristic of ORC evaporators. The dominance of exergy losses in this subsystem is also coherent with its major role in power generation, since it supplies 82.5% of total power recovered by the proposed system.
The CO2 liquefaction subsystem represents 6.8% of total exergy destruction, which suggests room for improvement. The contributions from the cold energy ORC and the HVAC system are comparatively minor, with 0.64 and 0.99%, respectively. Their individual components show negligible levels of exergy destruction relative to the full system.

3.3. Environmental Assessment

The emission reductions achieved by the system originate from two sources: the reduction in LNG fuel consumption due to the electrical power generated by the energy recovery system, and the fraction of exhaust gas that is captured and liquefied, preventing its release into the atmosphere. As a result, a substantial amount of CO2, CH4, and N2O emissions is avoided. Table 10 presents the emissions abated by the proposed waste energy recovery system in tons per year.
While the waste energy recovery system provides additional useful energy from the same fuel input, the majority of the emissions reduction is achieved through the CCS system, which enables the abatement of up to 77,220.8 tons of CO2 per year. After accounting for methane and nitrous oxide contributions, the integration of the CO2 liquefaction unit with the energy recovery system yields a net annual reduction of 84,427.6 tons of CO2-equation.

Total Equivalent Warming Impact

The retrofitting of the HVAC system by incorporating a heat exchanger that utilizes the available cold energy released during the heating of natural gas, together with the replacement of the original high-GWP refrigerant R407C with a low-GWP zeotropic mixture, provides multiple operational and environmental benefits. To quantify these improvements, the performance of the original system is compared with that of the retrofitted configuration using the TEWI metric. Table 11 compares the TEWI values of the baseline system with those of the retrofitted system using the four studied mixtures.
The TEWI metric clearly demonstrates the improvements achieved with the proposed zeotropic mixtures, further enhanced by the additional cold energy recovered during natural gas heating, which would otherwise be wasted. As expected, the resulting TEWI values vary slightly depending on the GWP of the working mixture and the compressor power demand. The smallest reduction corresponds to the Novec 649–R1233zd(E) mixture, yielding a 44.2% decrease, followed by a 51.1% reduction with the Novec 649–R1234ze(Z) mixture. The remaining mixtures achieve reductions exceeding 53%.

3.4. Economical Assessment

As presented in Table 12, the combined CCS and waste energy recovery system exhibits a slightly higher cost when compared with the purchase of EU ETS allowances or the anticipated IMO Tier 1 remedial units. However, its cost remains below the expected pricing level of IMO Tier 2 measures, indicating that the proposed system stands as a competitive option within forthcoming regulatory frameworks.
The economic relevance of regulatory frameworks differs in nature. Under EU ETS, avoided CO2-equivalent emissions translate directly into reduced expenditure on emission allowances, thereby generating an immediate and quantifiable annual financial benefit that directly improves cash flow and payback performance. In contrast, the IMO Carbon Intensity Indicator does not impose a direct monetary penalty but may affect vessel operability, charter attractiveness, and long-term commercial competitiveness if rating thresholds are not met. Therefore, the integrated CCS–ORC system contributes both to direct cost avoidance under EU ETS and to improved regulatory compliance under CII, enhancing long-term economic resilience under tightening decarbonization policies.
Among the four zeotropic mixtures considered, the lowest GHG-AC is obtained using the Novec 649 and R1233zd(E) mixture. Since this metric is closely linked to the power recovered by the proposed system and, in turn, to the corresponding fuel savings, the ranking of GHG-AC values mirrors the ranking of power output. Although energy recovery systems currently represent a significant investment and it may appear more economical to pay GHG-related penalties, stricter future regulations or reductions in carbon allowances under emissions trading schemes could make these systems a highly attractive solution to improve the energy efficiency of existing onboard equipment.
Regarding the payback and discounted payback periods, the proposed recovery system achieves annual fuel savings of 268,989.75 Euro. In addition, the avoidance of payments associated with GHG pricing mechanisms provides a further benefit of 597,305.34 Euro. When the annual OPEX is considered, which amounts to 389,579.59 Euro, the resulting net annual savings are 476,624.50 Euro. With a capital expenditure of 4,869,744.90 Euro, payback period is calculated to be 10.2 years, equivalent to approximately ten years and three months. For the discounted payback period, the cumulative discounted cash flows obtained with a discount rate of 5% show that the investment is recovered in year 14.6 (equivalent to 14 years and 8 months). These deterministic results provide a baseline economic performance under average fuel price assumptions.

Uncertainty Analysis

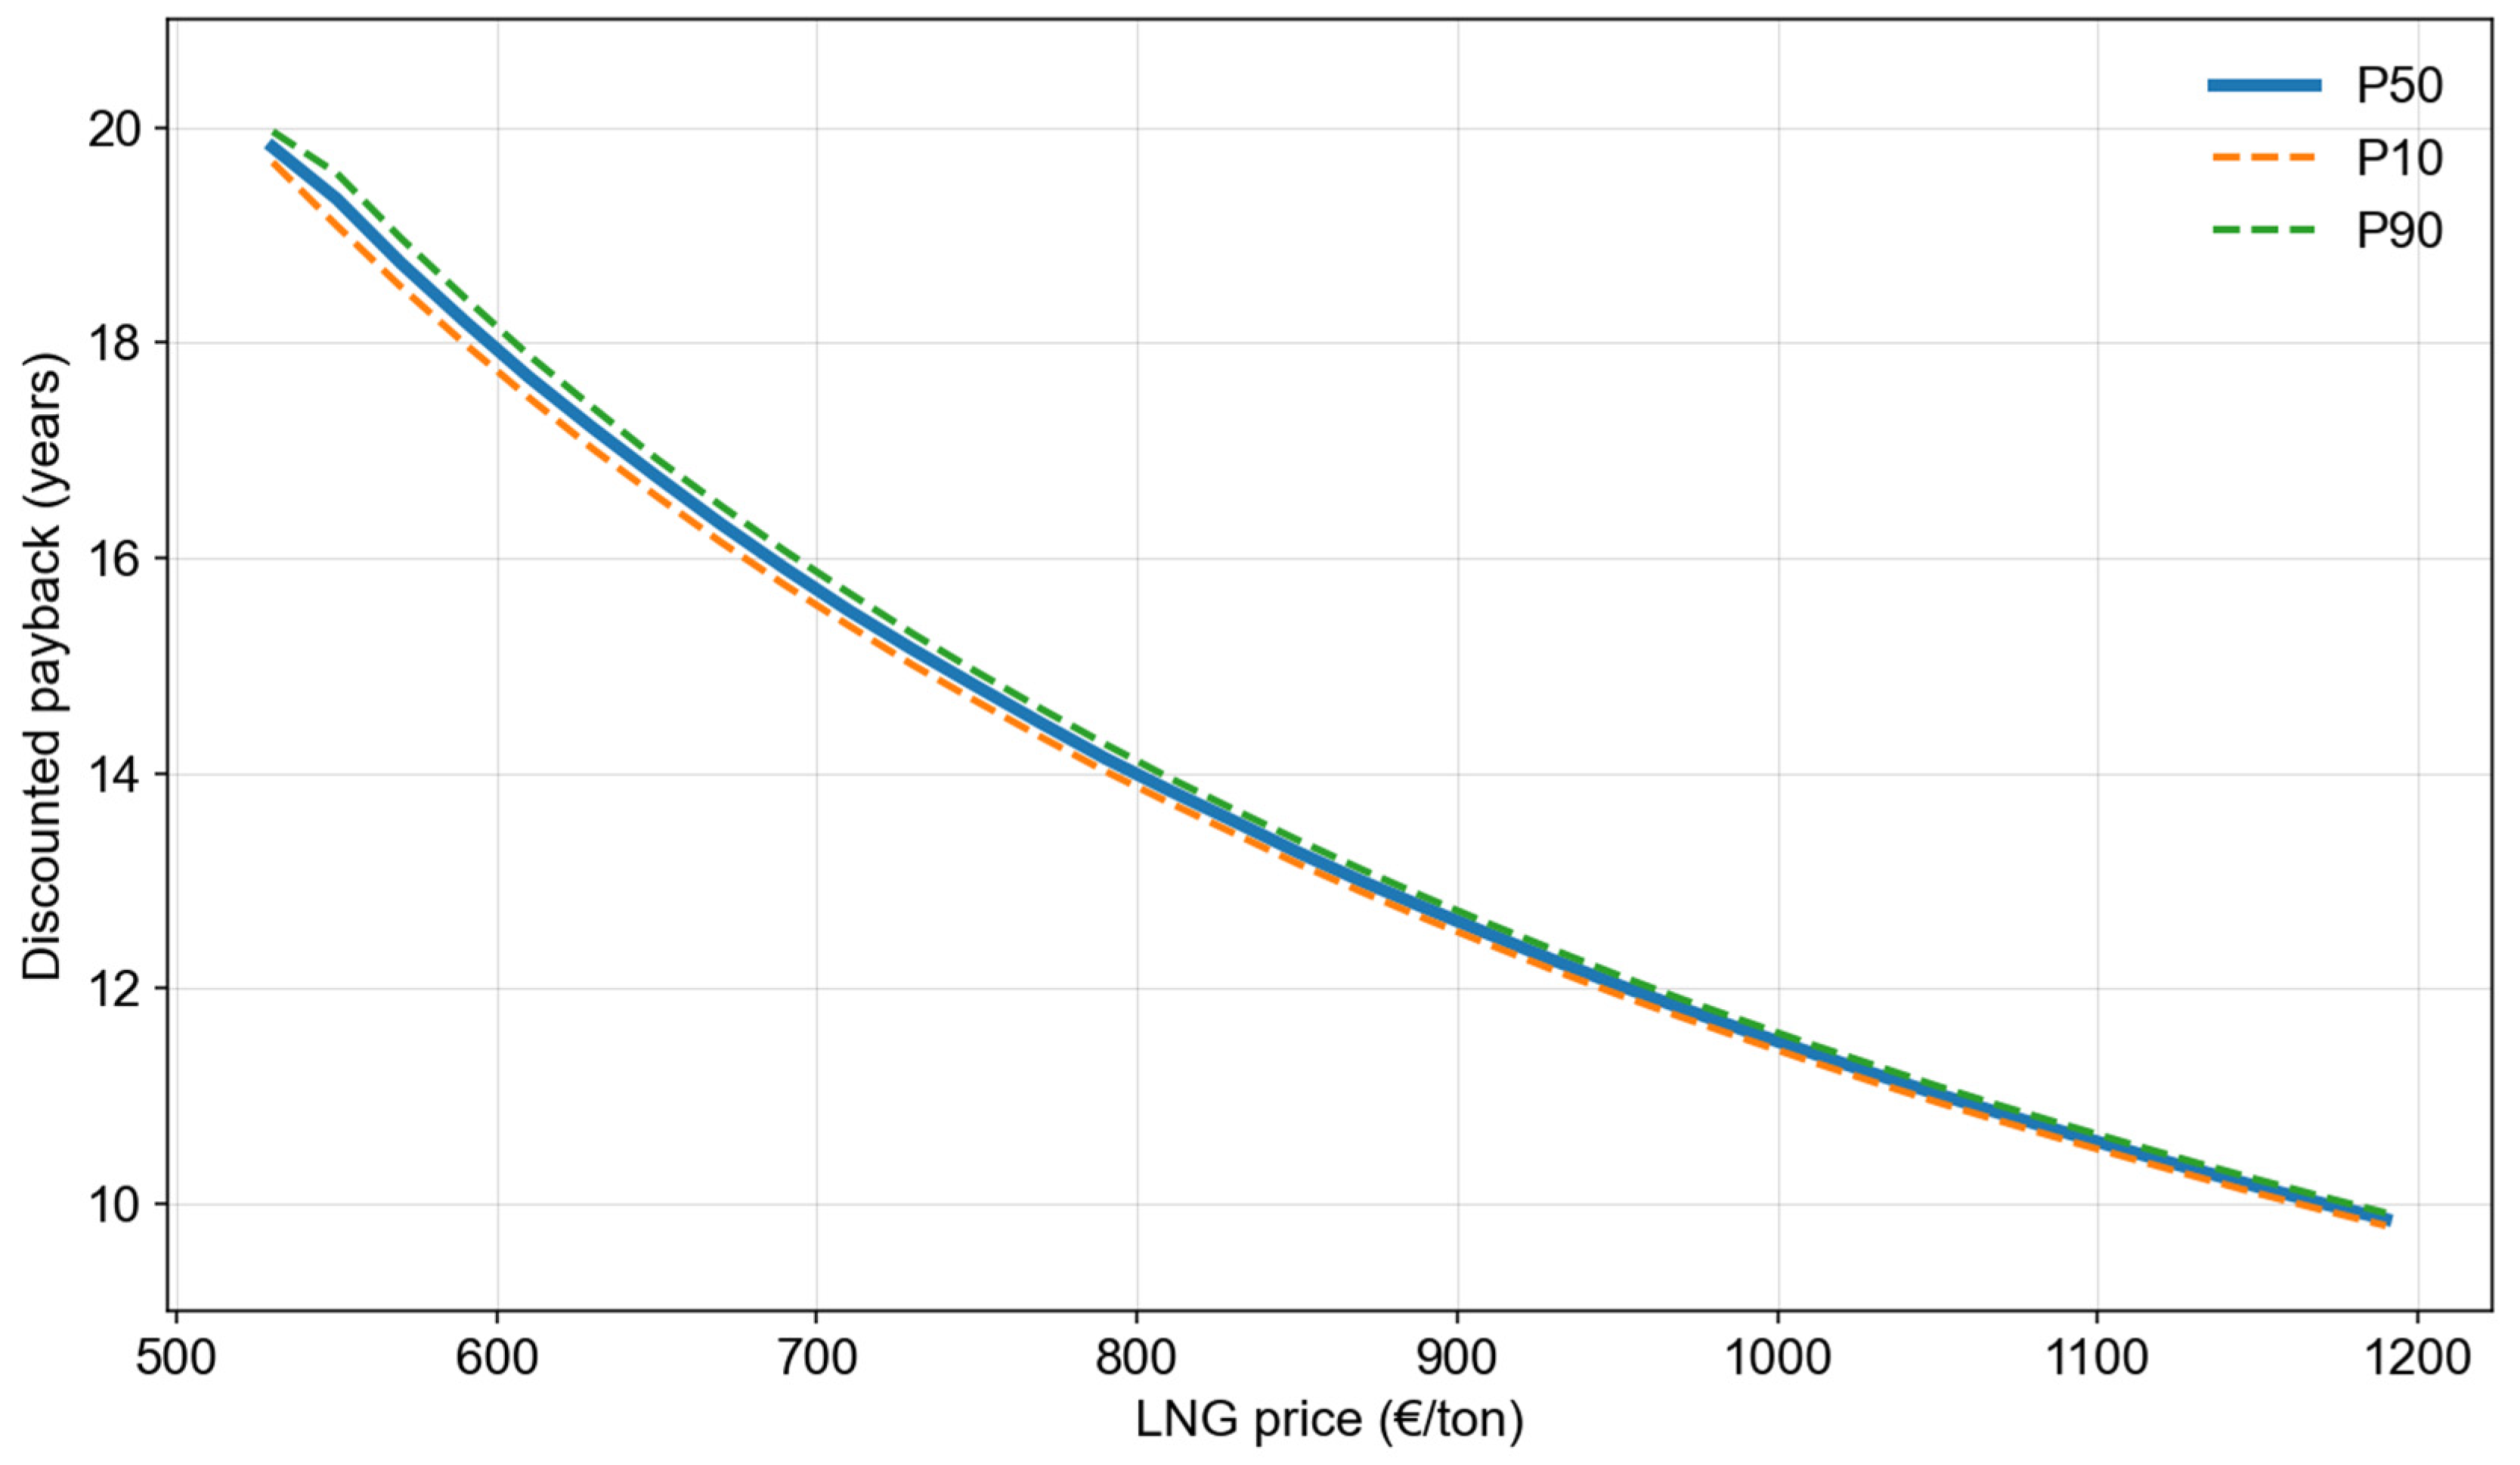
To account for uncertainty in fuel prices, a Monte Carlo simulation with 100,000 iterations is conducted, assuming a uniform LNG price distribution between 400 and 1200 Euro per ton. Figure 12 presents the P10, P50, and P90 percentiles of the discounted payback period as a function of LNG price. Across all simulations, 83.95% of the scenarios achieve capital recovery within the 20-year project lifetime. For the cases reaching recovery, the discounted payback period exhibits a mean value of 13.65 years and a median (P50) of 13.08 years, with a standard deviation of 2.85 years. The interdecile range spans from 10.29 (P10) to 18.09 years (P90), indicating moderate sensitivity to fuel price variability. Only 4.4% of recovered scenarios achieve a payback period below 10 years, while no simulations result in recovery within 7 years. These findings suggest that the economic feasibility of the integrated CCS and waste energy recovery system is primarily long term and highly dependent on sustained fuel price levels and carbon pricing mechanisms under EU ETS and forthcoming IMO regulatory frameworks.
A statistical summary of the Monte Carlo outputs is provided in Table 13.

4. Conclusions

The present study demonstrates that integrating onboard CO2 liquefaction with combined waste heat and cold energy recovery can be both technically feasible and economically viable for maritime decarbonization. Three main conclusions can be drawn.
(1)
The systematic screening of 208 ultra-low GWP zeotropic mixtures confirms the superior performance of Novec 649-based blends. Among the evaluated candidates, the Novec 649–R1233zd(E) mixture emerges as the most suitable general-purpose working fluid, delivering the highest overall energy recovery while maintaining acceptable safety and environmental characteristics. Although R1234yf performs slightly better in the cold energy ORC, the dominant contribution of the waste heat cycle makes R1233zd(E) the most advantageous integrated solution.
(2)
The waste heat ORC is identified as the dominant subsystem, accounting for the majority of total power recovered. Under optimal operating conditions, the integrated system achieves up to 2600 kW of recovered energy while simultaneously enabling the capture and liquefaction of 66% of the CO2 emitted by the engines. This highlights the importance of prioritizing waste heat utilization in future shipboard CCS–ORC integration strategies.
(3)
The techno-economic assessment confirms that the system’s economic viability is primarily driven by fuel savings and avoided GHG pricing costs under EU ETS. Discounted payback periods remain within the 20-year project lifetime in most simulated scenarios, even when accounting for fuel price uncertainty through Monte Carlo analysis. The results indicate that the proposed architecture enhances regulatory resilience under tightening decarbonization policies.
Overall, the integration of carbon capture systems and waste energy recovery represents a promising pathway toward shipboard decarbonization management with tangible economic benefits. Future work should include dynamic analyses under variable engine loads and transient maritime operating conditions, assessment of part-load ORC behavior, detailed sensitivity to heat exchanger design parameters such as minimum temperature difference, optimization of fluid compositions, and experimental validation in a representative marine environment.

Author Contributions

Conceptualization, L.A.D.-S. and A.N.F.Á.; methodology, L.A.D.-S.; software, L.A.D.-S.; validation, A.N.F.Á.; investigation, R.M.M. and P.A.R.L.; resources, L.A.D.-S. and P.A.R.L.; writing—original draft preparation, L.A.D.-S.; writing—review and editing, A.N.F.Á., J.W.R. and C.G.S.; visualization, R.M.M.; supervision, J.W.R. and C.G.S.; project administration, J.W.R. and C.G.S.; funding acquisition, L.A.D.-S. All authors have read and agreed to the published version of the manuscript.

Funding

This research received no external funding.

Data Availability Statement

The data presented in this study are available upon request from the author.

Acknowledgments

The authors gratefully acknowledge the financial support provided by the Instituto Universitario de Tecnología Industrial de Asturias (IUTA) through the research grant IUTA SV-25-GIJON-1-26. This article is also supported and endorsed by the COST Action DeWaTra (CA23159—Decarbonising Waterborne Transportation), funded by European Cooperation in Science and Technology (COST).

Conflicts of Interest

The authors declare no conflicts of interest.

Abbreviations

The following abbreviations are used in this manuscript:
CAPEXCapital Expenditure
CCSCarbon Capture and Storage
CEPCIChemical Engineering Plant Cost Index
CFCChlorofluorocarbon
CIICarbon Intensity Indicator
DWTDeadweight tonnage
EU ETSEuropean Union Emissions Trading System
EUAEU Emission Allowances
GCSGas Conditioning System
GHGGreenhouse Gas
GHG-ACGreenhouse Gas Abatement Cost
GWPGlobal Warming Potential
HCFCHydrochlorofluorocarbon
HFCHydrofluorocarbon
HSCHigh-speed Craft
HVACHeating, Ventilation and Air Conditioning
IMOInternational Maritime Organization
LCALifecycle Analysis
LNGLiquefied
MRVEU Monitoring, Reporting and Verification system
ODPOzone Depletion Potential
OPEXOperational Expenditure
ORCOrganic Rankine Cycle
RPMRevolutions per Minute
TEWITotal Equivalent Warming Impact

Appendix A

Table A1. Complete set of zeotropic mixtures analyzed within the study.
ReferenceZeotropic Mixture
Fluid 1Fluid 2
[79]1,1,1,3,3,5,5,5-Octafluoro-pentaneNeopentane
[79]1,1,1-Trifluoro-2-trifluoro-methyl-butaneNeopentane
[79]1,1,1-Trifluoro-2-trifluoromethylpropane2,2-Difluoro-hexane
[79]1,1,1-Trifluoro-butane1,1,1-Trifluoro-3-(fluoromethoxy)-2-methylpropane
[79]1,1,1-Trifluoro-butane1,1,1-Trifluoropentane
[79]1,1,1-Trifluoro-pentaneNeopentane
[79]1,1,1-Trifluoro-propane1-Fluoromethoxy-propane
[79]1,1,1-Trifluoro-propane1-Fluoromethoxy-propane
[80]1-Butanol2-Propanol
[81]1-ButenePropene
[82]1-Butene R290
[82,83]1-ButeneR1270
[81]2-Butanone Propene
[79]2-Fluoromethoxy-2-methylpropaneNeopentane
[80]2-PropanolWater
[82]AcetoneBenzene
[82]AcetoneIsobutene
[82]AcetoneIsooctene
[81]AcetonePropene
[82]AcetoneR600
[82]AcetoneR600a
[82]AcetoneR601
[82]AcetoneTransbutene
[84]BenzeneCyclohexane
[81]BenzenePropene
[85]BenzeneR11
[85]BenzeneR123
[85]BenzeneToluene
[86]ButeneR601
[87]Cis-2-ButaneR123
[87,88]Cis-2-ButaneR601
[87,88]Cis-2-ButaneR601a
[88]Cis-2-ButeneR601
[88]Cis-2-ButeneR601a
[83]CO2Novec 649
[33]CO2R12
[89]CO2R32
[89]CO2R41
[33,89]CO2R134a
[33]CO2R143a
[33,89]CO2R152a
[89]CO2R161
[33]CO2R290
[83]CO2R601
[90]CO2R601a
[83]CO2R1233zd(E)
[89]CO2R1234yf
[91]CO2R1234ze(E)
[92]CO2R1234ze(Z)
[84]CyclohexaneNonane
[81]CyclohexanePropene
[85,93]CyclohexaneR11
[85]CyclohexaneR123
[93]CyclohexaneR141b
[94]CyclohexaneR236ea
[94]CyclohexaneR245fa
[95]CyclohexaneR601a
[96]CyclohexaneToluene
[81]CyclopentanePropene
[85]CyclopentaneR11
[85]CyclopentaneR123
[97]CyclopentaneR245fa
[97]CyclopentaneR1336mzz(Z)
[89]D4R123
[97]D5R245fa
[79]DecaneNonane
[79]DecaneOctane
[89]DecaneToluene
[98]EthaneR23
[98]EthaneR1234ze(E)
[99]HeptaneR245fa
[87]HeptaneR600a
[87]HeptaneR601a
[99]HexaneIsobutene
[89,94]HexaneR236ea
[89,94,99]HexaneR245fa
[79]HexaneR290
[100]HexaneR600a
[89,101]HexaneR601
[100]HexaneR601a
[87]IsohexaneR123
[89,94]IsohexaneR236ea
[89,94]IsohexaneR245fa
[28,89]IsohexaneR601
[86,95]IsohexaneR601a
[89]MD2MR123
[102]MDMMM
[89]MDMR123
[81]Methyl acetatePropene
[81]Methyl cyclopentanePropene
[81]Methyl propionatePropene
[97]MMR1224yd(Z)
[98]N-butaneR134a
[28,29,89]N-hexaneR601
[84]NonaneToluene
[36]Novec 649HFE7000
[83]Novec 649R32
[83]Novec 649R601
[83]Novec 649R1233zd(E)
[83]Novec 649R1234yf
[83]Novec 649R1234ze(E)
[103]Novec 649R1234ze(Z)
[83]Novec 649R1270
[101]R11R245fa
[49]R12R22
[49]R13R23
[89]R113R245ca
[89,101]R113R245fa
[101]R114R141b
[49]R115R32
[82]R123R21
[104]R123R236fa
[89]R123R245fa
[87]R123Trans-2-Butane
[49]R125R134a
[49]R125R32
[105]R134aR152a
[49]R134aR227ea
[82]R134aR236ea
[28]R134aR236fa
[28]R134aR245fa
[106]R134aR32
[28]R134aRC318
[101]R141bR21
[101]R141bR236ea
[101]R141bR245fa
[82]R143aR227ea
[82]R152aR236ea
[89]R152aR245fa
[107]R152aR365mfc
[108]R227eaR245fa
[79,109]R236fa1,1,1-Trifluoro-2-(fluoromethoxy)ethane
[89]R236faR245fa
[28]R236faR365mfc
[99]R245faR290
[89]R245faR365mfc
[89]R245faRC318
[89]R245faToluene
[110]R290R1234ze(E)
[33]R600CO2
[99]R600Heptane
[99]R600Hexane
[98]R600R32
[101]R600R123
[101]R600R141b
[98]R600R152a
[89]R600R245fa
[100]R600R290
[107]R600R600a
[111]R600R601
[79]R600R601a
[98,110]R600R1234yf
[101]R600aNeopentane
[97]R600aNovec 649
[81]R600aPropene
[83]R600aR32
[89]R600aR245fa
[100]R600aR290
[79,87]R600aR601
[28,111]R600aR601a
[83]R600aR1233zd(E)
[83]R600aR1234yf
[83]R600aR1234ze(E)
[83]R600aR1270
[101]R601R21
[83]R601R32
[112]R601R142b
[86,89]R601R245fa
[100]R601R290
[83]R601R1233zd(E)
[83]R601R1234yf
[83]R601R1234ze(E)
[83]R601R1270
[88]R601Trans-2-butene
[101]R601aR114
[112]R601aR142b
[101]R601aR236ea
[86,101]R601aR245fa
[100]R601aR290
[107]R601aR601
[88]R601aTrans-2-butene
[105]R1123R32
[111]R1150R170
[18]R1224yd(Z)R1233zd(E)
[18]R1224yd(Z)R1234ze(Z)
[97]R1224yd(Z)R1243zf
[83]R1233zd(E)R32
[83]R1233zd(E)R1234yf
[83]R1233zd(E)R1234ze(E)
[113]R1233zd(E)R1234ze(Z)
[18,97]R1233zd(E)R1336mzz(Z)
[97]R1233zd(E)Toluene
[83]R1234yfR32
[105]R1234yfR134a
[105]R1234yfR152a
[110]R1234yfR245fa
[105]R1234ze(E)R227ea
[110]R1234ze(E)R245fa
[105]R1234ze(E)R1243zf
[83]R1270R32
[87]R1270R123
[83]R1270R170
[83]R1270R1233zd(E)
[83]R1270R1234yf
[89]R1336mzz(Z)R236fa
[89]R1336mzz(Z)R245fa
Table A2. Nomenclature.
SymbolParameterUnits
A Annual savingsEuro
C p Constant-pressure specific heatkJ/kg·K
E Energy (for TEWI calculation)kJ
h Specific enthalpykJ/kg
I ˙ Exergy destructionkW
m ˙ Mass flowkg/s
n TimeYears
P Pressurebar
Q ˙ Thermal energykW
r Discount rate%
s Specific entropykJ/kg·K
T TemperatureK
W ˙ PowerkW
Subscripts
ambEnvironmental conditions
annualAnnual
avgLMTD temperature
BMBare module factor
CO2Carbon dioxide
coldCold energy
compressorCompressor
condCondenser
cricondenbarCricondenbar conditions
evapEvaporator
genElectrical generator
HVACHeating, ventilation and air conditioning
inInlet
JWEngine jacket water
LCO2Liquefied carbon dioxide
LNGLiquefied natural gas
MMaterial factor
netNet
ORCOrganic Rankine cycle
outOutlet
pricePrice
pumpPump
refReference
savingsSavings
SWSeawater
totalTotal
turbineTurbine
WHWaste heat
zeotropicZeotropic fluid
Greek symbols
α Recovery factor
β CO2 emission factorkgCO2/kWh
Δ Increment
ε Efficiency (machinery)%
ν Specific volumem3/kg

References

  1. Calvin, K.; Dasgupta, D.; Krinner, G.; Mukherji, A.; Thorne, P.W.; Trisos, C.; Romero, J.; Aldunce, P.; Barrett, K.; Blanco, G.; et al. IPCC, 2023: Climate Change 2023: Synthesis Report. Contribution of Working Groups I, II and III to the Sixth Assessment Report of the Intergovernmental Panel on Climate Change; Core Writing Team, Lee, H., Romero, J., Arias, P., Bustamante, M., Elgizouli, I., Flato, G., Howden, M., Méndez-Vallejo, C., Pereira, J.J., et al., Eds.; IPCC: Geneva, Switzerland, 2023. [Google Scholar]
  2. International Maritime Organization (IMO). Fourth IMO Greenhouse Gas Study; International Maritime Organization (IMO): London, UK, 2021; pp. 951–952. [Google Scholar]
  3. Castellanos, G.; Roesch, R.; Sloan, A.; Gielen, D. Pathway to Decarbonise the Shipping Sector by 2050; International Renewable Energy Agency (IRENA): Abu Dhabi, United Arab Emirates, 2021; ISBN 978-92-9260-330-4. [Google Scholar]
  4. International Maritime Organization (IMO). Resolution MEPC.352 (78)—2022 Guidelines on Operational Carbon Intensity Indicators and the Calculation Methods (CII Guidelines, G1); International Maritime Organization (IMO): London, UK, 2022; Volume 352, pp. 1–6. [Google Scholar]
  5. Tadros, M.; Ventura, M.; Guedes Soares, C. Review of the IMO Initiatives for Ship Energy Efficiency and Their Implications. J. Mar. Sci. Appl. 2023, 22, 662–680. [Google Scholar] [CrossRef]
  6. Bilgili, L. Comparative Assessment of Alternative Marine Fuels in Life Cycle Perspective. Renew. Sustain. Energy Rev. 2021, 144, 110985. [Google Scholar] [CrossRef]
  7. Hossein Arabnejad, M.; Thies, F.; Yao, H.-D.; Ringsberg, J.W. Life Cycle Assessment Method for Ship Fuels Using a Ship Performance Prediction Model and Actual Operation Conditions—Case Study of Wind-Assisted Cargo Ship. Energies 2025, 18, 4559. [Google Scholar] [CrossRef]
  8. European Council. EU Council Regulation (EU) 2023/957 of the European Parliament and of the Council of 10 May 2023 Amending Regulation (EU) 2015/757 in Order to Provide for the Inclusion of Maritime Transport Activities in the EU Emissions Trading System and for the MRV; European Council: Brussels, Belgium, 2023; Volume 2023, pp. 105–114. [Google Scholar]
  9. Díaz-Secades, L.A. Enhancement of Maritime Sector Decarbonization through the Integration of Fishing Vessels into IMO Energy Efficiency Measures. J. Mar. Sci. Eng. 2024, 12, 663. [Google Scholar] [CrossRef]
  10. Tadros, M.; Ventura, M.; Guedes Soares, C. Review of Current Regulations, Available Technologies, and Future Trends in the Green Shipping Industry. Ocean Eng. 2023, 280, 114670. [Google Scholar] [CrossRef]
  11. International Maritime Organization (IMO). MEPC.1/Circ.896 2021 Guidance on Treatment of Innovative Energy Efficiency Technologies for Calculation and Verification of the Attained EEDI and EEXI; International Maritime Organization (IMO): London, UK, 2021. [Google Scholar]
  12. Mondejar, M.E.; Andreasen, J.G.; Pierobon, L.; Larsen, U.; Thern, M.; Haglind, F. A Review of the Use of Organic Rankine Cycle Power Systems for Maritime Applications. Renew. Sustain. Energy Rev. 2018, 91, 126–151. [Google Scholar] [CrossRef]
  13. Díaz-Secades, L.A.; Fernández Álvarez, A.N.; Teodoro, P.; Pereira, S. Trigeneration Pathways for Maritime Decarbonization in Liquefied Natural Gas Tankers: A Case Study on Waste Energy Recovery from an Auxiliary Engine. Energy Convers. Manag. 2025, 345, 120389. [Google Scholar] [CrossRef]
  14. Wang, Z.; Huang, Z.; Huang, Y.; Wittram, C.; Zhuang, Y.; Wang, S.; Nie, B. Synergy of Carbon Capture, Waste Heat Recovery and Hydrogen Production for Industrial Decarbonisation. Energy Convers. Manag. 2024, 312, 118568. [Google Scholar] [CrossRef]
  15. Mocerino, L.; Guedes Soares, C.; Rizzuto, E.; Balsamo, F.; Quaranta, F. Validation of an Emission Model for a Marine Diesel Engine with Data from Sea Operations. J. Mar. Sci. Appl. 2021, 20, 534–545. [Google Scholar] [CrossRef]
  16. United Nations. Amendment to the Montreal Protocol on Substances That Deplete the Ozone Layer; US Government Printing Office: Washington, DC, USA, 2016.
  17. Díaz-Secades, L.A.; González, R.; Rivera, N.; Quevedo, J.R.; Montañés, E. Parametric Study of Organic Rankine Working Fluids via Bayesian Optimization of a Preference Learning Ranking for a Waste Heat Recovery System Applied to a Case Study Marine Engine. Ocean Eng. 2024, 306, 118124. [Google Scholar] [CrossRef]
  18. Akman, M.; Ergin, S. Thermodynamic Analysis of a Marine-Type ORC Waste Heat Recovery System Using Zeotropic Mixtures of HCFO and HFO Refrigerants. Int. J. Exergy 2025, 46, 67–78. [Google Scholar] [CrossRef]
  19. Lebedevas, S.; Malūkas, A. The Application of Cryogenic Carbon Capture Technology on the Dual-Fuel Ship through the Utilisation of LNG Cold Potential. J. Mar. Sci. Eng. 2024, 12, 217. [Google Scholar] [CrossRef]
  20. Brescini, M.; Antomarioni, S.; Ciarapica, F.E.; Bevilacqua, M. Techno-Economic and Environmental Assessment of Carbon Capture Solutions in Maritime Transportation. Ocean Eng. 2025, 330, 121252. [Google Scholar] [CrossRef]
  21. Kim, Y.; Lee, J.; An, N.; Kim, J. Advanced Natural Gas Liquefaction and Regasification Processes: Liquefied Natural Gas Supply Chain with Cryogenic Carbon Capture and Storage. Energy Convers. Manag. 2023, 292, 117349. [Google Scholar] [CrossRef]
  22. Ahmed, Y.A.; Lazakis, I.; Mallouppas, G. Advancements and Challenges of Onboard Carbon Capture and Storage Technologies for the Maritime Industry: A Comprehensive Review. Mar. Syst. Ocean Technol. 2025, 20, 13. [Google Scholar] [CrossRef]
  23. Awoyomi, A.; Patchigolla, K.; Anthony, E.J. Process and Economic Evaluation of an Onboard Capture System for LNG-Fueled CO2 Carriers. Ind. Eng. Chem. Res. 2020, 59, 6951–6960. [Google Scholar] [CrossRef]
  24. Ros, J.A.; Skylogianni, E.; Doedée, V.; van den Akker, J.T.; Vredeveldt, A.W.; Linders, M.J.G.; Goetheer, E.L.V.; Monteiro, J.G.M. Advancements in Ship-Based Carbon Capture Technology on Board of LNG-Fuelled Ships. Int. J. Greenh. Gas Control 2022, 114, 103575. [Google Scholar] [CrossRef]
  25. Li, Z.; Zhao, X.; Cao, R.; Yang, H.; Li, B.; Diao, F.; Zhang, R. Simulation Study On Utilising Cold Energy Fuel To Liquefy Captured CO2 On Lng-Fuelled Vessels. Pol. Marit. Res. 2025, 32, 131–146. [Google Scholar] [CrossRef]
  26. Shin, H.; Oh, J.; Jeon, Y.; Lim, Y.; Adams, T.A. Comparative Environmental Techno-Economic Assessments (ETEAs) of Onboard Amine-Based Carbon Capture and Boil-off Gas Handling Systems on LCO2 Carriers. Carbon Capture Sci. Technol. 2026, 18, 100569. [Google Scholar] [CrossRef]
  27. Akman, M.; Ergin, S. Performance Optimization of ORC-Based Waste Heat Recovery System Integrated with Marine Engine Using Alternative Fuels under Different Operating Conditions. Therm. Sci. Eng. Prog. 2025, 66, 104084. [Google Scholar] [CrossRef]
  28. Heberle, F.; Brüggemann, D. Thermo-Economic Evaluation of Organic Rankine Cycles for Geothermal Power Generation Using Zeotropic Mixtures. Energies 2015, 8, 2097–2124. [Google Scholar] [CrossRef]
  29. Oyewunmi, O.; Markides, C. Thermo-Economic and Heat Transfer Optimization of Working-Fluid Mixtures in a Low-Temperature Organic Rankine Cycle System. Energies 2016, 9, 448. [Google Scholar] [CrossRef]
  30. Oyewunmi, O.A.; Taleb, A.I.; Haslam, A.J.; Markides, C.N. On the Use of SAFT-VR Mie for Assessing Large-Glide Fluorocarbon Working-Fluid Mixtures in Organic Rankine Cycles. Appl. Energy 2016, 163, 263–282. [Google Scholar] [CrossRef]
  31. Wang, Z.; Zhao, Y.; Xia, X.; Pan, H.; Zhang, S.; Liu, Z. Experimental Evaluation of Organic Rankine Cycle Using Zeotropic Mixture under Different Operation Conditions. Energy 2023, 264, 126188. [Google Scholar] [CrossRef]
  32. Wiśniewski, S.; Bańkowski, M. Effectiveness Analysis of a Binary ORC Power Plant with Zeotropic Organic Fluid. Arch. Thermodyn. 2024, 45, 129–138. [Google Scholar] [CrossRef]
  33. Li, D.; Yin, G.; Gao, W.; Zhang, C. Role of CO2-Based Mixtures in the Organic Rankine Cycle Using LNG Cold Energy. Sustain. Energy Technol. Assess. 2024, 65, 103752. [Google Scholar] [CrossRef]
  34. Aresti, L.; Panayiotou, G. Applications and New Technologies Pertaining to Waste Heat Recovery: A Vision Article. Energies 2025, 18, 2086. [Google Scholar] [CrossRef]
  35. Ma, X.; Chen, M.; Lian, Q.; Wang, L.; Meng, X.; Wei, X. Performance Optimization and Experimental Investigation of Organic Rankine Cycle System Using Binary Zeotropic Mixtures. J. Energy Resour. Technol. Part A Sustain. Renew. Energy 2026, 2, 032101. [Google Scholar] [CrossRef]
  36. Blondel, Q.; Tauveron, N.; Lhermet, G.; Caney, N. Zeotropic Mixtures Study in Plate Heat Exchangers and ORC Systems. Appl. Therm. Eng. 2023, 219, 119418. [Google Scholar] [CrossRef]
  37. Global Fishing Watch. Available online: https://globalfishingwatch.org/ (accessed on 4 November 2025).
  38. Spanish State Meteorological Agency (AEMET). Standard Climate Values. Available online: https://www.aemet.es/en/serviciosclimaticos/datosclimatologicos/valoresclimatologicos (accessed on 12 November 2025).
  39. Wärtsilä. Wärtsilä 31DF Dual Fuel Engine. Available online: https://www.wartsila.com/energy/solutions/engine-power-plant-products/wartsila-31df-dual-fuel-engine (accessed on 12 November 2025).
  40. Guascor. SGE-24SL Gas Engine. Available online: https://guascor-energy.com/products/industrial-products/s-series-engines/ (accessed on 12 November 2025).
  41. Huber, M.L.; Lemmon, E.W.; Bell, I.H.; McLinden, M.O. The NIST REFPROP Database for Highly Accurate Properties of Industrially Important Fluids. Ind. Eng. Chem. Res. 2022, 61, 15449–15472. [Google Scholar] [CrossRef]
  42. Chowdhury, A.S.; Ehsan, M.M. A Critical Overview of Working Fluids in Organic Rankine, Supercritical Rankine, and Supercritical Brayton Cycles Under Various Heat Grade Sources. Int. J. Thermofluids 2023, 20, 100426. [Google Scholar] [CrossRef]
  43. Raninga, M.; Mudgal, A.; Patel, V.; Patel, J. Zeotropic Mixture as a Working Fluid for Cascade Rankine Cycle-Based Reverse Osmosis: Energy, Exergy, and Economic Analysis. Int. J. Thermofluids 2024, 24, 100890. [Google Scholar] [CrossRef]
  44. Lebedevas, S.; Čepaitis, T. Complex Use of the Main Marine Diesel Engine High- and Low-Temperature Waste Heat in the Organic Rankine Cycle. J. Mar. Sci. Eng. 2024, 12, 521. [Google Scholar] [CrossRef]
  45. Seo, Y.; Huh, C.; Lee, S.; Chang, D. Comparison of CO2 Liquefaction Pressures for Ship-Based Carbon Capture and Storage (CCS) Chain. Int. J. Greenh. Gas Control 2016, 52, 1–12. [Google Scholar] [CrossRef]
  46. Deng, H.; Roussanaly, S.; Skaugen, G. Techno-Economic Analyses of CO2 Liquefaction: Impact of Product Pressure and Impurities. Int. J. Refrig. 2019, 103, 301–315. [Google Scholar] [CrossRef]
  47. International Maritime Organization (IMO). Resolution MEPC.364(79) 2022 Guidelines on the Method of Calculation of the Attained Energy Efficiency Design Index (EEDI) for New Ships; International Maritime Organization (IMO): London, UK, 2022. [Google Scholar]
  48. Ouyang, T.; Wang, Z.; Zhao, Z.; Lu, J.; Zhang, M. An Advanced Marine Engine Waste Heat Utilization Scheme: Electricity-Cooling Cogeneration System Integrated with Heat Storage Device. Energy Convers. Manag. 2021, 235, 113955. [Google Scholar] [CrossRef]
  49. Alshammari, F.; Alatawi, I.; Alshammari, A.S. Impact of Turbine Characteristics on Low Temperature Organic Rankine Cycles Operating with Zeotropic and Azeotropic Mixtures. Case Stud. Therm. Eng. 2024, 59, 104463. [Google Scholar] [CrossRef]
  50. Díaz-Secades, L.A.; Bouzón, R. Reducing the Carbon Footprint of LNG Shipping: Implementation of a Combined Waste Heat Recovery System in the Onboard Incinerator for Lower Environmental Impact. Energy 2024, 314, 134271. [Google Scholar] [CrossRef]
  51. Díaz-Secades, L.A.; González, R.; Rivera, N.; Montañés, E.; Quevedo, J.R. Waste Heat Recovery System for Marine Engines Optimized through a Preference Learning Rank Function Embedded into a Bayesian Optimizer. Ocean Eng. 2023, 281, 114747. [Google Scholar] [CrossRef]
  52. Lecompte, S.; Huisseune, H.; van den Broek, M.; Vanslambrouck, B.; De Paepe, M. Review of Organic Rankine Cycle (ORC) Architectures for Waste Heat Recovery. Renew. Sustain. Energy Rev. 2015, 47, 448–461. [Google Scholar] [CrossRef]
  53. Miao, Z.; Wang, Z.; Varbanov, P.S.; Klemeš, J.J.; Xu, J. Development of Selection Criteria of Zeotropic Mixtures as Working Fluids for the Trans-Critical Organic Rankine Cycle. Energy 2023, 278, 127811. [Google Scholar] [CrossRef]
  54. UNEP. Handbook for the Montreal Protocol on Substances That Deplete the Ozone Layer; UNEP: Nairobi, Kenya, 2006; 960p. [Google Scholar]
  55. Occhipinti, Z.; Verona, R. Kyoto Protocol (KP). In Climate Action; Springer: Berlin/Heidelberg, Germany, 2019; pp. 605–617. ISBN 978-3-319-95884-2. [Google Scholar]
  56. European Commission. F-Gas Regulation Review 2022. Available online: https://f-gas-regulation-review-2022.eu/ (accessed on 5 April 2024).
  57. ANSI/ASHRAE 34-2022; Designation and Safety Classification of Refrigerants. ASHRAE: Atlanta, GA, USA, 2022; Volume 2019.
  58. Pavlenko, N.; Comer, B.; Zhou, Y.; Clark, N.; Rutherford, D. The Climate Implications of Using LNG as a Marine Fuel; International Council on Clean Transportation: Washington, DC, USA, 2020. [Google Scholar]
  59. Shindell, D.; Myhre, G.; Boucher, O.; Forster, P.; Breon, F.M.; Fuglestvedt, J. Radiative Forcing in the AR5. In Conference Proceeding in IPCC AR5 Working Group I; IPPC: Rome, Italy, 2013; pp. 1–11. [Google Scholar]
  60. Llopis, R.; Calleja-Anta, D.; Maiorino, A.; Nebot-Andrés, L.; Sánchez, D.; Cabello, R. TEWI Analysis of a Stand-Alone Refrigeration System Using Low-GWP Fluids with Leakage Ratio Consideration. Int. J. Refrig. 2020, 118, 279–289. [Google Scholar] [CrossRef]
  61. Hafner, I.A.; Gabrielii, C.H.; Widell, K. Refrigeration Units in Marine Vessels; TemaNord, Nordic Council of Ministers: Copenhagen, Denmark, 2019; ISBN 9789289359412. [Google Scholar]
  62. Geelen, C.; van Gerwen, R. Natural Refrigerants in Heat Pumps; IE Solutions: Portland, OR, USA, 2021. [Google Scholar]
  63. OECD. The Ocean Economy to 2050; OECD Publishing: Paris, France, 2025; ISBN 9789264434134. [Google Scholar]
  64. Turton, R.; Bailie, R.C.; Whiting, W.B.; Shaeiwitz, J.A. Analysis, Synthesis, and Design of Chemical Processes; Pearson Education: London, UK, 2018; ISBN 978-0134177403. [Google Scholar]
  65. Texas A&M University. Chemical Engineering Plant Cost Index (CEPCI). Available online: https://tamu.libguides.com/c.php?g=587308&p=9269319 (accessed on 30 October 2025).
  66. Titan Clean Fuels. Titan Weekly LNG Prices. Available online: https://titan-cleanfuels.com/lng-pricing/ (accessed on 3 December 2025).
  67. Ouyang, T.; Huang, Y.; Tuo, X.; Zhou, H.; Mo, C. Comprehensive Performance Analysis and Optimization of an ORC-HDH System for Power and Freshwater Production Driven by Marine Exhaust Gas. Desalination 2024, 592, 118166. [Google Scholar] [CrossRef]
  68. International Carbon Action. Partnership ICAP Allowance Price Explorer. Available online: https://icapcarbonaction.com/en/ets-prices (accessed on 12 December 2025).
  69. Konur, O.; Yuksel, O.; Korkmaz, S.A.; Colpan, C.O.; Saatcioglu, O.Y.; Muslu, I. Thermal Design and Analysis of an Organic Rankine Cycle System Utilizing the Main Engine and Cargo Oil Pump Turbine Based Waste Heats in a Large Tanker Ship. J. Clean. Prod. 2022, 368, 133230. [Google Scholar] [CrossRef]
  70. Díaz-Secades, L.A.; Fernández Álvarez, A.N.; Ferro, M.; Pereira, S.; Baptista, L.F. Shipboard Waste Energy Recovery for Power and Cooling Supply as a Strategic Response to Greenhouse Gas Pricing Mechanisms. Energy 2026, 342, 139675. [Google Scholar] [CrossRef]
  71. Yadav, S.; Seethamraju, S.; Banerjee, R. Cold Energy Recovery from Liquefied Natural Gas Regasification Process for Data Centre Cooling and Power Generation. Energy 2023, 283, 128481. [Google Scholar] [CrossRef]
  72. Li, X.; Chen, Y.; Zhang, Y.; Liu, Y. Thermoeconomic Modelling and Multi-Objective Optimisation of ORC Systems for Low-Temperature Waste Heat Recovery. Appl. Therm. Eng. 2025, 279, 127603. [Google Scholar] [CrossRef]
  73. Rosato, A.; Guarino, F.; Filomena, V.; Sibilio, S.; Maffei, L. Experimental Calibration and Validation of a Simulation Model for Fault Detection of HVAC Systems and Application to a Case Study. Energies 2020, 13, 3948. [Google Scholar] [CrossRef]
  74. Ye, Z.; Yang, J.; Shi, J.; Chen, J. Thermo-Economic and Environmental Analysis of Various Low-GWP Refrigerants in Organic Rankine Cycle System. Energy 2020, 199, 117344. [Google Scholar] [CrossRef]
  75. Conoship International. CO2ASTS Public Concise Report; Conoship International: Groningen, The Netherlands, 2020. [Google Scholar]
  76. Gao, W.; Zhu, S.; Tian, Z.; Zhang, Y.; Yang, C. Experimental Investigation on RORC System Performance for Recovering LNG Cold Energy under Heating and Cooling Capacities Variations. Energy Convers. Manag. 2023, 290, 117157. [Google Scholar] [CrossRef]
  77. Yang, K.; Zhang, H.; Song, S.; Yang, F.; Liu, H.; Zhao, G.; Zhang, J.; Yao, B. Effects of Degree of Superheat on the Running Performance of an Organic Rankine Cycle (ORC) Waste Heat Recovery System for Diesel Engines under Various Operating Conditions. Energies 2014, 7, 2123–2145. [Google Scholar] [CrossRef]
  78. Jang, Y.; Lee, J. Influence of Superheat and Expansion Ratio on Performance of Organic Rankine Cycle-Based Combined Heat and Power (CHP) System. Energy Convers. Manag. 2018, 171, 82–97. [Google Scholar] [CrossRef]
  79. Mavrou, P.; Papadopoulos, A.I.; Stijepovic, M.Z.; Seferlis, P.; Linke, P.; Voutetakis, S. Novel and Conventional Working Fluid Mixtures for Solar Rankine Cycles: Performance Assessment and Multi-Criteria Selection. Appl. Therm. Eng. 2015, 75, 384–396. [Google Scholar] [CrossRef]
  80. Kolahchian Tabrizi, M.; Bonalumi, D. Techno-Economic Performance of the 2-Propanol/1-Butanol Zeotropic Mixture and 2-Propanol/Water Azeotropic Mixture as a Working Fluid in Organic Rankine Cycles. Energy 2022, 246, 123316. [Google Scholar] [CrossRef]
  81. Schilling, J.; Entrup, M.; Hopp, M.; Gross, J.; Bardow, A. Towards Optimal Mixtures of Working Fluids: Integrated Design of Processes and Mixtures for Organic Rankine Cycles. Renew. Sustain. Energy Rev. 2021, 135, 110179. [Google Scholar] [CrossRef]
  82. Mondejar, M.E.; Thern, M. Analysis of Isentropic Mixtures for Their Use as Working Fluids in Organic Rankine Cycles. Environ. Prog. Sustain. Energy 2017, 36, 921–935. [Google Scholar] [CrossRef]
  83. Braimakis, K.; Mikelis, A.; Charalampidis, A.; Karellas, S. Exergetic Performance of CO2 and Ultra-Low GWP Refrigerant Mixtures as Working Fluids in ORC for Waste Heat Recovery. Energy 2020, 203, 117801. [Google Scholar] [CrossRef]
  84. Javed, S.; Tiwari, A.K. Performance Analysis of Zeotropic Mixture as a Working Fluid for Medium Temperature in Regenerative Organic Rankine Cycle. Process Saf. Environ. Prot. 2023, 179, 864–872. [Google Scholar] [CrossRef]
  85. Shu, G.; Gao, Y.; Tian, H.; Wei, H.; Liang, X. Study of Mixtures Based on Hydrocarbons Used in ORC (Organic Rankine Cycle) for Engine Waste Heat Recovery. Energy 2014, 74, 428–438. [Google Scholar] [CrossRef]
  86. Han, J.; Wang, X.; Xu, J.; Yi, N.; Ashraf Talesh, S.S. Thermodynamic Analysis and Optimization of an Innovative Geothermal-Based Organic Rankine Cycle Using Zeotropic Mixtures for Power and Hydrogen Production. Int. J. Hydrogen Energy 2020, 45, 8282–8299. [Google Scholar] [CrossRef]
  87. Akbari, S.; Faghiri, S.; Zinjanabi, A.M.; Bijarchi, M.A.; Shafii, M.B.; Hosseinzadeh, K. Thermo-Economic Investigation and Comparative Multi-Objective Optimization of Dual-Pressure Evaporation ORC Using Binary Zeotropic Mixtures as Working Fluids for Geothermal Energy Application. Int. J. Thermofluids 2024, 24, 100899. [Google Scholar] [CrossRef]
  88. Zhou, Y.; Li, S.; Sun, L.; Zhao, S.; Ashraf Talesh, S.S. Optimization and Thermodynamic Performance Analysis of a Power Generation System Based on Geothermal Flash and Dual-Pressure Evaporation Organic Rankine Cycles Using Zeotropic Mixtures. Energy 2020, 194, 116785. [Google Scholar] [CrossRef]
  89. Xu, W.; Zhao, R.; Deng, S.; Zhao, L.; Mao, S.S. Is Zeotropic Working Fluid a Promising Option for Organic Rankine Cycle: A Quantitative Evaluation Based on Literature Data. Renew. Sustain. Energy Rev. 2021, 148, 111267. [Google Scholar] [CrossRef]
  90. Garg, P.; Kumar, P.; Srinivasan, K.; Dutta, P. Evaluation of Carbon Dioxide Blends with Isopentane and Propane as Working Fluids for Organic Rankine Cycles. Appl. Therm. Eng. 2013, 52, 439–448. [Google Scholar] [CrossRef]
  91. Sánchez, C.J.N.; da Silva, A.K. Technical and Environmental Analysis of Transcritical Rankine Cycles Operating with Numerous CO2 Mixtures. Energy 2018, 142, 180–190. [Google Scholar] [CrossRef]
  92. Luo, J.; Ye, Z.; Zhao, Z.; Yang, K.; Zhang, S.; Wang, Q. Vapor-Liquid Equilibrium Measurement and Heating Performance Modeling on Eco-Friendly Zeotropic Blends of CO2/R1234ze(Z) and CO2/R1336mzz(E). Appl. Therm. Eng. 2023, 229, 120576. [Google Scholar] [CrossRef]
  93. Song, J.; Gu, C. Analysis of ORC (Organic Rankine Cycle) Systems with Pure Hydrocarbons and Mixtures of Hydrocarbon and Retardant for Engine Waste Heat Recovery. Appl. Therm. Eng. 2015, 89, 693–702. [Google Scholar] [CrossRef]
  94. Kolahi, M.; Yari, M.; Mahmoudi, S.M.S.; Mohammadkhani, F. Thermodynamic and Economic Performance Improvement of ORCs through Using Zeotropic Mixtures: Case of Waste Heat Recovery in an Offshore Platform. Case Stud. Therm. Eng. 2016, 8, 51–70. [Google Scholar] [CrossRef]
  95. Chys, M.; van den Broek, M.; Vanslambrouck, B.; De Paepe, M. Potential of Zeotropic Mixtures as Working Fluids in Organic Rankine Cycles. Energy 2012, 44, 623–632. [Google Scholar] [CrossRef]
  96. Fergani, Z.; Morosuk, T.; Touil, D. Exergy-Based Multi-Objective Optimization of an Organic Rankine Cycle with a Zeotropic Mixture. Entropy 2021, 23, 954. [Google Scholar] [CrossRef] [PubMed]
  97. Krempus, D.; Bahamonde, S.; van der Stelt, T.P.; Klink, W.; Colonna, P.; De Servi, C.M. On Mixtures as Working Fluids of Air-Cooled ORC Bottoming Power Plants of Gas Turbines. Appl. Therm. Eng. 2024, 236, 121730. [Google Scholar] [CrossRef]
  98. Albà, C.G.; Alkhatib, I.I.I.; Llovell, F.; Vega, L.F. Assessment of Low Global Warming Potential Refrigerants for Drop-In Replacement by Connecting Their Molecular Features to Their Performance. ACS Sustain. Chem. Eng. 2021, 9, 17034–17048. [Google Scholar] [CrossRef] [PubMed]
  99. Yaïci, W.; Entchev, E.; Talebizadehsardari, P.; Longo, M. Thermodynamic, Economic and Sustainability Analysis of Solar Organic Rankine Cycle System with Zeotropic Working Fluid Mixtures for Micro-Cogeneration in Buildings. Appl. Sci. 2020, 10, 7925. [Google Scholar] [CrossRef]
  100. Gonidaki, D.; Bellos, E. Performance Investigation of Geothermal Driven Organic Rankine Cycles with Zeotropic Mixtures and Partial Evaporation. Therm. Sci. Eng. Prog. 2025, 61, 103539. [Google Scholar] [CrossRef]
  101. Li, Y.-R.; Du, M.-T.; Wu, C.-M.; Wu, S.-Y.; Liu, C. Potential of Organic Rankine Cycle Using Zeotropic Mixtures as Working Fluids for Waste Heat Recovery. Energy 2014, 77, 509–519. [Google Scholar] [CrossRef]
  102. Dong, B.; Xu, G.; Cai, Y.; Li, H. Analysis of Zeotropic Mixtures Used in High-Temperature Organic Rankine Cycle. Energy Convers. Manag. 2014, 84, 253–260. [Google Scholar] [CrossRef]
  103. Sefidgar, Z.; Khazaei, A.; Javaherian, A.; Mahmoudi, S.M.S.; Elmegaard, B.; Arabkoohsar, A. Heat Pumps Using Zeotropic Mixtures for Heating and Cooling Applications: A Literature Review. Appl. Therm. Eng. 2025, 276, 126794. [Google Scholar] [CrossRef]
  104. Miao, Z.; Zhang, Y.; Yan, P.; Xu, J. Dynamic Modeling and Control Strategy of an Organic Rankine Cycle with Concentration Regulation of the Zeotropic Mixture Working Fluid. Energy 2025, 335, 138093. [Google Scholar] [CrossRef]
  105. Albà, C.G.; Alkhatib, I.I.I.; Llovell, F.; Vega, L.F. Hunting Sustainable Refrigerants Fulfilling Technical, Environmental, Safety and Economic Requirements. Renew. Sustain. Energy Rev. 2023, 188, 113806. [Google Scholar] [CrossRef]
  106. Andreasen, J.; Kærn, M.; Pierobon, L.; Larsen, U.; Haglind, F. Multi-Objective Optimization of Organic Rankine Cycle Power Plants Using Pure and Mixed Working Fluids. Energies 2016, 9, 322. [Google Scholar] [CrossRef]
  107. Asim, M.; Siddiqui, M.F.; Siddiqui, F.R.; Khan, S.; Leung, M.K.H. Decarbonizing Air-Conditioning Systems via Ultra-Low Grade Waste Heat Recovery—A Comprehensive Energy, Exergy, Economic and Environmental Assessment with Novel Desuperheating Based Adaptive Pinch Point Approach. Energy Convers. Manag. 2026, 348, 120631. [Google Scholar] [CrossRef]
  108. Heberle, F.; Preißinger, M.; Brüggemann, D. Zeotropic Mixtures as Working Fluids in Organic Rankine Cycles for Low-Enthalpy Geothermal Resources. Renew. Energy 2012, 37, 364–370. [Google Scholar] [CrossRef]
  109. Papadopoulos, A.I.; Stijepovic, M.; Linke, P.; Seferlis, P.; Voutetakis, S. Toward Optimum Working Fluid Mixtures for Organic Rankine Cycles Using Molecular Design and Sensitivity Analysis. Ind. Eng. Chem. Res. 2013, 52, 12116–12133. [Google Scholar] [CrossRef]
  110. Wang, S.; Tang, J.; Liu, C.; Li, Q.; Sun, Z.; Huo, E. Techno-Economic-Environmental Analysis and Fluid Selection of Transcritical Organic Rankine Cycle with Zeotropic Mixtures. J. Clean. Prod. 2024, 436, 140690. [Google Scholar] [CrossRef]
  111. Tian, Z.; Zeng, W.; Gu, B.; Zhang, Y.; Yuan, X. Energy, Exergy, and Economic (3E) Analysis of an Organic Rankine Cycle Using Zeotropic Mixtures Based on Marine Engine Waste Heat and LNG Cold Energy. Energy Convers. Manag. 2021, 228, 113657. [Google Scholar] [CrossRef]
  112. Wang, N.; Zhang, S.; Fei, Z.; Zhang, W.; Shao, L.; Sardari, F. Thermodynamic Performance Analysis a Power and Cooling Generation System Based on Geothermal Flash, Organic Rankine Cycles, and Ejector Refrigeration Cycle; Application of Zeotropic Mixtures. Sustain. Energy Technol. Assess. 2020, 40, 100749. [Google Scholar] [CrossRef]
  113. Giuffrida, A.; Pezzuto, D. Simulation of a Scroll Expander Using R1233zd(E), R1234ze(Z) and Their Mixtures as Drop-in Replacements for R245fa. Energy Procedia 2017, 129, 301–306. [Google Scholar] [CrossRef]
Figure 1. Methodological framework adopted in this study.
Jmse 14 00420 g001
Figure 2. Routes covered by the case-study vessel over the period 2023–2025 [37]. (a) Large-scale overview of the operational area in the Western Mediterranean. (b) Detailed view of the navigation route between the mainland and the Balearic Islands.
Jmse 14 00420 g002
Figure 3. Schematics of the proposed waste energy recovery system.
Jmse 14 00420 g003
Figure 4. Flowchart of the zeotropic mixture selection process.
Jmse 14 00420 g004
Figure 5. Temperature glide of selected zeotropic mixtures. The markedly higher glide observed for R1234yf and R1234ze(E) mixtures may lead to suboptimal heat transfer matching under the investigated operating conditions.
Jmse 14 00420 g005aJmse 14 00420 g005b
Figure 6. Comparison of the proposed cold energy ORC model with Yadav et al. data [71]. (a) Validation of cold energy ORC (power output vs. superheat). (b) Validation of cold energy ORC (thermal efficiency vs. superheat).
Jmse 14 00420 g006
Figure 7. Comparison between the waste heat ORC model results and reference data [74]. (a) Validation of waste heat ORC (power output vs. superheat). (b) Validation of waste heat ORC (thermal efficiency vs. superheat).
Jmse 14 00420 g007
Figure 8. Cold energy ORC performance under varying operating conditions. All zeotropic mixtures exhibit similar trends, with evaporation pressure exerting the strongest influence on net power output. (a) Effect of superheat in cold ORC power. (b) Effect of evaporation pressure in cold ORC power. (c) Effect of seawater temperature in cold ORC power.
Jmse 14 00420 g008
Figure 9. Waste heat ORC performance for Novec 649-based zeotropic mixtures. The figure illustrates the influence of reduced pressure and superheat on operational feasibility and net power output, with R1234yf showing the widest operating range. (a) Effect of superheat and reduced press on waste heat ORC [Novec 649 and R1233zd(E)]. (b) Effect of superheat and reduced press on waste heat ORC [Novec 649 and R1234yf]. (c) Effect of superheat and reduced press on waste heat ORC [Novec 649 and R1234ze(E)]. (d) Effect of superheat and reduced press on waste heat ORC [Novec 649 and R1234ze(Z)].
Jmse 14 00420 g009
Figure 10. Performance comparison of waste heat ORC under Novec 649-based zeotropic mixtures. The figure highlights the trade-off between operational flexibility and achievable net power output.
Jmse 14 00420 g010
Figure 11. Distribution of exergy destruction among system components. Heat transfer processes in the waste heat ORC, particularly in the evaporator, account for the majority of total irreversibilities.
Jmse 14 00420 g011
Figure 12. Discounted payback percentiles (P10, P50, and P90) as a function of LNG price obtained from Monte Carlo simulations. The close grouping of the percentile curves indicates moderate variability and stable economic trends across the investigated fuel price range.
Jmse 14 00420 g012
Table 1. Monthly average seawater and air temperatures along the vessel’s route [38].
MonthJanFebMarAprMayJunJulAgoSepOctNovDec
Seawater temp (°C)14.514.014.516.018.822.025.026.525.022.519.516.5
Air temp (°C)11.811.813.815.919.023.225.926.323.620.215.512.8
Table 2. Main and auxiliary engine specifications of the case-study vessel [39,40].
ParameterValue
Main Engines
Engine typeWärtsilä 16V31DF
NOx emission standardIMO Tier II (Diesel)/Tier III (Gas)
Number of cylinders16
R.P.M.750
Power9600 kW
LNG fuel consumption (85% load)0.325 kg/s
Exhaust gas temperature after turbocharger (85% load, gas mode)603.15 K
Exhaust gas mass flow rate (85% load)12.77 kg/s
Cooling water temperature (engine outlet)369.15 K
Cooling water mass flow41.67 kg/s
Auxiliary Engines
Engine typeSGE-24SL
NOx emission standardIMO Tier III (Gas)
Number of cylinders8
R.P.M.1500
Power344 kW
LNG fuel consumption (80% load)0.0156 kg/s
Exhaust gas temperature after turbocharger (80% load)693.15 K
Exhaust gas mass flow rate (80% load)0.86 kg/s
Cooling water temperature (engine outlet)369.15 K
Cooling water mass flow13.34 kg/s
Table 3. Main operational parameters defined for the proposed system.
ParameterValueUnitsReference
LNG fuel mass flow1.32kg/sCase study, all engines
Exhaust gas mass flow51.94kg/sCase study, all engines
Jacket water mass flow180.02kg/sCase study, all engines
Seawater mass flow100kg/sDesign condition
ORC cold pump efficiency75%[48]
ORC cold turbine efficiency80%[49]
HVAC compressor efficiency80%Case study, manufacturer data
Waste heat ORC pump efficiency75%[48]
Waste heat ORC turbine efficiency80%[50]
Electrical generators efficiency98%[51]
Pressure drop in heat exchangers0.1bar[52]
Table 4. Parameters considered in the sensitivity analysis.
ParameterMinMaxUnits
Air temperature283.15303.15K
Seawater temperature288.15303.15K
ORC cold evaporation pressure0.20.8Reduced press
ORC cold superheat030K
Waste heat ORC evap. pressure0.20.8Reduced press
Waste heat ORC superheat030K
Table 5. Selected zeotropic working fluid mixtures.
Base FluidSecondary FluidOptimal Mass FractionMixture GWP
Novec 649R1233zd(E)0.1–0.93.6
R1234yf0.1–0.90.6
R1234ze(E)0.1–0.91.3
R1234ze(Z)0.1–0.90.38
Table 6. Parameters for TEWI calculation [61,62].
Leakage Rate (kg/year)Recovery Factor
R407C (original fluid)0.150.85
Novec 649 & R1233zd(E)0.100.68
Novec 649 & R1234yf0.100.70
Novec 649 & R1234ze(E)0.100.65
Novec 649 & R1234ze(Z)0.100.71
Table 7. Parameters used for cost calculation [64].
ComponentK1K2K3C1C2C3B1B2FMFBM
Centrifugal Pump3.38920.05360.1538−0.39350.3957−0.013631.891.352.4
Compressor2.28971.3604−0.1027 7
Condenser (shell and tube)4.3247−0.3030.1634 1.631.661
Evaporator (shell and tube)4.3247−0.3030.16340.1578−0.29920.14131.631.661
Heat Exchanger
(flat plate)
4.6656−0.15570.1547 0.961.212.5
Expansion Valve3.87510.33280.1901−0.167420.134280.15058 4.5
Turbine2.70511.4398−0.1776 3.5
Table 8. Comparison of simulated HVAC system results with manufacturer specifications.
Manufacturer DataSimulation ResultsRelative Error (%)
Compressor power input (kW)110112.62.36
Heat absorbed by evaporator (kW)167169.91.79
Heat rejected by condenser (kW)120121.41.18
Table 9. Power consumption of HVAC compressor, original fluid vs. zeotropic mixtures.
R407C
(Original)
Novec 649
&
R1233zd(E)
Novec 649
&
R1234yf
Novec 649
&
R1234ze(E)
Novec 649
&
R1234ze(Z)
Compressor work11061.550.851.053.9
Table 10. Total annual CO2-equivalent emissions abated by the waste energy recovery system.
Ton/yearNovec 649
&
R1233zd(E)
Novec 649
&
R1234yf
Novec 649
&
R1234ze(E)
Novec 649
&
R1234ze(Z)
CO25135.224770.115108.344544.05
CH471.5266.4471.1563.29
N2O0.260.240.260.23
CO2-eq7206.736694.347169.016377.09
Table 11. TEWI comparison between the original system and the retrofitted configuration.
FluidR407C (Original)Novec 649
&
R1233zd(E)
Novec 649
&
R1234yf
Novec 649
&
R1234ze(E)
Novec 649
&
R1234ze(Z)
TEWI (ton CO2-eq)4735.02640.92180.02187.42313.1
Table 12. Comparison between GHG pricing mechanisms and the GHG-AC of the proposed system.
EU ETSIMO Tier 1
Remedial Unit *
IMO Tier 2
Remedial Unit *
Novec 649
&
R1233zd(E)
Novec 649
&
R1234yf
Novec 649
&
R1234ze(E)
Novec 649
&
R1234ze(Z)
CO2-eq price (Euro/ton)82.8990.91345.45258.75303.68261.84335.12
* IMO Tier 1 and Tier 2 Remedial Units are expected to be set at 100 and 380 USD. For comparison, these amounts are converted into Euro using an exchange rate of 1.10.
Table 13. Statistical summary of Monte Carlo simulation results for discounted payback period.
MetricValue
Recovery within 20 years83.95%
Mean discounted payback (years)13.65
Median (P50) (years)13.08
Standard deviation (years)2.85
P10 (years)10.29
P90 (years)18.09
Probability DPB < 10 years (conditional)4.4%
Probability DPB < 7 years (overall)0%
Disclaimer/Publisher’s Note: The statements, opinions and data contained in all publications are solely those of the individual author(s) and contributor(s) and not of MDPI and/or the editor(s). MDPI and/or the editor(s) disclaim responsibility for any injury to people or property resulting from any ideas, methods, instructions or products referred to in the content.