Article

Volcanic Lithology Identification via Improved Random Forest with Conventional-Elemental-Logging Feature Interpolation: A Case of Block KL16-1

College of Earth Sciences, Yangtze University, Wuhan 430100, China
*
Author to whom correspondence should be addressed.
J. Mar. Sci. Eng. 2026, 14(19), 1802; https://doi.org/10.3390/jmse14191802
Submission received: 31 August 2026 / Revised: 23 September 2026 / Accepted: 24 September 2026 / Published: 29 September 2026
(This article belongs to the Section Geological Oceanography)

Abstract

Conventional logging and elemental logging-based lithology identification for volcanic buried-hill reservoirs is hampered by overlapping logging responses, low vertical resolution of elemental measurements, and inter-sample class imbalance, which lead to unsatisfactory classification accuracy. Existing cross-plot empirical methods cannot reliably distinguish lithologies with similar geophysical signatures (e.g., volcanic breccia versus andesite), especially for complex Mesozoic volcanic successions in offshore Bohai Bay Basin. To fill this technical gap, this work proposes an improved random-forest workflow integrating multi-source log-data fusion, depth-aligned linear interpolation, mutual-information feature screening, and SMOTE oversampling. The core methodological innovations lie in: (1) depth matching between conventional continuous logs and sparsely sampled elemental logging by linear interpolation to construct complete multi-feature datasets; (2) eliminating redundant input variables via mutual-information-based feature selection; and (3) mitigating lithology-sample imbalance with SMOTE synthetic-sample generation prior to random-forest training, rather than directly applying off-the-shelf random-forest classifiers. Six dominant lithologies are recognized within the Mesozoic buried-hill of Block KL16-1: basalt, andesite, rhyolite, volcanic breccia, tuff, and tuffaceous conglomerate. The proposed improved random-forest model yields an overall lithology-identification accuracy of 87% and average recall of 85.9%, substantially outperforming traditional cross-plot approaches. Confusion-matrix error analysis demonstrates that the workflow greatly reduces misclassification between easily confused lithological pairs (volcanic breccia andesite, tuff andesite). This study not only delivers a practical tool for fine reservoir evaluation and reservoir-facies prediction in Bohai Mesozoic buried-hill plays but also provides a reproducible reference for machine-learning-driven lithology interpretation in analogous offshore volcanic-reservoir settings.

1. Introduction

Global hydrocarbon exploration is increasingly targeting deep, complex lithological and unconventional reservoirs. Mesozoic buried-hill petroleum systems in eastern China possess huge resource potential and have become a critical domain for reserves growth and production stabilization. As a key offshore exploration province, the Bohai Sea hosts Mesozoic volcanic buried-hill structures with favorable reservoir-forming conditions and proven hundred-million-ton-scale petroleum reserves, showing bright exploration prospects [1]. Nevertheless, multi-phase tectonic deformation, frequent volcanic eruptions, and subsequent long-term weathering-leaching have created highly complex volcanic reservoirs within Bohai Mesozoic buried hills: lithologies vary rapidly in both vertical and lateral directions, lithological boundaries are transitional and blurred, and conventional empirical lithology-identification workflows struggle to satisfy high-precision exploration requirements.
Accurate lithology identification underpins reservoir assessment, volumetric estimation, and development planning; its reliability directly controls the quality of reservoir characterization and exploration decision-making. Traditional empirical identification mainly depends on two-dimensional cross-plot analysis: though simple and intuitive, it only utilizes a small subset of logging or elemental-log parameters. In complex volcanic intervals, log-response overlap between rock types severely degrades classification performance [2]. Elemental logging records rock geochemical composition yet suffers from low vertical sampling resolution, discontinuous depth coverage, and high operational costs, restricting large-scale field deployment [3]. Therefore, new integrated interpretation workflows are urgently required for volcanic-reservoir lithology discrimination.
Many domestic and international researchers have investigated log-based lithology interpretation. Herron (1986) built element-to-mineral conversion relationships and quantitatively inverted kaolinite, illite and K-feldspar contents from Al-Fe-K elemental logs, establishing the theoretical basis for elemental-log-driven lithology evaluation [4]. Liu Juntao et al. (2018) transformed X-ray fluorescence (XRF) elemental-logging data into mineral-abundance series and constructed regional interpretation models to estimate reservoir skeletal density and permeability, broadening elemental-log application in reservoir evaluation [5].
Interpretation paradigms for well-logging datasets have shifted from empirical charts toward intelligent machine-learning algorithms. Two-dimensional cross-plots were widely adopted in early lithofacies discrimination for their simplicity, yet they only leverage two log dimensions and cannot capture comprehensive geophysical fingerprints for complicated volcanic sequences [6]. In the Mesozoic buried-hill of the Laizhou Bay Sag, abundant co-existing lithofacies and fuzzy boundaries cause considerable misclassification using cross-plot techniques, failing practical exploration demands.
Machine-learning methods are rapidly penetrating log-interpretation practice. Random forest (RF), characterized by anti-noise capability, good generalization, and suitability for high-dimensional classification tasks, has become a mainstream intelligent-identification technique for complex lithologies [7,8]. Convolutional neural networks (CNNs) can extract local and global curve features and improve identification robustness [9]. Bayesian discrimination, Fisher discriminant analysis, and support vector machines (SVMs) have also been trialed for clastic and volcanic-rock classification with varying degrees of success [10].
Existing research gaps remain for offshore volcanic buried-hill reservoirs: Elemental logging and conventional logging differ in depth-sampling intervals; direct concatenation produces depth-mismatched samples, and simple resampling methods may distort geochemical signatures; Volcanic-lithology datasets typically exhibit severe class imbalance because certain rock types occur less frequently in drilled intervals, leading to model bias toward dominant lithologies; Many published machine-learning lithology-identification papers treat pre-processing as a trivial step and directly apply off-the-shelf classifiers; few publications systematically combine depth-alignment interpolation, information-theoretic feature filtering, and imbalance mitigation for volcanic-reservoir log interpretation; Geological and machine-learning results are often decoupled; and model outputs are rarely analyzed against core-measured geochemical statistics to explain misclassification mechanisms [11,12].
Aiming at these bottlenecks for Block KL16-1, this study integrates conventional logging and elemental-logging datasets. We implement depth-aligned linear interpolation for multi-source log matching, adopt mutual-information metrics to select high-sensitivity features [13], apply SMOTE oversampling to mitigate sample imbalance, and construct an improved random-forest lithology-identification model. Model performance is validated against core, thin-section and cutting observations. This work offers a reproducible technical workflow for fine-scale lithology discrimination in Bohai offshore Mesozoic volcanic buried-hill reservoirs and provides a comparative benchmark for analogous global volcanic petroleum plays.

2. Regional Geological Overview

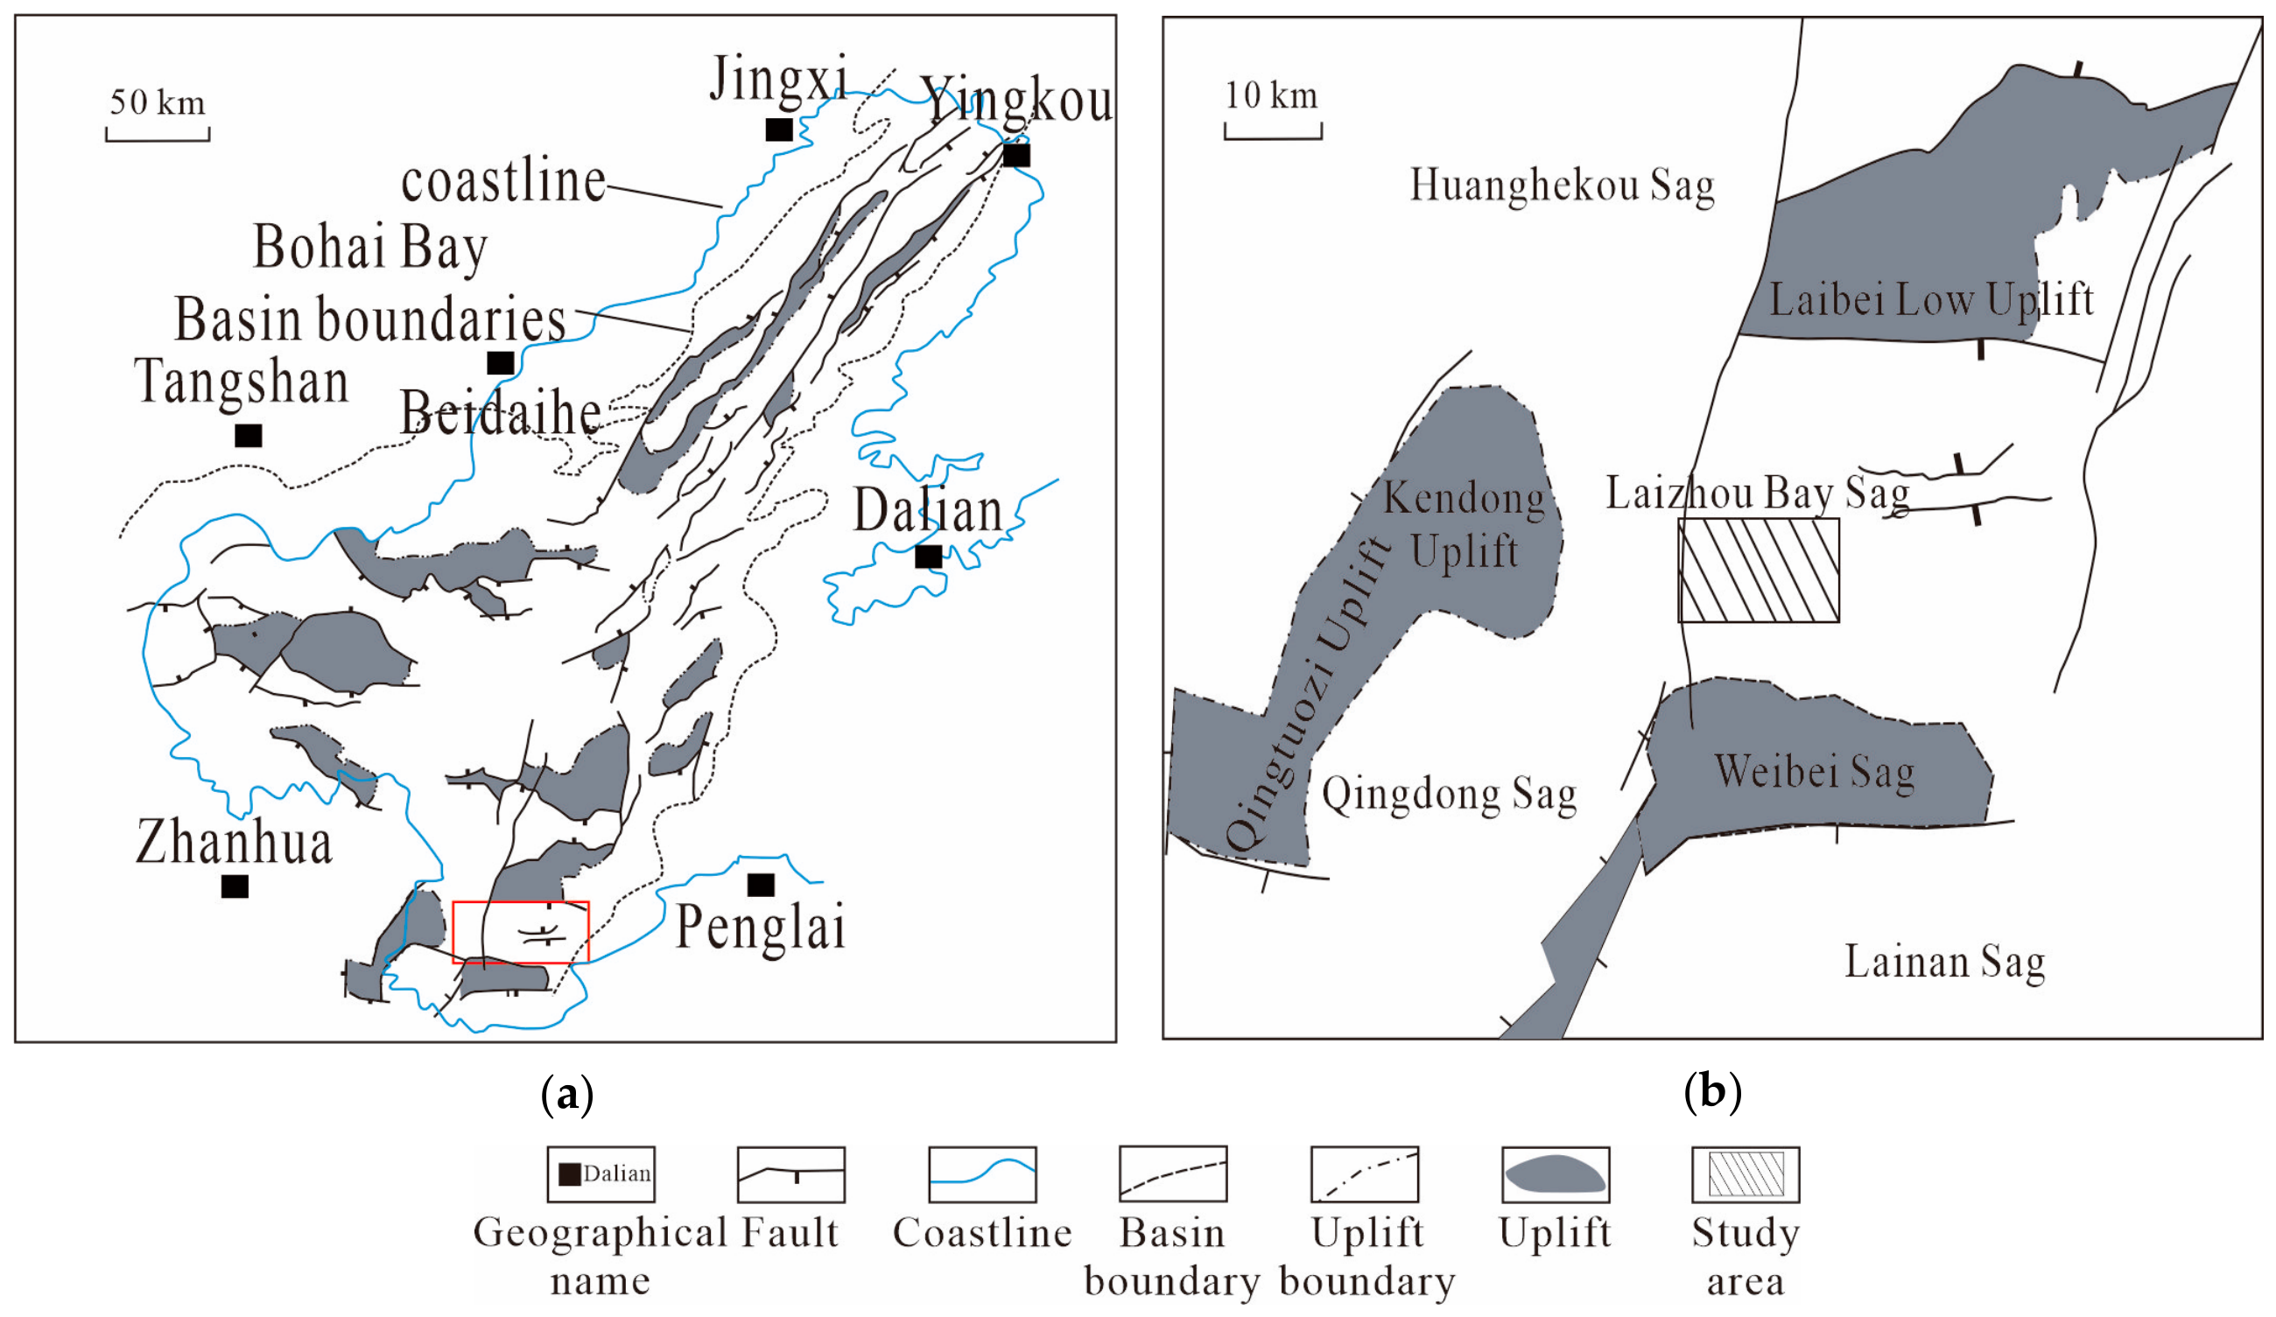
The Laizhou Bay Sag lies within the eastern Jiyang Depression of the Bohai Bay Basin, representing a typical north-dipping, south-onlapping trough-shaped graben with an areal extent of approximately 1500 km2. It is bounded by the Eastern Shandong Uplift (east), Northern Weifang Anticline (south), Eastern Kenan Anticline (west), and Northern Laizhou Low Anticline (north). This Cenozoic sag developed upon a pre-existing Mesozoic basement [14]. Block KL16-1 is located on the northern slope belt of the Laizhou Bay Sag (Figure 1). Multiple exploration wells have been drilled in this oilfield, with average water depth of ~15 m. To its north sits the northern sub-sag of Laizhou Bay; to its east lies the southern secondary trough of Laizhou Bay. Block KL16-1 corresponds to a composite faulted-anticline structure jointly controlled by strike-slip faults and major boundary faults [15].
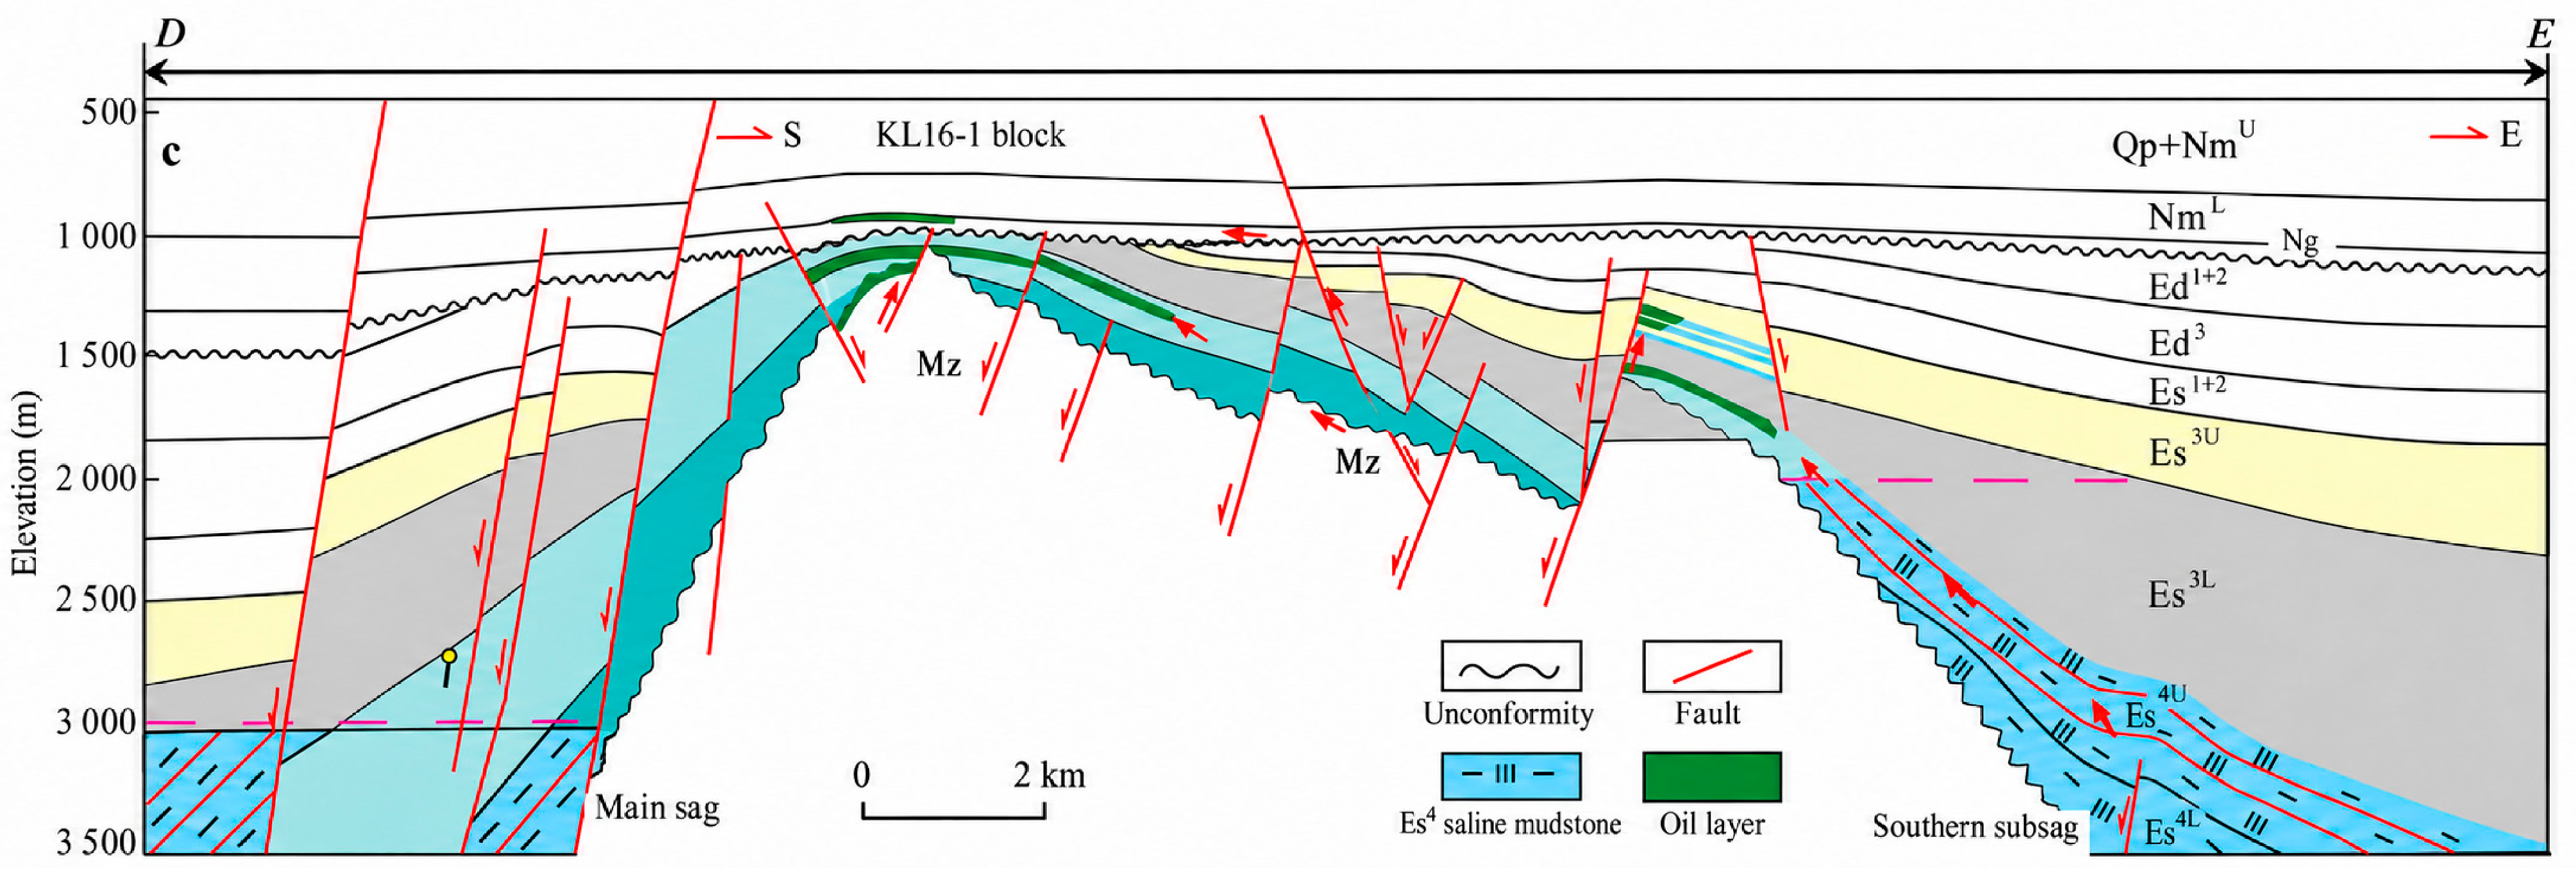
The strata in the study area from top to bottom consist of the Quaternary Pingyuan Formation, Neogene Minghuazhen Formation and Guantao Formation, and Paleogene Dongying Formation and Shahejie Formation. The Shahejie Formation can be further divided into the 1st–2nd Members, 3rd Member, and 4th Member. Beneath the Shahejie Formation lies the Mesozoic volcanic basement, which is mainly composed of andesite from the Lower Cretaceous Yixian Formation and rhyolite from the Middle Jurassic Lanqi Formation. Mesozoic buried-hill reservoirs are primarily distributed in the structural high of the study area, specifically at the top of the buried hill below the basal unconformity of the Shahejie 4th Member and along adjacent fault zones, with reservoir spaces dominated by volcanic weathered pores, dissolution pores, and structural fractures. After formation, these Mesozoic volcanic rocks underwent 45–80 Ma of prolonged weathering and alteration, forming complex volcanic buried-hill reservoir assemblages [16]. Drill-hole data reveal diverse lithologies in the study area, mainly including andesite, diabase, rhyolite, and volcaniclastic rocks. These lithologies mutually transition and intergrade vertically and laterally, resulting in strongly heterogeneous reservoir spatial distributions. Furthermore, the volcanic buried-hill reservoirs are frequently developed near faults, folds, and magmatic intrusion zones, so their physical properties have been significantly overprinted and modified by multi-stage tectonic activities (Figure 2).
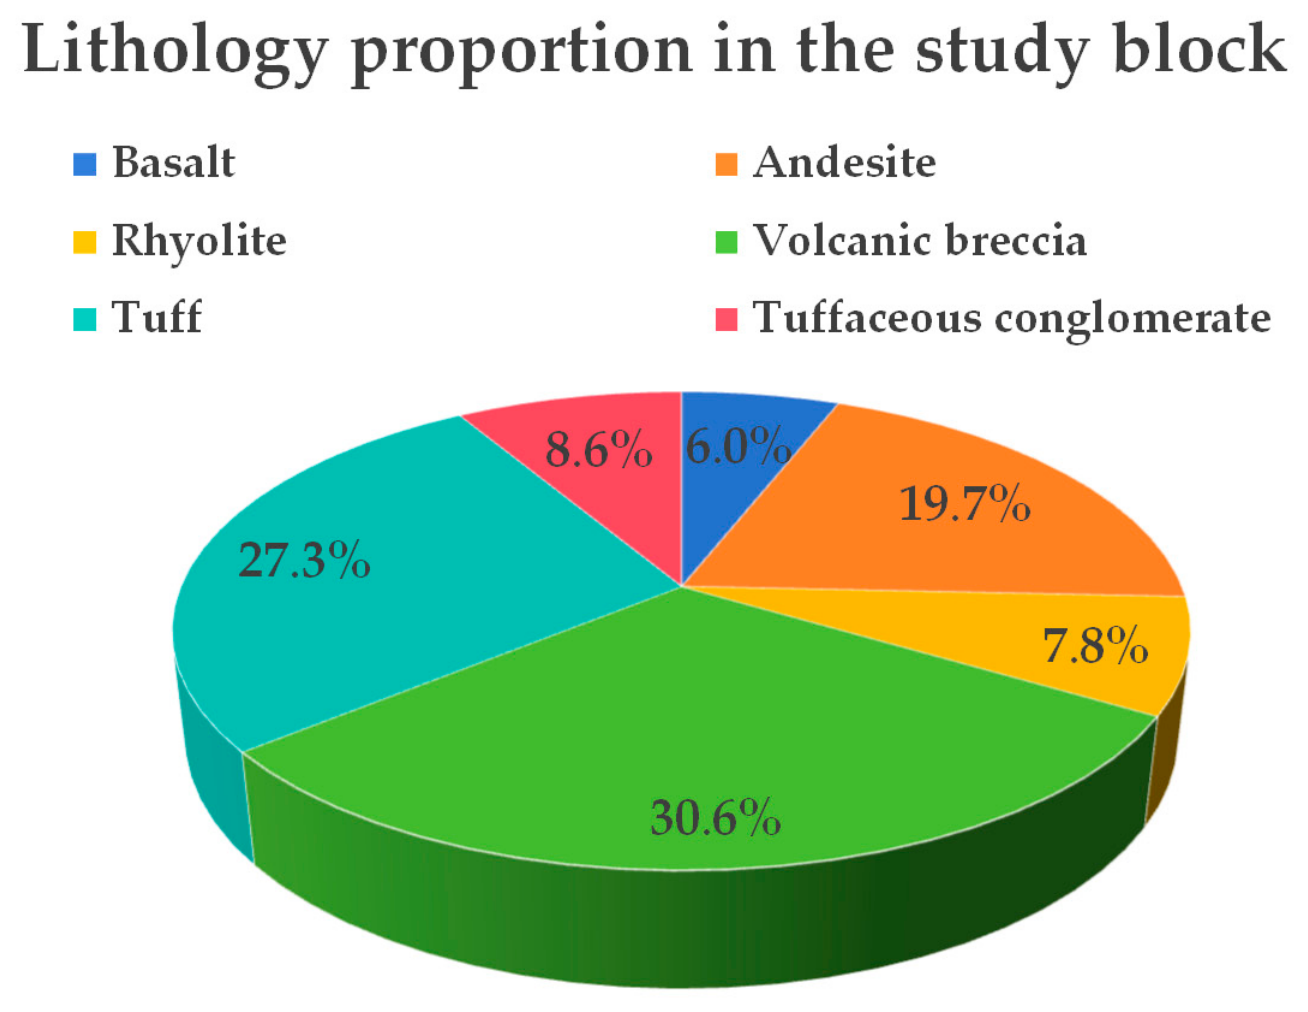
Six major volcanic rock types occur in our study block: basalt, andesite, rhyolite, volcanic breccia, tuff, and tuffaceous conglomerate. Volcanic-rock volumetric fractions calculated from core and cutting statistics are: basalt 6.1%, andesite 19.7%, rhyolite 7.8%, volcanic breccia 30.6%, tuff 27.3%, and tuffaceous conglomerate 8.6%. Volcanic breccia, tuff and andesite constitute the most volumetrically important rock units (Figure 3).
Supplementary lithostratigraphic information for the KL16-1 block is summarized as follows: the local Mesozoic succession mainly consists of intermediate-acid volcanic lava and volcaniclastic deposits; stratigraphic contacts are frequently unconformable due to long-term pre-Cenozoic uplifting and erosion; source-rock and hydrocarbon-migration system characteristics for the Laizhou Bay Sag have been comprehensively described in previous regional publications and will not be repeated herein; readers are referred to Rudarsko-geološko-naftni zbornik and Mining of Mineral Deposits series papers on volcanic-reservoir petroleum systems for regional analogies [17].

3. Data and Methods

Core samples, drill cuttings, thin-section petrography and X-ray diffraction mineralogical data from multiple wells in Block KL16-1 are synthesized. Rock units are classified into volcanic-lava and volcaniclastic categories according to petrographic texture, structure and mineralogical assemblages [18].

3.1. Rock-Type Classification and Geochemical Statistics

3.1.1. Volcanic Lava

Basalt (basic): Basic volcanic lava, SiO2 = 40–53 wt %. Dominant minerals: plagioclase, pyroxene; minor biotite, quartz. Black-dark-grey, mottled texture, locally micro-fractured. Core-measured mean SiO2 = 48.2 wt %, standard deviation σ = 2.7 wt % (n = 6) [19].
Andesite (intermediate): Intermediate volcanic lava, SiO2 = 51–64 wt %. Phenocrysts: plagioclase, pyroxene, chlorite, amphibole; matrix contains glassy components. Mean core-measured SiO2 = 57.4 wt %, σ = 3.1 wt % (n = 4).
Rhyolite (acidic): Acidic volcanic lava, SiO2 > 63 wt %. Phenocrysts: feldspar, quartz; matrix comprises volcanic glass, micro-striped feldspar and magnetite. Mean core-measured SiO2 = 72.1 wt %, σ = 2.4 wt % (n = 3).

3.1.2. Volcaniclastic Rocks

Tuff: Light-green-purplish-red; dominated by volcanic-ash fractions; porphyritic-blocky texture, well-developed fractures partially filled by calcite. Mean SiO2 = 59.3 wt %, σ = 3.8 wt% (n = 4).
Volcanic breccia: Dominated by igneous clasts, clast size 2–7 mm (maximum 30 mm), sub-angular clasts, poor sorting; matrix is mainly volcanic ash. Mean SiO2 = 56.8 wt %, σ = 4.2 wt % (n = 9).
Tuffaceous conglomerate: Clasts include volcanic rock fragments, basalt clasts, quartz and feldspar; grain-size 2–64 mm, loosely cemented with patchy cementation zones. Mean SiO2 = 58.1 wt %, σ = 3.5 wt % (n = 5).
Note: Above SiO2 statistics are computed from n = 31 valid core-calibrated XRF measurements within Block KL16-1 [20].

3.2. Limitations of Traditional Lithology-Identification Approaches

3.2.1. Elemental-Logging Cross-Plot Method

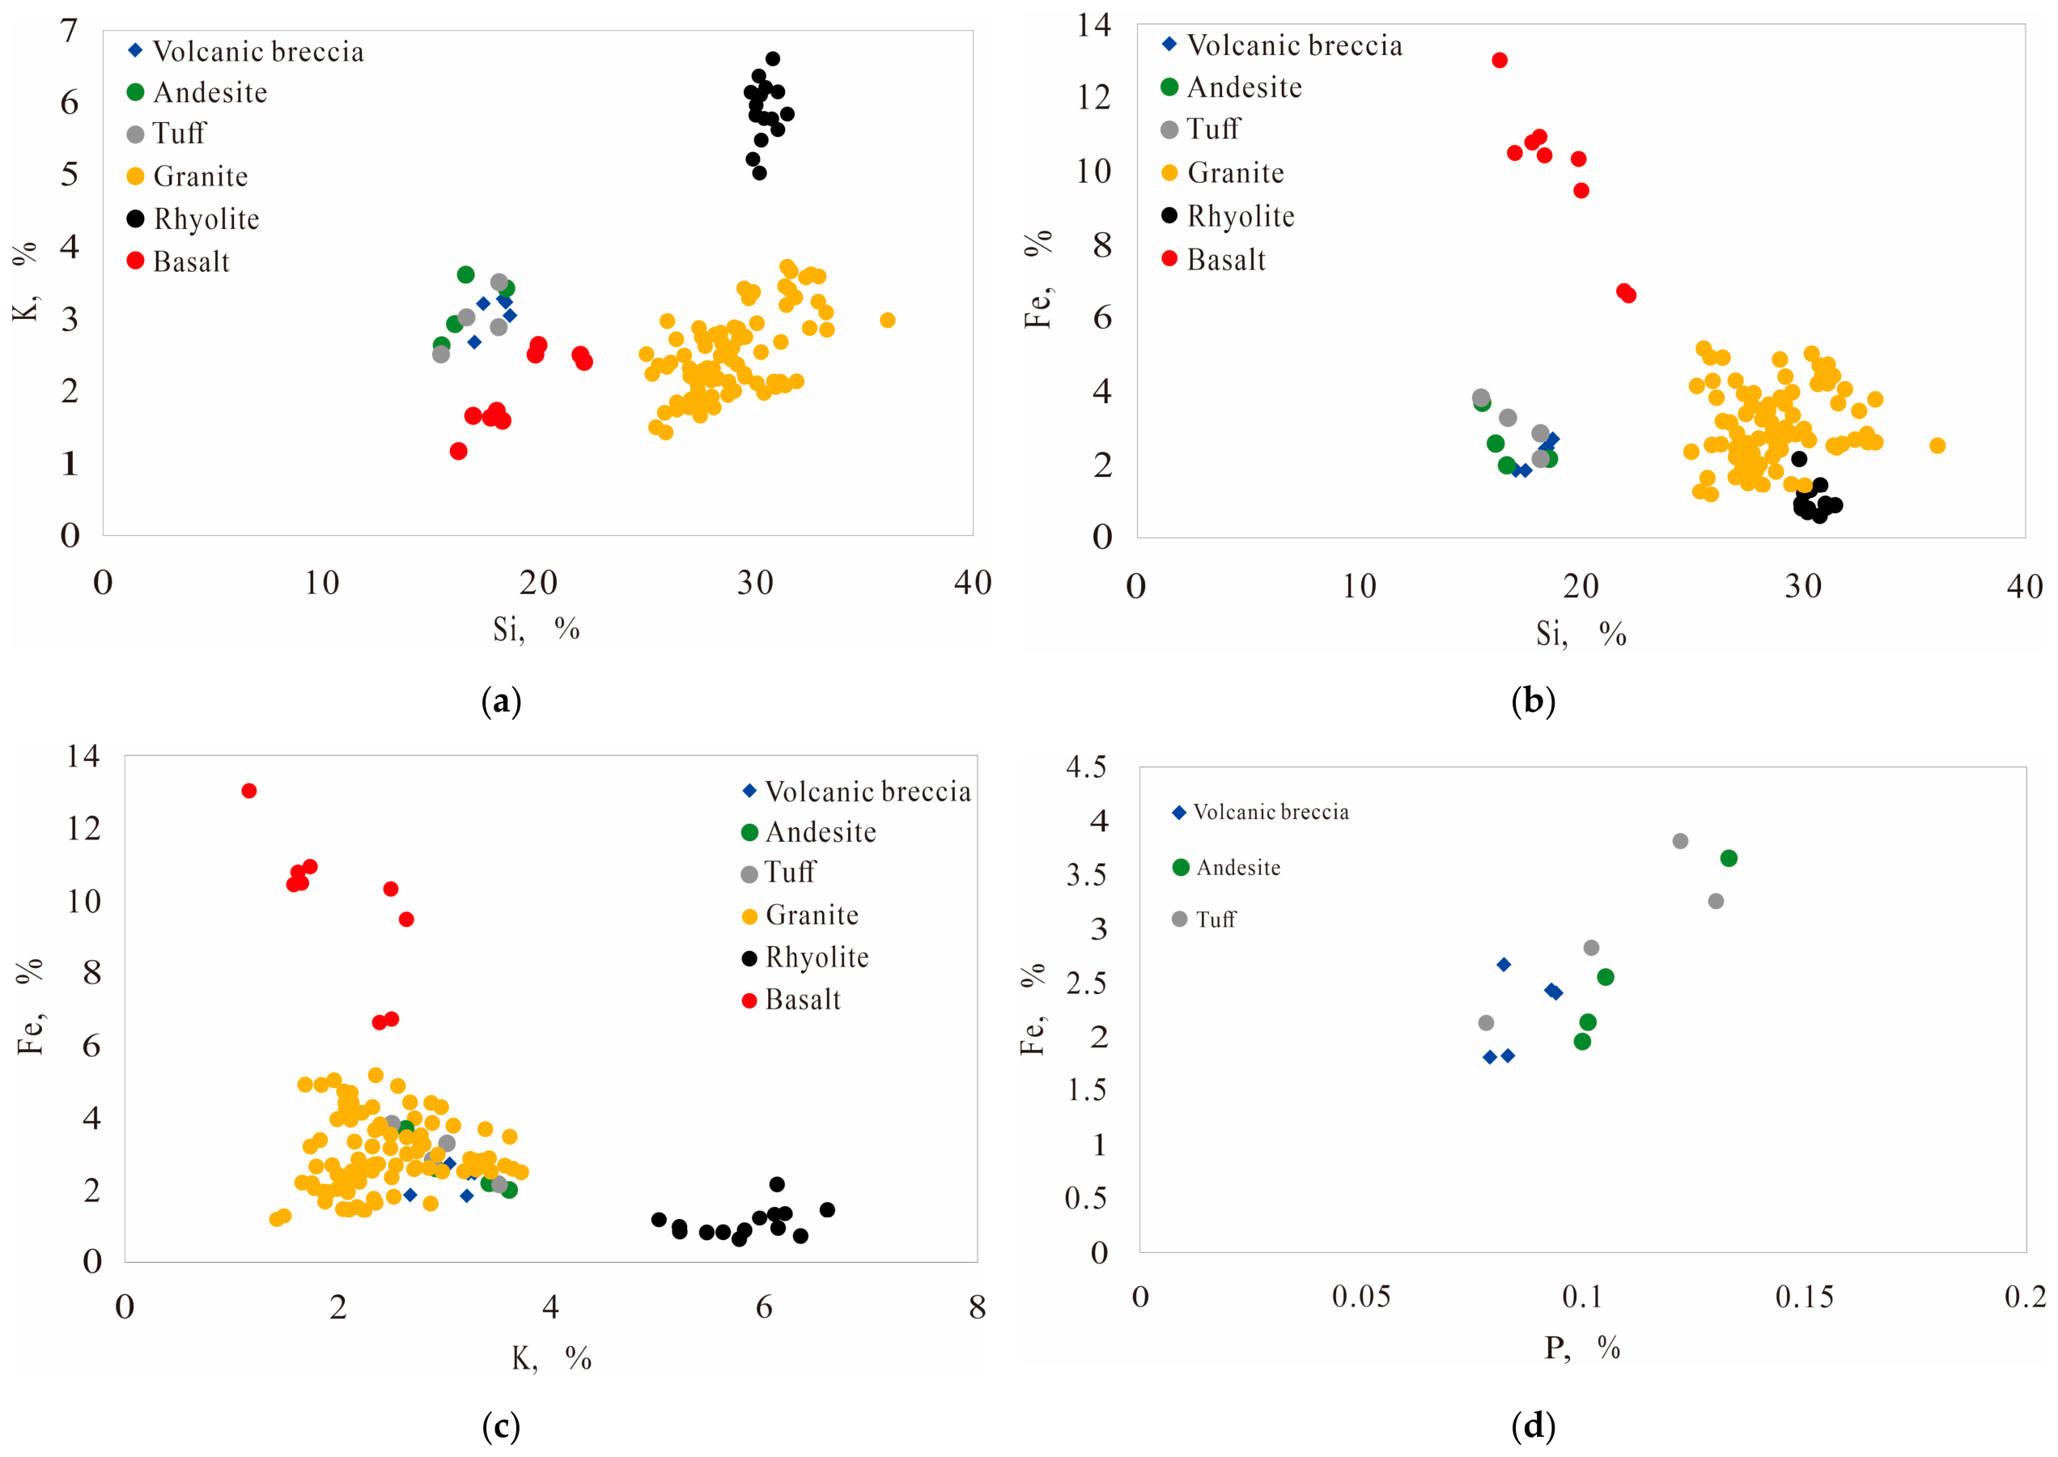
Sensitive elemental indicators (Si, K, Fe, P) are selected to build two-dimensional cross-plots for preliminary lithology discrimination. For our study block, identification thresholds for rhyolite, basalt, granite, volcanic breccia, andesite and tuff are established (Table 1, Figure 4) [21,22]. The overall cross-plot identification accuracy reaches 81.06%. Nevertheless, elemental logging suffers from low vertical resolution, discontinuous depth sampling and high cost. Cross-plot boundaries are transitional, and lithology overlap cannot be eliminated [23,24].
Petrological characteristics and elemental-log response ranges for each lithology are summarized (Table 2). Despite measurable geochemical differences, response-field overlap is pervasive, which restricts purely elemental-chart-based discrimination.

3.2.2. Conventional-Logging Cross-Plot Analysis

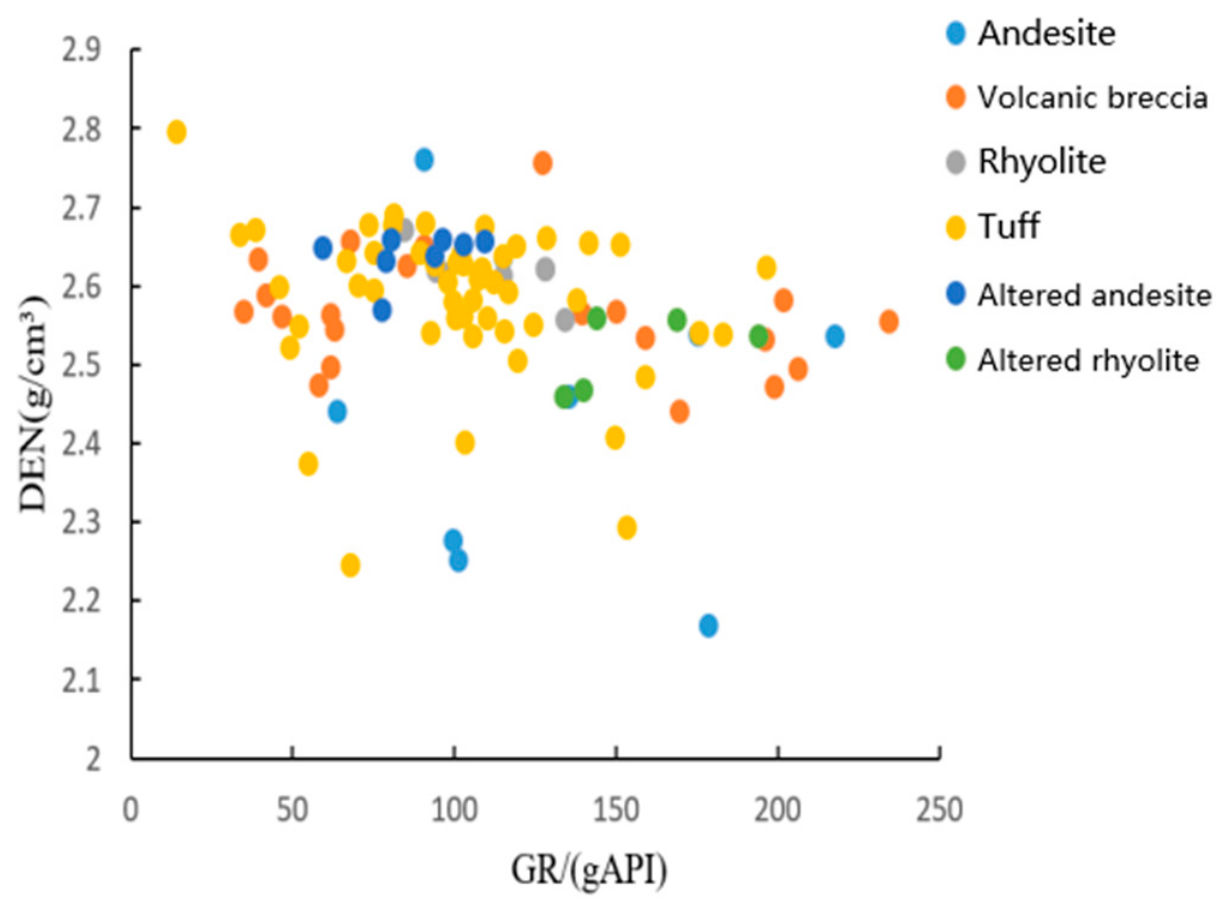
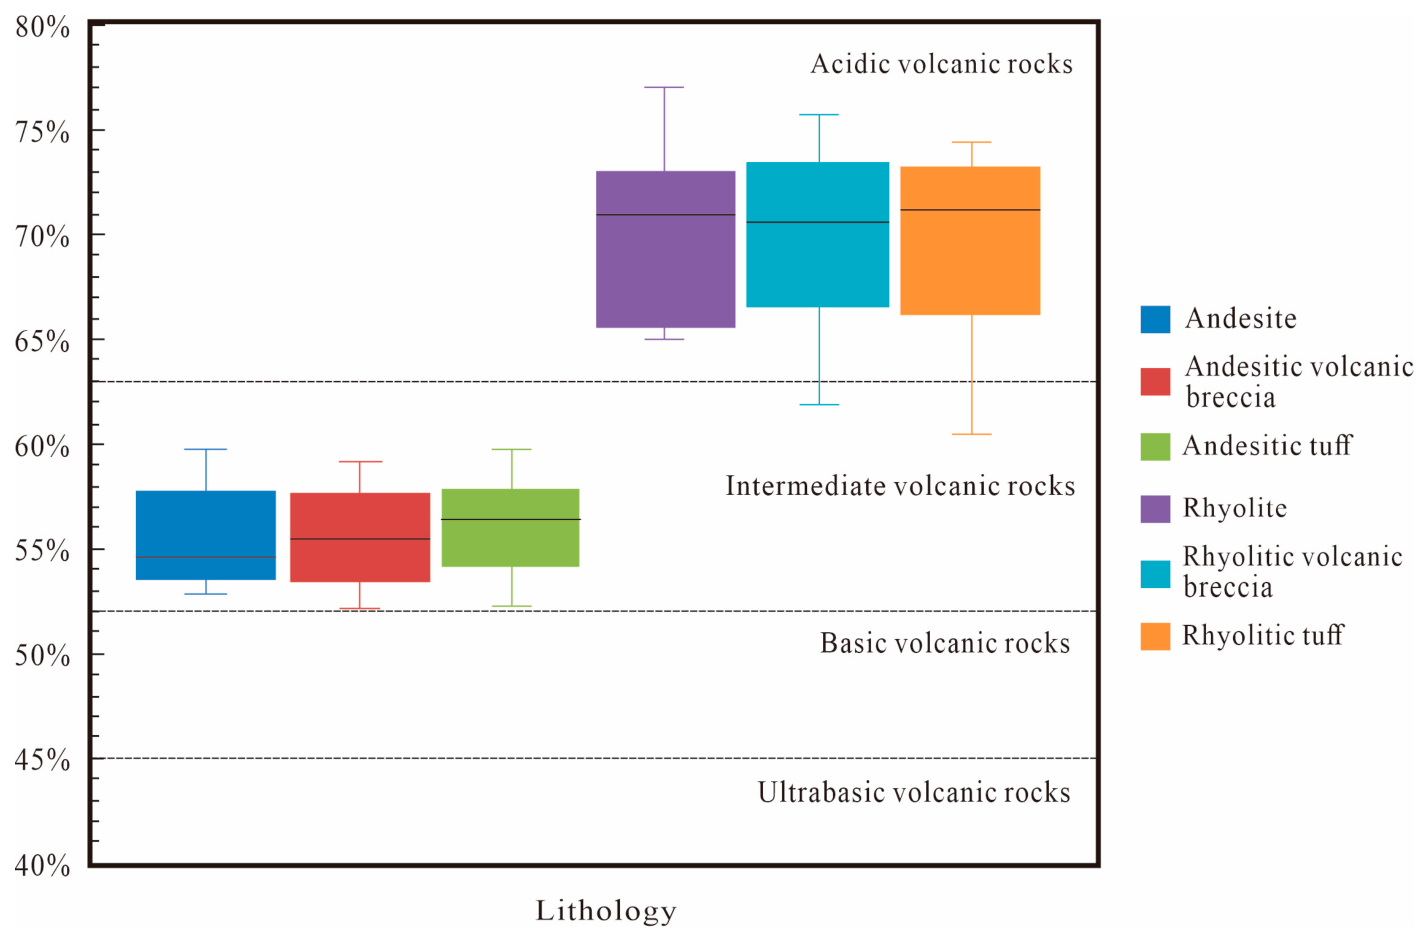
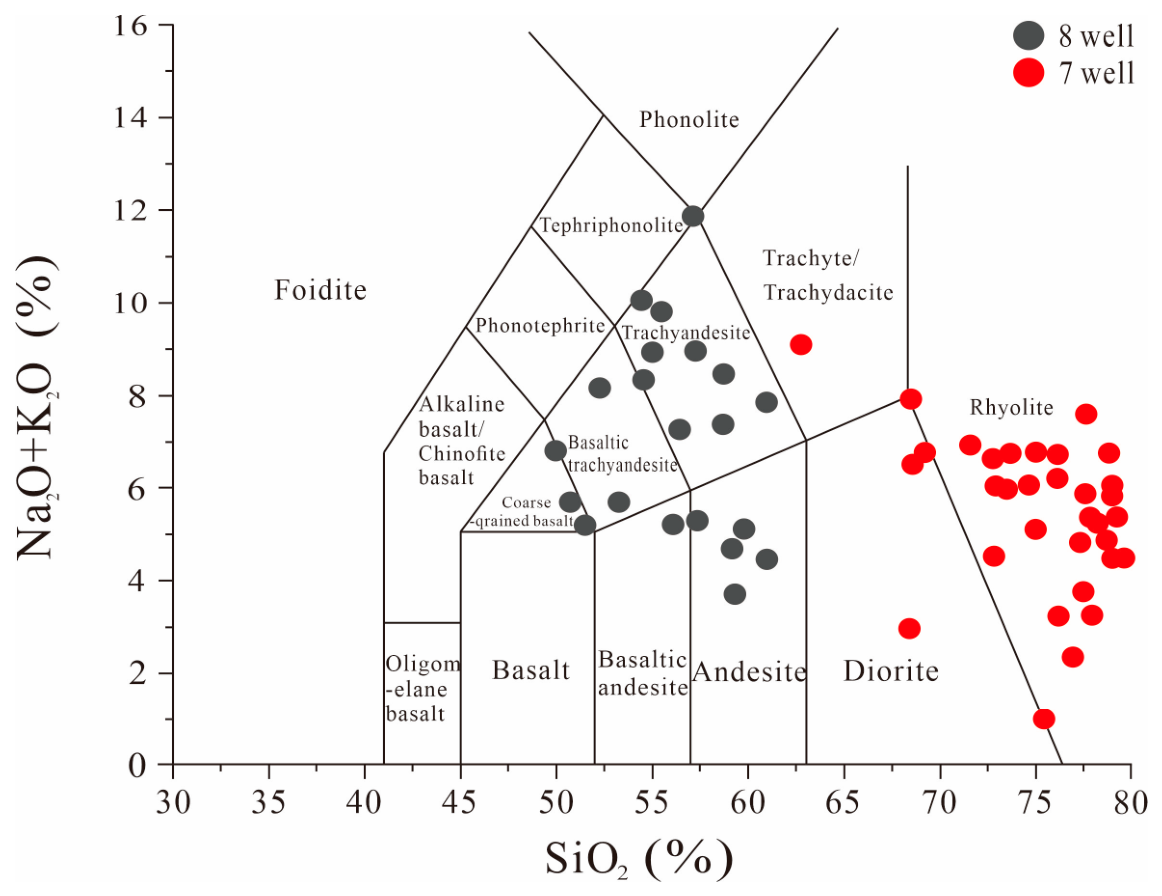
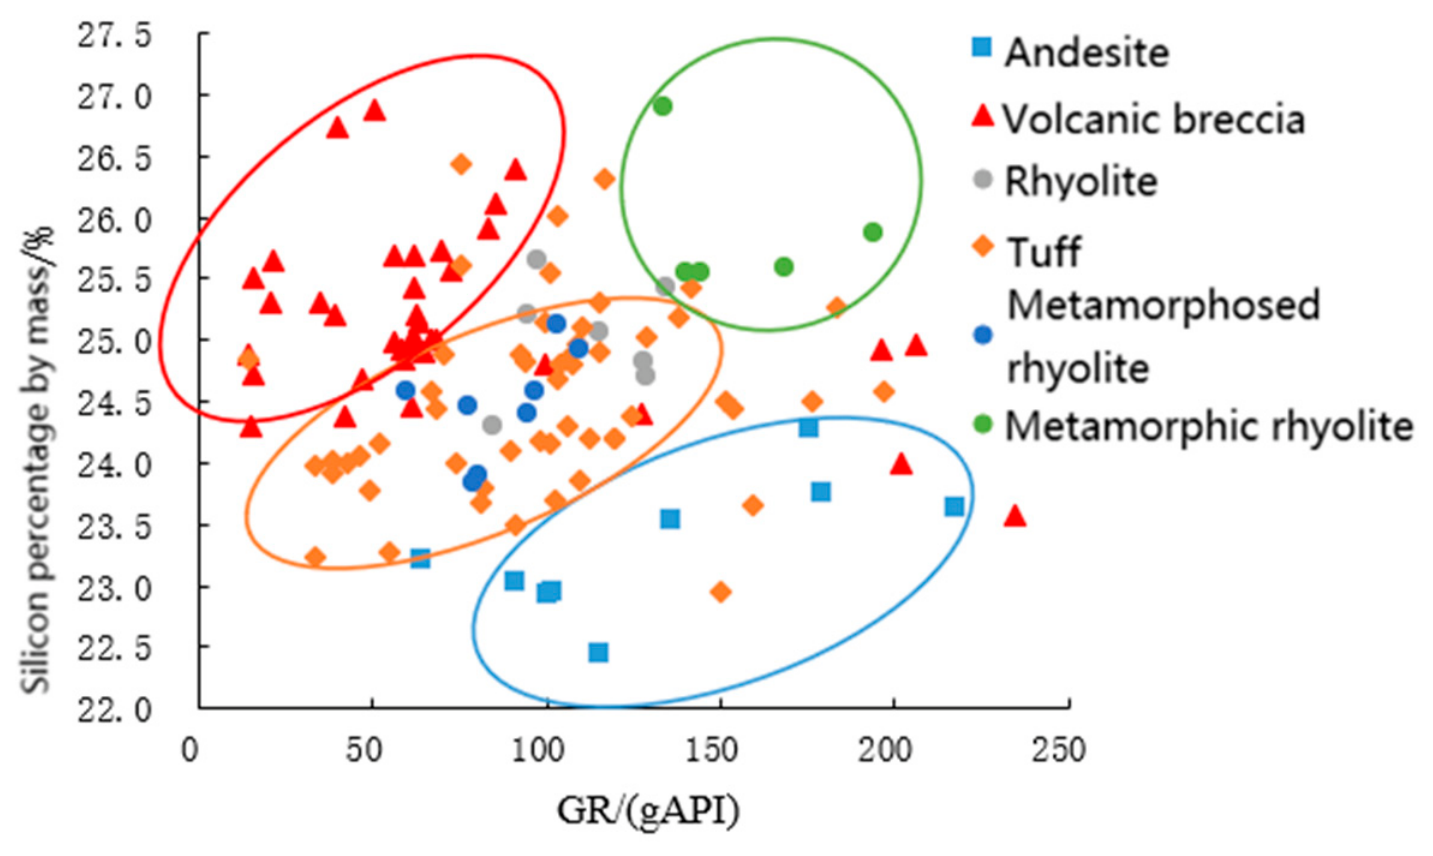
Conventional well-logging curves include natural gamma (GR), acoustic transit time (DT), compensated neutron porosity (CNL), bulk density (DEN), and deep laterolog resistivity (RD). These logs are conventionally deployed for porosity and saturation computation; yet volcanic-rock lithology is also strongly imprinted on gamma-ray, density-neutron and resistivity responses, because mineral assemblage, porosity, alteration and fracture development jointly control geophysical measurements. Accordingly, we constructed cross-plots, box-and-whisker diagrams for SiO2 mass fraction, total-alkali-silica (TAS) classification diagrams and ECS elemental-logging identification plates (Figure 5, Figure 6, Figure 7 and Figure 8). Distinct log-response envelopes exist for different rock units; nevertheless, substantial overlap is observed, especially between volcanic breccia and andesite. Two-dimensional parameter spaces cannot fully separate these lithologies, resulting in insufficient identification accuracy for field exploration requirements [25]. In summary, single-source and two-dimensional empirical workflows are limited by data dimensionality, discontinuous sampling, and overlapping log fingerprints; multi-source-fusion intelligent-identification workflows are required for complex volcanic-reservoir lithology interpretation [26,27].

3.3. Improved Random-Forest Workflow with Log-Feature Interpolation

3.3.1. General Background of Random-Forest Algorithm

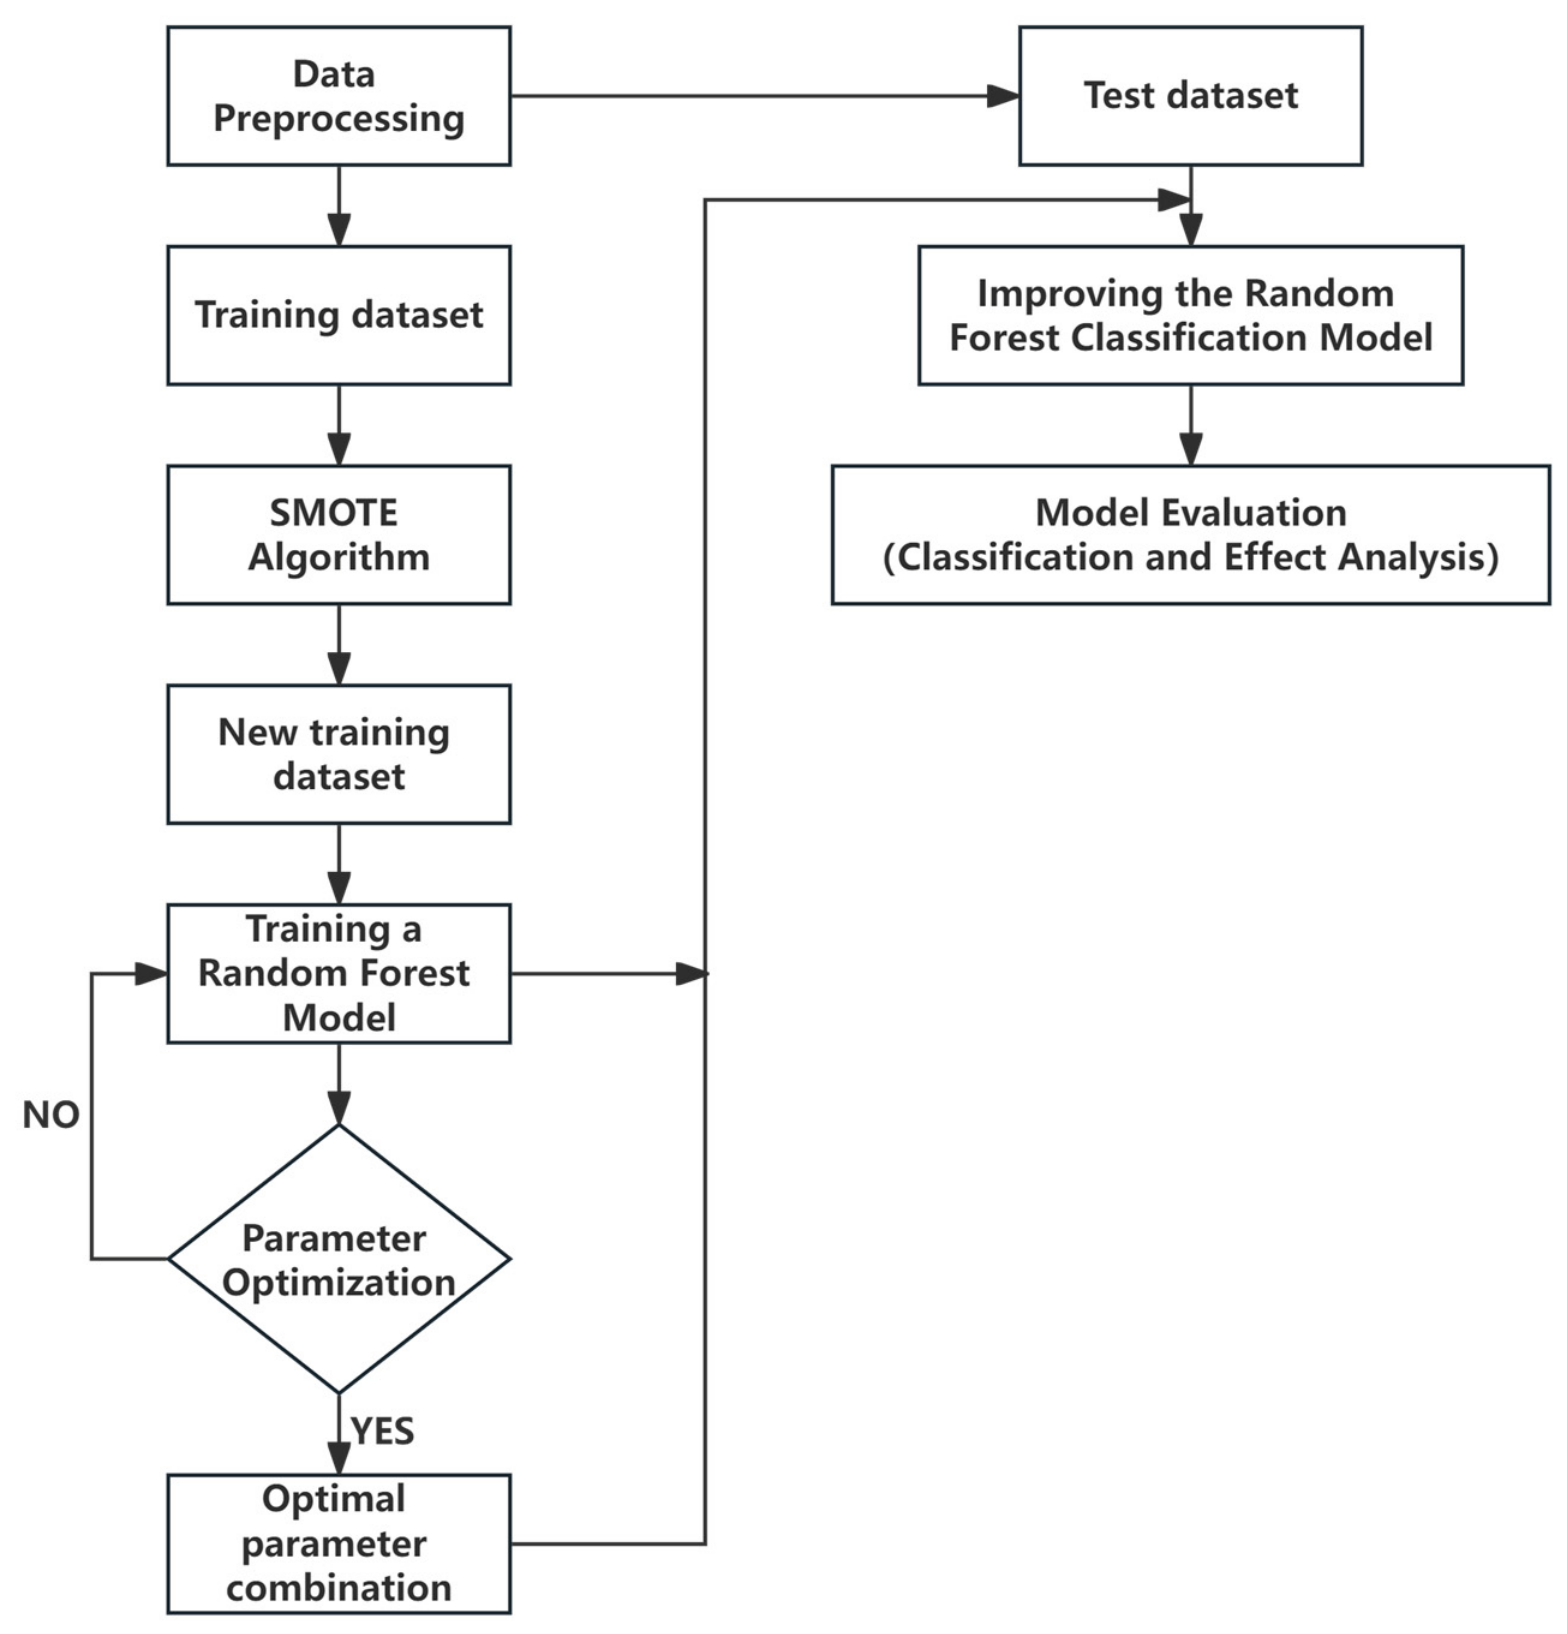
Random forest is an ensemble supervised-classification algorithm built upon multiple independent decision-tree base-learners. Each decision tree is trained on boot-strapped subsets of the training dataset; feature randomness is further introduced by randomly sampling input features at each tree node. Final classification outputs are determined via majority voting across all decision trees within the forest. RF exhibits strong anti-noise performance, good generalization capacity, and handles high-dimensional input well. Nevertheless, vanilla RF does not natively address multi-source depth-mismatch, feature redundancy, or class-imbalance problems. In this study, the “improvement” does not modify internal decision-tree splitting logic of RF itself; improvements are embodied within the complete pre-processing pipeline: depth-aligned linear interpolation for multi-source log matching, mutual-information-driven feature filtering, and SMOTE oversampling to counteract lithology-class imbalance before feeding samples into the random-forest classifier [28,29,30,31,32].

3.3.2. Step-by-Step Workflow

Multi-Source-Log Fusion and Depth-Aligned Linear Interpolation
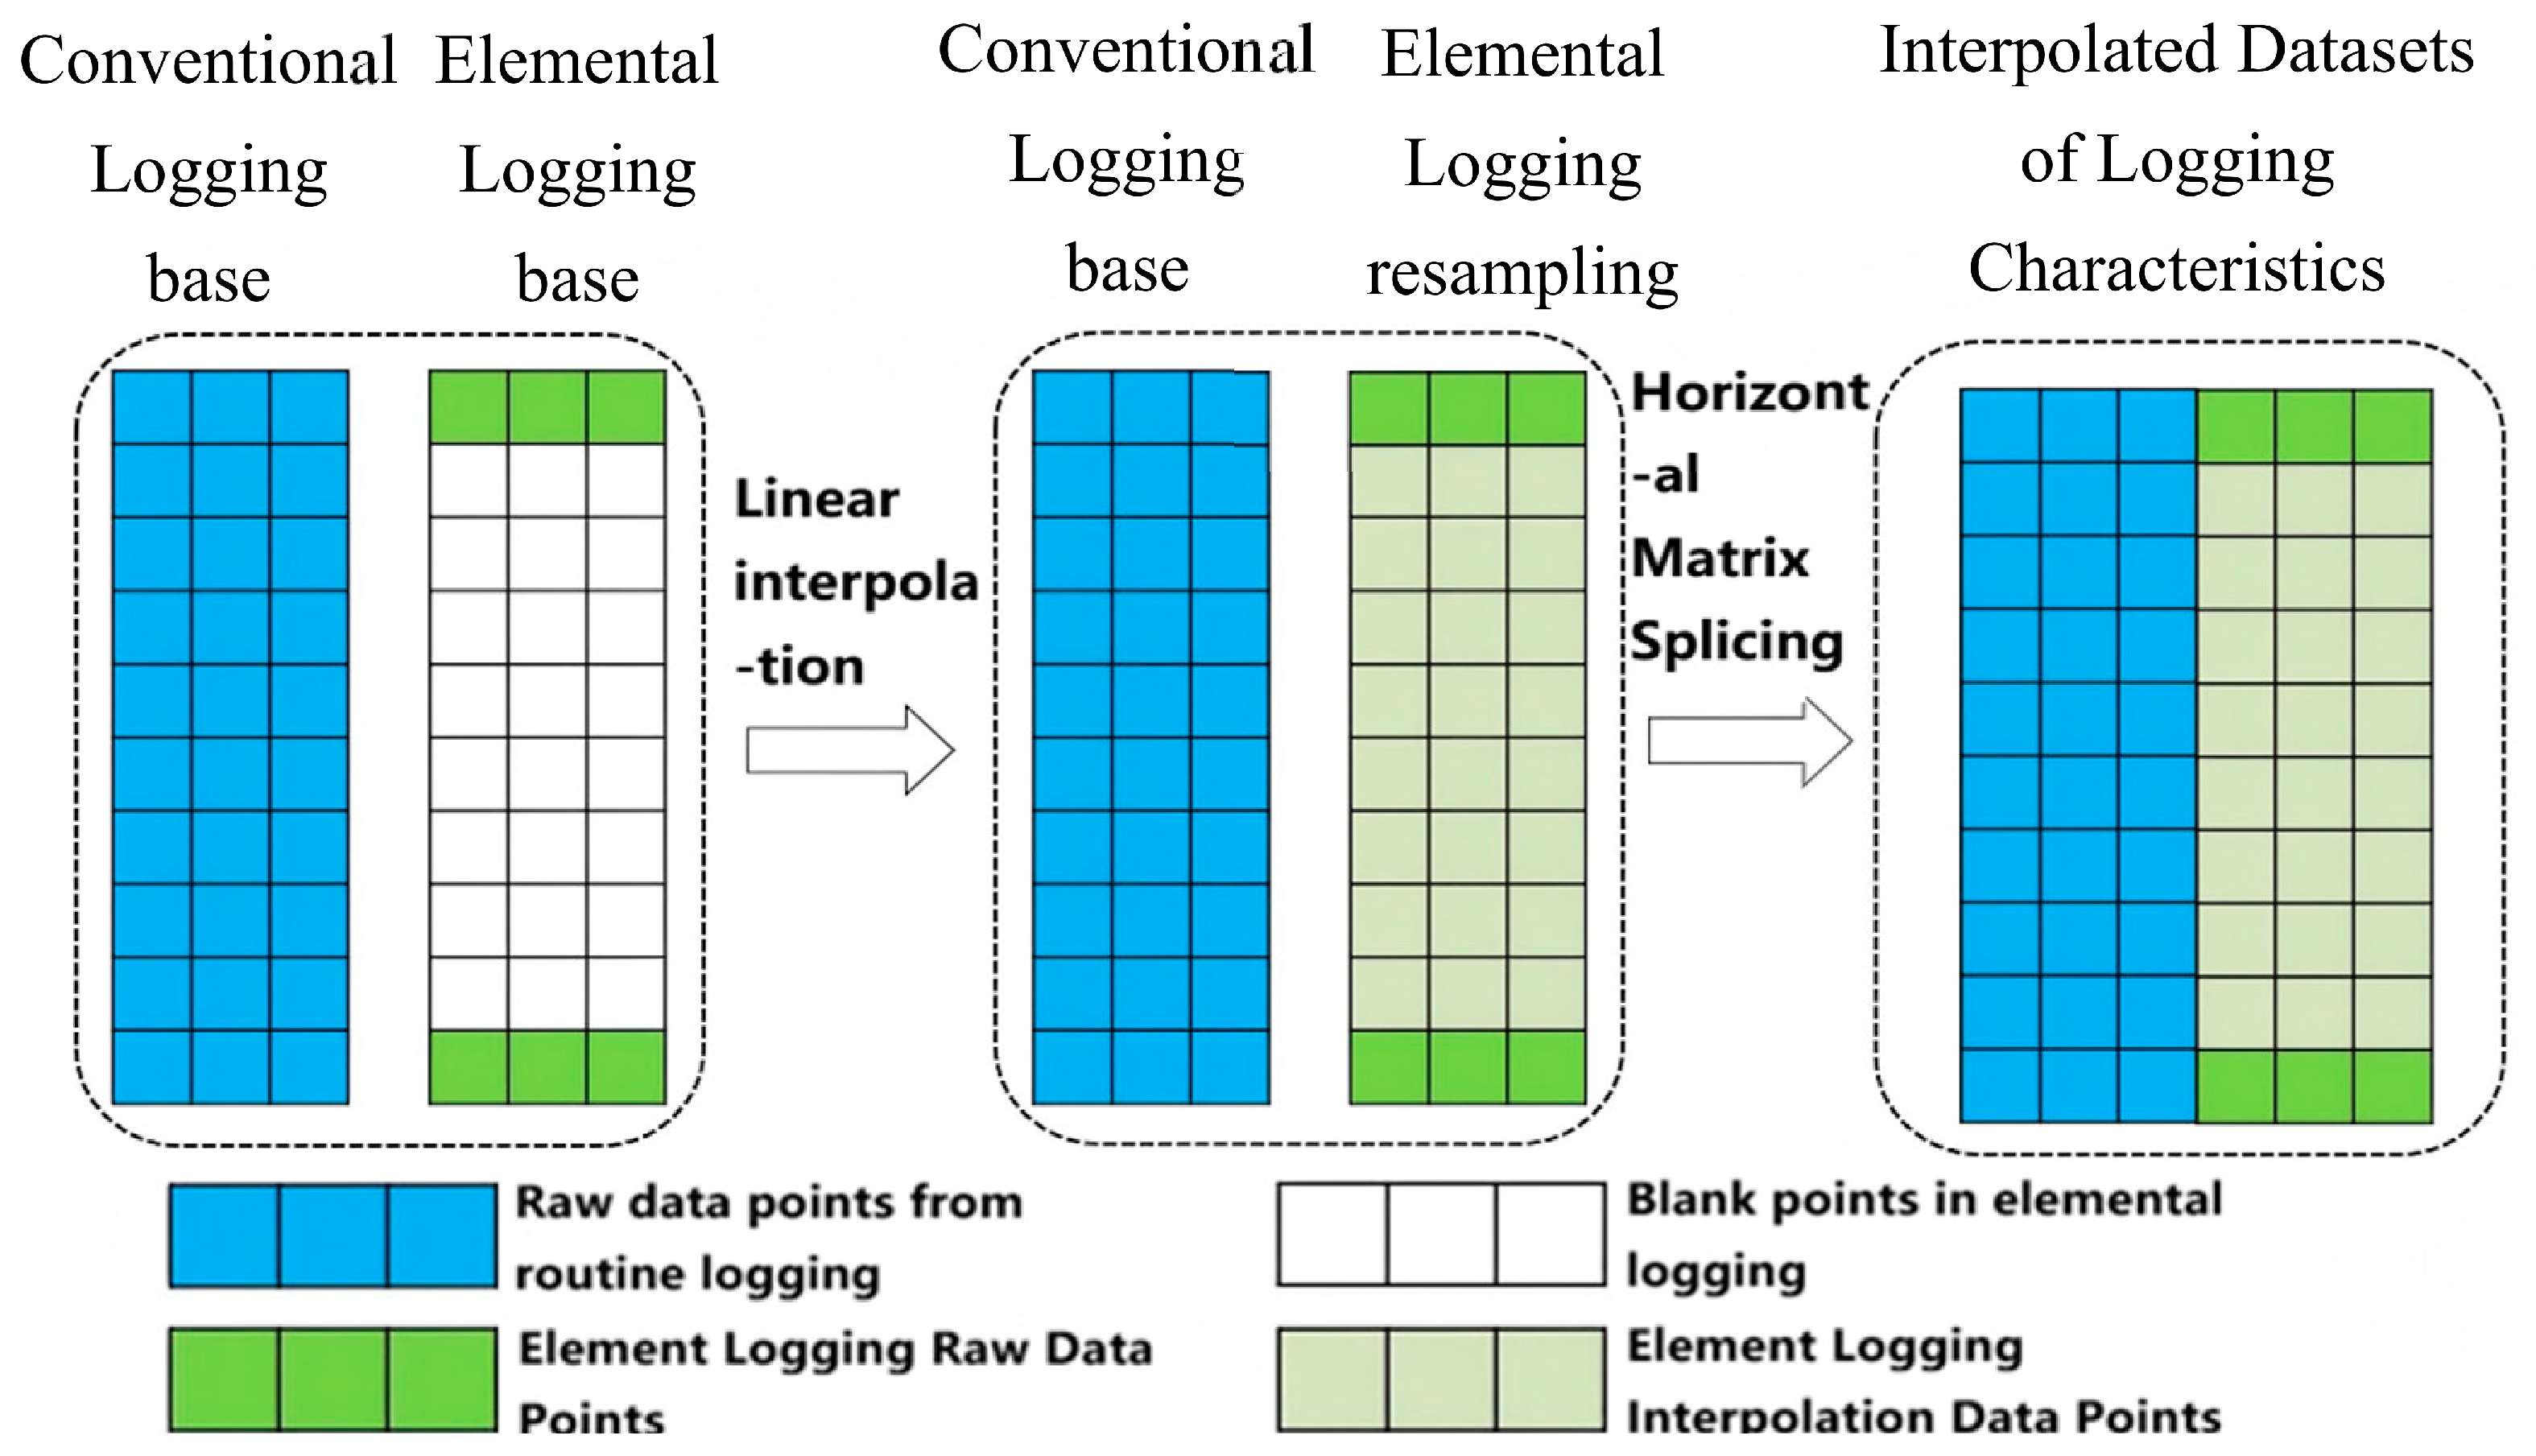
Conventional logging provides continuous depth sampling (0.125 m depth increment in this study), while elemental-logging data are sparsely sampled at coarser depth intervals. We adopt piecewise linear interpolation: elemental-log values are linearly resampled onto the uniform depth grid of conventional logs. Interpolation is constrained within adjacent real measured elemental-log depth-nodes; extrapolation beyond measured elemental-data segments is forbidden to avoid fictitious geochemical values. Depth-matching criterion: all model-input samples strictly share identical depth sampling increments after interpolation (0.125 m). This procedure produces depth-synchronized multi-source feature matrices and resolves depth-offset and data-discontinuity problems (Figure 9) [33,34,35].
Mutual-Information-Based Non-Linear Feature Selection
Mutual information quantifies statistical dependence between input features and lithology labels, capturing non-linear relationships that Pearson correlation cannot reflect [36,37]. Features with high mutual-information scores are retained; low-score redundant features are discarded to lower model complexity and computational overhead. Mutual-information formula:
I ( x , y ) = ∑ x ∈ X ∑ y ∈ Y p ( x , y ) log P ( x , y ) P ( x ) P ( y )
where p(x,y) = joint probability distribution for feature X and lithology label Y; p(x) and p(y) denote marginal probability distributions [38].
SMOTE Oversampling for Imbalanced-Sample Correction
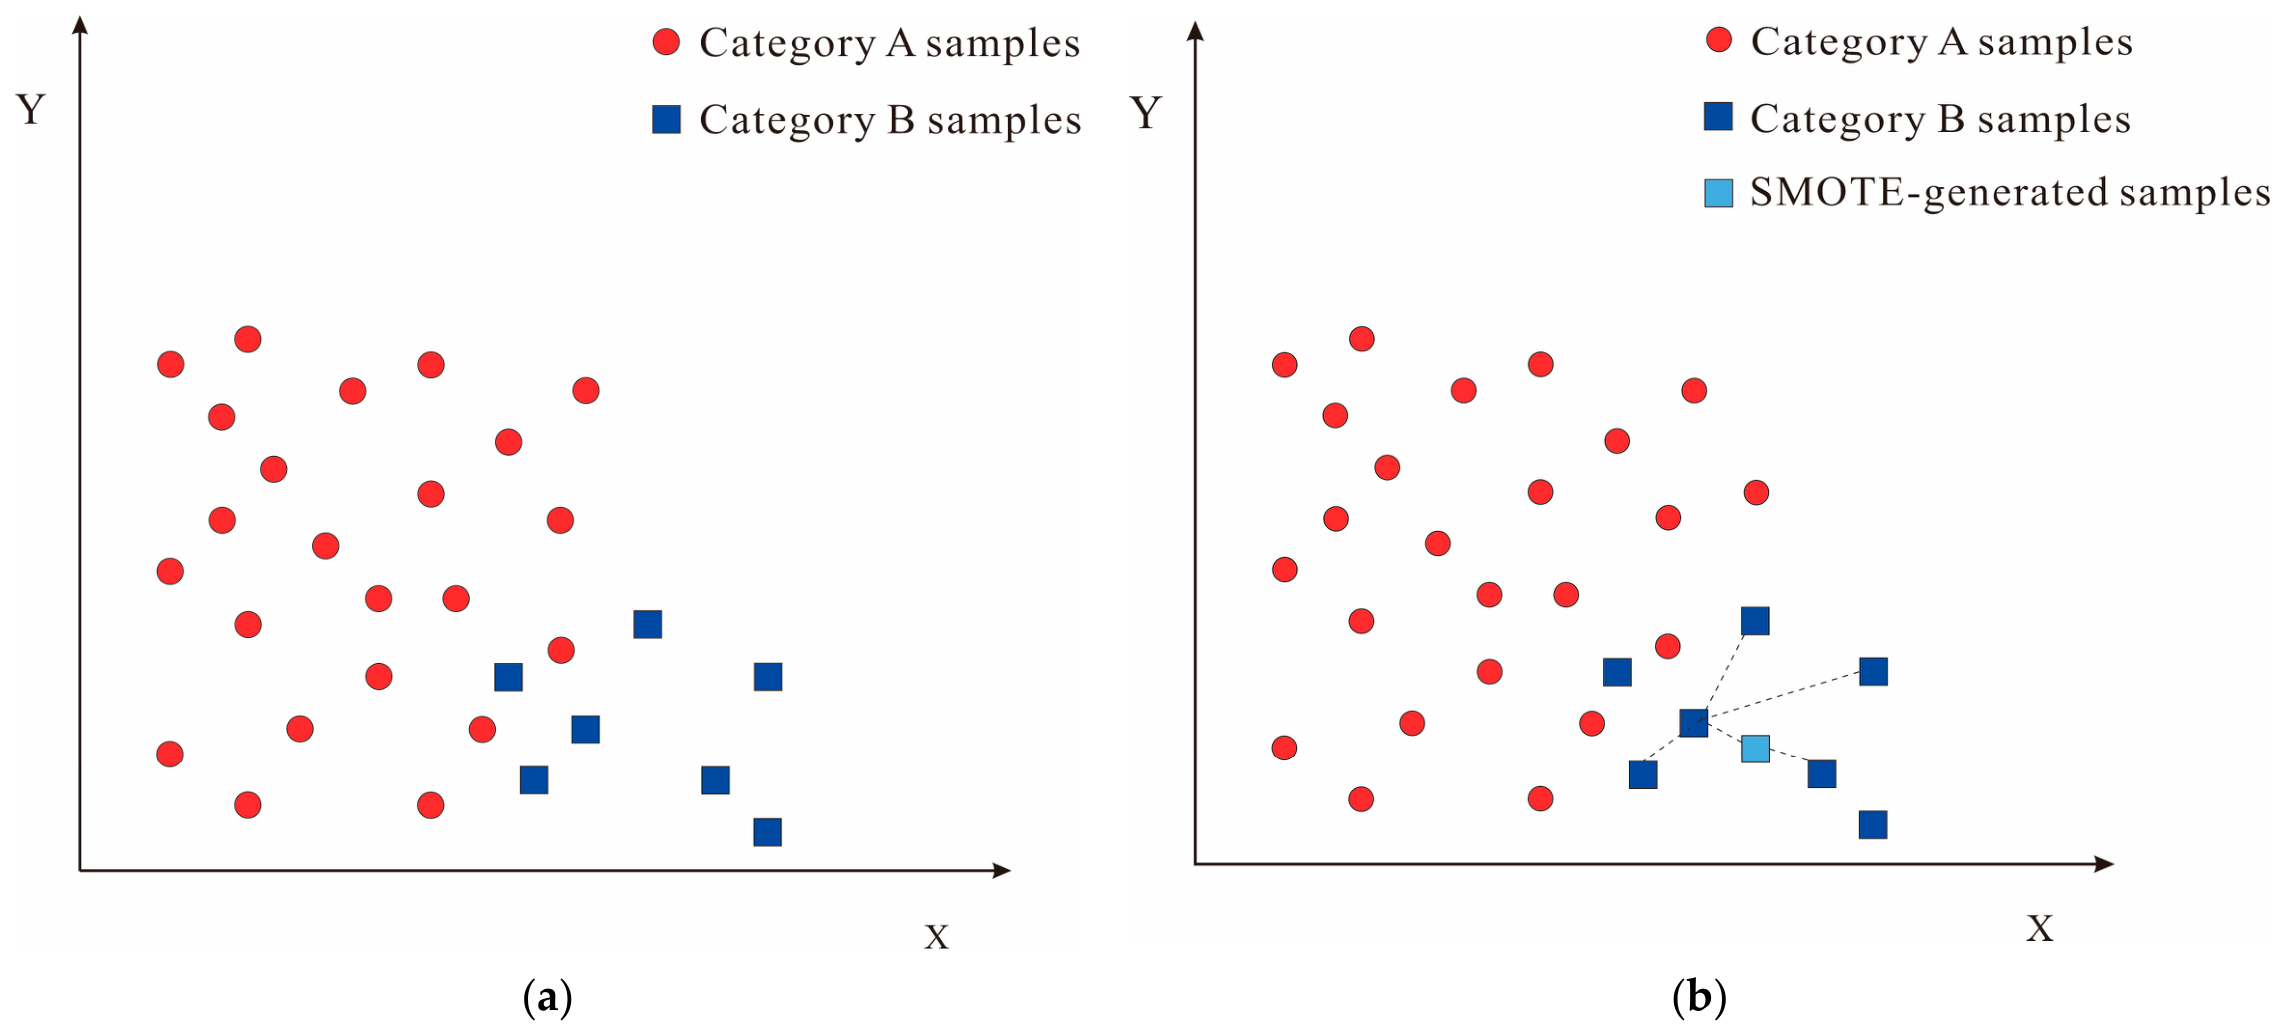
Volcanic-lithology datasets show class imbalance: some lithologies (minority classes) possess far fewer core-calibrated samples than dominant rock types. We adopt the SMOTE synthetic-minority oversampling technique to alleviate imbalance. Implementation parameters: nearest-neighbor number k = 5; minority classes are defined according to sample-count histograms of core-calibrated lithology labels. Synthetic samples are generated in feature-space between existing real minority-class neighbors rather than simple sample duplication, mitigating over-fitting risk (Figure 10). Only the training dataset is SMOTE-augmented; the held-out test dataset keeps original real-sample distributions without synthetic-sample injection for unbiased performance evaluation.
Random-Forest Ensemble Classification and Hyper-Parameter Tuning
The SMOTE-balanced training dataset with screened features is fed into the random-forest classifier. Key hyper-parameters (number of decision trees, maximum tree depth, maximum feature fraction per split) are optimized by 5-fold cross-validation on the training set. After hyper-parameter optimization, the final trained model predicts lithology labels for the independent test dataset. Model performance is assessed using overall accuracy, per-class recall, and confusion-matrix analysis(Figure 11).

3.3.3. Feature-Selection Results

Nine conventional-logging parameters and sixteen elemental-logging parameters are evaluated by mutual-information metrics (Table 3 and Table 4). After ranking mutual-information scores and removing low-contribution redundant variables, twelve optimal input features are retained: ΔCAL, GR, SP, RD, DT, CNL, Na, Si, P, S, Fe, Zr.

4. Results and Discussion

4.1. Model-Performance Evaluation and Error Analysis

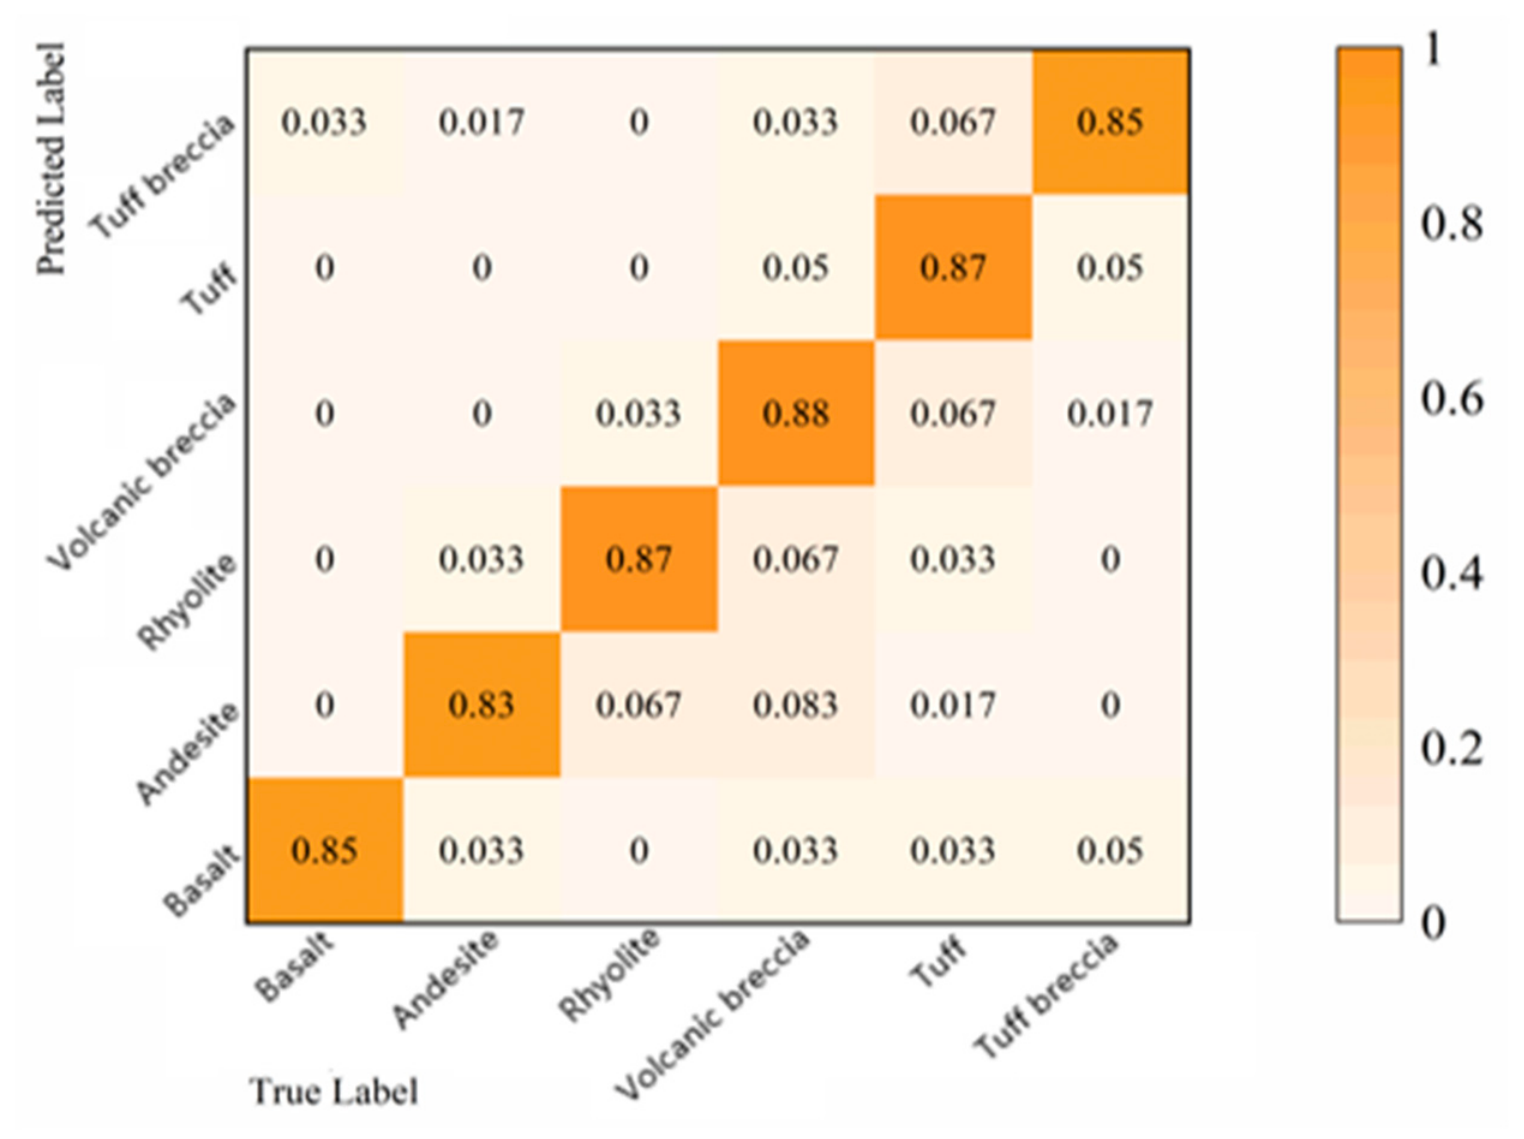
Original core-calibrated lithology samples are partitioned into the training set (80%) and held-out test set (20%). The training set is processed by piecewise linear interpolation, mutual-information feature filtering and SMOTE oversampling (k = 5). Hyper-parameters for RF are optimized via five-fold cross-validation. Confusion-matrix statistics from test-set prediction (Figure 12) yield overall lithology-identification accuracy = 87% and average per-class recall = 85.9%. The Main-diagonal entries in the confusion matrix correspond to recall for each lithological class.
Detailed error analysis reveals that most misclassifications occur within lithological pairs with transitional geochemical-mineralogical signatures:
Confusion between volcanic breccia and andesite is greatly suppressed compared with traditional cross-plots, yet still represents the dominant residual error source, because volcanic breccia clasts can be composed of andesite fragments, creating overlapping log-geochemical fingerprints;
Minor misclassification exists between tuff and volcanic breccia, related to gradual transitions between tuff and breccia textures in volcaniclastic successions.
No statistical significance test (confidence interval computation) is performed here because lithology labels are discrete categorical rock-class assignments derived from core-thin-section observation rather than continuous numerical measurements. Error sources are mainly geological (intrinsic lithological transition, alteration, fracture-related log perturbation) rather than random sampling error.

4.2. Single-Well Application (Well KL16-1)

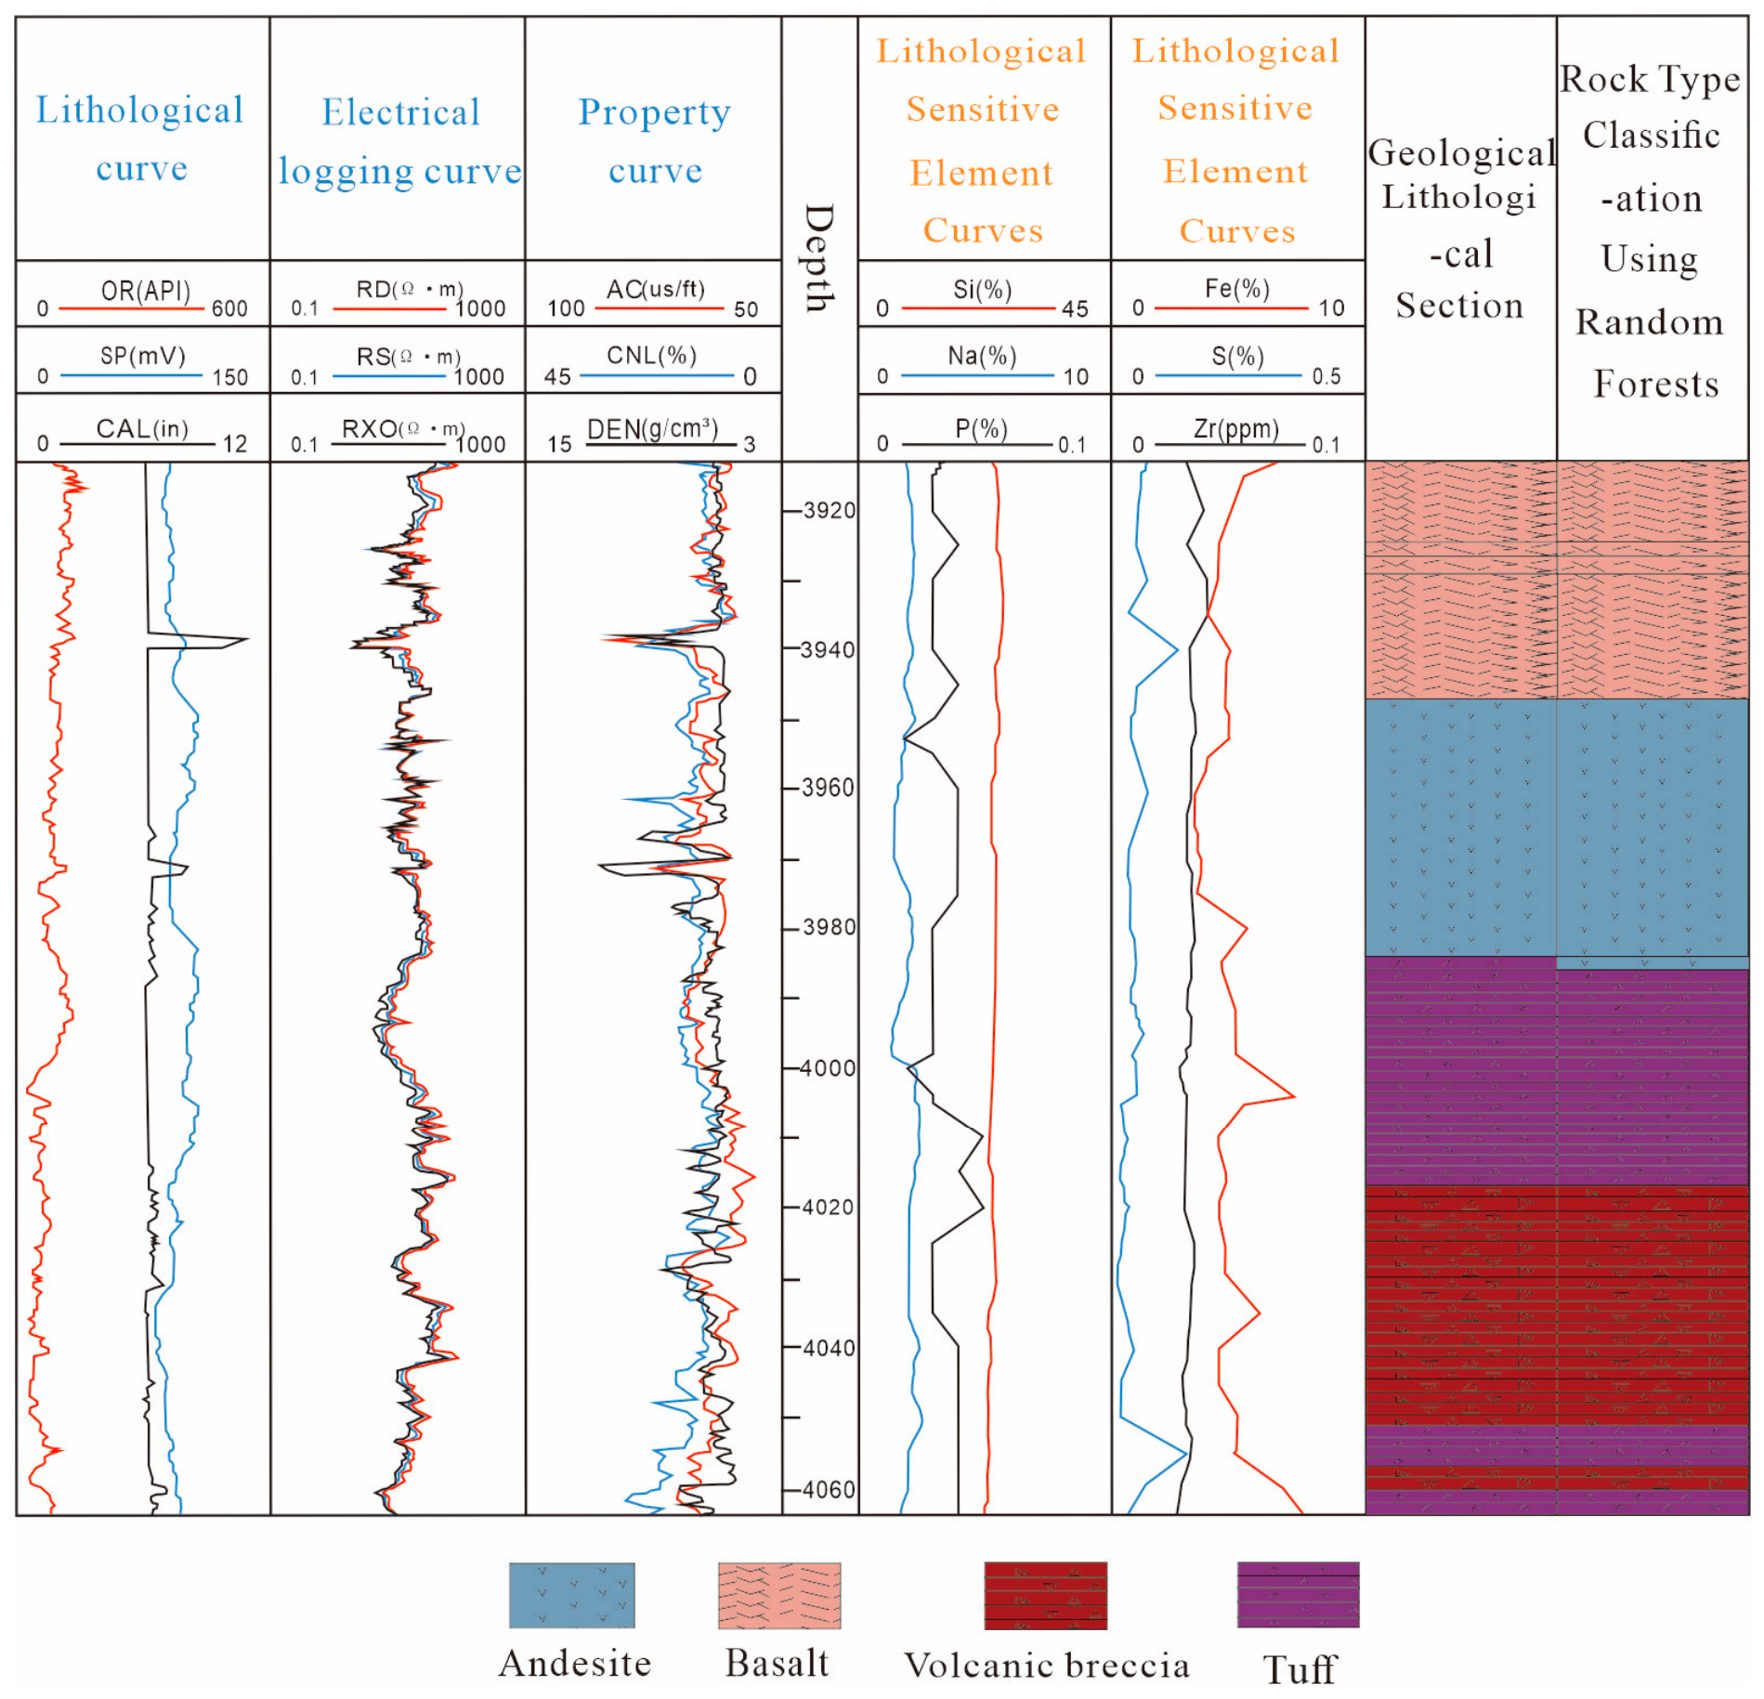
Well KL16-1 penetrates Mesozoic volcanic buried-hill reservoirs dominated by volcanic breccia, tuff and andesite with strong reservoir heterogeneity. Sensitive parameters including GR, DT, ΔCAL, Si, Fe, P are extracted for model construction. Our full improved-RF workflow (depth-interpolation fusion, feature-screening, SMOTE balancing, ensemble classification) is validated on this well. Predicted lithology profiles achieve an 85.9% average agreement rate against core-thin-section interpretation (Figure 13). Thin interbedded volcanic-rock intervals, which are hard to resolve using empirical charts, are reasonably identified. This single-well case confirms that the multi-source-fusion improved-RF workflow possesses good reliability for offshore Bohai volcanic buried hill lithology interpretation and can support reservoir-evaluation and exploration-deployment decision-making for Block KL16-1.

4.3. Method-Comparison, Geological Interpretation and Limitations

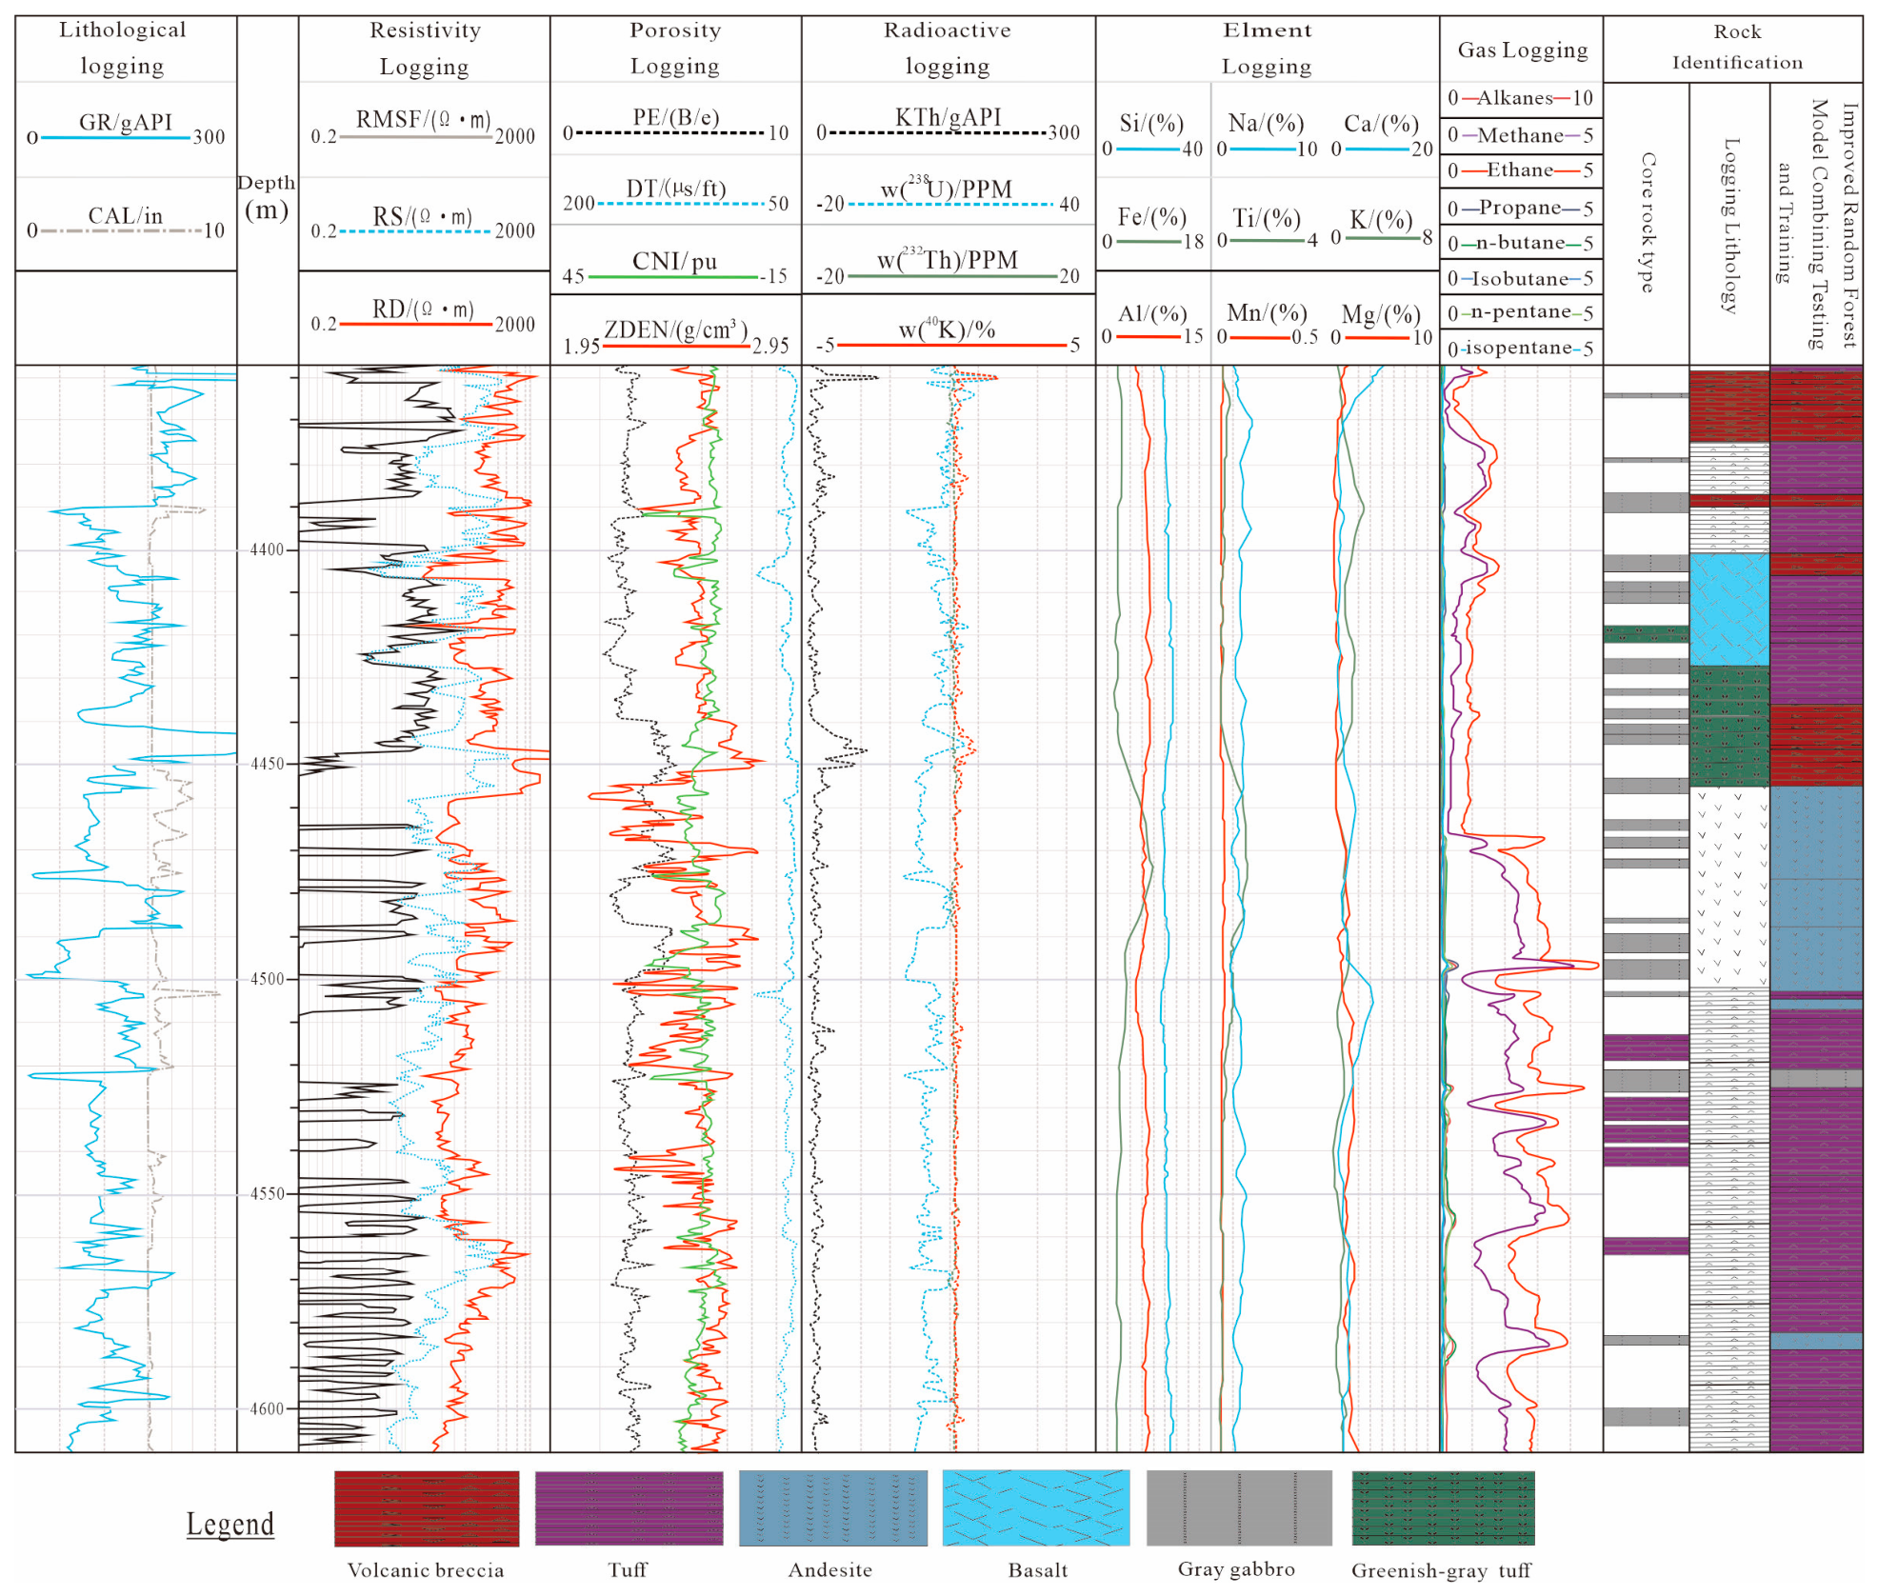
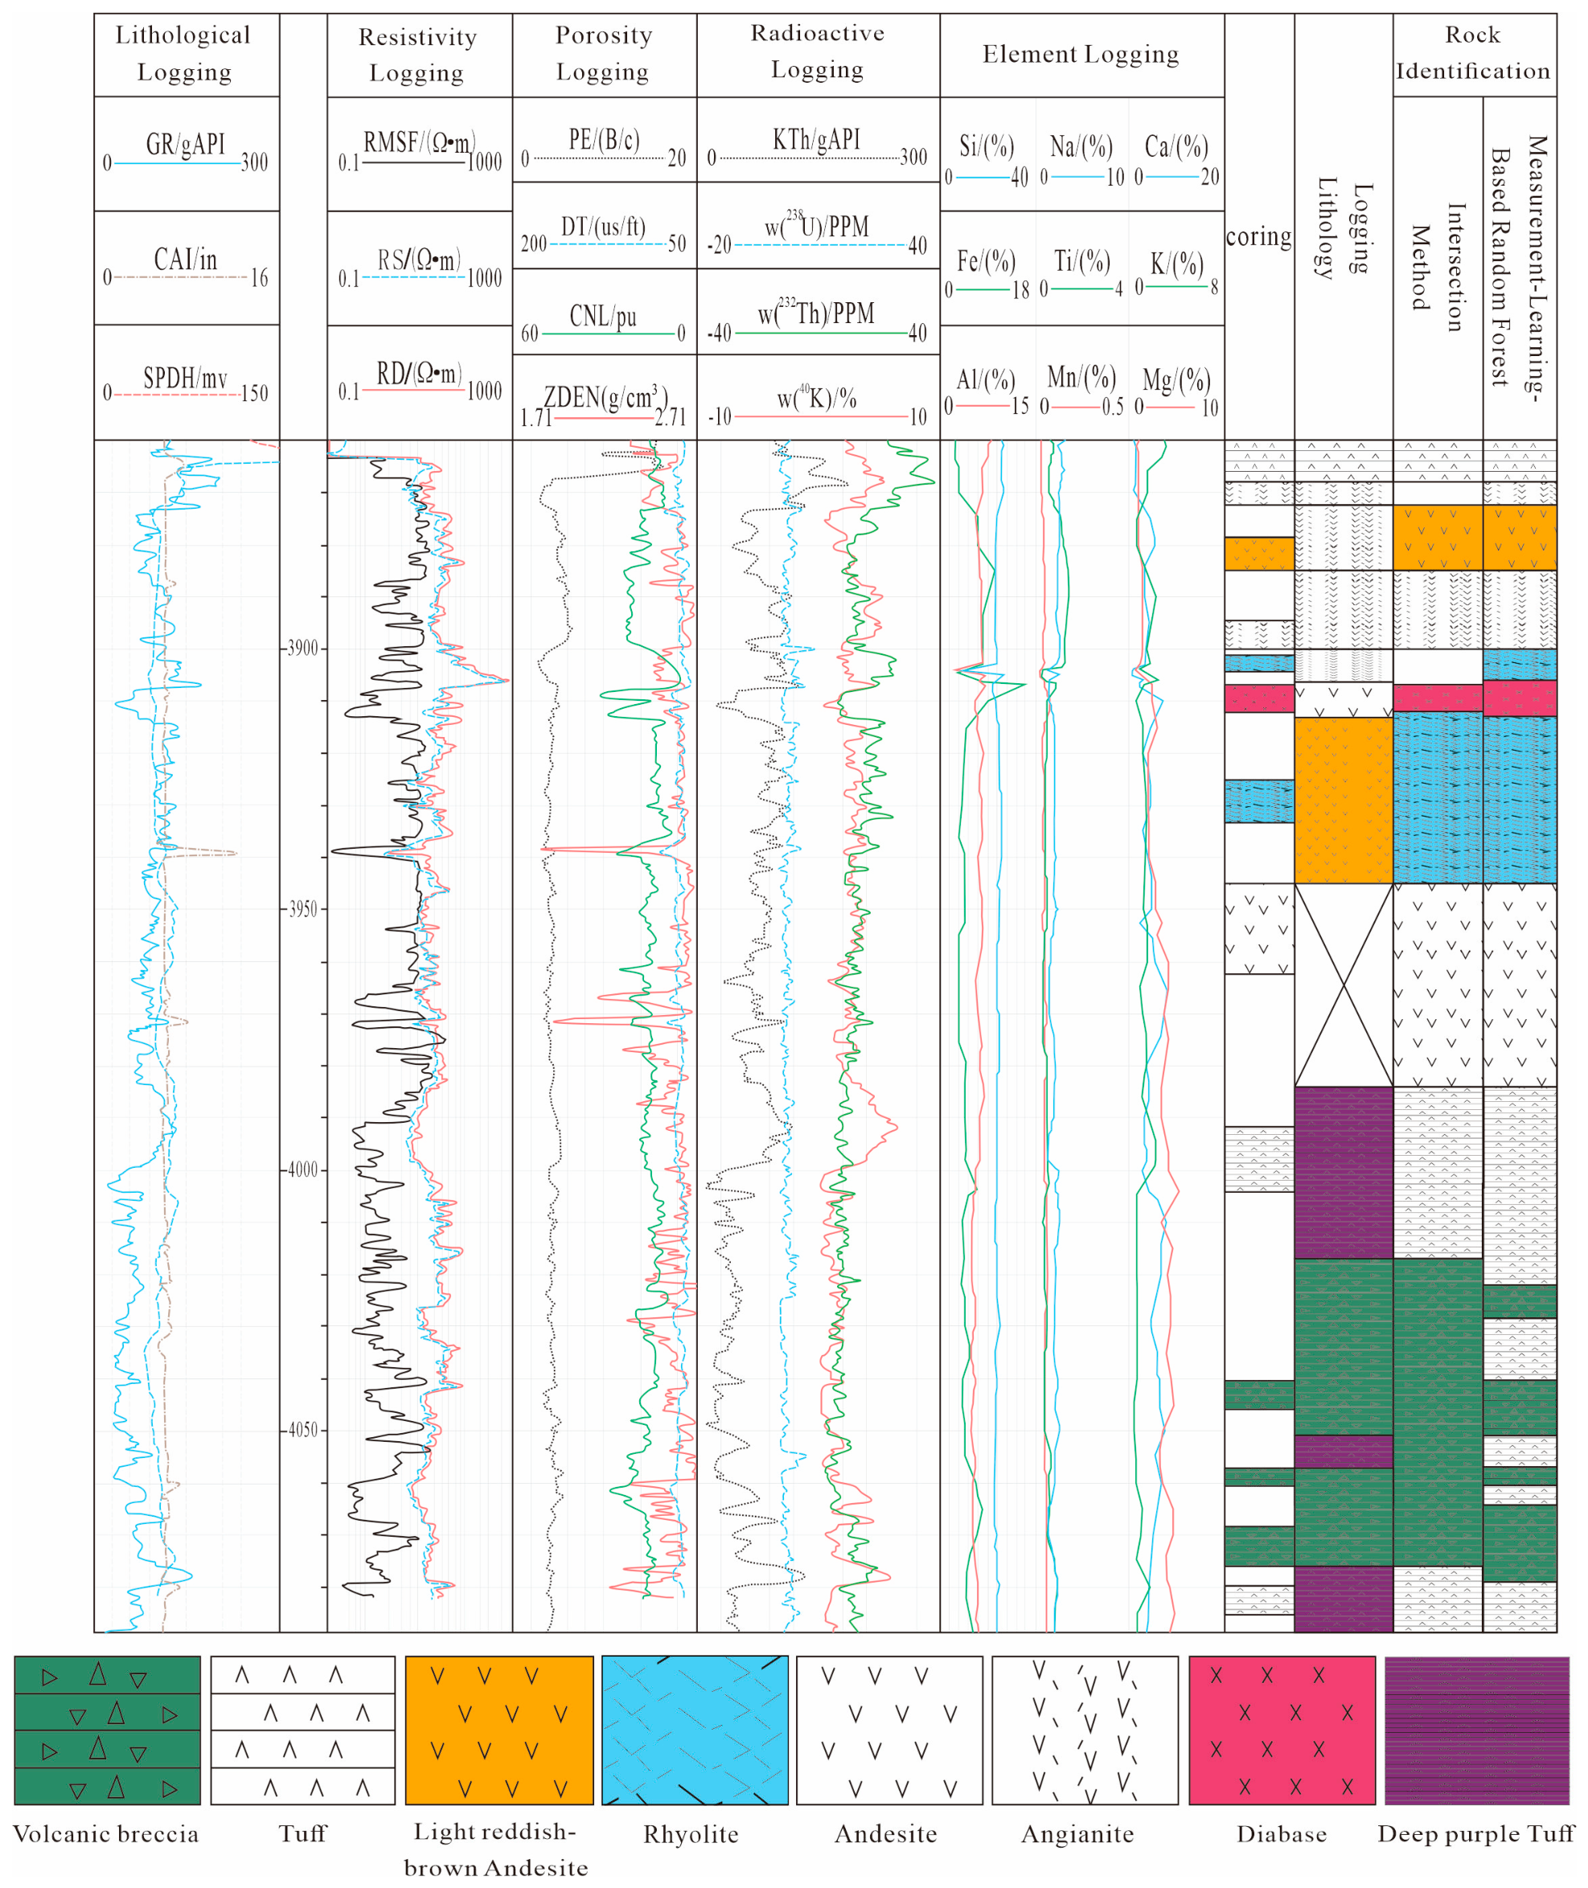
We compare our improved-RF workflow against traditional cross-plot approaches and vanilla-RF (without interpolation-feature-selection-SMOTE pre-processing) (Figure 14 and Figure 15). Key observations are summarized below:
  • Compared with traditional two-dimensional cross-plot charts, our multi-source-fusion workflow improves overall identification accuracy by 6–15%. Model-predicted lithology columns show better alignment with core observations;
  • Depth-aligned interpolation mitigates the adverse influence of elemental-logging sparse sampling; SMOTE oversampling alleviates classification bias against minority lithological classes; mutual-information filtering removes redundant log dimensions and suppresses model over-fitting risk;
  • Lithological boundaries between easily confused rock-types (volcanic breccia-andesite) become much sharper, and misclassification rates drop obviously.
Geologically, the good performance of this workflow arises because it jointly exploits conventional logs (reflecting physical properties: density, radioactivity, porosity, resistivity) and elemental logging (recording chemical-mineral composition fingerprints). The combined multi-dimensional feature space can better capture subtle differences between transition-prone volcanic lithologies that cannot be separated within two-dimensional empirical-chart space.
This workflow still bears several limitations:
  • Identification quality heavily depends on core-calibrated label quantity and quality; performance will degrade if core-calibrated training samples are scarce;
  • Piecewise linear interpolation can introduce artefacts for intervals with intense abrupt lithological changes between elemental-log measuring-points;
  • The current model is trained using datasets from the KL16-1 block; direct migration to other volcanic-reservoir blocks requires partial re-training using local core-calibrated samples, because volcanic-rock geochemical-logging signatures are region-dependent.
For future work, comparisons with other classical machine-learning algorithms (SVM, artificial neural networks) on identical input datasets should be conducted to further benchmark algorithm performance for volcanic-lithology classification tasks.

5. Conclusions

(1) Six dominant lithologies are identified in the Mesozoic buried-hill reservoir of Block KL16-1 (Laizhou Bay Sag): basalt, andesite, rhyolite, volcanic breccia, tuff, and tuffaceous conglomerate. Although each lithology exhibits characteristic conventional-log and elemental-log responses, widespread geophysical-response overlap restricts classification accuracy of traditional empirical cross-plot workflows. Core-measured SiO2 statistics with standard-deviation estimates for each major lithology are provided for this study area.
(2) This study constructs an improved random forest lithology-identification workflow integrating depth-aligned piecewise-linear interpolation for multi-source-log matching, mutual-information-based non-linear feature selection, and SMOTE oversampling for class-imbalance mitigation. Improvements are concentrated in multi-source-data pre-processing rather than modifying internal random-forest tree-splitting rules. The workflow overcomes the limitations of single-source-log interpretation and sample imbalance, enhancing classification accuracy and stability for complex volcanic-rock sequences.
(3) On held-out test datasets, the proposed improved-RF workflow achieves lithology-identification accuracy of 87% and average recall of 85.9%. It effectively discriminates easily-confused lithological pairs such as volcanic breccia and andesite. Error analysis indicates residual misclassification is primarily controlled by intrinsic geological lithological transitions and alteration effects. Single-well application demonstrates good practical reliability for local offshore volcanic-buried-hill interpretation.
(4) This reproducible technical workflow can be adapted for Mesozoic volcanic buried-hill reservoir evaluation across the Bohai offshore area and for analogous volcanic-petroleum plays globally. For other researchers studying volcanic reservoirs, this paper supplies a complete reference paradigm: (i) a multi-source-log depth-alignment interpolation strategy for mismatched logging datasets; (ii) information-theoretic feature-screening to reduce input-dimension redundancy; (iii) imbalance-correction pre-processing before ensemble-model training; and (iv) confusion-matrix-based geological-error analysis instead of only reporting aggregate accuracy metrics. Future investigations should compare multiple machine-learning classifiers and test cross-block transfer-learning potential for volcanic-lithology intelligent identification.

Author Contributions

Methodology, Y.H., J.G. and P.S.; verification, J.G. and P.S.; resources, Y.H.; Writing original draft preparation, J.G. and P.S.; writing—review and editing, J.G. and P.S. All authors have read and agreed to the published version of the manuscript.

Funding

This research received no external funding.

Institutional Review Board Statement

Not applicable.

Informed Consent Statement

Not applicable.

Data Availability Statement

The raw data supporting the conclusions of this article will be made available by the authors.

Conflicts of Interest

The authors declare no conflicts of interest.

References

  1. Zou, C.; Zhu, R.; Chen, Z.-Q.; Ogg, J.G.; Wu, S.; Dong, D.; Qiu, Z.; Wang, Y.; Wang, L.; Lin, S.; et al. Organic-Matter-Rich Shales of China. Earth-Sci. Rev. 2019, 189, 51–78. [Google Scholar] [CrossRef] [Scilit]
  2. Hill, D.G. Geologic Log Analysis Using Computer Methods. Geochim. Cosmochim. Acta 1995, 59, 1030–1031. [Google Scholar] [CrossRef] [Scilit]
  3. Hertzog, R.; Colson, L.; Seeman, B.; O’Brien, M.; Scott, H.; McKeon, D.; Wraight, P.; Grau, J.; Ellis, D.; Schweitzer, J.; et al. Geochemical Logging With Spectrometry Tools. SPE Form. Eval. 1989, 4, 153–162. [Google Scholar] [CrossRef] [Scilit]
  4. Herron, M. Mineralogy from Geochemical Well Logging. Clays Clay Miner. 1986, 34, 204–213. [Google Scholar] [CrossRef] [Scilit]
  5. Liu, J.; Liu, S.; Zhang, F.; Miao, B.; Yuan, C.; Su, B. A Method for Improving the Evaluation of Elemental Concentrations Measured by Geochemical Well Logging. J. Radioanal. Nucl. Chem. 2018, 317, 1113–1121. [Google Scholar] [CrossRef] [Scilit]
  6. Busch, J.M.; Fortney, W.G.; Berry, L.N. Determination of Lithology From Well Logs by Statistical Analysis. SPE Form. Eval. 1987, 2, 412–418. [Google Scholar] [CrossRef] [Scilit]
  7. Breiman, L. Random Forests. Mach. Learn. 2001, 45, 5–32. [Google Scholar] [CrossRef] [Scilit]
  8. Liu, J.Y.; Wang, Q.H.; Feng, J.; Guan, Y.; Liu, J.; Song, W.; Zhao, P.; Wang, X.N. Comprehensive lithology identification method for complex reservoir of buried hill based on wireline and cutting logs: A case study of Huizhou 26-6 structure in the Pearl River Mouth Basi. J. Yangtze Univ. Nat. Sci. Ed. 2025, 22, 18–27. [Google Scholar] [CrossRef]
  9. Liu, J.; Min, X.; Qi, Z.; Yi, J.; Zhou, W. Lithology Identification Using Electrical Imaging Logging Image: A Case Study in Jiyang Depression, China. J. Appl. Geophys. 2024, 230, 105536. [Google Scholar] [CrossRef] [Scilit]
  10. Soulaimani, S.; Soulaimani, A.; Abdelrahman, K.; Miftah, A.; Fnais, M.S.; Mondal, B.K. Advanced Machine Learning Artificial Neural Network Classifier for Lithology Identification Using Bayesian Optimization. Front. Earth Sci. 2024, 12, 1473325, Correction in Front. Earth Sci. 2025, 12, 1544327. [Google Scholar] [CrossRef] [Scilit]
  11. Ji, J.F.; Yuan, S.B.; Yang, Y.; Liu, C.Z. Application of Fisher Discriminant Method Based on XRF Technology in Volcanic Lithology Identification. China Pet. Chem. Stand. Qual. 2019, 39, 240–241. [Google Scholar]
  12. Cortes, C.; Vapnik, V. Support-Vector Networks. Mach. Learn. 1995, 20, 273–297. [Google Scholar] [CrossRef] [Scilit]
  13. Chawla, N.V.; Bowyer, K.W.; Hall, L.O.; Kegelmeyer, W.P. SMOTE: Synthetic Minority over-Sampling Technique. J. Artif. Intell. Res. 2002, 16, 321–357. [Google Scholar] [CrossRef] [Scilit]
  14. Shi, W.L. Study on Sedimentary Facies of Sangonghe Formation in Moxizhuang Area of the Junggar Basin. Master’s Thesis, China University of Petroleum (East China), Qingdao, China, 2026. [Google Scholar]
  15. Feng, C.; Wang, Q.B.; Tan, Z.J.; Dai, L.M.; Liu, X.J.; Zhao, M. Logging Classification and Identification of Complex Lithologies in Volcanic Debris-Rich Formations: An Example of KL16 Oilfield. Acta Pet. Sin. 2019, 40, 91. [Google Scholar]
  16. Huang, A.; Cai, W.Y.; Wei, X.L.; Li, Y.; Duan, G.S.; Liu, D.R. Lithology identification of volcanic logging based on improved random forest. Sci. Technol. Eng. 2023, 23, 3696–3704. [Google Scholar]
  17. Huang, A. Log Evaluation of Buried-Hill Volcanic Reservoir Effectiveness in Bohai Sea Area: A Case Study of KL16-A Structure. Master’s Thesis, Yangtze University, Jingzhou, China, 2024. [Google Scholar]
  18. Pedregosa, F.; Varoquaux, G.; Gramfort, A.; Michel, V.; Thirion, B.; Grisel, O.; Blondel, M.; Prettenhofer, P.; Weiss, R.; Dubourg, V.; et al. Scikit-Learn: Machine Learning in Python. J. Mach. Learn. Res. 2011, 12, 2825–2830. [Google Scholar]
  19. Le Bas, M.J.; Le Maitre, R.W.; Streckeisen, A.; Zanettin, B.; IUGS Subcommission on the Systematics of Igneous Rocks. A chemical classification of volcanic rocks based on the total alkali-silica diagram. J. Petrol. 1986, 27, 745–750. [Google Scholar]
  20. Tang, H.F.; Wang, P.J.; Bian, W.H.; Huang, Y.L.; Gao, Y.F.; Dai, X.J. Review of Volcanic Reservoir Geology. Acta Pet. Sin. 2020, 41, 1744–1773. [Google Scholar]
  21. Ho, T.K. The Random Subspace Method for Constructing Decision Forests. IEEE Trans. Pattern Anal. Mach. Intell. 1998, 20, 832–844. [Google Scholar] [CrossRef] [Scilit]
  22. Duan, Y.; Xie, J.; Su, Y.; Liang, H.; Hu, X.; Wang, Q.; Pan, Z. Application of the Decision Tree Method to Lithology Identification of Volcanic Rocks-Taking the Mesozoic in the Laizhouwan Sag as an Example. Sci. Rep. 2020, 10, 19209. [Google Scholar] [CrossRef] [Scilit] [PubMed]
  23. Ren, X.; Hou, J.; Song, S.; Liu, Y.; Chen, D.; Wang, X.; Dou, L. Lithology Identification Using Well Logs: A Method by Integrating Artificial Neural Networks and Sedimentary Patterns. J. Pet. Sci. Eng. 2019, 182, 106336. [Google Scholar] [CrossRef] [Scilit]
  24. Carvalho, H.M.O.; Daniel, H.; Korenchendler, A.; Sobreira, M.C.A.; Machado, A.M.C. Lithology Classification Based on Well Log Data: A Benchmark for Machine Learning Models. Math. Geosci. 2026. [Google Scholar] [CrossRef] [Scilit]
  25. Shang, Y.Z.; Zhang, Z.H.; Xu, D.N.; Zhao, W.W.; Chen, H.Y.; Han, H.B. Log-based lithology identification of volcanic rocks using random forest method: A case study of Carboniferous strata in the Dixi area, Junggar Basin. Geophys. Geochem. Explor. 2024, 48, 1025–1036. [Google Scholar]
  26. Mu, D. Study on Logging Lithology Identification Method for Intermediate-Basic Igneous Rocks in Liaohe Basin. Master’s Thesis, Jilin University, Changchun, China, 2015. [Google Scholar]
  27. Xie, Y.; Zhu, C.; Hu, R.; Zhu, Z. A Coarse-to-Fine Approach for Intelligent Logging Lithology Identification with Extremely Randomized Trees. Math. Geosci. 2021, 53, 859–876. [Google Scholar] [CrossRef] [Scilit]
  28. Breiman, L. Bagging Predictors. Mach. Learn. 1996, 24, 123–140. [Google Scholar] [CrossRef] [Scilit]
  29. Peng, H.; Long, F.; Ding, C. Feature Selection Based on Mutual Information Criteria of Max-Dependency, Max-Relevance, and Min-Redundancy. IEEE Trans. Pattern Anal. Mach. Intell. 2005, 27, 1226–1238. [Google Scholar] [CrossRef] [Scilit] [PubMed]
  30. Han, H.; Wang, W.Y.; Mao, B.H. Borderline-SMOTE: A New over-Sampling Method in Imbalanced Data Sets Learning. In Advances in Intelligent Computing; Huang, D.S., Zhang, X.P., Huang, G.B., Eds.; Lecture Notes in Computer Science; Springer: Berlin, Germany, 2005; Volume 3644, pp. 878–887. [Google Scholar]
  31. Chen, T.; Guestrin, C. XGBoost: A Scalable Tree Boosting System. In Proceedings of the 22nd ACM SIGKDD International Conference on Knowledge Discovery and Data Mining; ACM: New York, NY, USA, 2016; pp. 785–794. [Google Scholar]
  32. Cracknell, M.J.; Reading, A.M. Geological Mapping Using Remote Sensing Data: A Comparison of Five Machine Learning Algorithms, Their Response to Variations in the Spatial Distribution of Training Data and the Use of Explicit Spatial Information. Comput. Geosci. 2014, 63, 22–33. [Google Scholar] [CrossRef] [Scilit]
  33. Probst, P.; Wright, M.N.; Boulesteix, A. Hyperparameters and Tuning Strategies for Random Forest. WIREs Data Min. Knowl. Discov. 2019, 9, e1301. [Google Scholar] [CrossRef] [Scilit]
  34. Friedman, J.H. Greedy Function Approximation: A Gradient Boosting Machine. Ann. Stat. 2001, 29, 1189–1232. [Google Scholar] [CrossRef] [Scilit]
  35. Sokolova, M.; Lapalme, G. A Systematic Analysis of Performance Measures for Classification Tasks. Inf. Process. Manag. 2009, 45, 427–437. [Google Scholar] [CrossRef] [Scilit]
  36. Ao, Y.; Zhu, L.; Guo, S.; Yang, Z. Probabilistic Logging Lithology Characterization with Random Forest Probability Estimation. Comput. Geosci. 2020, 144, 104556. [Google Scholar] [CrossRef] [Scilit]
  37. Vergara, J.R.; Estévez, P.A. A Review of Feature Selection Methods Based on Mutual Information. Neural Comput. Appl. 2014, 24, 175–186. [Google Scholar] [CrossRef] [Scilit]
  38. Edwards, S. Elements of Information Theory, Thomas M. Cover, Joy A. Thomas, 2nd ed., John Wiley & Sons, Inc. (2006). Inf. Process. Manag. 2008, 44, 400–401. [Google Scholar] [CrossRef]
Figure 1. Geological setting of the block. (a) Location of the Laizhou Bay Sag within Bohai Bay Basin. (b) Location of the study area (Block KL16-1).
Jmse 14 01802 g001
Figure 2. Stratigraphic section of Block KL16-1.
Jmse 14 01802 g002
Figure 3. Core-derived lithology proportion pie-chart for Block KL16-1.
Jmse 14 01802 g003
Figure 4. Elemental-log cross-plot plates. (a) Si-K; (b) Si-Fe; (c) K-Fe; (d) P-Fe.
Jmse 14 01802 g004
Figure 5. Conventional-log lithology-identification cross-plot (GR-DEN), Block KL16-1.
Jmse 14 01802 g005
Figure 6. Box-and-whisker plot for core-measured SiO2 mass fractions for major volcanic lithologies.
Jmse 14 01802 g006
Figure 7. TAS geochemical classification diagram for core samples, Block KL16-1.
Jmse 14 01802 g007
Figure 8. ECS-elemental-log lithology-identification cross-plot (GR-Si).
Jmse 14 01802 g008
Figure 9. Workflow flowchart for improved random-forest volcanic-lithology identification.
Jmse 14 01802 g009
Figure 10. Schematic diagram for piecewise linear interpolation depth alignment between conventional-logging and elemental-logging datasets.
Jmse 14 01802 g010
Figure 11. Schematic sketch illustrating the SMOTE oversampling principle: (a) original imbalanced sample distribution; (b) distribution after SMOTE synthetic-sample generation for minority class.
Jmse 14 01802 g011
Figure 12. Improved Random Forest Confusion Matrix for Interpolation of Well Log Features.
Jmse 14 01802 g012
Figure 13. Lithology-identification profile comparison for Well KL16-1, comparing predicted lithology against the geological core-derived lithological column.
Jmse 14 01802 g013
Figure 14. Multi-log composite plot comparing core-lithology, cross-plot interpretation and improved-RF predicted lithology for Well KL16-1.
Jmse 14 01802 g014
Figure 15. Detailed comparison of lithology-identification results: cross-plot method versus improved-random-forest prediction.
Jmse 14 01802 g015
Table 1. Lithology-identification thresholds for elemental-log cross-plots (Block KL16-1).
SiKFeP
Rhyolite>29.8>5//
Basalt<23/>6/
Granite>24.9<3.75//
Volcanic breccia//<2.7<0.1
Andesite//<2.5>0.1
Tuff//>2.5≥0.1
Table 2. Typical elemental-logging response intervals for Mesozoic buried-hill lithologies, Block KL16-1.
LithologyElement-Log Response RangesQuantitative ThresholdsSlices
Volcanic brecciaSi: 15.65~18.71
Al: 4.59~5.18
Fe: 1.81~2.87
Ca: 0.68~3.57
Na: 0.089~0.102
K: 2.68~3.28
Mg: 0.296~0.38
P < 0.094%Jmse 14 01802 i001
BasaltSi: 16.35~22.13
Al: 5.13~6.67
Fe: 6.6~13.00
Ca: 1.52~5.39
Na: 0.013~1.35
K: 1.17~2.64
Mg: 0.68~2.27
16.3% < Si < 22.2%

K < 2.65%

Fe > 6.4%
Jmse 14 01802 i002
AndesiteSi: 15.57~18.56
Al: 4.63~5.36
Fe: 2.15~3.66
Ca: 0.996~2.45
Na: 0.09~0.1
K: 2.64~3.61
Mg: 0.3~2.4
P > 0.094%

Fe < 2.84%
Jmse 14 01802 i003
RhyoliteSi: 29.83~30.37
Al: 5.54~6.45
Fe: 3.86~4.02
Ca: 0.36~1.12
Na: 0.44~1.2
K: 3.93~4.44
Mg: 0.35~0.47
Si > 29.8%

K > 3.72%

Fe < 6.4%
Jmse 14 01802 i004
TuffSi: 15.52~18.21
Al: 4.74~5.22
Fe: 2.13~3.82
Ca: 0.88~3.26
Na: 0.089~0.118
K: 2.51~3.51
Mg: 0.35~0.45
P > 0.094%

2.84% < Fe < 6.4%
Jmse 14 01802 i005
Table 3. Mutual information metric values Logging parameter table.
Conventional-Log ParametersMutual-Information IConventional-Log ParametersMutual-Information IConventional-Log ParametersMutual-Information I
ΔCAL19.790RD10.646DT28.803
GR29.820RS6.517CNL15.047
SP14.467RXO6.144DEN6.876
Table 4. Mutual-information metric values for elemental-logging parameters.
Element Log ParametersMutual-Information IElement Log ParametersMutual-Information I
Na24.907Ba0.639
Mg14.435Ti0.702
Al9.812Mn18.454
Si29.249Fe24.003
P75.581V1.521
S27.694Ni15.001
K4.227Sr1.848
Ca3.322Zr79.514
Disclaimer/Publisher’s Note: The statements, opinions and data contained in all publications are solely those of the individual author(s) and contributor(s) and not of MDPI and/or the editor(s). MDPI and/or the editor(s) disclaim responsibility for any injury to people or property resulting from any ideas, methods, instructions or products referred to in the content.