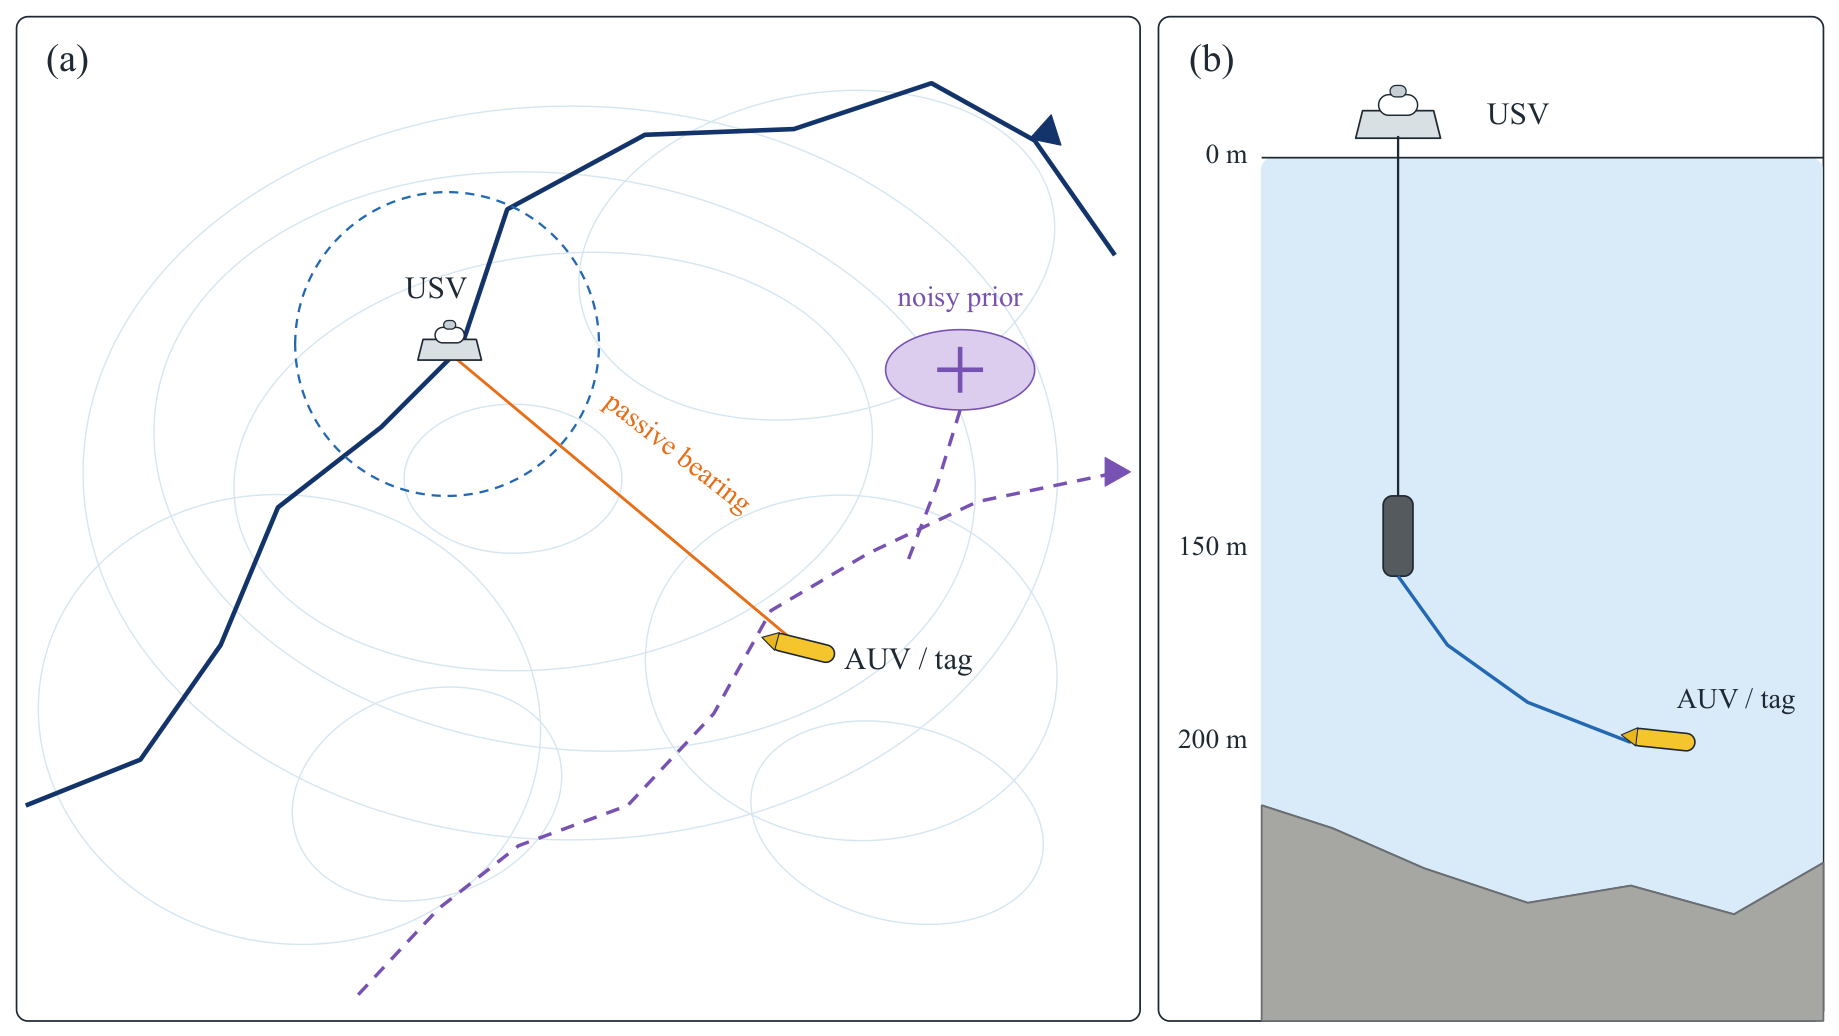
Figure 1.
Task geometry and sensor-depth interpretation (schematic, not to scale). (a) The deployed policy combines an intermittent noisy position prior with a passive bearing cue while selecting a USV route that changes the subsequent acoustic geometry. The prior marker is deliberately offset from the moving AUV/tag, and target truth remains inside the simulator. The dashed circle denotes finite modeled acoustic support rather than a measured footprint. (b) By acoustic reciprocity, the RAM lookup is interpreted as a 200 m AUV/tag source observed by an idealized hydrophone lowered to 150 m and horizontally co-located with the surface craft. The drawn paths are illustrative; tether dynamics, receiver-depth excursions, and explicit ray tracing are not modeled.
Figure 1.
Task geometry and sensor-depth interpretation (schematic, not to scale). (a) The deployed policy combines an intermittent noisy position prior with a passive bearing cue while selecting a USV route that changes the subsequent acoustic geometry. The prior marker is deliberately offset from the moving AUV/tag, and target truth remains inside the simulator. The dashed circle denotes finite modeled acoustic support rather than a measured footprint. (b) By acoustic reciprocity, the RAM lookup is interpreted as a 200 m AUV/tag source observed by an idealized hydrophone lowered to 150 m and horizontally co-located with the surface craft. The drawn paths are illustrative; tether dynamics, receiver-depth excursions, and explicit ray tracing are not modeled.
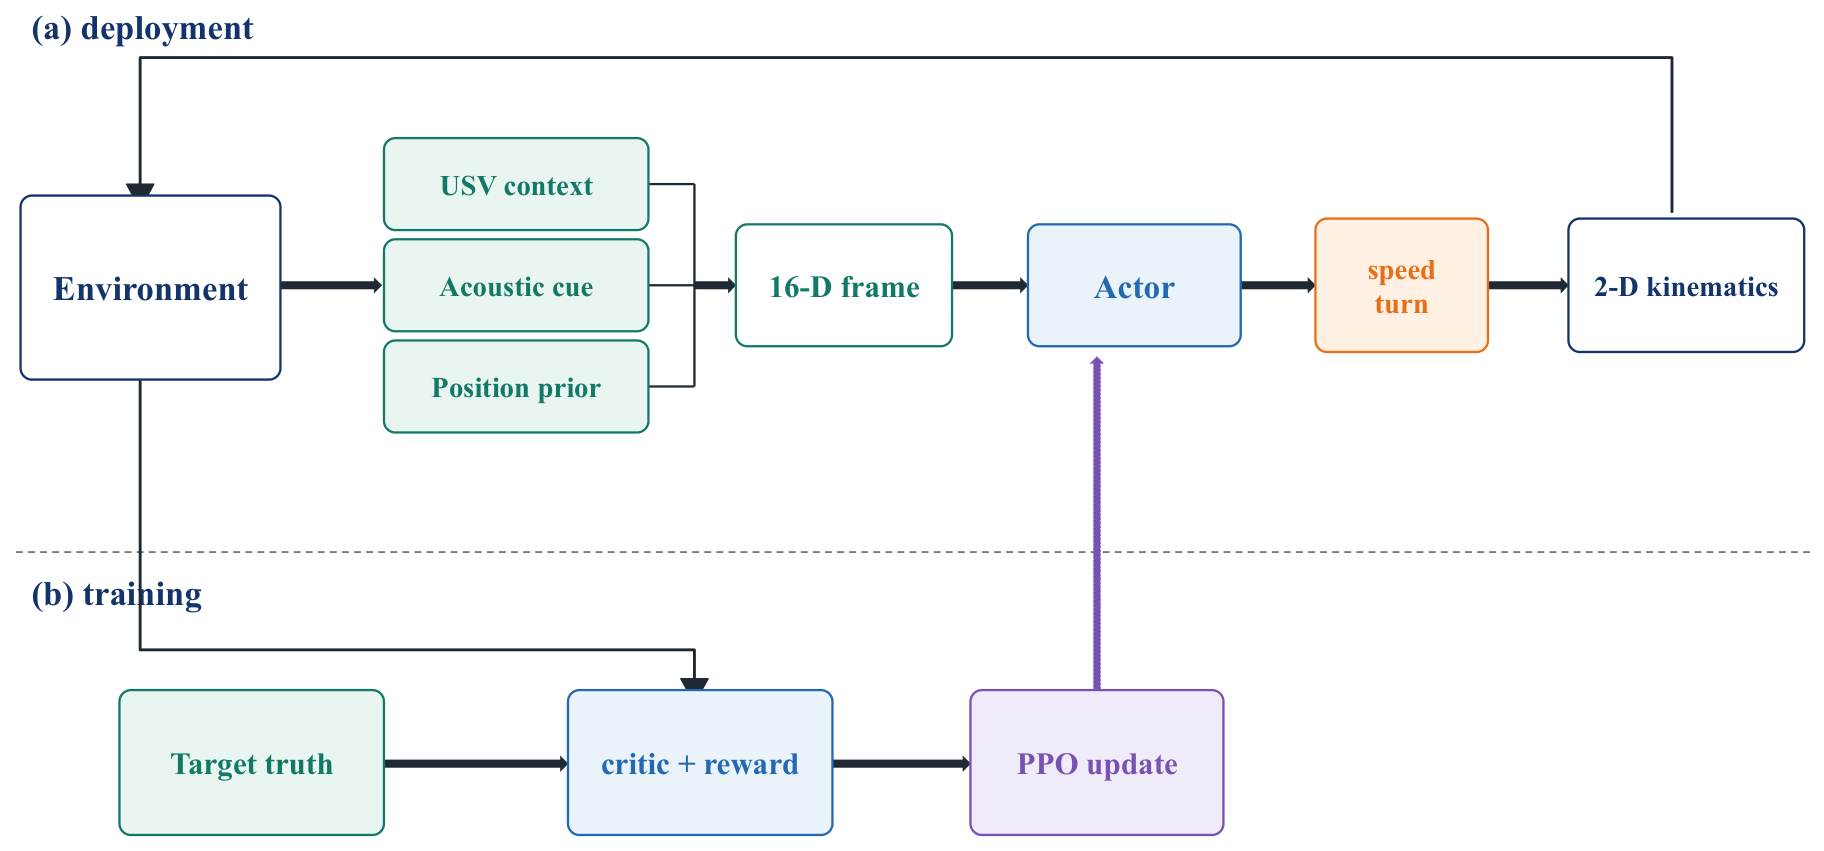
Figure 2.
Closed-loop information flow (schematic). The 16-dimensional observation contains one frame: six USV context features, five acoustic features, and five prior features. Solid arrows form the deployed feed-forward loop. Simulator truth enters the asymmetric state-value critic and reward only in the lower training lane; the dashed parameter-update path is absent at deployment. No recurrent hidden state is used. The actor-side deployment path and training-only privileged path are explicitly separated so that target truth cannot be mistaken for an actor input.
Figure 2.
Closed-loop information flow (schematic). The 16-dimensional observation contains one frame: six USV context features, five acoustic features, and five prior features. Solid arrows form the deployed feed-forward loop. Simulator truth enters the asymmetric state-value critic and reward only in the lower training lane; the dashed parameter-update path is absent at deployment. No recurrent hidden state is used. The actor-side deployment path and training-only privileged path are explicitly separated so that target truth cannot be mistaken for an actor input.
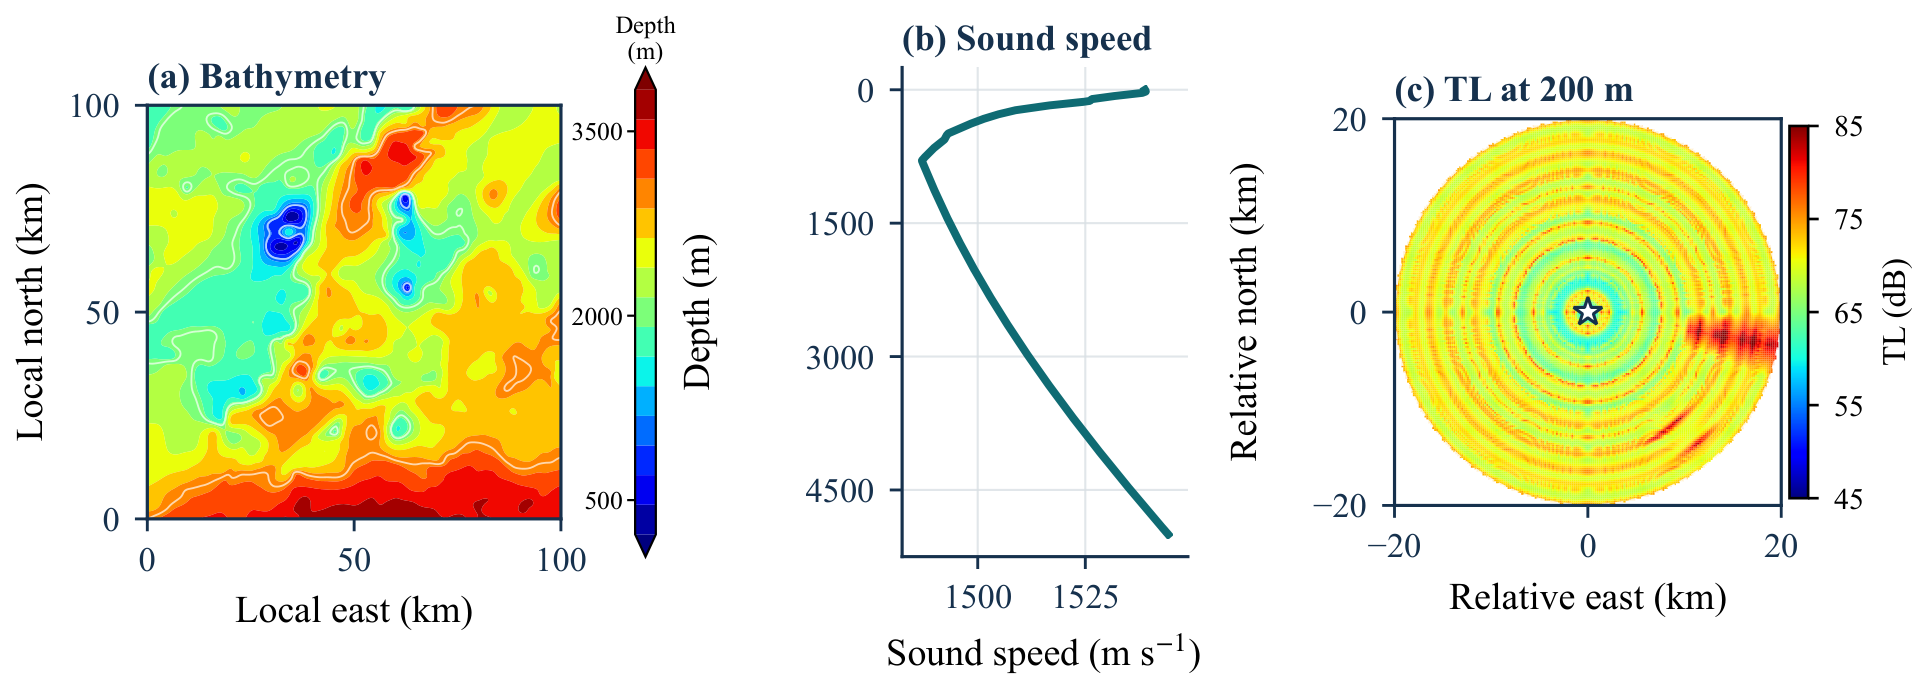
Figure 3.
Acoustic environment used by the simulator: (a) bathymetry, (b) sound-speed profile, and (c) the stored 200 m transmission-loss (TL) layer. The star in panel (c) marks source-grid index , and the dashed circle denotes the approximately 20 km lookup support. The database contains a source grid at 1 km spacing, 36 azimuths, and local maps at 0.1 km resolution.
Figure 3.
Acoustic environment used by the simulator: (a) bathymetry, (b) sound-speed profile, and (c) the stored 200 m transmission-loss (TL) layer. The star in panel (c) marks source-grid index , and the dashed circle denotes the approximately 20 km lookup support. The database contains a source grid at 1 km spacing, 36 azimuths, and local maps at 0.1 km resolution.
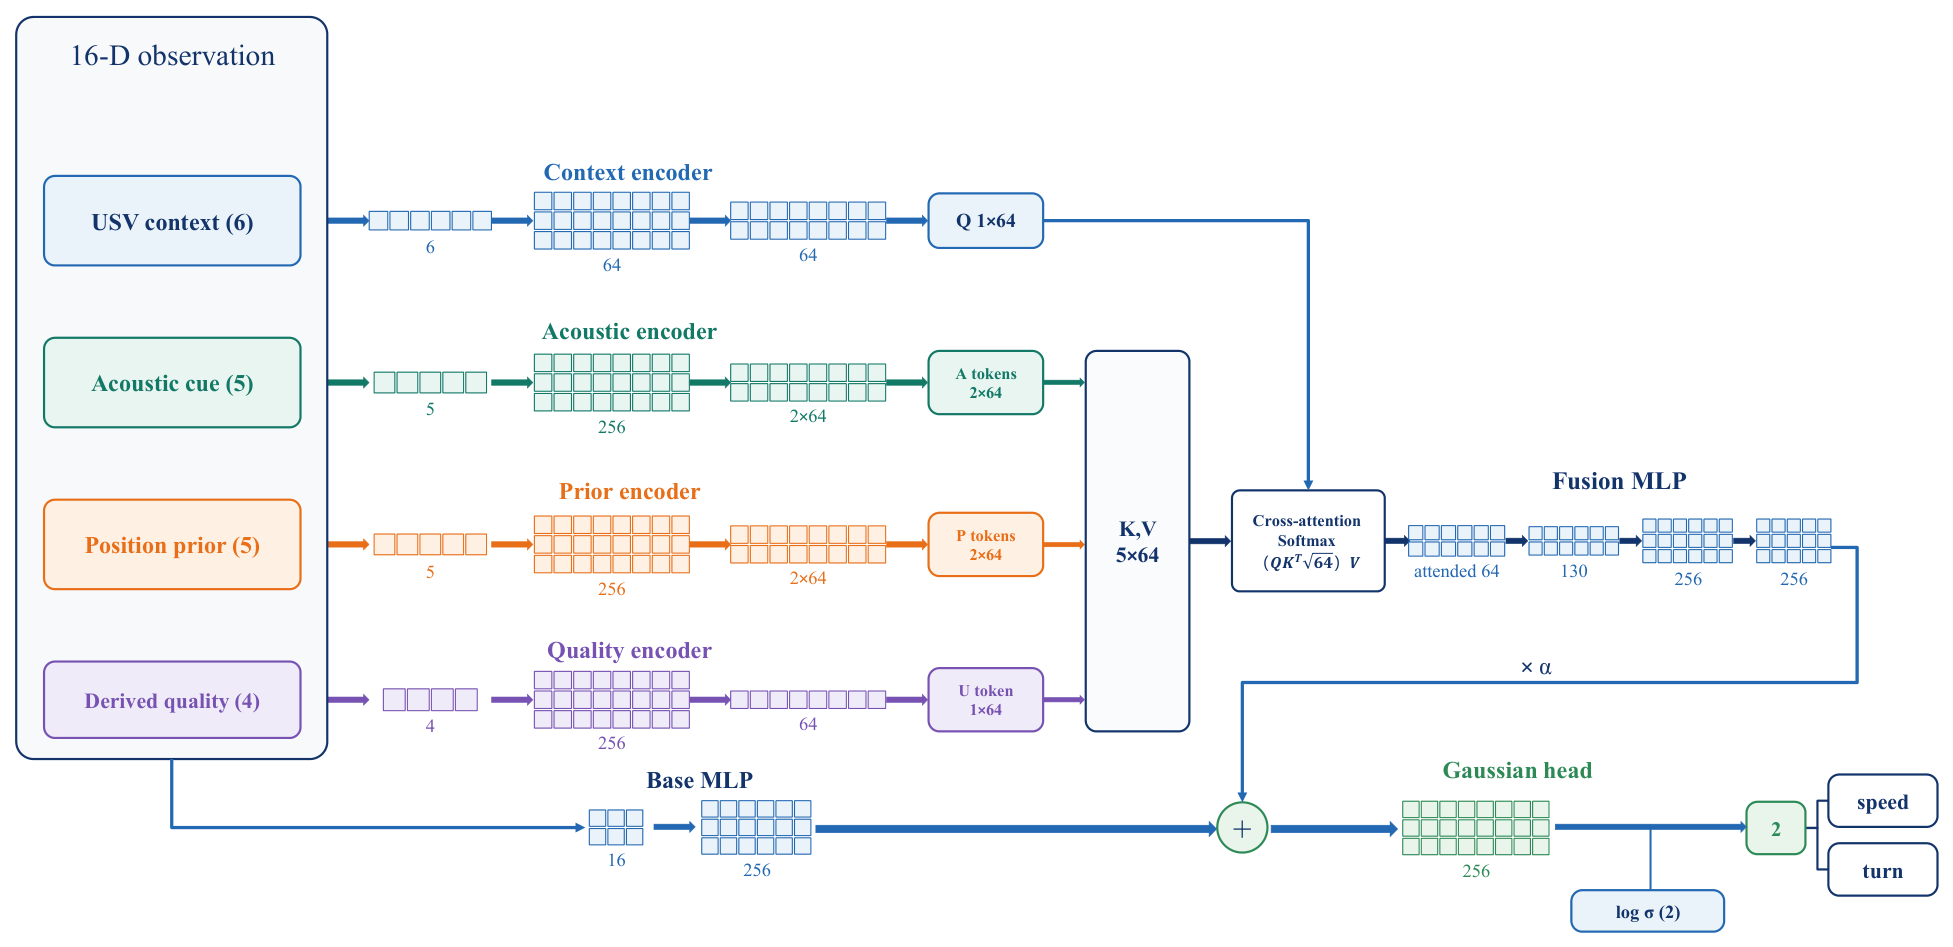
Figure 4.
Network structure of the evaluated UCA-PPO actor (schematic). The 16-dimensional observation comprises 6 USV-context, 5 acoustic, and 5 prior features. The acoustic and prior encoders each produce two 64-dimensional source tokens; a four-component quality descriptor derived from the received acoustic and prior features produces one observation-quality token. A 64-dimensional context query attends to the five source tokens. The resulting feature passes through a fusion MLP and is added, with learned scale , to the base branch. The Gaussian head maps the fused 256-dimensional feature to the two action means, while a separate trainable two-component log standard deviation specifies exploration. Tiled groups schematically encode changes in layer width; numerical labels give the exact dimensions, and individual cells are visual symbols rather than counted neurons. All actor inputs shown above the training-only boundary are available at deployment; target truth and latent are excluded.
Figure 4.
Network structure of the evaluated UCA-PPO actor (schematic). The 16-dimensional observation comprises 6 USV-context, 5 acoustic, and 5 prior features. The acoustic and prior encoders each produce two 64-dimensional source tokens; a four-component quality descriptor derived from the received acoustic and prior features produces one observation-quality token. A 64-dimensional context query attends to the five source tokens. The resulting feature passes through a fusion MLP and is added, with learned scale , to the base branch. The Gaussian head maps the fused 256-dimensional feature to the two action means, while a separate trainable two-component log standard deviation specifies exploration. Tiled groups schematically encode changes in layer width; numerical labels give the exact dimensions, and individual cells are visual symbols rather than counted neurons. All actor inputs shown above the training-only boundary are available at deployment; target truth and latent are excluded.

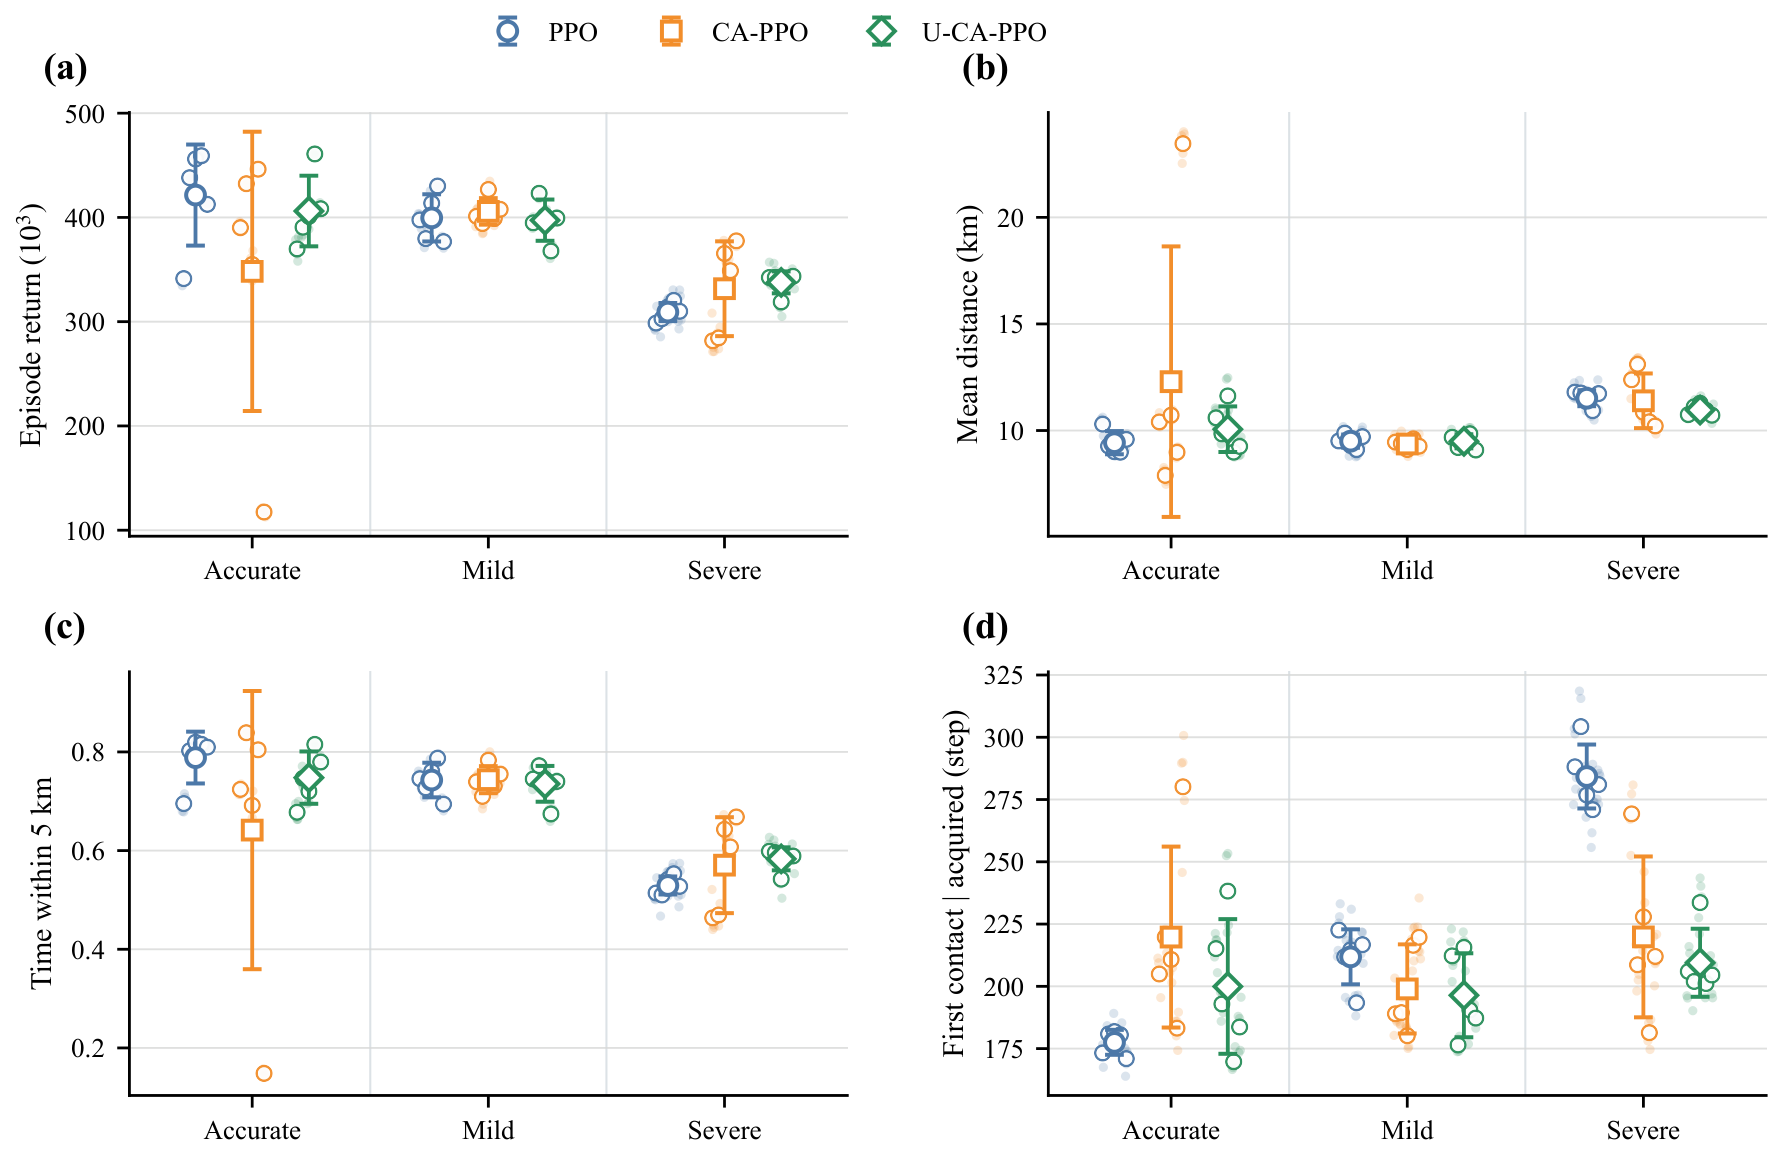
Figure 5.
Main-policy performance across prior regimes: (a) episode return, (b) mean USV–AUV distance, (c) fraction of time within 5 km, and (d) first-contact time conditional on acquisition. Small semi-transparent points show all 25 evaluation-block results in each model–regime combination (five training seeds by five evaluation seeds, 200 episodes per block). Open points show the five training-seed means after averaging the evaluation blocks; the larger model-shaped marker and bar denote the mean ± one standard deviation across those five independent training outcomes. Evaluation blocks are nested repeats, not additional independent training samples. No line is drawn between regimes. Lower is better for distance and first-contact time.
Figure 5.
Main-policy performance across prior regimes: (a) episode return, (b) mean USV–AUV distance, (c) fraction of time within 5 km, and (d) first-contact time conditional on acquisition. Small semi-transparent points show all 25 evaluation-block results in each model–regime combination (five training seeds by five evaluation seeds, 200 episodes per block). Open points show the five training-seed means after averaging the evaluation blocks; the larger model-shaped marker and bar denote the mean ± one standard deviation across those five independent training outcomes. Evaluation blocks are nested repeats, not additional independent training samples. No line is drawn between regimes. Lower is better for distance and first-contact time.
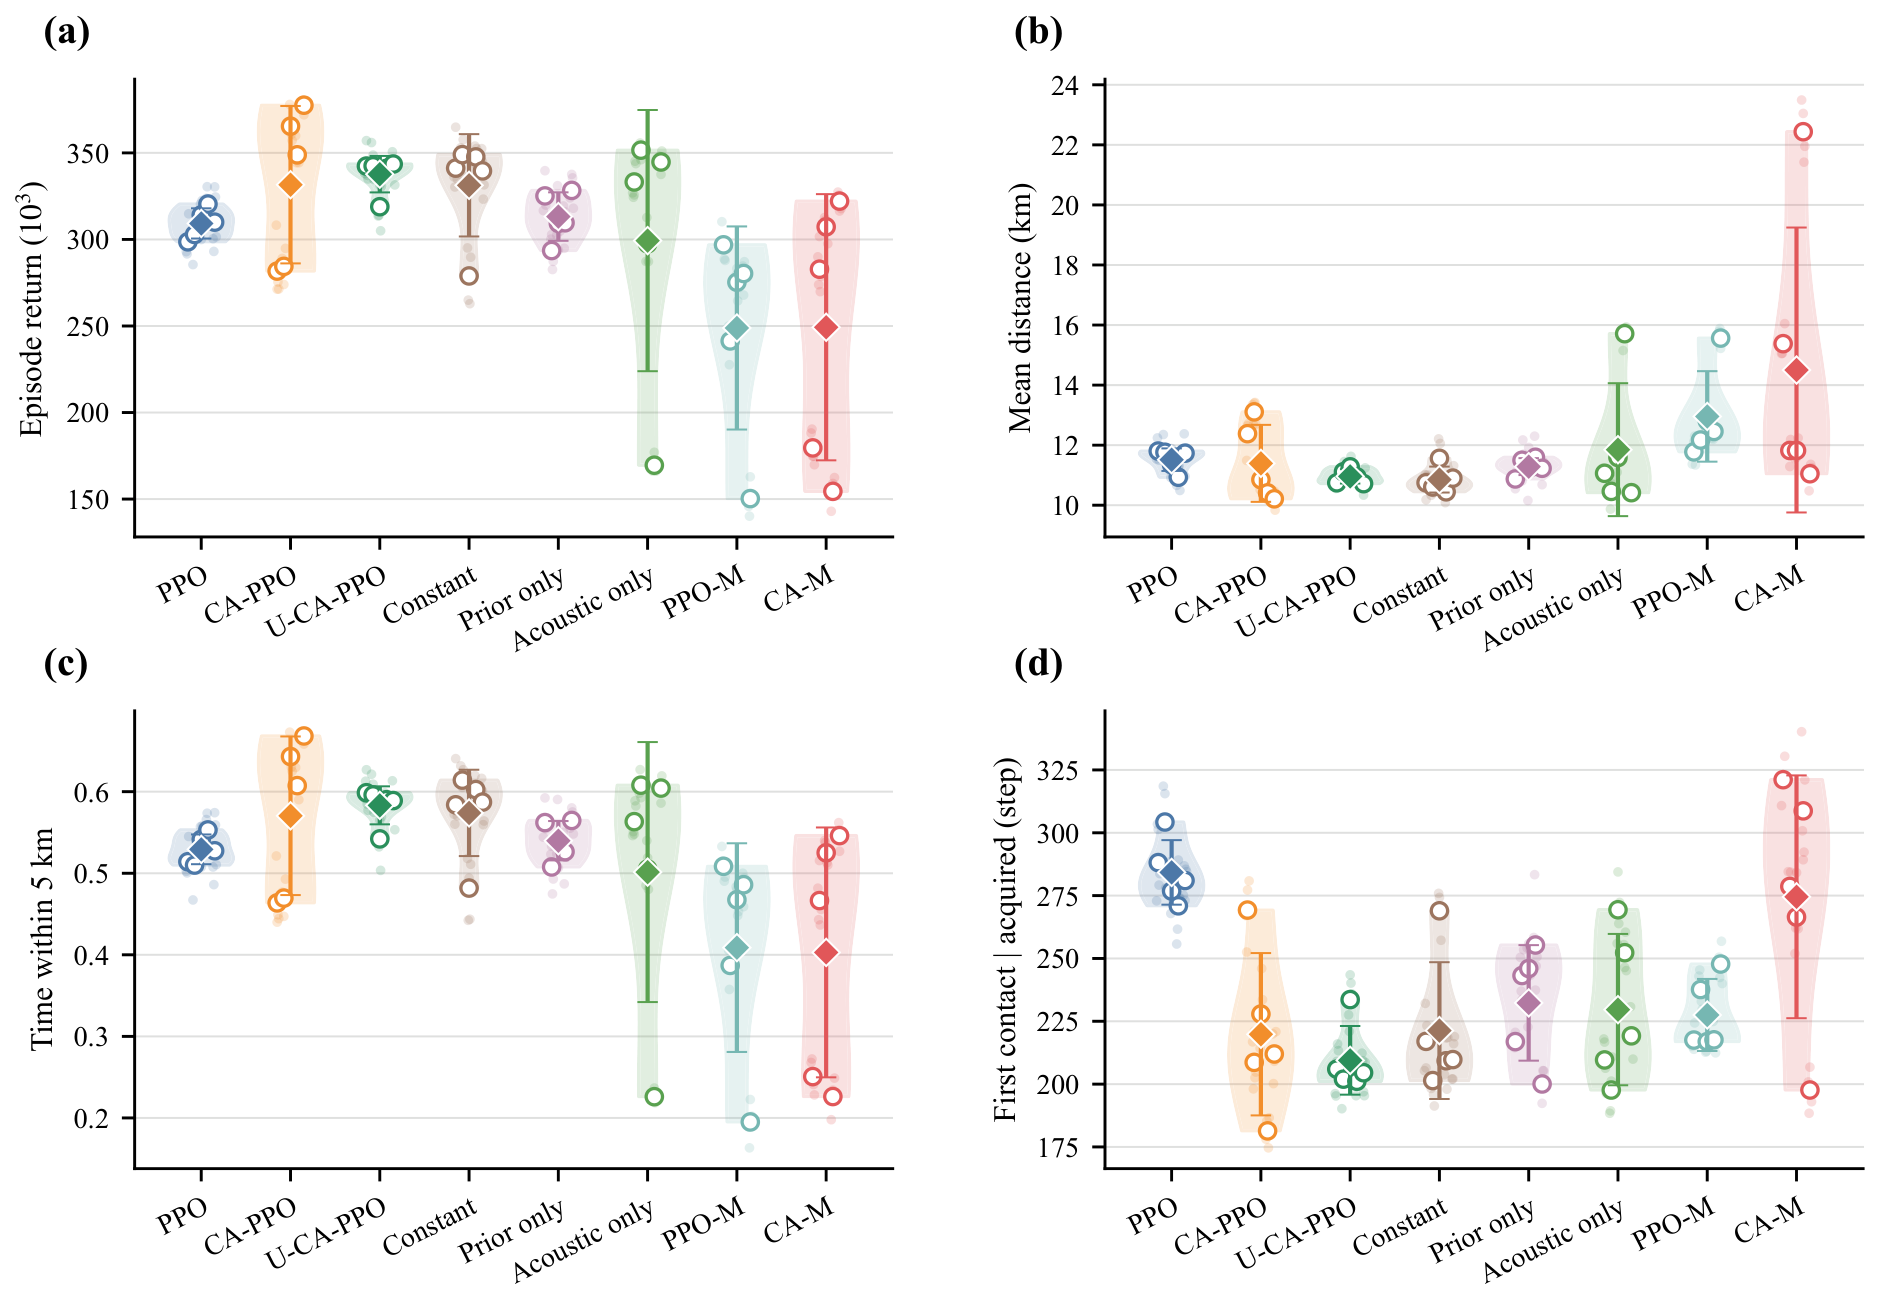
Figure 6.
Severe-regime attribution: (a) episode return, (b) mean USV–AUV distance, (c) fraction of time within 5 km, and (d) first-contact time conditional on acquisition. Small semi-transparent points show the 25 evaluation-block results per method (200 episodes per block), while open circles show the five training-seed means. Violin contours are descriptive kernel-density estimates of those five means, and diamonds with bars denote their mean ± SD. Constant, Prior, and Acoustic are equal-capacity observation-quality-token ablations. PPO-M and CA-M match UCA-PPO’s actor parameter count. The five evaluation repeats within a checkpoint are not treated as independent inferential units; inference rests on the five training outcomes and paired analyses rather than on violin width.
Figure 6.
Severe-regime attribution: (a) episode return, (b) mean USV–AUV distance, (c) fraction of time within 5 km, and (d) first-contact time conditional on acquisition. Small semi-transparent points show the 25 evaluation-block results per method (200 episodes per block), while open circles show the five training-seed means. Violin contours are descriptive kernel-density estimates of those five means, and diamonds with bars denote their mean ± SD. Constant, Prior, and Acoustic are equal-capacity observation-quality-token ablations. PPO-M and CA-M match UCA-PPO’s actor parameter count. The five evaluation repeats within a checkpoint are not treated as independent inferential units; inference rests on the five training outcomes and paired analyses rather than on violin width.
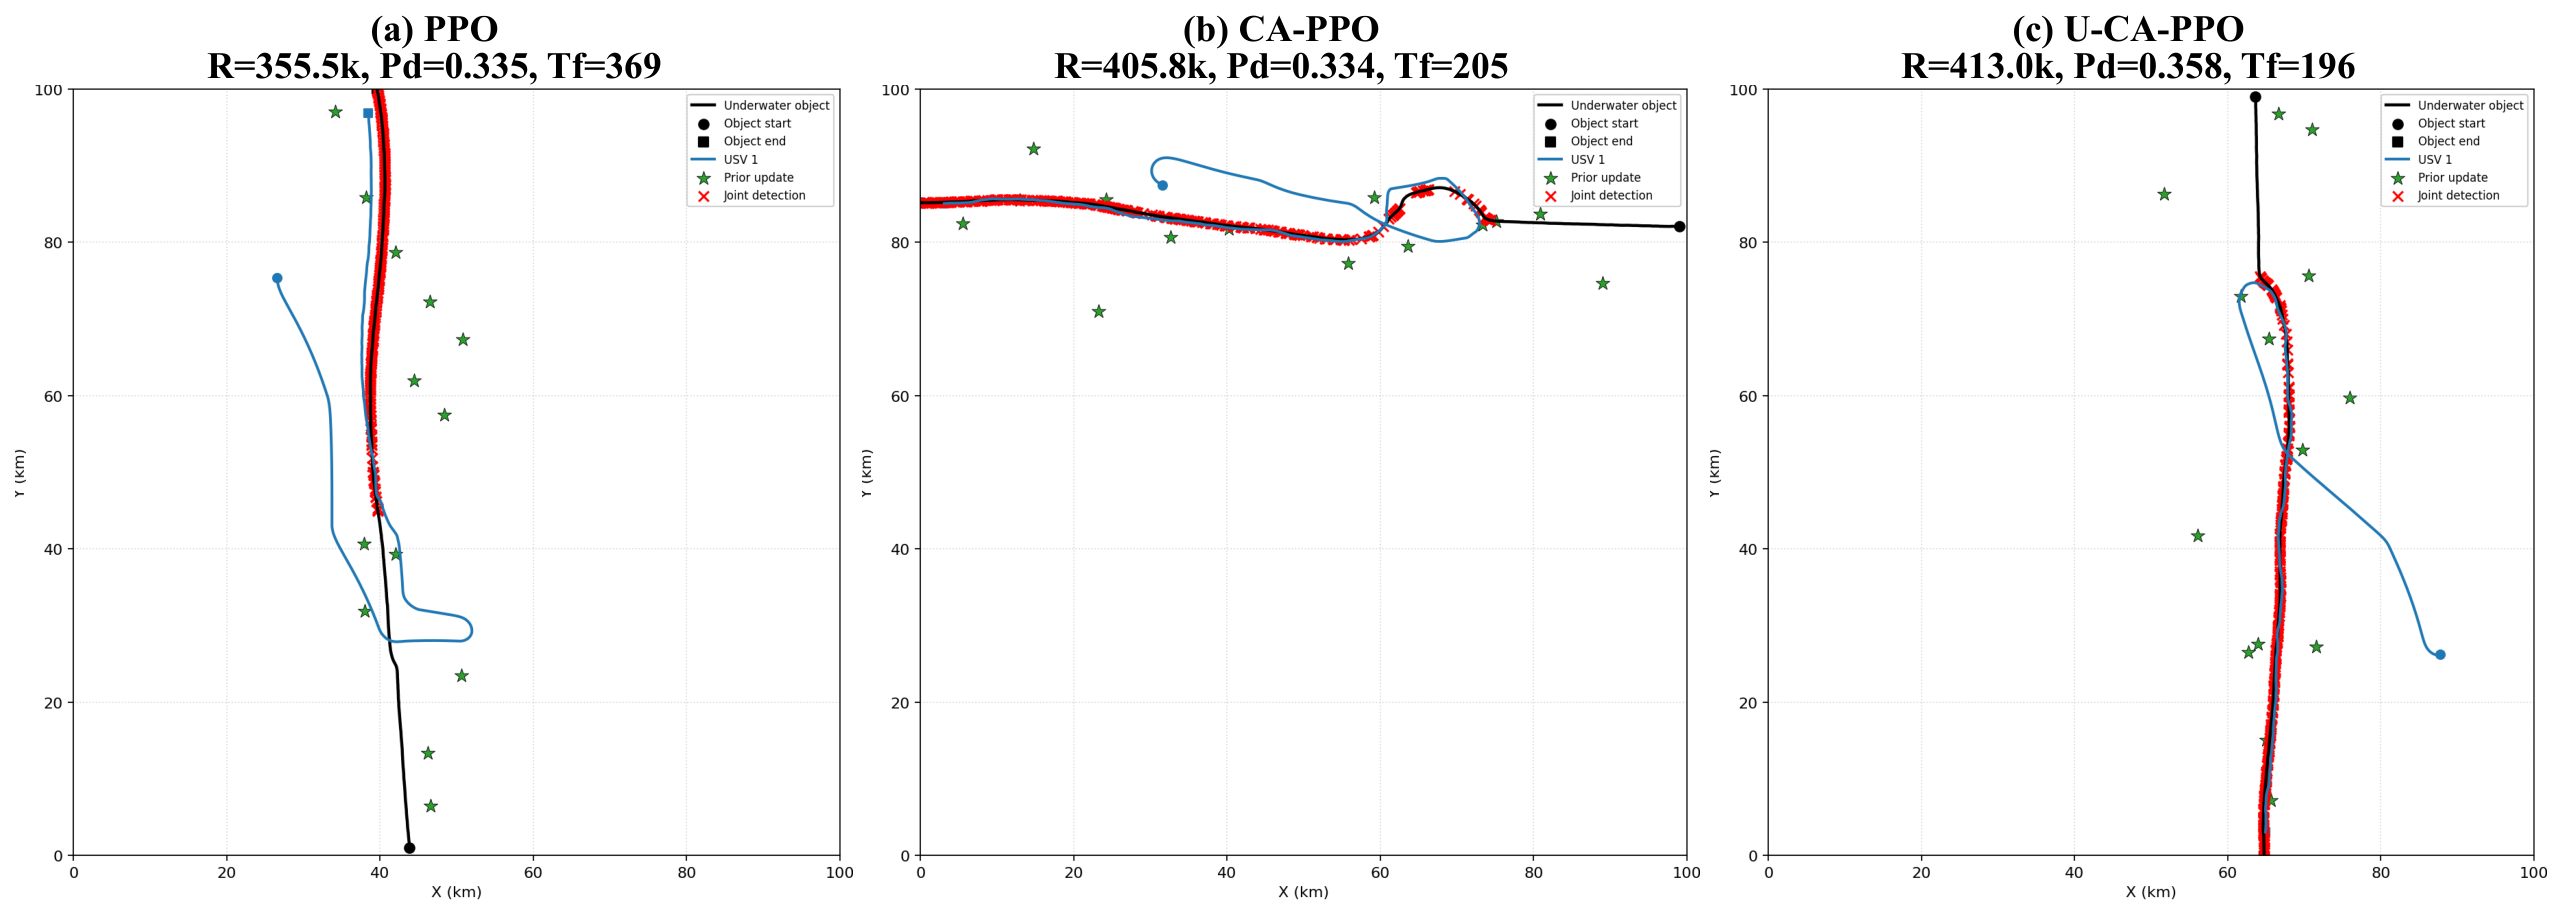
Figure 7.
Representative trajectories under severe prior degradation ( decisions and km): (a) PPO, (b) CA-PPO, and (c) UCA-PPO. All panels use training seed 0, evaluation seed 102, and episode 93. Black and blue curves denote the underwater-object and USV paths; green stars are prior updates, and red crosses mark passive-acoustic contacts. Panel headers report episode return R in thousands, mean modeled detection probability , and first-contact decision . Because the target reacts to the USV, the shared seed does not imply pointwise paired target trajectories.
Figure 7.
Representative trajectories under severe prior degradation ( decisions and km): (a) PPO, (b) CA-PPO, and (c) UCA-PPO. All panels use training seed 0, evaluation seed 102, and episode 93. Black and blue curves denote the underwater-object and USV paths; green stars are prior updates, and red crosses mark passive-acoustic contacts. Panel headers report episode return R in thousands, mean modeled detection probability , and first-contact decision . Because the target reacts to the USV, the shared seed does not imply pointwise paired target trajectories.
Table 1.
Single-frame actor observation. Target truth, true range, and latent modeled detection probability are excluded.
Table 1.
Single-frame actor observation. Target truth, true range, and latent modeled detection probability are excluded.
| Block | Dim. | Entries | Scaling or Interpretation |
|---|
| USV context | 6 | | Position/100 km; speed and turn/limits |
| Acoustic | 5 | | Contact; held bearing; confidence; |
| External prior | 5 | | Update; relative position; age; stated error |
Table 2.
Main simulation and acoustic parameters.
Table 2.
Main simulation and acoustic parameters.
| Parameter | Value |
|---|
| Area/decision interval | km/60 s |
| Episode horizon | 1000 decisions |
| USV/AUV speed | 5/2 ms−1 |
| USV initialization | km; ; |
| AUV entry/exit | 1 km inside/5 km beyond opposite side |
| AUV lateral entry/exit jitter | km/ km, clipped |
| Heading increment/slew limit | 10°/2° per decision |
| AUV avoidance range/weight | 15 km/25 |
| Acoustic frequency | 100 Hz |
| Modeled depth pair | 150/200 m |
| RAM maximum range | 20 km |
| RAM azimuth/range/depth steps | 10°/100 m/50 m |
| 130, 65, 50, 0 dB |
| Invalid TL/contact memory | 120 dB/50 decisions |
| Bearing-noise limits | 0.03–0.35 rad |
Table 3.
Learned configurations used to test UCA-PPO. Ablations and matched controls are evaluated only under severe prior degradation.
Table 3.
Learned configurations used to test UCA-PPO. Ablations and matched controls are evaluated only under severe prior degradation.
| Configuration | Width | Parameters | Role |
|---|
| PPO | 256 | 70,660 | Unstructured main baseline |
| CA-PPO | 256 | 189,957 | Source-token attention baseline |
| UCA-PPO (uca) | 256 | 207,685 | Proposed full observation-quality token |
| Constant (uca_zero) | 256 | 207,685 | Quality variation removed |
| Prior-only | 256 | 207,685 | Prior quality retained |
| Acoustic-only | 256 | 207,685 | Acoustic quality retained |
| PPO-M | 446 | 207,840 | Parameter-matched PPO control |
| CA-PPO-M | 275 | 208,007 | Parameter-matched CA control |
Table 4.
Non-learning engineering baselines. All controllers use the same environment action limits as the learned policies and receive no simulator target truth.
Table 4.
Non-learning engineering baselines. All controllers use the same environment action limits as the learned policies and receive no simulator target truth.
| Controller | Position Prior | Acoustic Observation | Decision Rule |
|---|
| Greedy-Prior | Held position | None | Distance-scaled direct pursuit |
| Prior-MPC | Held position | None | Eight-step discrete receding-horizon search |
| PF-Pursuit | Position and stated error | Contact, bearing, confidence | Particle-filter mean followed by pursuit |
Table 5.
Separately trained prior regimes.
Table 5.
Separately trained prior regimes.
| Regime | Code | Interval | |
|---|
| Accurate | tp10_sig0 | 10 decisions | 0 km |
| Mild | tp30_sig2 | 30 decisions | 2 km |
| Severe | tp60_sig5 | 60 decisions | 5 km |
Table 6.
Main-policy evaluation. Values are mean ± SD across five training seeds after averaging 1000 episodes within each seed. Return is reported in ; D is mean distance, is the fraction of time within 5 km, C is contact continuity, A is the fraction of episodes with contact, and is first-contact time conditional on acquisition.
Table 6.
Main-policy evaluation. Values are mean ± SD across five training seeds after averaging 1000 episodes within each seed. Return is reported in ; D is mean distance, is the fraction of time within 5 km, C is contact continuity, A is the fraction of episodes with contact, and is first-contact time conditional on acquisition.
| Regime | Model | Return | D (km) | | | C | A | |
|---|
| Accurate | PPO | | | | | | | |
| CA-PPO | | | | | | | |
| UCA-PPO | | | | | | | |
| Mild | PPO | | | | | | | |
| CA-PPO | | | | | | | |
| UCA-PPO | | | | | | | |
| Severe | PPO | | | | | | | |
| CA-PPO | | | | | | | |
| UCA-PPO | | | | | | | |
Table 7.
Seed-paired severe-regime contrasts between UCA-PPO and PPO. Differences are oriented so that positive values favor UCA-PPO. CI is the 10,000-resample paired bootstrap interval; is paired Cohen’s effect size; wins count favorable training seeds. Exact p values are discrete and are not multiplicity-adjusted.
Table 7.
Seed-paired severe-regime contrasts between UCA-PPO and PPO. Differences are oriented so that positive values favor UCA-PPO. CI is the 10,000-resample paired bootstrap interval; is paired Cohen’s effect size; wins count favorable training seeds. Exact p values are discrete and are not multiplicity-adjusted.
| Endpoint | Favorable Difference | 95% CI | | Wins | Exact p |
|---|
| Return | | | 1.79 | 5/5 | 0.0625 |
| Mean distance decrease (km) | 0.556 | | 1.10 | 4/5 | 0.1250 |
| 5 km dwell | 0.0539 | | 1.50 | 5/5 | 0.0625 |
| Modeled | 0.0376 | | 1.50 | 5/5 | 0.0625 |
| Contact continuity | | | | 2/5 | 0.5625 |
| Contact coverage | 0.1526 | | 6.67 | 5/5 | 0.0625 |
| Conditional first-contact decrease | 74.8 | | 3.49 | 5/5 | 0.0625 |
| Mean-turn decrease (deg) | | | | 0/5 | 0.0625 |
Table 8.
Engineering-baseline evaluation, reported as mean ± SD over five environment-seed blocks of 200 episodes. Return is in . is the penalized first-contact time, with 1000 assigned to an episode without contact.
Table 8.
Engineering-baseline evaluation, reported as mean ± SD over five environment-seed blocks of 200 episodes. Return is in . is the penalized first-contact time, with 1000 assigned to an episode without contact.
| Regime | Controller | Return | D (km) | | | C | A | | |
|---|
| Accurate | Greedy-Prior | | | | | | | | |
| Prior-MPC | | | | | | | | |
| PF-Pursuit | | | | | | | | |
| Mild | Greedy-Prior | | | | | | | | |
| Prior-MPC | | | | | | | | |
| PF-Pursuit | | | | | | | | |
| Severe | Greedy-Prior | | | | | | | | |
| Prior-MPC | | | | | | | | |
| PF-Pursuit | | | | | | | | |
Table 9.
Severe-regime ablation and parameter-matched evaluation. Reporting follows
Table 6.
Table 9.
Severe-regime ablation and parameter-matched evaluation. Reporting follows
Table 6.
| Configuration | Return | D (km) | | | C | A | |
|---|
| PPO | | | | | | | |
| CA-PPO | | | | | | | |
| UCA-PPO | | | | | | | |
| Constant token | | | | | | | |
| Prior-only | | | | | | | |
| Acoustic-only | | | | | | | |
| PPO-M | | | | | | | |
| CA-PPO-M | | | | | | | |
Table 10.
Frozen-checkpoint factorial evaluation over 135,000 episodes. Entries are mean ± SD across five independent training seeds after averaging over five evaluation seeds within each training seed. Return is in , and A denotes contact-acquisition success.
Table 10.
Frozen-checkpoint factorial evaluation over 135,000 episodes. Entries are mean ± SD across five independent training seeds after averaging over five evaluation seeds within each training seed. Return is in , and A denotes contact-acquisition success.
| (km) | PPO Return | CA-PPO Return | UCA-PPO Return | UCA-PPO (km) | UCA-PPO | UCA-PPO A |
|---|
| 10 | 0 | | | | | | |
| 10 | 2 | | | | | | |
| 10 | 5 | | | | | | |
| 30 | 0 | | | | | | |
| 30 | 2 | | | | | | |
| 30 | 5 | | | | | | |
| 60 | 0 | | | | | | |
| 60 | 2 | | | | | | |
| 60 | 5 | | | | | | |
Table 11.
Zero-shot transfer of frozen severe-regime checkpoints to a Munk-profile RAM database over the same terrain. Each acoustic field contains 15,000 episodes; values are the mean ± SD across five training seeds after averaging five evaluation seeds per seed, and return is in .
Table 11.
Zero-shot transfer of frozen severe-regime checkpoints to a Munk-profile RAM database over the same terrain. Each acoustic field contains 15,000 episodes; values are the mean ± SD across five training seeds after averaging five evaluation seeds per seed, and return is in .
| Acoustic Field | Policy | Return | (km) | | A | |
|---|
| WOA-derived | PPO | | | | | |
| WOA-derived | CA-PPO | | | | | |
| WOA-derived | UCA-PPO | | | | | |
| Munk profile | PPO | | | | | |
| Munk profile | CA-PPO | | | | | |
| Munk profile | UCA-PPO | | | | | |
Table 12.
Severe-regime UCA-PPO retraining with and without the privileged acoustic reward. Both rows are evaluated under the same common evaluator. Values are the mean ± SD across five training seeds after averaging five evaluation seeds per training seed; return is in , L is path length, and is cumulative absolute turn.
Table 12.
Severe-regime UCA-PPO retraining with and without the privileged acoustic reward. Both rows are evaluated under the same common evaluator. Values are the mean ± SD across five training seeds after averaging five evaluation seeds per training seed; return is in , L is path length, and is cumulative absolute turn.
| Training Reward | Return | (km) | L (km) | | A | | (deg) |
|---|
| Original | | | | | | | |
| No acoustic reward | | | | | | | |
Table 13.
Additional metrics recovered from completed learned-policy evaluations (mean ± SD across five training seeds).
Table 13.
Additional metrics recovered from completed learned-policy evaluations (mean ± SD across five training seeds).
| Regime | Policy | Path Length L (km) | Cumulative Turn (deg) | Acquisition Success A | |
|---|
| Accurate | PPO | | | | |
| Accurate | CA-PPO | | | | |
| Accurate | UCA-PPO | | | | |
| Mild | PPO | | | | |
| Mild | CA-PPO | | | | |
| Mild | UCA-PPO | | | | |
| Severe | PPO | | | | |
| Severe | CA-PPO | | | | |
| Severe | UCA-PPO | | | | |



 ,
,