Article

The Effects of Salinity Changes on Coastal Bacterial Communities in Experimental Microcosms

Department of Biology, University of Mississippi, University, MS 38677, USA
*
Author to whom correspondence should be addressed.
J. Mar. Sci. Eng. 2026, 14(18), 1687; https://doi.org/10.3390/jmse14181687
Submission received: 22 July 2026 / Revised: 6 September 2026 / Accepted: 9 September 2026 / Published: 11 September 2026
(This article belongs to the Section Marine Ecology)

Abstract

Bacterial communities are important in coastal environments, but how these communities are affected by changes in salinity is understudied. We used an experimental microcosm approach to examine how short-term changes in salinity affect coastal bacterial community structure, diversity, and activity. Seawater in microcosms was amended with different treatments to decrease salinity or artificial seawater to raise it. Bacterial community structure and diversity were assessed over five days through 16S rRNA gene sequencing and the activity of microbial enzymes related to organic carbon, nitrogen, and phosphorus mineralization determined. While salinity treatments significantly affected bacterial community composition, there were few consistent patterns and time within the experiment was a more significant factor impacting bacterial communities. Highlights included a decline in the proportion of Cyanobacteriota, coupled with increases in heterotrophic taxa such as Campylobacteriota, although the latter did not occur under elevated salinity. β-glucosidase, a carbon-acquiring enzyme, showed lower activity in a decreased salinity treatment compared to controls, despite all treatments showing an initial burst in activity of this enzyme. While seawater bacterial communities did change following short-term changes in salinity, such changes were difficult to separate from those caused by experimental conditions, making predictions about natural systems an ongoing challenge.

1. Introduction

Coastal marine ecosystems are important both ecologically and economically, acting as interfaces between marine and terrestrial ecosystems [1,2]. Coastal environments are dynamic and subject to environmental variability from the mixing of inland freshwater with seawater, as well as the influence of precipitation and storm events [3]. Microorganisms play important roles in these systems, influencing the biogeochemical cycling of carbon and nutrients [4,5]. Because of their locations as transitions between salt- and freshwater, coastal waters can support microbial communities that are adapted to intermediate salinity or communities may be stratified along salinity gradients with distinct microbial taxa present under different salinity regimes [6,7]. However, unlike the open ocean where salinity is relatively stable, fluctuations in salinity in coastal marine systems could lead to changes in the microbial community or microbial activity [8], and either increases or decreases in salinity can affect the composition of microbial communities [9,10].
The northern coast of the Gulf of Mexico is one example of a coastal system that can be subject to elevated or reduced salinity. Some parts of the northern Gulf coast, such as the Mississippi Sound, are protected by barrier islands that result in lower salinity compared to offshore waters [11,12]. Salinity in this region typically ranges from 12 to 22 ppt [13], but can increase when higher-salinity water is pushed toward the shore by hurricanes or tropical storms developing in the broader Gulf [14]. More persistent increases can occur from the inflow of shelf waters that introduce higher-salinity seawater [15]. In contrast, rain events can lead to increased river discharge and reduce salinity over short-term timescales [13], as has been shown in coastal systems worldwide [16,17,18]. Anthropogenic factors can also cause major shifts in salinity in this system, such as the opening of the Bonnet Carré Spillway, a flood control system that diverts massive amounts of freshwater into Lake Pontchartrain and from there towards the Mississippi coast [19,20]. Influx of freshwater from the Bonnet Carré Spillway sharply reduced salinity levels from 2011 to 2014 and almost eliminated oyster populations in coastal waters, with estimated losses of USD 9.6 to 19.9 million for the oyster industry [19]. The natural and human-made variability in salinity makes the Mississippi Gulf coast an interesting environment for examining how salinity shifts can influence ecological processes, particularly in the short term, although little is known about how the microbial communities in this system respond to changing environmental conditions.
Studies have begun to describe bacterial communities along the Mississippi Gulf coast, particularly those in beach environments, which comprise a large portion of habitats along this coastline [21,22,23]. Seawater and sand harbor distinct bacterial communities, with temporal variation in bacterial community structure exceeding spatial variation between different beaches along the coast [22,23]. Seasonal patterns are particularly pronounced in seawater communities and appear to be driven by changes in temperature and salinity [23], factors which have been found to influence bacterial community structure in other coastal environments [7,24]. However, such relationships are typically correlative and occur over large spatial or temporal scales. The impacts of short-term fluctuations in salinity on coastal bacterial communities in this system, such as those that occur over periods of 3–10 days during and/or following storm events [13], are less clear. Such ecological studies can be difficult to conduct in the field, where changes in environmental conditions can be difficult to predict and replicate, suggesting the possibility of more controlled microcosm-scale approaches to mimic the effects of environmental change in a laboratory environment [25].
In this study we used an experimental laboratory microcosm approach to assess the effects of short-term elevated or reduced salinity on the structure and function of seawater bacterial communities from the Mississippi Gulf coast. This experimental approach has not been used previously to determine the impacts of salinity changes on bacterial communities in this region, where patterns relating salinity to biological processes have tended to be correlative or based on modelling. We manipulated salinity levels to reflect those that can occur naturally and for a length of time typical of short-term storm events in this system, such that our study is relevant to understanding how such events could impact coastal bacterial communities. Seawater was placed in microcosms subject to different salinity conditions and high-throughput 16S rRNA gene amplicon sequencing used to describe bacterial community structure and diversity after one, three, and five days. The activity of three common microbial extracellular enzymes related to organic carbon (β-glucosidase), nitrogen (N-acetylglucosaminidase; NAGase), and phosphorus (phosphatase) mineralization was assayed over the same period to assess the impact of salinity changes on microbial biogeochemical capacity and provide a broad assessment of how such changes could impact the ecological function of seawater microbial communities. We expected that short-term changes in salinity would lead to changes in bacterial community composition, with potential reductions in diversity following the disturbance with some recovery as the study continued. Similarly, we expected that extracellular enzyme activity would decline following the initial salinity changes but show recovery by the end of the five-day study. While some of these patterns occurred, we found that the overall effects of the experiment on coastal seawater microbial communities were likely more related to experimental conditions than to specific salinity treatments.

2. Materials and Methods

2.1. Seawater Collection and Experimental Treatments

Seawater was collected from the surf zone of Biloxi East Beach (GPS coordinates: 30.392732° N, −88.876898° W), MS, USA, at approximately 13:00 on 28 October 2024. Seawater was collected into a 19 L plastic bucket that was sterilized by wiping with 70% ethanol. Seawater temperature at time of collection was 23.2 °C, salinity was 19.8 ppt, pH 8.19, and dissolved oxygen (DO) at 91% saturation. Damp surface sand was collected from the same area and into the same bucket. Water was collected from a freshwater site, the Tchoutacabouffa River (GPS coordinates: 30.460136° N, −88.908478° W), Biloxi, MS, USA, on the same day. Water was collected directly into autoclaved 1 L Nalgene bottles. Water temperature at the river site at time of sampling was 24.8 °C, salinity 3.48 ppt, pH 7.5, and DO at 92% saturation. Samples from both sites were transported (7 h) to the laboratory at the University of Mississippi for further processing.
Experimental microcosms (described below) involved controls (unamended seawater) and four treatments designated Natural Fresh (NF), Filtered Fresh (FF), RO (RO), and RO + Salt (RO+S), with five replicate microcosms per treatment type. The Natural Fresh treatment used untreated water from the freshwater site. The Filtered Fresh treatment used water from the freshwater site that was filtered through sterile 0.2 µm nylon membrane filters (MilliporeSigma, Cork, Ireland) and autoclaved. The RO treatment used autoclaved reverse osmosis (RO) purified water. The RO+S treatment used RO water that was amended with Instant Ocean Sea Salt (InstantOcean, Blacksburg, VA, USA) to give a salinity of 32 ppt, and autoclaved. Treatments were selected to represent a variety of salinity changes. The NF treatment mimicked the input of freshwater from increased river flow following significant rain events, with the FF treatment showing the same but removing the potential confounding factor of the input of freshwater microorganisms and their products so the treatment would solely change water chemistry, primarily salinity. The RO+S treatment mimicked the potential input of higher-salinity water being driven into the system during major storms in the Gulf of Mexico (focusing solely on salinity changes rather than inputs of bacteria), with the RO treatment acting as both a control for this treatment (to account for any effect of RO water itself) as well as an additional treatment that reduced salinity.

2.2. Microcosm Establishment and Sampling

Microcosms were established on October 29, 2024 (~20 h after seawater collection). Microcosms consisted of 600 mL sterile beakers that were maintained and stored in a standing incubator at room temperature (24–25 °C). Each microcosm received 225 mL of seawater and 90–95 g of sand. Control microcosms (n = 5) received an additional 225 mL of seawater (maintaining salinity at 19.8 ppt), while experimental treatments (n = 5 per treatment; Table 1) received 225 mL of untreated natural freshwater (NF treatment; to give salinity of 11.6 ppt), 225 mL of filtered and autoclaved freshwater (FF; also at 11.6 ppt), 225 mL of autoclaved RO water (RO; to give 9.9 ppt), or 225 mL of the RO and Instant Ocean solution (RO+S; to give a final salinity of 25.9 ppt). Microcosms were established in a randomized order using a random number generator in R version 4.2.2 and the total time for set-up was approximately 1 h. The experiment ran for a total of six days to represent the length of time that short-term changes in salinity typically occur along the Mississippi coast in response to storm events [13].
Water was sampled from each microcosm on day 0 (within 1 h of microcosm set-up), and after 1, 3, and 5 days, with the order of sampling randomized each day. The water in each microcosm was stirred gently using a sterile glass pipet and 50 mL collected. Approximately 5 mL of this water was used for assays of microbial extracellular enzyme activity, with the remainder being filtered through 0.2 µm sterile nylon membrane filters and the filters frozen at −20 °C for subsequent DNA extraction. Water sampled on day 0 from the control microcosms (which contained only the original seawater) served as a measure of the initial seawater bacterial community used in the study, and subsamples (3 × 0.5 g) of the sand used in microcosms were also processed on day 0 to assess the initial sand bacterial community. While not the focus of the study, sand was also collected and processed from each microcosm at the end of the experiment.

2.3. Assays of Microbial Extracellular Enzyme Activity

Enzyme assays followed the protocols of Jackson et al. [26] as used for seawater by Vaughn et al. [22] and used 4-methylumbelliferone (MUB)-linked fluorogenic substrates to measure the activity of enzymes involved in the mineralization of organic carbon (β-glucosidase), phosphate (phosphatase), and carbon and nitrogen (N-acetylglucosaminidase; NAGase). Briefly, assays were conducted in black 96-well microplates using 200 μL of sampled water per analytical replicate, with three analytical replicate assays per enzyme per sample, along with sample and substrate controls. Fluorescence readings were recorded every 5 min for 30 min at 360/460 (excitation/emission) nm, and enzyme activity of each sample was expressed as nmoles of substrate consumed per h−1 mL−1 of water.

2.4. DNA Extraction and 16S rRNA Gene Sequencing and Processing

DNA was extracted from filters or sand samples using a PowerSoil Pro DNA extraction kit (Qiagen, Germantown, MD, USA), following the manufacturer’s protocol, and the presence of DNA confirmed by agarose gel electrophoresis. A dual-index barcoding approach was used for Illumina next-generation sequencing of the V4 region of the bacterial 16S rRNA gene. Procedures followed those described by our previous studies (e.g., [22,27,28]), where a 250 base pair (bp) region was amplified using forward and reverse primers that were each tagged with a specific 8-nucleotide barcode to allow subsequent pooling of samples [29]. Following amplification, barcoded amplicons were standardized using SequalPrep plates (Life Technologies, Grand Island, NY, USA) and pooled prior to sequencing. The assembled library was spiked with 20% PhiX [27] and sequenced using an Illumina NextSeq at the University of Mississippi Medical Center (UMMC) Molecular and Genomics Core Facility.
Sequence fastq files were downloaded and processed using the standard 16S rRNA pipeline of the DADA2 package version 1.26.0 [30], within R version 4.2.2. Bioinformatics procedures followed those we have used previously for the analysis of seawater bacterial communities [22]. Sequences were trimmed and inspected to ensure proper quality of trimmed reads, and forward and reverse reads were merged. Sequences that were outside of the range of 250–256 bp were removed, as were sequences identified as possible chimeras, chloroplasts, mitochondria, Archaea, or Eukarya. Unique sequences were categorized as amplicon sequence variants (ASVs). Taxonomy was assigned to ASVs by classification according to the SILVA database [31] v138.1 (released August 2020) with nomenclature of phyla updated to that of Oren and Garrity [32]. Singleton ASVs were removed prior to data analysis.

2.5. Data Analysis

Statistical analyses were carried out in R version 4.2.2. Enzyme activity data were analyzed to determine the effects of salinity treatments on microbial extracellular enzyme activity over time. Two-way analysis of variance (ANOVA) was used to determine if there were significant differences in the activity of each treatment on each sampling day (i.e., using treatment × day as the two factors). Significant differences were further analyzed using Tukey’s HSD post hoc tests.
Bacterial 16S rRNA gene sequence data were used to examine the influence of salinity treatments and time on bacterial community composition and diversity. Alpha diversity was measured by calculating species diversity as the inverse Simpson’s index and species richness as the number of species (ASVs) observed. For those analyses, samples with particularly low sequence read counts were removed and remaining samples were rarefied by randomly subsampling each to the lowest sequence count (5223) observed across all remaining samples. Two-way ANOVA was used to test for differences in alpha diversity metrics between salinity treatments and days.
Bray–Curtis dissimilarity scores were calculated between all pairs of samples, followed by permutational analysis of variance (PERMANOVA) to test significant differences of microcosm bacterial communities between treatments and days. These data were visualized using non-metric multidimensional scaling (NMDS) plots. The envfit function in R was used to relate the activity of enzymes that showed significant differences by treatment or experimental day to NMDS ordinations of bacterial community composition.
The relative abundance of major bacterial taxa (those accounting for >1.0% of the total 16S rRNA gene sequence data) in each microcosm was determined and statistically compared between treatments and days using multivariate analysis of variance (MANOVA). The ‘core’ microbiome of seawater in the microcosms was defined as the top ten common ASVs at >1% of sequences within a given sample using the ‘microbiome’ package. The abundance of these ASVs was compared between treatments and days using MANOVA followed by Tukey’s HSD post hoc analysis.

3. Results

3.1. Microbial Extracellular Enzyme Activity

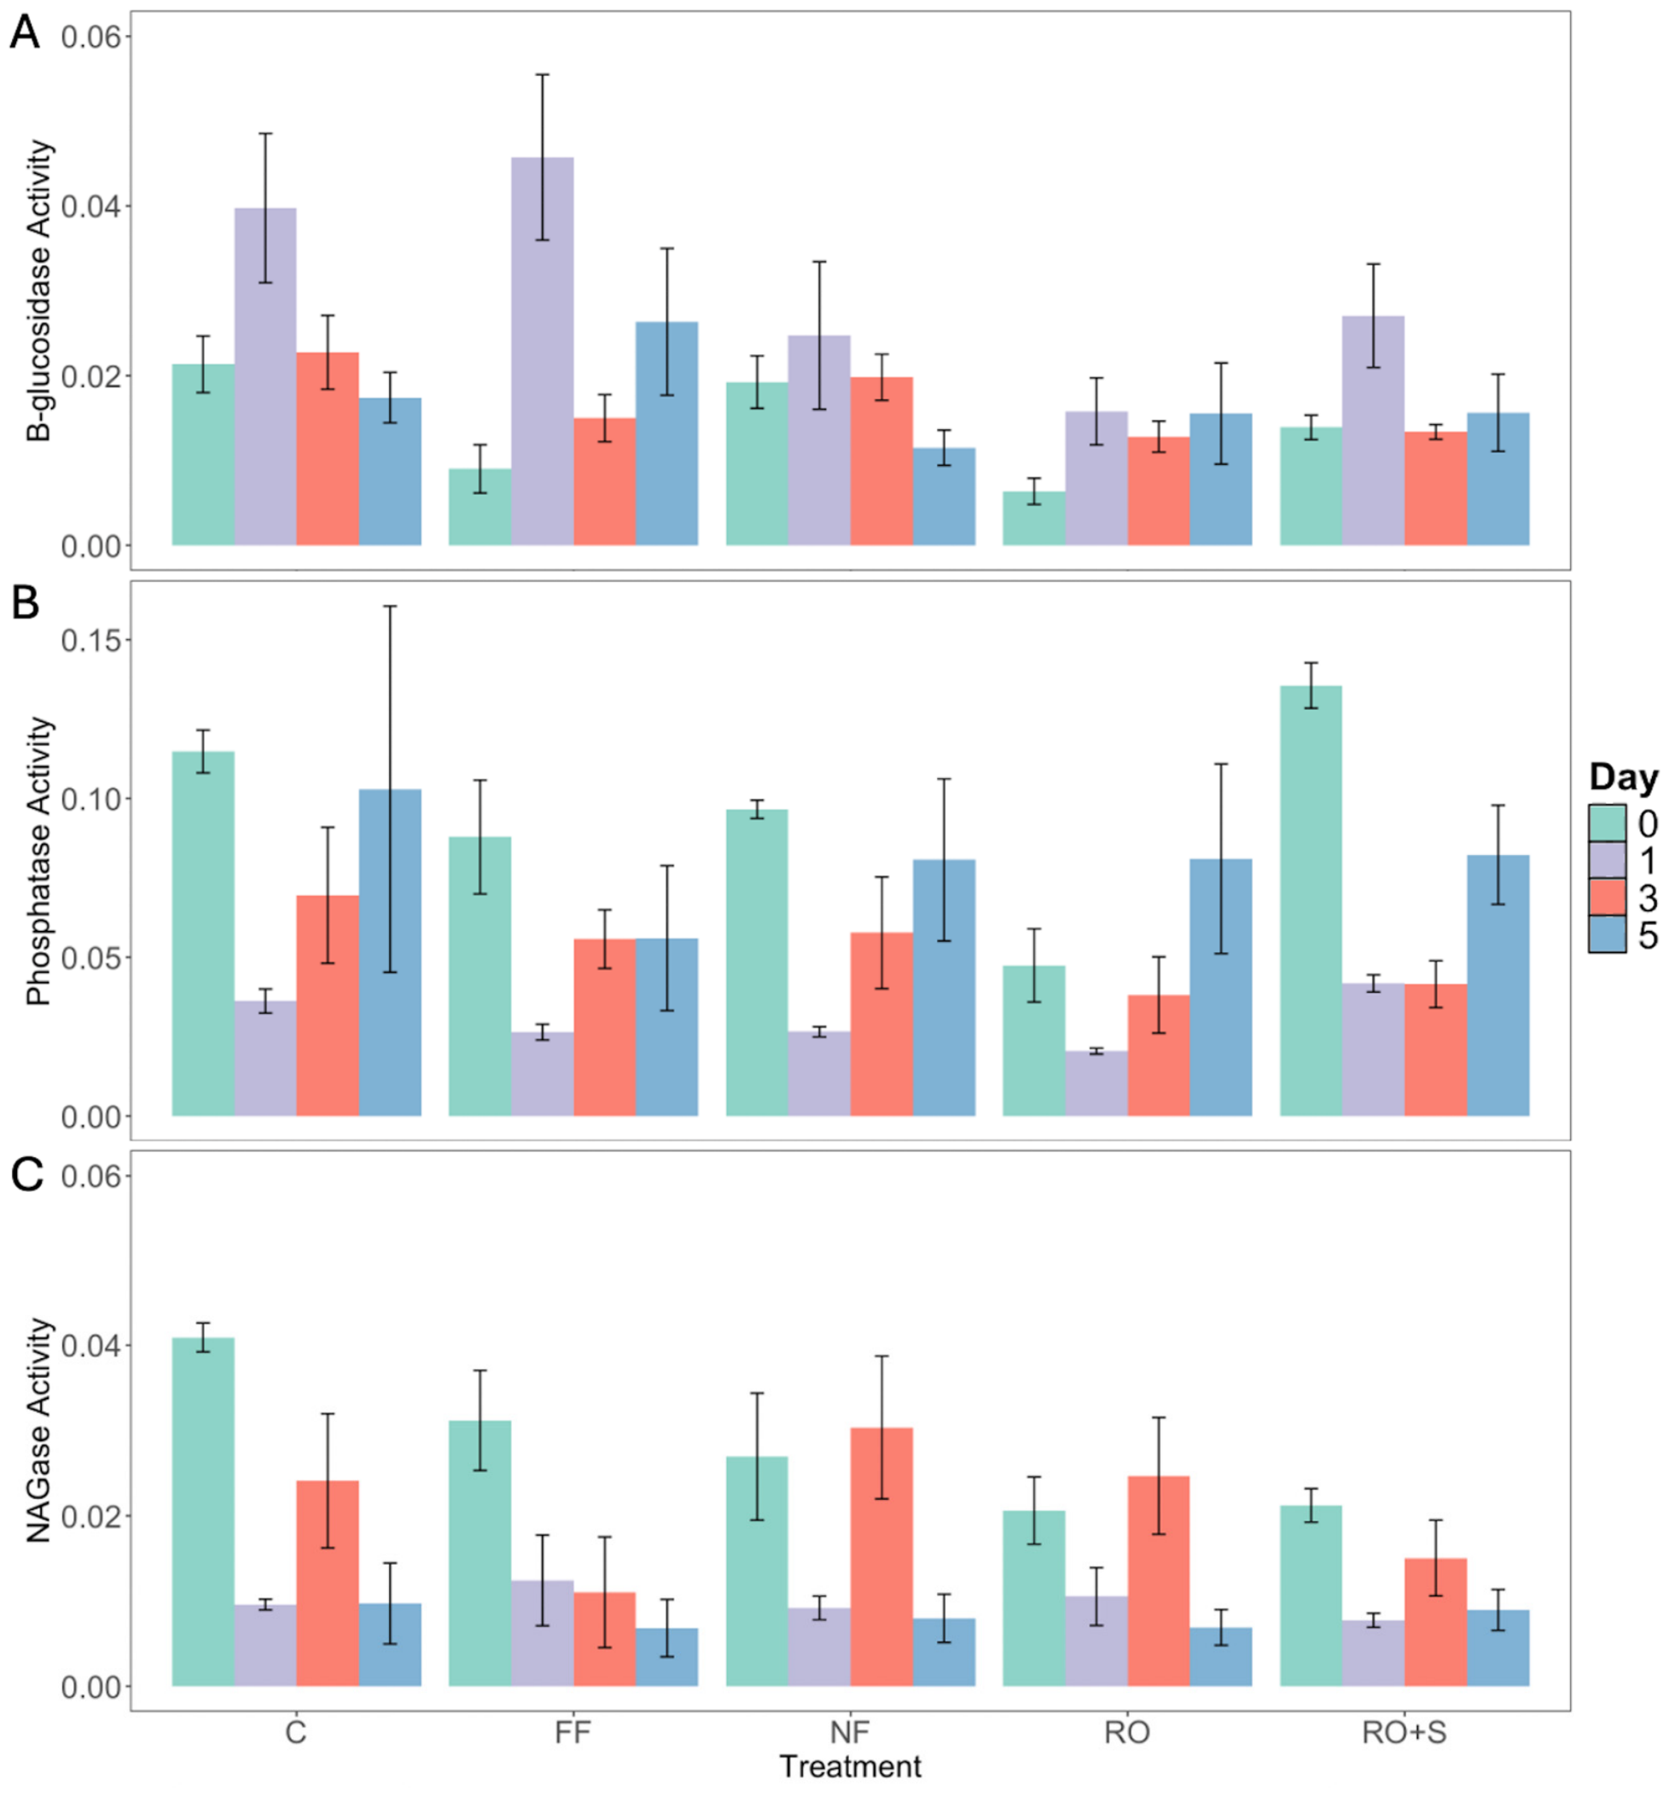
Extracellular enzyme activity was measured in microcosms under the different salinity treatments at the start of the experiment (day 0) and on days 1, 3, and 5. Activity of β-glucosidase and NAGase was typically between 0.01 and 0.04 nmol h−1 mL−1, while phosphatase activity was approximately twice that (typically between 0.02 and 0.10 nmol h−1 mL−1; Figure 1). Activities of β-glucosidase and phosphatase (Pearson’s correlation, r = −0.070) or β-glucosidase and NAGase (r = −0.131) were not appreciably correlated with each other, but there was a slight positive correlation between the activities of NAGase and phosphatase (r = 0.341).
Enzyme activities varied significantly over the course of the experiment (ANOVA; F = 10.7–20.2, p < 0.001), however only the activity of β-glucosidase differed significantly between treatments (F = 4.10, p < 0.01). There was also a significant effect of day on β-glucosidase activity (F = 10.75, p < 0.001) but the treatment x day interaction was not significant. The activity of β-glucosidase in all treatments increased from day 0 to day 1 (Figure 1A) and β-glucosidase activity on day 1 was significantly higher than all other experimental days (Tukey’s HSD; p-adj < 0.001). β-glucosidase activity in all treatments decreased after day 1, with a significant overall difference in β-glucosidase activity between day 1 and day 5 (p-adj < 0.05). β-glucosidase activity in the FF treatment was also higher on day 1 than it was on day 3 (p-adj < 0.05). In terms of specific differences in β-glucosidase activity between treatments, microcosms in the RO treatment had lower overall β-glucosidase activity than controls (p-adj < 0.01) or those in the FF (p-adj < 0.05) treatment.
Phosphatase activity in microcosms differed significantly by day overall (F = 11.89, p < 0.001) but not by treatment and the treatment x day interaction was also not significant. Phosphatase activity in all experimental groups decreased from day 0 to day 1 (Figure 1B) but subsequently increased such that activity on day 5 was similar to that on day 0. Phosphatase activity on day 0 and day 5 was significantly higher than that on day 1 (p-adj < 0.001) or day 3 (p-adj < 0.01). NAGase activity also showed significant differences by day (F = 20.19, p < 0.001) but not by treatment or treatment x day interaction. Activity of NAGase decreased from day 0 to day 1 in all treatment groups, although treatments other than FF showed increases in NAGase activity on day 3, although activity decreased again by day 5 (Figure 1C). Significant pairwise differences by day were between the higher activity on day 0 and that on day 1, and between day 0 and day 5 (both p-adj < 0.001).

3.2. Overall Bacterial Community Structure

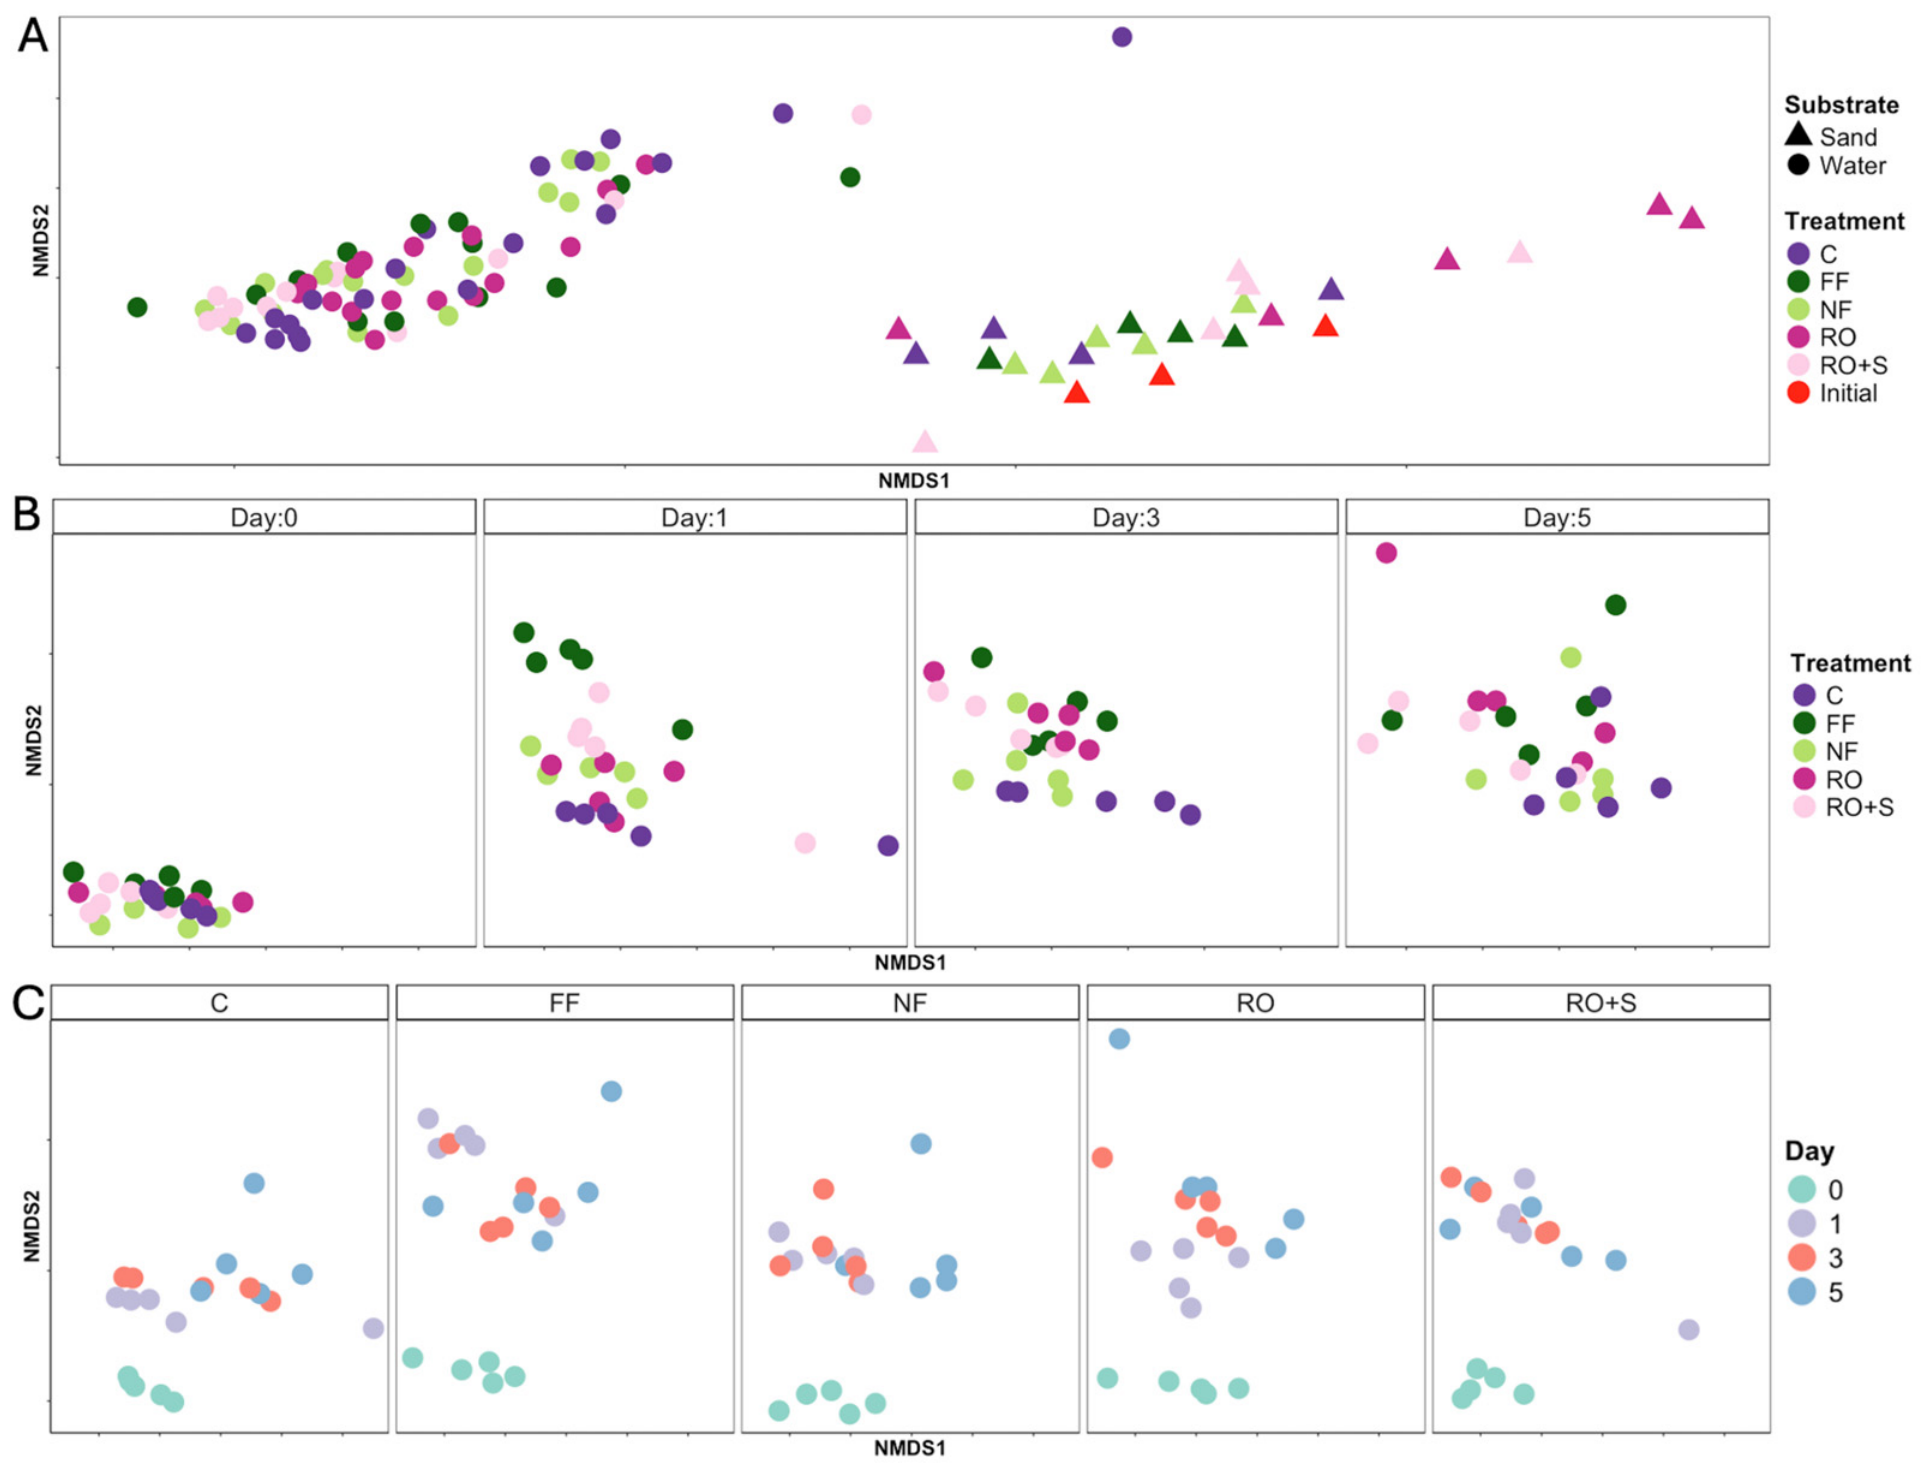
The final dataset contained 13,210 ASVs and had a Good’s coverage score of 96.4%. The clearest difference in bacterial community structure was between the sand samples (collected initially and on day 5) and all the seawater samples, regardless of treatment or day (Figure 2A; PERMANOVA; R2 = 0.38, F = 28.3, p < 0.001). Sand bacterial communities did not differ significantly among microcosm treatments (p > 0.05) and did not change from those used at day 0 (p > 0.05). Seawater bacterial communities differed significantly overall between treatments (R2 = 0.10, F = 2.60, p < 0.01) although none of the pairwise comparisons between specific treatments were significant individually (p-adj > 0.05; Figure 2B).
The effect of day on microcosm seawater bacterial community structure was stronger (R2 = 0.26, F = 8.82, p < 0.001), and except for comparing day 1 to day 3 (p-adj > 0.05), pairwise comparisons between individual days were significant (R2 = 0.17–0.33, p < 0.01 for all). NMDS ordinations showed general transitions in bacterial community composition in each microcosm treatment from day 0 through day 1 and day 3 to day 5 (Figure 2C). There was no significant interaction between treatment and day (p > 0.05).
Variation in seawater bacterial community structure was generally not related to variation in enzyme activity. In terms of experimental treatments, the activity of β-glucosidase was weakly but significantly correlated to bacterial community structure in the FF treatment on day 5 (envfit; R2 = 0.22, p < 0.05), but no other significant correlations between bacterial community structure and enzyme activity were found for any treatment x day combination. In terms of patterns by day, the activity of NAGase was weakly correlated to daily patterns in community structure overall (R2 = 0.23, p < 0.05), but correlations between daily patterns in seawater bacterial community structure and enzyme activity in any specific treatment were all non-significant (all p > 0.05). There were no significant correlations between seawater bacterial community structure and phosphatase activity (all p > 0.05).

3.3. Alpha Diversity of Bacterial Communities

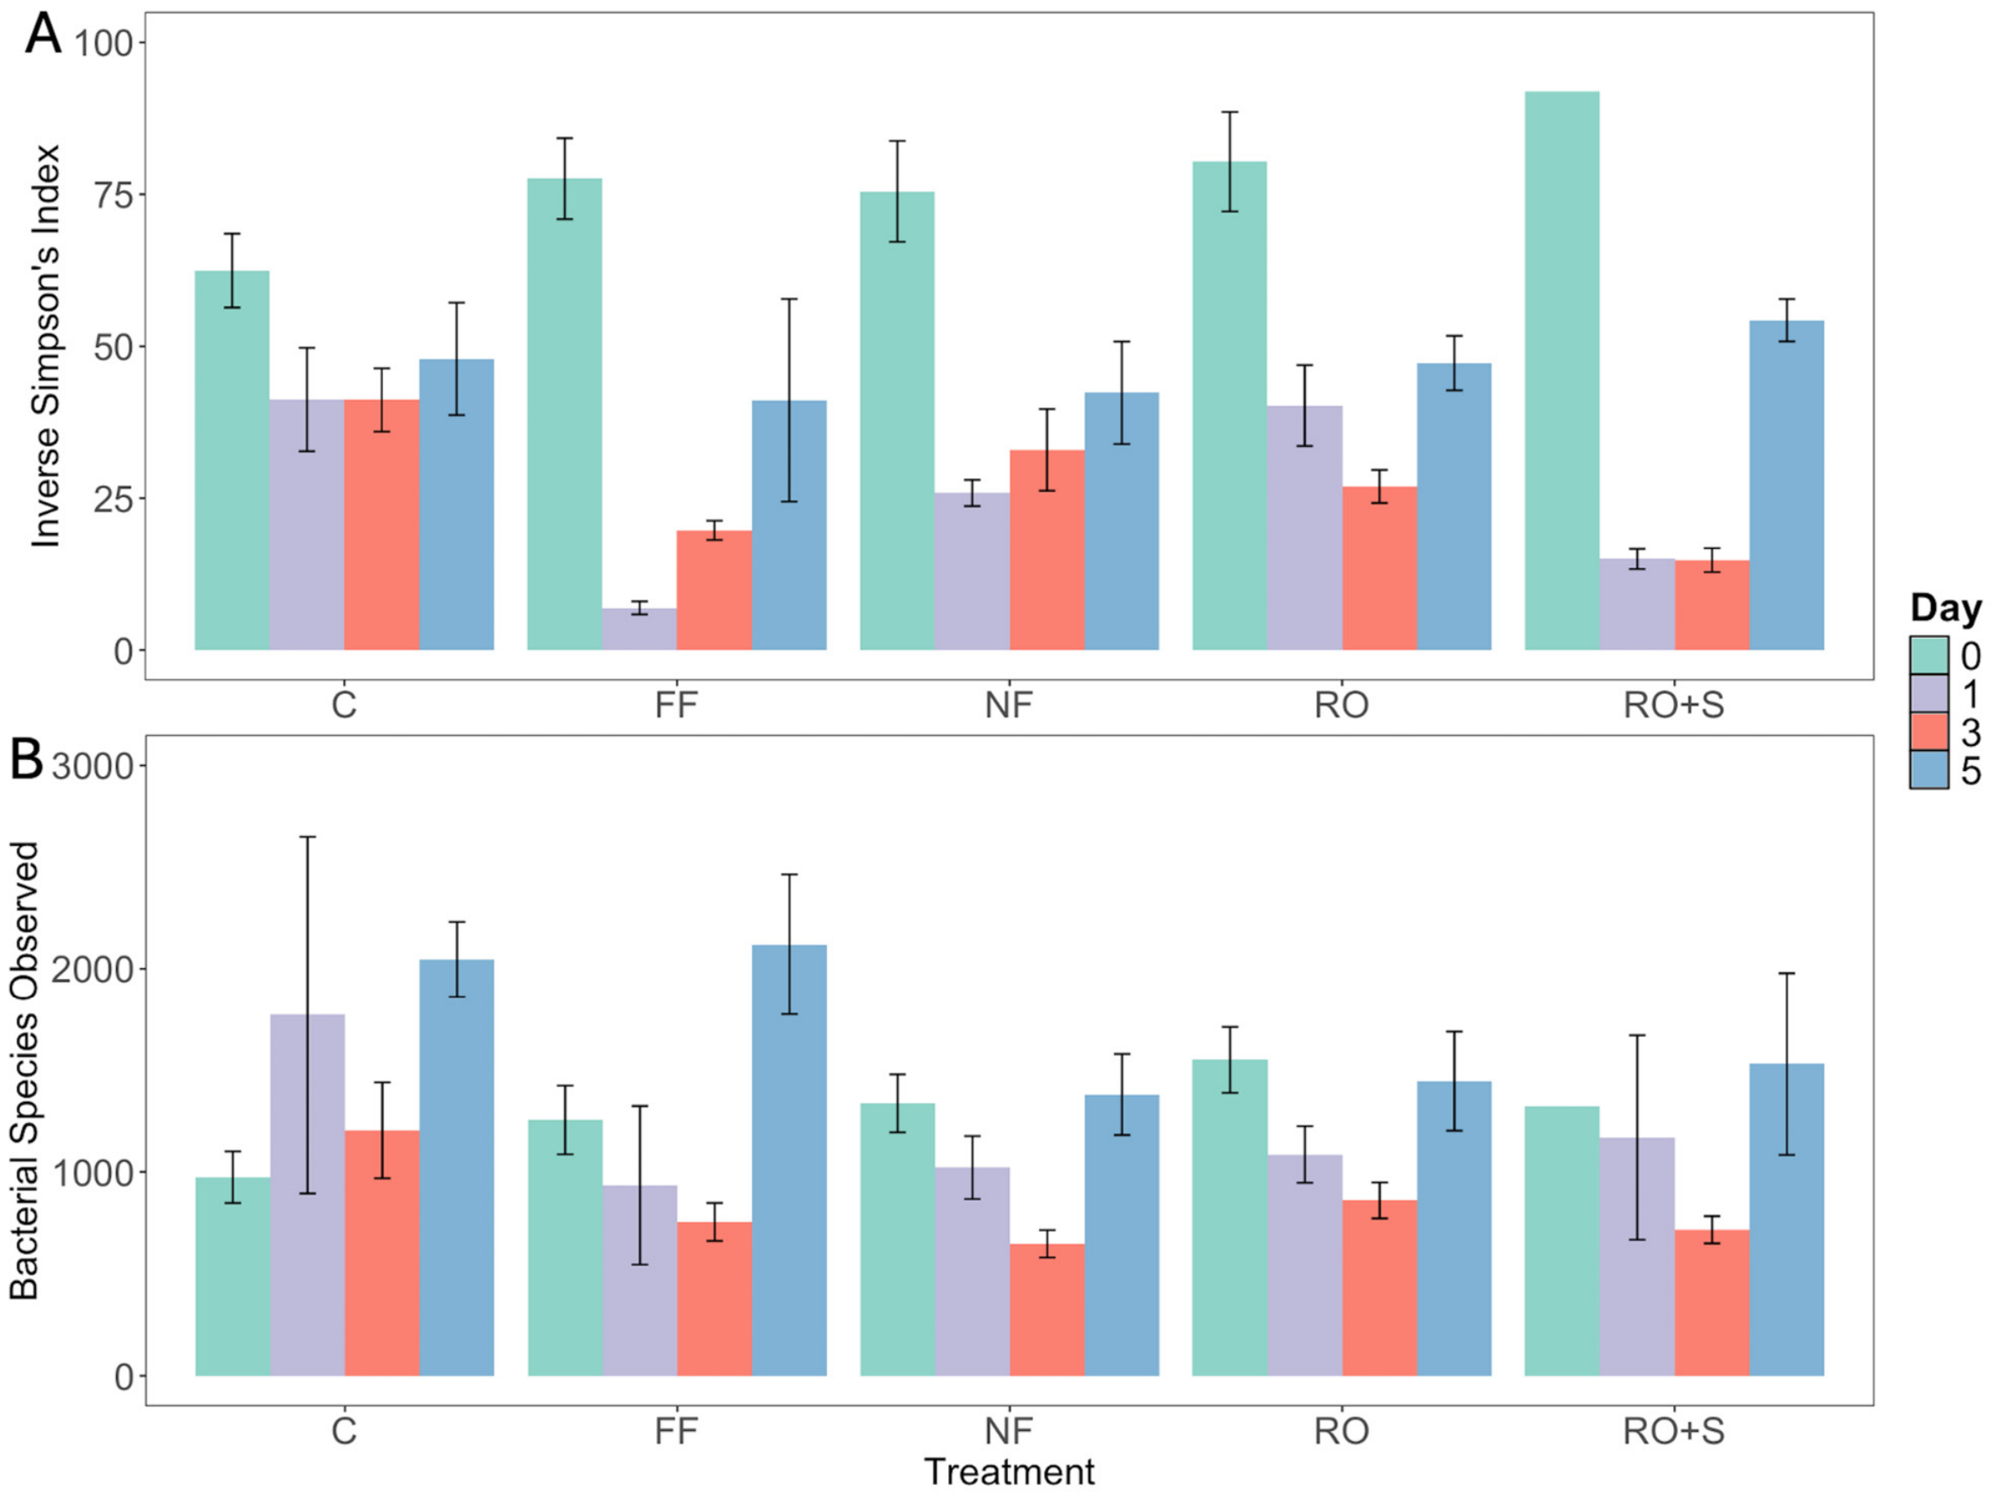
Species diversity (the inverse Simpson’s index) of seawater bacterial communities in microcosms differed by treatment (ANOVA; F = 3.70, p < 0.01) and by day (F = 35.40, p < 0.001), but the treatment x day interaction was not significant (p > 0.05). Species diversity in all treatments declined after day 0, with bacterial species diversity on day 0 significantly higher than all other days (pairwise comparisons; p-adj < 0.001–0.05; Figure 3A). No other pairwise comparisons between individual days were significant (p > 0.05). In terms of treatment effects, bacterial species diversity in seawater in the controls was greater than that in RO+S (p-adj < 0.05), but not significant between any other treatments. Bacterial species diversity in RO+S treatment seawater was also significantly lower than that of RO treatments (p-adj < 0.05).
Species richness (observed number of species based on ASVs) of the seawater bacterial community differed significantly by day overall (F = 6.36, p < 0.01), but no specific pairwise comparisons between days were significant (p > 0.05; Figure 3B). Species richness did not differ by treatment (p > 0.05), and the treatment x day interaction was also not significant (p > 0.05). As a point of comparison, sand collected from microcosms at the end of the experiment on day 5 had significantly greater bacterial species diversity (mean + SE; 466.1 + 12.0) compared to water samples collected on the same day (46.1 + 4.13; F = 990.2, p < 0.001) and significantly greater species richness (4165 + 299; compared to 1713 + 128; F = 71.0, p < 0.001). Species richness and diversity of bacterial communities in the initial sand (2880 + 358 and 459.3 + 35.1, respectively) did not differ significantly from the sand samples collected from microcosms on day 5 (p > 0.05).

3.4. Broad-Level Taxonomic Composition of Bacterial Communities

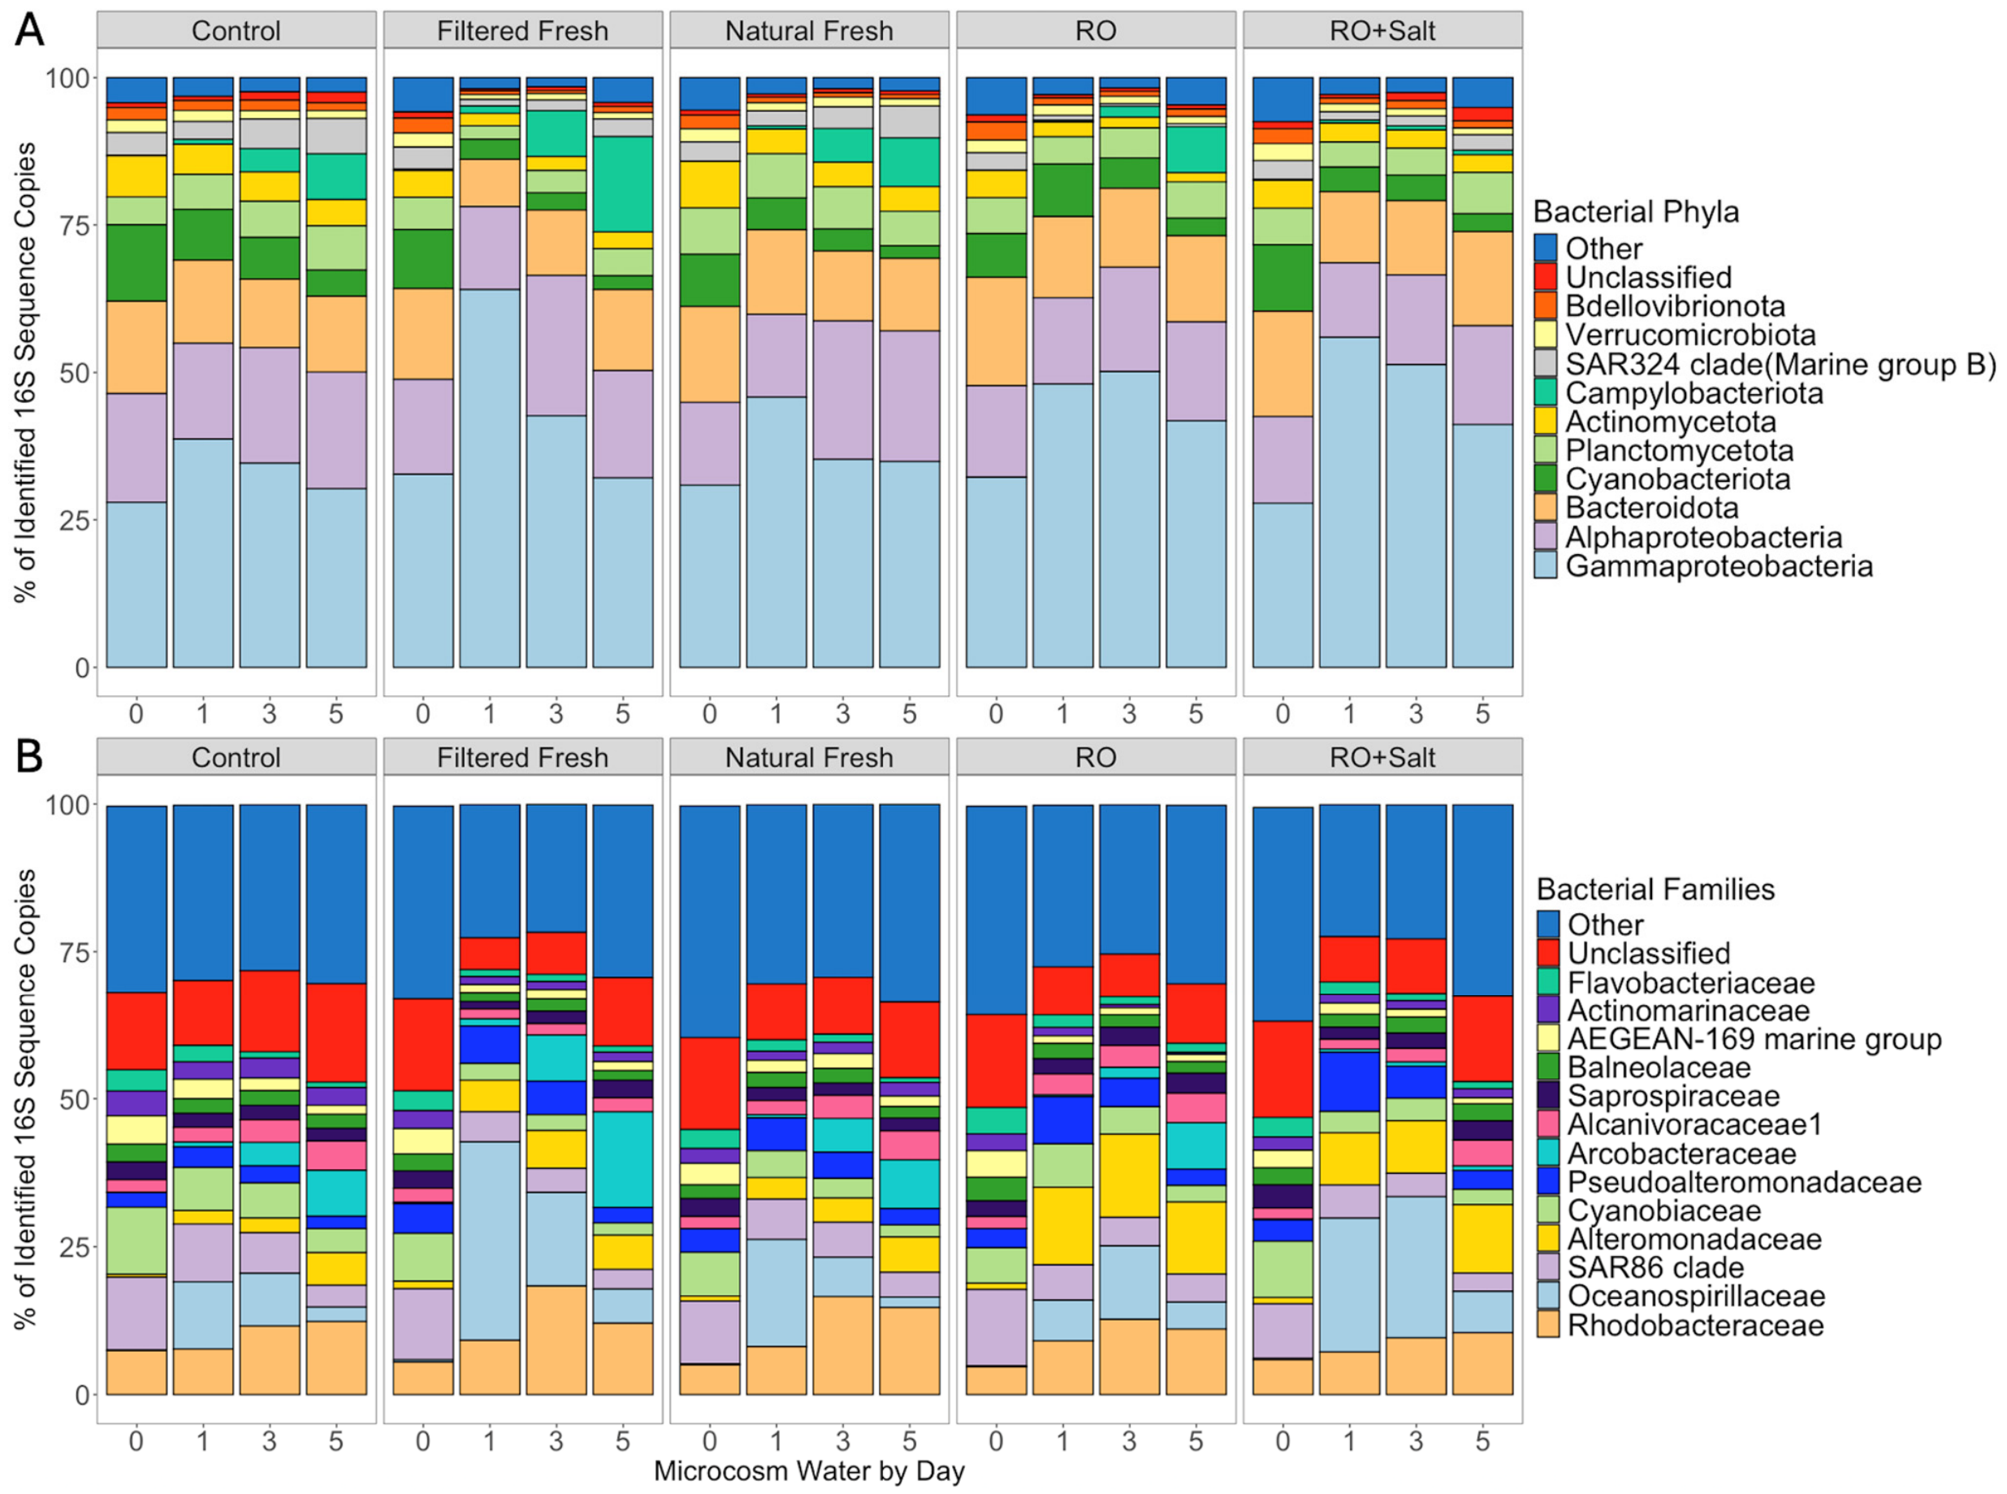
Based on proportions of 16S rRNA gene sequences identified, the most dominant bacterial phyla or other major groups in seawater in the microcosms were Gammaproteobacteria (39.9% of all seawater sequences), followed by Alphaproteobacteria (17.2%), Bacteroidota (13.8%), Cyanobacteriota (5.96%), Planctomycetota (5.64%), Actinomycetota (3.91%), Campylobacteriota (3.24%), SAR324 clade (Marine group B) (2.79%), Verrucomicrobiota (1.59%), and Bdellovibrionota (1.44%), with < 1.0% of sequences unable to be classified at the phylum level (Figure 4A). Other than Campylobacteriota, the proportions of these phyla differed between treatments (MANOVA; F = 3.15–42.9, p < 0.001–0.05). Proportions of all these major groups differed by day (F = 4.58–155.1, p < 0.001), and other than for Cyanobacteriota, Actinomycetota, and Campylobacteriota, there was a significant treatment x day interaction (F = 2.55–6.99, p < 0.001). For treatments other than RO+S, a common trend was an increase in the representation of Campylobacteriota in the seawater community over the course of the experiment, and the proportion of Campylobacteriota was significantly higher on day 3 and day 5 compared to day 0 and day 1 (p-adj < 0.01–0.05). Other general patterns seen across treatments were increases in the proportion of Gammaproteobacteria from day 0 to day 1 and day 3 (p-adj < 0.01) followed by a decline on day 5 (p-adj < 0.001), and a general reduction in the proportion of Cyanobacteriota in the community over the course of the experiment (Figure 4A).
At a finer taxonomic resolution, 13 bacterial families each accounted for at least 2% of the 16S rRNA gene sequences: Rhodobacteraceae (9.96% of sequences), Oceanospirillaceae (9.14%), SAR86 clade (6.74%), Alteromonadaceae (5.74%), Cyanobiaceae (5.09%), Pseudoalteromonadaceae (4.42%), Arcobacteraceae (3.24%), Alcanivoracaceae1 (2.96%), Saprospiraceae (2.61%), Balneolaceae (2.45%), AEGEAN-169 marine group (2.30%), Actinomarinaceae (2.05%), and Flavobacteriaceae (2.0%), with 11.6% of sequences not classified to the family level (Figure 4B). Except for Arcobacteraceae, the proportions of these families in the seawater bacterial community differed between treatments (F = 3.25–40.4, p < 0.001–0.05). There were also differences between days (F = 5.49–180.6, p < 0.001), and a significant treatment x day interaction (F = 2.57–15.1, p < 0.001–0.05) for the proportions of Rhodobacteraceae, Oceanospirillaceae, Alteromonadaceae, Alcanivoracaceae1, Saprospiraceae, Balneolaceae, Actinomarinaceae, and Flavobacteriaceae. Of note were increases in the proportion of Oceanospirillaceae in the seawater bacterial community in all microcosm treatments by day 1 and day 3 (p-adj < 0.001) followed by a decline by day 5 (p-adj < 0.001), as well as increases in the proportion of Alteromonadaceae. As seen for their broader phyla (Campylobacteriota), the proportion of Arcobacteraceae in the community increased over the course of the study (p-adj < 0.001 for all pairwise comparisons of experimental days to day 0) for treatments other than RO + Salt, whereas the proportion of Cyanobiaceae (Cyanobacteriota) generally declined (p-adj < 0.001 for all pairwise comparisons to day 0; Figure 4B).

3.5. Dominant Bacterial Populations (‘Core Microbiome’) in Microcosm Treatments

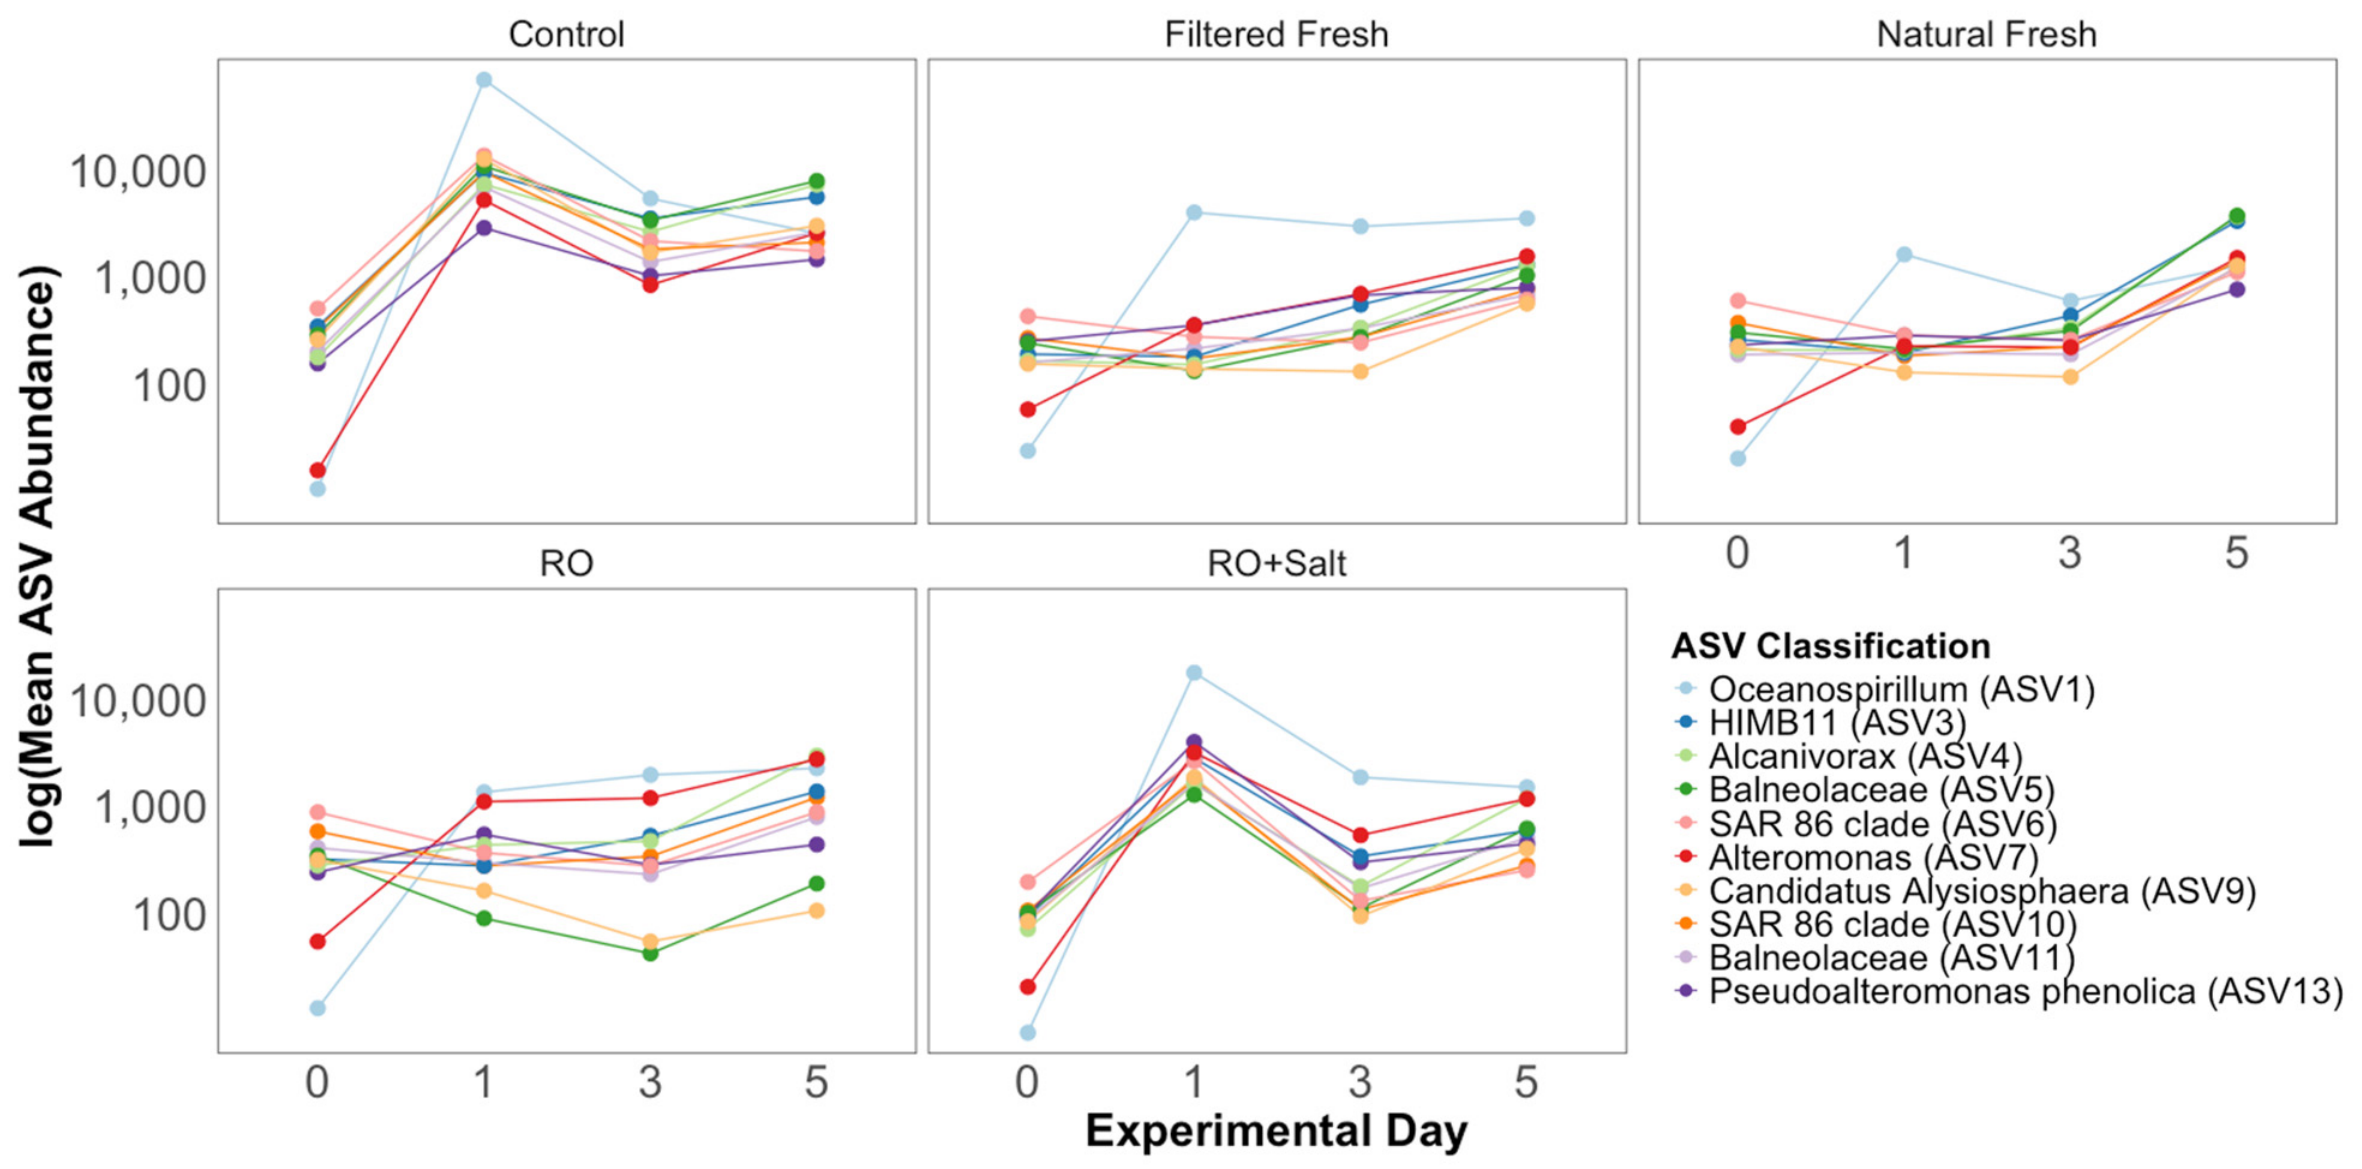
A number of ASVs were detected consistently as accounting for a substantial fraction (> 1% of sequences) of the community in the majority of microcosms, essentially being members of the ‘core microbiome’ of the microcosm seawater bacterial community (Figure 5). Six of these ASVs were identified as members of the Gammaproteobacteria: ASV 4 (Alcanivorax; found in 100% of samples), ASV 10 (SAR 86 clade; 99% of samples), ASV 6 (SAR 86 clade; 96%), ASV 13 (Pseudoalteromonas phenolica; 85%), ASV 1 (Oceanospirillum; 75%), and ASV 7 (Alteromonas; 74%). Other members of the ‘core microbiome’ were ASV 3 (HIMB11; Alphaproteobacteria; 100% of samples), ASV 11 (Balneolaceae; Bacteroidota; 96%), ASV 5 (SAR324 clade; 83%), and ASV 9 (Candidatus Actinomarina; Actinomycetota; 78%). Of these ASVs, the abundance of ASV 3, ASV 4, and ASV 5 differed significantly between treatments (MANOVA; F = 2.50–3.16, p < 0.05), but not between days (p > 0.05). ASV4 was at significantly higher abundance in the control microcosms compared to the FF treatment (p-adj < 0.05), and controls also had higher abundance of ASV5 than found in the FF, RO, or RO+S treatments (p-adj < 0.05).

4. Discussion

Coastal marine ecosystems such as the nearshore environment of the northern Gulf of Mexico are affected by multiple environmental factors that can influence bacterial community structure, diversity, and activity [8,20,33]. Of particular concern is salinity, which can increase in coastal areas from the influence of tropical storms pushing more saline seawater inshore [14] or decrease with increased rainfall and river discharge [13,16,17]. Elevated or reduced levels of salinity can change the composition of microbial communities [9,10] and microbial communities in coastal waters are often structured along salinity gradients [6,7]. However, assessing the effects of changes in salinity on coastal bacterial communities experimentally is difficult in a field setting, with studies generally being largely descriptive and limited to observations after a salinity change has occurred. Thus, we sought to use experimental microcosms to investigate the short-term impacts on bacterial community composition, diversity, and activity that occur during changes in the salinity regime. While salinity changes did have some impacts on seawater bacterial communities, there were also substantial effects related to the length of time of the experiment, which was apparent in untreated controls as well as different salinity treatments.
Marine microbial communities are important in the degradation of organic material, and microbial extracellular enzymes regulate the transformation of dissolved and particulate organic matter [34,35]. The activity of microbial enzymes in coastal systems can vary over short and long timescales, typically in response to environmental conditions [36,37]. Effects of short-term salinity treatments on the seawater activity of three enzymes related to the mineralization of organic carbon (β-glucosidase), phosphate (phosphatase), and carbon and nitrogen (NAGase) varied by enzyme. Only β-glucosidase, an enzyme produced by microorganisms to obtain carbon from cellulose derivatives [38,39], showed a significant treatment effect, with β-glucosidase activity in the reduced-salinity RO treatment being lower than that in controls. All three enzymes did, however, vary in their activity over the course of the experiment, although the temporal pattern varied by enzyme. Changes in enzyme activity from day 0 to day 1 could represent the design in the experiment. Other than the natural freshwater treatment, experimental treatments received sterilized water (whether the water was RO water, RO + salt, or river water), which would effectively have diluted the concentration of prevailing extracellular enzymes by half. Declines in the activity of phosphatase and NAGase from day 0 to day 1 could reflect that dilution, although this reduction in activity was also seen in controls, suggesting that the change was at least in part an initial response of the seawater microbial community. It does make the increases in β-glucosidase activity from day 0 to day 1, in combination with reductions in the activity of NAGase and phosphatase, particularly interesting, and suggests an increased preference for carbon acquisition by the microbial community as the experiment began. Carbon metabolism plays a central role in the bacterial response to both osmotic changes and nutrient stress [40], and the initial increase in β-glucosidase activity could be tied to both factors.
The dilution effect of experimental treatments using sterilized water could also have affected bacterial community structure, particularly diversity. Dilution would be expected to lower bacterial cell counts overall and reduce the chance of detecting rarer bacterial populations (as measured as ASVs). Less template DNA for 16S rRNA gene amplification has been found to reduce the values of alpha diversity metrics such as observed species richness or the inverse Simpson’s index [41], and the inverse Simpson’s index of seawater bacterial communities in all treatments declined from day 0 to day 1. However, this was also seen in control microcosms, which were undiluted, and the NF treatment which received non-sterilized river water that presumably contained other bacterial populations. The inverse Simpson’s index incorporates both species richness and evenness, and if opportunistic bacterial populations became more dominant following the establishment of microcosms, a phenomenon observed in longer-term microcosm experiments [42,43], then we would expect to see reductions in the inverse Simpson’s index over time. Certain ASVs did become more abundant over the course of the five-day experiment, such that when the experiment was considered as a whole, they were the dominant populations found across all samples taken. The taxonomy of these ASVs did not generally match those that have previously been found to be dominant in seawater along the Mississippi Gulf coast, which have often been photosynthetic [22,23], so these microcosm ASVs may represent populations of opportunistic organisms that proliferated soon after microcosms were established. Many of these dominant ASVs were identified as belonging to groups of ubiquitous marine bacteria such as Oceanospirillum, Alcanivorax, or the SAR86 group, and heterotrophs in these groups can thrive in disturbed or polluted marine environments [44,45,46]. More detailed examination of the bacterial community at the start of the experiment shows the more dominant ASVs at that time to be ones that were not abundant enough overall to be considered members of the ‘core’ microbiome, and were not included in our descriptions of ASV changes with treatment or time or treatment over the whole study (e.g., ASV 18, ASV 36, and ASV 123—all identified as Cyanobium PCC-6307, and ASV 40 and ASV 45—both identified as Synechococcus CC9901). Reductions in photosynthetic bacterial taxa could be seen at higher taxonomic levels, with the proportion of Cyanobacteriota in the seawater bacterial community declining as the experiment progressed.
Sand bacterial communities were not the focus of the study, and we did not sample sand in each microcosm throughout the experiment to minimize any disturbance. However, neither species richness nor diversity of the sand bacterial community differed significantly between that in the initial sand and sand collected from microcosms at the end of the experiment. This pattern was seen regardless of experimental treatment. Sand bacterial communities differed significantly from those in seawater and were richer and more diverse, the same patterns seen for field-collected samples [22,23]. Sand bacterial communities in beaches along the Mississippi Gulf coast are also more stable over time than those in seawater [23], and while we did not sample the sand bacterial communities in this microcosm experiment in as much detail as the seawater bacterial community, they did appear to show little effect from experimental treatments or being maintained in microcosms. It is possible that bacterial populations or activity in the sand could have influenced those in the overlying water, but we have not seen evidence of this in this system, where sand and seawater enzyme activity are only minimally correlated and bacterial community structure in the two habitats is fundamentally different [22].
The decline in the proportion of Cyanobacteriota, primarily the Cyanobiaceae family, over time was one of the most noticeable changes in terms of the taxonomic composition of the bacterial community and was apparent in all treatments. Reduced light availability and energy deprivation can cause stress and even programmed cell death in members of the Cyanobacteriota [47,48]. While lysis for cyanobacterial species may not occur until four–six days under dark conditions [48], which would have been at the end of our experiment, the stress of low/no light during microcosm incubations, combined with increases in heterotrophic taxa, likely led to reductions in the proportion of Cyanobacteriota in the seawater community. Other major bacterial taxonomic groups in the seawater microcosms, such as the Gammaproteobacteria, Alphaproteobacteria, Bacteroidota, Planctomycetota, and Actinomycetota, were typical of those reported for marine and coastal environments [6,22], and while proportions of these groups in the community differed significantly overall between salinity treatments, specific changes based on individual treatment types were difficult to discern. One change that was apparent was an increase in the proportion of phylum Campylobacteriota (specifically family Arcobacteraceae) by days 3 and 5, a pattern seen in all treatments that decreased or maintained salinity but not the one (RO+S) that raised it. Originally classified as Epsilonproteobacteria, this bacterial group is diverse and widespread in marine and freshwater environments [49,50], with the abundance of genera such as Arcobacter being negatively correlated with salinity in coastal environments [51]. Increased representation of this group of bacteria in microcosms that did not receive elevated salinity likely represents a combination of the effects of treatment and time within microcosms.
Microcosm-scale approaches are an alternative to field studies and can allow the effects of environmental change to be mimicked in a more controlled laboratory environment to provide a mechanistic understanding of ecological processes [25]. Such studies have been used to examine the effects of changing salinity on various planktonic organisms [52,53,54] and are regarded as a fundamental tool in aquatic microbial ecology [55]. However, container-based studies can lead to a “bottle effect” where restrictions on nutrient exchange and waste removal can lead to variation in microbial activity, successional dynamics, the growth of opportunistic bacteria, and host–phage interactions, even between replicate microcosms undergoing the same treatment [43,55,56,57]. Based on our prior experience in using laboratory microcosms for experiments on freshwater microbial systems [58], we expected that the five-day study would limit bottle effects and allow effects of experimental treatments to be detected, and this length of time is relevant for salinity changes along the Mississippi coast [13]. Others have used five-day microcosm incubation periods to examine the effects of changing salinity on coastal lagoon phytoplankton [54] and photosynthetic microorganisms may survive for a similar length of time, even in complete darkness [48]. However, by the end of the five-day experiment, bacterial communities in all treatments, including untreated controls, were distinct from those at the start of the study, clearly showing an effect of maintaining seawater in the microcosms for five days. Changes in community structure began to appear after just one day and increased over time, a pattern also reported for lake bacterioplankton in biological oxygen demand bottles [43]. Similarly, changes in microbial enzyme activity were apparent after the first day and continued throughout the experiment, even in controls. Thus, while some effects of the salinity treatments on seawater bacterial communities were detected, larger effects were likely caused by the microcosms themselves. The use of five replicate microcosms for each treatment type could mitigate such effects, but in some cases there was substantial variation between replicates and quality control of sequencing (rarefaction) limited the number of replicates for a few treatment x day combinations. Lastly, while seawater was collected from a site that is close to the center of the Mississippi Gulf coast, it was only collected from one site, and seawater bacterial communities at other locations along the coast may show different responses to varying salinity conditions.

5. Conclusions

In microcosms subject to different salinity conditions for five days, seawater bacterial community structure differed between salinity treatments, showing that short-term changes in salinity do influence seawater bacterial communities along the Mississippi Gulf coast. However, treatment alone explained only 10% of the variation in community structure compared to 26% for days in the experiment, suggesting that some changes were likely caused by the microcosms themselves, potentially indicating a “bottle effect”. Changes in community composition included reductions in the proportion of photosynthetic Cyanobacteriota in the community over time, coupled with increases in the representation of heterotrophic bacterial taxa such as Campylobacteriota, although elevated salinity conditions appeared to limit the proliferation of this group. These patterns suggest that reductions in salinity, at least under the conditions assessed in this study, can result in shifts to a more heterotrophic seawater microbial community. While our findings show that bacterial communities in coastal seawater do change in response to different salinity conditions, such changes are difficult to test experimentally and it is difficult to separate treatment-induced effects from those caused by the experiment itself. It should also be kept in mind that bacterial communities in coastal sediments may be dominated by ecologically flexible generalists rather than specialists [59,60], and the same may apply to bacterial communities in coastal seawater. As such, changes in salinity or other environmental conditions may not result in consistent changes in bacterial community composition, such that making specific predictions about salinity-triggered shifts in coastal bacterial communities following environmental change remains challenging.

Author Contributions

Conceptualization, S.N.V. and C.R.J.; methodology, S.N.V., N.A., C.C.W., J.S., and C.R.J.; formal analysis, S.N.V., N.A., C.C.W., J.S., and C.R.J.; investigation, S.N.V., N.A., C.C.W., and J.S.; resources, C.R.J.; data curation, S.N.V.; writing—original draft preparation, S.N.V., N.A., C.C.W., J.S., and C.R.J. writing—review and editing, S.N.V., N.A., C.C.W., J.S., and C.R.J.; visualization, S.N.V.; supervision, S.N.V. and C.R.J.; project administration, C.R.J.; funding acquisition, C.R.J. All authors have read and agreed to the published version of the manuscript.

Funding

This project was paid for with federal funding from the U.S. Department of the Treasury, the Mississippi Department of Environmental Quality, and the Mississippi Based RESTORE Act Center of Excellence under the Resources and Ecosystems Sustainability, Tourist Opportunities, and Revived Economies of the Gulf Coast States Act of 2012 (RESTORE Act). The statements, findings, conclusions, and recommendations are those of the author(s) and do not necessarily reflect the views of the Department of the Treasury, the Mississippi Department of Environmental Quality, or the Mississippi Based RESTORE Act Center of Excellence.

Data Availability Statement

The sequence data for the bacterial communities described in this study are available in the NCBI Sequence Reads Archive under BioProject ID PRJNA1494561.

Conflicts of Interest

The authors declare no conflicts of interest. The funders had no role in the design of the study; in the collection, analyses, or interpretation of data; in the writing of the manuscript; or in the decision to publish the results.

References

  1. Barbier, E.B.; Hacker, S.D.; Kennedy, C.; Koch, E.W.; Stier, A.C.; Silliman, B.R. The value of estuarine and coastal ecosystem services. Ecol. Monogr. 2011, 81, 169–193. [Google Scholar] [CrossRef] [Scilit]
  2. Jickells, T.D. Nutrient biogeochemistry of the coastal zone. Science 1998, 281, 217–222. [Google Scholar] [CrossRef] [Scilit] [PubMed]
  3. Henson, M.W.; Thrash, J.C. Microbial ecology of northern Gulf of Mexico estuarine waters. mSystems 2024, 9, e01318-23. [Google Scholar] [CrossRef] [Scilit] [PubMed]
  4. Broman, E.; Asmala, E.; Carstensen, J.; Pinhassi, J.; Dopson, M. Distinct coastal microbiome populations associated with autochthonous and allochthonous-like dissolved organic matter. Front. Microbiol. 2019, 10, 2579. [Google Scholar] [CrossRef] [Scilit] [PubMed]
  5. Fuhrman, J.A.; Cram, J.A.; Needham, D.M. Marine microbial community dynamics and their ecological interpretation. Nat. Rev. Microbiol. 2015, 13, 133–146. [Google Scholar] [CrossRef] [Scilit] [PubMed]
  6. Herlemann, D.P.R.; Labrenz, M.; Jürgens, K.; Bertilsson, S.; Waniek, J.J.; Andersson, A.F. Transitions in bacterial communities along the 2000 km salinity gradient of the Baltic Sea. ISME J. 2011, 5, 1571–1579. [Google Scholar] [CrossRef] [Scilit] [PubMed]
  7. Wang, H.; Zhang, C.; Chen, F.; Kan, J. Spatial and temporal variations of bacterioplankton in the Chesapeake Bay: A re-examination with high-throughput sequencing analysis. Limnol. Oceanogr. 2020, 65, 3032–3045. [Google Scholar] [CrossRef] [Scilit]
  8. Keneally, C.; Gaget, V.; Chilton, D.; Dornan, T.N.; Hensel, J.; Keneally, A.E.; Kidd, S.P.; Brookes, J.D. Extreme salinity change governs microbial community assembly and interactions. Environ. Microbiol. Rep. 2026, 18, e70301. [Google Scholar] [CrossRef] [Scilit] [PubMed]
  9. Lindh, M.V.; Figueroa, D.; Sjöstedt, J.; Baltar, F.; Lundin, D.; Andersson, A.; Legrand, C.; Pinhassi, J. Transplant experiments uncover Baltic Sea basin-specific responses in bacterioplankton community composition and metabolic activities. Front. Microbiol. 2015, 6, 223. [Google Scholar] [CrossRef] [Scilit] [PubMed]
  10. Walker, J.R.; Woods, A.C.; Pierce, M.K.; Steichen, J.L.; Quigg, A.; Kaiser, K.; Labonté, J.M. Functionally diverse microbial communities show resilience in response to a record-breaking rain event. ISME Commun. 2022, 2, 81. [Google Scholar] [CrossRef] [Scilit] [PubMed]
  11. Vinogradov, S.; Vinogradova, N.; Kamenkovich, V.; Nechaev, D. Temperature and salinity variability in the Mississippi Bight. Mar. Technol. Soc. J. 2004, 38, 52–60. [Google Scholar] [CrossRef] [Scilit]
  12. Armandei, M.; Linhoss, A.C.; Camacho, R.A. Hydrodynamic modeling of the Western Mississippi Sound using a linked model system. Reg. Stud. Mar. Sci. 2021, 44, 101685. [Google Scholar] [CrossRef] [Scilit]
  13. Gautam, A.; Mustafa, Z.; Talchabhadel, R. Satellite-derived salinity dynamics in the Mississippi Sound: A Hurricane Nate case study. Earth Syst. Environ. 2026, 10, 7935–7951. [Google Scholar] [CrossRef] [Scilit]
  14. Feher, L.C.; Osland, M.J.; Swarzenski, C.M. Estuarine salinity extremes: Using the Coastal Salinity Index to quantify the role of droughts, floods, hurricanes, and freshwater flow alteration. Estuar. Coast. Shelf Sci. 2023, 291, 108445. [Google Scholar] [CrossRef] [Scilit]
  15. Cambazoglu, M.K.; Soto, I.M.; Howden, S.D.; Dzwonkowski, B.; Fitzpatrick, P.J.; Arnone, R.A.; Jacobs, G.A.; Lau, Y.H. Inflow of shelf waters into the Mississippi Sound and Mobile Bay estuaries in October 2015. J. Appl. Remote Sens. 2017, 11, 032410. [Google Scholar] [CrossRef] [Scilit]
  16. Liu, Y.; Guo, W.; Wei, C.; Huang, H.; Nan, F.; Liu, X.; Liu, Q.; Lv, J.; Feng, J.; Xie, S. Rainfall-induced changes in aquatic microbial communities and stability of dissolved organic matter: Insight from a Fen river analysis. Environ. Res. 2024, 246, 118107. [Google Scholar] [CrossRef] [Scilit] [PubMed]
  17. McKee, M.; White, J.R.; Putnam-Duhon, L.A. Simulated storm surge effects on freshwater coastal wetland soil porewater salinity and extractable ammonium levels: Implications for marsh recovery after storm surge. Estuar. Coast. Shelf Sci. 2016, 181, 338–344. [Google Scholar] [CrossRef] [Scilit]
  18. Nordio, G.; Frederiks, R.; Hingst, M.; Carr, J.; Kirwan, M.; Gedan, K.; Michael, H.; Fagherazzi, S. Frequent storm surges affect the groundwater of coastal ecosystems. Geophys. Res. Lett. 2023, 50, e2022GL100191. [Google Scholar] [CrossRef] [Scilit]
  19. Posadas, B.C.; Posadas, B.K.A. Economic impacts of the opening of the Bonnet Carre Spillway to the Mississippi oyster fishery. J. Food Distrib. Res. 2017, 48, 42–45. [Google Scholar]
  20. Linhoss, A.; Mickle, P.; Osorio, R.J. Simulating how freshwater diversions impact salinity regimes in an estuarine system. J. Mar. Sci. Eng. 2023, 11, 2349. [Google Scholar] [CrossRef] [Scilit]
  21. Basha, E.; Vaughn, S.N.; Pavlovsky, J.C.; Roth, H.; Jackson, C.R. Fine-scale patterns in bacterial communities on a Gulf Coast beach. Coasts 2025, 5, 34. [Google Scholar] [CrossRef] [Scilit]
  22. Vaughn, S.N.; Pavlovsky, J.C.; Jackson, C.R. Bacterial communities in sand and seawater of northern gulf coast beaches: Temporal, spatial, and environmental influences. Environ. Microbiol. Rep. 2026, 18, e70309. [Google Scholar] [CrossRef] [Scilit] [PubMed]
  23. Vaughn, S.N.; Pavlovsky, J.C.; Heiman, J.A.; Jackson, C.R. Contrasting spatial and temporal structuring of seawater and sediment bacterial communities in coastal environments. Sci. Rep. 2026, 16, 14586. [Google Scholar] [CrossRef] [Scilit] [PubMed]
  24. Wang, Z.; Juarez, D.L.; Pan, J.-F.; Blinebry, S.K.; Gronniger, J.; Clark, J.S.; Johnson, Z.I.; Hunt, D.E. Microbial communities across nearshore to offshore coastal transects are primarily shaped by distance and temperature. Environ. Microbiol. 2019, 21, 3862–3872. [Google Scholar] [CrossRef] [Scilit] [PubMed]
  25. Caracciolo, A.B.; Bottoni, P.; Grenni, P. Microcosm studies to evaluate microbial potential to degrade pollutants in soil and water ecosystems. Microchem. J. 2013, 107, 126–130. [Google Scholar] [CrossRef] [Scilit]
  26. Jackson, C.R.; Tyler, H.L.; Millar, J.J. Determination of microbial extracellular enzyme activity in waters, soils, and sediments using high throughput microplate assays. J. Vis. Exp. 2013, 80, 50399. [Google Scholar] [CrossRef] [Scilit] [PubMed]
  27. Jackson, C.R.; Stone, B.W.G.; Tyler, H.L. Emerging perspectives on the natural microbiome of fresh produce vegetables. Agriculture 2015, 5, 170–187. [Google Scholar] [CrossRef] [Scilit]
  28. Vaughn, S.N.; Hopper, G.W.; González, I.S.; Bucholz, J.R.; Garrick, R.C.; Jackson, C.R. Introduction into natural environments shifts the gut microbiome of captivity-raised filter-feeding bivalves. ISME Commun. 2024, 4, ycae125. [Google Scholar] [CrossRef] [Scilit] [PubMed]
  29. Kozich, J.J.; Westcott, S.L.; Baxter, N.T.; Highlander, S.K.; Schloss, P.D. Development of a dual-index sequencing strategy and curation pipeline for analyzing amplicon sequence data on the MiSeq Illumina sequencing platform. Appl. Environ. Microbiol. 2013, 79, 5112–5120. [Google Scholar] [CrossRef] [Scilit] [PubMed]
  30. Callahan, B.J.; McMurdie, P.J.; Rosen, M.J.; Han, A.W.; Johnson, A.J.A.; Holmes, S.P. DADA2: High-resolution sample inference from Illumina amplicon data. Nat. Methods 2016, 13, 581–583. [Google Scholar] [CrossRef] [Scilit] [PubMed]
  31. Quast, C.; Pruesse, E.; Yilmaz, P.; Gerken, J.; Schweer, T.; Yarza, P.; Peplies, J.; Glöckner, F.O. The SILVA ribosomal RNA gene database project: Improved data processing and web-based tools. Nucleic Acids Res. 2013, 41, D590–D596. [Google Scholar] [CrossRef] [Scilit] [PubMed]
  32. Oren, A.; Garrity, G.M. Valid publication of the names of forty-two phyla of prokaryotes. Int. J. Syst. Evol. Microbiol. 2021, 71, 005056. [Google Scholar] [CrossRef] [Scilit] [PubMed]
  33. Traving, S.J.; Bentzon-Tilia, M.; Knudsen-Leerbeck, H.; Mantikci, M.; Hansen, J.L.S.; Stedmon, C.A.; Sørensen, H.; Markager, S.; Riemann, L. Coupling bacterioplankton populations and environment to community function in coastal temperate waters. Front. Microbiol. 2016, 7, 1533. [Google Scholar] [CrossRef] [Scilit] [PubMed]
  34. Arnosti, C. Microbial extracellular enzymes and the marine carbon cycle. Ann. Rev. Mar. Sci. 2010, 3, 401–425. [Google Scholar] [CrossRef] [Scilit] [PubMed]
  35. Arnosti, C.; Bell, C.; Moorhead, D.L.; Sinsabaugh, R.L.; Steen, A.D.; Stromberger, M.; Wallenstein, M.; Weintraub, M.N. Extracellular enzymes in terrestrial, freshwater, and marine environments: Perspectives on system variability and common research needs. Biogeochemistry 2014, 117, 5–21. [Google Scholar] [CrossRef] [Scilit]
  36. Karner, M.; Rassoulzadegan, F. Extracellular enzyme activity: Indications for high short-term variability in a coastal marine ecosystem. Microb. Ecol. 1995, 30, 143–156. [Google Scholar] [CrossRef] [Scilit] [PubMed]
  37. Allison, S.D.; Chao, Y.; Farrara, J.D.; Hatosy, S.; Martiny, A.C. Fine-scale temporal variation in marine extracellular enzymes of coastal southern California. Front. Microbiol. 2012, 3, 301. [Google Scholar] [CrossRef] [Scilit] [PubMed]
  38. Ketudat Cairns, J.R.; Esen, A. β-Glucosidases. Cell. Mol. Life Sci. 2010, 67, 3389–3405. [Google Scholar] [CrossRef] [Scilit] [PubMed]
  39. Zang, X.; Liu, M.; Fan, Y.; Xu, J.; Xu, X.; Li, H. The structural and functional contributions of β-glucosidase-producing microbial communities to cellulose degradation in composting. Biotechnol. Biofuels 2018, 11, 51. [Google Scholar] [CrossRef] [Scilit] [PubMed]
  40. Brauer, A.M.; Shi, H.; Levin, P.A.; Huang, K.C. Physiological and regulatory convergence between osmotic and nutrient stress responses in microbes. Curr. Opin. Cell Biol. 2023, 81, 102170. [Google Scholar] [CrossRef] [Scilit] [PubMed]
  41. Multinu, F.; Harrington, S.C.; Chen, J.; Jeraldo, P.R.; Johnson, S.; Chia, N.; Walther-Antonio, M.R. Systematic bias introduced by genomic DNA template dilution in 16S rRNA gene-targeted microbiota profiling in human stool homogenates. mSphere 2018, 3, e00560-17. [Google Scholar] [CrossRef] [Scilit] [PubMed]
  42. Massana, R.; Pedrόs, A.C.; Casamayor, E.O.; Gasol, J.M. Changes in marine bacterioplankton phylogenetic composition during incubations designed to measure biogeochemically significant parameters. Limnol. Oceanogr. 2001, 46, 1181–1188. [Google Scholar] [CrossRef] [Scilit]
  43. Baltar, F.; Lindh, M.V.; Parparov, A.; Berman, T.; Pinhassi, J. Prokaryotic community structure and respiration during long-term incubations. Microbiologyopen 2012, 1, 214–224. [Google Scholar] [CrossRef] [Scilit] [PubMed]
  44. Hara, A.; Syutsubo, K.; Harayama, S. Alcanivorax which prevails in oil-contaminated seawater exhibits broad substrate specificity for alkane degradation. Environ. Microbiol. 2003, 5, 746–753. [Google Scholar] [CrossRef] [Scilit] [PubMed]
  45. Baltar, F.; Palovaara, J.; Vila-Costa, M.; Salazar, G.; Calvo, E.; Pelejero, C.; Marrasé, C.; Gasol, J.M.; Pinhassi, J. Response of rare, common and abundant bacterioplankton to anthropogenic perturbations in a Mediterranean coastal site. FEMS Microbiol. Ecol. 2015, 91, fiv058. [Google Scholar] [CrossRef] [Scilit] [PubMed]
  46. Zadjelovic, V.; Chhun, A.; Quareshy, M.; Silvano, E.; Hernandez-Fernaud, J.R.; Aguilo-Ferretjans, M.M.; Bosch, R.; Dorador, C.; Gibson, M.I.; Christie-Oleza, J.A. Beyond oil degradation: Enzymatic potential of Alcanivorax to degrade natural and synthetic polyesters. Environ. Microbiol. 2020, 22, 1356–1369. [Google Scholar] [CrossRef] [Scilit] [PubMed]
  47. Hood, R.D.; Higgins, S.A.; Flamholz, A.; Nichols, R.J.; Savage, D.F. The stringent response regulates adaptation to darkness in the cyanobacterium Synechococcus elongatus. Proc. Natl. Acad. Sci. USA 2016, 113, E4867–E4876. [Google Scholar] [CrossRef] [Scilit] [PubMed]
  48. Zorz, J.; Paquette, A.J.; Gillis, T.; Kouris, A.; Khot, V.; Demirkaya, C.; De La Hoz Siegler, H.; Strous, M.; Vadlamani, A. Coordinated proteome change precedes cell lysis and death in a mat-forming cyanobacterium. ISME J. 2023, 17, 2403–2414. [Google Scholar] [CrossRef] [Scilit] [PubMed]
  49. Campbell, B.J.; Engel, A.S.; Porter, M.L.; Takai, K. The versatile ε-proteobacteria: Key players in sulphidic habitats. Nat. Rev. Microbiol. 2006, 4, 458–468. [Google Scholar] [CrossRef] [Scilit] [PubMed]
  50. Han, Y.; Perner, M. The globally widespread genus Sulfurimonas: Versatile energy metabolisms and adaptations to redox clines. Front. Microbiol. 2015, 6, 989. [Google Scholar] [CrossRef] [Scilit] [PubMed]
  51. Guo, Y.; Wu, C.; Sun, J. Pathogenic bacteria significantly increased under oxygen depletion in coastal waters: A continuous observation in the central Bohai Sea. Front. Microbiol. 2022, 13, 1035904. [Google Scholar] [CrossRef] [Scilit] [PubMed]
  52. Greenwald, G.M.; Hurlbert, S.H. Microcosm analysis of salinity effects on coastal lagoon plankton assemblages. Hydrobiologia 1993, 267, 307–335. [Google Scholar] [CrossRef] [Scilit]
  53. Barnes, B.D.; Wurtsbaugh, W.A. The effects of salinity on plankton and benthic communities in the Great Salt Lake, Utah, USA: A microcosm experiment. Can. J. Fish. Aquat. Sci. 2015, 72, 807–817. [Google Scholar] [CrossRef] [Scilit]
  54. Ligorini, V.; Garrido, M.; Malet, N.; Simon, L.; Alonso, L.; Bastien, R.; Aiello, A.; Cecchi, P.; Pasqualini, V. Response of phytoplankton communities to variation in salinity in a small Mediterranean coastal lagoon: Future management and foreseen climate change consequences. Water 2023, 15, 3214. [Google Scholar] [CrossRef] [Scilit]
  55. Pound, H.L.; Martin, R.M.; Zepernick, B.N.; Christopher, C.J.; Howard, S.M.; Castro, H.F.; Campagna, S.R.; Boyer, G.L.; Bullerjahn, G.S.; Chaffin, J.D.; et al. Changes in microbiome activity and sporadic viral infection help explain observed variability in microcosm studies. Front. Microbiol. 2022, 13, 809989. [Google Scholar] [CrossRef] [Scilit] [PubMed]
  56. Stewart, F.J.; Dalsgaard, T.; Young, C.R.; Thamdrup, B.; Revsbech, N.P.; Ulloa, O.; Canfield, D.E.; DeLong, E.F. Experimental incubations elicit profound changes in community transcription in OMZ bacterioplankton. PLoS ONE 2012, 7, e37118. [Google Scholar] [CrossRef] [Scilit] [PubMed]
  57. Ionescu, D.; Bizic-Ionescu, M.; Khalili, A.; Malekmohammadi, R.; Morad, M.R.; de Beer, D.; Grossart, H.-P. A new tool for long-term studies of POM-bacteria interactions: Overcoming the century-old Bottle Effect. Sci. Rep. 2015, 5, 14706. [Google Scholar] [CrossRef] [Scilit] [PubMed]
  58. Vaughn, S.N.; Jackson, C.R. Freshwater macroinvertebrates drive planktonic bacterial community composition and activity in microcosms. Freshw. Biol. 2025, 70, e14369. [Google Scholar] [CrossRef] [Scilit]
  59. Chen, Y.J.; Leung, P.M.; Wood, J.L.; Bay, S.K.; Hugenholtz, P.; Kessler, A.J.; Shelley, G.; Waite, D.W.; Franks, A.E.; Cook, P.L.; et al. Metabolic flexibility allows bacterial habitat generalists to become dominant in a frequently disturbed ecosystem. ISME J. 2021, 15, 2986–3004. [Google Scholar] [CrossRef] [Scilit] [PubMed]
  60. Chen, Y.J.; Leung, P.M.; Cook, P.L.; Wong, W.W.; Hutchinson, T.; Eate, V.; Kessler, A.J.; Greening, C. Hydrodynamic disturbance controls microbial community assembly and biogeochemical processes in coastal sediments. ISME J. 2022, 16, 750–763. [Google Scholar] [CrossRef] [Scilit] [PubMed]
Figure 1. Microbial extracellular enzyme activity (nmol h−1 mL−1) in experimental seawater microcosms over five days. In addition to untreated controls (C), microcosms were subject to three treatments that lowered salinity (addition of filtered and autoclaved freshwater (FF), addition of natural freshwater (NF), or addition of autoclaved reverse osmosis water (RO)), as well as one treatment that elevated salinity through the addition of RO water plus salt/artificial seawater (RO+S). Enzyme activity is shown for β-glucosidase (A), Phosphatase (B) and N-acetylglucosaminidase (C), and is the mean of five replicate microcosms per treatment, with error bars indicating standard error.
Jmse 14 01687 g001
Figure 2. NMDS ordinations based on Bray–Curtis dissimilarity scores of seawater bacterial communities in experimental seawater microcosms over five days. In addition to untreated controls (C), microcosms were subject to three treatments that lowered salinity (addition of filtered and autoclaved freshwater (FF), addition of natural freshwater (NF), or addition of autoclaved reverse osmosis water (RO)), as well as one treatment that elevated salinity through the addition of RO water plus salt/artificial seawater (RO+S). Community structure was assessed through 16S rRNA gene sequencing on days 0, 1, 3, and 5, and compared overall and to that of the sand collected initially (Initial) and in the same microcosms at the end of the experiment (day 5; (A)). Other panels show the same seawater bacterial communities separated by the different treatments on each day (B) or by the different days for each treatment (C).
Jmse 14 01687 g002
Figure 3. Alpha diversity of seawater bacterial communities in experimental seawater microcosms over five days. In addition to untreated controls (C), microcosms were subject to three treatments that lowered salinity (addition of filtered and autoclaved freshwater (FF), addition of natural freshwater (NF), or addition of autoclaved reverse osmosis water (RO)), as well as one treatment that elevated salinity through the addition of RO water plus salt/artificial seawater (RO+S). Alpha diversity is shown as the inverse Simpson’s index (A) and as observed species richness (B), with a mean and standard error of n = 3–5 retained replicates shown per treatment per day with the exception of the day 0 RO+S treatment, for which n = 1.
Jmse 14 01687 g003
Figure 4. Composition of seawater bacterial communities in experimental seawater microcosms over five days. In addition to untreated controls, microcosms were subject to three treatments that lowered salinity (addition of filtered and autoclaved freshwater (Filtered Fresh), addition of natural freshwater (Natural Fresh), or addition of autoclaved reverse osmosis water (RO)), as well as one treatment that elevated salinity through the addition of RO water plus salt/artificial seawater (RO + Salt). Bars show the proportions of bacterial phyla (A) or families (B) in the community as a percentage of 16S rRNA gene sequences recovered for five replicate microcosms per treatment. Other represents any phyla that individually accounted for < 1% of the total sequences recovered (A) or families that accounted for < 2% (B).
Jmse 14 01687 g004
Figure 5. Dominant ASVs in seawater bacterial communities in experimental seawater microcosms over five days. In addition to untreated controls, microcosms were subject to three treatments that lowered salinity (addition of filtered and autoclaved freshwater (Filtered Fresh), addition of natural freshwater (Natural Fresh), or addition of autoclaved reverse osmosis water (RO)), as well as one treatment that elevated salinity through the addition of RO water plus salt/artificial seawater (RO + Salt). Values are the mean number (log scale) of sequences recovered that corresponded to that ASV from five replicate microcosms per treatment.
Jmse 14 01687 g005
Table 1. Summary of experimental treatments and their effective salinity in seawater microcosms used to examine the effects of salinity changes on bacterial communities in coastal seawater.
Treatment Effective Salinity
Control (C)Unamended seawater19.8 ppt
Natural Fresh (NF)Seawater + freshwater11.6 ppt
Filtered Fresh (FF)Seawater + sterilized freshwater11.6 ppt
Reverse Osmosis (RO)Seawater + sterilized purified water9.9 ppt
Reverses Osmosis + Salt (RO+S)Seawater + sterilized artificial seawater25.9 ppt
Disclaimer/Publisher’s Note: The statements, opinions and data contained in all publications are solely those of the individual author(s) and contributor(s) and not of MDPI and/or the editor(s). MDPI and/or the editor(s) disclaim responsibility for any injury to people or property resulting from any ideas, methods, instructions or products referred to in the content.