Article

Report-Supported Factor Pathways in Ship Collision Accidents: An STPA-Based Constrained Network Motif Analysis

1
School of Navigation and Naval Architecture, Dalian Ocean University, Dalian 116023, China
2
South China Sea Fisheries Research Institute, Chinese Academy of Fishery Sciences, Guangzhou 510300, China
3
College of Ocean and Meteorology, Guangdong Ocean University, Zhanjiang 524088, China
*
Authors to whom correspondence should be addressed.
These authors contributed equally to this work.
J. Mar. Sci. Eng. 2026, 14(17), 1620; https://doi.org/10.3390/jmse14171620
Submission received: 3 August 2026 / Revised: 26 August 2026 / Accepted: 31 August 2026 / Published: 2 September 2026
(This article belongs to the Section Ocean Engineering)

Abstract

Ship collisions emerge from interactions among human, vessel, environmental, and management factors. Aggregate accident networks can, however, combine relations across events and evidence levels, obscuring whether recurrent topology represents event-level pathways. We coded 364 official Chinese collision investigation reports using Systems-Theoretic Process Analysis and constructed a directed binary network of 46 factors and 269 relations. Induced triads were evaluated against degree-preserving and functional block-preserving null models and then traced to accidents, responsible vessels, and responsibility chains. Four triads, 021C, 021U, 021D, and 030T, were overrepresented in the primary network. Frequency weighting preserved H1, H9, and H19 as the three highest-ranked nodes by total strength, whereas only 030T remained concentrated on high-support edges after block-stratified weight permutation. Evidence-tier filtering was more restrictive: the cumulative E1–E4 network retained 112 relations, and none of the four motifs remained significant under the functional block-preserving null model. Event-level support was strongest for 021C and 021U, whereas 030T mainly reflected aggregate transitive closure. The primary motifs therefore characterize structures generated by the complete report coding framework, not experimentally identified causal mechanisms. Combining constrained topology, recurrence weights, evidence grading, and event-level back-tracing provides an auditable basis for safety questions without conflating structural enrichment with causal strength.

1. Introduction

Ship collisions are a major maritime safety concern and arise through dynamic interactions among crew behavior, vessel condition, the navigational environment, ship–shore management, and regulatory constraints. Global accident and fleet data show that vessel size, age, type, and operating area affect collision probability [1]. Semantic analyses of accident reports link proper lookout, situation awareness, collision risk assessment, and collision avoidance actions within accident evolution [2]. AIS-based studies further show that risk assessment depends on relative vessel motion and the spatial and temporal characteristics of encounters [3]. Understanding how upstream management constraints propagate through information acquisition, risk assessment, and maneuver execution is therefore important for both causal explanation and maritime safety governance.
These considerations motivate an analytical framework that connects systems-theoretic control semantics with evidence-bounded structural inference. We therefore developed a four-stage framework comprising STPA-guided evidence coding, directed accident evidence network construction, constrained motif inference under two null models, and multilevel event validation.
Relative to studies that primarily rank causal factors by frequency, severity, probability, or centrality, this study makes three specific contributions:
  • The framework integrates STPA-guided evidence coding with degree-preserving and functional block-preserving null models to test whether local configurations exceed explicit structural expectations.
  • Event-level back-tracing connects enriched triads to individual accidents, responsible vessels, and chains of responsibility, thereby distinguishing aggregate topological enrichment from event-level evidential support.
  • Frequency-weighted and evidence-tier sensitivity analyses assess robustness to relation recurrence and relation-evidence strength, respectively, while retaining the directed binary network as the primary analytical representation.
Together, these contributions limit mechanistic overinterpretation and provide an auditable basis for identifying multilevel maritime safety priorities.

2. Related Work

Previous studies provide complementary foundations for this problem. Chauvin et al. used HFACS to identify hierarchical links between human actions and organizational factors in maritime collisions [4]. Fan et al. used a data-driven Bayesian network to represent probabilistic relations among maritime human factors [5]. Recent complex network studies have identified and ranked influential collision causes using node significance, frequency, severity and probability [6]. Other studies have used semi-automated methods to extract risk factor propagation paths from investigation reports [7] and have integrated network topology with DEMATEL to characterize accident evolution and risk influence [8]. In system safety research, reviews have examined the use and methodological completeness of STAMP, STPA, and CAST in complex sociotechnical systems [9]. Comparative work in rail safety similarly shows that systems approaches broaden the analytical boundary and reveal interactions among actors [10]. Other studies have combined STAMP with fuzzy DEMATEL to quantify control hierarchy relations [11] or used STPA as the structural basis for Bayesian models of remote pilotage risk propagation [12]. Together, these advances have shifted accident analysis from isolated error tracing toward multilevel, process-based, and quantitative explanation.
Three related problems nevertheless constrain mechanistic interpretation of ship collision networks. First, centrality and node removal results from a single observed network cannot determine whether frequent local structures arise mechanically from heterogeneous in-degrees, out-degrees, or block-to-block edge counts. Network motifs provide basic units for detecting recurrent local structure [13], but the selected null model constraints materially affect the interpretation of structural significance [14]. Second, aggregation across accidents can combine edges from different accidents, vessels at fault, or chains of responsibility within one triad, creating a scale mismatch when global counts are interpreted as event mechanisms. Third, published applications of STAMP and STPA sometimes omit analytical steps or leave the interface between control semantics and quantitative models unclear [15]. Accident causation models are purpose-specific abstractions whose explanatory value depends on explicit model boundaries, relation rules, and evidence levels [16]. A suitable framework must therefore control basic network structure while returning local configurations to the underlying accident evidence.
Structured reviews of maritime human factors call for stronger evidence on factor interactions, intervention effects, and maritime-specific data [17]. Reviews of human-autonomy interaction also identify supervisory roles and automation boundaries as central system safety concerns [18]. Systems-theoretic methods have further been used to represent coupled safety and security controls for autonomous ships [19]. Recent work has combined systems theory with association rules and Bayesian trend analysis to identify maritime accident patterns and their evolution [20].

3. Materials and Methods

3.1. Integrated STPA and Complex Network Framework

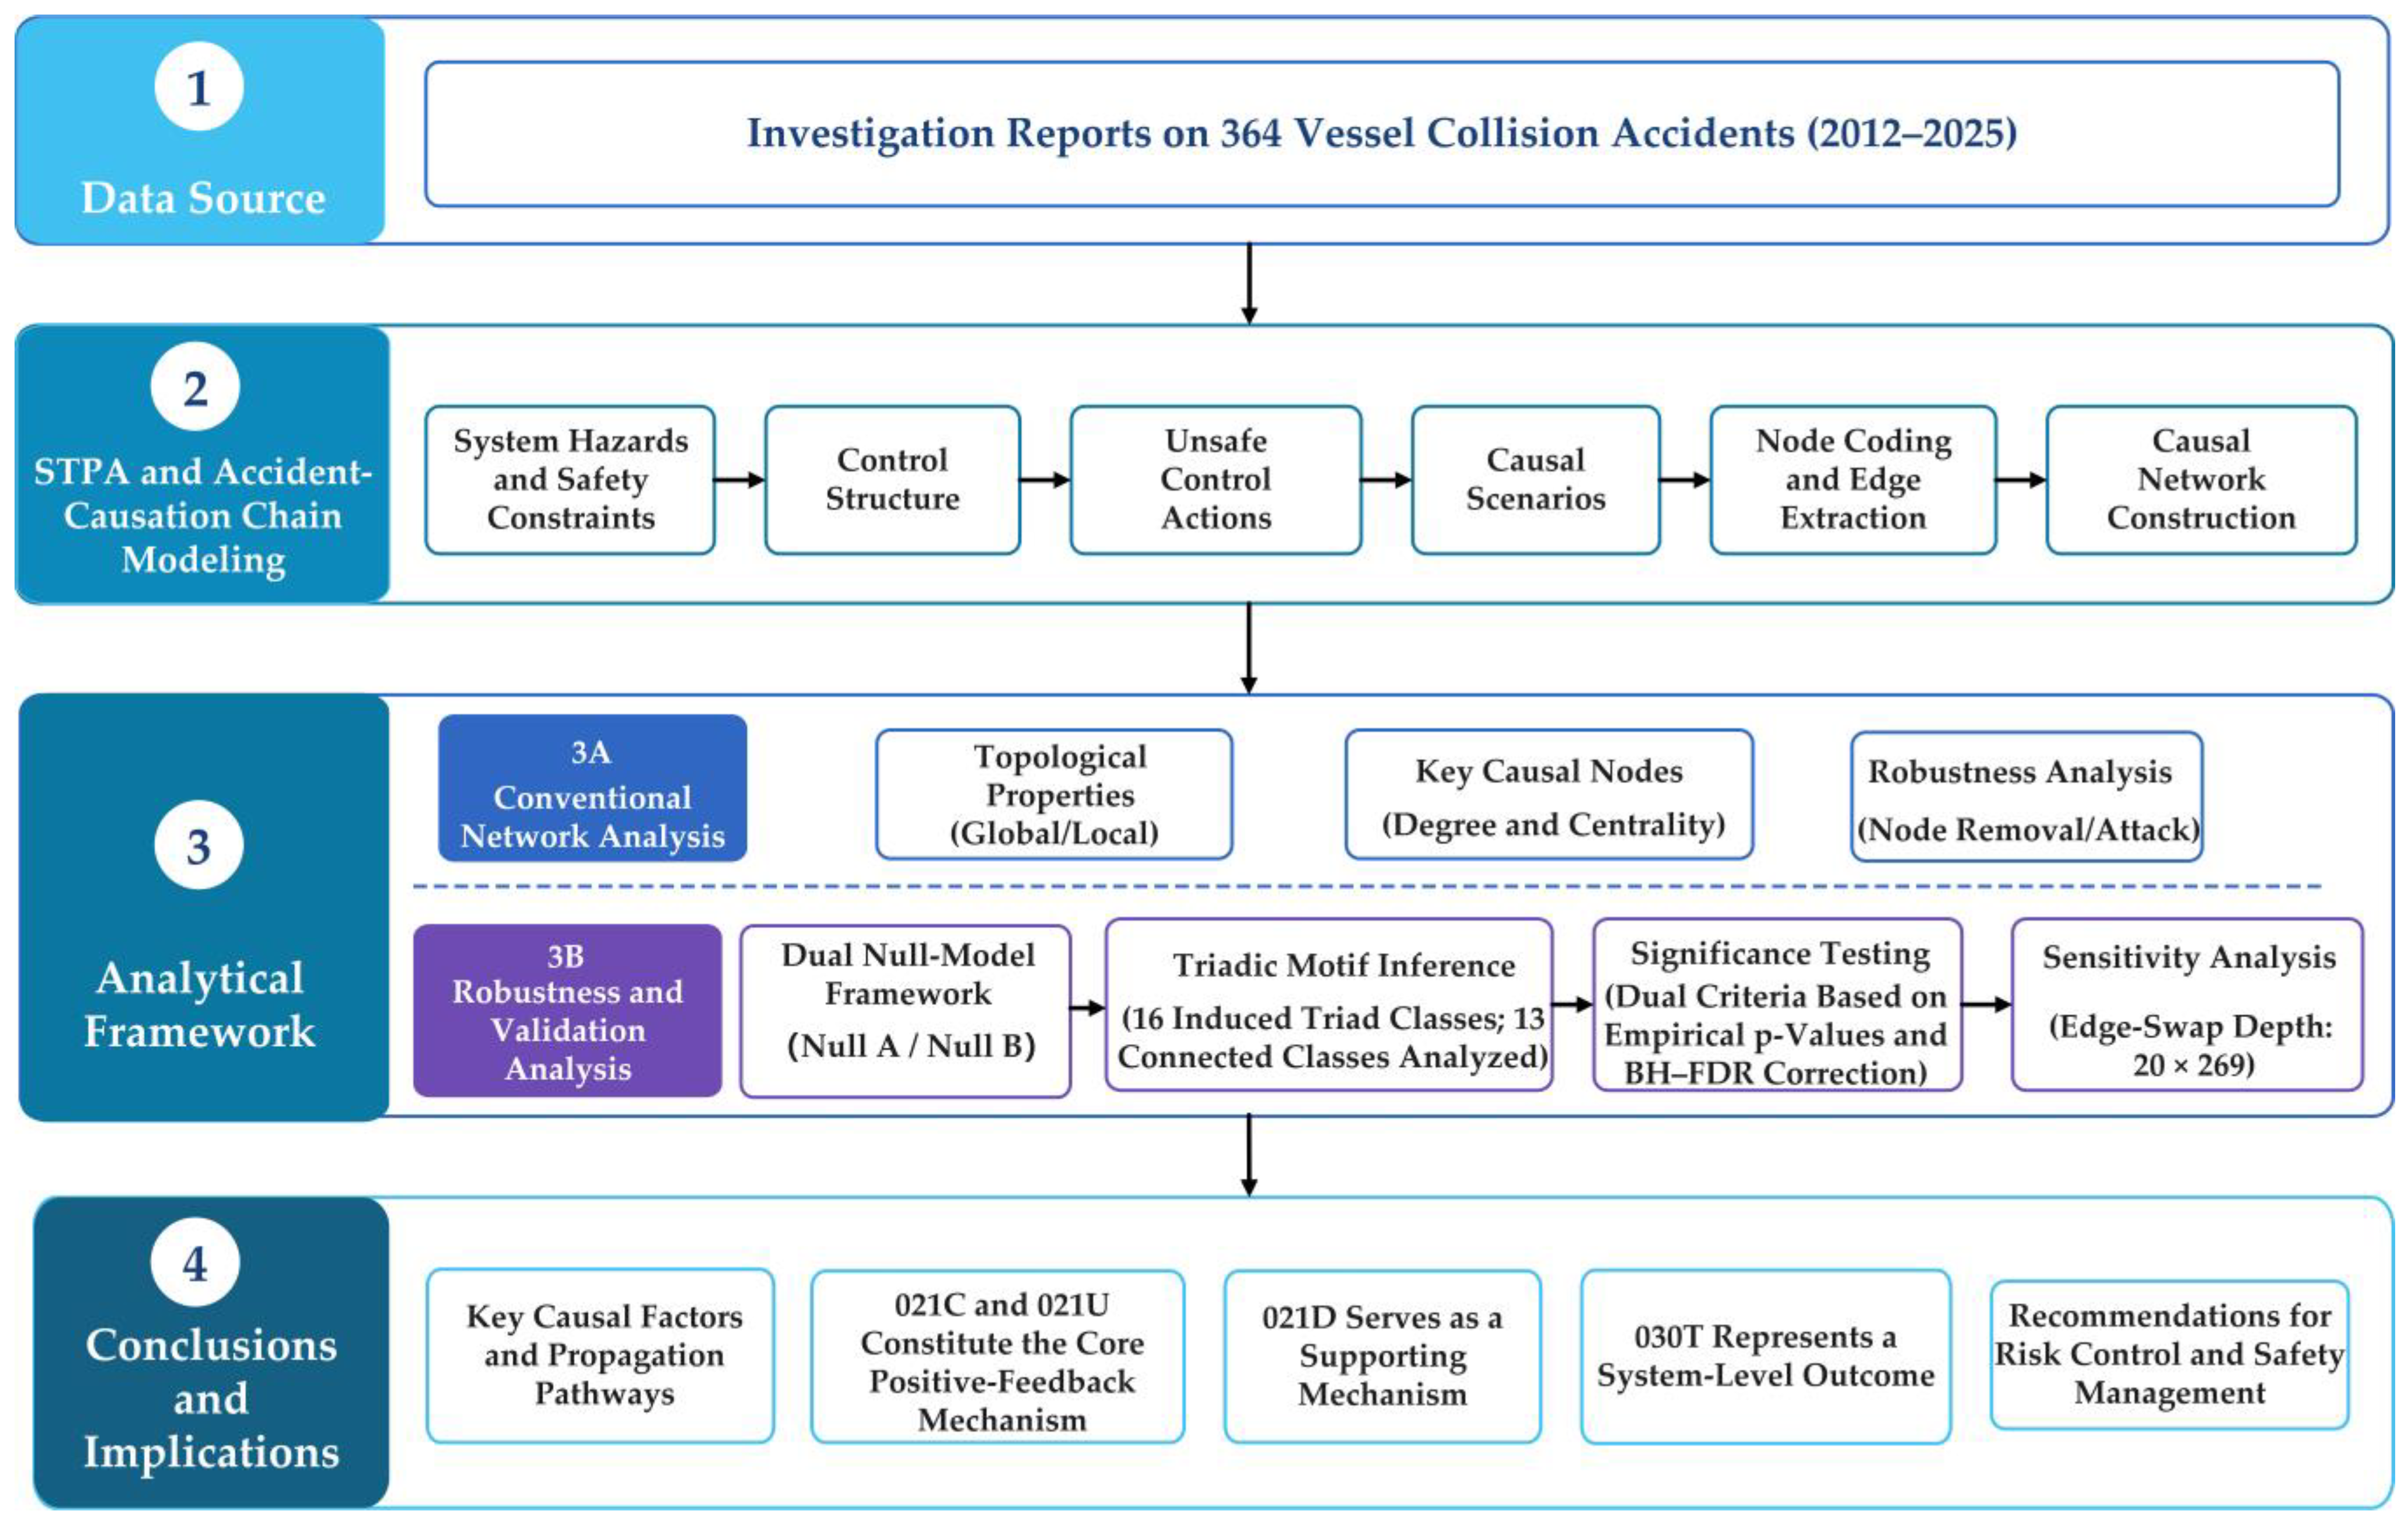
The proposed framework comprises four stages: accident evidence coding, network representation, constrained random inference, and accident-level validation (Figure 1). First, STPA provides the semantic framework for identifying losses, hazards, safety constraints, unsafe control actions, and causal scenarios. These elements are mapped to standardized causal nodes and directed edges. Second, accident-level and aggregate networks are constructed while retaining accident identifiers, vessels at fault, and chain-of-responsibility attributes. Third, after excluding the fixed terminal node C, two random reference ensembles are generated from the observed 46-node, 269-edge network. Null A preserves each node’s in-degree and out-degree, whereas Null B additionally preserves the 5 × 5 functional block edge count matrix. Thirteen connected induced triads are then evaluated using two-sided empirical tests with multiple-comparison correction. Finally, robustly overrepresented motifs are traced to the accident, responsible vessel and responsibility chain levels. This step evaluates whether aggregate enrichment is supported by corresponding event-level evidence. The design therefore separates structural expectations imposed by the degree sequence or functional block architecture from event-supported local configurations.
These analytical stages address distinct but complementary questions within the overall framework. The constrained null models test whether local configurations depart from degree-preserving and degree-plus-block-preserving expectations. Multilevel validation then determines whether the relations required by a significant motif recur within the same accident, responsible vessel, or responsibility chain. Separating the two stages prevents structures assembled across accidents from being interpreted directly as mechanisms of individual accidents. It therefore preserves the distinction between aggregate enrichment and event-level evidential support.

3.2. Data Sources and Sample

The analytical sample comprised 364 official ship collision investigation reports retrieved from the accident-lessons collection of the Maritime Safety Administration of the Ministry of Transport of China. The search closed on 28 February 2026 and covered reports concerning accidents that occurred between 2012 and 2025 and were available by that date. Records were screened sequentially to confirm that they (1) documented a ship collision, (2) were official investigation reports rather than news items, notices, or duplicate postings, and (3) contained narrative or causal evidence suitable for coding. No record available by the cutoff was excluded on these grounds. One report posted in March 2026 was outside the prespecified retrieval window and was therefore not added. Figure S1 summarizes the screening process and record counts.
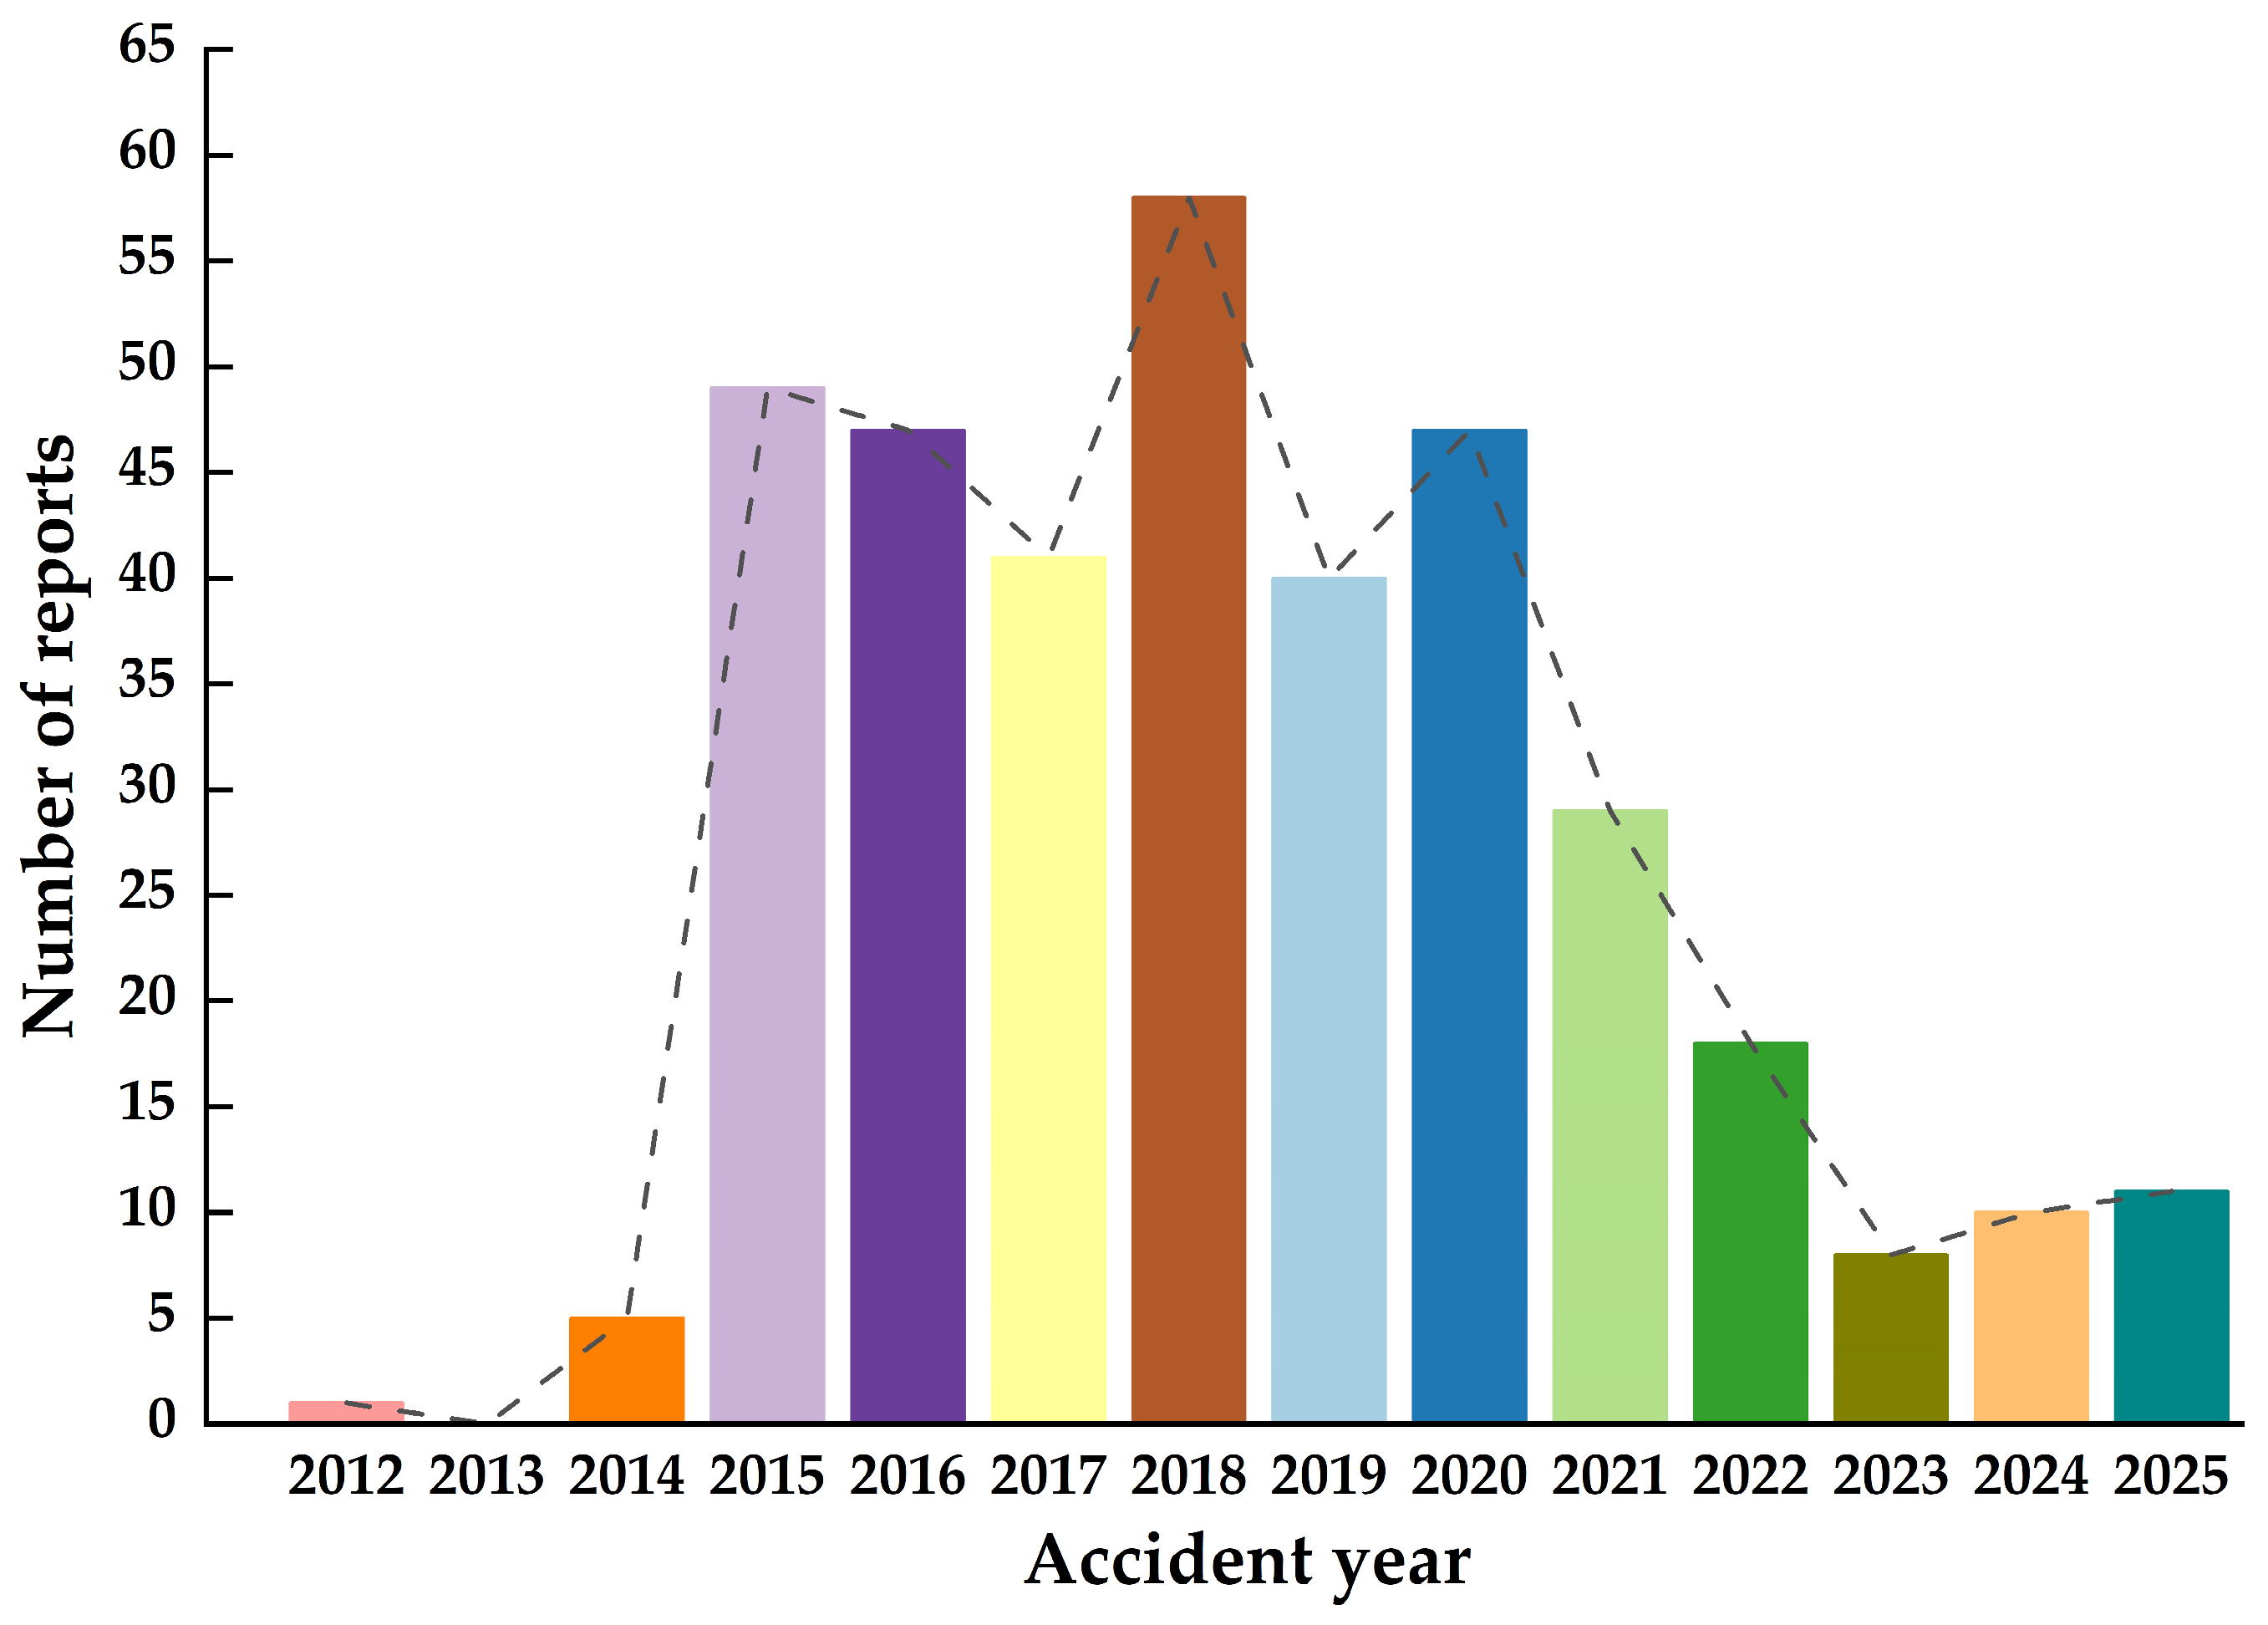
The retained reports were assigned identifiers A001–A364. The sample comprised 152 merchant–merchant and 212 merchant–fishing collisions: 7 major (1.92%), 91 serious (25.00%), 239 ordinary (65.66%), and 27 minor accidents (7.42%). The distribution of the 364 included reports by accident year is shown in Figure 2. The corresponding annual counts and other sample characteristics are provided in Table S4. For each case, the source index records the issuing authority, accident year, publication year, source URL, and verification status.

3.3. STPA Evidence Coding and Accident Chain Extraction

3.3.1. Accident Causation Model and Systems Thinking

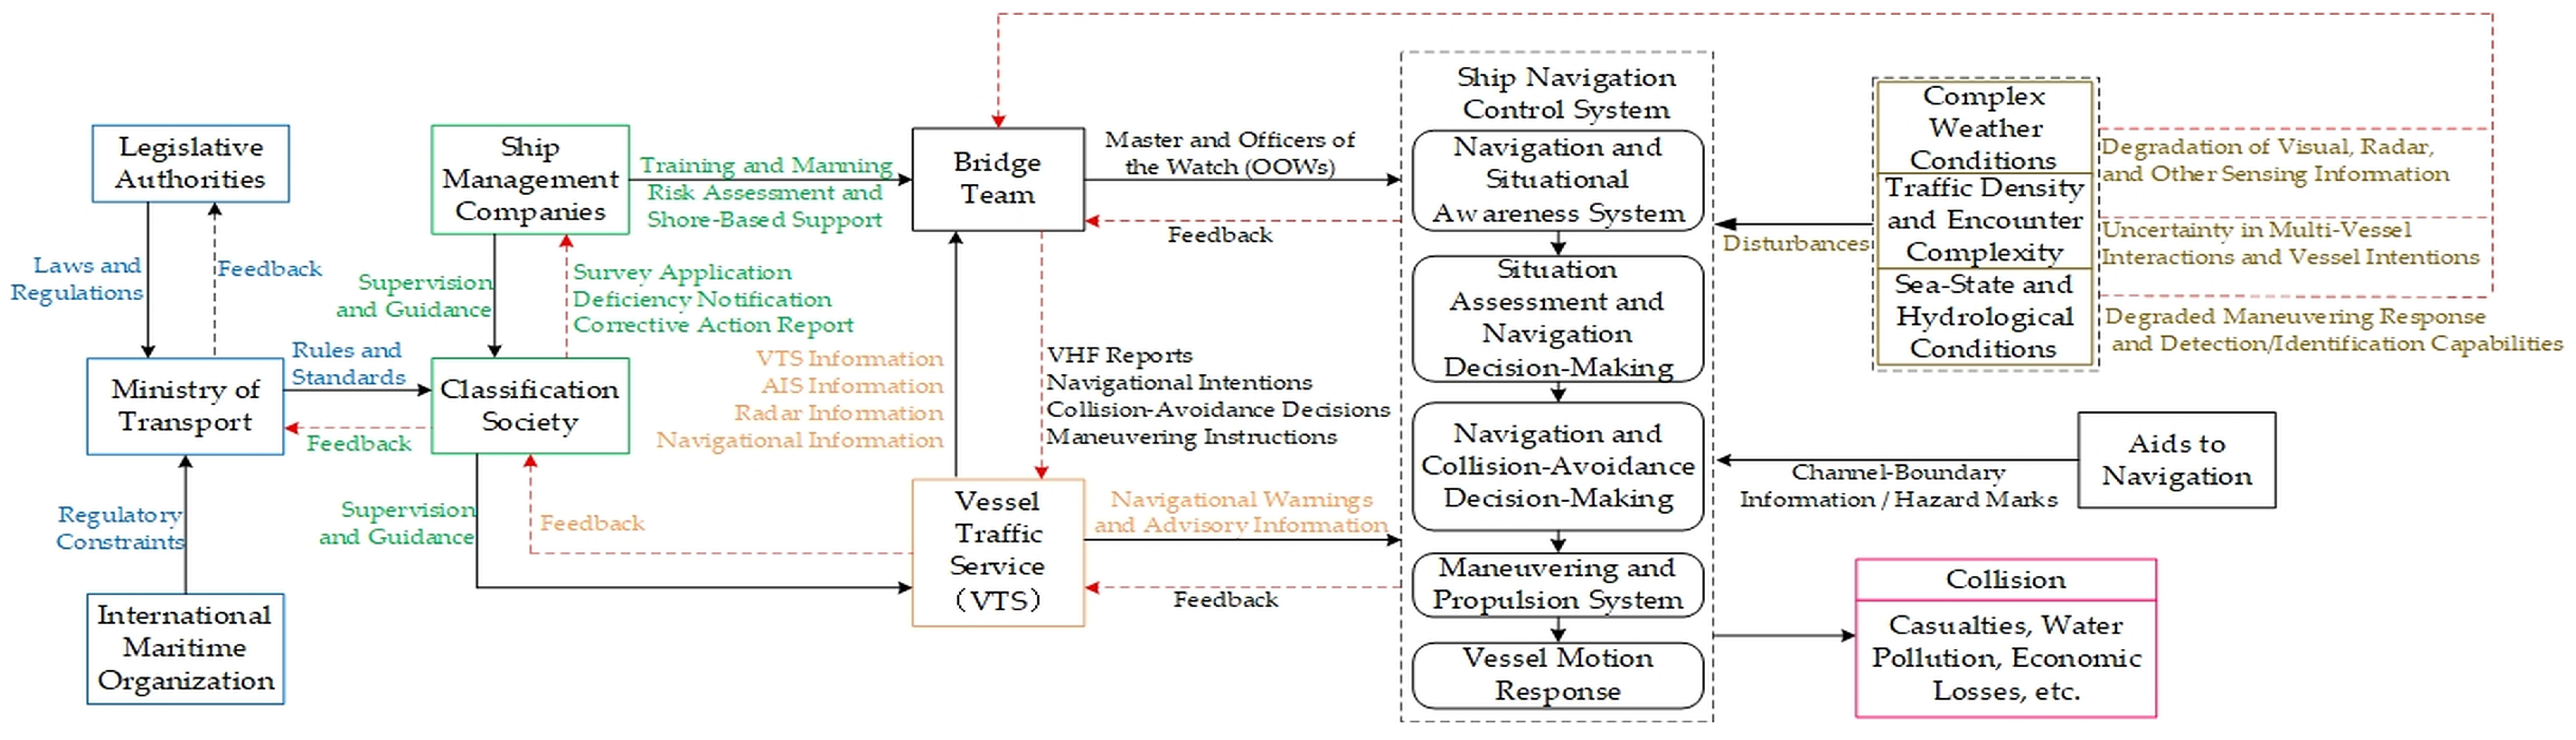
STAMP represents a sociotechnical system as a hierarchical safety control structure comprising controllers, actuators, controlled processes, and feedback channels. STPA consequently treats accidents as control problems caused by inadequate enforcement of safety constraints rather than as isolated component failures or linear failure chains [21,22]. In maritime systems, STPA outputs can also be converted into system verification objectives and scenarios [23]. We therefore used losses, hazards, safety constraints, unsafe control actions, and causal scenarios as a unified coding framework. A directed edge required at least one of four forms of support: an explicit causal statement, temporal ordering, attribution to a chain of responsibility, or STPA control logic. Co-occurrence alone did not create an edge (Figure 3).
To apply these edge criteria consistently, the coding manual defined boundaries between conceptually adjacent nodes and specified decision rules for ambiguous passages. Directed edge evidence was graded as high, medium, or low according to the operational definitions reported in the Supplementary Methods. Only high- or medium-strength evidence was coded as an edge; low-strength or unresolved evidence was recorded as absent. Consistency in applying these rules was evaluated through the inter-coder reliability procedure described in Section 3.3.5.

3.3.2. Construction of the STPA Process

The analysis focused on collisions during vessel navigation, encounters, and evasive maneuvers. Recent reviews and spatiotemporal risk metrics indicate that collision risk assessment requires the integration of encounter scenarios, collision parameters, and multisource navigational information while accounting for changes in relative motion [24,25]. Yu et al. incorporated encounter scenarios, mariner experience, and risk attitudes into a multicriteria aggregation framework. Liu et al. combined AIS-derived vessel dimensions, relative positions, relative speeds, and trajectories to quantify typical encounter situations [26,27]. Guided by this evidence and by STPA requirements concerning control actions, feedback, and safety constraints, we represented the collision avoidance process as seven sequential operational stages. These stages comprised target detection and information acquisition, collision risk recognition, intention communication, maneuver-need assessment, maneuver selection, execution, and effectiveness feedback. Safety management control was treated as an eighth, cross-cutting stage because it constrains personnel, equipment, and bridge operations throughout the operational sequence. This arrangement captures both the temporal progression of collision avoidance and the management conditions that shape each operational stage.
Drawing on the STPA procedure [28] and the collision avoidance literature cited above, the eight-stage scheme was specified in the coding manual before formal coding began and remained unchanged thereafter. The six structured training examples described in Section 3.3.5 were used to calibrate the scheme’s application to the language of investigation reports.
Following the STPA process, we first defined system losses, system-level hazards, and the corresponding safety constraints (Table 1).
Table 2 operationalizes these eight control stages in terms of their controllers, control actions, unsafe control actions, coded factor nodes, and safety constraints, thereby providing a consistent coding reference across reports.

3.3.3. Causal Node System and Coding Results

Repeated report language, STPA control stages, and established maritime safety classifications jointly constrained the causal node system. We identified 46 causal nodes: H1–H31 for human factors, S32–S34 for ship factors, E35–E37 for environmental factors, and M38–M46 for management factors (Table 3).

3.3.4. Mapping Typical Causal Scenarios to Directed Edges

We mapped unsafe control actions and their causal scenarios from representative accident narratives to causal nodes and directed edges. These mappings supported subsequent accident chain extraction and complex network modeling (Table 4). The table presents representative nodes and edges rather than the complete edge set. A specific accident chain may combine several scenarios, with edge direction determined from temporal order, causal statements, control logic, and adjacency matrix coding.

3.3.5. Inter-Coder Reliability

Maritime accident reports combine event narratives, immediate causes, latent organizational deficiencies, and consequences. To convert this evidence into reproducible variables and relations, we developed an accident chain coding manual before formal coding. The manual defined all 46 nodes, their inclusion and exclusion criteria, representative report language, conceptual boundaries, and directed edge rules. Coding drew on accident narratives, causal analyses, responsibility determinations, and investigation conclusions; every retained node and edge required report-based evidence rather than coder inference alone [29].
Before reliability assessment, both coders studied the same manual and completed six structured training examples covering typical report language, boundaries between adjacent nodes, directed relations, and prohibited cross-level links. The examples were used to calibrate decisions and check the applicability of the rules; no separate pilot dataset was coded. The coders then annotated the reliability sample independently and were blinded to each other’s decisions.
Reliability was evaluated in a disproportionate stratified random sample of 73 reports (20.05% of the full dataset). Strata were defined by collision type and accident severity. The sampled strata comprised 22 merchant–merchant ordinary, 8 merchant–merchant serious, 13 merchant–fishing ordinary, 18 merchant–fishing serious, and 12 merchant–fishing minor accidents. The remaining non-empty stratum contained seven major merchant–fishing accidents. Because this stratum was too small to support a stable stratum-specific estimate, it was not included in the reliability sample; these seven reports were nevertheless coded for the main dataset using the same manual. Accordingly, the reported reliability statistics do not establish reliability for major accidents separately. The supplementary sample list identifies all 73 audited reports and their strata. Because the original random seed was not archived, the historical draw cannot be reproduced exactly, although the reported reliability calculations can be reproduced from the realized sample and coder-level judgments.
For node identification, each coder assessed all 46 nodes in each report, yielding 3358 binary judgments per coder. For edge coding, both coders assessed the same 132 candidate directed relations, yielding 9636 judgments per coder. The candidate dictionary was derived from the finalized 364-report coding corpus and fixed before the two-coder audit; it was not changed in response to either coder’s audit judgments. Edge kappa therefore quantifies agreement when evaluating this documented candidate set, not agreement in discovering relations among all 2070 possible directed non-self node pairs.
Inter-coder reliability was quantified using Cohen’s kappa [30]. For node coding, the observed agreement was 0.965, expected agreement was 0.799, and kappa was 0.827. The corresponding values for edge coding were 0.991, 0.938, and 0.862. The two kappa values were reported separately because node and edge coding used different judgment units and class distributions (Table 5).
After the reliability statistics had been fixed, a third coder adjudicated all 199 disagreements against the source reports and the coding manual (117 node judgments and 82 edge judgments). A disputed item was retained only when its evidence met the prespecified coding rule; otherwise, it was recorded as absent. The supplementary adjudication log reports the coder-level judgments, evidence basis, and final decision for every disputed item. Because adjudication occurred after independent rating, it did not alter the reported pre-adjudication kappa values.

3.3.6. Accident Chain Evolution Model

Ship collision causation commonly involves nonlinear coupling and concurrent evolution along multiple pathways. Risk factors can propagate through different accident chains and converge, accumulate, or amplify at critical stages. We used the evolution model in Figure 4 to organize the initiation and progression of each accident. Extracting the relevant stages and control processes produced a complete accident chain.

3.3.7. Example of Accident Report Coding and Chain Extraction

Using the model in Figure 4, we coded the accident report text in four steps. We first extracted information on collision occurrence and evolution from the accident narrative, causal analysis, responsibility determination, and investigation conclusion. We then mapped this evidence to the system-level hazards, safety constraints, and STPA control stages in Table 1 and Table 2. Next, the evidence was converted to causal node codes using Table 3. Finally, directed links were assigned from the reported temporal sequence, causal description, and control relations. Factors that merely co-occurred, without a direct causal relation, propagation order, or control relation, were not linked. Table 6 illustrates the process.

3.4. Construction of the Directed Accident Causation Network

3.4.1. Directed Network Representation and Analytical Levels

Complex networks represent system elements as nodes and relations as edges, making them suitable for describing structure and propagation in multifactor systems [31]. We represented standardized causal factors as nodes and report-supported directional relations as directed edges. Support comprised explicit relational statements, process order, attribution to a chain of responsibility, or STPA control logic. The resulting network was used to analyze topology, local configurations, and directed reachability. These edges represent process relations supported by investigation reports, not causal effects identified experimentally or longitudinally.
To distinguish primary evidence units from derived network structures, we defined the analytical levels before network aggregation, as summarized in Supplementary Table S3. The 364 investigation reports served as the primary evidence units for node and edge coding and event-level validation. Responsible vessels and chains of responsibility were nested within individual accidents and supported vessel- and chain-specific motif validation. In contrast, nodes, edges, and motif instances were derived structural elements and were not treated as independent statistical observations.
The Null A and Null B tests evaluated whether local structures in a single aggregate network departed from matched random network expectations. Accident-level back-tracing then examined whether the edges constituting each motif co-occurred within the same accident, responsible vessel, or chain of responsibility. This procedure did not convert overlapping motif instances into independent samples. Accident support and strong support proportions were therefore interpreted as descriptive evidence rather than population estimates based on independent motif observations.

3.4.2. Adjacency Matrix and Network Generation

An adjacency matrix was constructed for each accident chain. For causal factors i and j, Aij = 1 when report evidence satisfied at least one edge criterion, and Aij = 0 otherwise. A node pair satisfying several criteria still contributed only one directed edge, without repeated counts or accumulated weights.
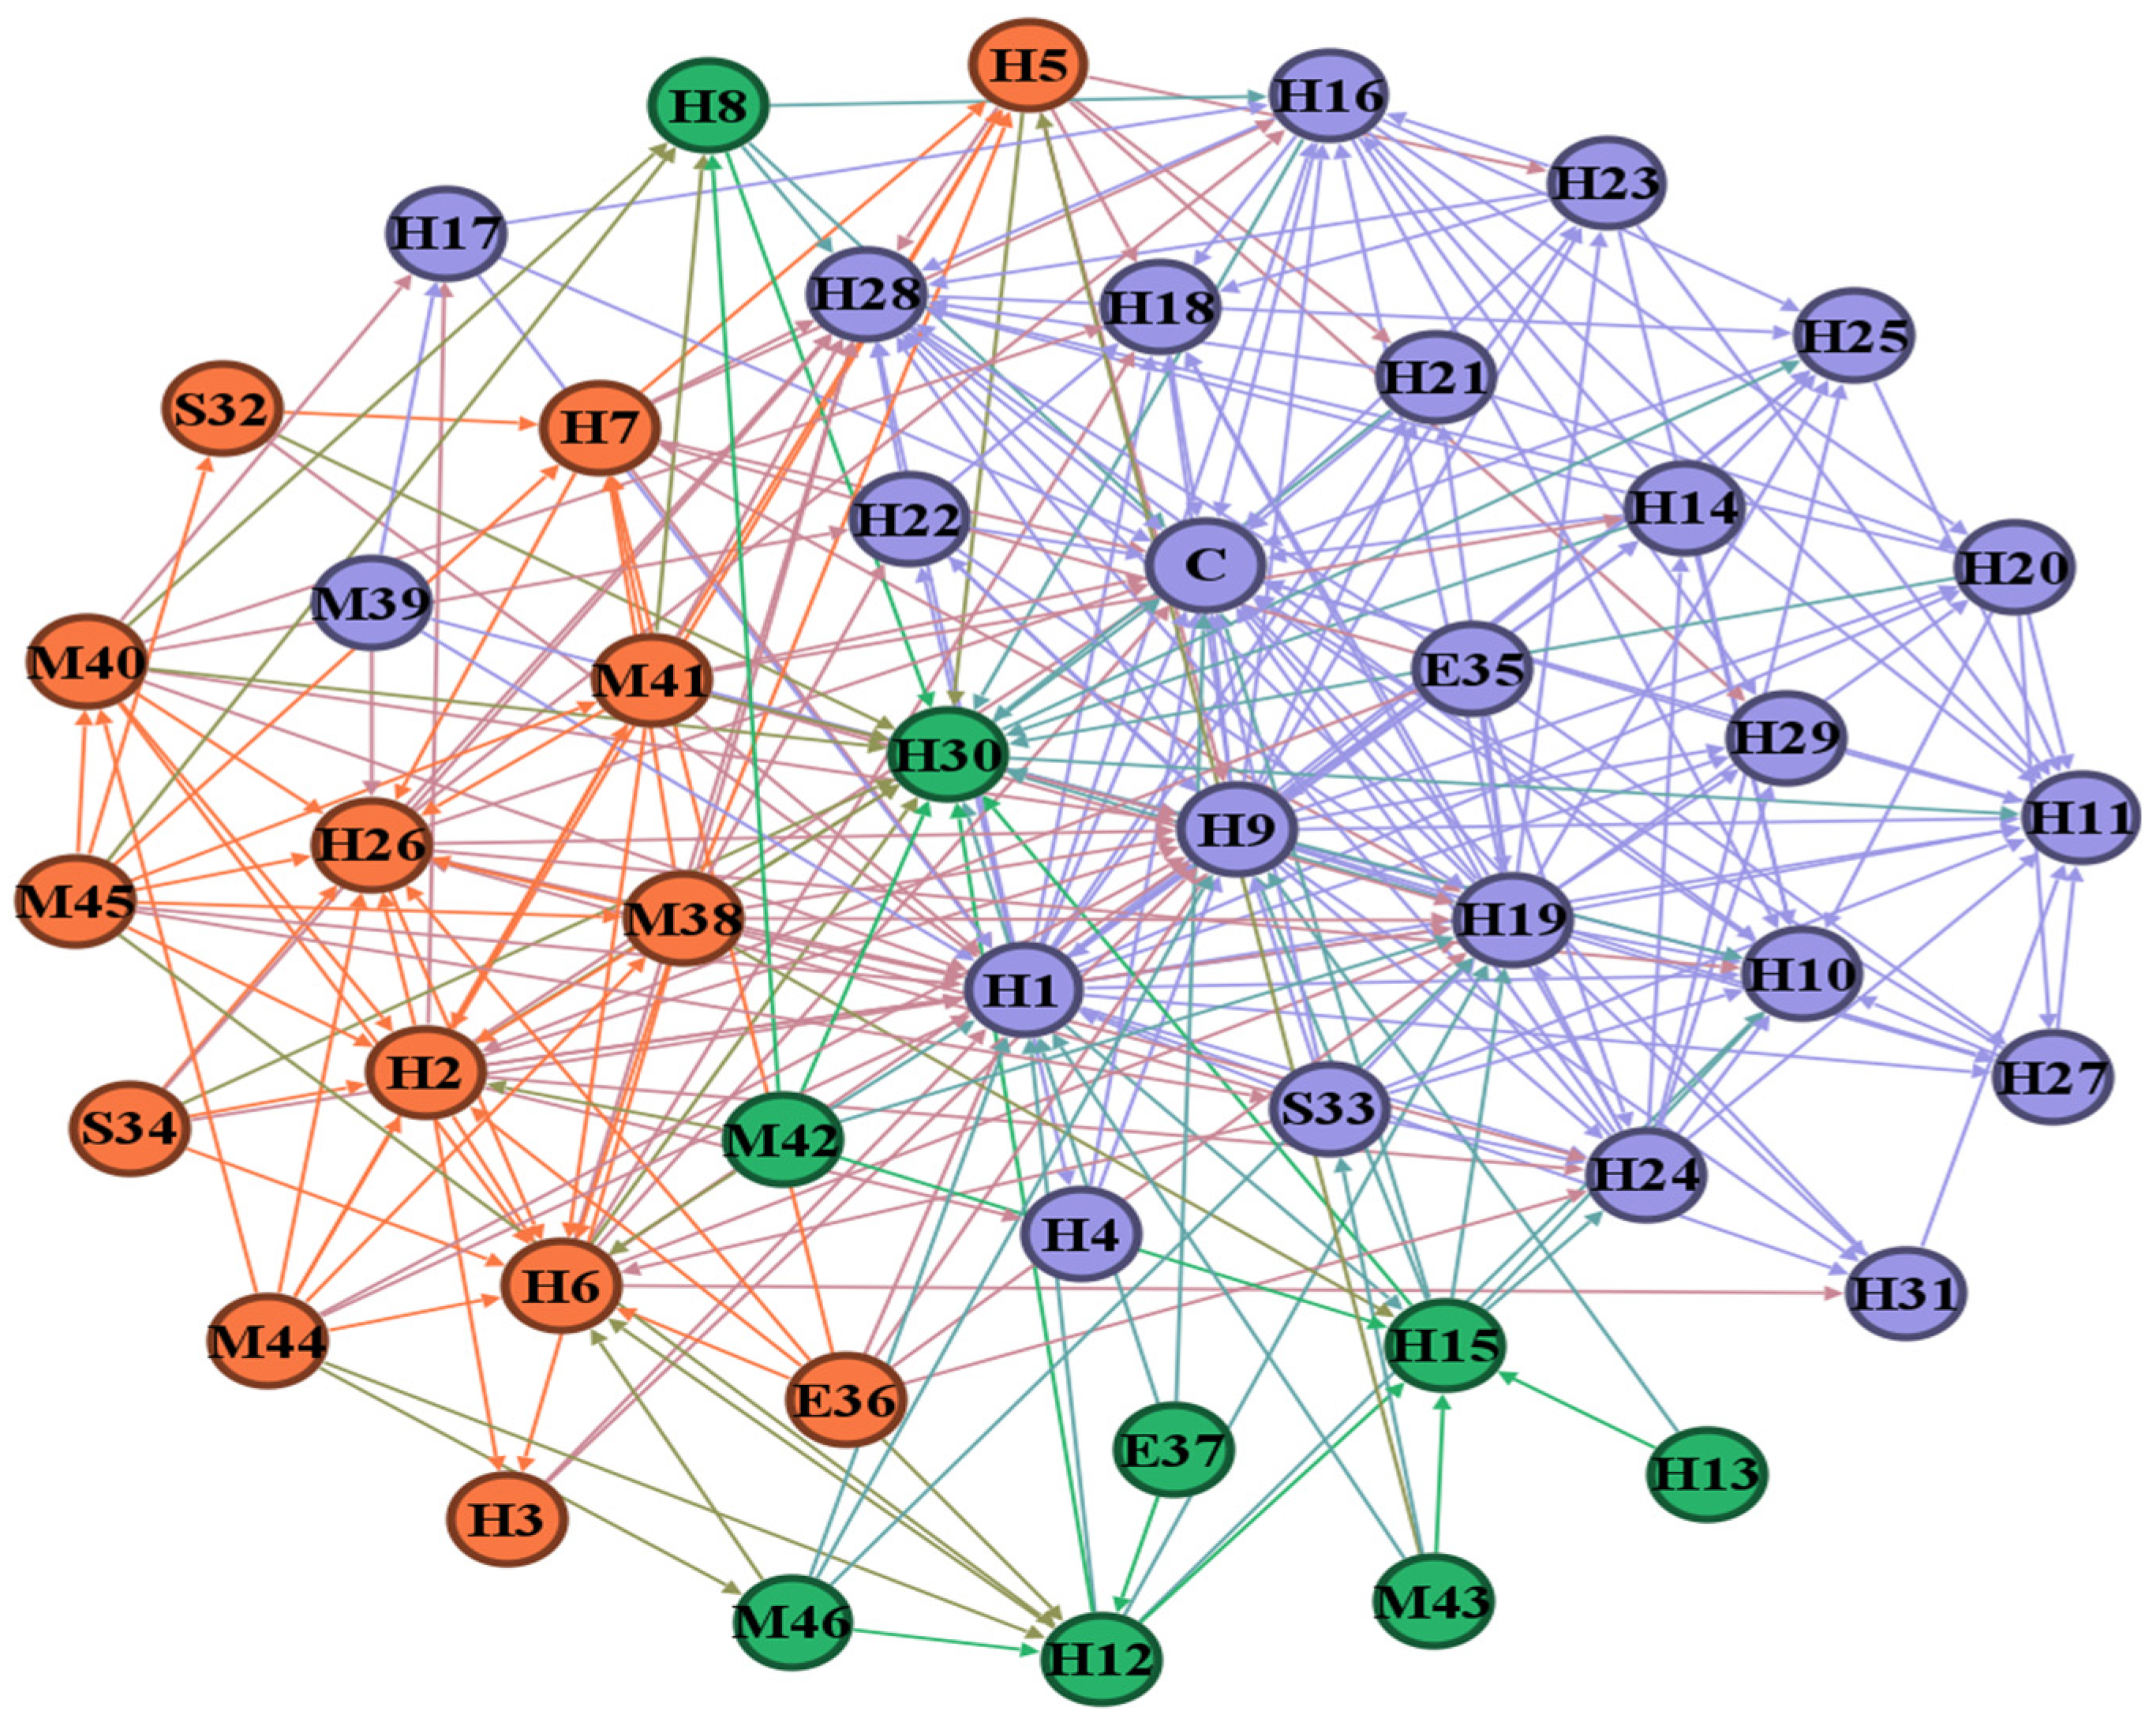
The 364 accident-level networks were aggregated by logical union. A directed relation was assigned a value of one if it was supported in at least one accident under the common edge rules and zero otherwise. Repeated occurrence across accidents did not increase its weight. This binary representation matches our focus on the existence and topological combination of report-supported relations. Report length, repetition, and descriptive detail were not treated as relation strength. As shown in Figure 5, the complete network contained 46 causal nodes and the terminal collision node C, yielding 47 nodes and 298 unique directed edges. After excluding C, the 46-node, 269-edge network was used for the two null models and the primary motif analysis.
To verify this aggregation process, we reconstructed the network from the final A001–A364 coding table. Parsing the coded-chain fields yielded 838 responsibility chains and 2502 adjacent directed edge records. Deduplication within accidents produced 2275 accident–edge records. Their logical union reproduced the 298 unique edges in the complete network. Removing the 29 edges terminating at C reproduced the 269-edge causal factor network used in the null model and motif analyses. The supplementary provenance audit reports the record counts and identifiers for each transformation.

3.5. Constrained Network Motif Inference and Multilevel Validation

3.5.1. Constrained Random Reference Models and Functional Blocks

We generated interpretable random reference networks using directed double-edge swaps that preserved the in-degree and out-degree of every node [32]. Let A i j { 0 , 1 } denote the adjacency matrix, and let g i { 1 , , 5 } denote the functional block assigned to node i before randomization. The number of directed edges from the source block r to the target block s was defined as:
B r s = i : g i = r j : g j = s A i j
Here, Brs denotes the block-to-block edge count, and A i j = 1 indicates the edge i j . Null A preserved the in-degree and out-degree of every node, whereas Null B additionally preserved all 25 entries of the 5 × 5 block-to-block edge count matrix.
Two edges, a b and c d , were sampled without replacement from the current network. The proposed double-edge swap was:
a b ,   c d a d ,   c b
A proposal was accepted only if a c , b d , a d , and c b and neither proposed edge already existed. These conditions prevented self-loops and duplicate edges. Under Null B, the proposal was additionally required to satisfy g a = g c or g b = g d . This condition leaves the source block-to-target block combinations of the two edges unchanged and therefore preserves every B r s exactly.
The irreducibility and mixing properties of a directed swap chain depend on the degree sequence and feasible state space [33]. Consequently, preservation of the specified constraints and satisfactory mixing diagnostics do not constitute a mathematical proof of uniform sampling [34].

3.5.2. Analysis Boundary and Dual-Null Models

To prevent the fixed convergence on terminal node C from dominating the triad census, randomization and primary motif analyses excluded C. The resulting observed network comprised 46 causal nodes and 269 unique directed edges.
Before randomization, the 46 nodes were assigned to five mutually exclusive functional blocks according to their roles in the collision control process: management, vessel, and environmental preconditions; crew states, responsibilities, and antecedent navigational practices; information acquisition, lookout, and warning; encounter interpretation, communication, and collision risk assessment; and collision avoidance rules, response selection, and maneuver execution.
The five-block scheme represented causal nodes at a broader functional level than the eight STPA operational stages. It was used exclusively as a structural constraint in Null B and was not interpreted as a temporal hierarchy. The two classification schemes therefore served different analytical purposes and were not intended to correspond one-to-one. The complete node-to-block mapping and the corresponding 5 × 5 block-to-block edge count matrix are provided in Supplementary Tables S1 and S2, respectively.
Null A preserved each node’s in-degree and out-degree exactly. Null B additionally preserved the complete 5 × 5 block-to-block edge count matrix defined in Section 3.5.1. Each null model generated 1000 networks, with a target of 10 × 269 = 2690 accepted swaps per network. Each randomized network was checked for node and edge counts, self-loops, duplicate edges, and preservation of the node degree sequence. Null B networks were additionally verified against the complete block-to-block edge count matrix.
Mixing was evaluated using the swap acceptance rate, the fraction of edges replaced relative to the observed network, and the mean pairwise Jaccard similarity. Null B was treated as a restricted directed double-edge swap model. We do not claim that this model covers the entire feasible state space or samples uniformly from that space.

3.5.3. Triad Statistics and Inference Criteria

Three-node structures were enumerated as induced subgraphs using the triad_census function of the R package igraph (version 2.3.3) [35] and classified into the 16 conventional directed triad types [36]. For motif t , standardized deviation from the null distribution was calculated as:
Z t = N t o b s μ t σ t
Here, N t o b s denotes the observed count of motif t , whereas μ t and σ t denote the mean and standard deviation, respectively, of its counts across B randomized networks. Empirical tail probabilities are calculated using the +1 correction [37]:
p u p p e r = 1 + b = 1 B I N t b N t o b s B + 1
p l o w e r = 1 + b = 1 B I N t b N t o b s B + 1
p t w o = min 1 ,   2 min p u p p e r , p l o w e r ,   B = 1000
Here, Nt(b) is the count of motif t in randomized network b, I ( · ) is the indicator function, and B = 1000 . Two-sided p values for the 13 connected triads were adjusted within Null A and Null B using the Benjamini–Hochberg procedure [38]. A robust dual-null signal required the same deviation direction under both models, an observed count outside both 95% empirical intervals, and Z t 2 and q t < 0.05 . Overrepresented triads satisfying all criteria were designated core motifs and advanced to multilevel accident evidence validation.

3.5.4. Multilevel Validation Against Accident Evidence

Core motifs identified by both null models were traced to the accident evidence. An accident-supported instance required every motif edge to occur within the same accident. Strong support additionally required evidence at the responsible vessel and responsibility chain levels. For 021C, both consecutive edges had to belong to the same chain of responsibility. For 021U and 021D, all required edges had to involve the same vessel at fault within one accident, although they could belong to different chains. For 030T, all three edges had to involve the same vessel, and the chain backbone had to occur within one chain of responsibility. Ambiguous vessel or chain assignments were manually checked against the report. Instances with insufficient evidence were retained as unresolved and excluded from strong support counts.
To distinguish these evidence levels, we reported three complementary support measures. The global instance accident support proportion was calculated by dividing the number of accident-supported instances by the global motif count. The conditional strong support proportion was calculated by dividing the number of strongly supported instances by the number of accident-supported instances. Accident-level prevalence was defined as the proportion of the 364 accidents containing at least one instance that met the corresponding support criterion. Because these measures use different denominators, they were interpreted separately.

3.5.5. Swap Depth Sensitivity Analysis

We tested whether the Null B results depended on swap depth by generating 100 additional networks under the same constraints, randomization procedure, and statistics. The target number of accepted swaps per network increased from 2690 in the primary analysis to 5380. We compared null means, Z scores, deviation directions, and robustness decisions for the core motifs. This analysis assessed sensitivity only; formal p and q values remained based on the 1000 primary networks generated under each null model.
We further assessed Null B mixing using eight independently seeded Markov chains, each initialized from the observed network. The seeds are reported in the Supplementary Methods. Each chain ran until 72,630 swaps had been accepted, corresponding to 270 times the observed edge count. For depth stability diagnostics, states were recorded at 0, 1, 2, 5, 10, 20, 40, 80, 160, and 270 times the observed edge count. The state recorded after 5380 accepted swaps marked the 20-fold burn-in endpoint and was excluded from the post-burn-in sample. Thereafter, one state was retained every 1345 accepted swaps, corresponding to five times the edge count. This procedure yielded 50 samples per chain and 400 post-burn-in samples. Every recorded state, including the depth checkpoints and post-burn-in samples, was checked for edge count, self-loops, duplicate edges, node-level in- and out-degrees, and all 25 block-to-block edge counts. Mixing was evaluated using the prespecified core-triad counts and edge-overlap statistics, with an R-hat threshold of 1.05 and a minimum approximate effective sample size of 100. Depth stability was assessed by comparing the mean Jaccard similarity to the observed edge set at the recorded 20-fold burn-in endpoint and the 270-fold endpoint. These diagnostics assess empirical mixing within the explored communicating component; they do not establish global irreducibility or uniform sampling over the full space of legal graphs.

3.5.6. Additional Robustness and Sensitivity Analyses

Beyond the swap depth diagnostics, we conducted six additional robustness analyses using the frozen accident-level data. The 46-node, 269-edge network remained the primary analysis, and all sensitivity networks were derived from the same coded records.
First, we replaced the five functional blocks in Null B with four domains: human, ship, environmental, and management factors. This randomization preserved every node’s in-degree and out-degree and the exact 4 × 4 domain edge count matrix. We generated 1000 networks, each stopping after 2690 accepted swaps.
Second, we retained edges supported by at least two, three, or five accidents. These thresholds were specified before the sensitivity results were examined. All 46 nodes, including isolates, were retained, yielding networks with 159, 96, and 63 edges.
Third, we grouped major and serious accidents as higher severity (n = 98) and ordinary and minor accidents as lower severity (n = 266). One source-file label, A002, was corrected from ordinary to serious after a data audit and author confirmation. This correction is documented in the Supplementary Materials.
Each threshold and severity network was evaluated with 1000 Null A and 1000 five-block Null B networks. Randomization for each network stopped after ten accepted swaps per observed edge. Structural p values and multiple-comparison procedures followed Section 3.5.3.
Fourth, we generated 10,000 within-accident node-label permutations. Each permutation preserved the accident’s node set, edge count, and complete directed topology while reallocating node identities across topological roles. This baseline did not preserve responsible vessel or responsibility chain labels. Upper-tail empirical p values were adjusted across the four core motifs using the Benjamini–Hochberg procedure.
We also resampled the 364 accidents with replacement 10,000 times. This accident-cluster bootstrap produced percentile 95% confidence intervals for accident support and strong support prevalence. Complete specifications, random seeds, and outputs are provided in the Supplementary Materials.
Fifth, we conducted a frequency-weighted sensitivity analysis while retaining the directed binary network as the primary representation. The weight of each edge equaled the number of distinct accidents supporting that relation. We calculated weighted in-strength, out-strength, and total strength and compared these node rankings with their binary-degree counterparts using the Spearman rank correlation and top-ten overlap. For each induced triad instance, weighted intensity was defined as the geometric mean of its constituent edge weights. Mean intensity was evaluated using 10,000 global weight permutations and 10,000 permutations restricted to the observed source–target functional block strata. Two-sided empirical p values were adjusted across the 13 connected triads using the Benjamini–Hochberg procedure. Because accident support measures recurrence rather than distance or causal strength, we did not derive weighted shortest-path, efficiency, or node removal metrics.
Sixth, we retrospectively graded relation-level evidence to test whether motif results depended on the rule used to assign edge direction. E1 denoted an explicit pairwise link in which the source and target occurred in the same causal statement with a directional connector. E2 denoted an ordered process relation within the same or an adjacent cause or responsibility statement. E3 denoted common attribution within one responsibility scope without an explicit pairwise direction. E4 denoted a relation assigned through the prespecified STPA control logic, with both endpoints traceable in the report. U denoted an unresolved relation for which one or both endpoints, or the proposed relation, could not be reconstructed reliably.
Each global edge was assigned the strongest tier observed among its supporting accidents. The author verified all 269 edge-level decisions. A second coder independently assessed a stratified blinded sample of 60 accident–relation units; the pre-adjudication agreement was 59/60 (98.33%), with Cohen’s kappa = 0.977. One disagreement was resolved against the source report and coding rules. We constructed cumulative E1, E1–E2, E1–E3, and E1–E4 subnetworks while retaining all 46 nodes, including isolates. The complete 269-edge network remained the primary analysis. Networks with sufficient exchange space were tested using 1000 degree-preserving and 1000 five-block-constrained randomizations. The sparse E1 network was reported descriptively.

3.6. Descriptive Network Metrics and Node Removal Analysis

Unless otherwise specified, Section 3.6, Section 4.1 and Section 4.2 report topological metrics for the 46-node, 269-edge subnetwork obtained by excluding terminal node C from the complete 47-node, 298-edge directed network.

3.6.1. Network Diameter and Mean Path Length

We characterized the network topology using the network diameter d diameter and the average shortest-path length d avg . The network diameter was calculated as follows:
d diameter = max d i j
Here, d diameter is the maximum shortest-path length between any two reachable nodes, and d i j is the shortest-path length from node i to node j .
For a directed network, mean path length was calculated as:
d avg = 1 β i , j V ,   i j d i j < d i j
Here, V denotes the set of nodes, d i j is the length of the shortest directed path from node i to node j , and β is the number of reachable ordered node pairs satisfying i j and d i j < . Thus, d a v g represents the mean shortest-path length across all reachable ordered node pairs.

3.6.2. Computation of Node Degree

In a directed network, the total degree is the sum of in-degree and out-degree and describes a node’s overall participation in direct network relations:
k i t o t = k i i n + k i o u t = j = 1 N ( a j i + a i j )
Here, k i i n is the number of edges entering node i , and k i o u t is the number leaving it.

3.6.3. Computation of Closeness Centrality

Because the network was not strongly connected, we calculated reachability-adjusted out-closeness to characterize each node’s access to downstream nodes. Let R i denote the set of nodes other than i that are reachable from i along outgoing directed paths, and let r i = R i . Out-closeness centrality was calculated as:
C out ( i ) = r i N 1 r i j R i d i j
where d i j is the shortest directed path distance from node i to node j . This definition follows the direction of report-supported relations and adjusts for differences in reachable set size. When R i was empty, C o u t i was defined as zero.

3.6.4. Computation of Betweenness Centrality

Betweenness centrality measures how often node (i) lies on shortest directed paths between other node pairs and therefore identifies structural bridge positions in the directed causal network [39]:
B i = 1 ( N 1 ) ( N 2 ) k , m V k m ,   k i ,   m i δ k m > 0 δ k m ( i ) δ k m
Here, B i denotes the normalized betweenness centrality of node i , V is the set of nodes, and N = V is the number of nodes. Moreover, δ k m denotes the number of shortest directed paths from node k to node m , whereas δ k m i denotes the number of these paths that pass through node i as an intermediate node. The summation is taken over all reachable ordered pairs of distinct nodes k and m , excluding node i .

3.6.5. Global Efficiency

We used global efficiency to describe information transmission and potential risk propagation in the accident causation network [40]. For a directed network, global efficiency is the mean reciprocal shortest-path distance over all ordered node pairs:
E glob ( G ) = 1 N ( N 1 ) i , j V i j 1 d i j ,
Here, E g l o b is global efficiency, N is the number of network nodes, and d i j is the shortest directed path length from node i to node j .

3.6.6. Node Removal Perturbation and Reproducibility Analysis

Node removal analysis was conducted on the 46-node, 269-edge directed network obtained after excluding terminal collision node C. For a set S k containing the first k removed nodes, normalized global efficiency was calculated as:
E norm ( G S k ) = E glob ( G S k ) E glob ( G )
where G denotes the observed 46-node network and E g l o b G is its baseline global efficiency. Removing a node simultaneously removed all of its incoming and outgoing edges. We also recorded the fraction of remaining nodes contained in the largest weakly connected component. Because E g l o b G S k was evaluated on the remaining network, E n o r m could exceed 1 when node removal increased the efficiency of the residual network relative to the baseline.
To assess the stability of key-node identification, H1, H9, and H19 were removed individually, in all pairwise combinations, and jointly. Cumulative targeted removal followed fixed rankings based on total degree, betweenness centrality, or out-degree. Each ranking was calculated once on the observed 46-node network and held fixed throughout the ten removal steps; the rankings were not dynamically updated after each perturbation. Ties were resolved according to node order in the supplied adjacency matrix.
For random removal, 10,000 independent permutations of the 46 nodes were generated using NumPy PCG64 with seed 20260820. The first k nodes in each permutation defined the cumulative removal set at step k , ensuring sampling without replacement within each replicate. For k = 1 , , 10 , we calculated the normalized global efficiency and the largest weak-component fraction. The random reference curve was summarized by the mean across replicates and the pointwise 2.5th and 97.5th empirical percentiles, calculated using numpy.quantile (method = ‘linear’). The analysis was implemented in Python 3.12.13 with NumPy 2.3.5. The executable code, labeled 46 × 46 adjacency matrix, replicate-level outputs, and summary tables are provided in the accompanying Supplementary Files.

4. Results

The results are presented in three stages. Section 4.1 and Section 4.2 provide descriptive context on aggregate connectivity and hypothetical node removal responses. Section 4.3 reports the primary inferential analysis, including dual-null motif tests and evidence back-tracing at the accident, responsible vessel and responsibility chain levels. Descriptive topology was not used to infer event mechanisms or intervention effects.

4.1. Descriptive Network Topology Results

4.1.1. Mean Path Length

Using Equations (7) and (8), the 46-node causal network had a diameter of 3 and a mean path length of 1.66 across reachable ordered node pairs. Most causal factor nodes were therefore connected by few intermediate steps when a directed path existed. This result describes the topological compactness of the aggregate network and does not imply that risk necessarily propagates along shortest paths.

4.1.2. Node Degree

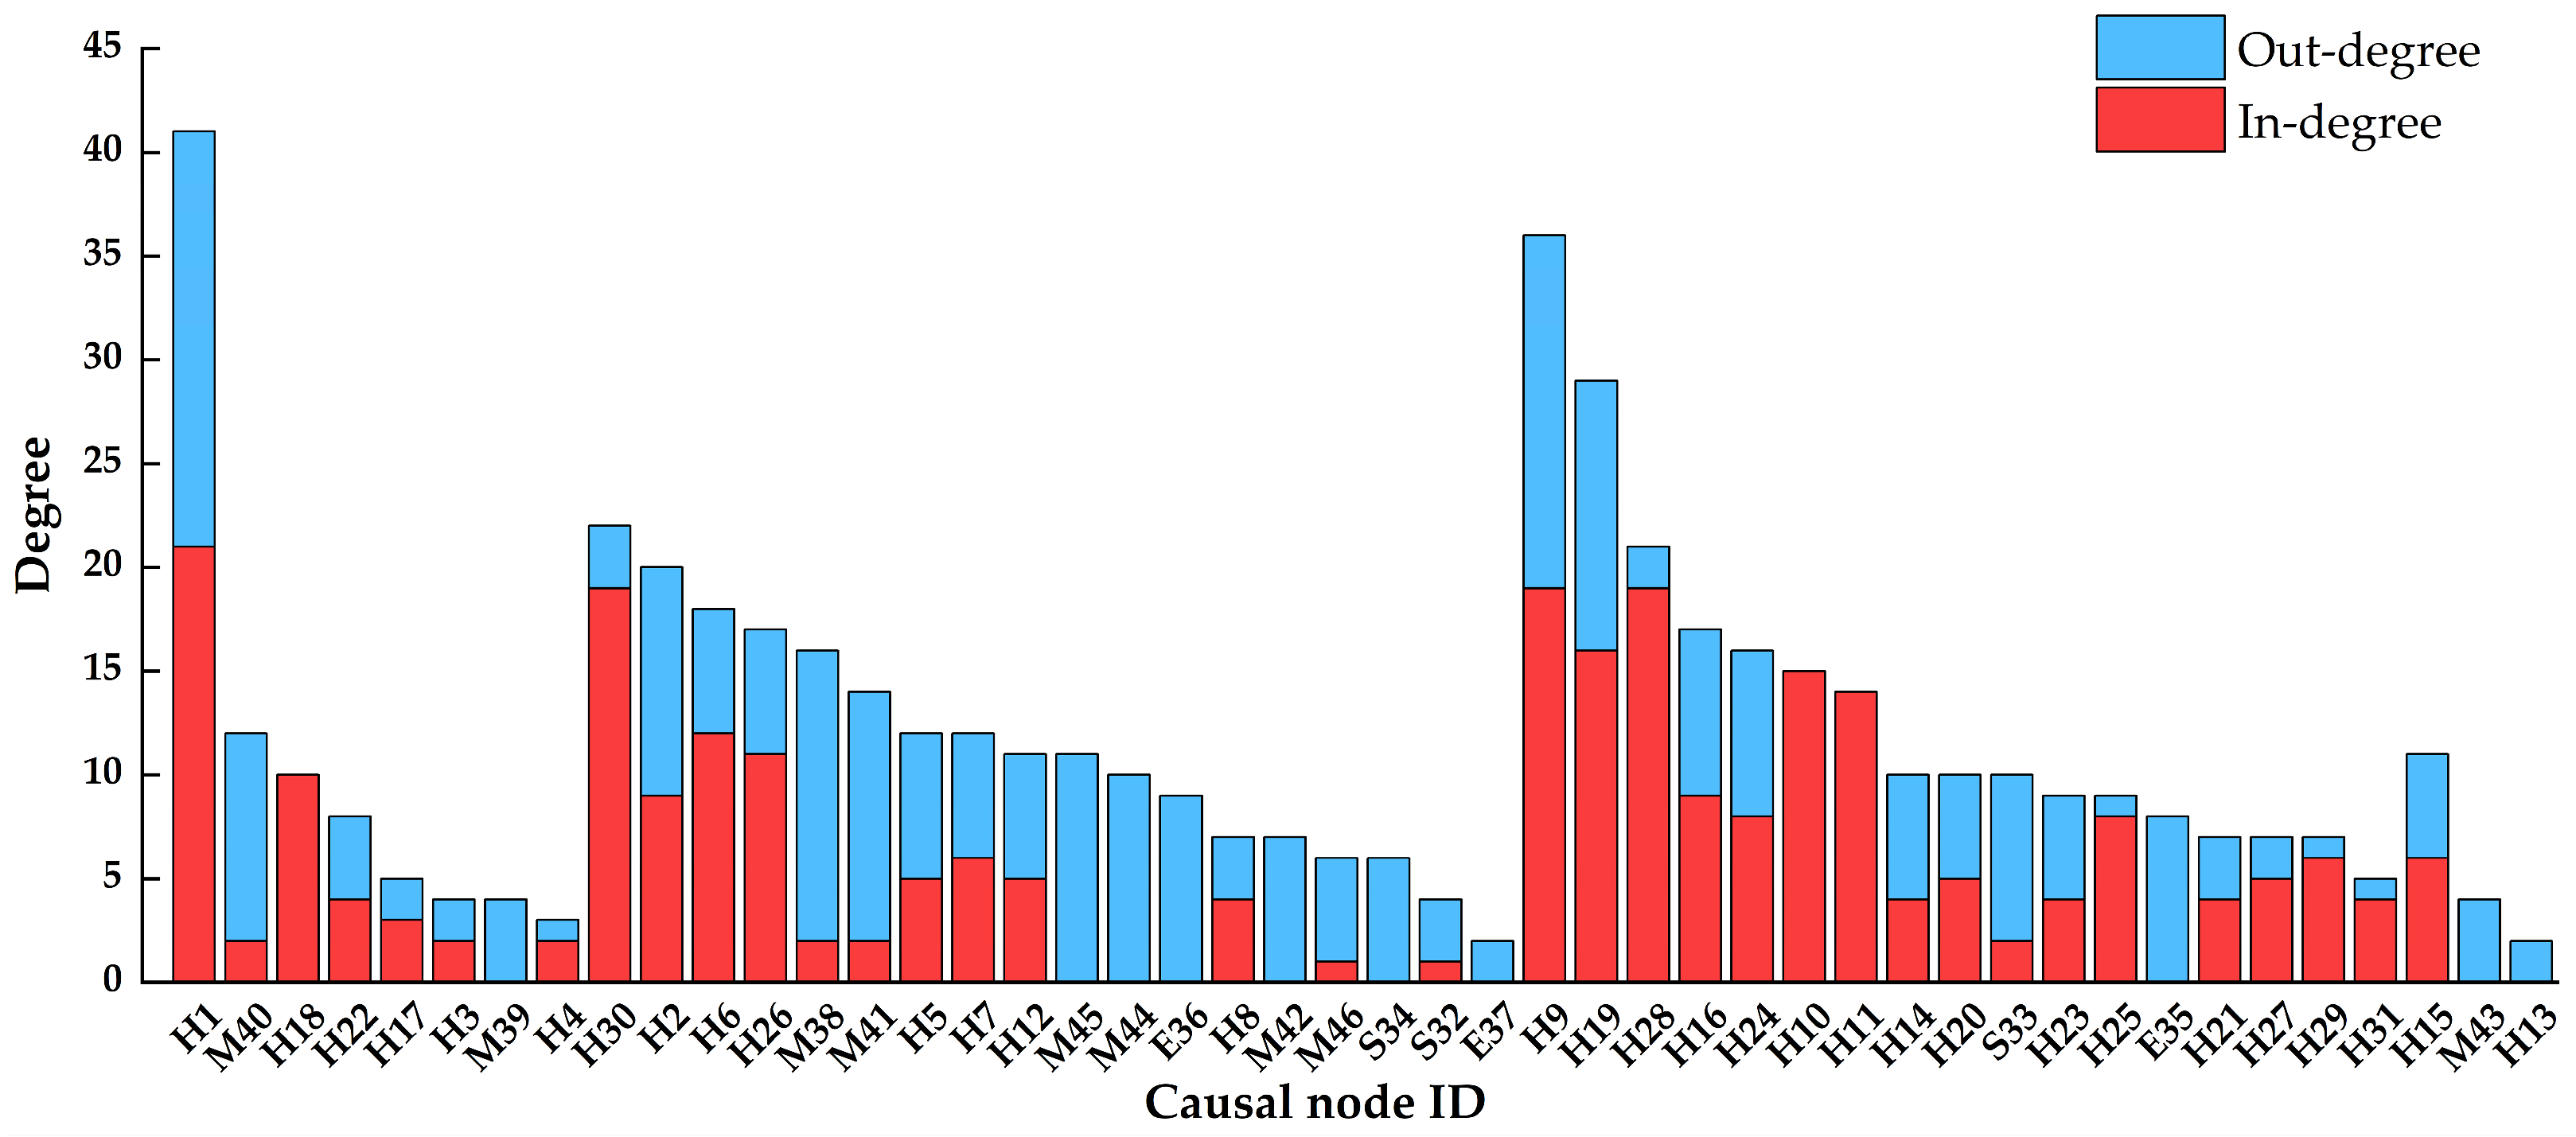
Figure 6 shows the in-degree, out-degree, and total degree of all 46 nodes calculated using Equation (9). Higher in-degree indicates more direct antecedents, higher out-degree indicates more direct downstream connections, and the total degree reflects the overall participation in direct structural relations.
High-degree nodes were concentrated among human and management factors. The main management factor nodes were M38 (insufficient manning), M40 (unlicensed operation), and M41 (crew incompetence). Each was directly connected to several downstream nodes. Prominent human factor nodes included H1 (failure to maintain a proper lookout), H9 (failure to assess collision risk correctly and in time), and H19 (failure to proceed at a safe speed). H28 (failure to take early and effective collision avoidance action) and H30 (failure to discharge give-way vessel duties) were also prominent. Overall, organizational and personnel factors exhibited broad direct connectivity, whereas operational links clustered around lookout, risk assessment, speed control, and maneuver execution.
Management factor nodes generally occupied upstream positions, whereas prominent human factor nodes occurred in the middle and downstream portions of the aggregate network. Connectivity was concentrated around watchkeeping organization, risk recognition and maneuver execution. These positions describe aggregate network structure and do not quantify causal effects.

4.1.3. Closeness Centrality

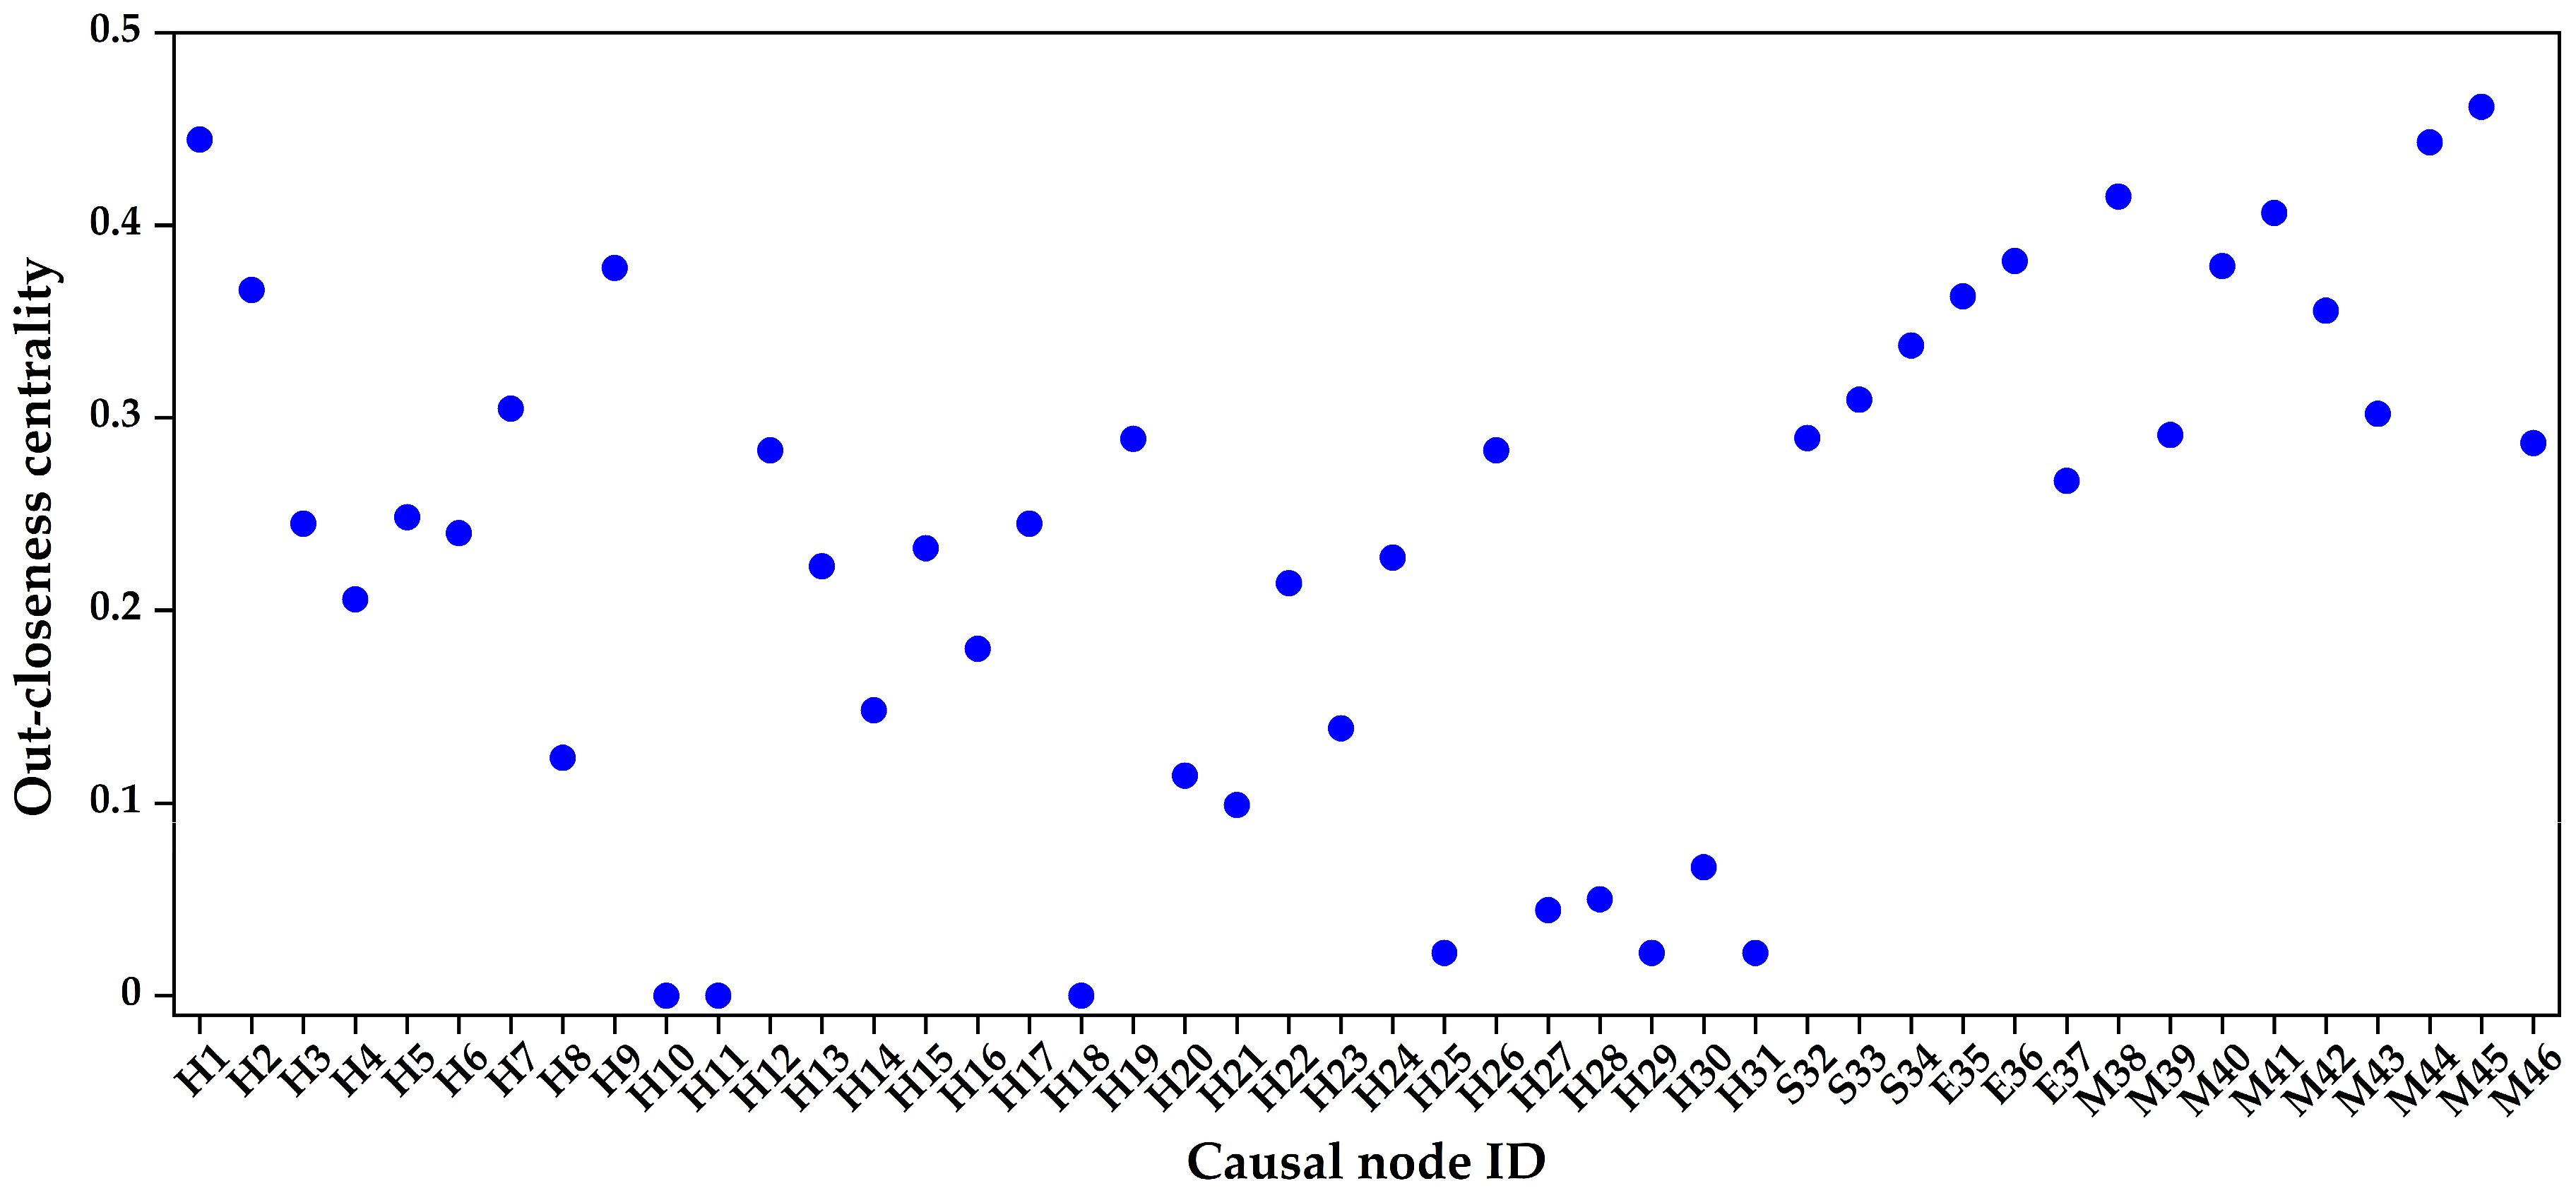
Figure 7 presents the reachability-adjusted out-closeness centrality of the 46 causal nodes. The highest values were observed for M45 (0.461), H1 (0.444), M44 (0.443), M38 (0.415), and M41 (0.406). E36 (0.381), M40 (0.379), and H9 (0.378) also showed relatively high values.
Across these eight nodes, reachable set sizes ranged from 17 to 35, while mean directed path lengths within the reachable sets ranged from 1.00 to 1.71. Their high out-closeness values therefore reflected different combinations of downstream reachability and short directed paths.
The reachability adjustment downweighted nodes that could reach only a limited subset of the network, even when the corresponding path lengths were short. For example, H25, H29, and H31 each reached only one downstream node and had out-closeness values of 0.022. H10, H11, and H18 had zero out-closeness because they could not reach any other causal node after terminal node C was excluded.
Out-closeness was interpreted as a descriptive measure of network position rather than a direct measure of causal influence or intervention priority. Key-node identification therefore additionally considered betweenness centrality, node removal effects, and motif roles.

4.1.4. Betweenness Centrality

Betweenness centrality was calculated for the same 46-node directed network using Equation (11). The values ranged from 0 to 0.0943, and 15 nodes (32.61%) had a betweenness centrality of zero. H1 (0.0943), H9 (0.0602), and H19 (0.0267) had the highest values. Together, these three nodes accounted for 69.53% of the total betweenness centrality. This concentration indicates that shortest directed paths were disproportionately channeled through a small subset of nodes.
Within the aggregate network, H1, H9 and H19 occupied bridge positions between nodes associated with information acquisition, risk assessment and maneuver execution. Betweenness centrality describes structural position rather than causal effects or intervention outcomes. Likewise, zero betweenness does not imply an absence of causal or operational relevance.

4.2. Topological Response to Node Removal

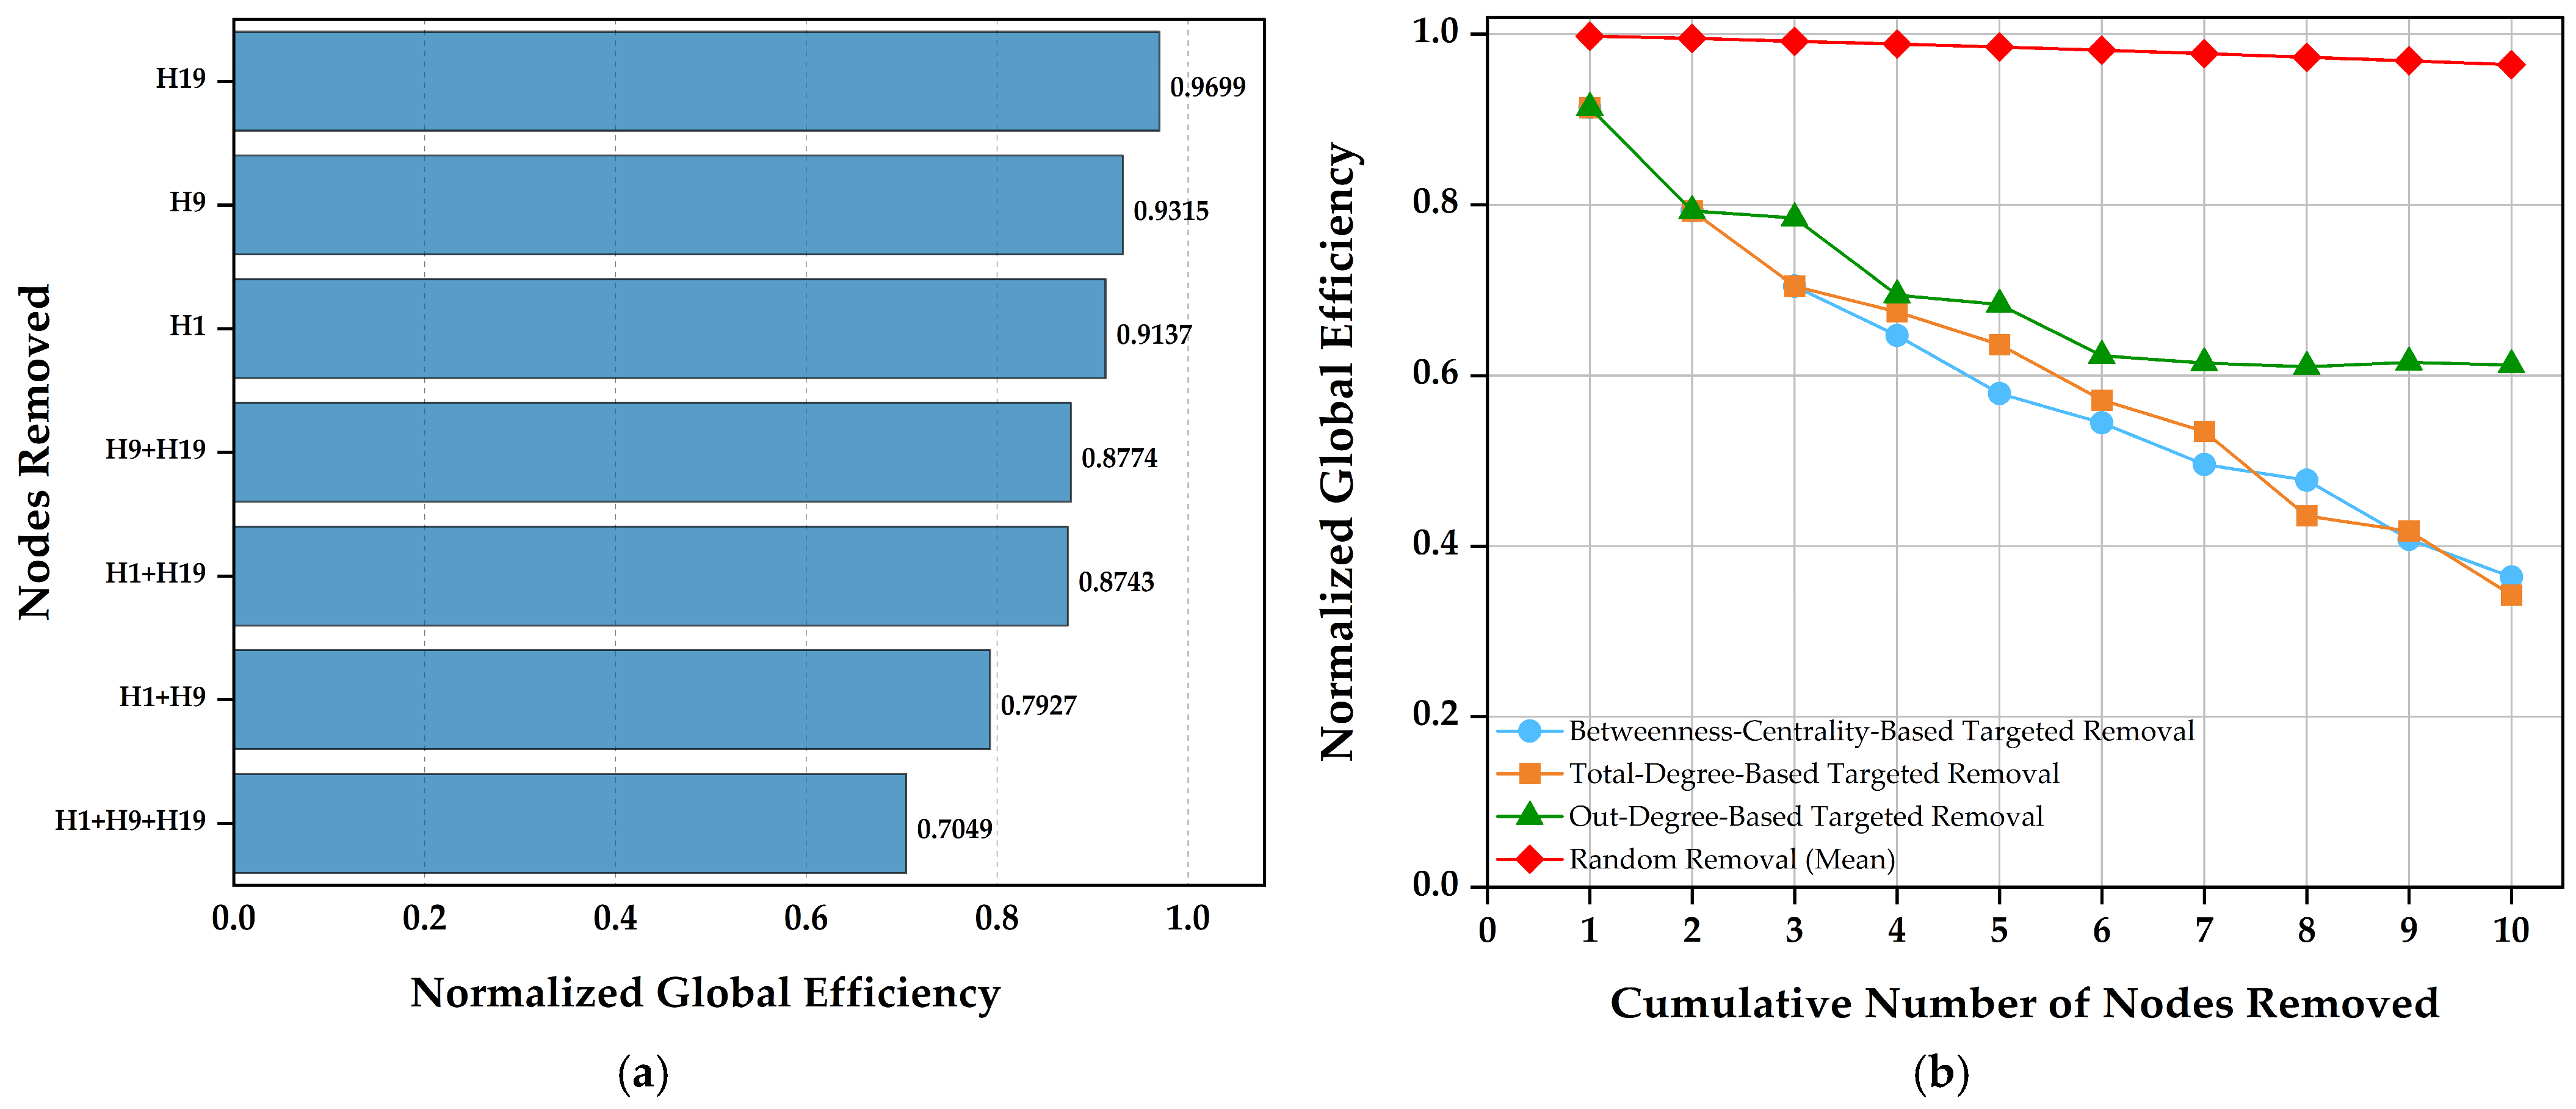
We examined the stability of key-node identification and the effect of node removal on global efficiency and directed reachability. High-betweenness nodes H1, H9, and H19 were removed individually and in combination (Figure 8a).
Removing H1, H9, or H19 reduced normalized global efficiency to 0.9137, 0.9315, and 0.9699, respectively. These values corresponded to decreases of 8.63%, 6.85%, and 3.01%. The largest reduction followed the removal of H1, consistent with the strong bridging position of inadequate lookout.
Combined removal produced larger changes. Removing H1 + H9, H1 + H19, or H9 + H19 reduced normalized efficiency to 0.7927, 0.8743, and 0.8774, respectively. Removing all three nodes reduced the value to 0.7049, a cumulative decrease of 29.51%. These nodes are therefore structurally associated with maintaining directed reachability in the aggregate network.
We next compared cumulative removal based on fixed rankings by total degree, betweenness centrality and out-degree with 10,000 random node permutations (Figure 8b). After ten removals, the normalized global efficiency was 0.3430, 0.3639 and 0.6124 for the three targeted strategies, respectively. The random removal mean was 0.9642 (95% empirical interval, 0.7658–1.0862). All targeted strategies therefore produced larger reductions in normalized global efficiency than random removal. The largest changes occurred under total degree- and betweenness-based removal. These scenarios represent hypothetical topological perturbations and do not estimate intervention effects or proportional changes in real-world collision risk.
Together, the degree, betweenness and node removal analyses identified H1, H9 and H19 as structural bridges in the observed aggregate network. Their event-level relevance was evaluated separately through motif roles and repeated accident evidence in Section 4.3.

4.3. Directed Triad Motifs Under Two Null Models

4.3.1. Random Network Quality and Overall Structural Signals

All 1000 primary networks generated under each null model satisfied the prespecified hard constraints, and every network was unique. For Null A, the mean acceptance was 0.3643, the median edge-replacement fraction was 0.6097, and the mean pairwise Jaccard similarity was 0.2432. The corresponding values for Null B were 0.1364, 0.5335, and 0.3044, respectively. The lower acceptance and greater similarity under Null B were consistent with its stronger constraints, while both ensembles retained substantial variation.
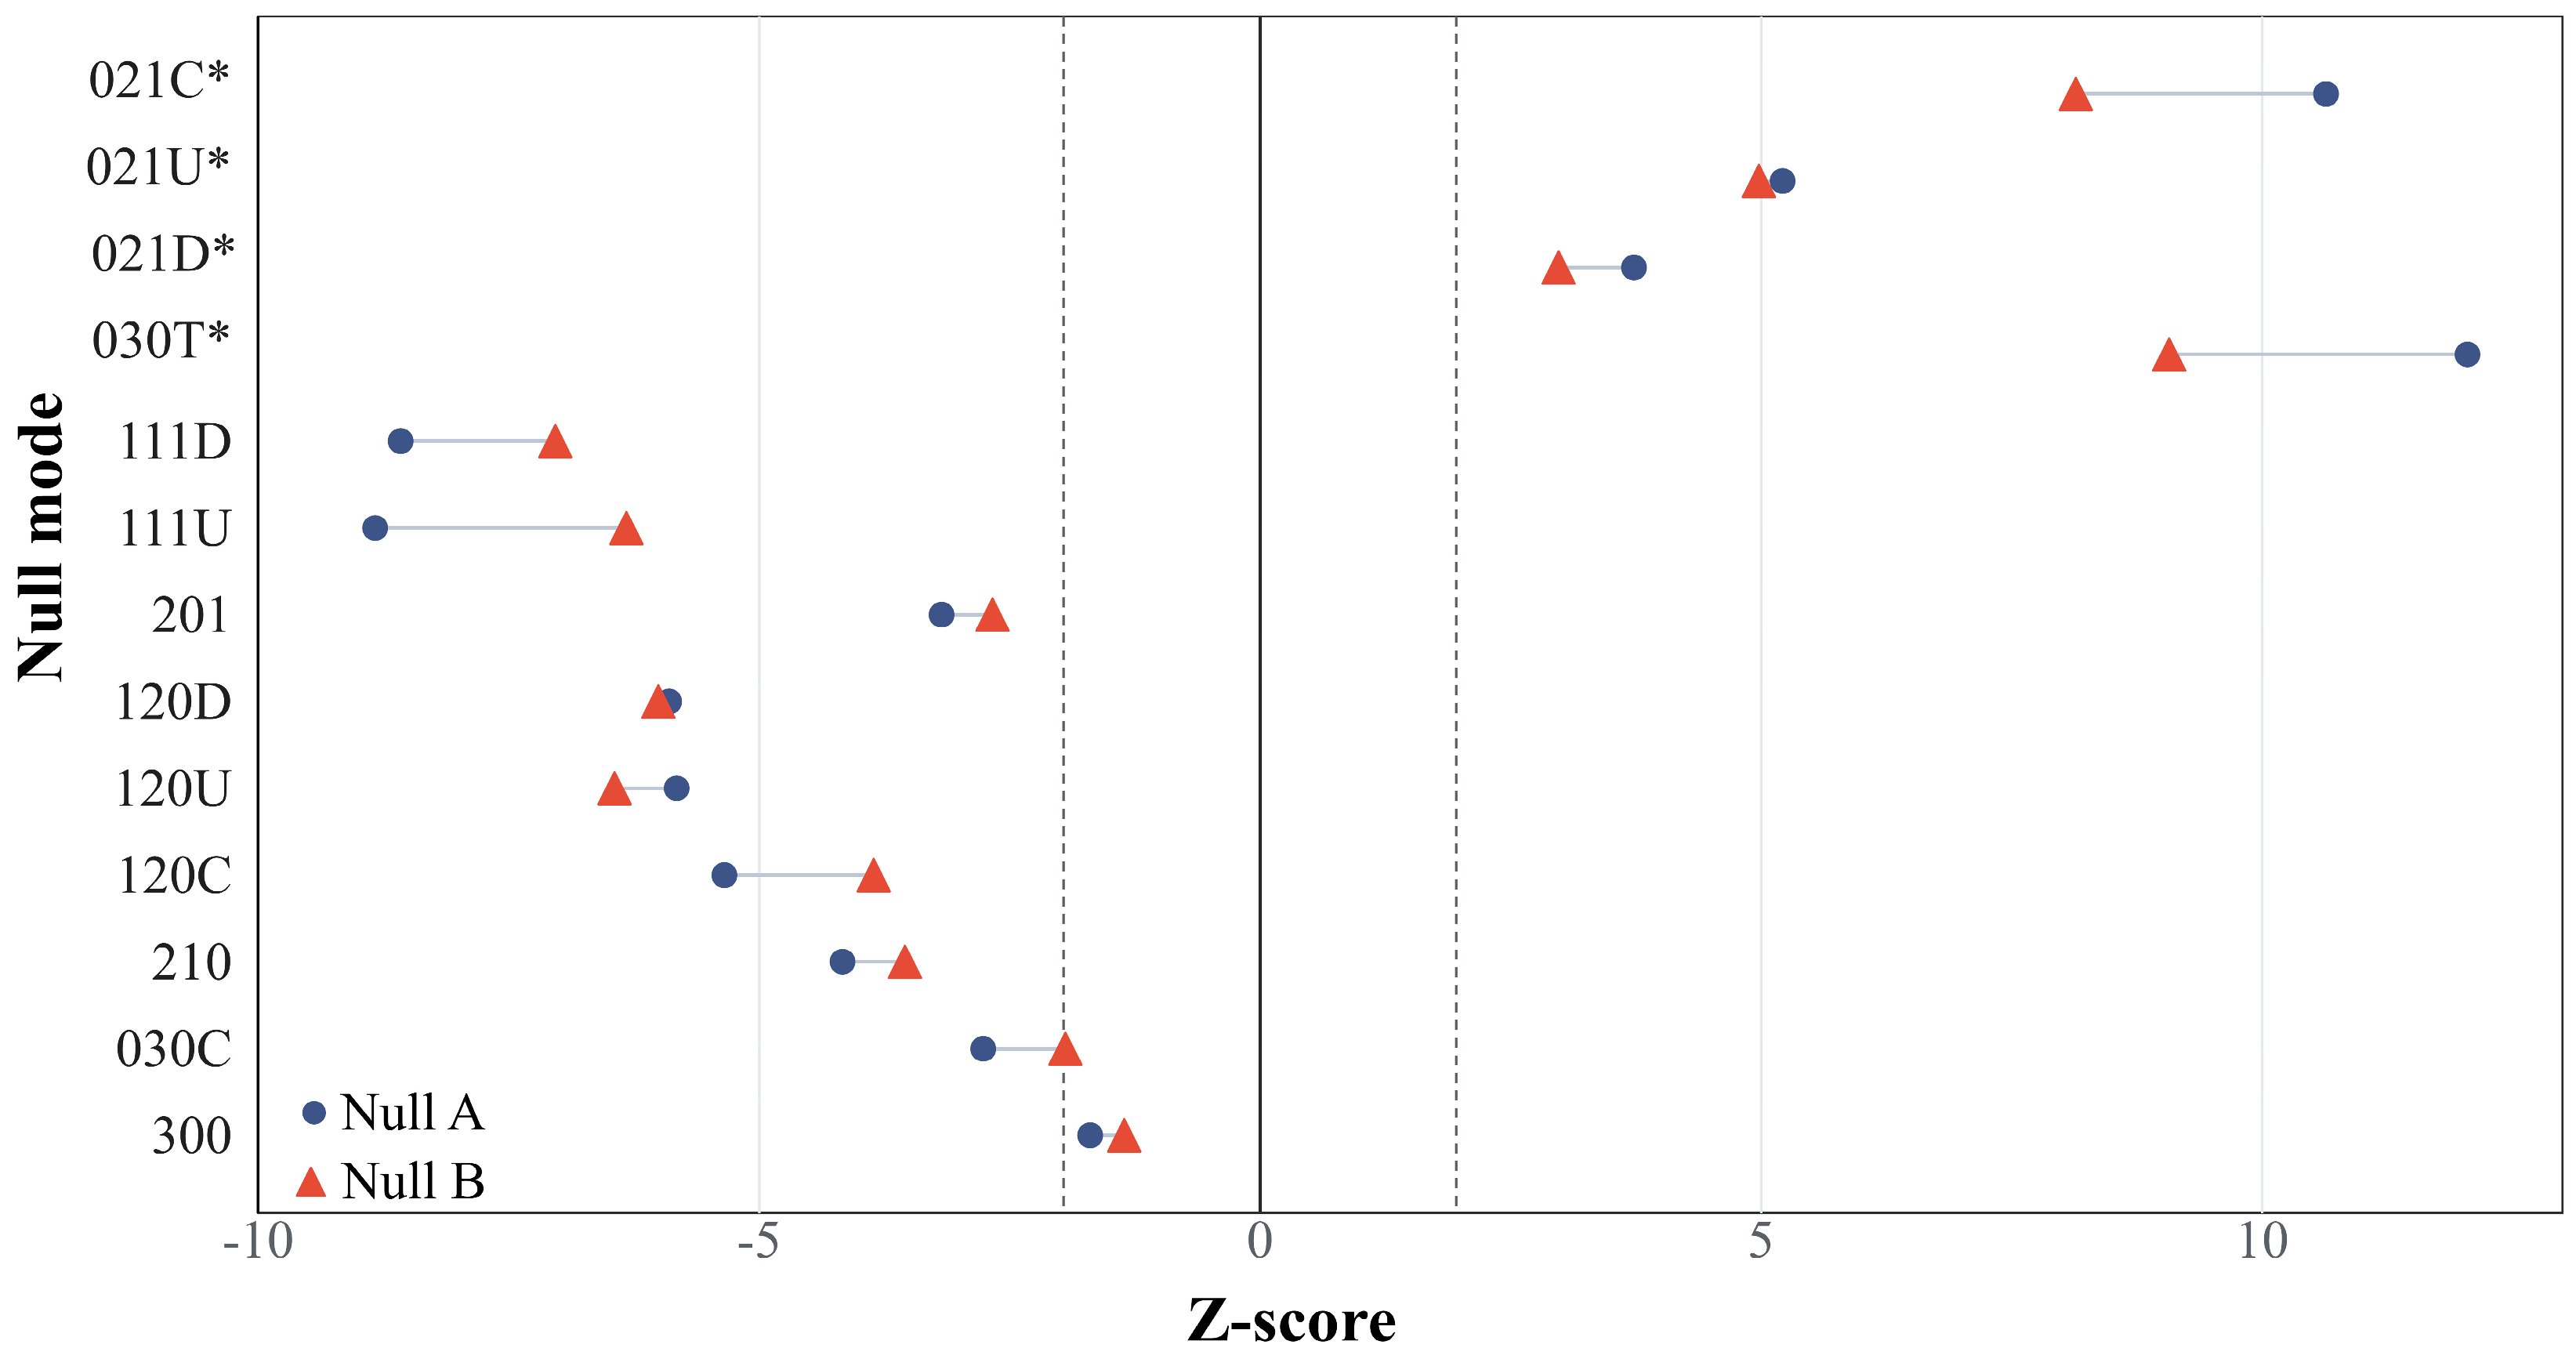
Eleven of the 13 connected triad types met the dual-null criteria. Four triads, 021C, 021U, 021D, and 030T, were overrepresented. Seven triads, 111D, 111U, 201, 120D, 120U, 120C, and 210, were underrepresented. Triad 030C showed borderline underrepresentation, whereas 300 lacked a robust dual-null signal. Complete observed counts, null means, 95% empirical intervals, Z scores, empirical p values, and BH-adjusted q values are reported in Supplementary Table S5. Figure 9 summarizes the corresponding Z scores under both null models.

4.3.2. Multilevel Evidence for Overrepresented Motifs

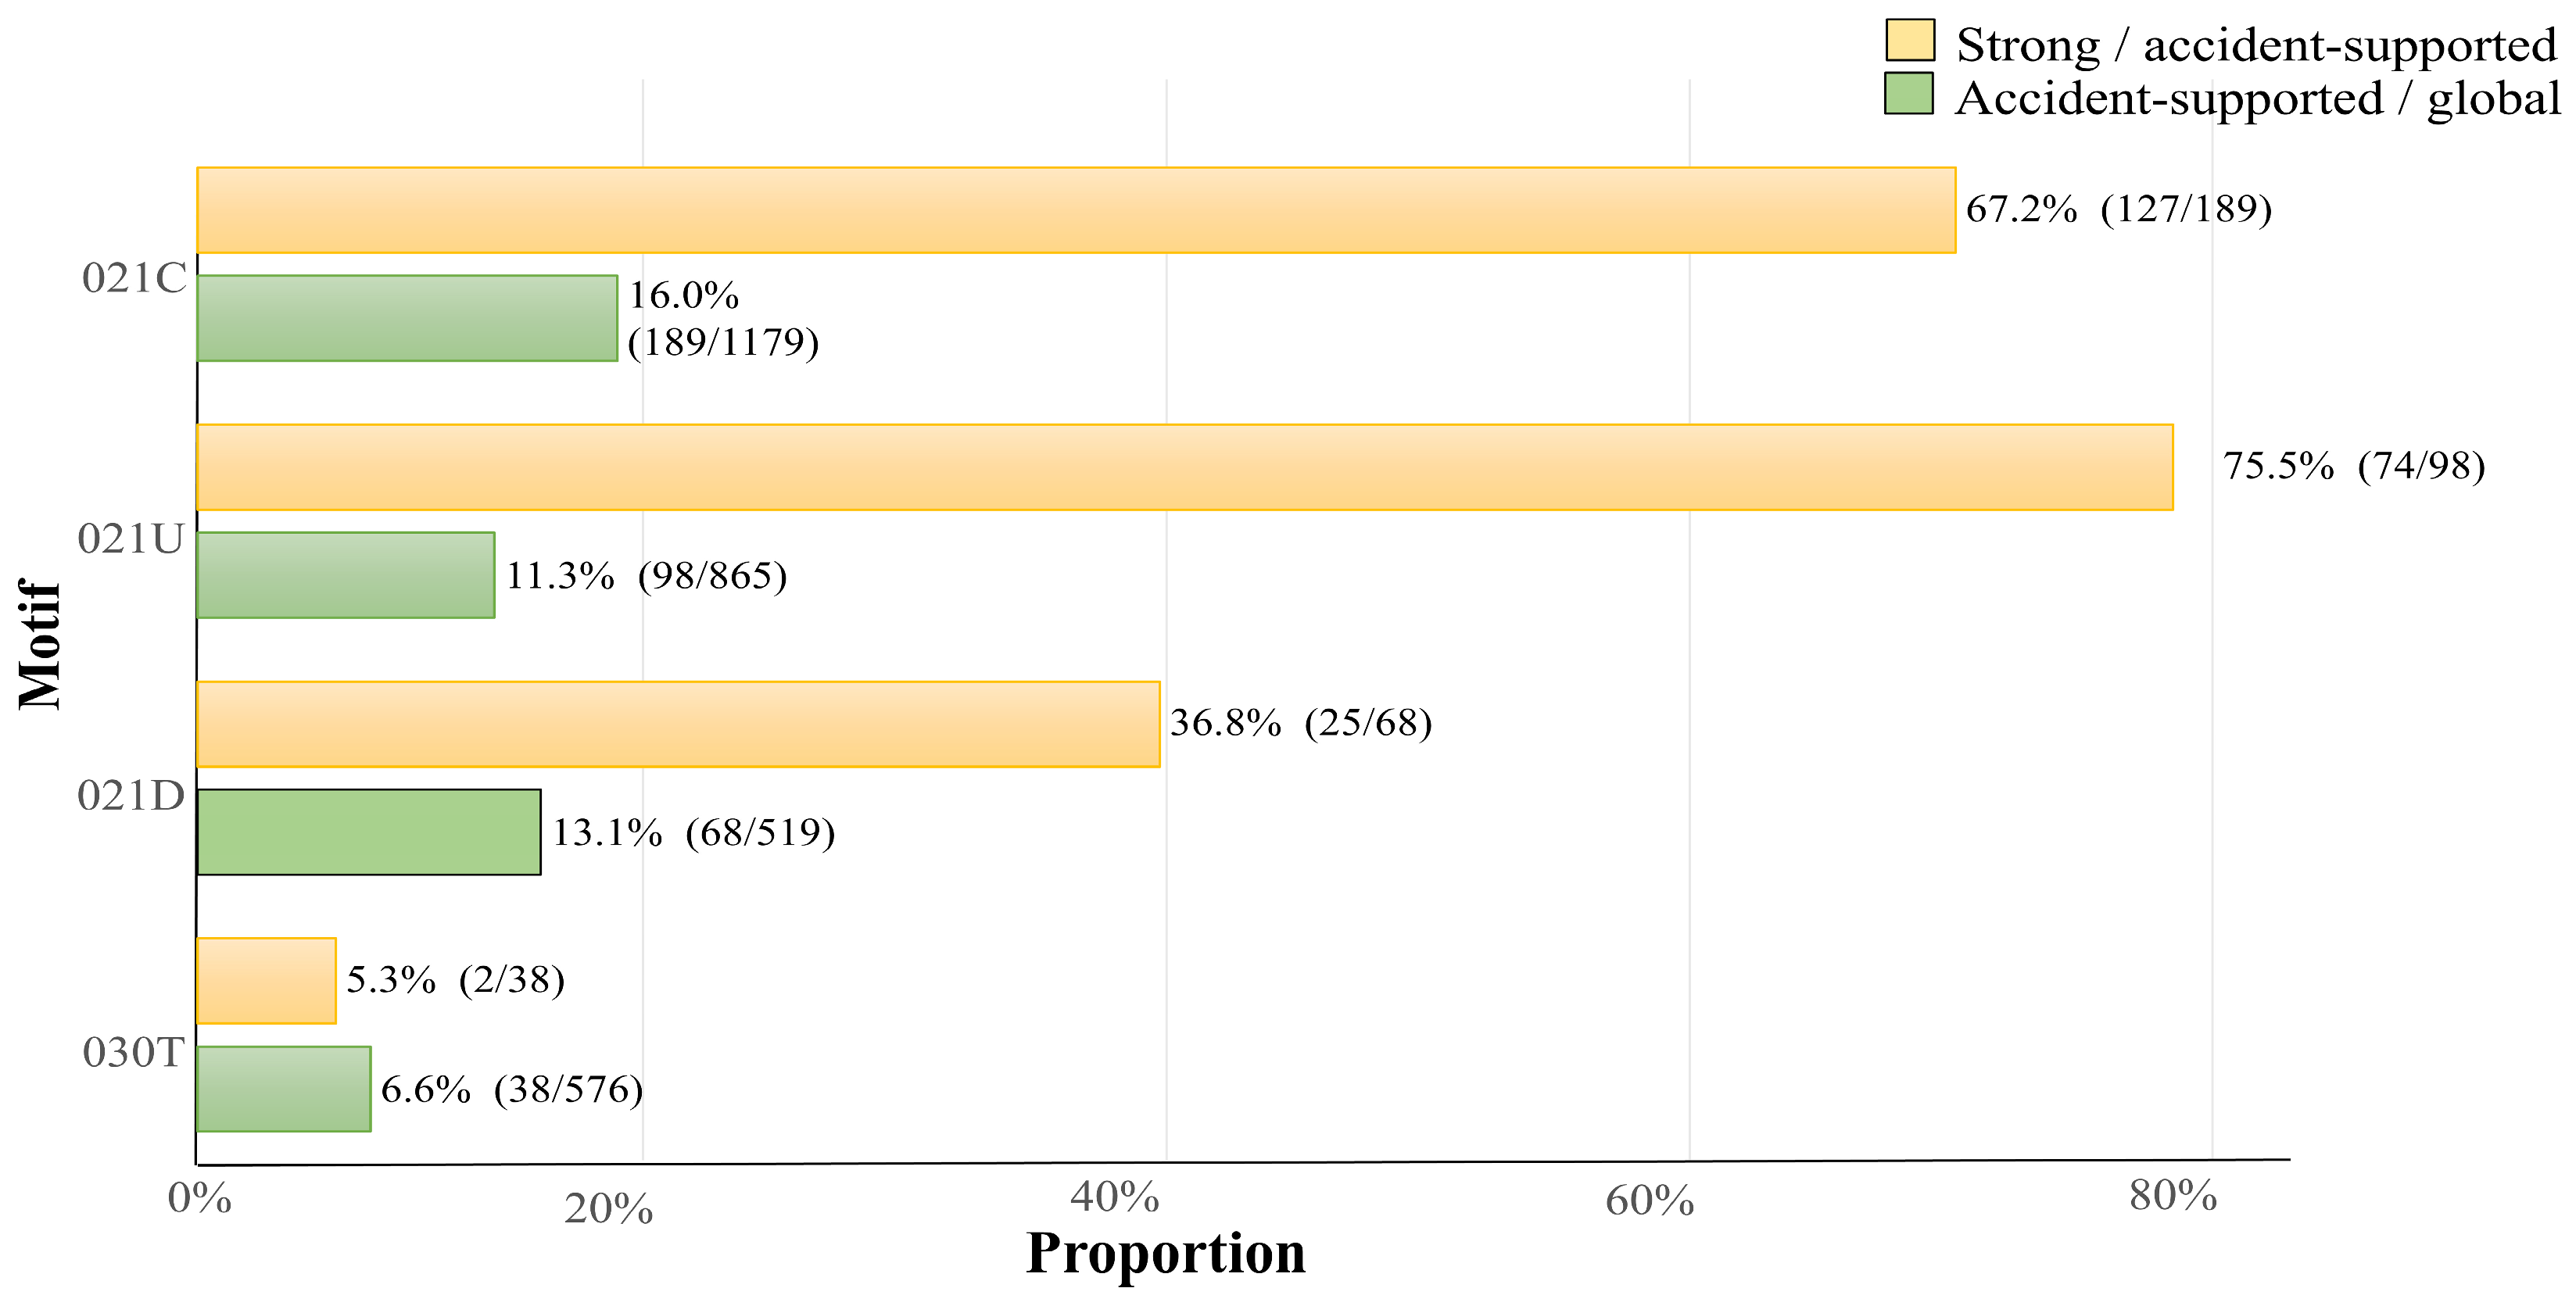
Figure 10 and Table 7 summarizes the dual-null results and multilevel evidence for the four robustly overrepresented motifs. Accident-supported instances accounted for only 6.6–16.0% of global instances, showing that most aggregate configurations lacked all required edges within a single accident.
Instance counts refer to unique node triads, whereas accident counts record the accidents in which those triads recurred. A single node triad could therefore contribute to more than one accident count. Triad 021C had the strongest accident-level evidence for a forward structure. Of the 189 accident-supported instances, 127 met the same-chain criterion (67.2%); collectively, these strongly supported configurations were observed in 129 distinct accidents. Node H1 occupied the middle position in 362 global 021C instances, consistent with its high betweenness. Two representative sequences received same-chain support. The sequence from violation of watchkeeping requirements, through inadequate lookout, to failure to issue a warning was supported in six accidents. The sequence from insufficient manning, through inadequate lookout, to failure to discharge stand-on vessel duties was supported in four accidents. Thus, some report-supported chains of responsibility connect duty or resource constraints sequentially to situation awareness deficiencies, rule compliance, and inadequate maneuver execution.
Triad 021U represented convergence of several antecedents on a common failure within the same responsible vessel. Of 865 global instances, 98 had accident support, and 74 met the same-vessel criterion, representing 75.5% and covering 100 accidents. The convergent configuration in which inadequate lookout and improper use of navigational aids both pointed to delayed or incorrect collision risk assessment had same-vessel strong support in 21 accidents. A second convergent configuration, in which insufficient manning and unlicensed operation both pointed to inadequate lookout, recurred in six accidents. Thus, within a responsible vessel, inadequate collision risk assessment could co-occur with deficiencies in information acquisition, equipment use, staffing or qualifications rather than with a single isolated antecedent.
Although 021D passed both null tests, its event-level support was weaker. Only 25 of 68 accident-supported instances met the same-vessel criterion (36.8%), covering 39 accidents. The divergent configuration in which insufficient manning pointed to both inadequate lookout and improper use of navigational aids had strong support in seven accidents. These instances linked one upstream constraint to deficiencies at multiple operational stages, although many global instances combined edges from different responsible vessels. Triad 021D should therefore be interpreted as supporting evidence for same-vessel branching. For 030T, the observed count was 576, with Z scores of 12.05 under Null A and 9.07 under Null B. Only 38 instances had accident support, and two met the strong support criterion (5.3%). No strongly supported configuration recurred across accidents. Triad 030T was therefore observed mainly as aggregate transitive closure across accidents, responsibility chains and responsible vessels, rather than as a recurrent single-vessel chain. The corresponding support proportions are summarized in Figure 10.

4.3.3. Sensitivity to Swap Depth

All 100 Null B networks generated at 20-fold swap depth were unique and passed the structural checks. The median acceptance was 0.1368, the median edge-replacement fraction was 0.5353, and the mean pairwise Jaccard similarity was 0.3045. Relative to the 10-fold primary analysis, the null means for 021C, 021U, 021D, and 030T changed by 1.06%, 0.19%, 0.08%, and 2.38%, respectively. Their Z scores changed from 8.14, 4.98, 2.98, and 9.07 to 8.47, 5.54, 3.16, and 8.17, respectively. These unchanged directions and classifications indicate that core motif identification was robust to the tested increase in swap depth.
All 448 recorded states, including the 400 post-burn-in samples, satisfied the structural constraints. Across the prespecified post-burn-in diagnostics, the maximum R-hat was 1.0022, and the minimum approximate effective sample size was 349.5. Across the eight chains, the mean Jaccard similarity to the observed edge set changed by only 0.0186 between the recorded 20-fold burn-in endpoint and the 270-fold endpoint. These results support adequate empirical mixing for the reported statistics within the explored communicating component, subject to the state space qualification stated in Section 3.5.5.

4.3.4. Robustness and Sensitivity Analyses

The primary core motif classifications remained unchanged across the structural sensitivity analyses. Under the four-domain partition, Z scores ranged from 3.98 for 021D to 11.61 for 030T, and all four q values were 0.0022. The four motifs also remained overrepresented at each edge support threshold under both null models. After adjudication, the networks supported by at least two, three, and five accidents contained 159, 96, and 63 edges, respectively. At the two-accident threshold, the Null B Z scores ranged from 4.42 to 6.86, and all four q values were 0.00325. Core motif directions were also unchanged in both severity groups.
Frequency weighting preserved the principal node rankings. Edge support ranged from 1 to 200 accidents, with a median of 2 and a mean of 6.07; 110 of 269 edges occurred in only one accident. The Spearman correlations were 0.941 for in-degree versus in-strength, 0.932 for out-degree versus out-strength, and 0.897 for total degree versus total strength. The corresponding top-ten overlaps were seven, eight, and nine nodes. H1, H9, and H19 ranked first to third by both binary total degree and weighted total strength.
The weighted motif results were more selective. Under global weight permutation, 021C and 030T were concentrated on high-support edges after correction across 13 triads (both q = 0.00130), whereas 021D (q = 0.127) and 021U (q = 1.000) were not. After weights were permuted within source–target functional block strata, only 030T remained significant (q = 0.00260). The 021C signal attenuated to q = 0.0767, and 021D and 021U remained non-significant. Thus, node-level prominence was stable to frequency weighting, but only 030T showed recurrence concentration beyond the allocation of high-support edges across functional blocks.
Relation-evidence filtering imposed a stronger boundary. The E1, E1–E2, E1–E3, and E1–E4 networks contained five, 62, 96, and 112 edges, leaving 41, 16, 10, and seven isolates, respectively. The sparse E1 network contained only five observed connected triads and was treated descriptively. In each cumulative E1–E2, E1–E3, and E1–E4 network, the four primary motifs remained significant under the degree-preserving null model. None remained significant under the five-block-constrained null model, for which all four q values were 1.000. These results indicate that the primary classifications are sensitive to narrower relation-evidence rules.
All four observed accident-supported counts exceeded the within-accident permutation baselines. The observed and expected counts were 189 and 42.93 for 021C, 98 and 11.85 for 021U, 68 and 11.62 for 021D, and 38 and 5.16 for 030T, respectively. The upper-tail BH-adjusted q value was 0.00010 for each motif.
Among the 364 accidents, 45.3%, 33.2%, 27.5%, and 14.0% contained at least one accident-supported 021C, 021U, 021D, and 030T instance, respectively. The corresponding 95% bootstrap intervals were 40.1–50.5%, 28.6–37.9%, 23.1–32.1%, and 10.4–17.6%. The proportions containing at least one strongly supported instance were 35.4%, 27.5%, 10.7%, and 0.55%, with intervals of 30.5–40.4%, 22.8–32.1%, 7.7–14.0%, and 0–1.37%, respectively.
Complete dual-null statistics for all 13 connected triads are reported in Supplementary Table S5. Modules S7–S10 provide the corresponding sensitivity distributions, evidence-restricted results, and randomization diagnostics.

5. Discussion

5.1. Main Finding: Separating Structural Enrichment from Event-Level Evidence

The central finding is not simply that four directed triads were robustly overrepresented under both null models. Event-level back-tracing substantially narrowed their interpretable scope. Accident-supported instances represented 16.0%, 11.3%, 13.1%, and 6.6% of global 021C, 021U, 021D, and 030T instances, respectively. Motif-specific strongly supported instances represented 10.8%, 8.6%, 4.8%, and 0.35% of the corresponding global counts. Because strong support criteria differ among motifs, these percentages describe within-motif attrition from global structure to event evidence and should not rank motifs directly. Interpretation also considered the number of supported instances and recurrence across accidents.
Triads 021C and 021U provided the clearest evidence of forward association within a chain of responsibility and multifactor convergence within one vessel at fault. Triad 021D had limited support for same-vessel branching. Despite strong statistical enrichment, most 030T instances combined edges from different accidents, vessels, or chains of responsibility and mainly captured transitive closure in the aggregate network. Structural anomaly relative to constrained random networks and evidential recurrence within an event are therefore distinct properties. The former cannot substitute for the latter.
The new sensitivity analyses clarified two different dimensions of robustness. Frequency weighting preserved the leading node rankings, but only 030T remained concentrated on high-support edges after functional block stratification. Relation-evidence filtering was more consequential: none of the four primary motifs survived the block-constrained test in the cumulative E1–E4 network. The primary motifs should therefore be interpreted as aggregate structures produced by the complete, prespecified coding framework. Their stability across recurrence thresholds does not imply stability under narrower definitions of relation-level evidence.
Previous complex network studies of ship collisions have used centrality, node removal, influence strength and risk rankings to identify key factors [6,7]. Our framework extends these approaches by combining STPA-guided coding and inter-coder reliability with two constrained null models, swap depth sensitivity analysis and multilevel evidence tracing. It evaluates whether local enrichment persists after accounting for node degree and functional block architecture and whether the required edges recur within the same accident. Collectively, these elements establish an auditable link between systems-theoretic control semantics, constrained structural inference, and event-level accident evidence.

5.2. Event-Supported Local Structures: Forward Association Within Chains of Responsibility and Same-Vessel Convergence

Strongly supported 021C instances indicate forward associations within chains of responsibility. In some accidents, upstream constraints included insufficient manning, poor performance of the master’s duties, and deficiencies in training or competence. These constraints were linked sequentially to inadequate lookout, improper use of navigational aids, or poor collision risk assessment. These intermediate deficiencies are then connected to warnings, speed control, or collision avoidance duties. Node H1 (failure to maintain a proper lookout) often occupied the middle position, linking upstream management constraints to downstream deficiencies in assessment and action.
Triad 021U captured convergence of several factors on one functional deficiency within the same vessel at fault. For example, H1 (failure to maintain a proper lookout) and H6 (improper use of navigational aids) converged on H9 (failure to assess collision risk correctly and in time). This same-vessel configuration was strongly supported in 21 accidents. Deficiencies in information acquisition and equipment use therefore accompanied inadequate risk assessment within the same vessel. Staffing and qualification problems, including insufficient manning and unlicensed operation, showed similar convergence on lookout or assessment. Some collisions are thus not adequately explained by one operational error but involve several control deficiencies constraining a critical navigational function.
These interpretations align with HFACS findings on lookout, instrument use, situation awareness, inter-vessel communication, bridge resource management, and safety management systems [4]. They also accord with Bayesian network evidence that human and non-human factors jointly influence maritime accidents [5]. Our analysis differs by testing local structure against constrained random expectations before determining whether the required relations recur within the same accident. Triads 021C and 021U are therefore best interpreted as event-supported local structures.

5.3. Scale Separation Between Aggregate Topology and Event-Level Structure

Triads 021D and 030T continued to reveal a scale mismatch between accident-level recurrence and responsibility-specific evidence. The 68 accident-supported 021D instances exceeded the permutation mean of 11.62. However, only 25 met the same-vessel strong support criterion. Triad 021D therefore showed non-random accident-level recurrence but limited responsibility-specific support for branching.
The 38 accident-supported 030T instances also exceeded the permutation mean of 5.16. Nevertheless, only two of 576 global instances met the same-vessel and same-chain-backbone criteria. These instances occurred in two accidents, corresponding to a strong support prevalence of 0.55% (95% bootstrap interval, 0–1.37%). Triad 030T can therefore recur within accidents above a topology-conditional baseline, but evidence for repeated closed processes within responsibility chains remains sparse. Its global enrichment is therefore interpreted primarily as aggregate transitive closure.
This distinction is the study’s main methodological implication. Null A removes structural expectations induced by in-degree and out-degree, and Null B additionally controls connectivity among functional blocks. Event-level back-tracing then tests whether the required global edges coexist in one evidence unit. The properties preserved or randomized by a reference model determine the scientific question addressed by statistical deviation [14,32,33,34]. Even a significantly enriched local structure can result from combining relations across accidents. The system-descriptive value of aggregate topology can thus be separated from the local explanatory value of event-level structure.

5.4. Interpretive Boundaries and Safety Management Implications

We propose three criteria for interpreting local structures in accident networks. First, nodes and edges should have explicit system-control semantics. Second, the structure should deviate robustly from a matched reference model. Third, relevant event-level evidence should be available. Centrality, global efficiency and node removal results describe aggregate position and reachability but do not independently support event-level interpretation. This rule extends approaches based solely on frequency, centrality, or significance rankings.
Different motifs can inform different audit questions. Triad 021C can be used to examine whether upstream management constraints are linked sequentially to lookout, equipment use, risk assessment and maneuver execution within a chain of responsibility. The results therefore motivate joint examination of manning, competence and master performance alongside operational lookout and rule compliance. Triad 021U can similarly inform checks for multiple deficiencies converging on the same navigational function. One example is the co-occurrence of inadequate lookout, improper use of navigational aids and poor risk assessment within the same responsible vessel. These configurations can inform integrated audit questions rather than isolated single-factor checks.
Triad 021D provides a supplementary indication of possible same-vessel branching, whereas 030T mainly describes aggregate network structure. Both motifs generate audit prompts or hypotheses rather than direct intervention prescriptions; implementation requires validation with operational data, independent accident samples, or prospective evaluation.

5.5. Limitations and Directions for Validation

Although inter-coder reliability assessment, dual-null modeling, swap depth sensitivity analysis, and event-level back-tracing addressed several sources of uncertainty, the study remains subject to limitations in its data source, evidence coding, network representation, and reference model specification.
First, all 364 accidents came from publicly released Chinese official investigation reports. The study analyzes local structures in published causal evidence rather than national collision incidence or population prevalence of specific factors. Report production and disclosure may depend on accident severity, investigation practice, and documentation conventions. Unpublished accidents, near misses, and reports from other jurisdictions were not included. The identified structures therefore apply first to the present evidence base and require testing under other regulatory systems, navigational environments, and vessel populations.
Second, the primary aggregate network was directed, binary, and unweighted. This representation matched the primary question of whether report-supported relations and local topological configurations existed. Frequency-weighted sensitivity showed that the leading node ranks were stable, but only 030T remained concentrated on high-support edges after functional block stratification. Accident support therefore adds information about recurrence, but it is not a calibrated measure of causal strength, temporal proximity, or intervention effect. We consequently did not convert recurrence weights into path lengths for weighted closeness, betweenness, efficiency, or node removal analyses.
Third, relation direction could be supported by explicit pairwise language, process order, common responsibility attribution, or prespecified STPA control logic. Retrospective filtering showed that motif results were sensitive to these categories. The E1 network was too sparse for stable inferential randomization, and none of the four primary motifs remained significant under the five-block-constrained null model in the cumulative E1–E4 network. The complete network should therefore be interpreted as a model generated under the prespecified coding framework, not as a set of experimentally identified causal effects. Although the blinded evidence-tier sample showed high agreement, the possibility of systematic interpretive bias shared by both coders cannot be excluded.
Fourth, within-accident permutation and accident-cluster bootstrap addressed dependence among nodes, edges, and overlapping motif instances. All four motifs exceeded the topology-conditional permutation baseline, and the bootstrap quantified uncertainty at the accident level. However, the permutation did not preserve responsible vessel or responsibility chain labels. The bootstrap also represents uncertainty within the 364 published reports and does not correct reporting or disclosure bias. These analyses strengthen evidence for non-random event-level recurrence, but they do not establish population prevalence or causal effects.
Fifth, Null B remains conditional on the selected functional classification. The four core motifs retained their deviation directions and significance classifications under the alternative human, ship, environmental, and management partition. This result reduces concern that the findings were unique to the five-block scheme. However, the analysis tested one theoretically defensible alternative and does not establish robustness across every possible classification.

6. Conclusions

The primary 46-node, 269-edge network contained four triads that were overrepresented under degree-preserving and functional block-preserving null models. Their structural classifications were stable across an alternative partition, recurrence thresholds, and severity groups. Frequency weighting preserved the leading node rankings, but only 030T remained concentrated on high-support edges after functional block stratification.
Relation-evidence filtering imposed a stronger boundary. The cumulative E1–E4 network retained 112 relations, yet none of the four primary motifs remained significant under the functional block-preserving null model. These findings distinguish stability under repeated observation from stability under narrower relation-evidence rules. The primary motifs should therefore be interpreted as aggregate process structures generated by the complete STPA coding framework.
Event-level back-tracing further showed that 021C and 021U had the clearest support within responsibility chains and responsible vessels. Triad 030T was recurrently weighted but was rarely reconstructed as a complete process within one responsibility chain, indicating aggregate transitive closure. Combining constrained reference models, recurrence weights, evidence grading, and event-level validation provides a transparent route from qualitative accident reports to bounded structural inference.

Supplementary Materials

The following supporting information can be downloaded at: https://www.mdpi.com/article/10.3390/jmse14171620/s1. The supporting information comprises Supplementary Methods, Tables S1–S5, Figure S1, and Modules S1–S10 containing the source index and coded data for 364 reports. These materials include the coding dictionary, directed edge rules, original reliability files, adjudication records, three complete coding examples, network-provenance audits, node removal outputs, and complete statistics for all 13 connected directed triads. The robustness modules provide results for alternative functional partitions, corrected edge support thresholds, severity strata, event-level permutations, accident-cluster bootstrap analyses, and Null B mixing diagnostics. Separate modules contain the author-verified relation-evidence audit, the blinded 60-unit reliability sample and adjudication record, cumulative evidence network results, frequency-weighted node and motif analyses, executable code, random seeds, and quality-control records. A master README documents the role of each file and the corresponding reproduction workflow.

Author Contributions

Conceptualization, Y.L., L.Z. and Y.R.; Methodology, Y.L.; Formal analysis, Y.L.; Data curation, Y.L.; Writing—original draft preparation, Y.L.; Writing—review and editing, Y.R. and L.Z.; Funding acquisition, Y.R. and Y.H. All authors have read and agreed to the published version of the manuscript.

Funding

This research was funded by the Ministry of Agriculture and Rural Affairs of China, grant number B050102.

Data Availability Statement

The coded accident-level dataset, source index, coding manual, inter-coder reliability files, node mappings, network-provenance tables, complete primary and sensitivity analysis outputs, and executable reproduction scripts accompany this article as Supplementary Materials. The original investigation reports were issued by the relevant Chinese maritime authorities and can be accessed through the URLs in the source index; the Maritime Safety Administration collection is available at https://www.msa.gov.cn/html/cnmsa/hxaq/sgjx/index.html?hcv=1U3u12EMIgwYexW5F (accessed on 30 August 2026). The original report files are not redistributed. The scripts reconstructed solely for reproduction are identified as such and are not presented as the historical line-by-line analysis code.

Conflicts of Interest

The authors declare no conflicts of interest.

References

  1. Antão, P.; Sun, S.; Teixeira, A.P.; Guedes Soares, C. Quantitative assessment of ship collision risk influencing factors from worldwide accident and fleet data. Reliab. Eng. Syst. Saf. 2023, 234, 109166. [Google Scholar] [CrossRef] [Scilit]
  2. Yan, K.; Wang, Y.; Jia, L.; Wang, W.; Liu, S.; Geng, Y. A content-aware corpus-based model for analysis of marine accidents. Accid. Anal. Prev. 2023, 184, 106991. [Google Scholar] [CrossRef] [Scilit]
  3. Liu, Z.; Zhang, B.; Zhang, M.; Wang, H.; Fu, X. A quantitative method for the analysis of ship collision risk using AIS data. Ocean Eng. 2023, 272, 113906. [Google Scholar] [CrossRef] [Scilit]
  4. Chauvin, C.; Lardjane, S.; Morel, G.; Clostermann, J.P.; Langard, B. Human and organisational factors in maritime accidents: Analysis of collisions at sea using the HFACS. Accid. Anal. Prev. 2013, 59, 26–37. [Google Scholar] [CrossRef] [Scilit]
  5. Fan, S.; Blanco-Davis, E.; Yang, Z.; Zhang, J.; Yan, X. Incorporation of human factors into maritime accident analysis using a data-driven Bayesian network. Reliab. Eng. Syst. Saf. 2020, 203, 107070. [Google Scholar] [CrossRef] [Scilit]
  6. Zhang, X.; Chen, P.; Mou, J.; Chen, L.; Li, M. Critical causation factor analysis in ship collision accidents with complex network. Ocean Eng. 2025, 315, 119837. [Google Scholar] [CrossRef] [Scilit]
  7. Ma, J.; Tian, H.; Xu, L.; Xu, T.; Yang, H.; Gao, F. Semi-automatic construction and analysis of complex networks for ship collision accidents. Ocean Coast. Manag. 2025, 261, 107519. [Google Scholar] [CrossRef] [Scilit]
  8. Shi, J.; Liu, Z.; Feng, Y.; Wang, X.; Zhu, H.; Yang, Z.; Wang, J.; Wang, H. Evolutionary model and risk analysis of ship collision accidents based on complex networks and DEMATEL. Ocean Eng. 2024, 305, 117965. [Google Scholar] [CrossRef] [Scilit]
  9. Patriarca, R.; Chatzimichailidou, M.; Karanikas, N.; Di Gravio, G. The past and present of System-Theoretic Accident Model And Processes (STAMP) and its associated techniques: A scoping review. Saf. Sci. 2022, 146, 105566. [Google Scholar] [CrossRef] [Scilit]
  10. Ahmadi Rad, M.; Lefsrud, L.M.; Hendry, M.T. Application of systems thinking accident analysis methods: A review for railways. Saf. Sci. 2023, 160, 106066. [Google Scholar] [CrossRef] [Scilit]
  11. Ebrahimi, H.; Zarei, E.; Ansari, M.; Nojoumi, A.; Yarahmadi, R. A system theory based accident analysis model: STAMP-fuzzy DEMATEL. Saf. Sci. 2024, 173, 106445. [Google Scholar] [CrossRef] [Scilit]
  12. Basnet, S.; BahooToroody, A.; Chaal, M.; Lahtinen, J.; Bolbot, V.; Valdez Banda, O.A. Risk analysis methodology using STPA-based Bayesian network-applied to remote pilotage operation. Ocean Eng. 2023, 270, 113569. [Google Scholar] [CrossRef] [Scilit]
  13. Milo, R.; Shen-Orr, S.; Itzkovitz, S.; Kashtan, N.; Chklovskii, D.; Alon, U. Network motifs: Simple building blocks of complex networks. Science 2002, 298, 824–827. [Google Scholar] [CrossRef] [Scilit]
  14. Hobson, E.A.; Silk, M.J.; Fefferman, N.H.; Larremore, D.B.; Rombach, P.; Shai, S.; Pinter-Wollman, N. A guide to choosing and implementing reference models for social network analysis. Biol. Rev. 2021, 96, 2716–2734. [Google Scholar] [CrossRef] [Scilit]
  15. Hulme, A.; Stanton, N.A.; Walker, G.H.; Waterson, P.; Salmon, P.M. What do applications of systems thinking accident analysis methods tell us about accident causation? A systematic review of applications between 1990 and 2018. Saf. Sci. 2019, 117, 164–183. [Google Scholar] [CrossRef] [Scilit]
  16. Igarashi, T.; Marais, K. Cartography of accident causation models: Remapping the modeling landscape. Risk Anal. 2025, 45, 3176–3200. [Google Scholar] [CrossRef] [Scilit]
  17. Shi, X.; Zhuang, H.; Xu, D. Structured survey of human factor-related maritime accident research. Ocean Eng. 2021, 237, 109561. [Google Scholar] [CrossRef] [Scilit]
  18. Veitch, E.; Alsos, O.A. A systematic review of human-AI interaction in autonomous ship systems. Saf. Sci. 2022, 152, 105778. [Google Scholar] [CrossRef] [Scilit]
  19. Zhou, X.Y.; Liu, Z.J.; Wang, F.W.; Wu, Z.L. A system-theoretic approach to safety and security co-analysis of autonomous ships. Ocean Eng. 2021, 222, 108569. [Google Scholar] [CrossRef] [Scilit]
  20. Bairami-Khankandi, S.; Bolbot, V.; BahooToroody, A.; Goerlandt, F. A systems-theoretic approach using association rule mining and predictive Bayesian trend analysis to identify patterns in maritime accident causes. Reliab. Eng. Syst. Saf. 2025, 258, 110911. [Google Scholar] [CrossRef] [Scilit]
  21. Leveson, N.G. A new accident model for engineering safer systems. Saf. Sci. 2004, 42, 237–270. [Google Scholar] [CrossRef] [Scilit]
  22. Leveson, N.G. Engineering a Safer World: Systems Thinking Applied to Safety; MIT Press: Cambridge, MA, USA, 2012. [Google Scholar]
  23. Rokseth, B.; Utne, I.B.; Vinnem, J.E. Deriving verification objectives and scenarios for maritime systems using the systems-theoretic process analysis. Reliab. Eng. Syst. Saf. 2018, 169, 18–31. [Google Scholar] [CrossRef] [Scilit]
  24. Marino, M.; Cavallaro, L.; Castro, E.; Musumeci, R.E.; Martignoni, M.; Roman, F.; Foti, E. New frontiers in the risk assessment of ship collision. Ocean Eng. 2023, 274, 113999. [Google Scholar] [CrossRef] [Scilit]
  25. Zheng, K.; Jiang, Y.; Zhou, S.; Xue, Y. A comprehensive spatiotemporal metric for ship collision risk assessment. Ocean Eng. 2022, 265, 112446. [Google Scholar] [CrossRef] [Scilit]
  26. Yu, Q.; Teixeira, A.P.; Liu, K.; Guedes Soares, C. Framework and application of multi-criteria ship collision risk assessment. Ocean Eng. 2022, 250, 111006. [Google Scholar] [CrossRef] [Scilit]
  27. Liu, R.W.; Huo, X.; Liang, M.; Wang, K. Ship collision risk analysis: Modeling, visualization and prediction. Ocean Eng. 2022, 266, 112895. [Google Scholar] [CrossRef] [Scilit]
  28. Leveson, N.G.; Thomas, J.P. STPA Handbook; MIT Partnership for Systems Approaches to Safety and Security: Cambridge, MA, USA, 2018. [Google Scholar]
  29. Zhu, Y.; Liao, H.; Huang, D. Using text mining and multilevel association rules to process and analyze incident reports in China. Accid. Anal. Prev. 2023, 191, 107224. [Google Scholar] [CrossRef] [Scilit]
  30. Cohen, J. A coefficient of agreement for nominal scales. Educ. Psychol. Meas. 1960, 20, 37–46. [Google Scholar] [CrossRef] [Scilit]
  31. Newman, M.E.J. Networks, 2nd ed.; Oxford University Press: Oxford, UK, 2018. [Google Scholar]
  32. Fosdick, B.K.; Larremore, D.B.; Nishimura, J.; Ugander, J. Configuring random graph models with fixed degree sequences. SIAM Rev. 2018, 60, 315–355. [Google Scholar] [CrossRef] [Scilit]
  33. Greenhill, C.S.; Sfragara, M. The switch Markov chain for sampling irregular graphs and digraphs. Theor. Comput. Sci. 2018, 719, 1–20. [Google Scholar] [CrossRef] [Scilit]
  34. Dutta, U.; Fosdick, B.K.; Clauset, A. Sampling random graphs with specified degree sequences. J. Comput. Graph. Stat. 2025, 34, 934–947. [Google Scholar] [CrossRef] [Scilit]
  35. Csárdi, G.; Nepusz, T. The igraph software package for complex network research. Int. J. Complex Syst. 2006, 1695, 1–9. [Google Scholar]
  36. Holland, P.W.; Leinhardt, S. A method for detecting structure in sociometric data. Am. J. Sociol. 1970, 76, 492–513. [Google Scholar] [CrossRef] [Scilit]
  37. Phipson, B.; Smyth, G.K. Permutation p-values should never be zero: Calculating exact p-values when permutations are randomly drawn. Stat. Appl. Genet. Mol. Biol. 2010, 9, 39. [Google Scholar] [CrossRef] [Scilit]
  38. Benjamini, Y.; Hochberg, Y. Controlling the false discovery rate: A practical and powerful approach to multiple testing. J. R. Stat. Soc. Ser. B Methodol. 1995, 57, 289–300. [Google Scholar] [CrossRef] [Scilit]
  39. Freeman, L.C. Centrality in social networks: Conceptual clarification. Soc. Netw. 1978, 1, 215–239. [Google Scholar] [CrossRef] [Scilit]
  40. Latora, V.; Marchiori, M. Efficient behavior of small-world networks. Phys. Rev. Lett. 2001, 87, 198701. [Google Scholar] [CrossRef] [Scilit]
Figure 1. Overall framework integrating STPA, directed complex networks, and constrained randomization.
Jmse 14 01620 g001
Figure 2. Annual distribution of the 364 included ship collision investigation reports by accident year.
Jmse 14 01620 g002
Figure 3. STPA process.
Jmse 14 01620 g003
Figure 4. Evolution model for ship collision accident chains. Colors distinguish the regulatory framework and authorities (blue), organizational management and certification bodies (green), operational actors and the accident-consequence pathway (orange), the onboard ship navigation control system (black), and external operating conditions and aids to navigation (gold). The colors are visual grouping devices only; they do not represent either the five functional blocks used in Null B or the eight STPA operational stages.
Jmse 14 01620 g004
Figure 5. Topology of the ship collision accident chain network.
Jmse 14 01620 g005
Figure 6. Degree values of the causal nodes.
Jmse 14 01620 g006
Figure 7. Closeness centrality of the causal nodes.
Jmse 14 01620 g007
Figure 8. Changes in normalized global efficiency under alternative node removal scenarios. (a) Normalized global efficiency after the individual and combined removal of H1, H9, and H19. (b) Cumulative node removal under fixed rankings by betweenness centrality, total degree, and out-degree, compared with random removal. The random curve shows the mean across 10,000 independent node permutations.
Jmse 14 01620 g008
Figure 9. Z scores for 13 connected directed triads under the two null models. Asterisks identify the four overrepresented motifs that met all prespecified robust dual-null criteria: concordant positive deviations, |Z| ≥ 2, q < 0.05, and observed counts outside both 95% empirical intervals.
Jmse 14 01620 g009
Figure 10. Support proportions for the four core motifs. The green bars show accident-supported instances as a proportion of global instances. The yellow bars show strongly supported instances as a proportion of accident-supported instances.
Jmse 14 01620 g010
Table 1. Losses, system-level hazards, and safety constraints.
TypeIDDescriptionAssociated Causal Nodes
LossL1Fatalities or injuries among crew, passengers, or relevant personnelC
L2Damage to hull structures, cargo, equipment, or shipping propertyC
L3Water pollution caused by fuel or hazardous-cargo leakageC
L4Disruption of navigation or port operations and associated economic lossesC
System-level hazardHaz1Inadequate situation awareness during a vessel encounterH1, H6, H15, H22
Haz2Failure to assess collision risk correctly and in timeH9, H22
Haz3Failure to take timely, effective, and rule-compliant collision avoidance actionH11, H18, H19, H28, H29, H30, H31
Haz4Failure to monitor maneuver effectiveness after initiating avoidance actionH25
Haz5Crew, equipment, or management conditions insufficient for safe navigationS32, S33, M38–M46
Safety constraintSC1Watchkeepers shall maintain a continuous proper lookout by sight, hearing, radar, AIS, and all other available means.H1, H6, H15
SC2Watchkeepers shall assess collision risk promptly using bearing changes, distance, speed, DCPA, TCPA, and other relevant information.H9, H22
SC3The vessel shall proceed at a safe speed appropriate to visibility, traffic density, maneuverability, wind, waves, and current.H19, E35, E36, E37
SC4The vessel shall correctly discharge its duties as a give-way, stand-on, overtaking, or crossing vessel under the collision regulations.H21, H29, H30, H31
SC5Collision avoidance action shall be early, substantial, and effective, and shall not create a new close-quarters situation.H11, H18, H28
SC6The vessel shall continuously verify maneuver effectiveness and promptly adjust the maneuver when necessary.H25
SC7Shipping companies and vessel managers shall ensure that manning, competence, training, equipment maintenance, and bridge resource management support safe operation.M38–M46
Table 2. Major unsafe control actions in ship collision accidents.
Collision Avoidance StageControllerControl ActionUnsafe Control ActionCausal NodesSafety Constraint
Target detection and information acquisitionOfficer of the watch; masterVisual, auditory, radar, and AIS lookoutFailure to maintain a proper lookout; improper use of navigational aids; insufficient acquisition of navigational environment informationH1, H6, H15SC1
Collision risk recognitionOfficer of the watch; masterAssessment of target bearing, distance, speed, and collision riskFailure to assess collision risk correctly and in time; failure to recognize a close-quarters situationH9, H22SC2
Communication of maneuvering intentionsBridge teams of both vessels; VTSExchange of intentions by VHF, sound signals, lights, and shapesInsufficient inter-vessel communication; inconsistent maneuvering intentions; improper use of lights and shapesH5, H20, H26SC4
Assessment of the need to maneuverOfficer of the watch; masterDecision on whether collision avoidance action is requiredFailure to take collision avoidance action; failure to observe good seamanshipH18, H24SC5
Selection of an avoidance maneuverOfficer of the watch; masterSelection of course alteration, speed reduction, stopping, or reversingImproper maneuver; failure to discharge the duties of a give-way, stand-on, or overtaking vesselH11, H29, H30, H31SC4
SC5
Execution of collision avoidance actionOfficer of the watch; steering gear; main engineExecution of course alteration, speed reduction, stopping, or reversingFailure to proceed at a safe speed; failure to take early and effective action; action taken too late or with insufficient magnitudeH19, H28SC3
SC5
Verification of maneuver effectivenessOfficer of the watch; masterContinuous monitoring of changes in relative motionFailure to verify maneuver effectiveness or promptly adjust the maneuverH25SC6
Safety management controlShipping company; vessel managers; masterManning, training, competence management, equipment maintenance, and bridge resource managementInsufficient manning; unqualified or unlicensed crew; inadequate training; deficient maintenance; company safety management deficiencies; inadequate bridge resource managementM38, M41, M42,
M43, M44, M46
SC7
Note: Haz denotes a system-level hazard, and SC denotes a safety constraint. H, S, E, and M denote human, ship, environmental, and management factors, respectively. C is used only as the terminal accident node and the target of reachability analysis.
Table 3. Coding scheme for causal factors in ship collision accidents.
CodeCausal FactorCodeCausal FactorCodeCausal Factor
H1Failure to maintain a proper lookoutH17Improper anchoring or berthingS33Vessel equipment defects
H2Violation of watchkeeping requirementsH18Failure to take collision avoidance actionS34Navigation beyond the approved operating area
H3Crew fatigueH19Failure to proceed at a safe speedE35Complex navigational environment
H4Inadequate transfer of watch-handover informationH20Failure to agree on maneuvering intentionsE36Restricted visibility
H5Insufficient inter-vessel communicationH21Violation of crossing rulesE37Adverse wind and wave conditions
H6Improper use of navigational aidsH22Failure to recognize a close-quarters situationM38Insufficient manning
H7Weak safety awarenessH23Failure to comply with routing requirementsM39Risk-taking navigation
H8Improper occupation of a navigational channelH24Failure to observe good seamanshipM40Unlicensed operation
H9Failure to assess collision risk correctly and in timeH25Failure to verify maneuver effectivenessM41Crew incompetence
H10Improper emergency responseH26Improper use of navigation lights and shapesM42Inadequate crew training
H11Improper collision avoidance maneuverH27Failure to follow the planned routeM43Deficient vessel maintenance
H12Improper discharge of the master’s dutiesH28Failure to take early and effective collision avoidance actionM44Company safety management deficiencies
H13Improper pilotageH29Failure to discharge overtaking-vessel dutiesM45Violation of vessel-survey requirements
H14Violation of narrow-channel navigation rulesH30Failure to discharge give-way vessel dutiesM46Inadequate bridge resource management
H15Insufficient acquisition of navigational environment informationH31Failure to discharge stand-on vessel duties
H16Failure to issue the required warningS32Unseaworthy vessel
Table 4. Partial mapping of typical causal scenarios to the complex network.
Scenario IDTypical Causal ScenarioControl or Feedback DeficiencyPrimary Causal NodesRepresentative Directed Edges Supported by the Sample
CS1Crew fatigue, insufficient manning, or inadequate bridge resource management reduces the continuity and effectiveness of proper lookout.Inadequate perceptual feedback; insufficient bridge resources and watchkeeping controlH3, M38
M46, H1
M38 → H1
M46 → H1
H3 → H1
CS2Improper use of radar, AIS, electronic charts, or other navigational aids, or abnormal vessel equipment, impairs assessment of target motion and the encounter situation.Inadequate navigational situation awareness; missing, distorted, or underused feedbackH6, S33
H9
H6 → H9
S33 → H9
CS3Under high traffic density or restricted visibility, watchkeepers fail to update collision risk assessments as external conditions change.Increased external disturbance; inadequate updating of the process modelE35, E36
H9, H22
E35 → H9
E36 → H9
H9 → H22
CS4Insufficient communication of maneuvering intentions, including improper VHF coordination, sound signals, lights, or shapes, leaves intentions unclear or delays decisions.Inadequate coordination between vessels; insufficient communication feedbackH5, H20
H26, H28
H5 → H28
H20 → H28
H26 → H28
CS5Failure to select a safe speed for visibility, traffic density, maneuverability, and safe passing distance reduces the time and space available for avoidance.Poor timing of the control action; insufficient control magnitudeH19, H28
C
H19 → H28
H28 → C
CS6During overtaking, crossing, or head-on encounters, a vessel fails to discharge its prescribed duties or take rule-compliant action, causing responsibility implementation to fail and a collision to occur.Incorrect recognition of collision regulations; inappropriate control rule; inadequate discharge of collision avoidance responsibilityH29
H30
H31
C
H29 → C; H30 → C; H31 → C
CS7After initiating an avoidance maneuver, the watchkeeper fails to monitor relative bearing, CPA, TCPA, or distance and does not adjust the maneuver in time.Interrupted feedback loop; inadequate verification of maneuver effectivenessH25
C
H25 → C
CS8Company safety management deficiencies, inadequate training, or crew incompetence impair collision risk recognition and avoidance decisions.Inadequate transmission of higher-level safety constraints; insufficient competence and training controlM44
M42
M41
H9
H19
M44 → H9
M41 → H9
M42 → H19
M41 → H19
Table 5. Inter-coder reliability for causal node identification and directed edge extraction.
Coding TaskValid JudgmentsObserved AgreementExpected AgreementCohen’s KappaInterpretation
Causal node identification33580.9650.7990.827High reliability
Directed edge extraction96360.9910.9380.862High reliability
Note: Statistics were calculated from the two coders’ independent judgments before adjudication. Node identification and edge extraction used different judgment units and class distributions; their kappa values are therefore reported separately. Edge reliability applies to the documented set of 132 candidate relations. Subsequent adjudication did not alter the reported kappa values.
Table 6. Example of accident report coding and accident chain extraction.
Accident ReportInvestigation Finding or Source EvidenceSTPA StageNode CodeEdge RelationBasis for Judgment
Mingzhou 25The vessel failed to maintain a proper lookout and did not detect the fishing vessel Jitanggangyu 01116 in time. It consequently failed to assess the encounter and collision risk adequately.Target detection and information acquisition; collision risk recognitionH1;
H9
H1 → H9The report explicitly linked inadequate lookout to inadequate collision risk assessment, with deficient target information preceding the assessment failure.
Mingzhou 25After a collision risk and close-quarters situation developed, the vessel did not take early and substantial avoiding action. It began turning only when the vessels were about 1.59 nautical miles apart and subsequently collided.Collision risk recognition; execution of collision avoidance action; discharge of collision avoidance responsibilityH9; H28; H30;
C
H9 → H28
→ C;
H30 → C
Inadequate risk assessment was followed by failure to act early and effectively. The vessel also failed to discharge its give-way duty, which the report directly identified as a basis for responsibility.
After a close-quarters situation developed, the watchkeeper did not exercise good seamanship and made a small alteration to port at close range. The maneuver did not achieve a safe passing distance.Selection and execution of the avoidance maneuverH24;
H11;
C
H24 → H11 → CThe report explicitly identified a failure of good seamanship and found that the selected maneuver was incorrect and ineffective, leading to the collision.
Jitanggangyu 01116The investigation found that the vessel was short of one deck officer. The resulting watchkeeping shortage contributed to fatigue and an inadequate lookout.Safety management control; target detection and information acquisitionM38; H3;
H1
M38 → H3 → H1The report used explicit causal language to connect insufficient manning, crew fatigue, and inadequate lookout in sequence.
The vessel failed to maintain a proper lookout, did not detect Mingzhou 25 in time, and failed to recognize that a close-quarters situation and immediate danger had developed.Target detection and information acquisition; collision risk recognitionH1; H22H1 → H22Inadequate lookout caused missing target information and subsequently prevented recognition of the close-quarters situation.
AIS data showed that the vessel maintained course and speed after a close-quarters situation developed and did not take the action most conducive to avoiding collision. The report found that it failed to discharge its stand-on duty.Collision risk recognition; assessment of the need to maneuver; selection of the avoidance maneuverH22; H18; H31;
C
H22 → H18 → C;
H31 → C
After failing to recognize the close-quarters situation, the vessel took no avoiding action, satisfying H18. Its failure to act as required of a stand-on vessel when immediate danger had arisen satisfied H31 and was directly linked to responsibility in the report.
Table 7. Dual-null summary and multilevel event evidence for the four overrepresented motifs.
MotifStructureGlobal Instances, nNull A
Z (q)
Null B
Z (q)
Accident-Supported, nStrongly Supported, n (% of Accident-Supported Instances)Interpretation
021CDirected chain117910.64
(0.0022)
8.14
(0.0026)
189127
(67.2%)
Forward association within a chain of responsibility
021UConvergent8655.21
(0.0022)
4.98
(0.0026)
9874
(75.5%)
Multifactor convergence within the same vessel at fault
021DDivergent5193.73
(0.0022)
2.98
(0.0094)
6825
(36.8%)
Supporting configuration for same-vessel branching
030TTransitive triangle57612.05
(0.0022)
9.07
(0.0026)
382
(5.3%)
Transitive closure at the aggregate system level
Note: Percentages are calculated relative to accident-supported instances; motif-specific strong support criteria are defined in Section 3.5.4.
Disclaimer/Publisher’s Note: The statements, opinions and data contained in all publications are solely those of the individual author(s) and contributor(s) and not of MDPI and/or the editor(s). MDPI and/or the editor(s) disclaim responsibility for any injury to people or property resulting from any ideas, methods, instructions or products referred to in the content.