1. Introduction
As a clean, efficient, and high-quality fossil fuel, global demand for natural gas continues to grow [
1,
2]. Offshore natural gas development has gradually become a focal point, expanding from shallow waters to deep waters and marginal gas fields [
3]. Against this backdrop, floating liquefied natural gas (FLNG) units, with their integrated capabilities for production, liquefaction, storage, and export, have emerged as a key technological pathway for the development of deepwater and marginal gas fields [
4,
5]. The advantages of FLNG are particularly pronounced in regions where onshore pipelines are difficult to construct or where onshore facilities are economically unfeasible [
6]. Among the various stages of the FLNG process, LNG offloading presents a key challenge in both research and engineering applications. When an FLNG unit reaches a certain storage capacity, it requires offshore transshipment via a liquefied natural gas carrier (LNGC). During offshore LNG tandem offloading operations, the FLNG and LNGC are arranged in a fore-and-aft configuration, typically spaced 50–100 m apart. This arrangement offers excellent adaptability to sea conditions and operational safety, making it suitable for harsher marine environments. The use of tandem offloading and the conveyance of LNG via cryogenic hoses has become a significant trend in the development of offshore LNG transportation [
7]. During tandem offloading operations, the LNG cryogenic unloading hose connects the offloading points of the FLNG and the LNGC. The relative positions of its two ends are affected by the relative motion between the two vessels. This relative motion subjects the hose to complex loads at all times, making its safety one of the core challenges of the entire unloading system.
Existing research on tandem mooring systems has primarily focused on two major areas. On the one hand, relatively in-depth studies have been conducted on the hydrodynamic response of multi-float mooring systems. For example, Buchner et al. [
8] performed numerical multi-body simulations of side-by-side moored FPSOs. Hong et al. [
9] analyzed vessel motion behavior by comparing tandem and side-by-side mooring configurations. Yan & Gu [
10] investigated the influence of parameters on the performance of LNG-FPSO unloading systems. Mauries et al. [
11] developed a tandem offloading system utilizing floating cryogenic hoses. Zhao et al. [
12,
13] conducted model tests to systematically investigate the effects of ship spacing and connection methods on the hydrodynamic performance of a single-point mooring FLNG tandem mooring system. On the other hand, significant progress has also been made in the mechanical modeling and simulation of floating hoses. Fang et al. [
14] studied the mechanical response of glass-fiber flexible pipes under the combined effects of tension and internal pressure. Wei et al. [
15] analyzed the bending and wrinkling behavior of floating hoses under the combined effects of internal pressure and bending moments. An et al. [
16] performed numerical simulations of the dynamic response of floating hoses under the combined action of waves and ocean currents. Hu et al. [
17] simulated and optimized the dynamic response of floating hoses in the CALM system. Regarding hoses specifically designed for LNG transportation, Yan et al. [
18] established a theoretical analytical model for the manufacturing process of the spiral layer in cryogenic flexible hoses, while Huang & Wu [
19] proposed a monitoring strategy for the stress of steel wires in the armor of flexible hoses during LNG serial offloading operations.
Although the aforementioned studies have laid a solid foundation for this field, a systematic, quantitative safety assessment framework for the safety boundaries and failure mechanisms of offloading hoses during offshore LNG operations is still lacking. The tension, curvature, and bending moment responses of hoses under complex sea conditions are highly nonlinear, which directly governs the determination of safe operational zones. Previous research has addressed material behavior and localized failure mechanisms. At the basic level, Bahtui et al. [
20] used FEM to model unbonded flexible risers under torsion, while Ramos et al. [
21] experimentally measured stress–strain distributions in flexible riser layers. Zhang et al. [
22] characterized hose damage under combined tension, bending, and torsion. Gao et al. [
23] studied bursting failure of double-carcass hoses via simulation and experiments, and He et al. [
24] analyzed failure of thermoplastic pipes under torsional-thermomechanical loads. Li et al. [
25] performed FE analysis on floating oil hose torsion and optimized cord winding angles. At the system level, Zhao et al. [
26] established a beam vibration model for floating hose strings and validated it with OrcaFlex, showing that maximum bending moment occurs at buoy and tanker connections. Liu et al. [
27] conducted hydrodynamic analysis of LNG cryogenic hoses under multiple offloading conditions, revealing that longer hoses and larger vessel spacing increase curvature extremes and reduce tension extremes. However, integrating these failure mechanisms with the global dynamic response of the offloading system to establish comprehensive, practical safety criteria and risk assessment methods remains a critical challenge.
The key to safety assessment of flexible pipelines lies in accurately identifying their potential failure modes and establishing a scientific set of criteria. The loading and deformation of floating hoses in the marine environment are characterized by multi-scale and multi-field coupling. Based on the BS EN 1474-2:2020 standard [
28] and considering the actual stress characteristics of floating hoses during LNG offshore unloading, this paper categorizes typical failure modes into three main types: axial overload failure, ultimate bending failure, and local failure of the joint structure. The mechanisms, identification criteria, and key parameters for the three failure modes are shown in
Table 1.
The core criteria for the three failure modes are tension, curvature, and bending moment, respectively. These three parameters are independent of one another, and a single parameter alone cannot cover all risk scenarios. Therefore, this paper selects these three parameters to construct a multi-parameter comprehensive evaluation system, aiming to fully reflect the structural safety status of the hose under various operating conditions. By establishing a hydrodynamic analysis model of the FLNG-LNGC tandem system and simulating typical sea states, the key responses of the hose, namely tension, curvature, and bending moment, are obtained. Different from traditional single-threshold judgment methods, this study simultaneously calculates the safety margins of all three parameters, achieving a refined quantitative assessment of the hose’s structural safety. Furthermore, considering the combined influence of environmental loads (sea state return period) and the core operational parameter (operational vessel distance), three dynamic risk zones, namely the “safe zone”, “warning zone”, and “danger zone”, are delineated, forming a clear two-dimensional operational decision matrix. This provides explicit and actionable safety boundaries for field operations. The novelty of this work lies in three aspects. First, unlike prior studies that treat mooring dynamics and hose mechanics separately, this study establishes a high-fidelity three-dimensional coupled dynamic model that integrates floating bodies, hoses, and mooring systems within a unified framework. Second, while existing research has focused on individual failure modes such as axial overload, bending failure, or joint failure in isolation, this study simultaneously adopts tension, curvature, and bending moment as core safety criteria, enabling a comprehensive evaluation of hose structural integrity. Third, a two-dimensional operational risk zoning scheme coupling sea state return period with operational vessel distance is proposed, providing quantifiable safety boundaries for field operations, an aspect largely absent in previous work. Through systematic threshold analysis and risk zoning, this study aims to offer theoretical foundations and engineering references for the design optimization and operational safety decision-making of offshore LNG tandem offloading systems.
The remainder of this paper is structured as follows.
Section 2 presents the construction of the coupled dynamic model for the FLNG-LNGC tandem offloading system, including environmental parameters, vessel and hose properties, and the numerical implementation in OrcaFlex.
Section 3 reports the results and discussion, covering the dynamic response trends of the hose under different sea conditions in
Section 3.1, the influence of sea state categories on safety margins in
Section 3.2, the control effect of operational vessel distance in
Section 3.3, and the definition of operation risk zones and thresholds in
Section 3.4. Finally,
Section 4 summarizes the main conclusions and discusses their implications for engineering practice.
2. Construction of a Coupled Dynamic Model for the FLNG-LNGC Tandem Offloading System
2.1. Environmental Parameters
The dynamic response of the offshore offloading system is highly dependent on external environmental loads. Therefore, selecting representative sea state parameters is fundamental to establishing a reliable numerical model and evaluating hose safety. In this study, six return-period sea states ranging from the 1-year to the 100-year event are selected as environmental load inputs. The wave, current, and wind parameters for each return period are based on long-term statistical data from a coastal sea area in China (see
Table 2). These sea states cover the full spectrum from routine operations to extreme events, enabling a comprehensive assessment of hose safety under varying levels of environmental severity. In the coupled dynamic analysis, the wind, wave, and current are all assumed to propagate in the same direction across all simulation cases. This direction is set perpendicular to the longitudinal axis of the hose string, with the incoming direction defined as 90° relative to the hose axis. This setup represents a relatively unfavorable transverse loading condition for the tandem offloading configuration, as it maximizes the lateral excitation on the hose and thus provides a conservative basis for safety assessment.
2.2. FLNG and LNGC Parameters
Accurate mass-inertia models of the FLNG and LNGC are essential to ensure that their motion behavior under combined wind, wave, and current loads is correctly represented in the numerical simulation. Based on typical engineering scales, this study establishes numerical models for both floating bodies. In OrcaFlex, the FLNG and LNGC are modeled as rigid bodies. This method characterizes their six-degree-of-freedom dynamic response by specifying key parameters, including the principal geometric dimensions, mass, moments of inertia, and the center of gravity. The primary geometric and inertial parameters used for the FLNG and LNGC in this study are listed in
Table 3. These parameters serve as the fundamental input for the subsequent coupled dynamic analysis and hose response calculations. The FLNG is secured at its stern by a mooring system consisting of six anchor chains spaced at 60° intervals with a mooring radius of 260 m. In this system, the origin is defined at the intersection of the FLNG bow and the still water surface, with the
X-axis pointing toward the stern, the
Y-axis toward starboard, and the
Z-axis upward. The seabed anchors are centered around the turret, the common vessel-side connection point located at (200, 0, 0) m, at a water depth of 90 m. To ensure full reproducibility, the precise Cartesian coordinates (X, Y, Z) of both the turret and the seabed anchors for each line are explicitly listed in
Table 4. Each chain has a total length of 271 m, a diameter of 0.127 m, a mass of 88.331 kg/m, an axial stiffness of 4.07 × 10
5 kN, and a torsional stiffness of 10 kN·m
2. The seabed contact radius is 0.1143 m, friction coefficient is 0.5, Poisson’s ratio is 0.5, added mass coefficient is 1, and drag coefficient is 2.6. The initial static configuration was established using OrcaFlex’s built-in static analysis (full catenary method) without imposing any external pretension; the equilibrium pretension in each line was automatically determined by the solver based on the balance of weight, buoyancy, and axial stiffness.
2.3. LNG Hose Parameters
The floating hose connects the FLNG to the LNG carrier and serves as the final link in transporting liquefied natural gas collected at sea to the LNG carrier. The total length of the hose is 203.4 m, and the typical connection distance during operation (i.e., the distance between the two vessels, referred to as the operational vessel distance) is set at 150 m. This hose features a multi-layer composite structure and must maintain structural integrity under two operating conditions: ambient temperature and the transport of cryogenic LNG (simulated by liquid nitrogen conditions). Its core design parameters are shown in
Table 5. The actual OrcaFlex inputs for the LNG hose modelled in this study are as follows: the software axial stiffness value is 83 × 10
3 kN, the bending stiffness value is 390 kN·m
2, and the torsional stiffness value is 270 kN·m
2.
2.4. Computational Model
Developing a numerical model capable of simultaneously characterizing the motion of multiple floats and the dynamic behavior of flexible hoses is central to safety assessment. This study employs OrcaFlex to establish a three-dimensional time-domain dynamic analysis model and, based on hydrodynamic theory, uniformly couples the floats, hoses, and mooring system to accurately reflect the response behavior of the export system under the combined effects of wind, waves, and currents.
First, to characterize the six-degree-of-freedom motion of the two types of floats under wave excitation, the FLNG and LNGC were modeled as rigid-body “Vessel” types, with parameters such as mass, moment of inertia, and center of gravity input. Their wave-forced response was characterized by inputting the RAO calculated in the frequency domain, enabling the model to reproduce the linear hydrodynamic response characteristics of the floats in the time domain. Subsequently, a model of the LNG export flexible hose was constructed. Flexible hoses exhibit significant large-deformation characteristics and bending-tension coupling effects; therefore, they were modeled using the “Line” type, allowing the hose to assume a natural sag configuration under the combined effects of self-weight, buoyancy, axial tension, and wave-current loads. The model incorporates parameters such as the hose’s axial stiffness, bending stiffness, mass per unit length, and hydrodynamic coefficients, thereby capturing key responses—including peak tension, bending moment variations, and minimum bending radius—in the time-domain simulation. Finally, the mooring system is integrated into the overall dynamic model. The positioning of the FLNG is achieved through a “Line” system composed of multiple catenary-type anchor chains, with the unit mass per length, hydrodynamic parameters, axial stiffness, and seabed contact characteristics of each chain segment inputted. The lower end of the anchor chain is constrained as “Anchored” to represent the anchorage foundation, while the upper end is connected to the float’s chain stopper, enabling it to provide restoring force to the platform, limit displacement, and influence the overall stress environment of the hose.
By integrating these three modeling modules, a complete coupled dynamic system comprising the FLNG, LNGC, hose, and mooring chain is established. By inputting uniform environmental conditions (wind, waves, and current) into OrcaFlex and performing coupled iterative solutions in the time domain, the model can realistically reproduce the dynamic stress characteristics of the hose under actual offloading conditions.
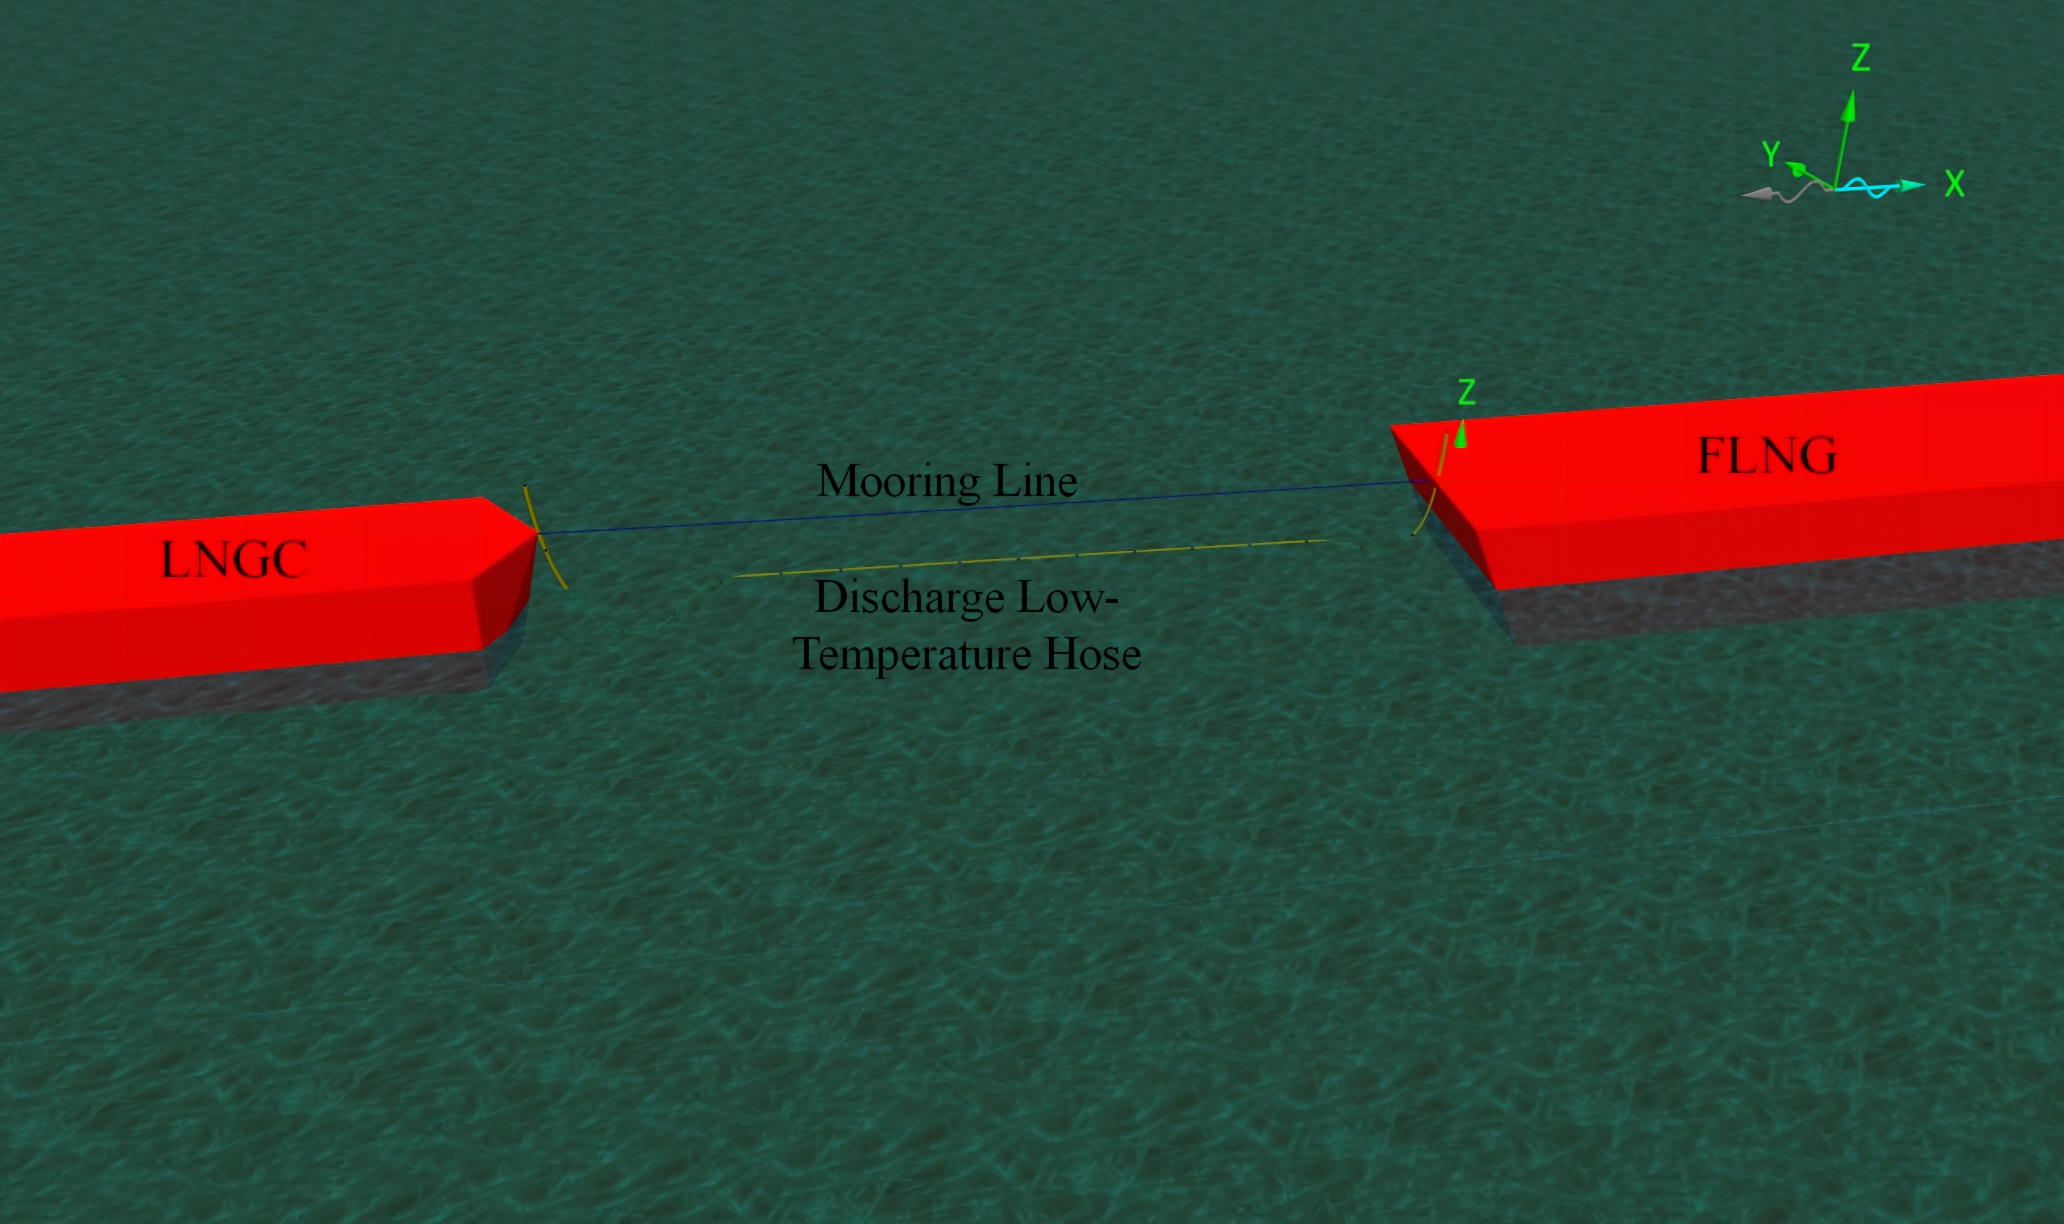
Figure 1 shows the three-dimensional dynamic model of the FLNG export system established in this study.
2.5. Model Verification
To verify the reliability and stability of the numerical model for the floating hose system, a convergence study was conducted.
Table 6 presents the discretization and time-step sensitivity of key response indicators under the operational sea state. Increasing the hose elements from 40 to 80 raised the peak tension from 92.5 kN to 100.7 kN, the bending moment from 34.6 kN·m to 37.9 kN·m, and the curvature from 0.067 m
−1 to 0.072 m
−1. Further refinement to 100 elements produced no change, confirming convergence at 80 elements. Reducing the time step from 0.2 s to 0.1 s caused minor changes in the predicted responses, with the peak tension, bending moment, and curvature shifting from 99.7 kN, 37.4 kN·m, and 0.071 m
−1 to 100.7 kN, 37.9 kN·m, and 0.072 m
−1. Further reduction to 0.05 s and 0.025 s yielded negligible differences, indicating that a time step of 0.1 s is sufficient. Therefore, a mesh of 80 elements and a time step of 0.1 s were adopted for all subsequent simulations.
It should be noted that the present OrcaFlex model has been verified numerically through mesh and time-step convergence studies. However, physical validation against experimental data or field measurements has not been performed, as the primary objective of this study is to develop and demonstrate a safety-threshold methodology rather than to predict the behavior of a specific prototype. Therefore, the results should be regarded as numerically consistent illustrations of the proposed approach, and experimental validation is recommended prior to practical engineering application.
All numerical simulations were conducted on a laboratory computer as listed in
Table 7. Each simulation covers a physical duration of 10,800 s. The computational time for a single sea state ranges from 3.5 to 5 h, depending on the complexity of the hydrodynamic conditions. The total computational cost for all cases considered in this study is considered acceptable for the level of detail required.
3. Results and Discussion
3.1. Analysis of Hose Dynamic Response Trends Under Different Sea Conditions
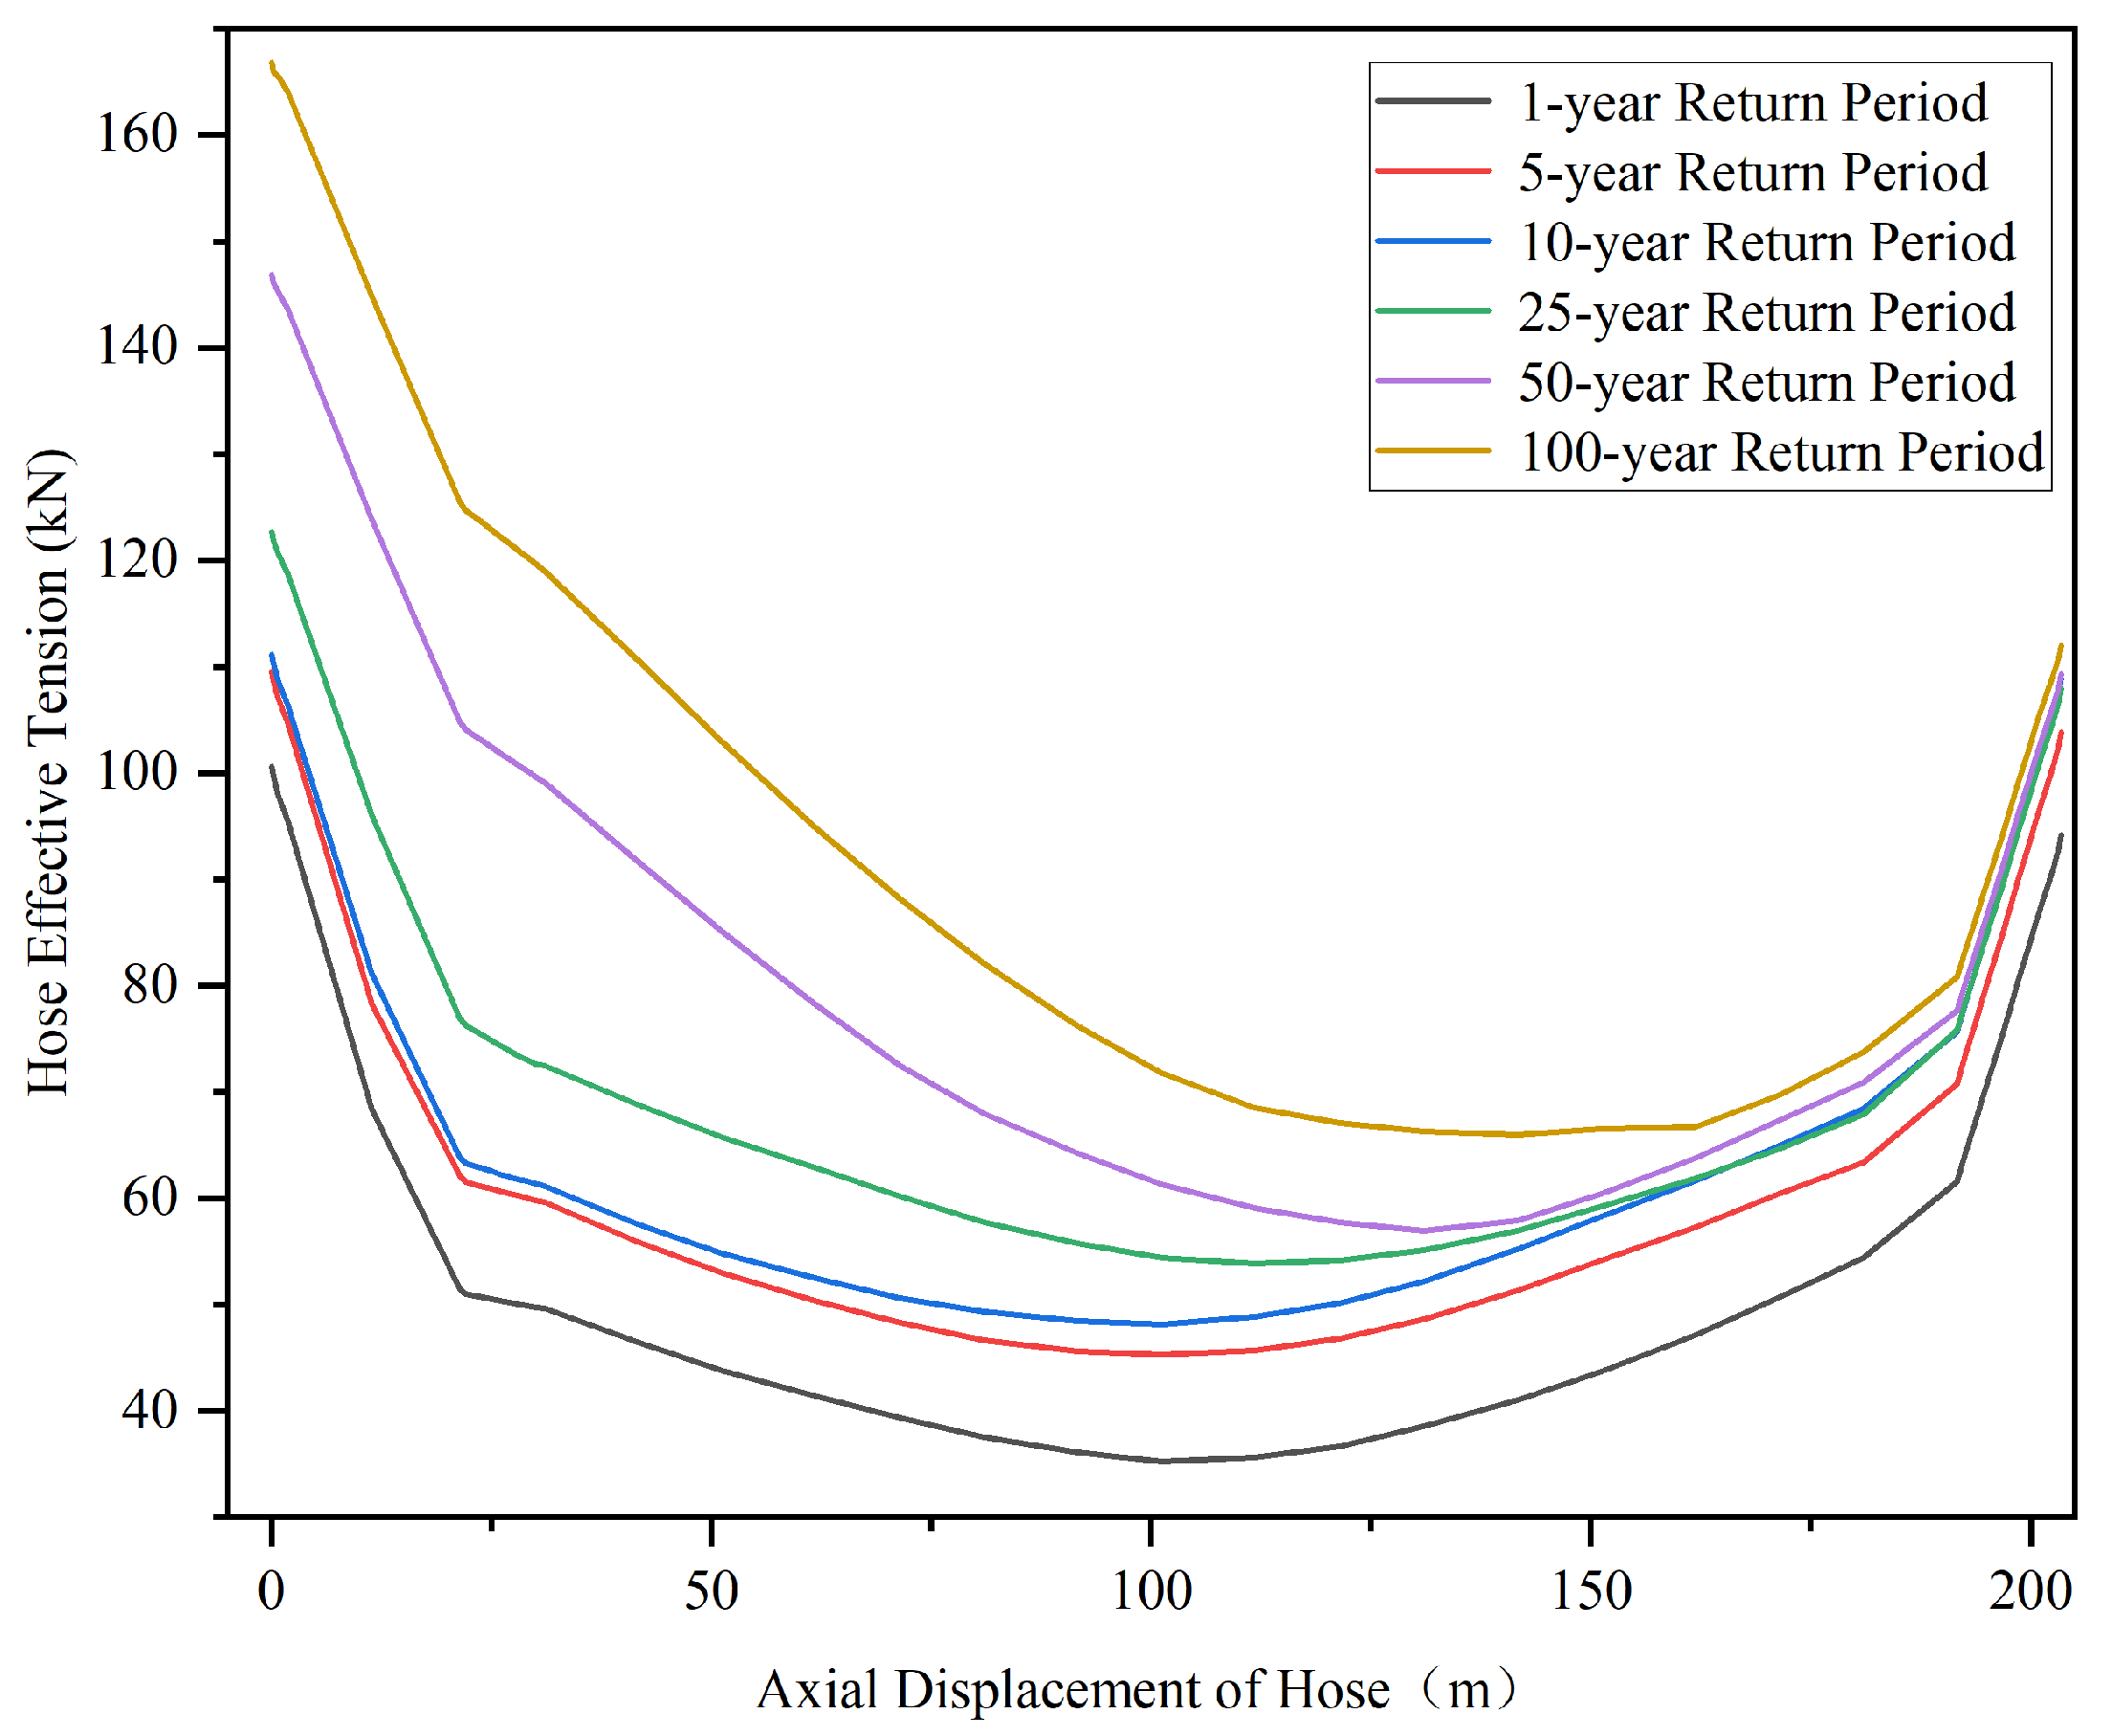
Figure 2 shows the distribution of effective axial tension along the length of the hose under different sea conditions. The tension reaches its peak at the leading end of the hose (near 0 m distance along the hose) under all conditions, with the highest peak occurring under the 100-year return period condition (approximately 167 kN) and the lowest under the 1-year return period condition (approximately 100 kN). As displacement increases, the tension initially decreases rapidly, then stabilizes in the middle section between 20 and 150 m; in the terminal section between 150 and 200 m, the tension rises slightly but remains below the peak value at the leading end. Overall, as the return period increases, the tension at various positions along the hose increases accordingly, with the most significant increase occurring at the leading end. This indicates that the connection at the leading end of the hose is the most vulnerable point under load and should be given special consideration in structural design.
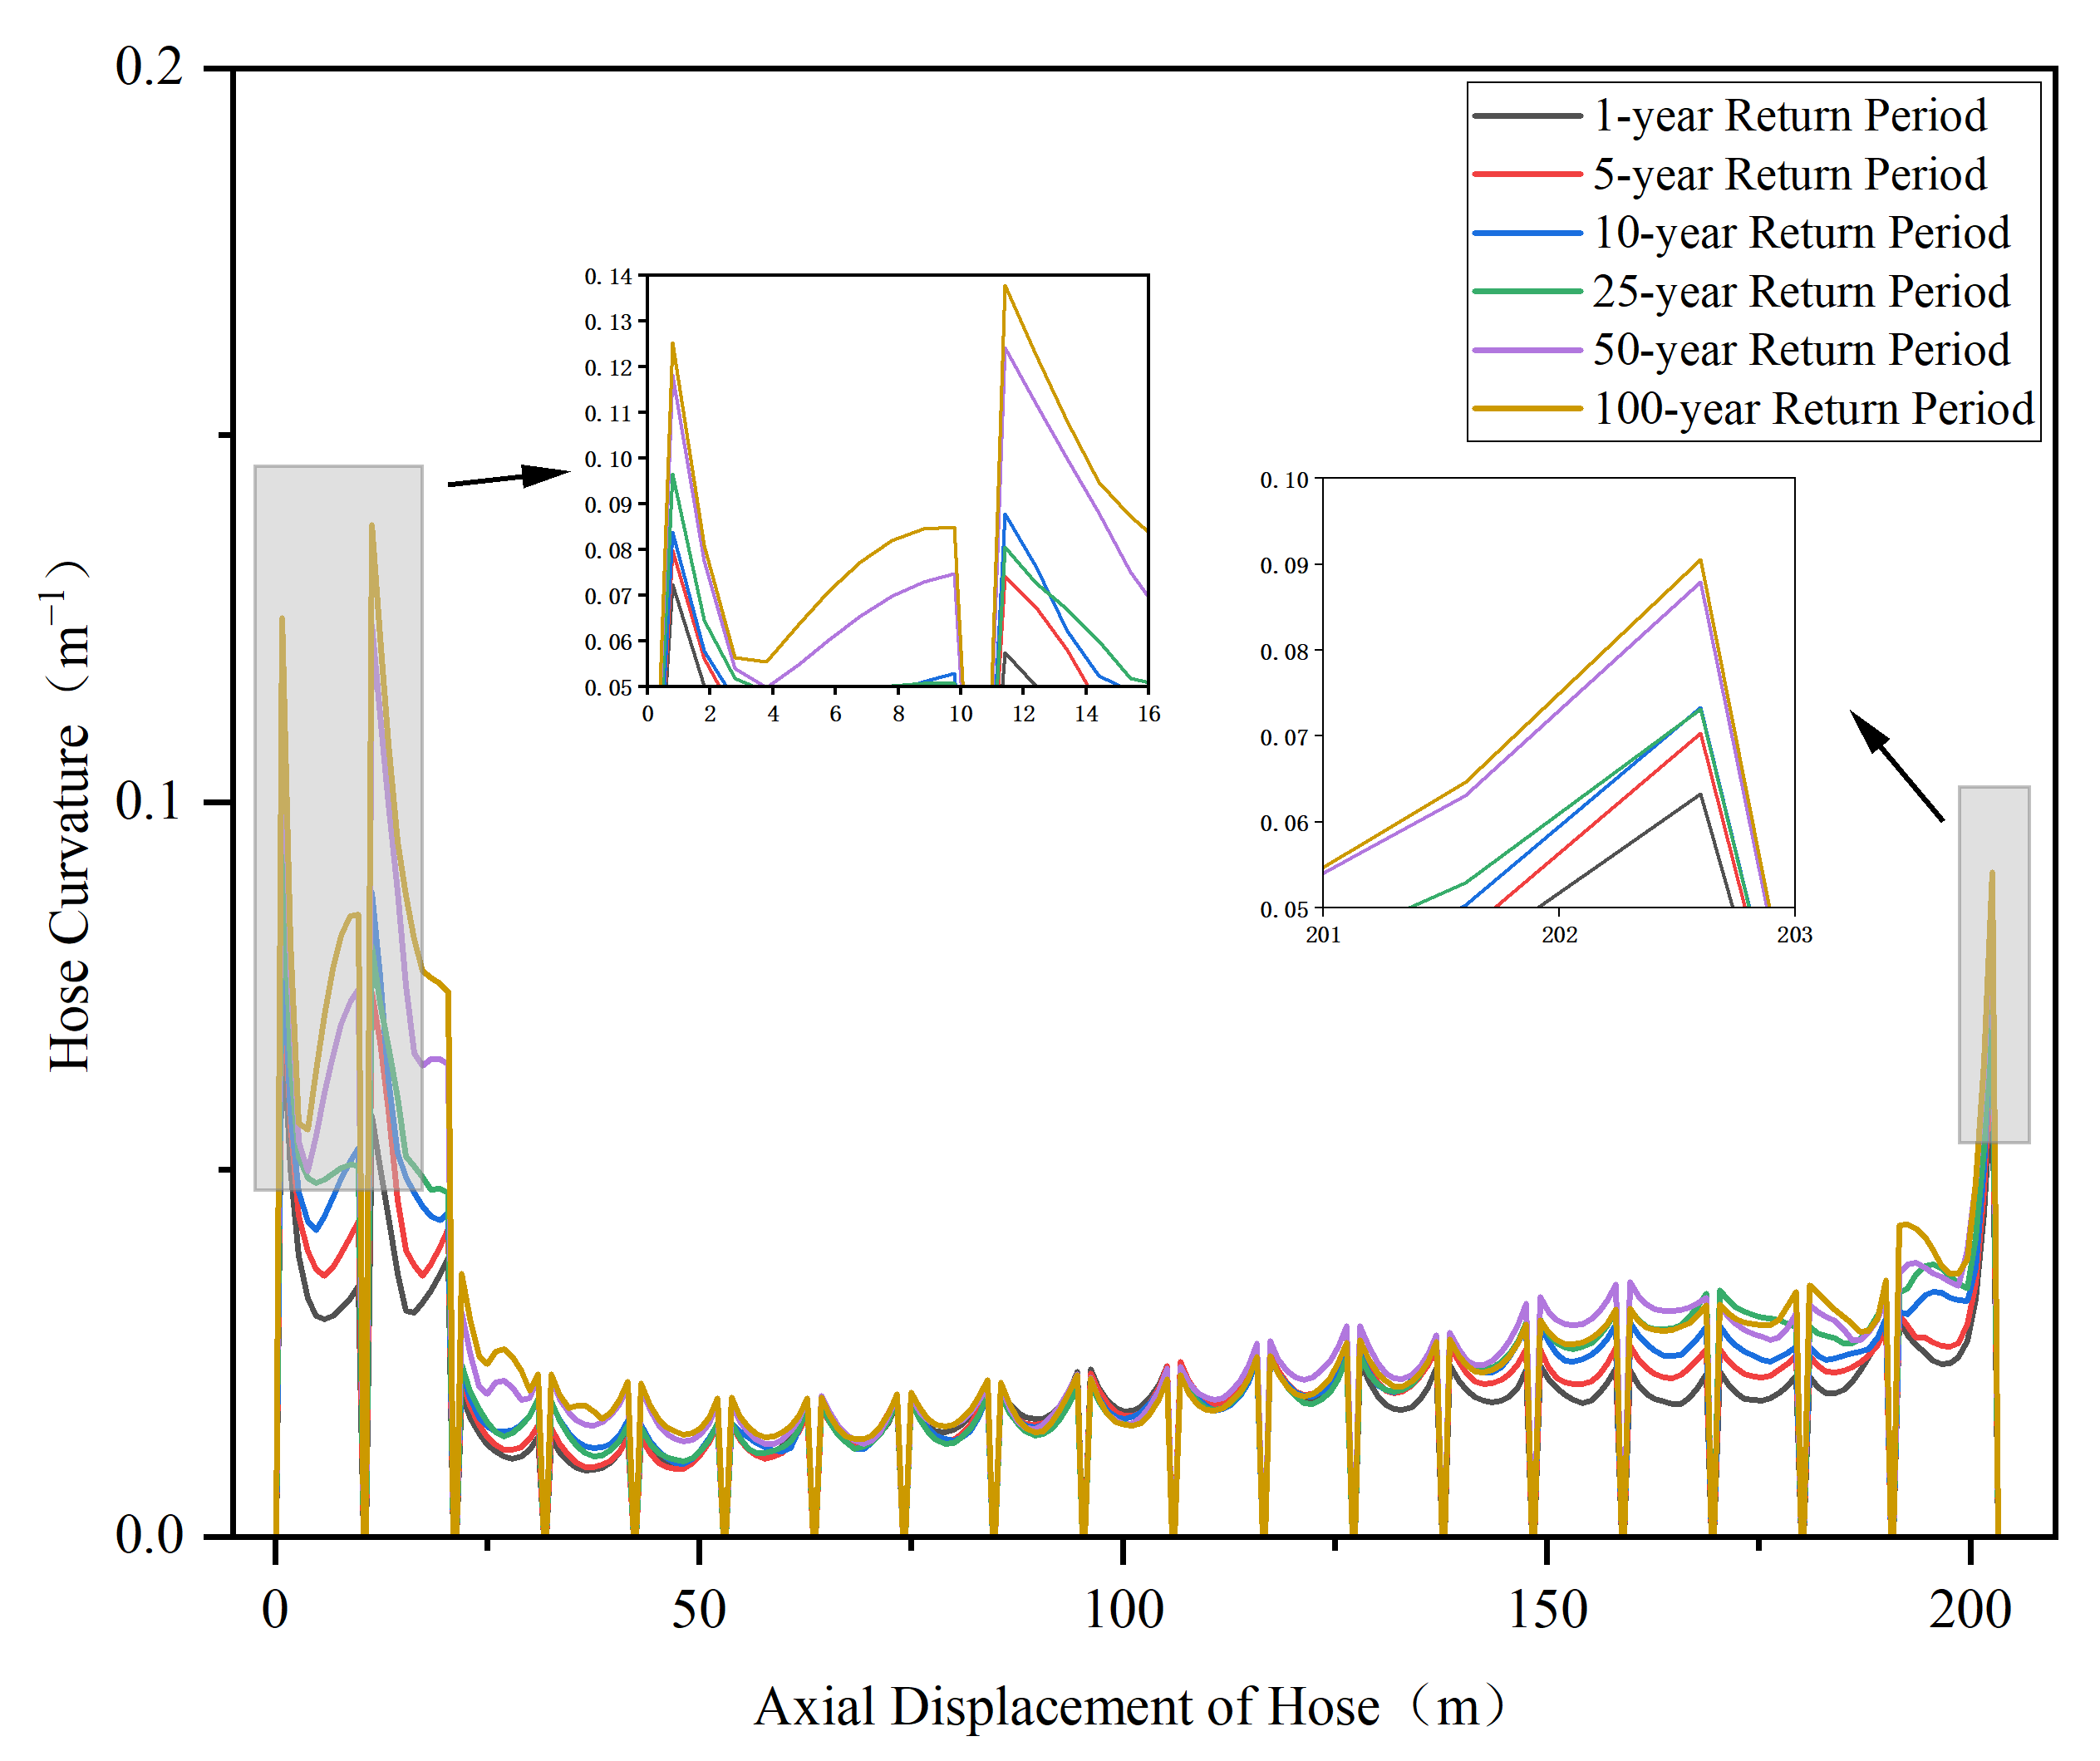
Figure 3 shows the curvature distribution of the flexible hose under different sea conditions. The curvature curve reveals 18 sections where the curvature approaches zero, corresponding to the flange connection points. The curvature is greater at both ends of the hose and smaller in the middle section; the maximum curvature consistently occurs at the junction between the flange at the leading end and the hose body. Under a once-in-a-year scenario, the maximum curvature is approximately 0.07 m
−1, with high-curvature zones concentrated in the 0–20 m and 180–200 m ranges at both ends; under a once-in-a-century scenario, the maximum curvature increases to 0.14 m
−1, representing an increase of approximately 100%. The curvature in the middle section of the hose (20–180 m) is lower and distributed more gradually, and is less affected by changes in sea conditions. The results indicate that the end regions are critical areas for bending response; their curvature increases significantly with the severity of sea conditions, which has a significant impact on the assessment of bending fatigue life.
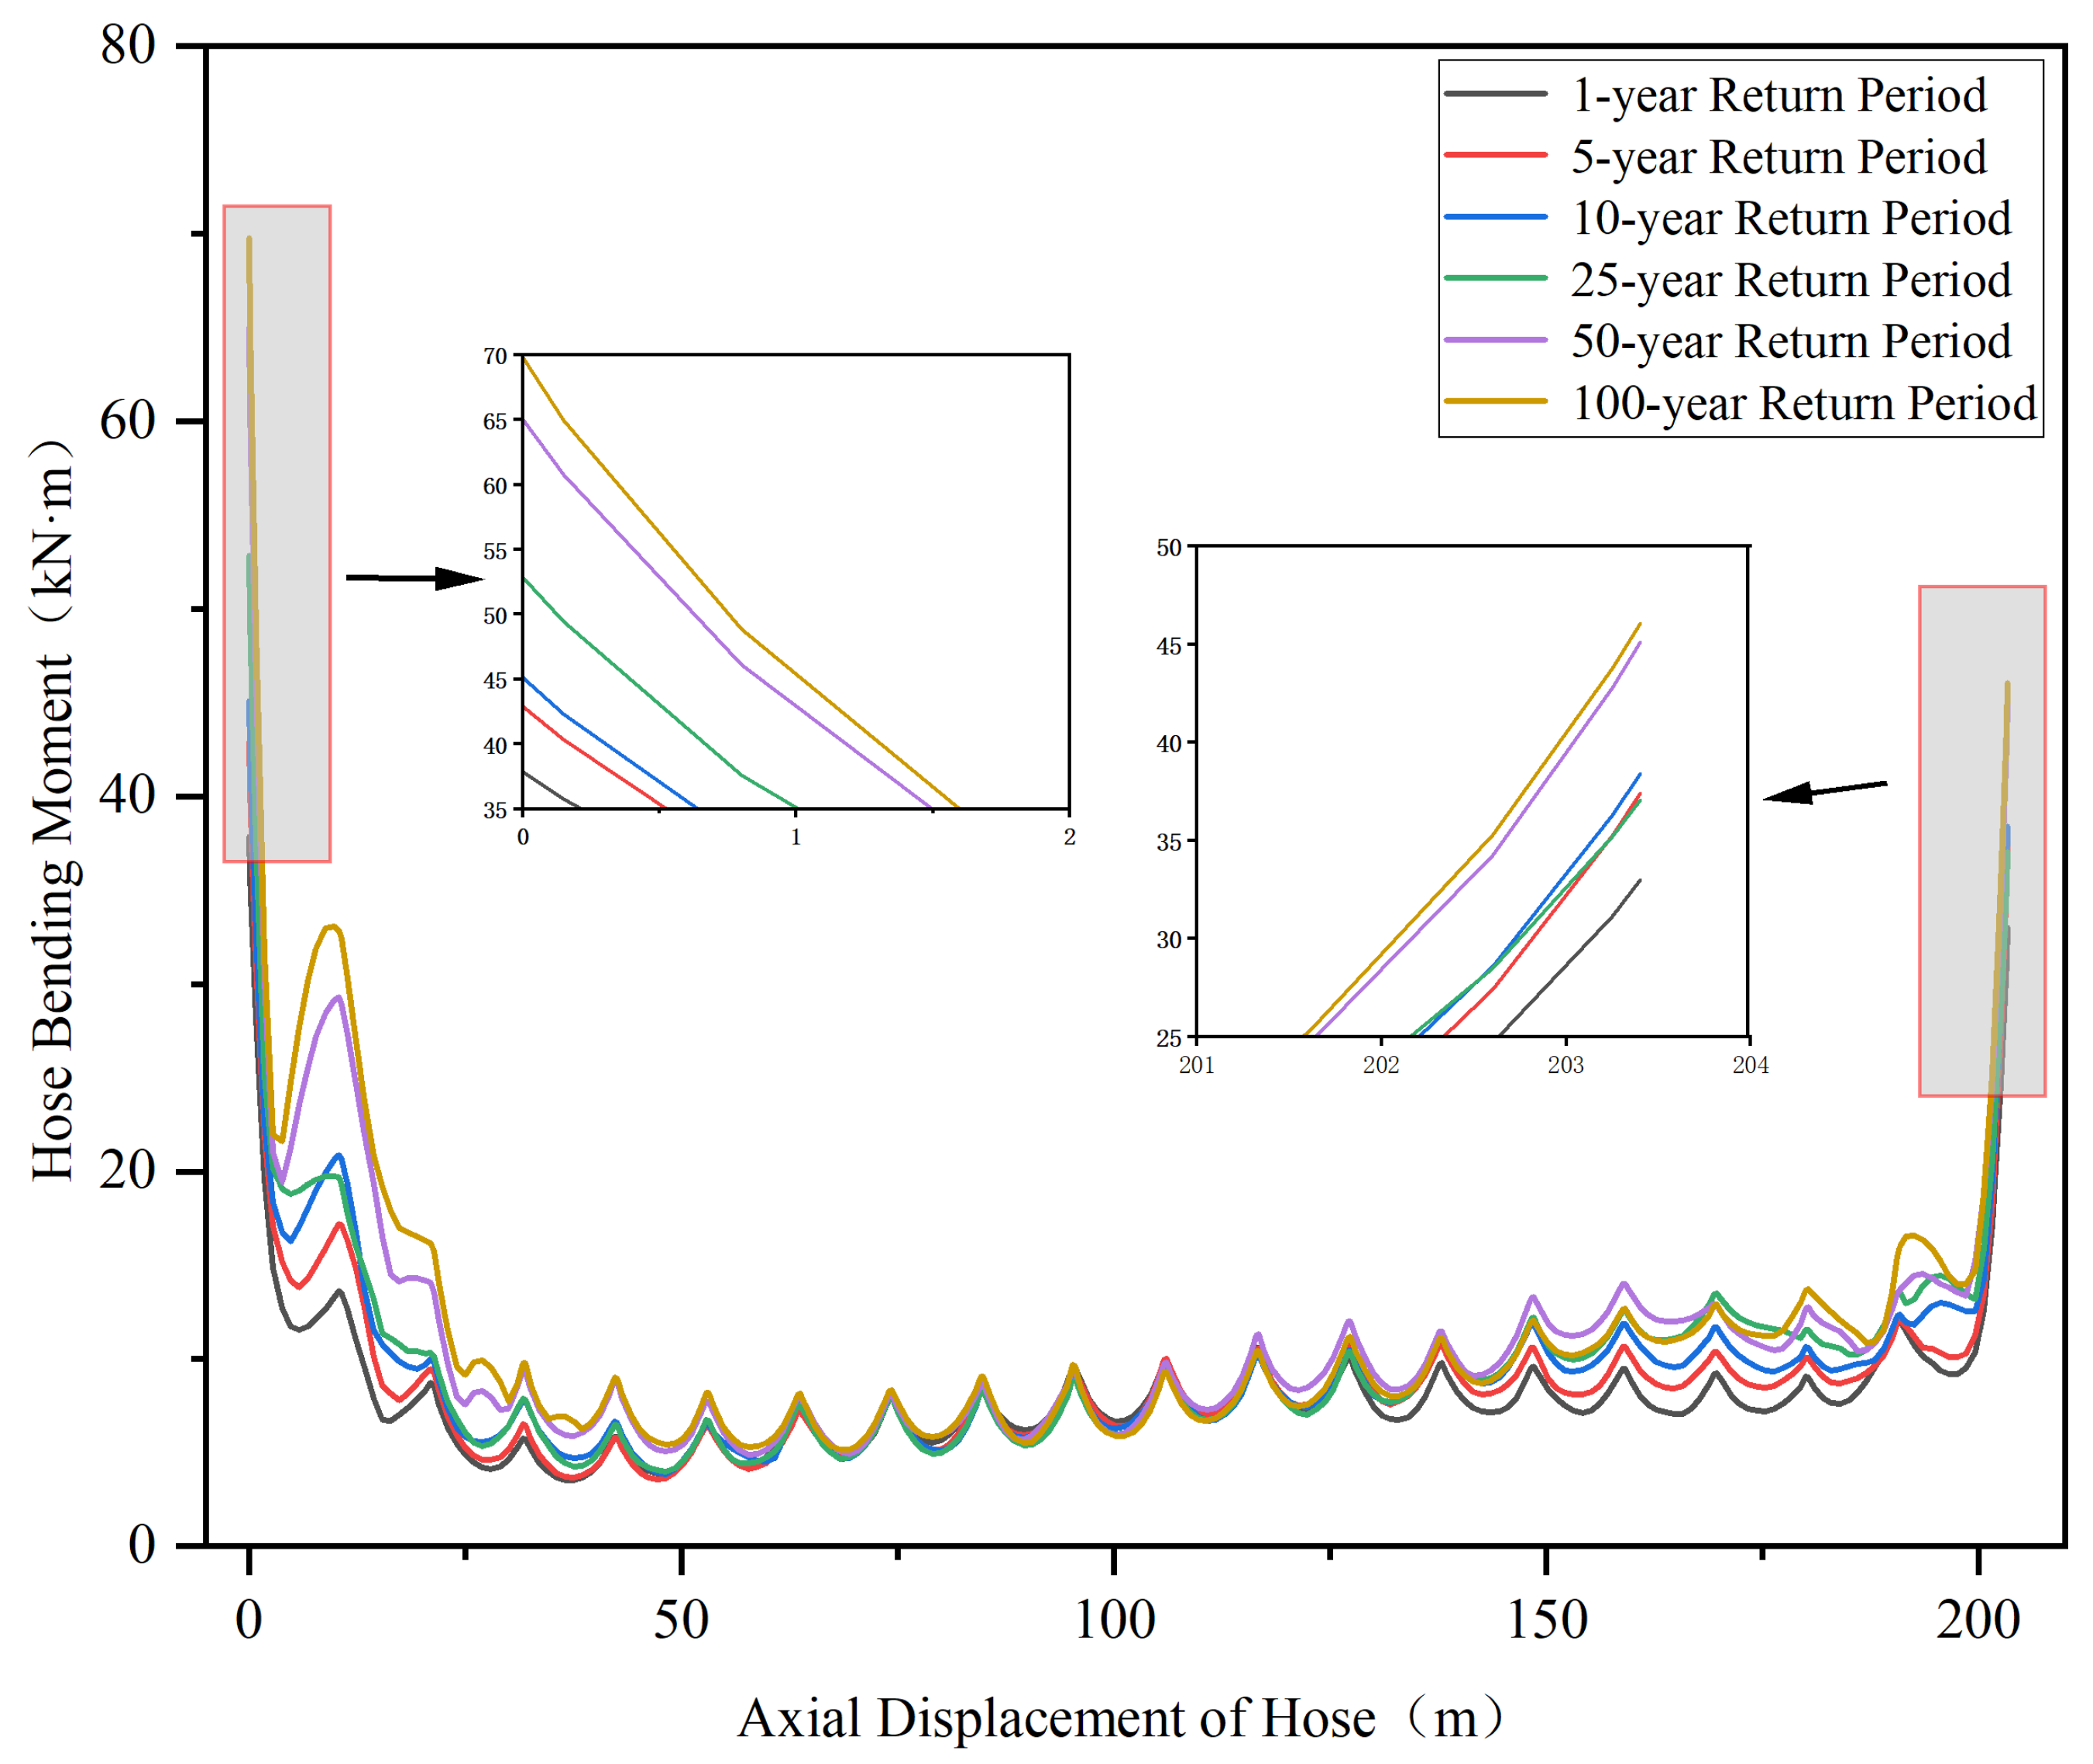
Figure 4 shows the distribution of bending moments in the flexible hose under different sea conditions. The bending moments are larger in the head and tail sections of the flexible pipe and smaller in the middle section, with the maximum bending moment always occurring in the head section. In the head section (0–20 m) and tail section (180–200 m), the bending moments increase with the return period: the maximum bending moment under a 100-year return period condition is approximately 70 kN·m, and under a 1-year return period condition, it is approximately 38 kN·m. In the main pipe section (50–150 m), the bending moment curves for different return periods overlap; in certain sections, the bending moment under a 5-year return period is higher than that under a 10-year return period. This indicates that the bending moment in this region is influenced by the complex interaction between waves and currents, exhibiting nonlinear characteristics. This result reflects the regional variability in the bending moment response of the flexible pipe system and provides valuable reference for structural optimization design.
3.2. Mechanism of the Influence of Sea State Categories on the Dynamic Response and Safety Margin of Flexible Hoses
To assess the structural safety of the floating hose, limit values for allowable tension, curvature, and bending moment were established based on the manufacturer’s specifications. Differentiated safety factors were introduced according to sea conditions with varying return periods: 2.0 for typical conditions (1–25-year return period) and 1.5 for extreme conditions (50–100-year return period). Considering the uncertainties in dynamic loads, the actual tension must be multiplied by the corresponding safety factor before comparison with the allowable tension [
29]. The specific criteria are shown in
Table 8.
To evaluate the axial load-bearing capacity and flexural resistance of floating hoses under various sea conditions, a systematic analysis was conducted of the maximum tension, curvature, and bending moment under six different load conditions ranging from a 1-year to a 100-year return-period event. The results are shown in
Table 9.
As shown in
Table 6, the three safety parameters exhibit markedly different sensitivities to the severity of sea conditions. The bending moment is the most sensitive indicator, consistently exceeding its allowable limit starting from the 5-year return period, indicating that bending failure is the dominant failure mode under moderate sea conditions. The curvature is moderately sensitive, first exceeding its allowable limit at the 50-year return period, reflecting the progressive loss of bending stiffness of the hose under large deformation. The tension is the least sensitive indicator, only exceeding the allowable value after applying the safety factor under the 100-year return period, suggesting that tensile failure represents the ultimate limit state under extreme conditions. In terms of axial tension, under a 100-year return period condition, 1.5 times the maximum tension (250.3 kN) has exceeded the allowable value (249 kN). Regarding curvature, the maximum value under a 50-year return period (0.1242 m
−1) exceeds the allowable value (0.1 m
−1) for the first time. For bending moment, although it does not exceed the limit under a 1-year return period, it is close to the allowable value (39 kN·m); starting from the 5-year return period, the maximum bending moment consistently exceeds the allowable value. This differentiated failure sequence has a clear physical interpretation. As a slender flexible structure, the hose is inherently sensitive to bending deformation induced by lateral loads, whereas axial tension requires greater overall deformation to reach its limit. From an engineering perspective, the early exceedance of the bending moment suggests that it can serve as an effective early warning indicator: operators should monitor the bending condition as early as the 5-year return period, rather than waiting until the curvature exceeds its limit at the 50-year return period.
Based on the aforementioned analysis results, a systematic comparison of the safety margins for key parameters of the floating hose under various return period conditions is presented in
Table 10. This study adopts a multi-parameter conservative judgment principle: when the safety margins of all three parameters—tension, curvature, and bending moment—are positive, the condition is judged as safe; when only one parameter has a negative margin, the condition is judged as critical, and an alert should be triggered; when two or more parameters have negative margins, the condition is judged as unsafe, and operations must be stopped immediately. Compared with traditional methods that rely on a single parameter, this judgment rule effectively avoids the risk of overlooking other failure paths simply because one indicator does not exceed its limit, thereby ensuring the structural safety of the hose more comprehensively. The safety margin is calculated using the formula: (Allowable value/Maximum response value − 1) × 100%.
The analysis indicates that the safety performance of the hose exhibits distinct hierarchical characteristics under different sea conditions:
Normal operating conditions (1-year return period): Tension, curvature, and bending moment all have positive safety margins, and the structure fully meets safety requirements;
Transitional conditions (5–25-year return period): The bending moment safety margin becomes negative, resulting in bending moment exceeding the limit, but tension and curvature still maintain positive safety margins;
Extreme conditions (50–100-year return period): Both the curvature and bending moment safety margins are negative; at the 100-year return period, the tensile safety margin also becomes negative, and the structure exceeds safety limits.
Comprehensive analysis indicates that this floating hose offers reliable safety under sea conditions with a return period of 5 years or less; however, under more severe sea conditions, necessary protective measures must be taken or its use restricted.
3.3. Control Effect and Quantitative Analysis of Operational Vessel Distance on the Structural Safety Margin of the Hose
Vessel distance is a core operational parameter that controls the catenary configuration and mechanical response of the floating hose. Its variation directly affects the axial tension, curvature, and end bending moment of the hose. To clarify the safe operational boundaries under different sea states, a systematic analysis of safe vessel distances was conducted for six return-period sea states ranging from the 1-year to the 100-year event.
Table 11,
Table 12,
Table 13,
Table 14,
Table 15 and
Table 16 present the maximum tension, curvature, bending moment, and corresponding safety margins at different vessel distances. Based on the multi-parameter conservative judgment principle established earlier, the hose condition at each vessel distance was evaluated and classified.
The results reveal that the relationship between vessel distance and hose safety exhibits a non-monotonic and asymmetric characteristic. Excessively large vessel distances cause the hose to be overly stretched, leading to elevated axial tension and end bending moments. Conversely, excessively small vessel distances result in excessive slack in the catenary, causing intensified local bending and compression near the hose end connections. Therefore, there exists an optimal vessel distance window for each sea state, within which all three safety parameters remain positive. As the return period increases, this safe operational window narrows rapidly. Under the 1-year return period sea state, the upper limit of safe vessel distance is 150 m. When the vessel distance increases to 160 m, the end bending moment first exceeds the limit, and the system enters a critical state. Notably, across all sea states, the bending moment consistently serves as the earliest failure indicator. Regardless of whether the vessel distance is too large or too small, the end bending moment always exceeds its allowable limit before tension or curvature do. This confirms that bending failure is the dominant and most sensitive failure mode for the floating hose under vessel distance variations, and also implies that monitoring the end bending moment can provide the most effective early warning for impending hose failure during tandem offloading operations. At 180 m, both curvature and tension also exceed their limits, leading to overall system failure. Under the 5-year and 10-year return period sea states, the upper limits of safe vessel distance are reduced to 140 m and 120 m, respectively. Beyond these limits, the system deterioration is again triggered by the bending moment exceeding its limit. Under the more severe 25-year return period sea state, the safe vessel distance is sharply compressed to 80 m, and at this limiting distance, the bending moment safety margin is only 0.4%, placing the system on the verge of safety. When the sea state reaches extreme conditions of the 50-year and 100-year return periods, the system cannot satisfy all safety criteria at any vessel distance, indicating that adjusting the vessel distance alone is insufficient to ensure safety, and operations must be prohibited. In addition, when the vessel distance is too short (below 60 m), the hose catenary becomes excessively slack, leading to intensified local bending and compression, which can also cause structural failure. Therefore, this study only considers vessel distances above 60 m in the analysis.
3.4. Operation Risk Zoning and Thresholds Based on the Coupling of Sea Conditions and Vessel Distance
Based on the systematic analysis of the dynamic response of floating hoses under sea conditions with different return periods, and taking into account the influence of the key operational parameter—vessel distance—this section aims to define a two-dimensional operational risk zone and propose corresponding operational and disengagement threshold recommendations. By integrating the coupled effects of sea conditions and vessel distance on the safety margins of the hose’s axial tension, curvature, and end bending moment, this section provides clear, matrix-based guidance for dynamic risk control during actual operations.
3.4.1. Definition of Comprehensive Risk Zones
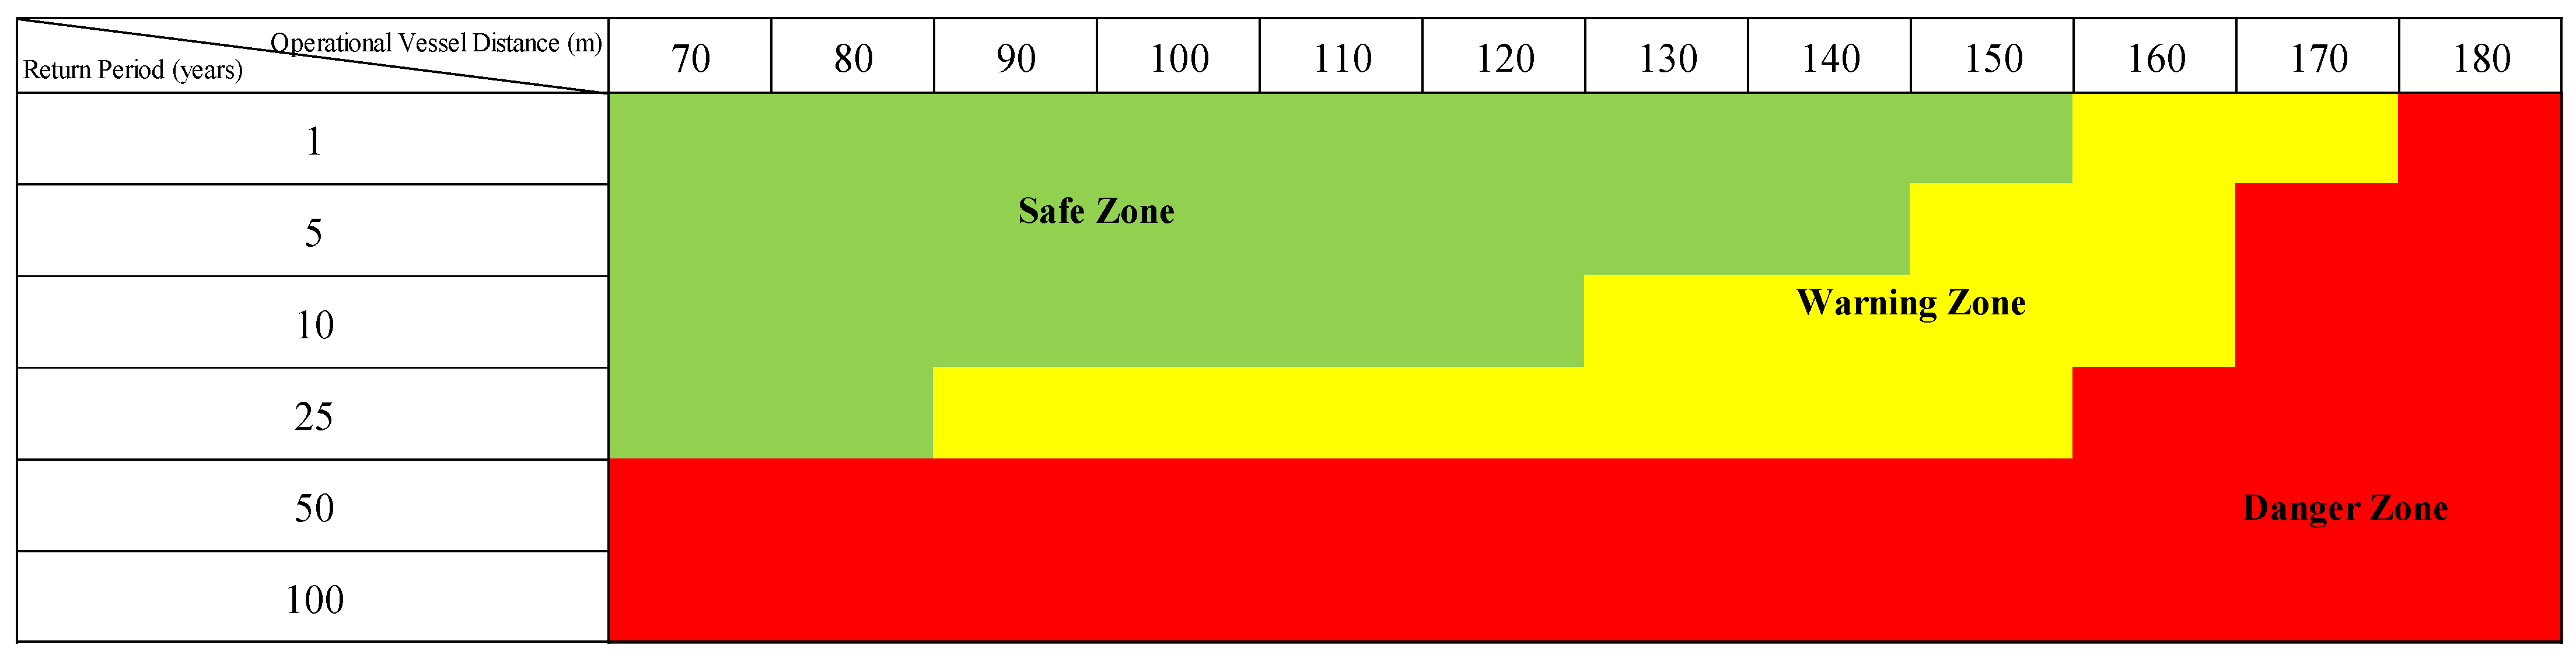
By analyzing the dynamic response of the flexible hose and safety margins, three hierarchical operational risk zones can be defined based on two dimensions: environmental sea conditions (return period) and operational vessel distance, as shown in
Figure 5:
Safe Operation Zone (Green): Corresponds to mild sea conditions where the vessel distance is strictly controlled within the corresponding safety limit. Within this zone, the hose tension, curvature, and bending moment all maintain positive safety margins, ensuring safe operations.
Early Warning and Avoidance Zone (Yellow): Corresponds to conditions where sea states worsen or the operational vessel distance slightly exceeds the safety limit. Within this zone, the end bending moment is typically already beyond the limit or at a critical level, and the safety margins for tension and curvature are significantly reduced. New operations should be avoided, and high vigilance is required for ongoing operations.
Danger and Release Zone (Red): Corresponds to severe sea conditions (return period > 25 years) or vessel distances that deviate significantly from the safe range. Within this zone, multiple key parameters of the hose exceed limits successively, posing a high risk of structural damage. Operations must be prohibited, or emergency release procedures must be initiated immediately.
Previous studies, such as that of Shi et al., defined single deterministic critical values for wind speed and current velocity in LNG ship-to-ship transfer operations, specifying that wind speed must be below Beaufort 6 and current velocity below 2.5 nautical miles per hour [
30]. These criteria provide clear binary thresholds for operational safety. However, this binary classification has an inherent limitation: it fails to capture the transitional state in which the hose structure has partially exceeded its limits but has not yet entered catastrophic failure.
The present study is guided by the ALARP principle, which divides risk into three regions: unacceptable, tolerable, and broadly acceptable [
31]. Based on this principle, a yellow critical zone is introduced. Unlike traditional binary judgments, this zone explicitly identifies the condition where exactly one safety parameter has turned negative while the remaining parameters remain positive. This provides operators with a proactive intervention window, enabling them to adjust vessel distance, reduce offloading rate, or alter vessel heading before the situation escalates to multi-parameter failure. The three-zone scheme transforms the abstract concept of approaching danger into actionable operational instructions, representing a significant advancement over conventional single-parameter binary criteria in terms of continuity and operability of safety assessment.
3.4.2. Safe Vessel Distance and Operating Window
Based on the systematic analysis in this study, the maximum allowable operating vessel distance to ensure hose structural safety under different sea conditions can be clearly defined, as shown in
Table 17. The upper limit of the safe vessel distance is a strongly decreasing function of the sea state return period. Under mild 1-year return period conditions, the maximum allowable vessel distance is 150 m; this distance serves as the operational reference benchmark, and exceeding this limit will directly cause the end connection bending moment to exceed the allowable value of 39 kN·m.
As sea conditions worsen, the safe operating window narrows rapidly. Under a 1-in-5-year event, the maximum allowable vessel distance is reduced to 140 m; under a 1-in-10-year event, it is further reduced to 120 m. This indicates that when facing harsher sea conditions, the precision required for vessel distance control increases significantly, and the allowable operational margin for error shrinks dramatically. Under a 25-year return period, the upper limit of the safe operational vessel distance has dropped to 80 m or less. At this point, the safety margin for the end bending moment is nearly exhausted, placing the system in a critical state with no practical operational safety window.
The results of this analysis provide clear, quantitative guidance for on-site operations. During actual operations, the current sea state level must be dynamically determined based on real-time marine environment forecasts, and the corresponding upper limit for safe operational vessel distance must be strictly enforced. When forecast sea conditions reach a 10-year return period or higher, decision-makers should recognize that the operational safety window is extremely limited. They must comprehensively consider whether conditions for implementing high-precision operational vessel distance control are met and assess whether to continue operations.