1. Introduction
Recent landslide tsunami events, such as the 2017 Greenland case [
1] and the 2020 Canadian case [
2], demonstrate that impact waves can overtop dams, flood coastlines, and run-up slopes. When a failed soil–rock mass enters water, it transfers energy and generates surges [
3]. Therefore, predicting maximum wave height, propagation speed, run-up, and inundation extent is critical for hazard assessment and early warning in vulnerable areas [
4].
Key parameters identified for predicting initial wave height include landslide volume [
5], thickness, and impact velocity [
6,
7], while aspect ratio and impact angle largely govern the directional propagation of wave energy [
8,
9]. Based on these parameters, semi-empirical prediction formulas have been developed through dimensional analysis and numerical simulations [
10,
11].
However, the experiments underlying these formulas typically treat the landslide mass as rigid blocks or uniform granular assemblies, whereas natural debris is inherently polydisperse and heterogeneous. Rigid blocks generate larger waves than granular aggregates [
12]. Particle-scale properties, including porosity [
13], apparent viscosity [
14], and size distribution [
15], have been shown to influence energy transfer and surge characteristics. Friction properties also govern granular motion [
16]. These findings confirm that a deformable granular representation is physically more appropriate [
8]. Nevertheless, experimental limitations in observing internal particle interactions have resulted in a lack of a unified understanding of how the vertical stacking order of fixed grain fractions and packing configuration control landslide kinematics and surge generation. Different from Lee and Huang (2022), who only adopted randomly mixed polydisperse particles without controlled vertical layered stacking sequences, this study designs six complete vertical permutation schemes of three grain sizes to quantitatively analyze the independent influence of initial stratification on particle sorting and surge amplification, which was not systematically quantified in their random particle simulation framework [
15].
In numerical studies, most simulations of subaerial landslides have also adopted granular assemblies but focused on single particle sizes. Ataie-Ashtiani and Shobeyri simulated landslide motion using a hybrid rheological model based on a non-Newtonian fluid assumption, which captured fluidized landslide dynamics; however, as a continuum approach, the model could not accurately describe the discrete mechanical behavior between solid particles in coarse-grained landslides [
17]. To intrinsically represent the discrete nature of landslide masses, the coupling of the Discrete Element Method (DEM) with Computational Fluid Dynamics (CFD) resolves both the discrete behavior of the particle system and the continuum behavior of the fluid phase, capturing the momentum exchange between the two phases [
18]. Chen et al. employed a coupled DEM-CFD approach to validate its applicability for seepage and consolidation problems, though their work highlighted that the determination of key computational parameters remains reliant on empirical knowledge [
19]. Consequently, systematic research on how grain size distribution and packing within a landslide mass influence its kinematics and final deposition characteristics is still lacking.
Existing coupled CFD-DEM numerical investigations on subaerial landslide-generated surges mostly simplify the sliding mass as uniform monodisperse particles, randomly mixed polydisperse grains, or rigid impact blocks, while the vertical layered stratification widely observed in natural colluvial slope deposits has rarely been systematically parameterized and quantified. A comprehensive comparison of representative previous works is summarized in
Table 1 to clarify the research gap addressed in the present study.
Mohammed and Fritz (2012) and Xue et al. (2019) adopted single-layer granular slides and focused on overall surge propagation characteristics; however, their study did not address the internal vertical grain sorting induced by layered initial structures [
8,
9]. Zhou et al. (2010) proposed a vertical centroid index to evaluate reverse segregation in dry debris flows with random binary mixtures; however, it did not include a submerged water wave generation process [
18]. Lee and Huang (2022) conducted multi-size granular surge simulations under random disordered packing, but failed to design controlled layered permutation boundary conditions to isolate stratification effects [
15]. Empirical prediction formulas proposed by Panizzo et al. (2005) were derived from rigid block impact experiments, which cannot reproduce particle-scale segregation and momentum exchange [
10]. Chen et al. (2011) and Rauter et al. (2022) further neglected the coupling between layered grain arrangement and surge amplification [
13,
19].
Against the above limitations, the core novelty of this work lies in three aspects:
(1) Six complete vertical layered permutation configurations composed of 1, 3, and 5 mm grains are designed to reproduce all typical natural slope stratification modes, which resolves the research gap on the topic of ordered, layered granular landslide simulation in the existing CFD-DEM frameworks. All simulations adopt identical 1, 3, and 5 mm grain fractions, with only vertical stacking sequences adjusted to isolate the effect of layered arrangement rather than varying particle compositions.
(2) The vertical centroid segregation index Hi is adopted to quantitatively characterize size sorting during sliding, and velocity flow field contours at the critical wave generation instant are used to reveal the fine-particle momentum transfer mechanism, rather than only qualitative morphological observation.
(3) Four still-water depths are set, and dimensional analysis based on the landslide front Froude number is performed to quantify the transition rule between nonlinear shallow-water surges and linear long waves, with dimensionless fitting of the deposit geometric parameters.
Therefore, this study employs a coupled CFD-DEM model to systematically investigate landslide motion and surge generation under varying particle compositions, revealing the controlling role of particle size distribution on landslide dynamics and final deposition characteristics. The findings provide insights for risk assessment and mitigation of landslide-generated surges.
2. Materials and Methods
2.1. Motion Equations of the DEM Model
The translational and rotational motion of each solid particle is governed by Newton’s second law [
20]:
where
mi,
vi,
Ii, and
wi are the mass, translational velocity, moment of inertia, and angular velocity of particle i;
Fc,ij and
Flr,ik are the contact force and non-contact long-range force acting on it defined in Equation (1); F
pf,i and Fg,i are the particle–fluid interaction force and gravitational force; and
Mt,ij and
Mr,ij are the tangential friction torque and rolling resistance torque exerted by particle j.
The contact force,
Fc,ij, is resolved into normal
Fcn,ij and tangential
Fct,ij components. The normal component follows the Hertz–Tsuji model [
21], and the tangential component follows the Hertz–Mindlin model [
22]:
where
kn,ij and
kt,ij are the normal and tangential contact stiffness, respectively;
and
are the corresponding damping coefficients; and
n,ij and
are the normal and tangential relative velocities.
2.2. Governing Equations of the CFD Model
The incompressible fluid phase is governed by the volume-averaged Navier–Stokes equations, with closure achieved through the Reynolds Stress Model [
23]:
where
ε is the local porosity;
u,
, and
are the fluid velocity, density, and dynamic viscosity;
p* is the fluid pressure; and
fpf is the momentum exchange source term imposed on the fluid by the particles.
To capture the free surface, the Volume of Fluid (VOF) method is integrated into the CFD-DEM framework to resolve the gas–liquid multiphase system. The liquid volume fraction
distinguishes three states within a computational cell:
= 0, pure gas;
= 1, pure liquid; and 0 <
< 1, free surface. The free-surface evolution is obtained by solving the transport equation [
24]:
where
u is the relative velocity between the two phases, defined as
u =
u1 −
u2.
The primary-phase volume fraction satisfies the conservation constraint:
For time discretization of the volume fraction equation, the geometric reconstruction scheme is adopted for its superior accuracy. The fluid density and viscosity in each cell are determined by the phase fractions and pure-phase properties [
25]:
The DEM timestep strictly satisfies the Rayleigh stability criterion to avoid abnormal contact force oscillation during particle collision. For the CFD solver, iteration convergence is judged by the residual of continuity and momentum equations; computation proceeds only after the residuals drop below 10−3 at each fluid timestep to guarantee stable two-phase coupling.
All two-way CFD-DEM coupling calculations are performed using ANSYS Fluent 19.2 and EDEM 2022 via the official bidirectional coupling interface. The VOF free-surface model, Reynolds Stress Model, and Di Felice drag correlation are activated within Fluent for multiphase flow computation, while EDEM handles particle contact detection, Hertz–Mindlin contact force calculation, and the virtual sphere-modified local porosity algorithm. Post-processing of particle velocity contours, time-series wave height data, and spatial granular distribution is completed with CFD-Post 19.2. Technical manuals of ANSYS 19.2 and EDEM 2022 are supplemented in the reference list for standardized citation.
2.3. Interaction Governing Equations
A bidirectional CFD-DEM coupling is adopted for fluid–particle interactions. The total fluid–particle force
Ff comprises the buoyancy force
Fb and the drag force
Fd. The buoyancy force is derived from the local fluid pressure gradient [
26]:
where
VP is the particle volume.
The drag force arises from the relative motion between the fluid and the particle, acts at the particle centroid, and opposes the relative velocity. It is computed using the Di Felice model [
27,
28]:
where
Cd is the drag coefficient,
d is the particle diameter,
v is the particle velocity vector,
is a correction factor accounting for the local particle concentration, and Re
p is the particle Reynolds number.
Compared with conventional models such as Ergun–Wen–Yu [
29], the concentration correction in the Di Felice model captures the drag force variation more accurately in granular landslide surges. The resulting force on the particles is fed back into the fluid momentum equation via the source term
fpf in Equation (6), establishing two-way momentum coupling [
30].
The cell-scale porosity ε calculated via the virtual sphere DEM algorithm describes the solid particle volume fraction within a grid cell, independent of the gas–liquid phase distribution denoted by αw. In mixed cells containing both particles and a free surface, the fluid momentum source term fpf uses ε to correct the effective fluid flow volume, while αw distinguishes liquid and gas phases to correspondingly assign fluid density and viscosity. These two-phase-averaged variables function independently without mutual coupling in the calculation of momentum source terms.
2.4. Local Mesh Porosity
Local porosity
ε is a key parameter controlling the drag force in the fluid governing equations. However, in the locally averaged CFD-DEM framework, excessively large particles can cause the particle phase volume fraction in a computational cell to approach or even exceed unity, leading to a discontinuous porosity field and numerical convergence issues [
31,
32]. To resolve this, a modified porosity calculation method based on a virtual sphere model is adopted [
33].
In this approach, the virtual sphere shares its centroid with the real particle, with a radius set to three times the real particle radius. The volume contribution of a real particle is uniformly distributed over all grid cells covered by its virtual sphere. The local porosity of a given cell is then obtained as [
33]:
where
Vp,i is the volume of the virtual sphere of particle i, and
Vvs,i is the total volume of all grid cells associated with the virtual sphere.
2.5. CFD-DEM Model Validation
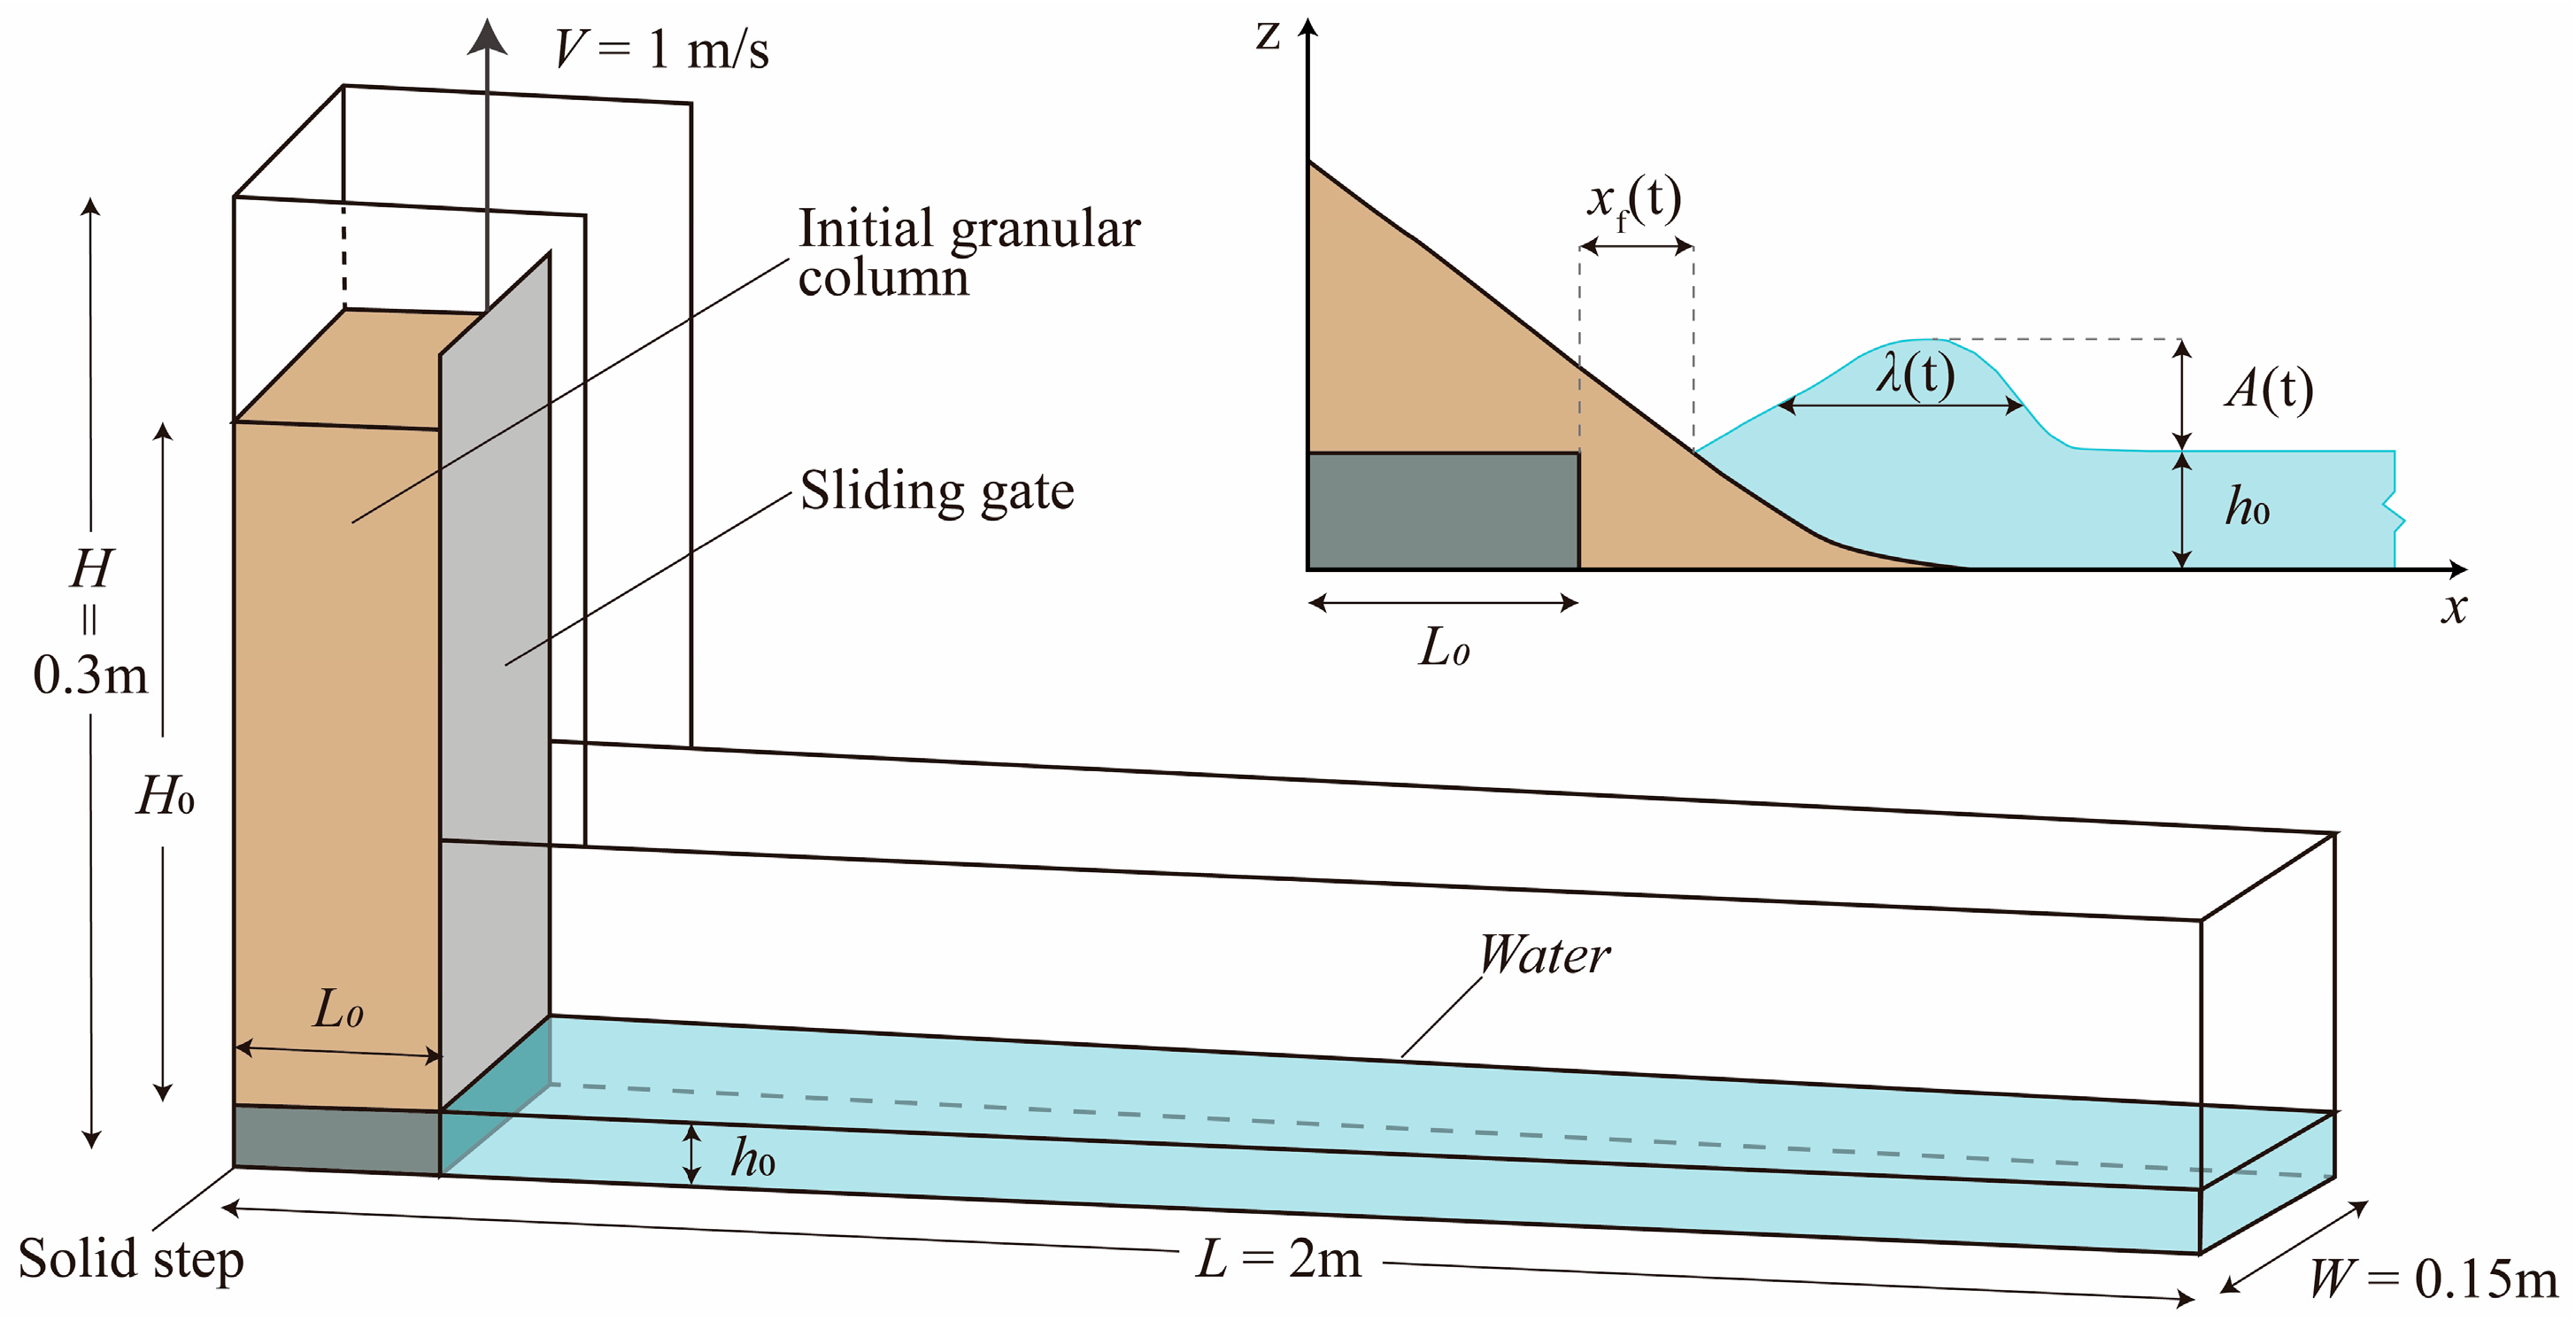
To validate the discrete-phase model for landslide-induced surge, a numerical simulation is performed based on the granular collapse and surge experiment of Sarlin et al. [
34]. The computational domain measures 2 m (
L) × 0.15 m (
W) × 0.3 m (
H) and is discretized with a uniform grid size of 1.5 cm (see
Figure 1). The initial still-water depth
h0 = 8 cm. A vertically stacked granular mass is placed on the left side, with an initial height
H0 = 0.29 m and length
L0 = 0.1 m. The top boundary is set as a pressure outlet; all other boundaries are no-slip walls. The key physical parameters are listed in
Table 2.
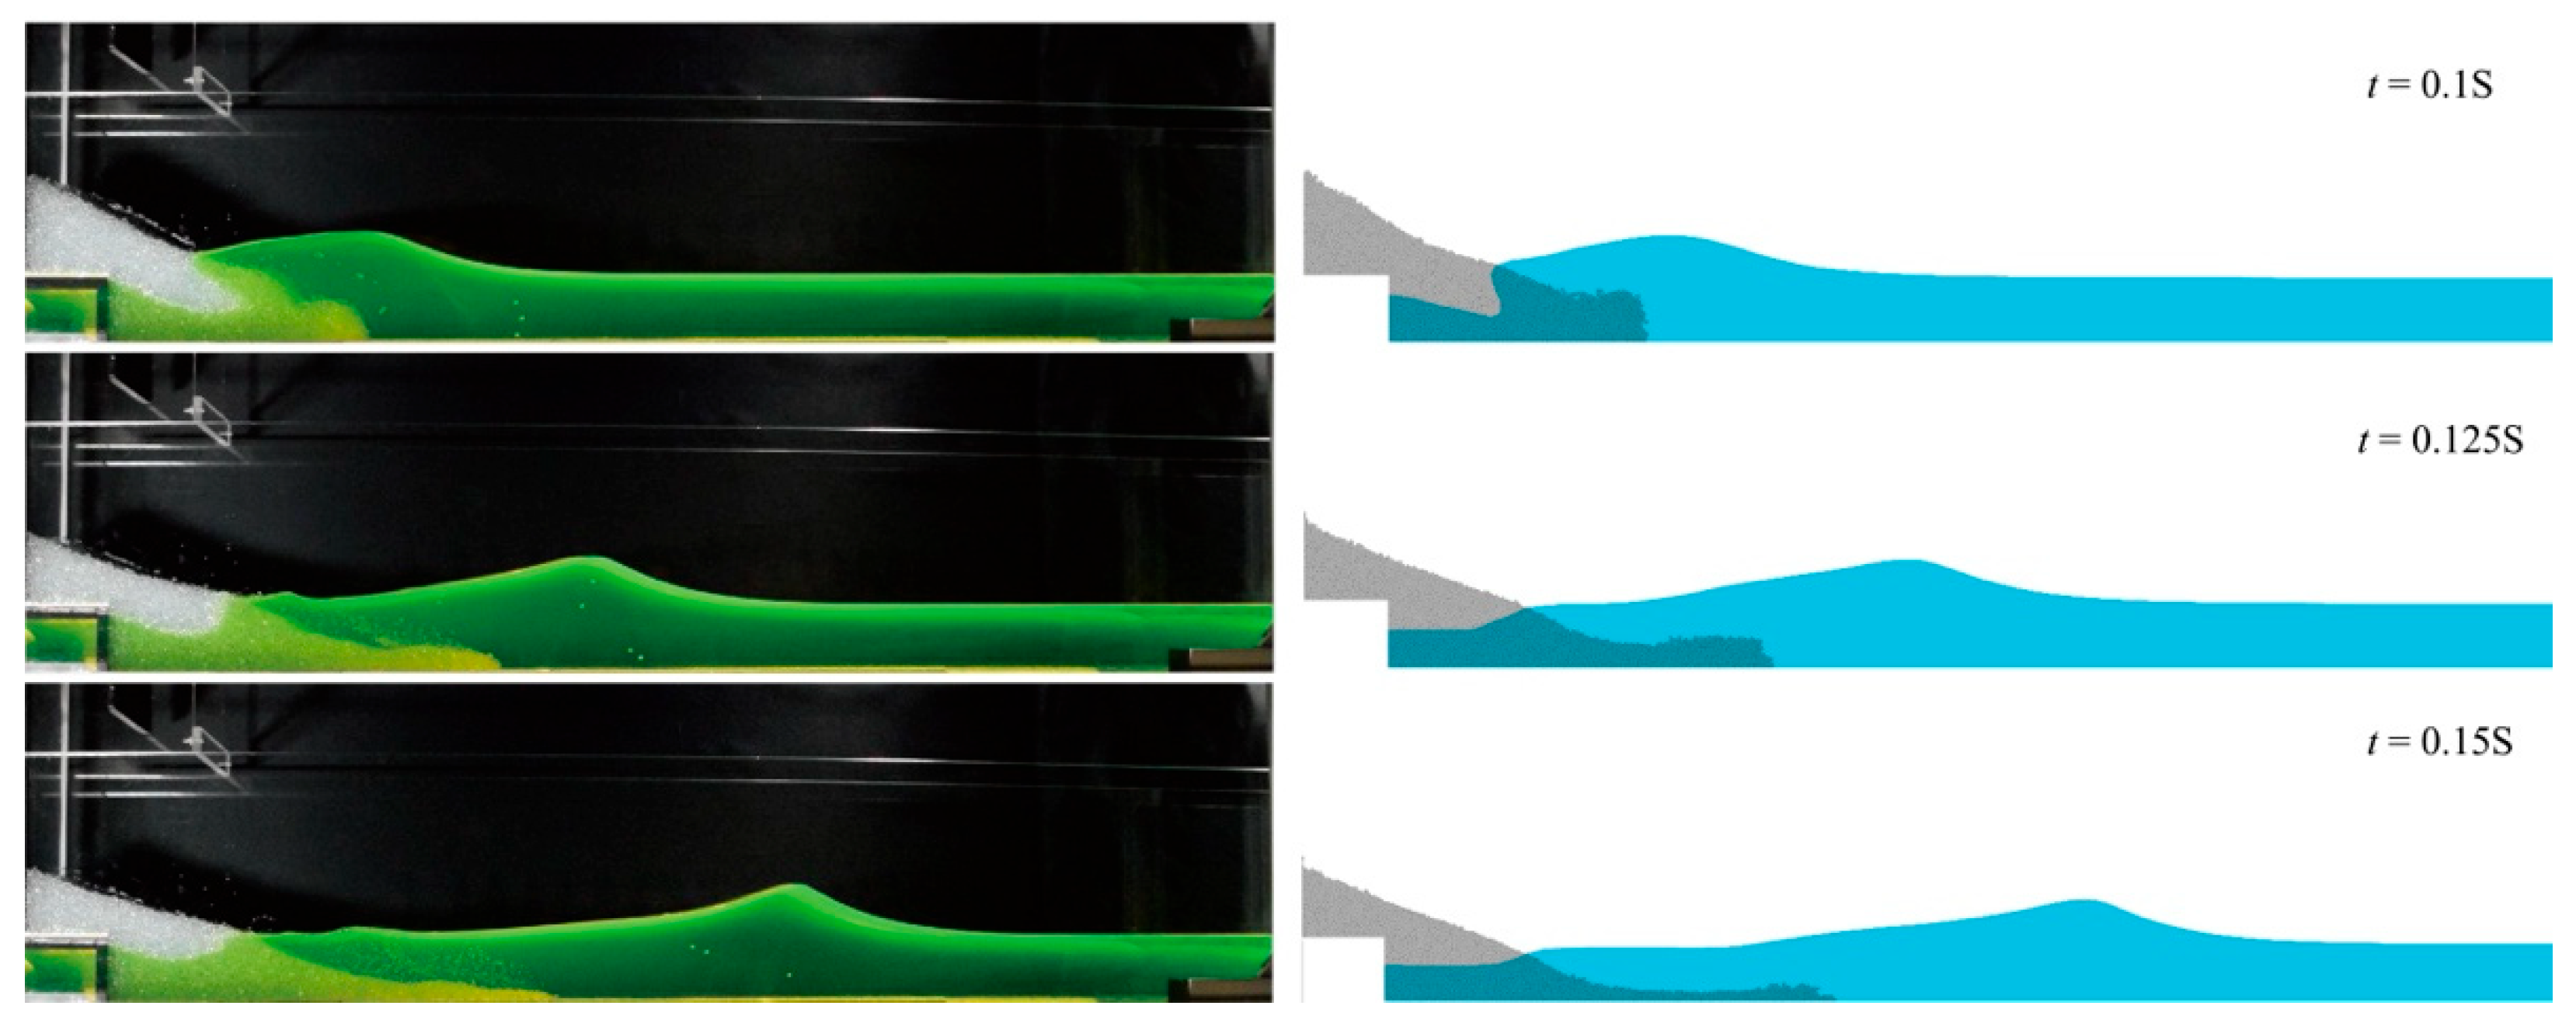
At the initial moment, the gate is removed, and the granular mass collapses under gravity. The particle motion displaces the fluid, generating the initial surge. As the fluid drag on the leading-edge increases, a distinct vortex structure develops above the granular mass, with its feedback most pronounced at the advancing front. The simulated collapse sequence agrees well with the experimental images (see
Figure 2).
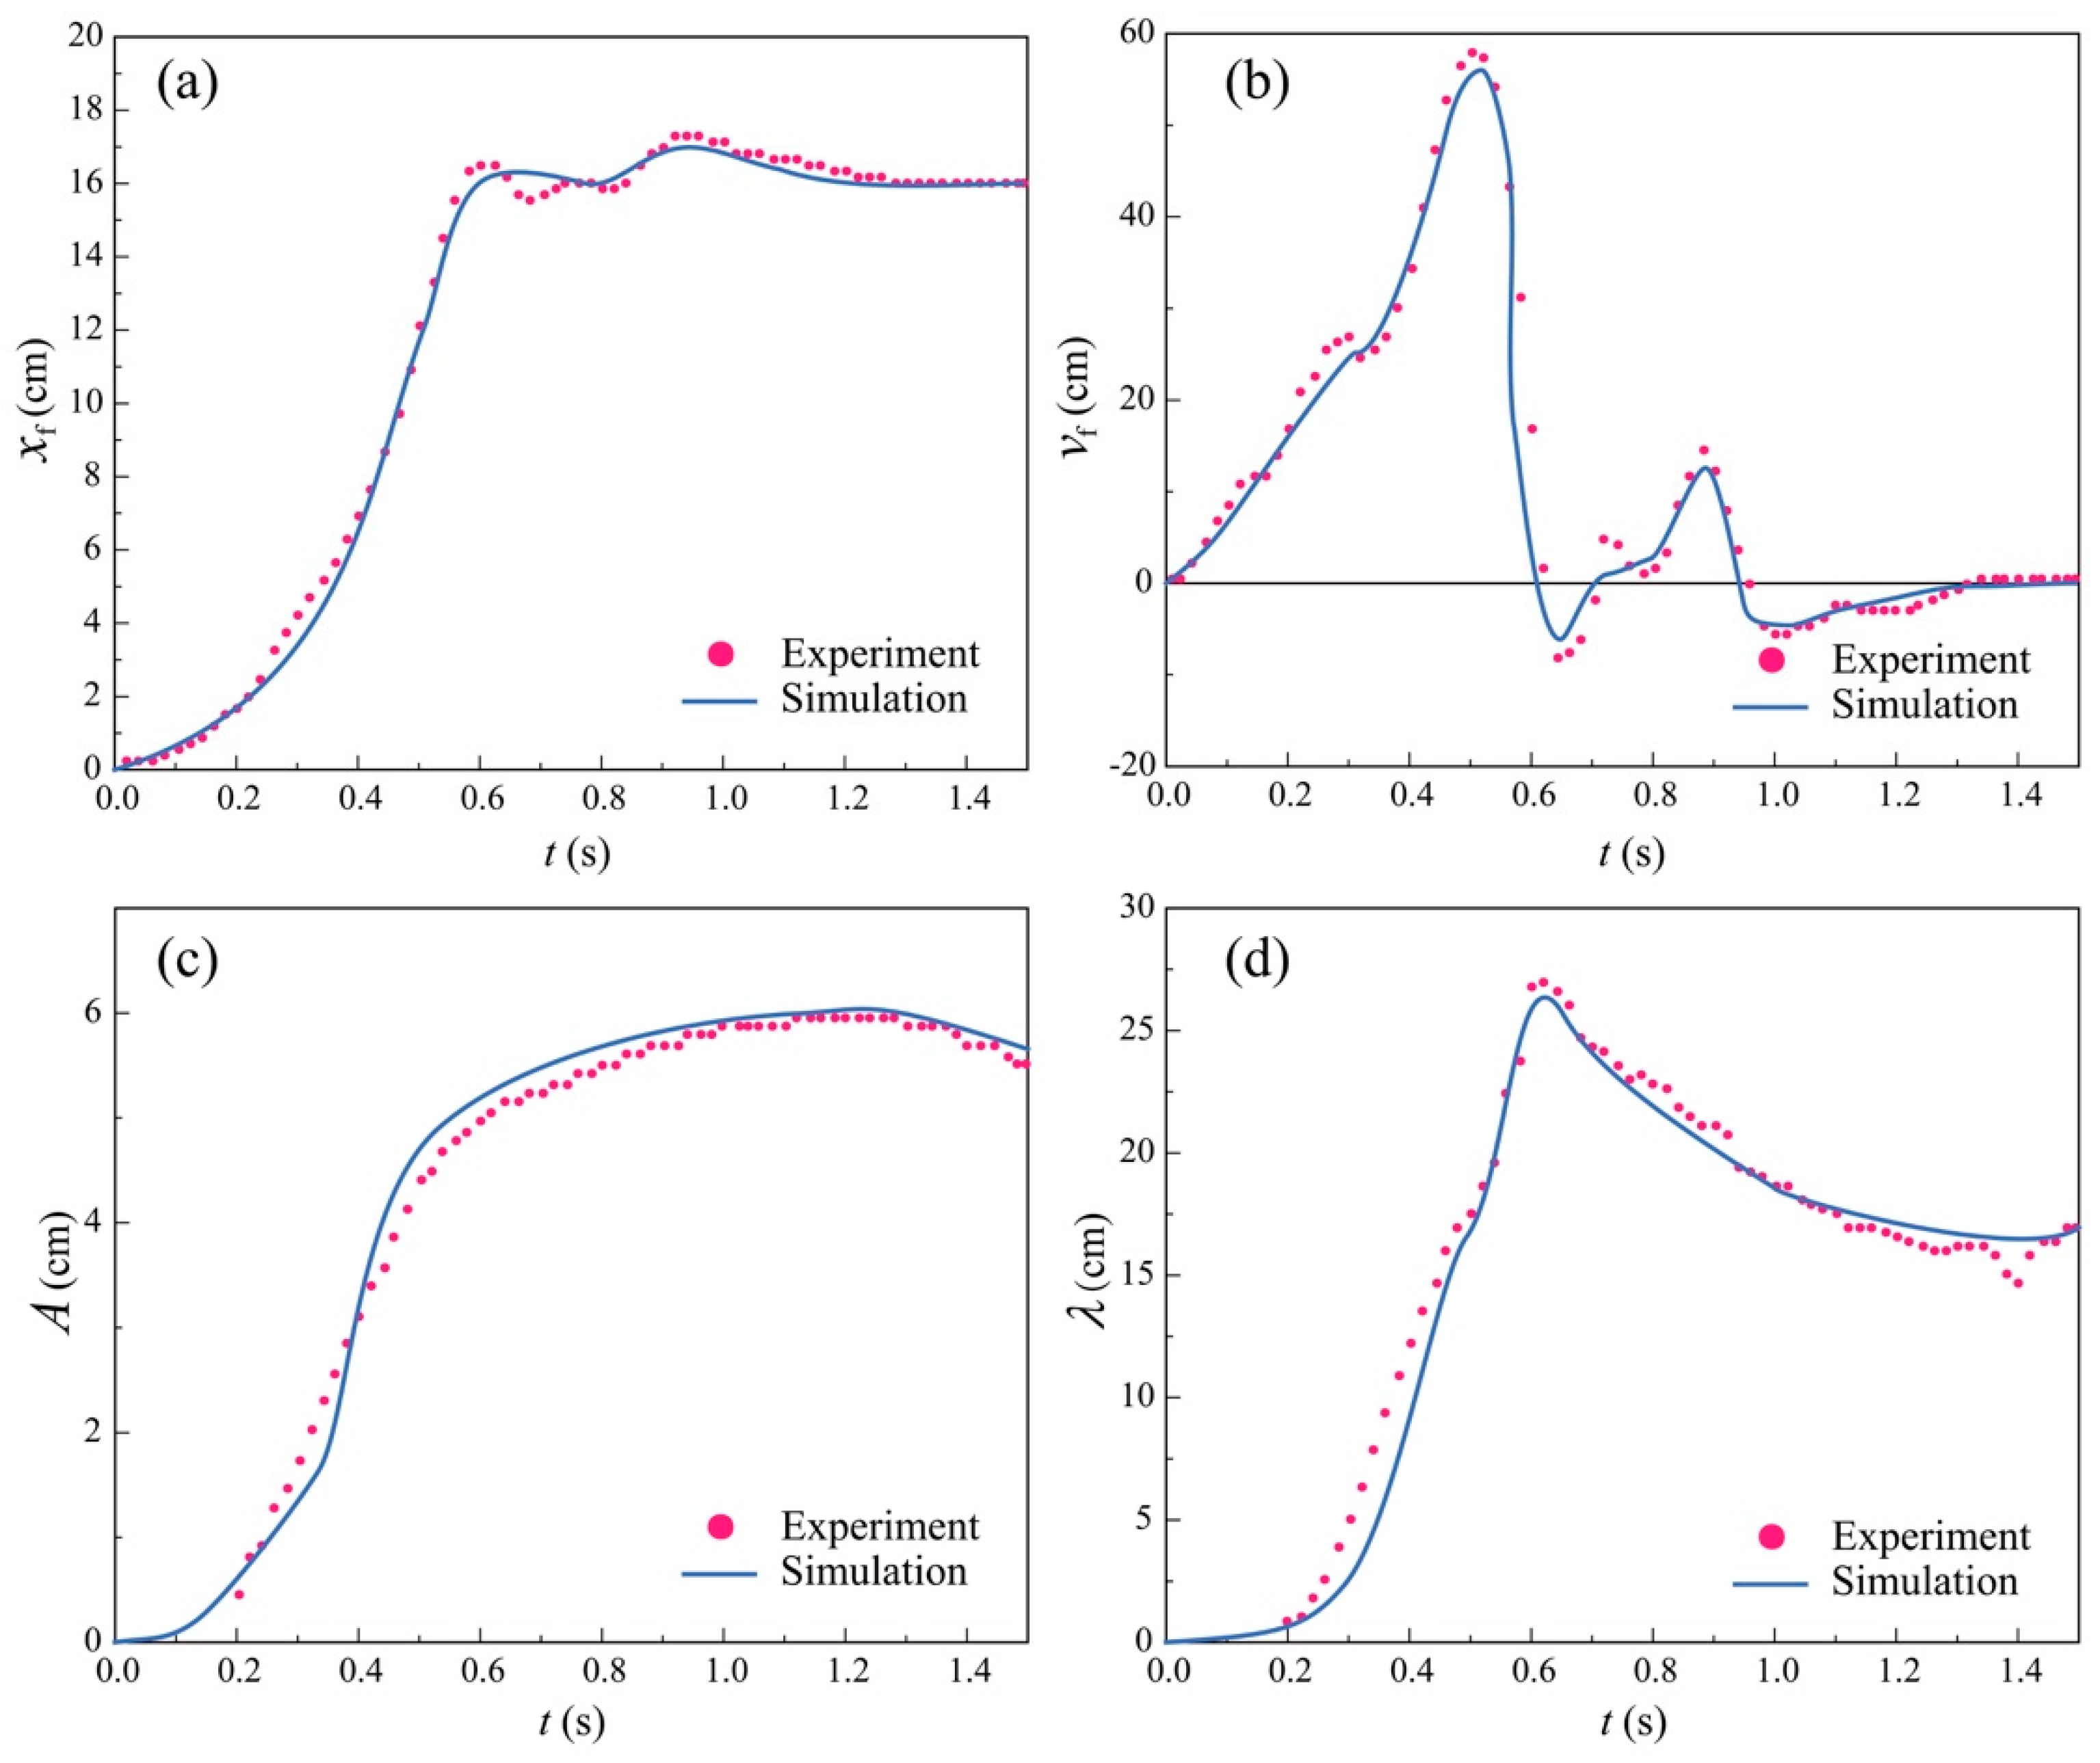
A quantitative comparison (see
Figure 3) further shows that the travel distance of the granular front matches the measurements, exhibiting three stages—rapid propagation, deceleration, and final stationary state—while the simulated surge amplitude is slightly higher. Moreover, the temporal evolution of the surge height is well captured, with the relative error within 5%.
2.6. Model Assumptions and Limitations
This numerical CFD-DEM framework adopts several simplified physical assumptions, which inevitably introduce limitations when extrapolating the simulation results to field-scale natural landslide disasters.
All particles are simplified as ideal smooth spheres in the present model. Natural slope deposits contain abundant angular gravel and irregular rock fragments; angular particles generate higher inter-particle friction and interlocking effects during sliding, which strengthen vertical particle segregation and restrain the overall sliding mobility compared with the spherical particles adopted in this work.
Inter-particle cohesive bonding forces are ignored in the contact model (Equations (3) and (4)). In real colluvial landslides, fine silt-and-clay matrices provide cementation and capillary cohesion between grains. The absence of cohesive force overestimates particle flowability and surge excitation capacity, especially for landslide masses rich in fine cohesive soil.
The entire numerical flume is constructed at laboratory scale, leading to obvious scale effects between the model and prototype natural reservoirs. The relative particle size ratio, channel boundary friction, and water depth scale cannot fully match field conditions. The nonlinear surge amplification effect captured in small-scale models may be weakened when scaled up to actual engineering scenarios.
Apart from the above three core simplifications, the model also neglects air entrainment and compressible flow during intense particle–water impact, and thus slightly underpredicts energy dissipation in the near-field wave generation zone. Readers should take these limitations into account when applying the quantitative laws obtained in this study to practical landslide tsunami hazard prediction.
Restricted by computing resources, this study does not set multiple repeated initial particle packing groups for each layered configuration, which will bring unavoidable random fluctuation to the particle vertical centroid index and deposition fitting results, especially fine particle groups with weak interlocking performance. We will carry out repeated simulation sensitivity analysis on typical Case 1 and Case 2 in follow-up research.
3. Analysis
3.1. Model Setup
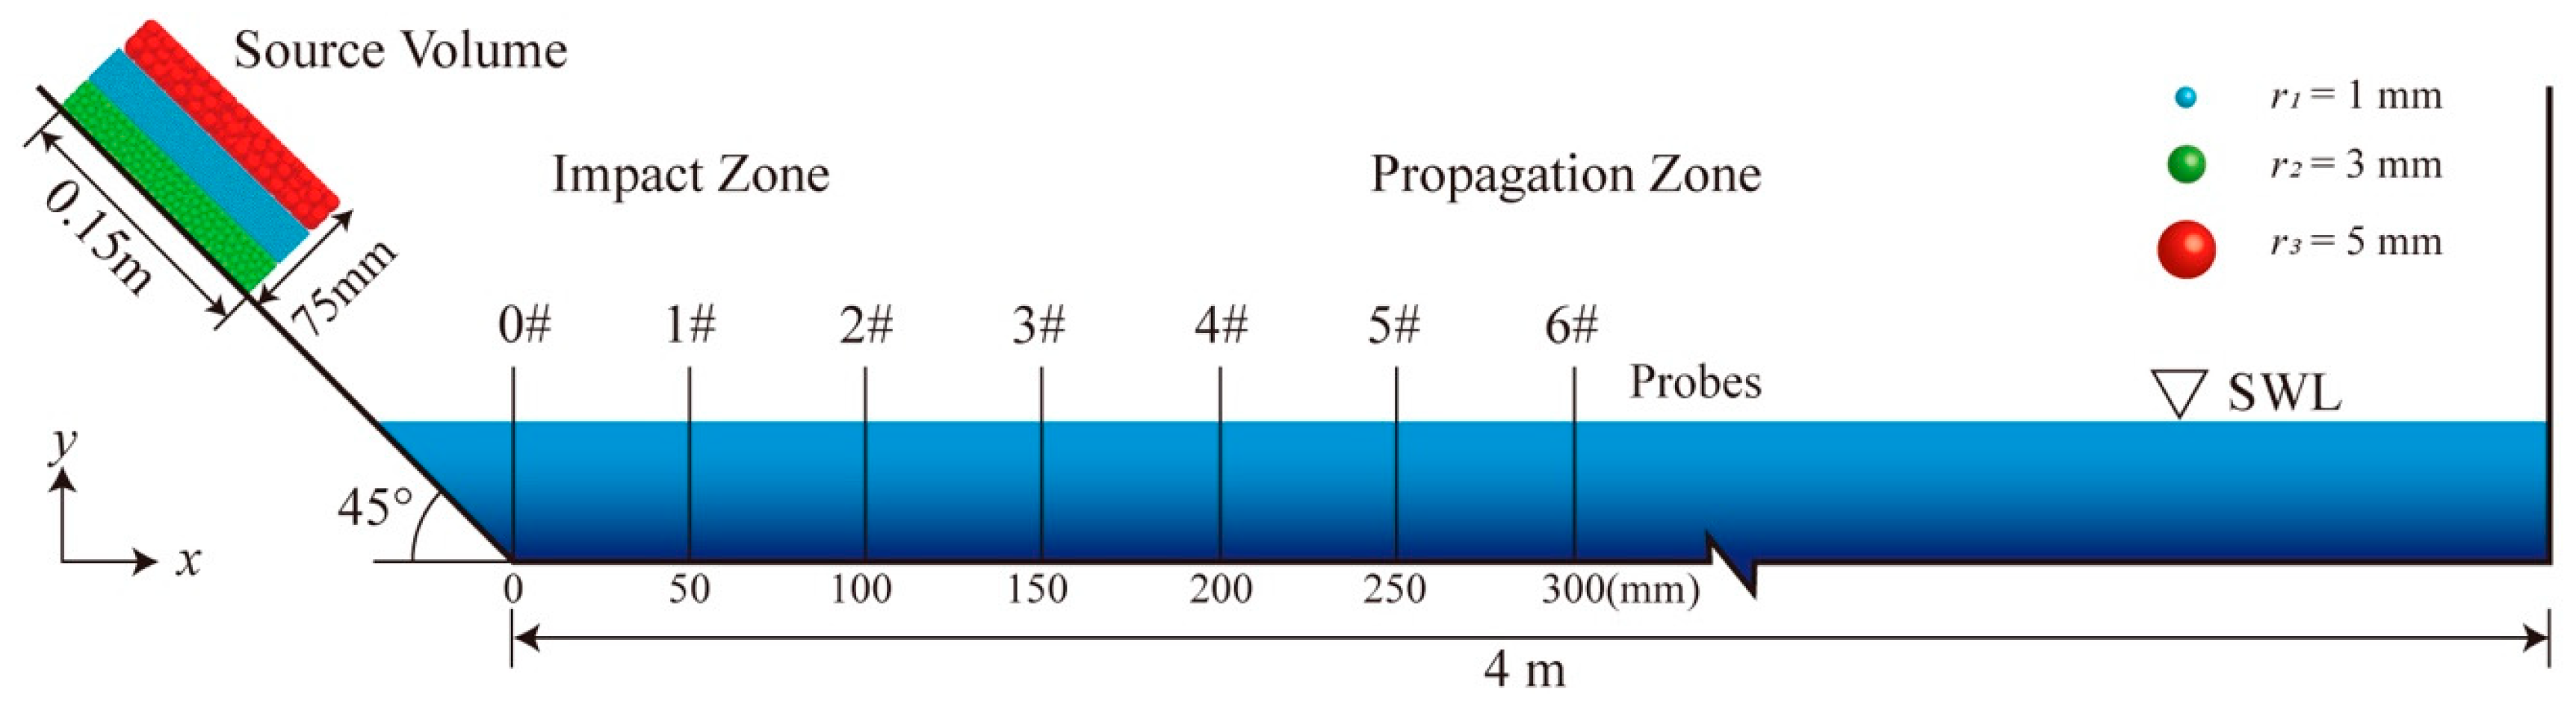
The numerical model measures 4.4 m (length) × 0.1 m (width) × 0.4 m (height). The landslide trigger is positioned 0.3 m above the channel bed, with dimensions of 0.15 m × 0.1 m × 0.75 m. The initial landslide body, approximated as a rectangular cuboid, is located 0.3 m above the channel bed and has dimensions of 0.15 m × 0.1 m × 0.75 m. The model length is chosen to capture the entire physical process from landslide initiation to surge propagation, while the narrow width focuses computational resources on the primary propagation direction while retaining three-dimensional flow features. The detailed configuration is shown in
Figure 4.
The computational domain is discretized with a structured hexahedral grid of 3 mm and lateral boundaries are set as no-slip walls, and the top boundary is an atmospheric pressure outlet. The landslide mass consists of three layers with particle radii
r of 1, 3, and 5 mm, designed to represent the grain-size heterogeneity of natural landslide materials and its influence on surge generation. At
t = 0 s, the granular mass begins to move down the slope under its own weight (see
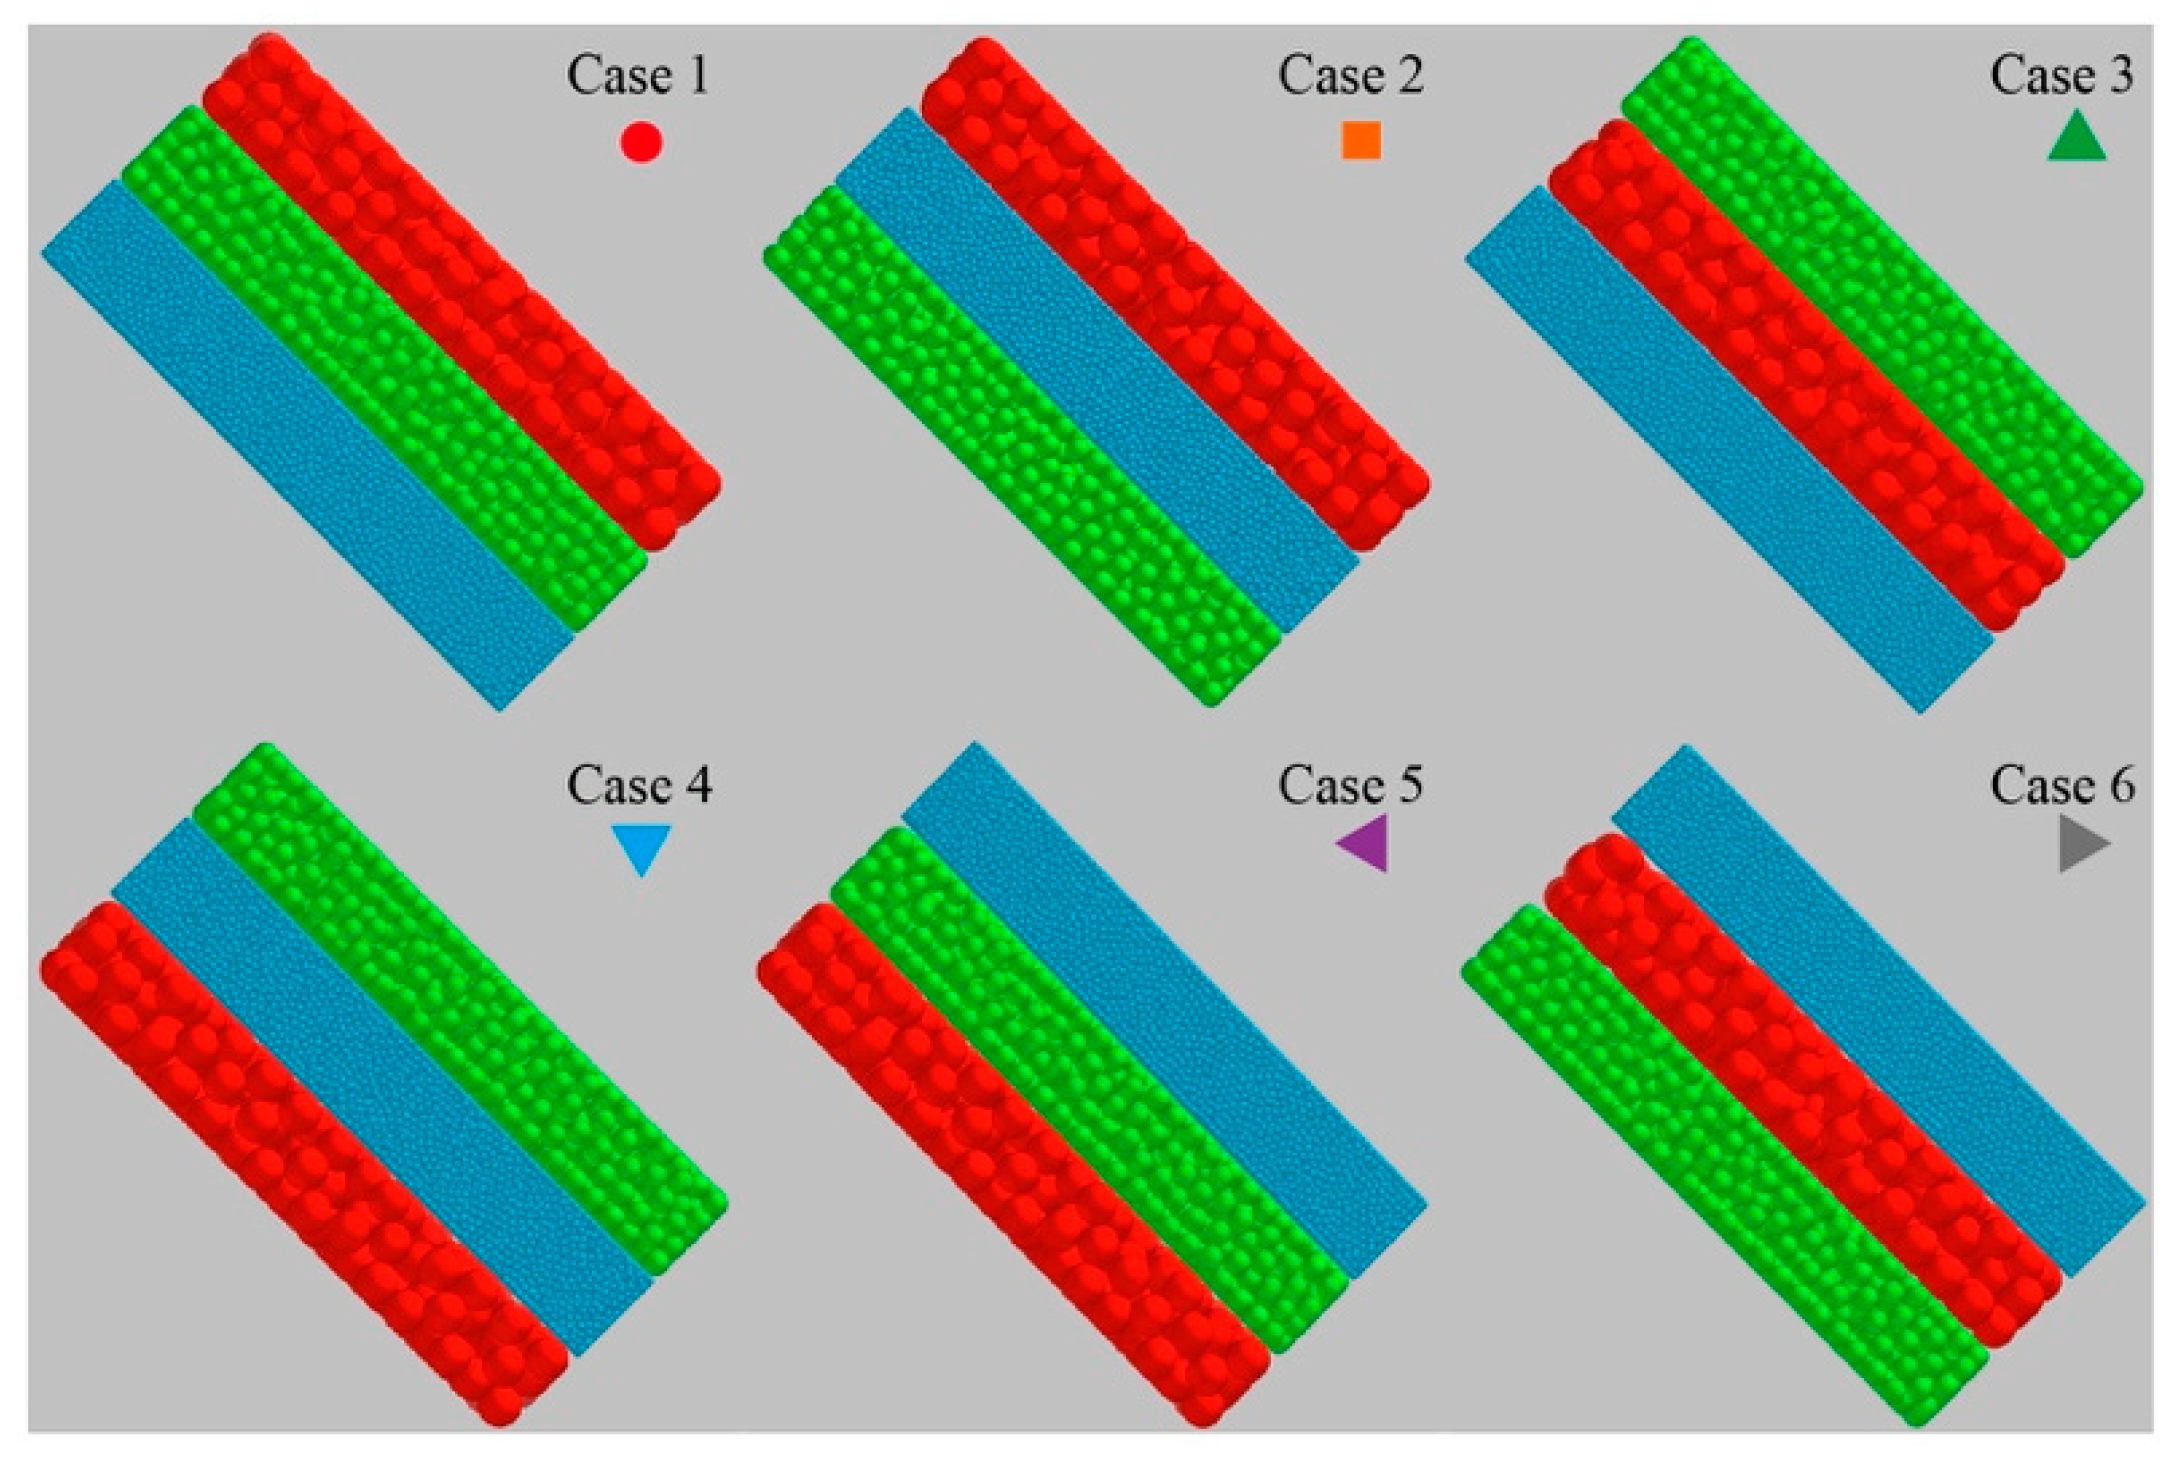
Table 3). Spherical particles with radii of 1, 3, and 5 mm are used, with all other properties identical. Each size is placed in one of three slope regions, and permuting the sizes yields six initial configurations (see
Figure 5). Three still-water depths (50, 75, and 100 mm) and a dry case are considered, resulting in 24 simulation cases.
The particle radii of 1 mm, 3 mm, and 5 mm adopted in this study correspond to fine silty particles, medium sand, and coarse gravel widely distributed in natural colluvial slope deposits, respectively. Natural slope sediments undergo long-term weathering, erosion, and gravity deposition, and commonly form distinct vertical layered grading structures rather than fully random homogeneous mixtures. The six complete permutation schemes of three grain sizes cover all typical vertical stacking modes including coarse-top fine-bottom, fine-top coarse-bottom, and interbedded grading configurations, which reproduce the primary layered structures of natural landslide mass. This full permutation design avoids the oversimplified single-layer or random mixed particle setup adopted in most previous CFD-DEM landslide simulations, and enables quantitative comparison of the exclusive influence of initial vertical stratification on granular motion and surge generation. This study adopts one fixed initial particle packing configuration for each layered permutation case without multiple repeated simulations to quantify random packing noise. The six layered permutation schemes show consistent segregation and surge evolution trends, which indicates vertical stacking order is the primary control factor (
Table 4). However, each case only adopts one fixed initial particle packing without multiple repeated parallel simulations, so random disturbance caused by different initial arrangements cannot be completely eliminated. This random noise is the core reason for the scattered fitting data
R2 ≈ 0.52 of the 1 mm fine particle group in Figure 12.
The distinct shear modulus values between validation and production cases stem from numerical softening for efficient computation. Standard elastic parameters are applied to the validation run to reproduce experimental granular motion accurately, while a lower shear modulus is adopted for all layered simulation groups to extend the allowable DEM timestep. Parametric trial calculations demonstrate that this softening treatment barely affects macroscopic grain segregation and surge characteristics.
Table 4.
Permutation of different grain radius size parameters in different operation scenarios (unit: mm).
Table 4.
Permutation of different grain radius size parameters in different operation scenarios (unit: mm).
| Scenarios | Upper | Middle | Lower | h0 | Symbols |
|---|
| Case 1 | 5 | 3 | 1 | 0, 50, 75, 100 | ● |
| Case 2 | 5 | 1 | 3 | ■ |
| Case 3 | 3 | 5 | 1 | ▲ |
| Case 4 | 3 | 1 | 5 | ▼ |
| Case 5 | 1 | 3 | 5 | ◀ |
| Case 6 | 1 | 5 | 3 | ▶ |
3.2. Mesh Independence Verification
Mesh independence analysis is essential to exclude grid resolution effects on simulated surge morphology and particle migration. Prior to formal case calculation, multiple grid sizes were trialed for the validation test case to determine a proper mesh scale.
The mesh dimension is constrained by the minimum particle diameter following the porosity correction approach proposed by Wu et al. (2018) [
33]. To avoid unphysical voidage distortion and numerical divergence, the horizontal and vertical mesh size is set to be at least three times larger than the maximum particle radius used in the simulation.
A preliminary grid comparison confirmed that further mesh refinement generates negligible differences in surge amplitude and granular front position. Therefore, a uniform structured hexahedral mesh of 3 mm was adopted for all computational domains in this study to balance computational efficiency and numerical accuracy.
3.3. Assessment of Particle Segregation
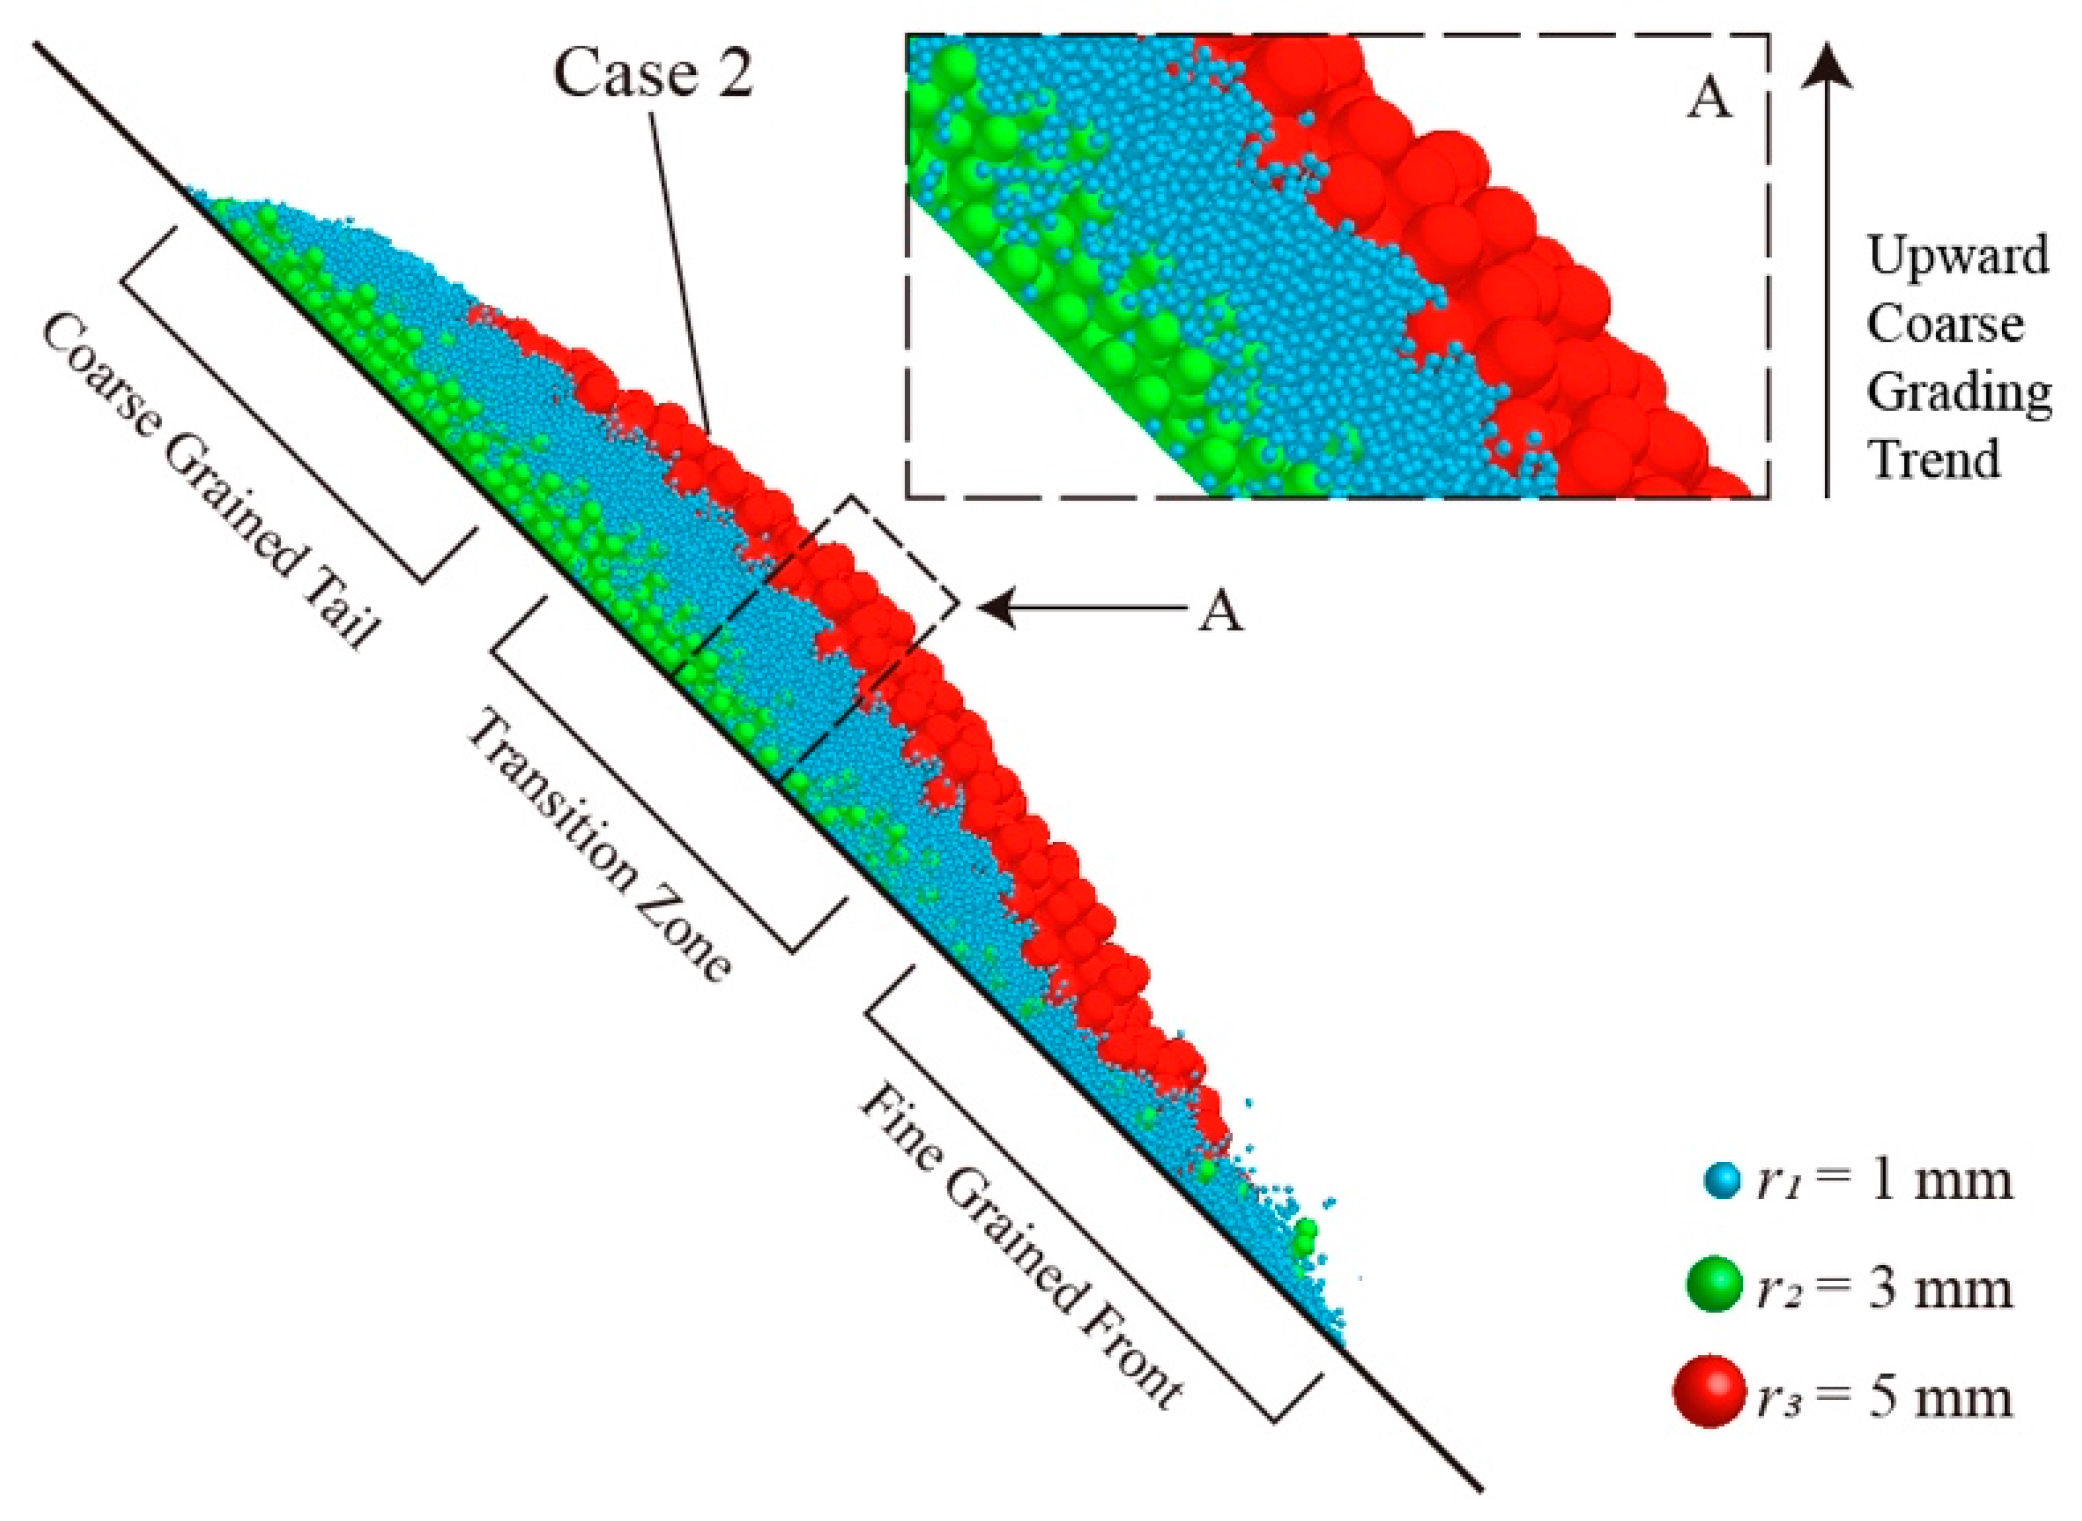
Particle segregation is a common phenomenon in the flow of mixed-size granular materials. It manifests as the preferential sorting of particles of different sizes in both the longitudinal and vertical directions during motion. A typical grading pattern resulting from this process is shown in
Figure 6. The flow structure of a granular landslide can be divided into three distinct zones: the elongated front zone, primarily composed of coarse particles and exhibiting the highest mobility; the intermediate transition zone, characterized by pronounced longitudinal particle size segregation; and the tail zone, dominated by fine particles, where particle transport is constrained, mobility is the lowest, and segregation is least evident.
During the flow of a granular landslide, influenced by the initial arrangement of particle sizes, segregation occurs simultaneously in both the longitudinal and vertical directions as particles sort according to their respective sizes. Taking the particle trajectories of different sizes in Case 2 of
Figure 6 as an example, along the primary flow direction of the landslide, larger particles tend to migrate toward and accumulate at the front, whereas finer particles tend to sink to the base and lag behind in the tail region.
To quantitatively analyze the formation process of the reverse grading structure within the landslide mass under the influence of particle segregation, this study focuses on the evolution of the spatial distribution of particle groups in the direction perpendicular to the flume (i.e., the vertical direction). For this purpose, the following quantitative indices characterizing the vertical distribution of particle groups is introduced, expressed as Equation (16):
where
Hi (i = 1, 2, 3) is the average centroid height (measured from the flume bed) of particles in different size groups,
hj is the vertical height of the j particle within a group, and
n is the total number of particles in that size group.
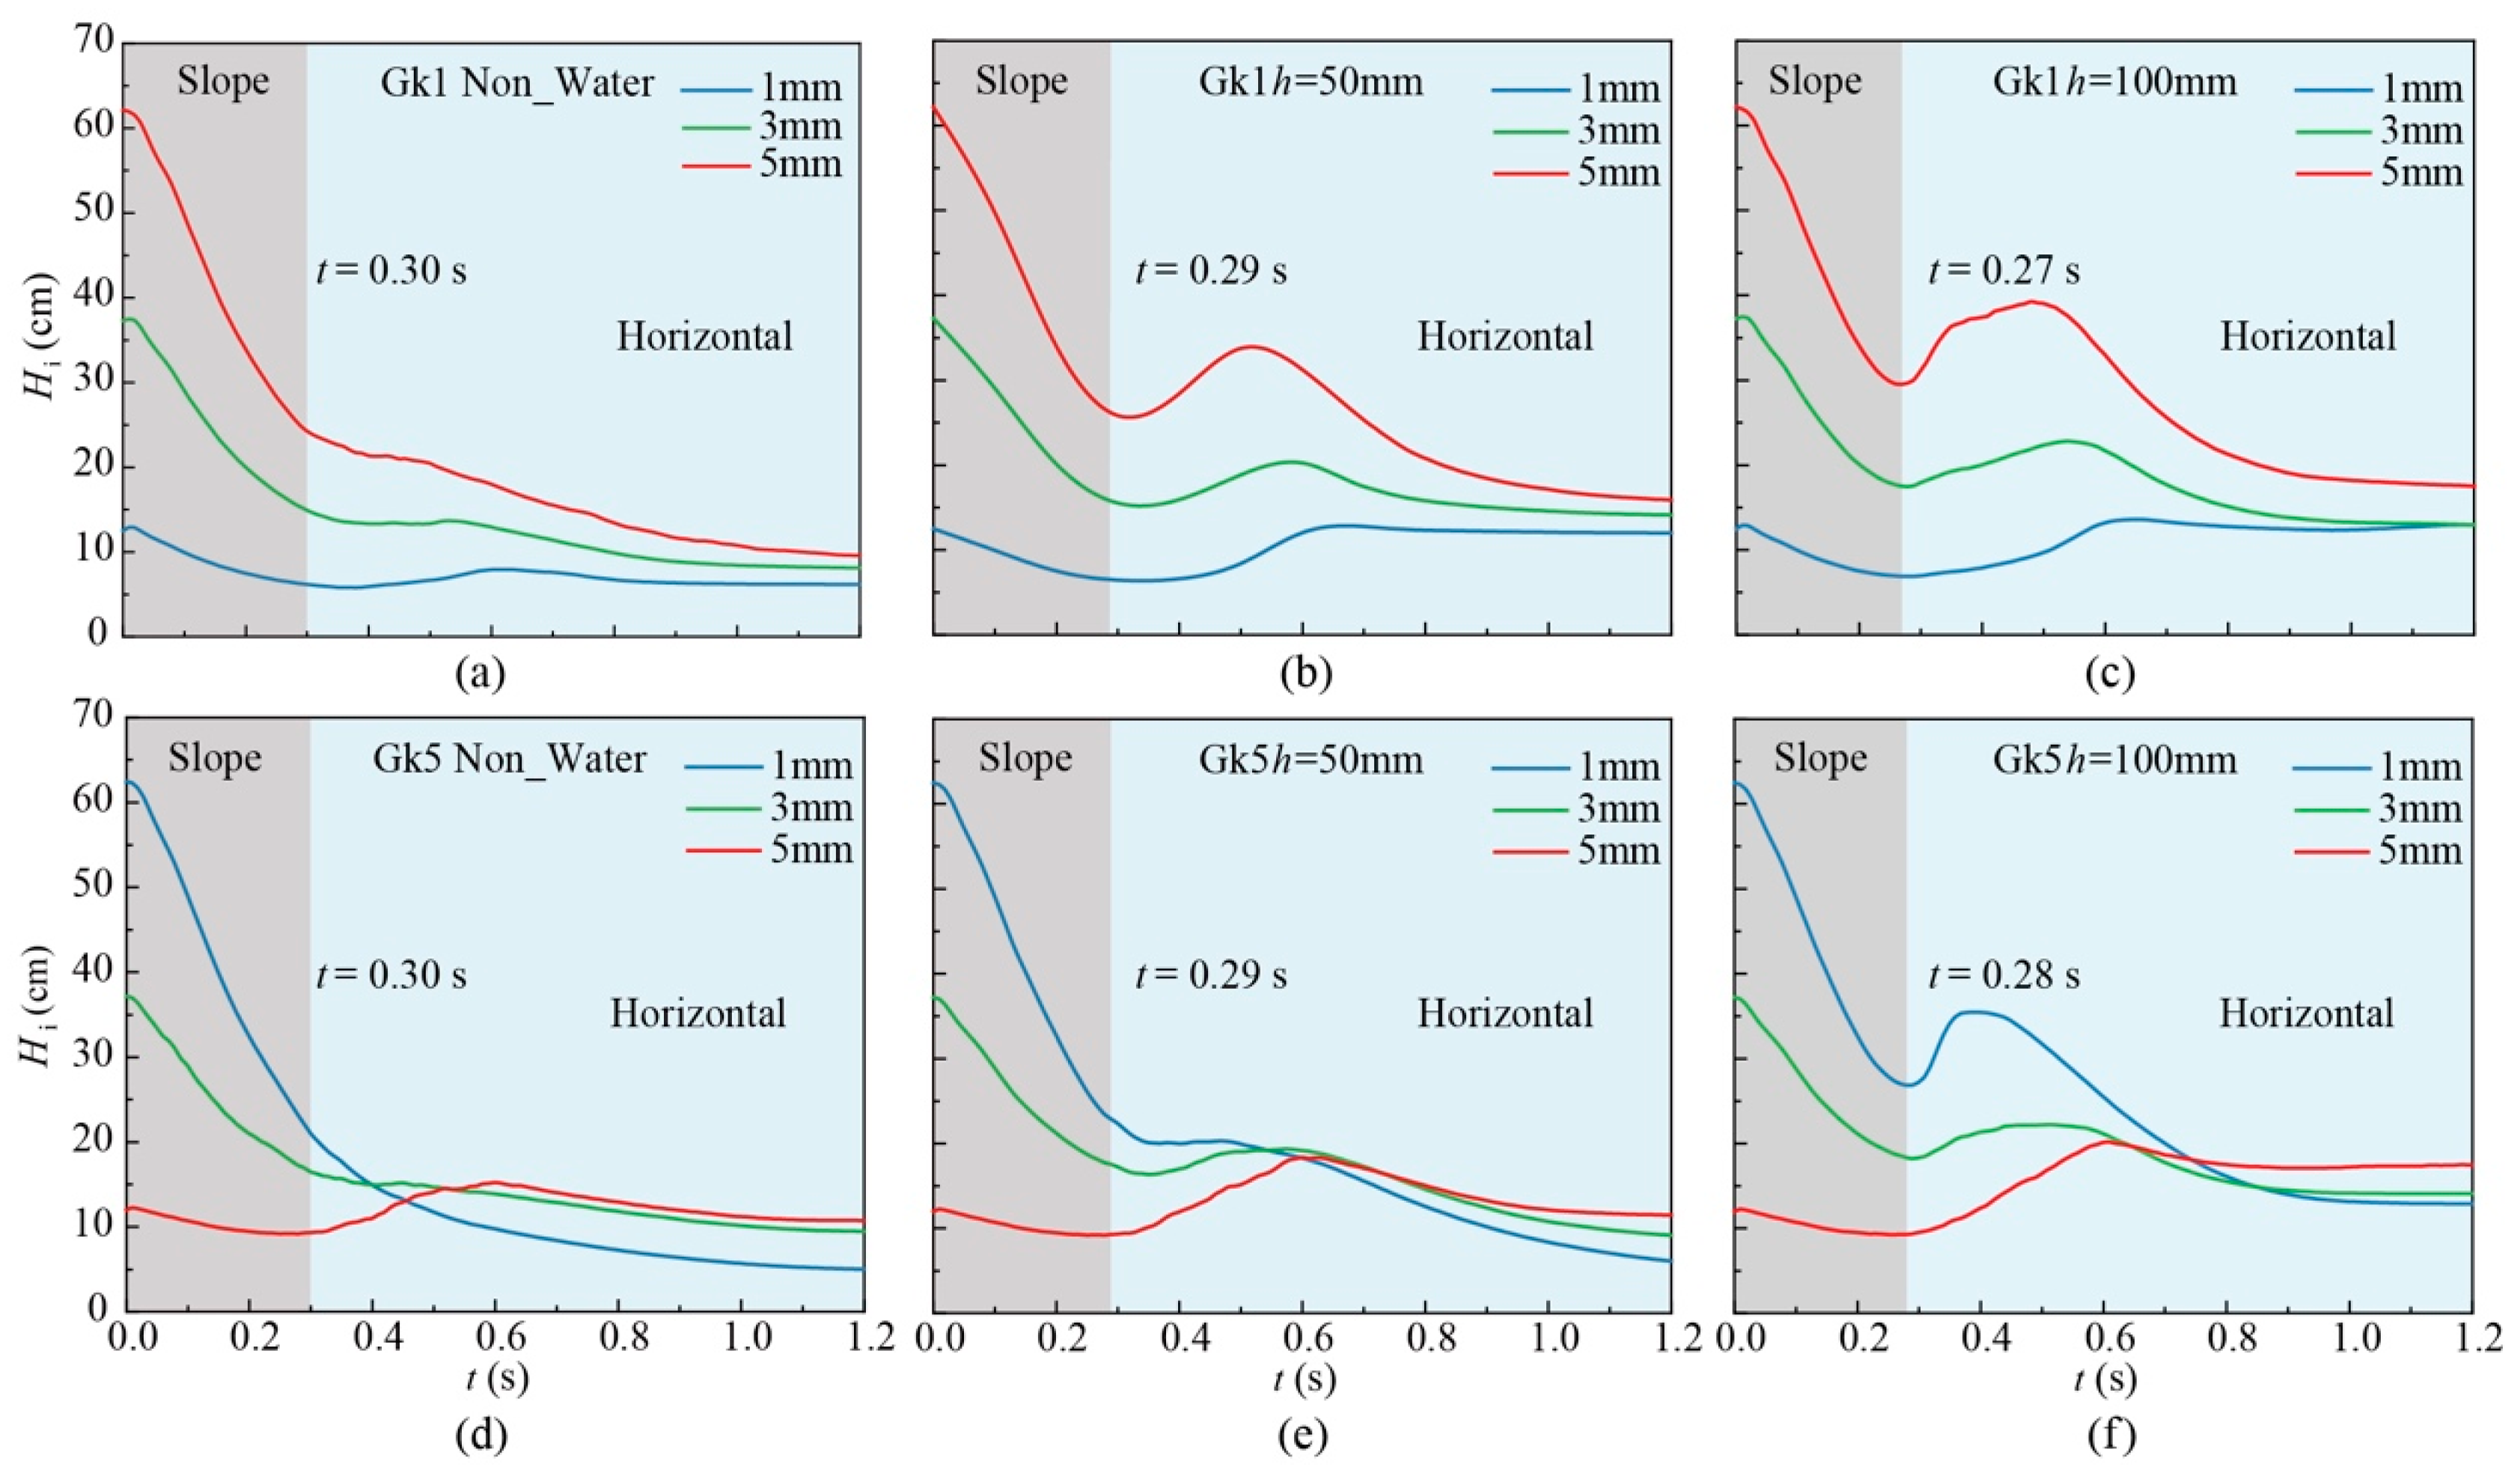
The vertical centroid height index Hi defined in Equation (16) acts as the core quantitative statistic for evaluating the segregation intensity of each grain group. The continuous time-series curves of Hi (see Figure 8) quantify the vertical migration amplitude of fine, medium, and coarse particles throughout the entire sliding process, which converts the visual qualitative zoning descriptions of granular layers into continuous, computable, segregation evolution data. The variation range of Hi can directly reflect the degree of size separation: a larger difference in Hi values among three particle groups indicates stronger vertical segregation induced by gravity and fluid drag.
3.4. Transport Analysis of the Landslide
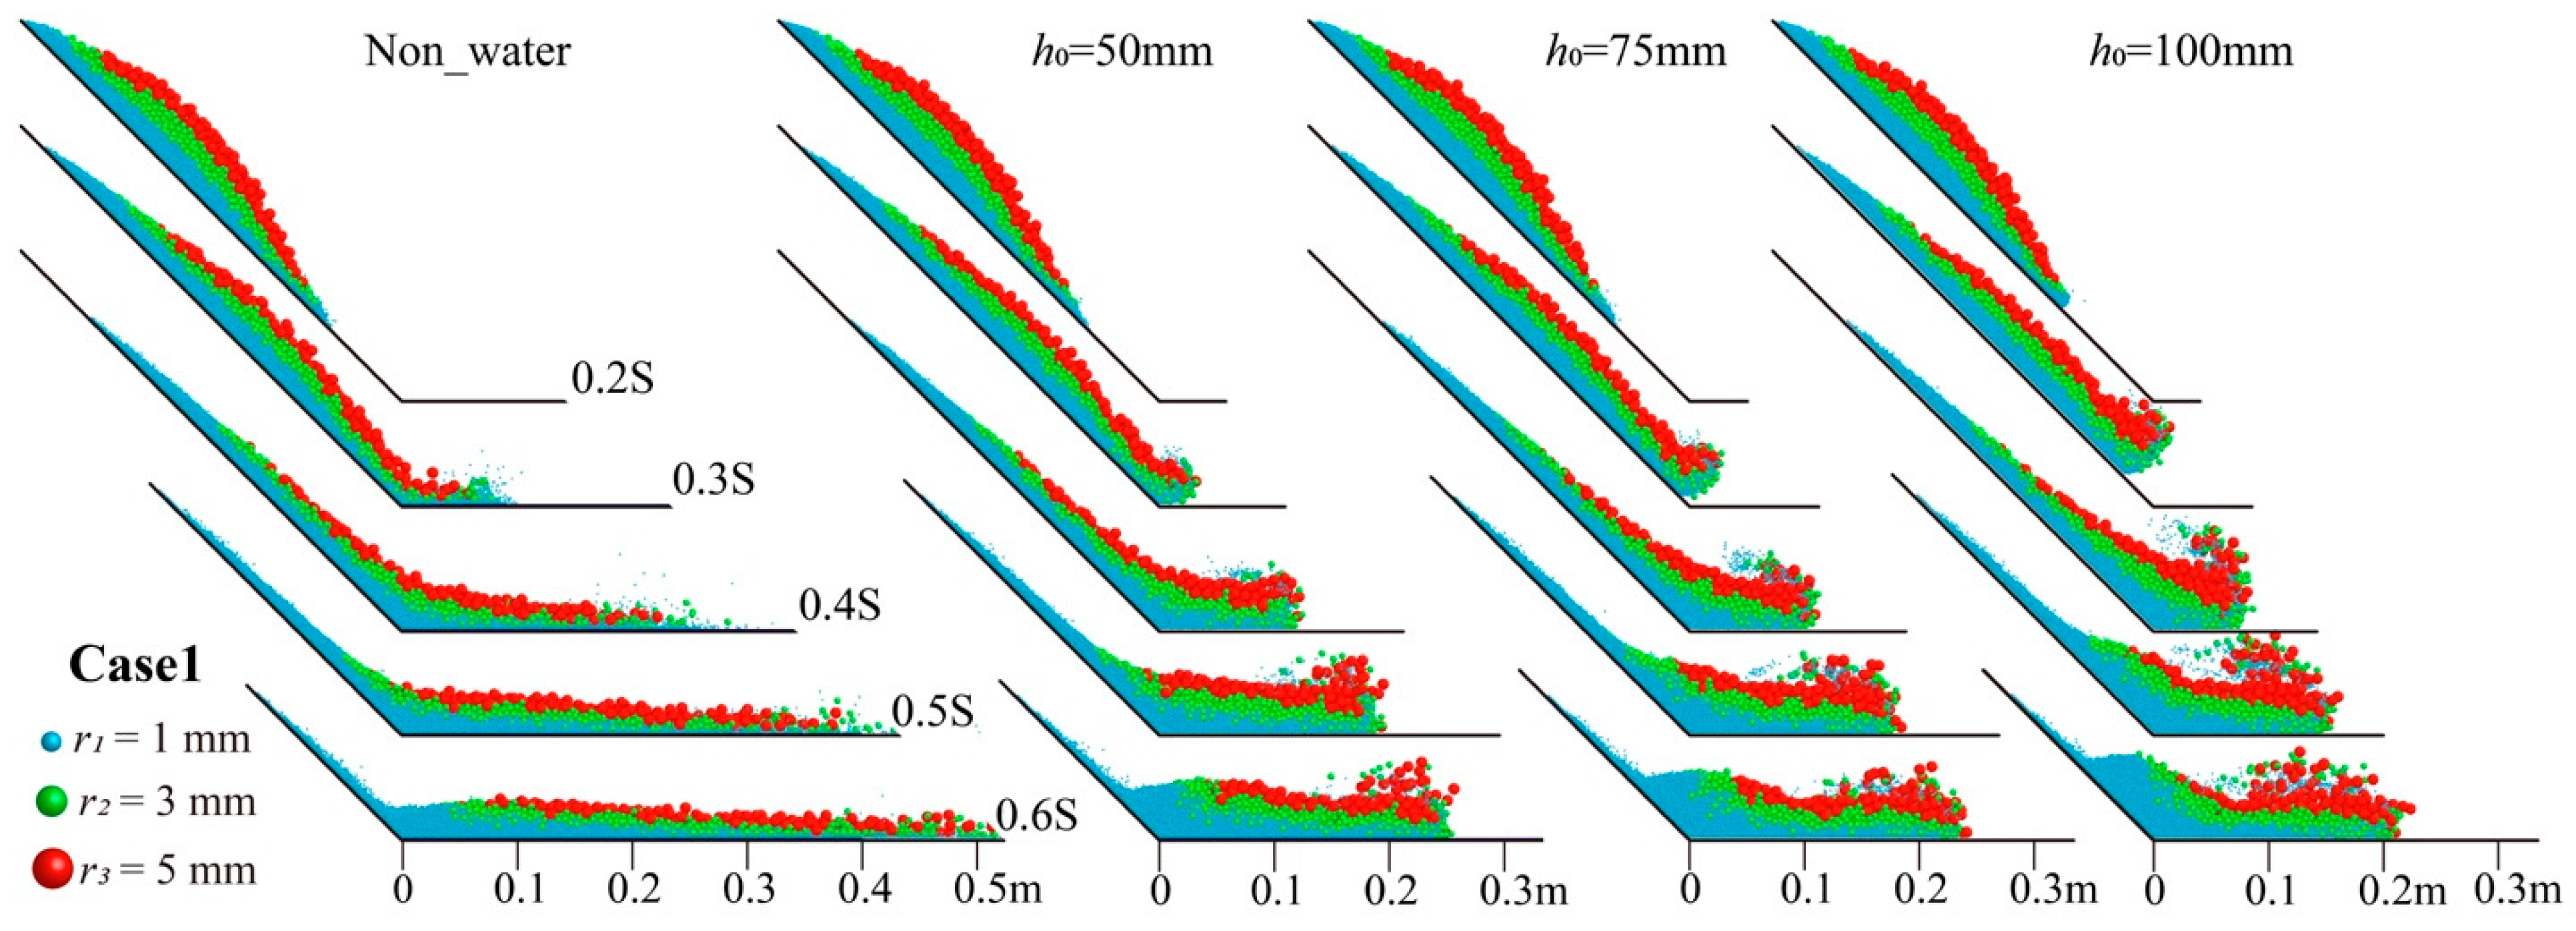
The computational results show that, under different particle size distributions, the initial still-water depth is a key factor governing both the motion pattern and the final deposition morphology of the landslide mass. Case 1 is taken as an example. The evolution of different-sized particles over 0.6 s is presented in
Figure 7. A comparison among the dry case and the three water depths (
h0 = 50, 75, and 100 mm) reveals that the influence of the fluid environment on granular motion becomes progressively more pronounced with increasing depth. In the dry condition, particles slide along the slope and deposit in situ; in water, hydrodynamic forces governed by the drag force model (Equation (11)) sort the particles horizontally and dictate their final distribution. The resulting deposit, extending from the slope toe along the motion direction, exhibits a clear horizontal size zonation: fine particles are retained at the rear, medium-sized particles are distributed in the middle, and coarse particles are transported by the leading surge and deposited at the forefront. This typical reverse-grading structure provides direct evidence that hydrodynamic forces dominate the final deposit morphology.
To clarify the motion and deposition of different-sized particles, two extreme initial arrangements are examined: normal grading (Case 1) and reverse grading (Case 5). The temporal evolution of the vertical distribution for these cases over 1.2 s under varying still-water depths is presented in
Figure 8, with the vertical distribution index
Hi. In
Figure 8, the gray-shaded region marks the initial sliding phase before the mass contacts the channel bed or water, whereas the blue-shaded region indicates the subsequent phase of horizontal size segregation after water entry. Two consistent patterns emerge: regardless of the initial arrangement, coarser particles always tend to occupy the upper layer; moreover, the presence of water not only induces local uplift of the landslide mass but also causes a systematic increase in the final vertical characteristic indices
Hi for all size groups as the initial water depth increases, indicating that the surface particle groups are lifted significantly higher by the fluid.
Figure 8.
Location–time curves of vertical distribution.
Figure 8.
Location–time curves of vertical distribution.
Taking
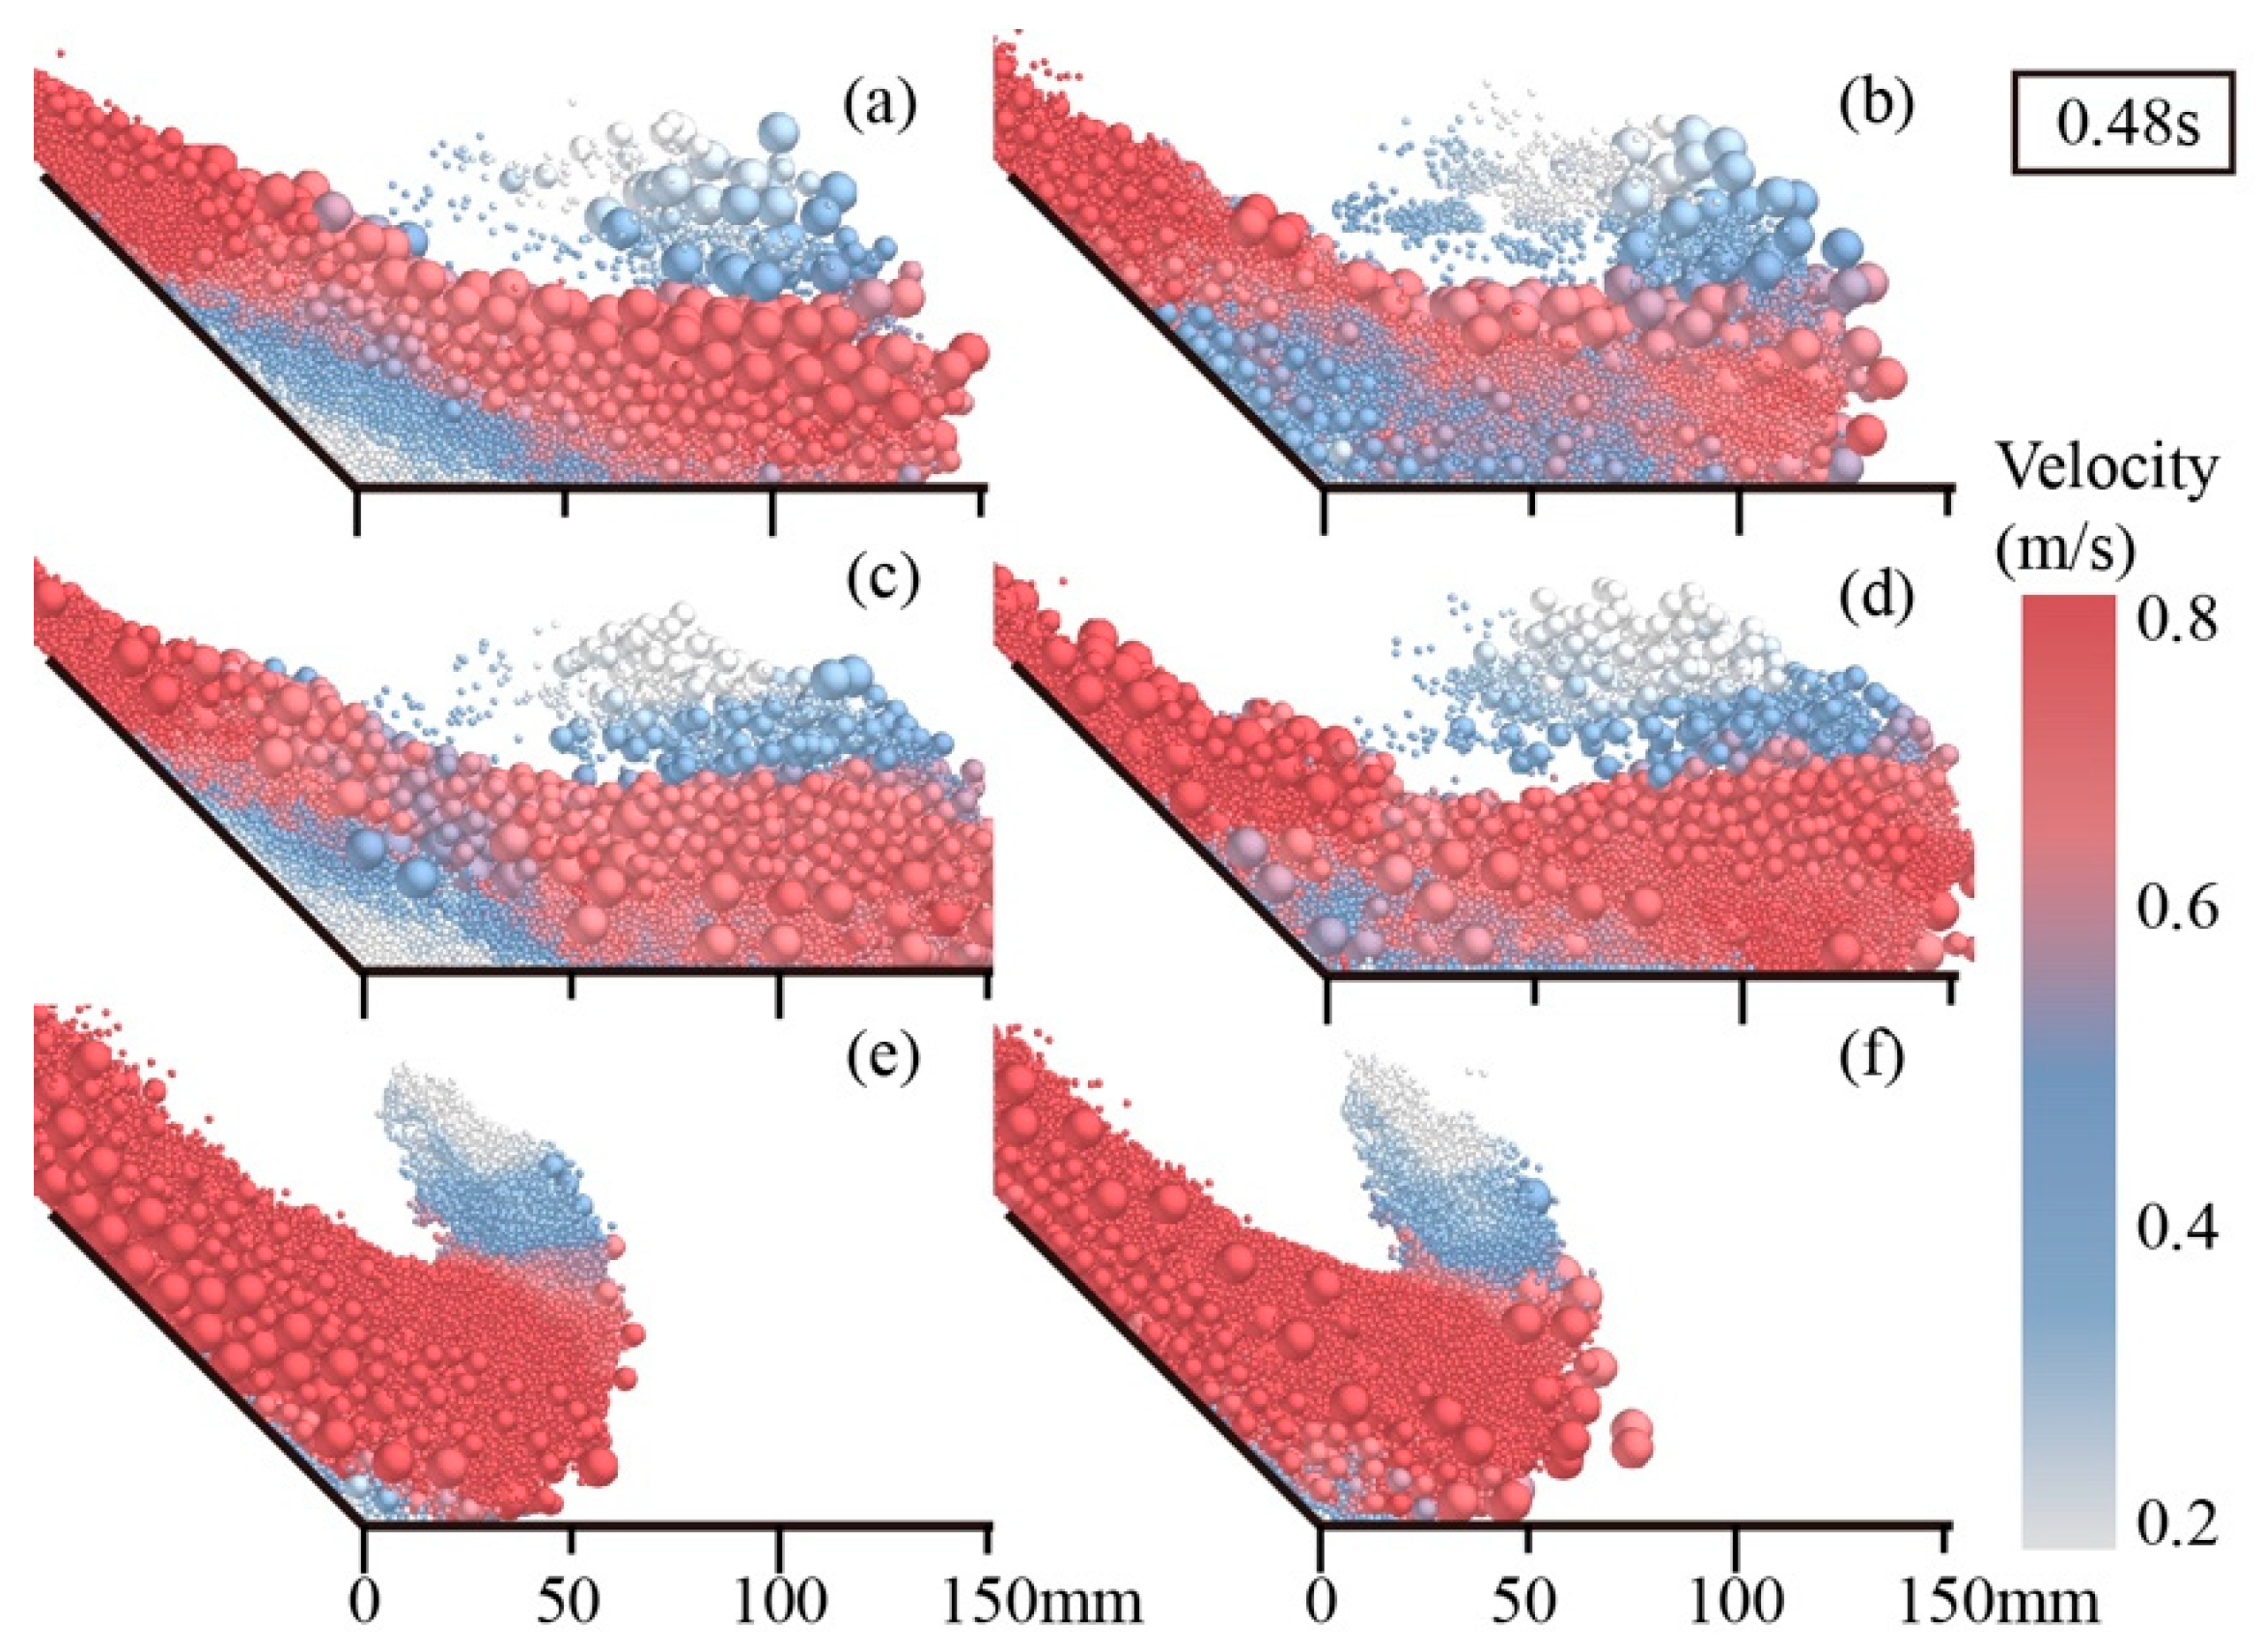
h0 = 100 mm as an example, the maximum lift height of surface particles occurs consistently at ∼0.48 s across all six initial arrangements, confirming that surface-particle lifting is dominated by fluid impact rather than the initial arrangement. To examine the internal kinematics at this critical instant,
Figure 9 presents velocity field contours for each case (subplots a–f corresponding to Cases 1–6). Based on the dominant surface particle size, the six cases can be grouped into three categories.
Large-particle surface group (Cases 1~2, 5 mm): In this group, the high-velocity zone is concentrated in a narrow mid-section, while the slope toe region remains at medium to low velocity; owing to their inertia, large surface particles are lifted less upon water impact. Medium-particle surface group (Cases 3–4, 3 mm): This group shows the most extensive high-velocity region and the longest travel distance, indicating the most efficient kinetic energy transfer. Small-particle surface group (Cases 5–6, 1 mm): In this group, the surface particle ejection is most fully developed, yet the overall travel distance is the shortest; although the mass maintains a high-velocity state, fine surface particles most strongly constrain the overall mobility.
In summary, the particle size at the landslide front surface is a key factor governing overall mobility. The medium-particle surface group achieves the longest travel distance through efficient fluid–particle coupling, while energy dissipation in the large-particle group and mobility restriction in the small-particle group both limit the travel distance.
4. Results
4.1. Characteristics of Landslide Deposition
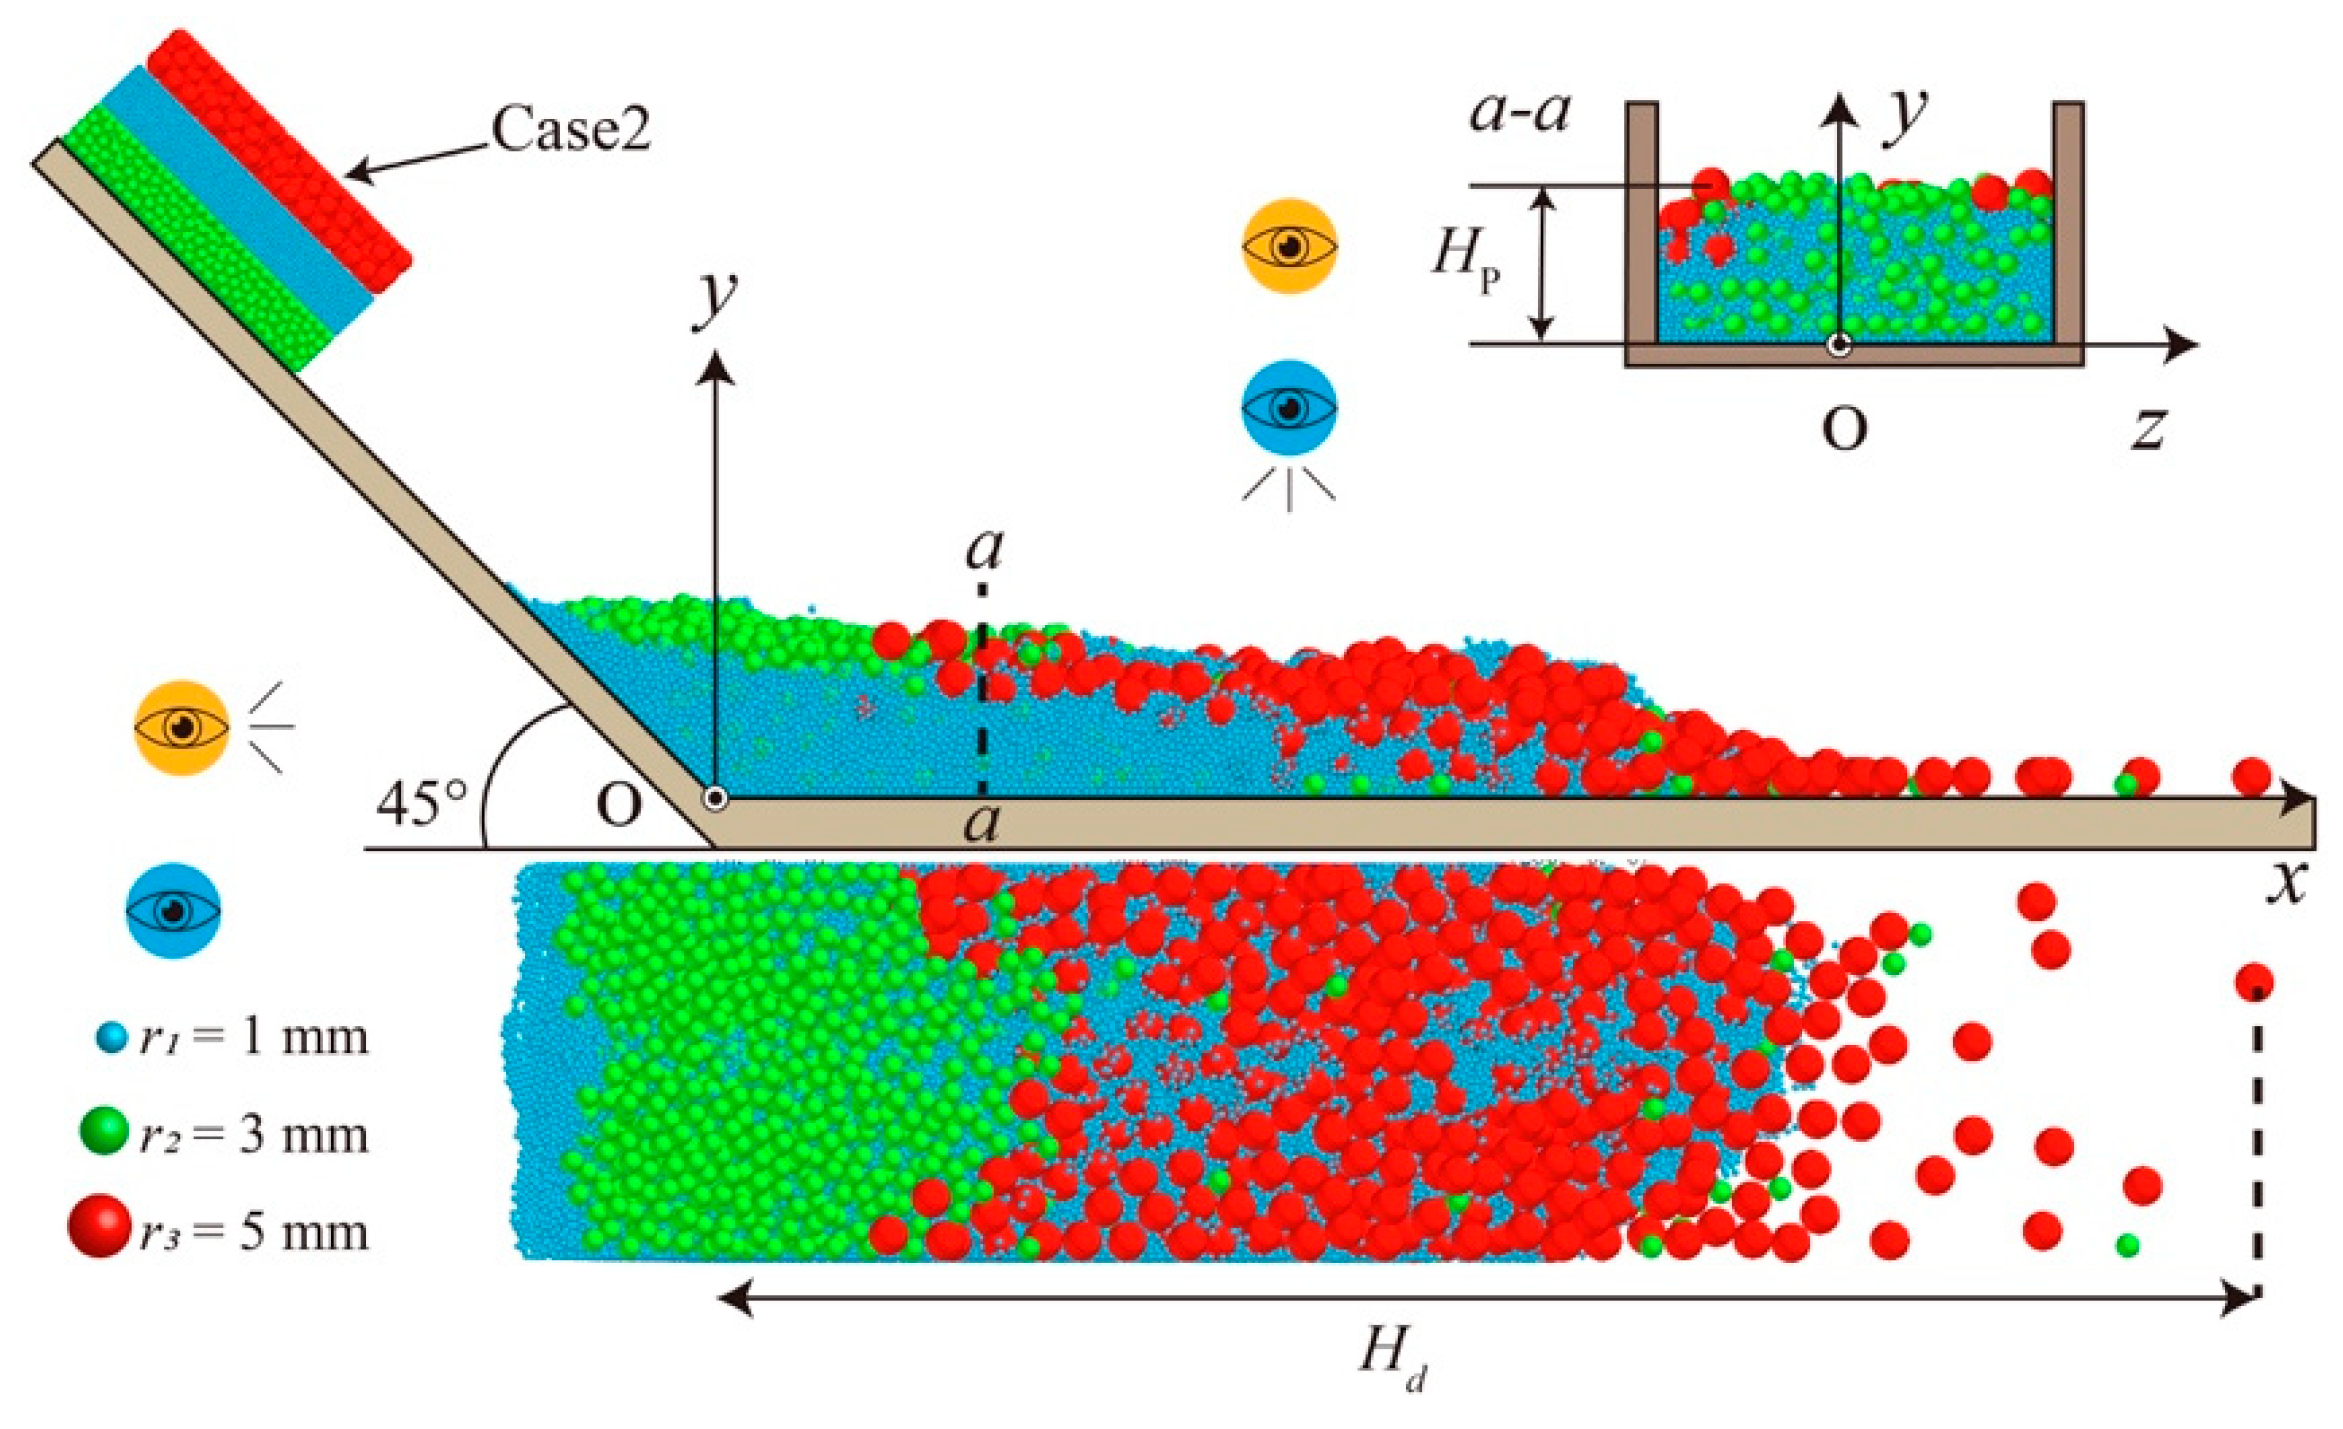
The final deposition morphology is directly governed by landslide mobility, which is closely related to the initial particle arrangement. To quantify the deposit, two geometric parameters are introduced (see
Figure 10): the deposition height
Hp is the maximum vertical accumulation thickness of each size group, and the deposition length
Hd is the maximum horizontal travel distance of each size group.
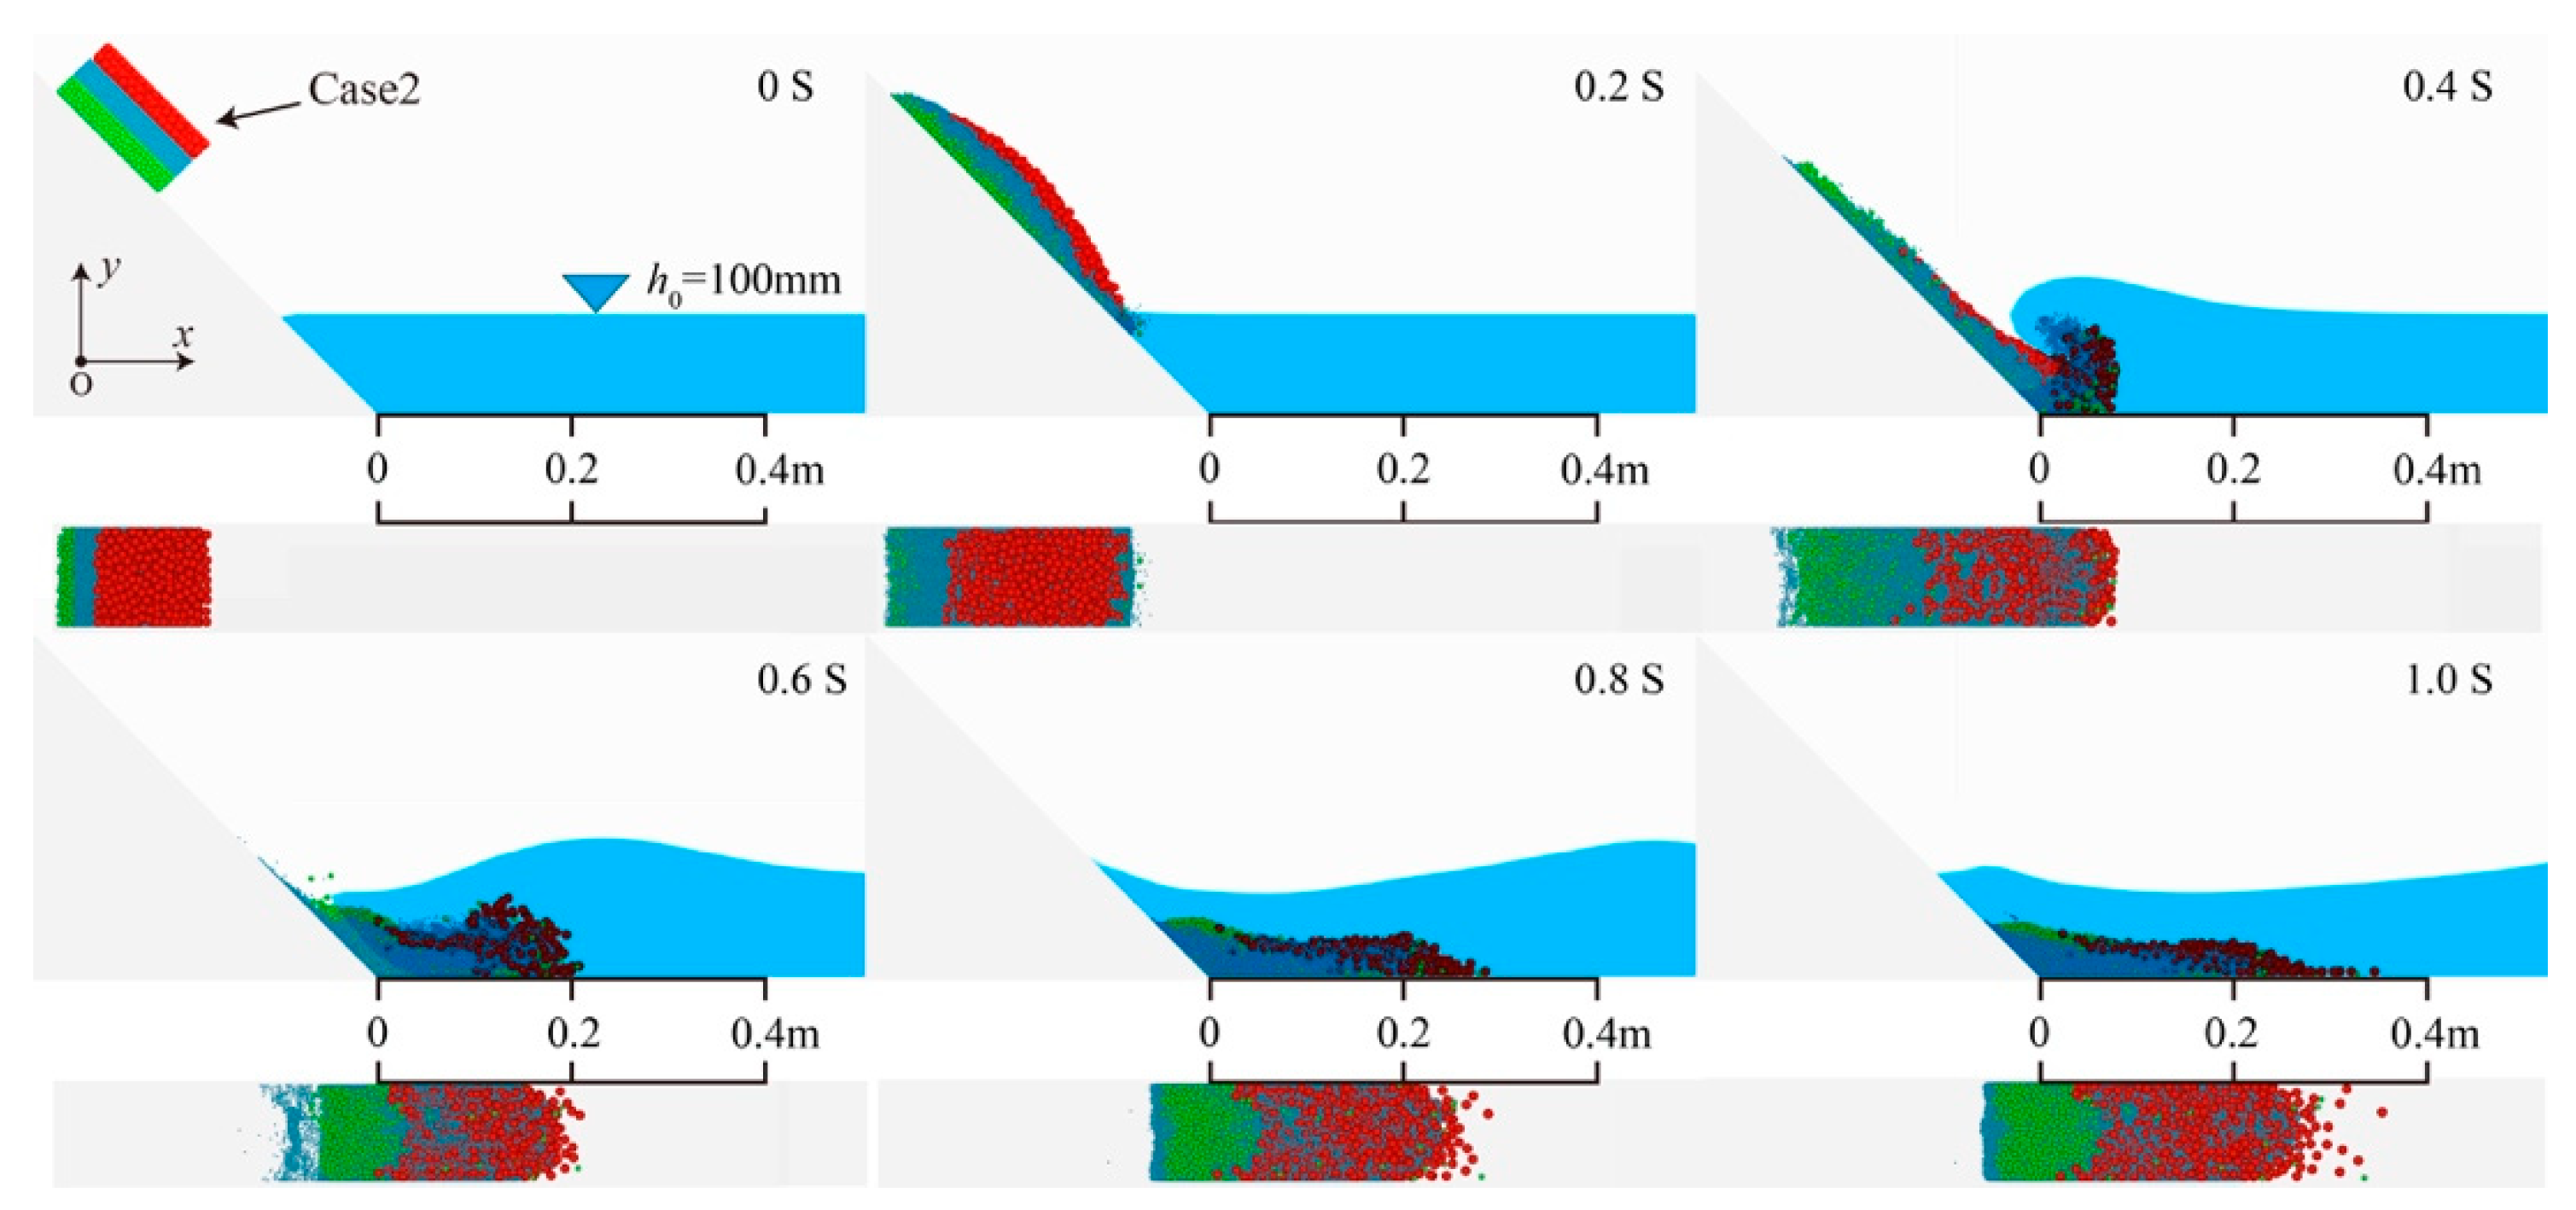
Taking Case 2 as a representative example,
Figure 11 shows the transport and deposition of different-sized particles under
h0 = 100 mm in both elevation and plane views. At
t = 0 s, the layered mass rests on the slope. By
t = 0.2 s, the front detaches and slides downward, accumulating at the toe. Between
t = 0.4 and approximately 0.6 s, massive water entry generates a surge; bottom-layer particles (
r = 3 mm) settle rapidly, while surface-layer particles (
r = 5 mm) are lifted and displaced laterally and longitudinally. From
t = 0.8 s onward, most particles have settled to the channel bed, forming a deposit layer along the flow path, and the water surface returns to a near-calm state with only minor residual disturbances.
To further reveal the controlling mechanisms behind the final deposition,
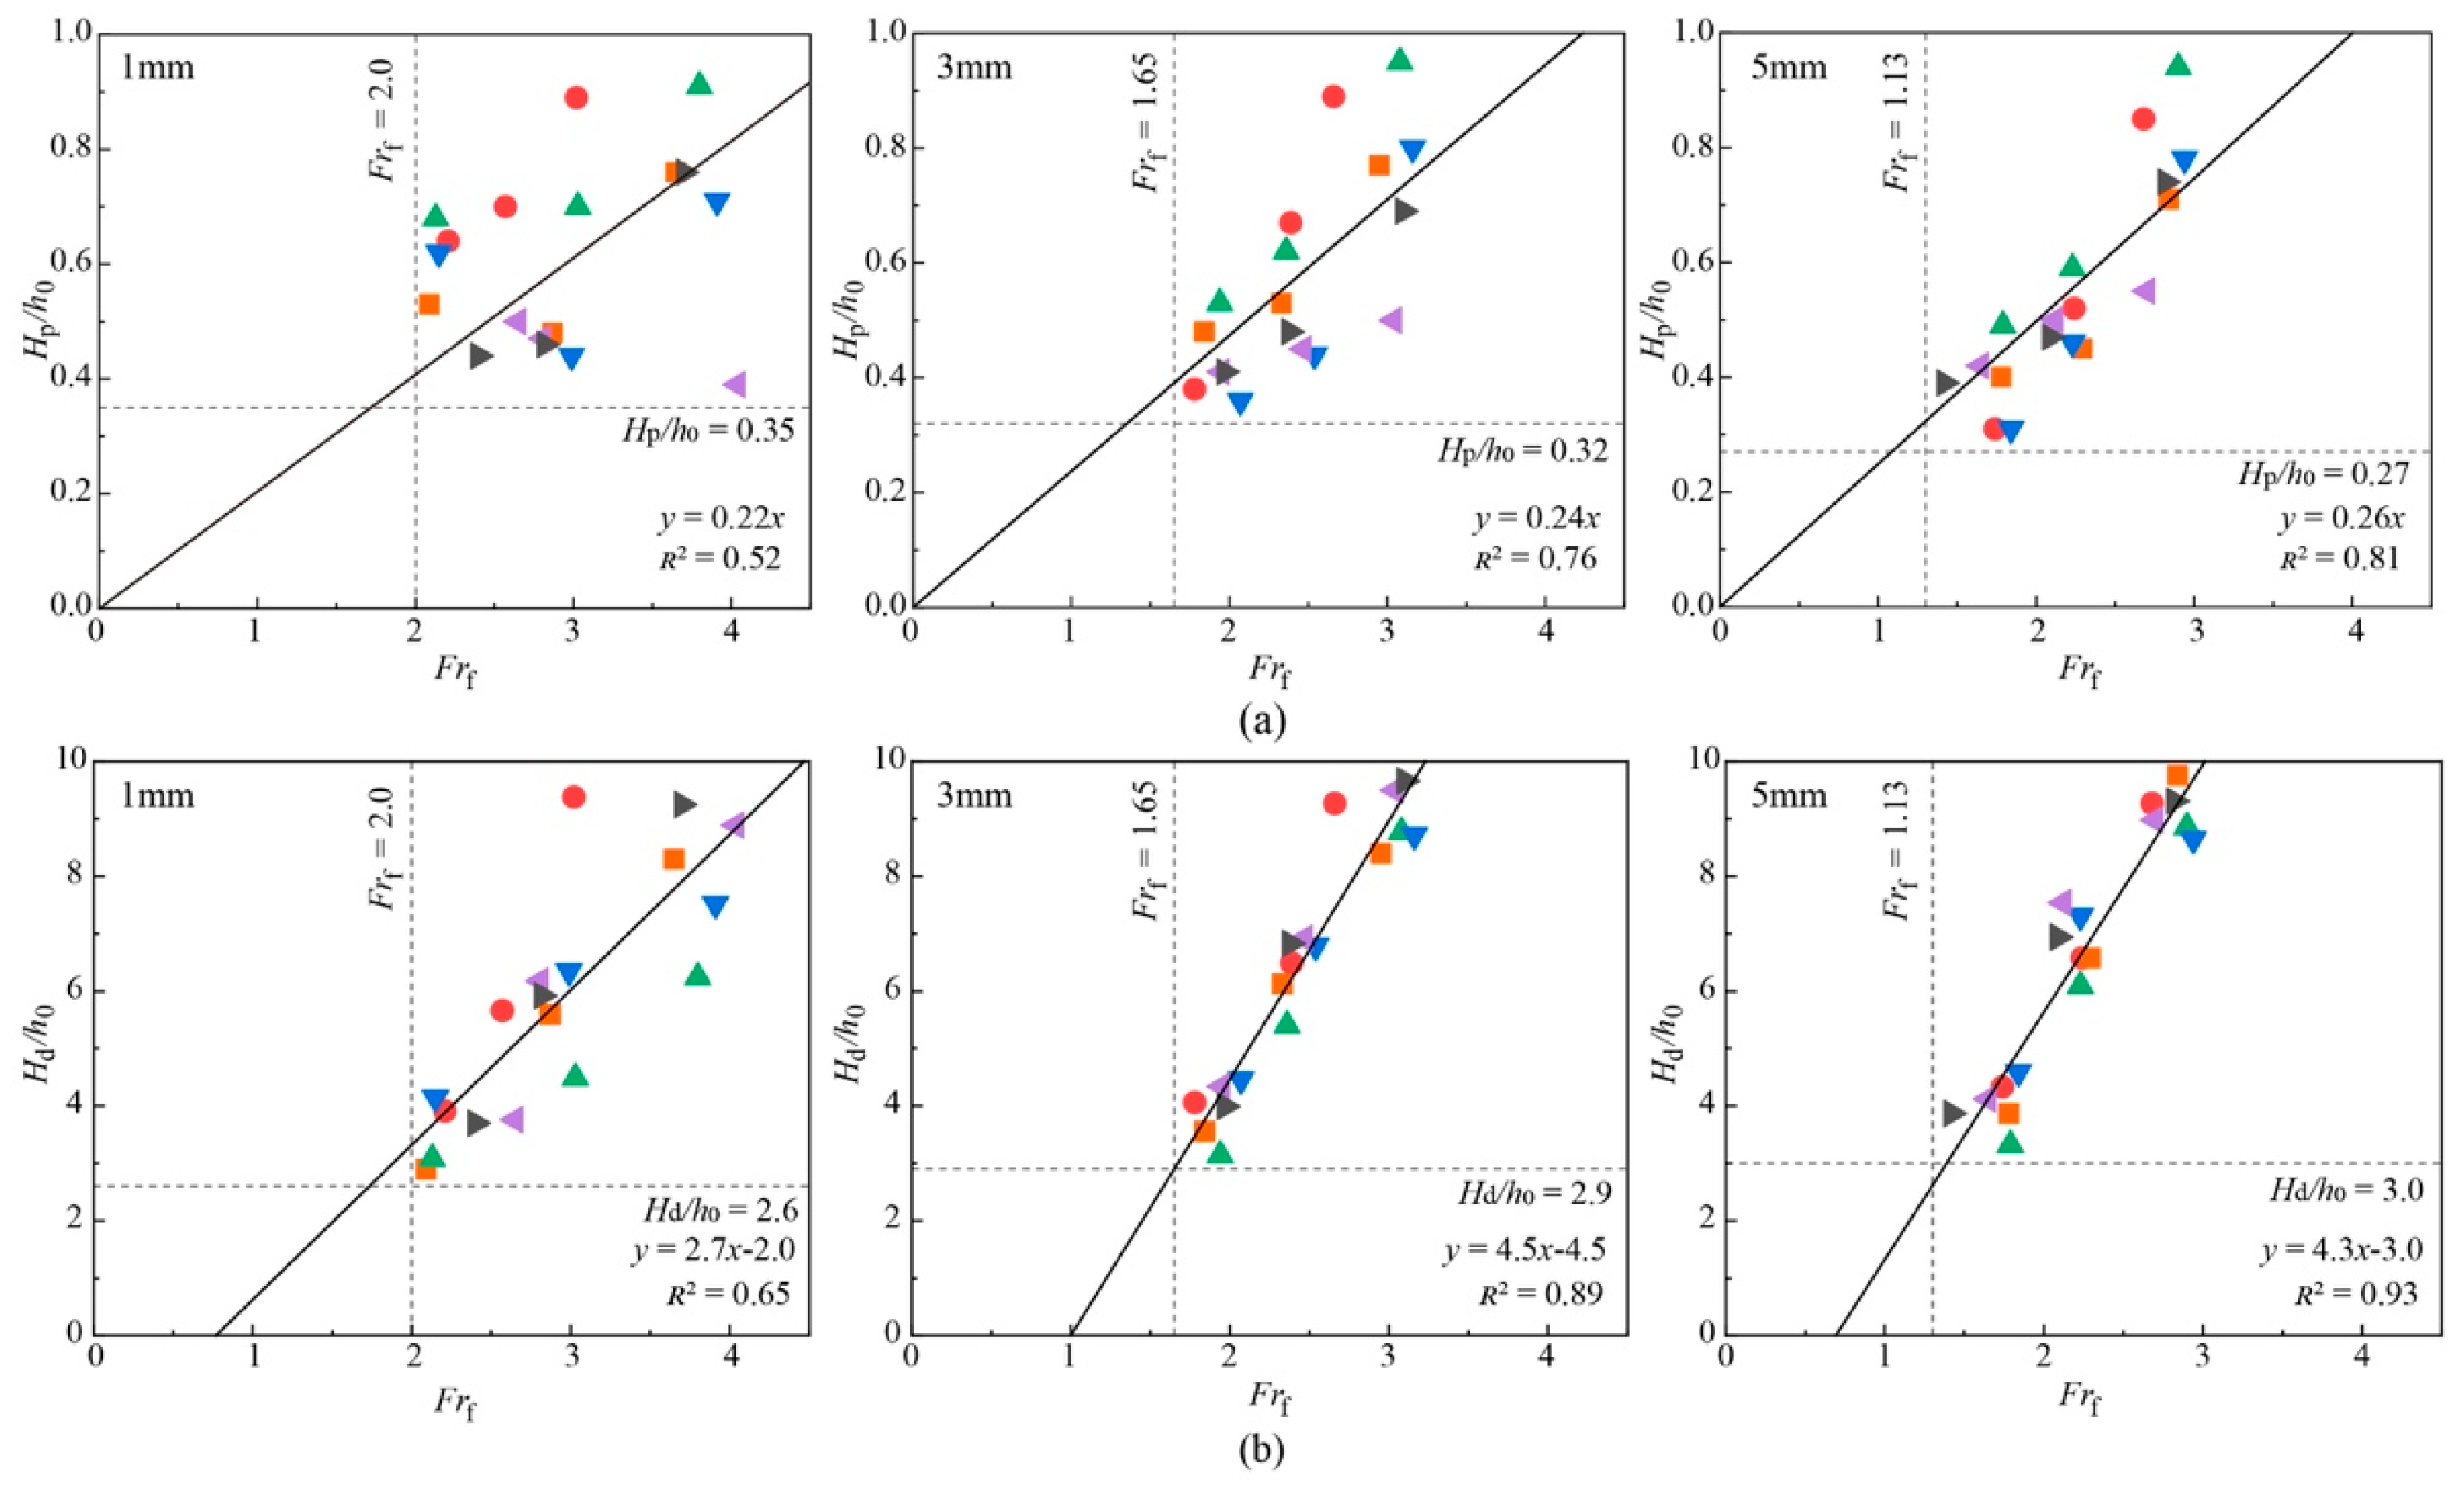
Figure 12 quantitatively analyzes the relative deposition height
Hp/
h0 (see
Figure 12a) and relative travel distance
Hd/
h0 (see
Figure 12b) of each particle size group against the local Froude number
Frf across all simulation cases. The local Froude number is defined as
, where
vf is the peak velocity at the leading edge of the landslide mass. The relative deposition height plot (see
Figure 12a) shows that as particle size increases, the
Hp/
h0 threshold decreases, with data points converging toward a fitted line of increasing slope, indicating a more pronounced linear positive correlation between
Frf and
Hp/
h0, with the
R2 value of the 1 mm group only reaching 0.52. Fine particles have weak intergranular interlocking effects and are more susceptible to disturbances from random initial packing, resulting in more scattered data points and poorer fitting performance compared with medium and coarse grains.
Figure 12.
Dependence of deposition characteristics on the local Froude number. (a) Hp/h0; (b) Hd/h0.
Figure 12.
Dependence of deposition characteristics on the local Froude number. (a) Hp/h0; (b) Hd/h0.
The relative travel distance plot (see
Figure 12b) shows that larger particles correspond to a higher
Hd/
h0 threshold, with data points exhibiting a more distinct clustered distribution. The vertical dashed lines mark the front velocity thresholds for each size group. For the large-particle group (
r = 5 mm), the front peak velocity is reduced due to hindered transport, so that despite the larger particle size, the corresponding
Fr is smaller. This discrepancy arises from the combined effect of particle inertial force and interlayer friction; coarse grains carry greater mass inertia but suffer stronger mutual interlocking resistance during sliding, which limits the front sliding velocity and weakens the correlation between the particle scale and Froude number.
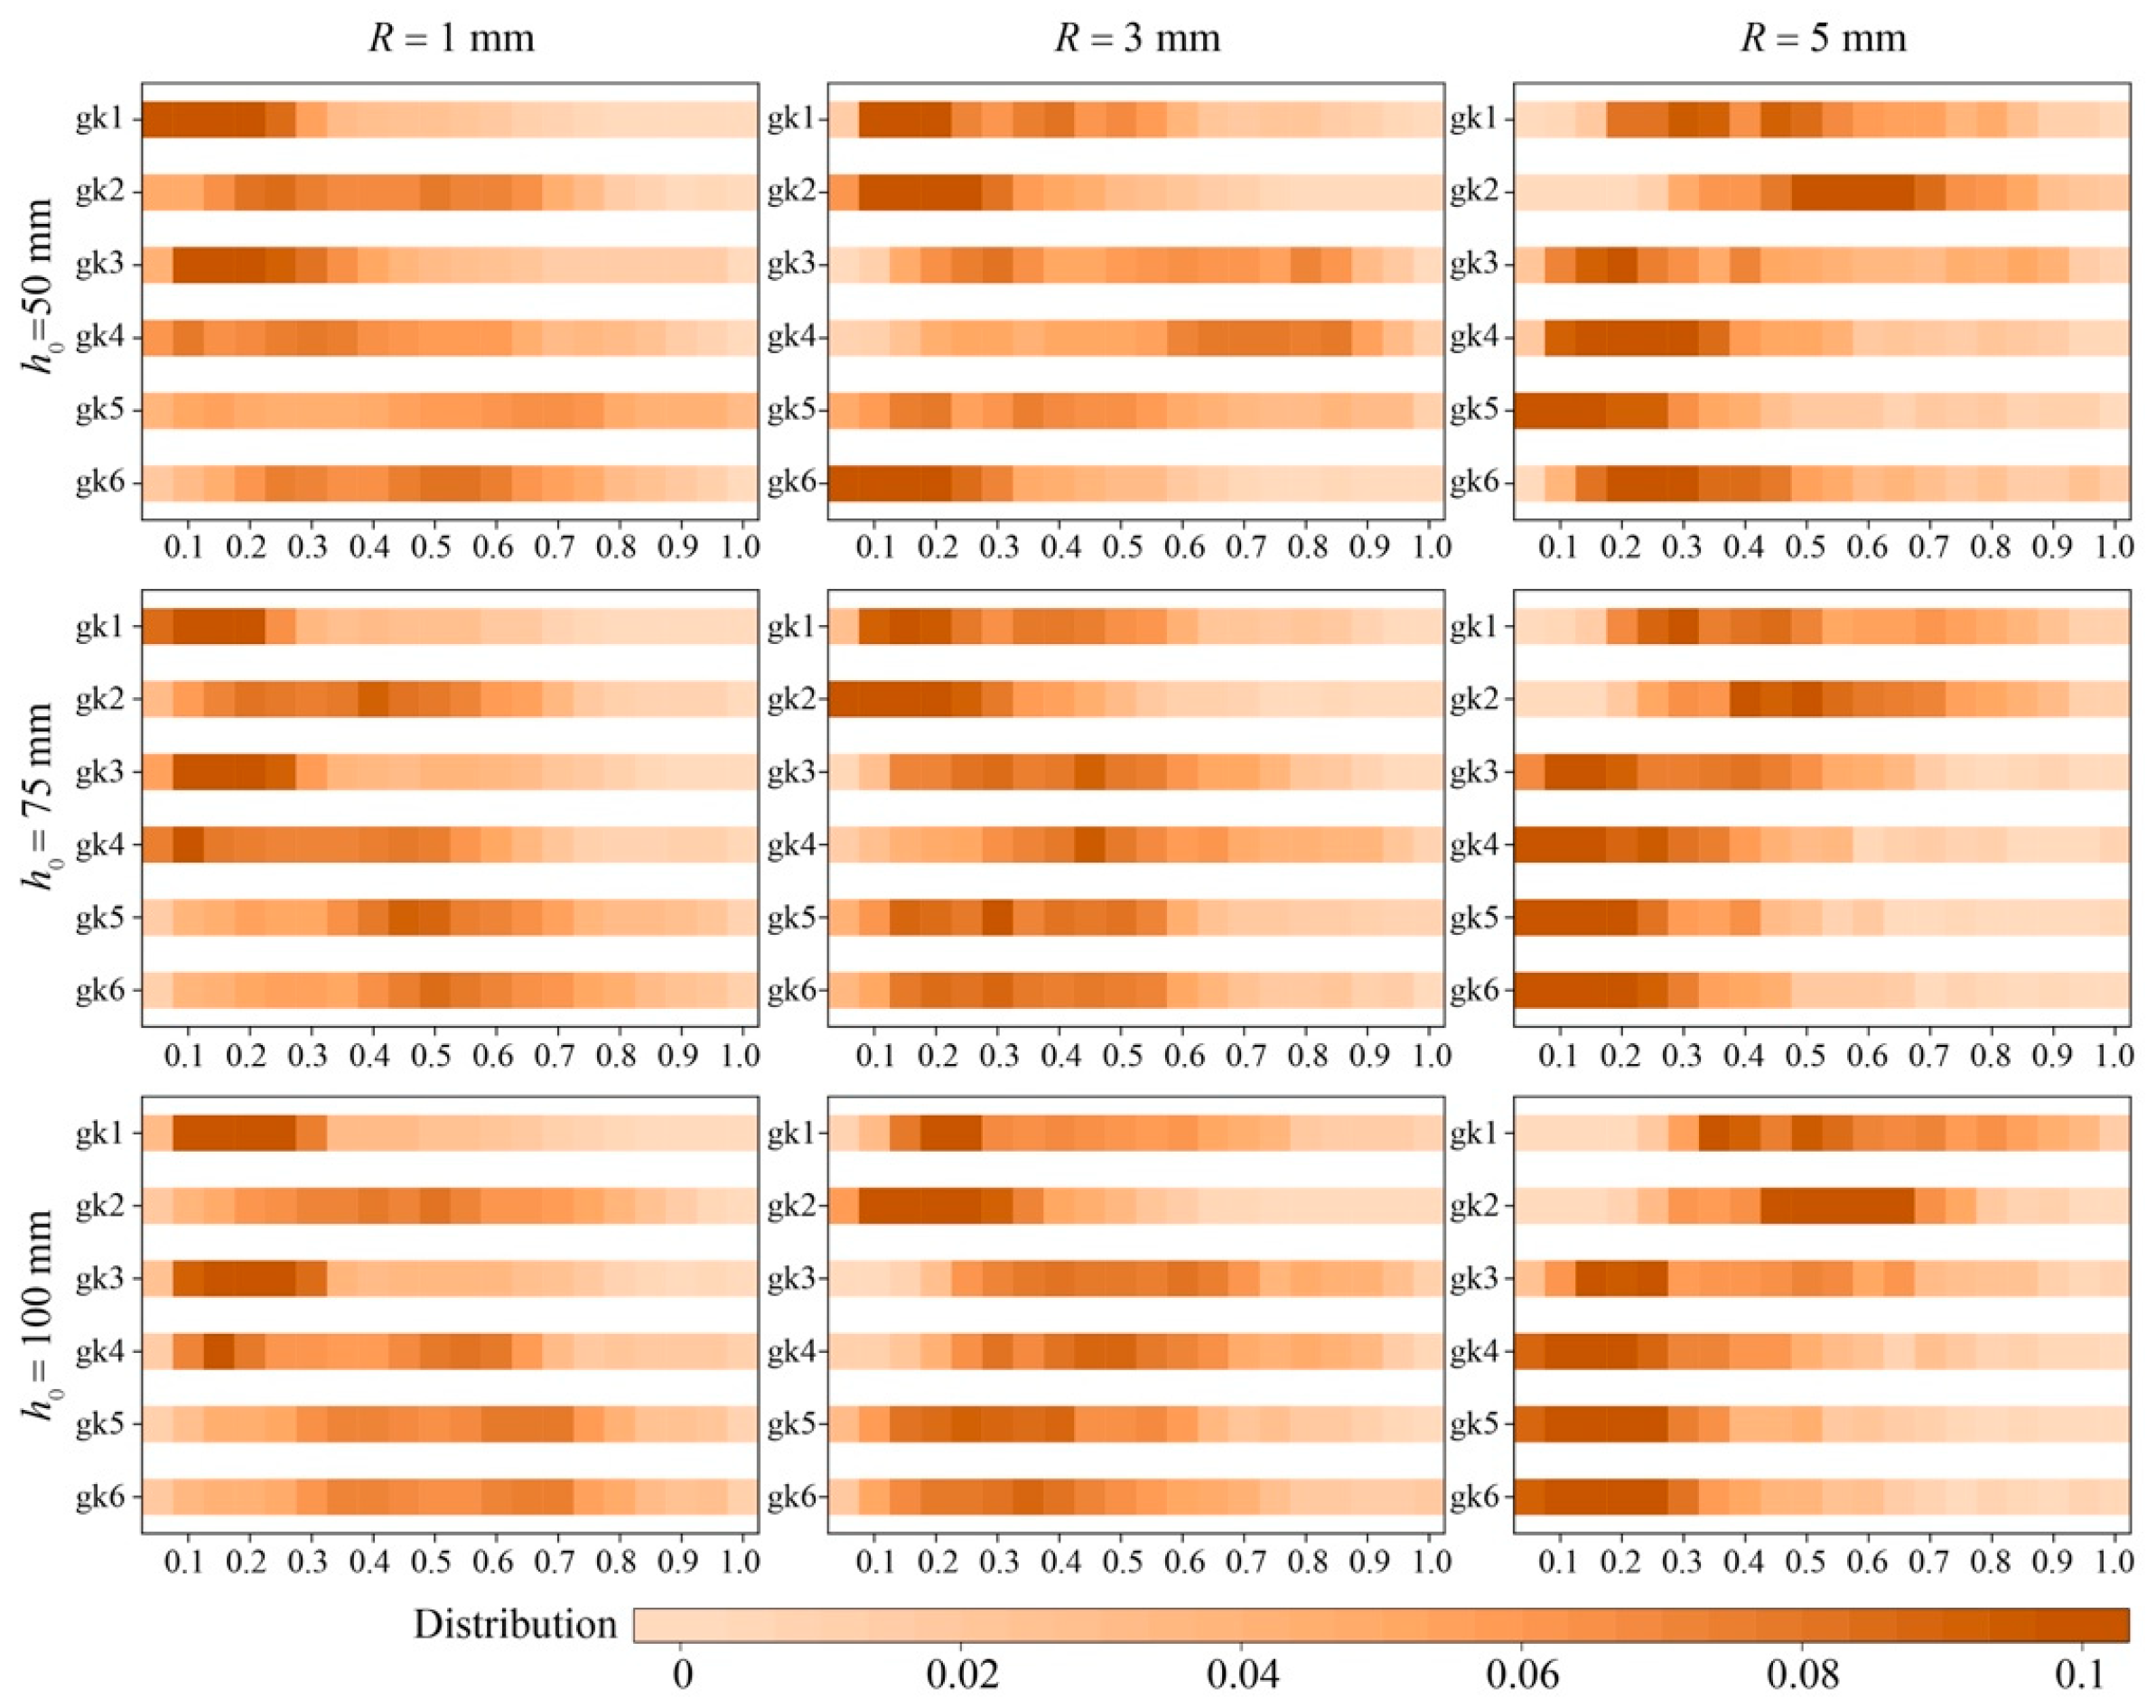
To further examine the final deposition state,
Figure 13 presents the normalized deposition density distributions of each particle size under all still-water depths and initial arrangements. Statistical bins of 0.05 m are used, and the count in each bin is normalized by the total number of particles of that size.
Under the same water depth, larger particles produce more concentrated high-density zones, indicating a smaller deposition extent. With increasing water depth, the deposition morphology of large particles (r = 5 mm) remains relatively stable, with high-density zones persisting near the slope toe. For a given particle size, differences among initial arrangements become more evident as water depth increases: the high-density zone of 1 mm particles shrinks markedly, whereas both the distribution pattern and peak location of 5 mm particles remain largely unchanged. Under shallow water and small particle sizes, the initial arrangement has the strongest influence on the final deposition morphology. The landslide front Froude number Frf serves as the dominant dimensionless number governing the coupled interaction between sliding granular mass and ambient water. The introduction of Frf eliminates the scale interference brought by different initial still-water depth h0 and sliding velocity vf values. Dimensionless deposition indices, Hp/h0 and Hd/h0, further normalize the geometric size of particle deposits under varying water depth conditions. The obvious linear correlation between Frf and normalized deposition parameters reveals the unified quantitative law of granular transport and surge generation across different water depth scenarios, which can provide a scalable reference for analyzing landslide surge behaviors under different prototype water depths.
4.2. Near-Field Morphological Evolution
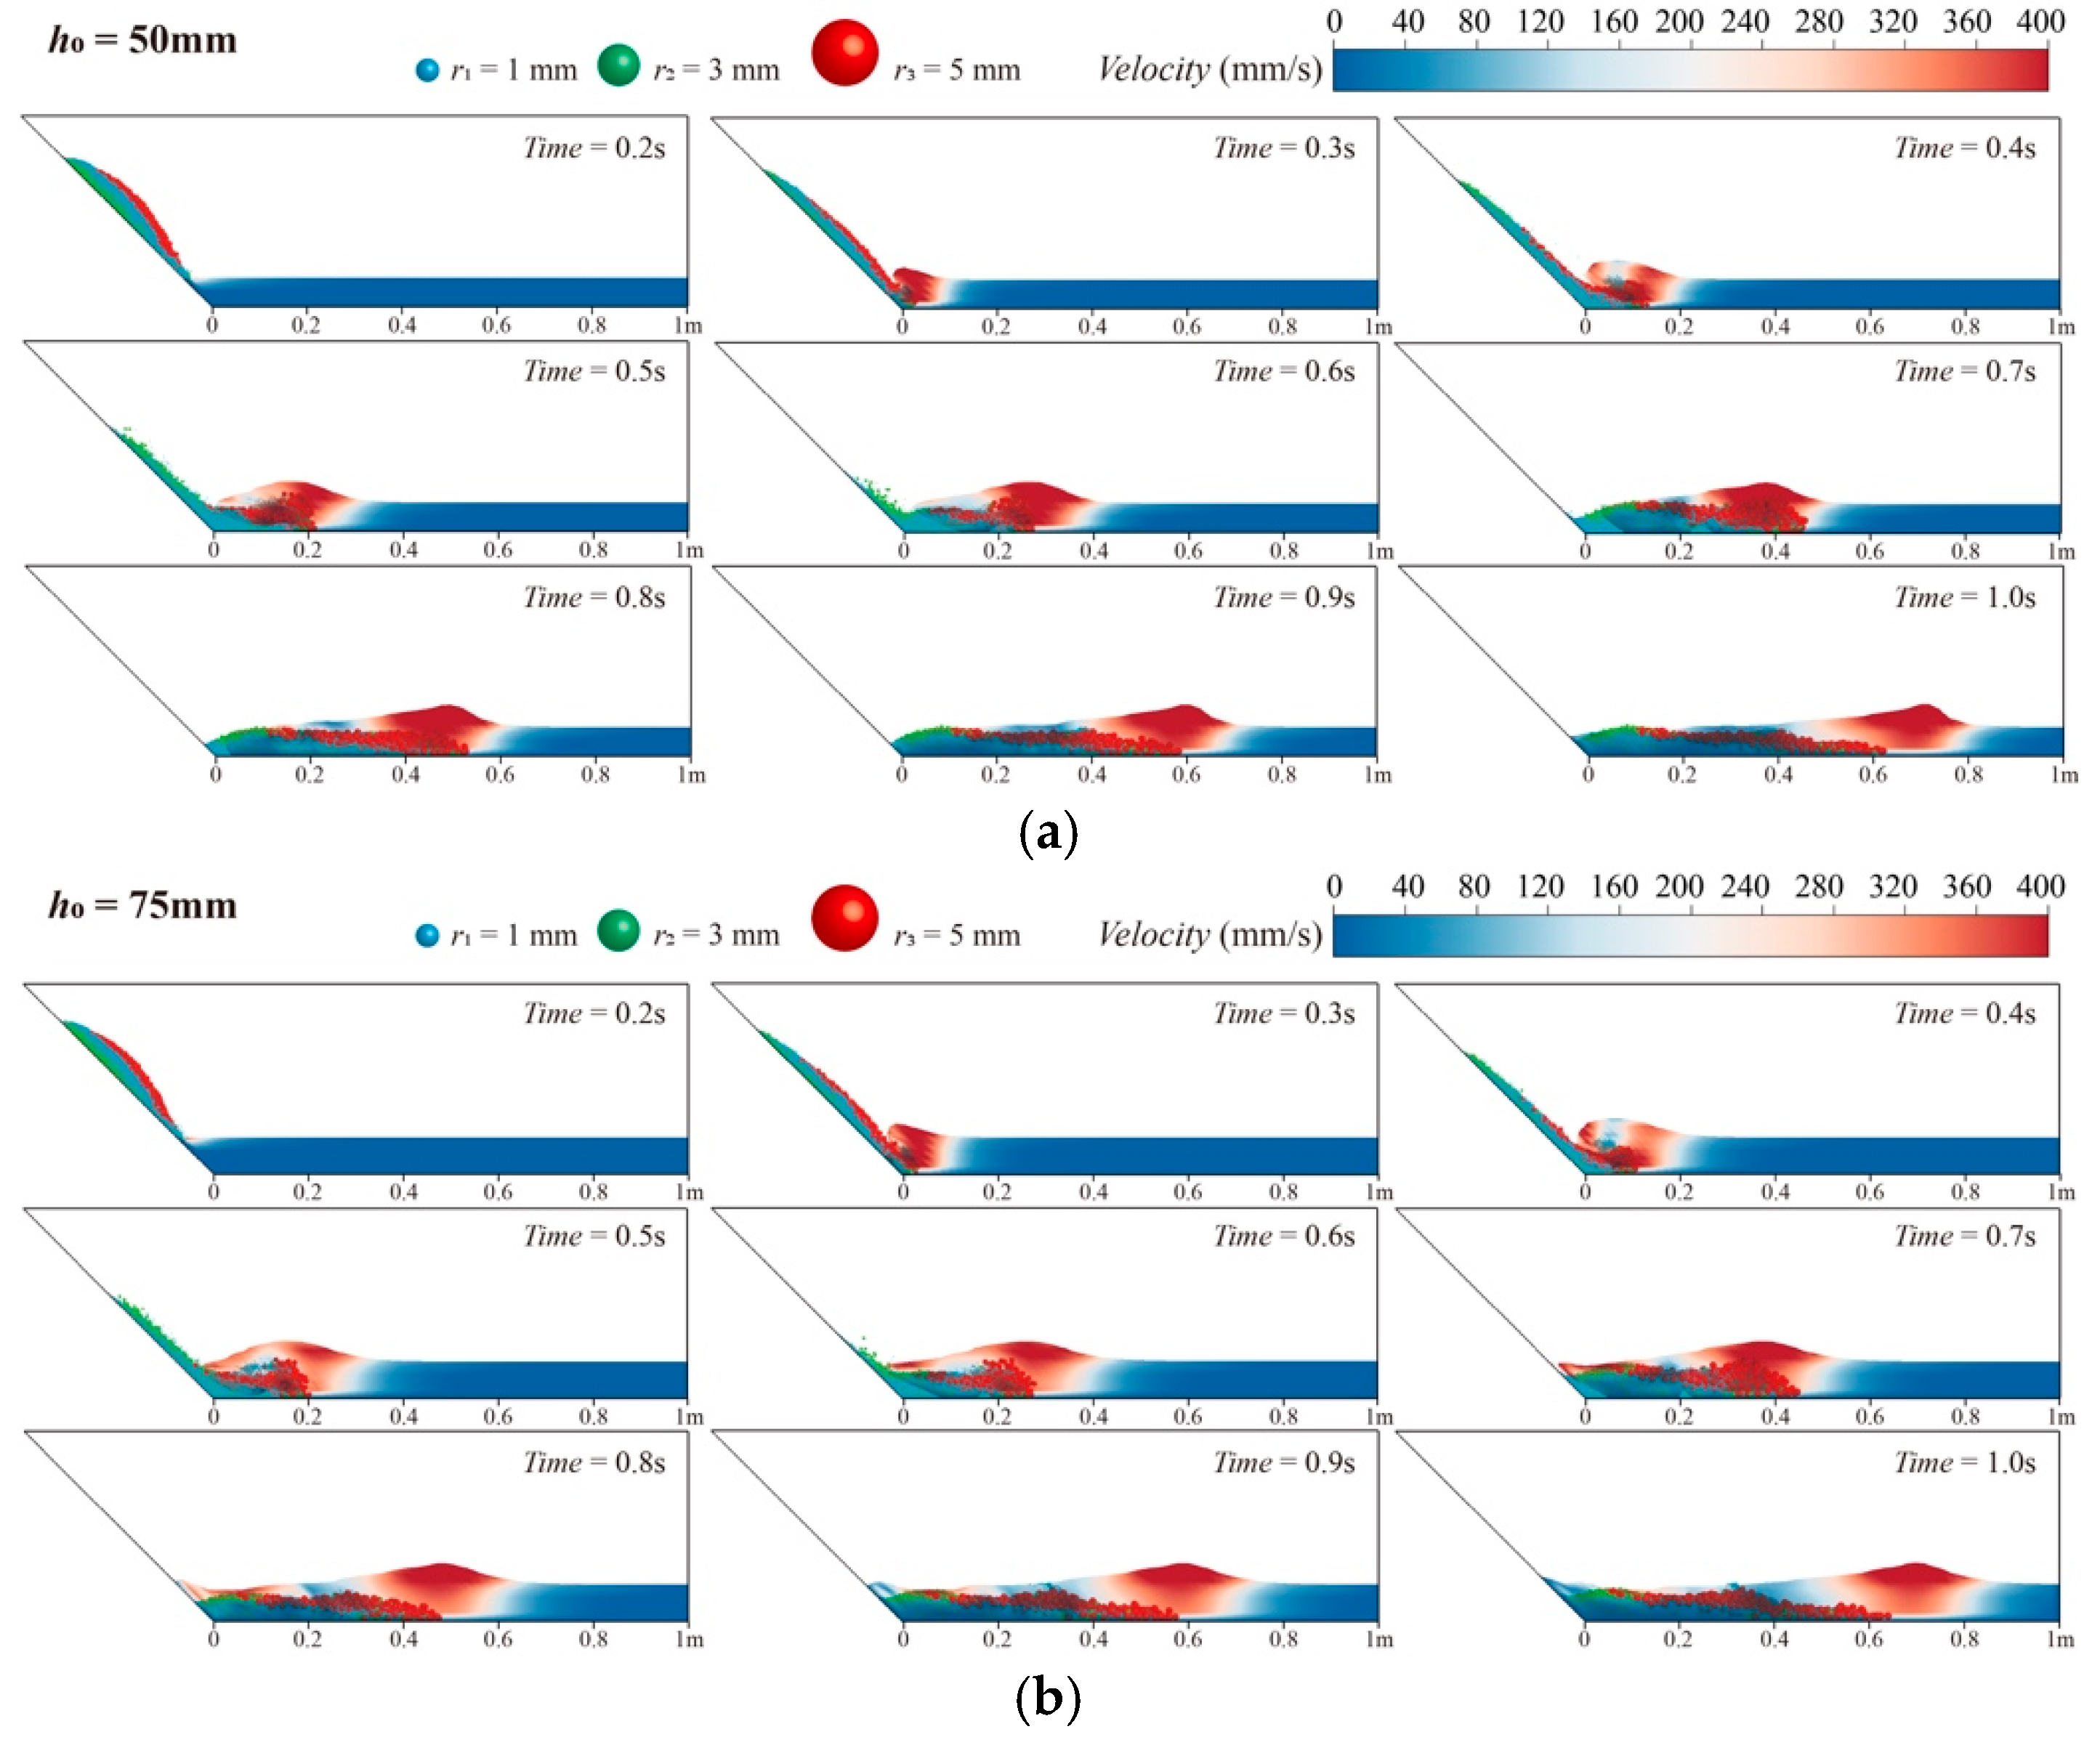
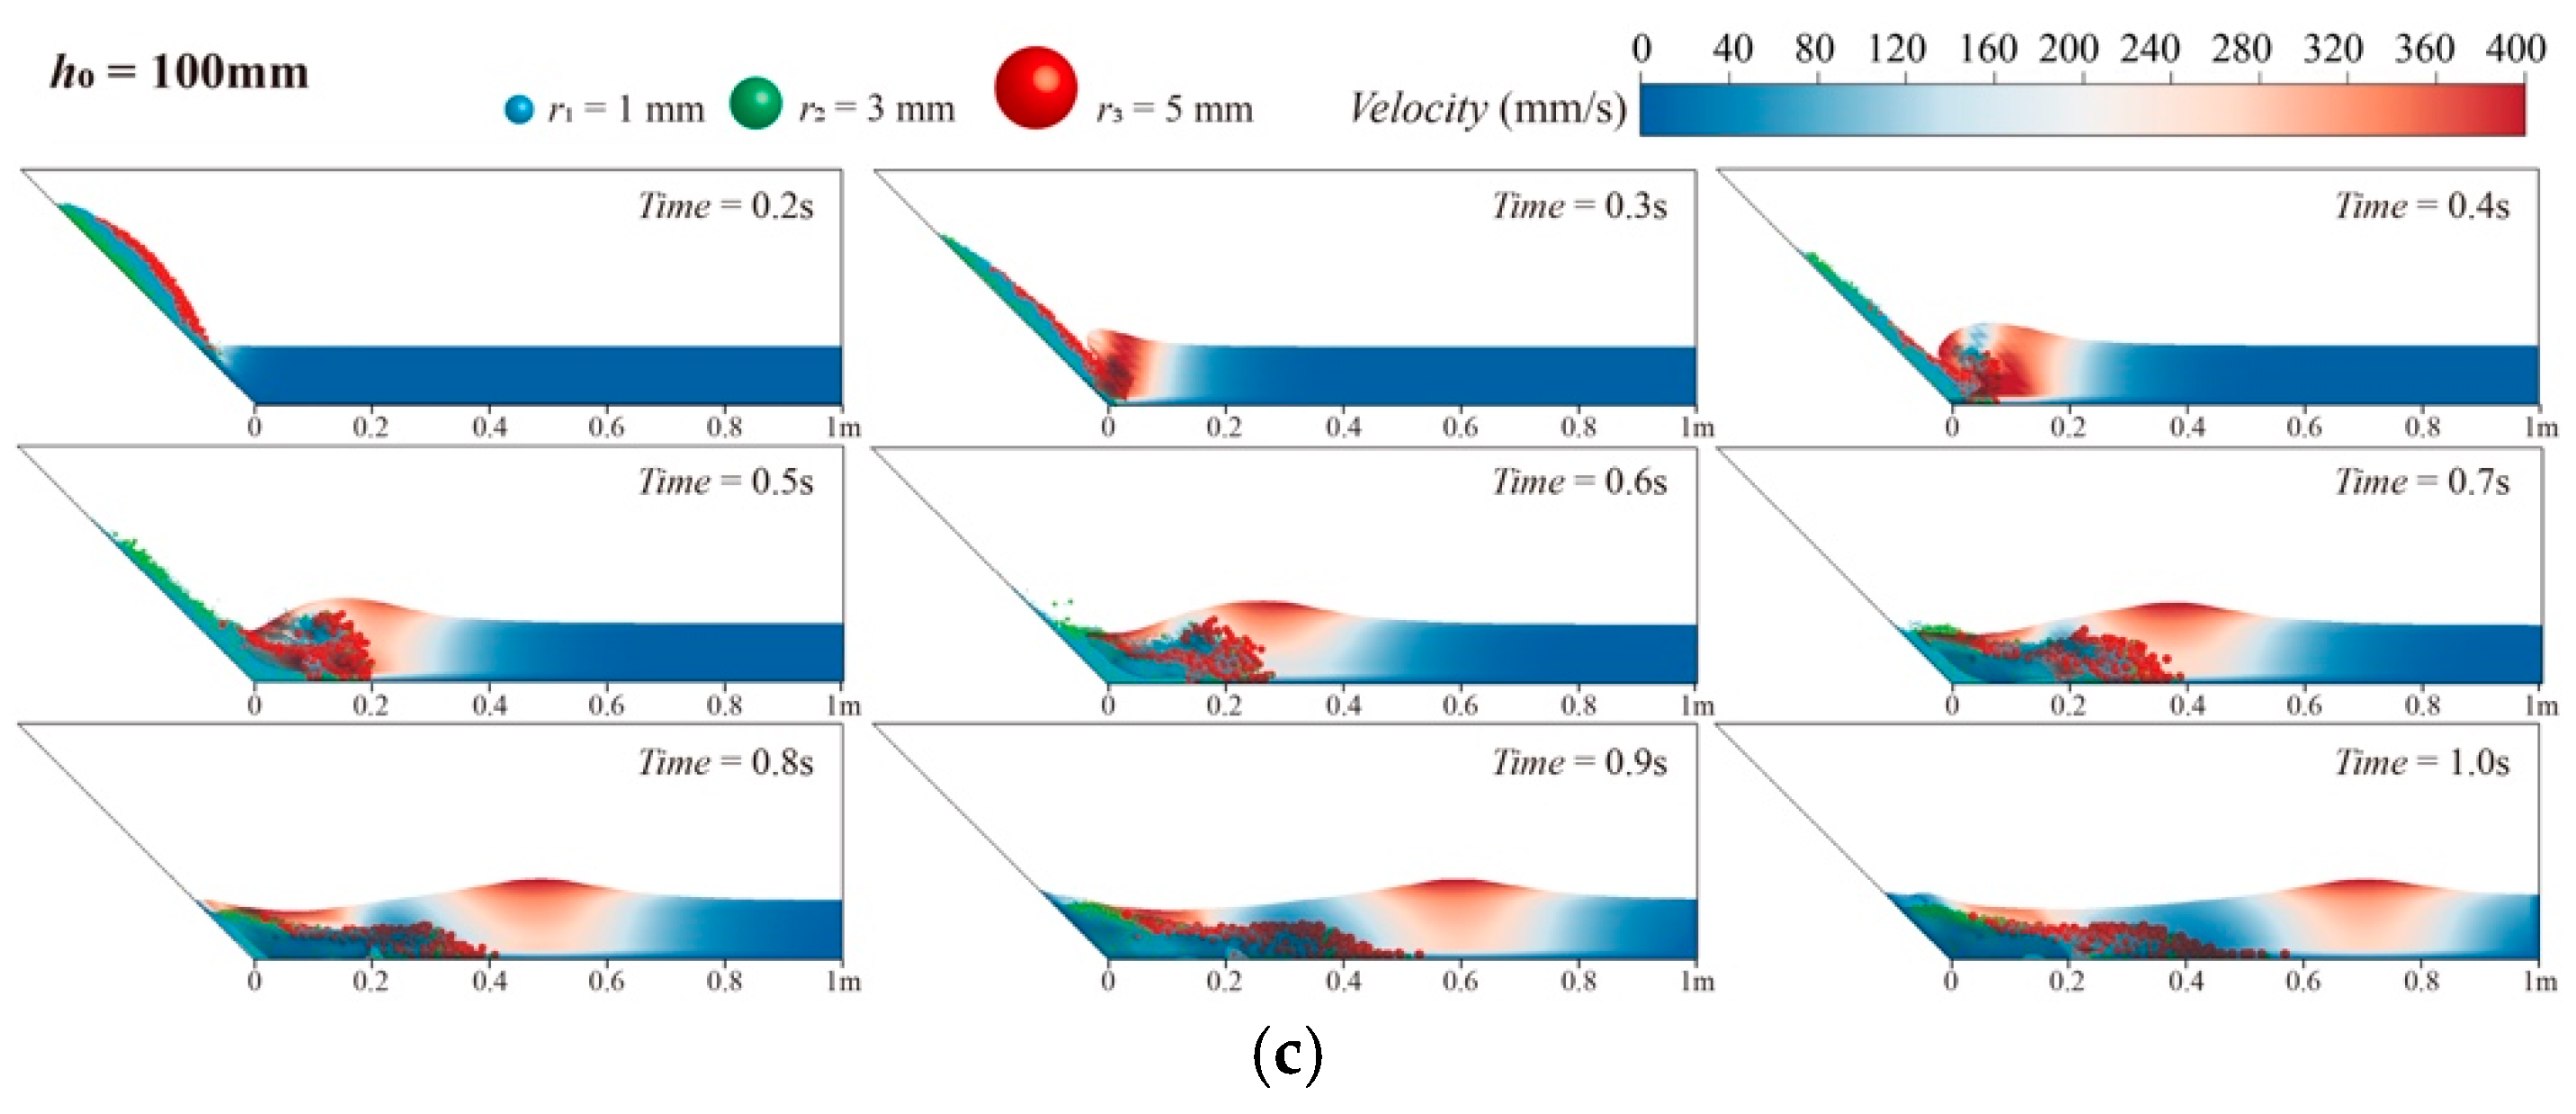
Surge waves generated by different particle size combinations share common evolutionary stages: initiation, development toward a solitary wave-like form, decay, and stable propagation. Taking Case 2 as an example,
Figure 14 shows the surge propagation and velocity distribution under three still-water depths. During initiation, a water tongue forms upon particle impact. In the development stage, the wave height decreases and wavelength increases, with the waveform gradually approaching that of a solitary wave. In the stable propagation stage, the flow field becomes more uniform and the surge propagates outward with further decay.
Still-water depth systematically modulates both the surge velocity and waveform. In the early stage, the velocity is controlled by the initial particle motion and varies little with depth. At later stages, under lower water depths the velocity decays more slowly and the wave front remains sharp. However, under higher depths, the decay is more pronounced and the waveform becomes gentler and more closely resembles a solitary wave. Overall, increasing water depth drives a transition from strongly nonlinear, large-amplitude shallow-water characteristics to more linear, longer-wavelength, smaller-amplitude deep-water features, underscoring the decisive role of water depth in energy transfer and waveform evolution. Sufficient water volume provides a buffer zone for particle impact, dissipates concentrated kinetic energy through distributed fluid shear, and suppresses the intense nonlinear free-surface distortion induced by granular impact in shallow-water environments.
4.3. Analysis of Surge Wave Height
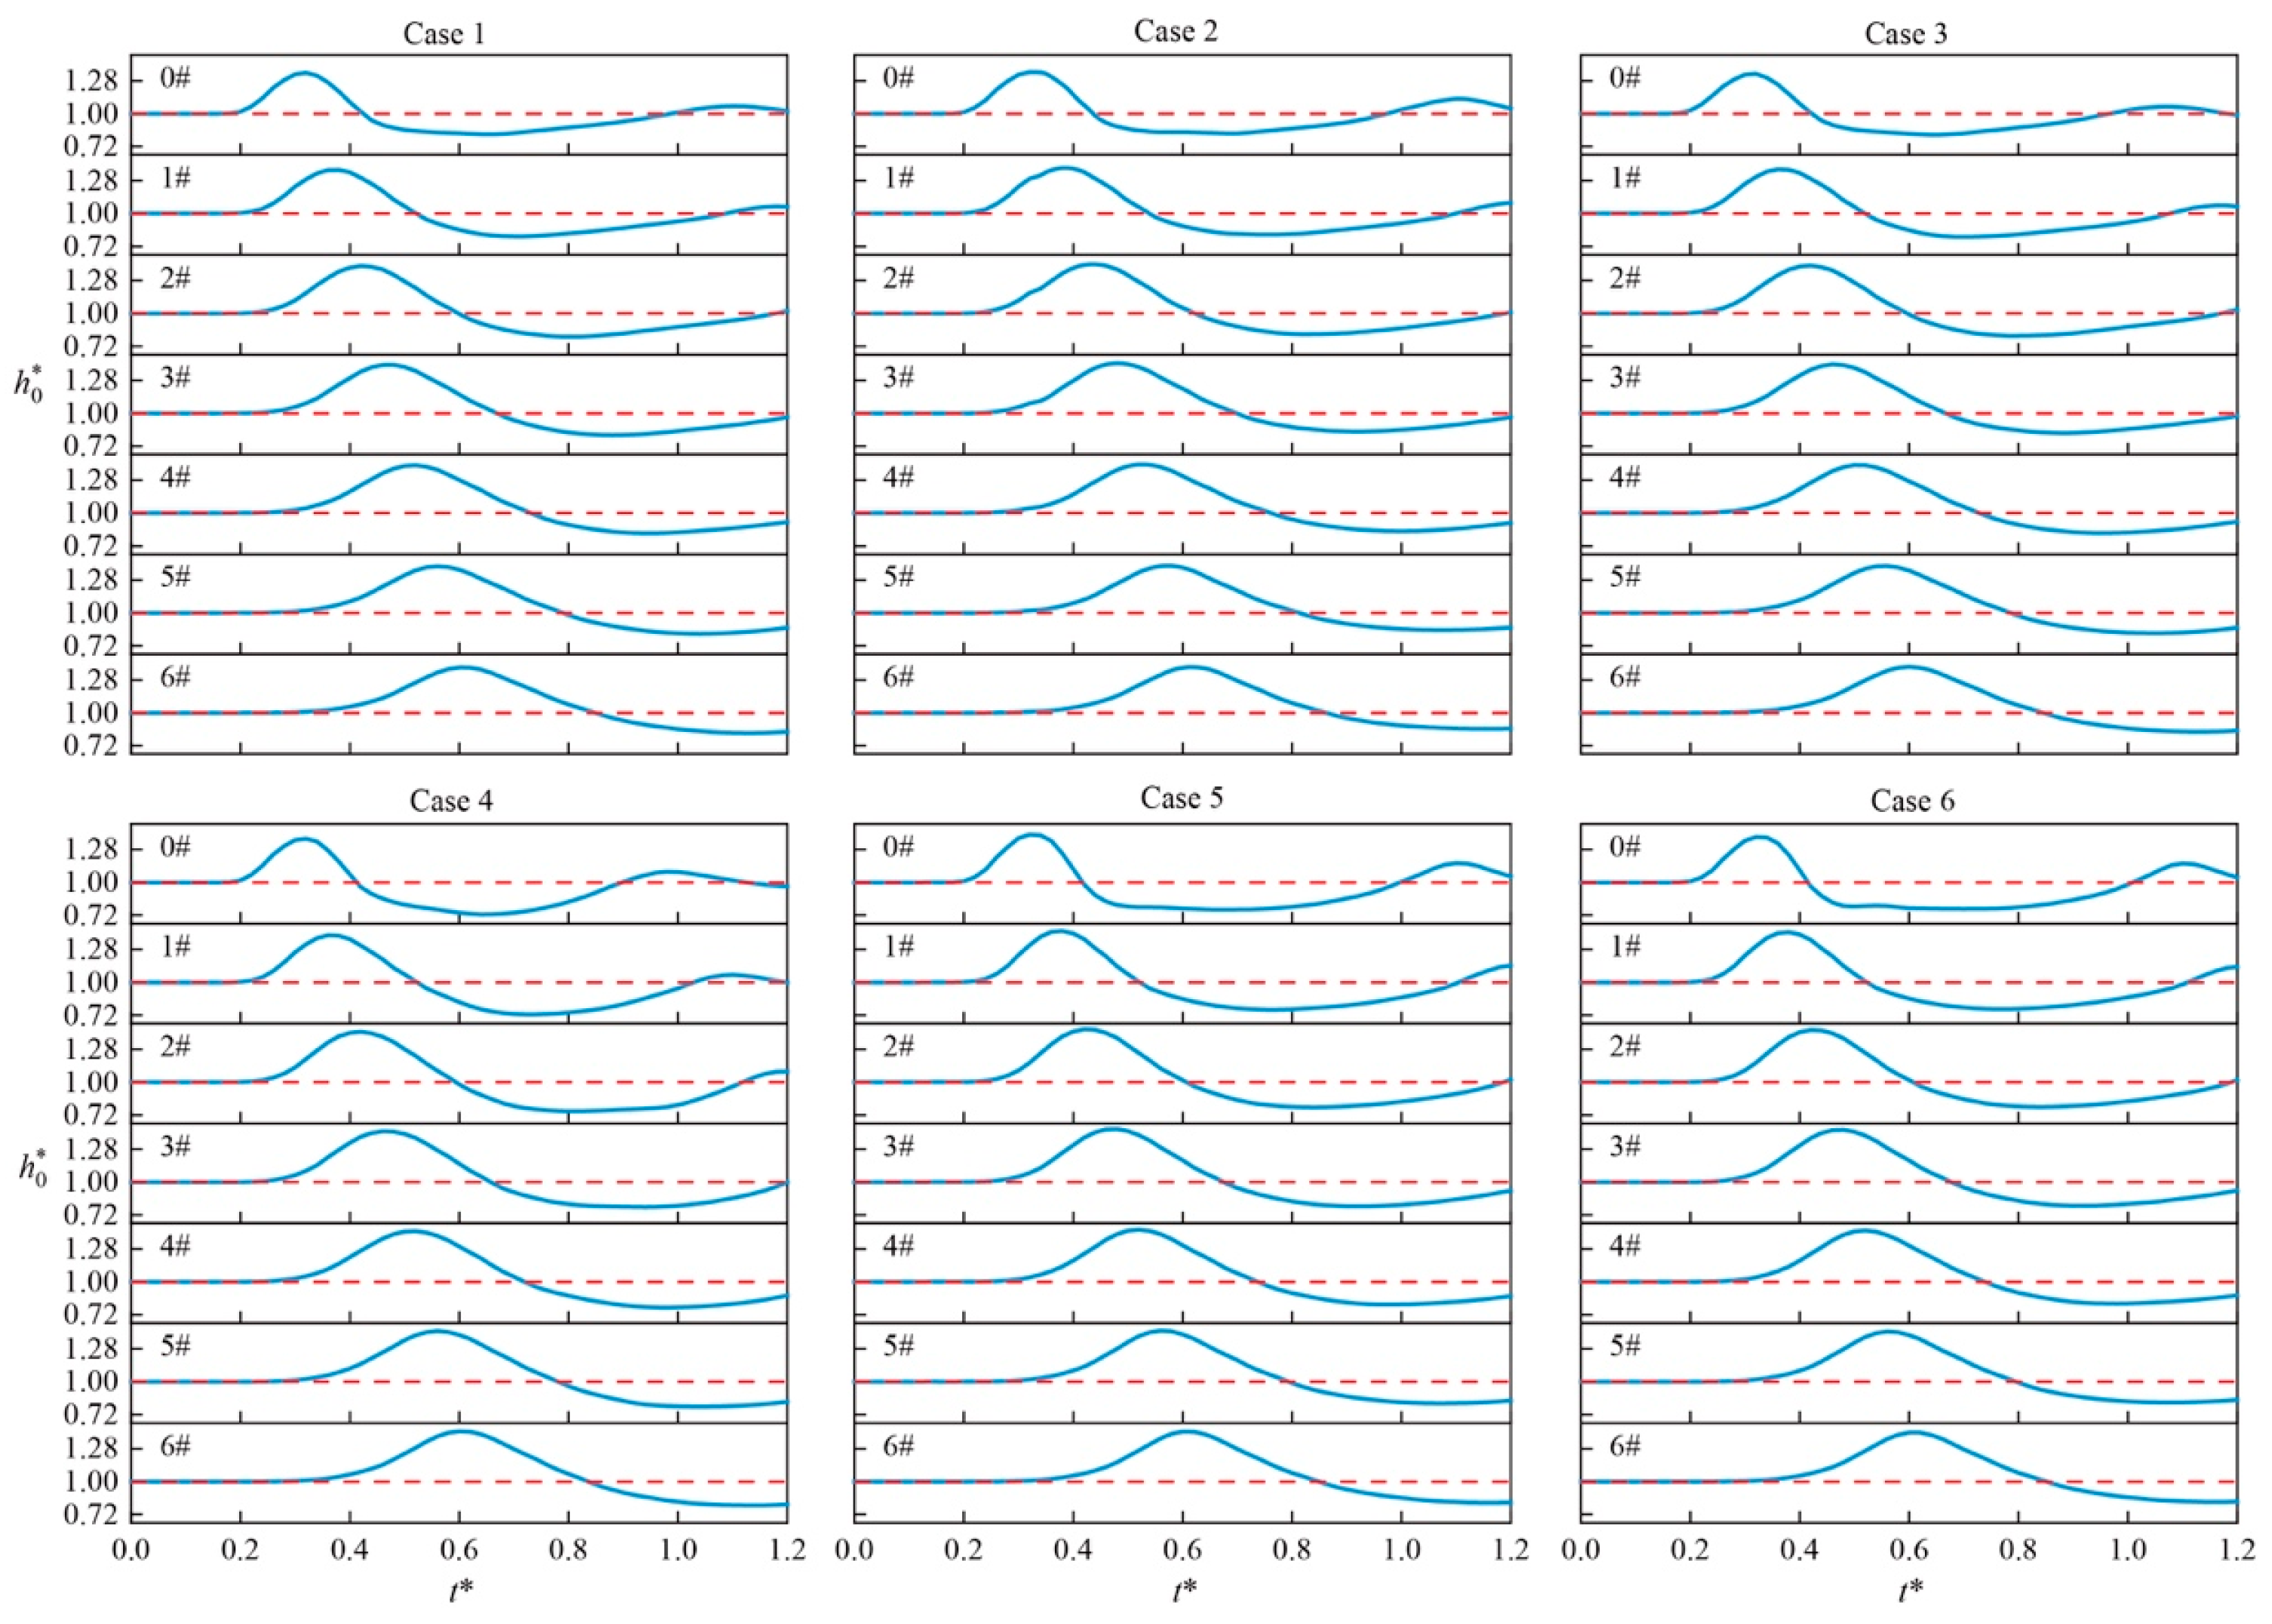
Case 1 (
h0 = 100 mm) is selected to quantitatively analyze the differential contributions of particle size to leading wave height evolution and kinetic energy transfer.
Figure 15 presents the non-dimensional water level variation along the flow path at multiple monitoring points, where the horizontal axis is the non-dimensional time and the vertical axis is the non-dimensional wave height. The red dashed line marks the initial still-water level.
Combining the morphological analysis with the wave height data, the surge evolution can be divided into three stages: generation, propagation, and decay (see
Figure 15). It should be noted that the “wavelength” extracted at each monitoring point does not refer to the physical wavelength of a classical solitary wave, but rather the characteristic time required for the local waveform to rise from the free surface to the crest and return to the free surface.
Combining the morphological and wave height analyses, the surge evolution follows three stages—generation, propagation, and decay—with the “wavelength” at each monitoring point representing the characteristic time for the local waveform to rise from the free surface to the crest and return.
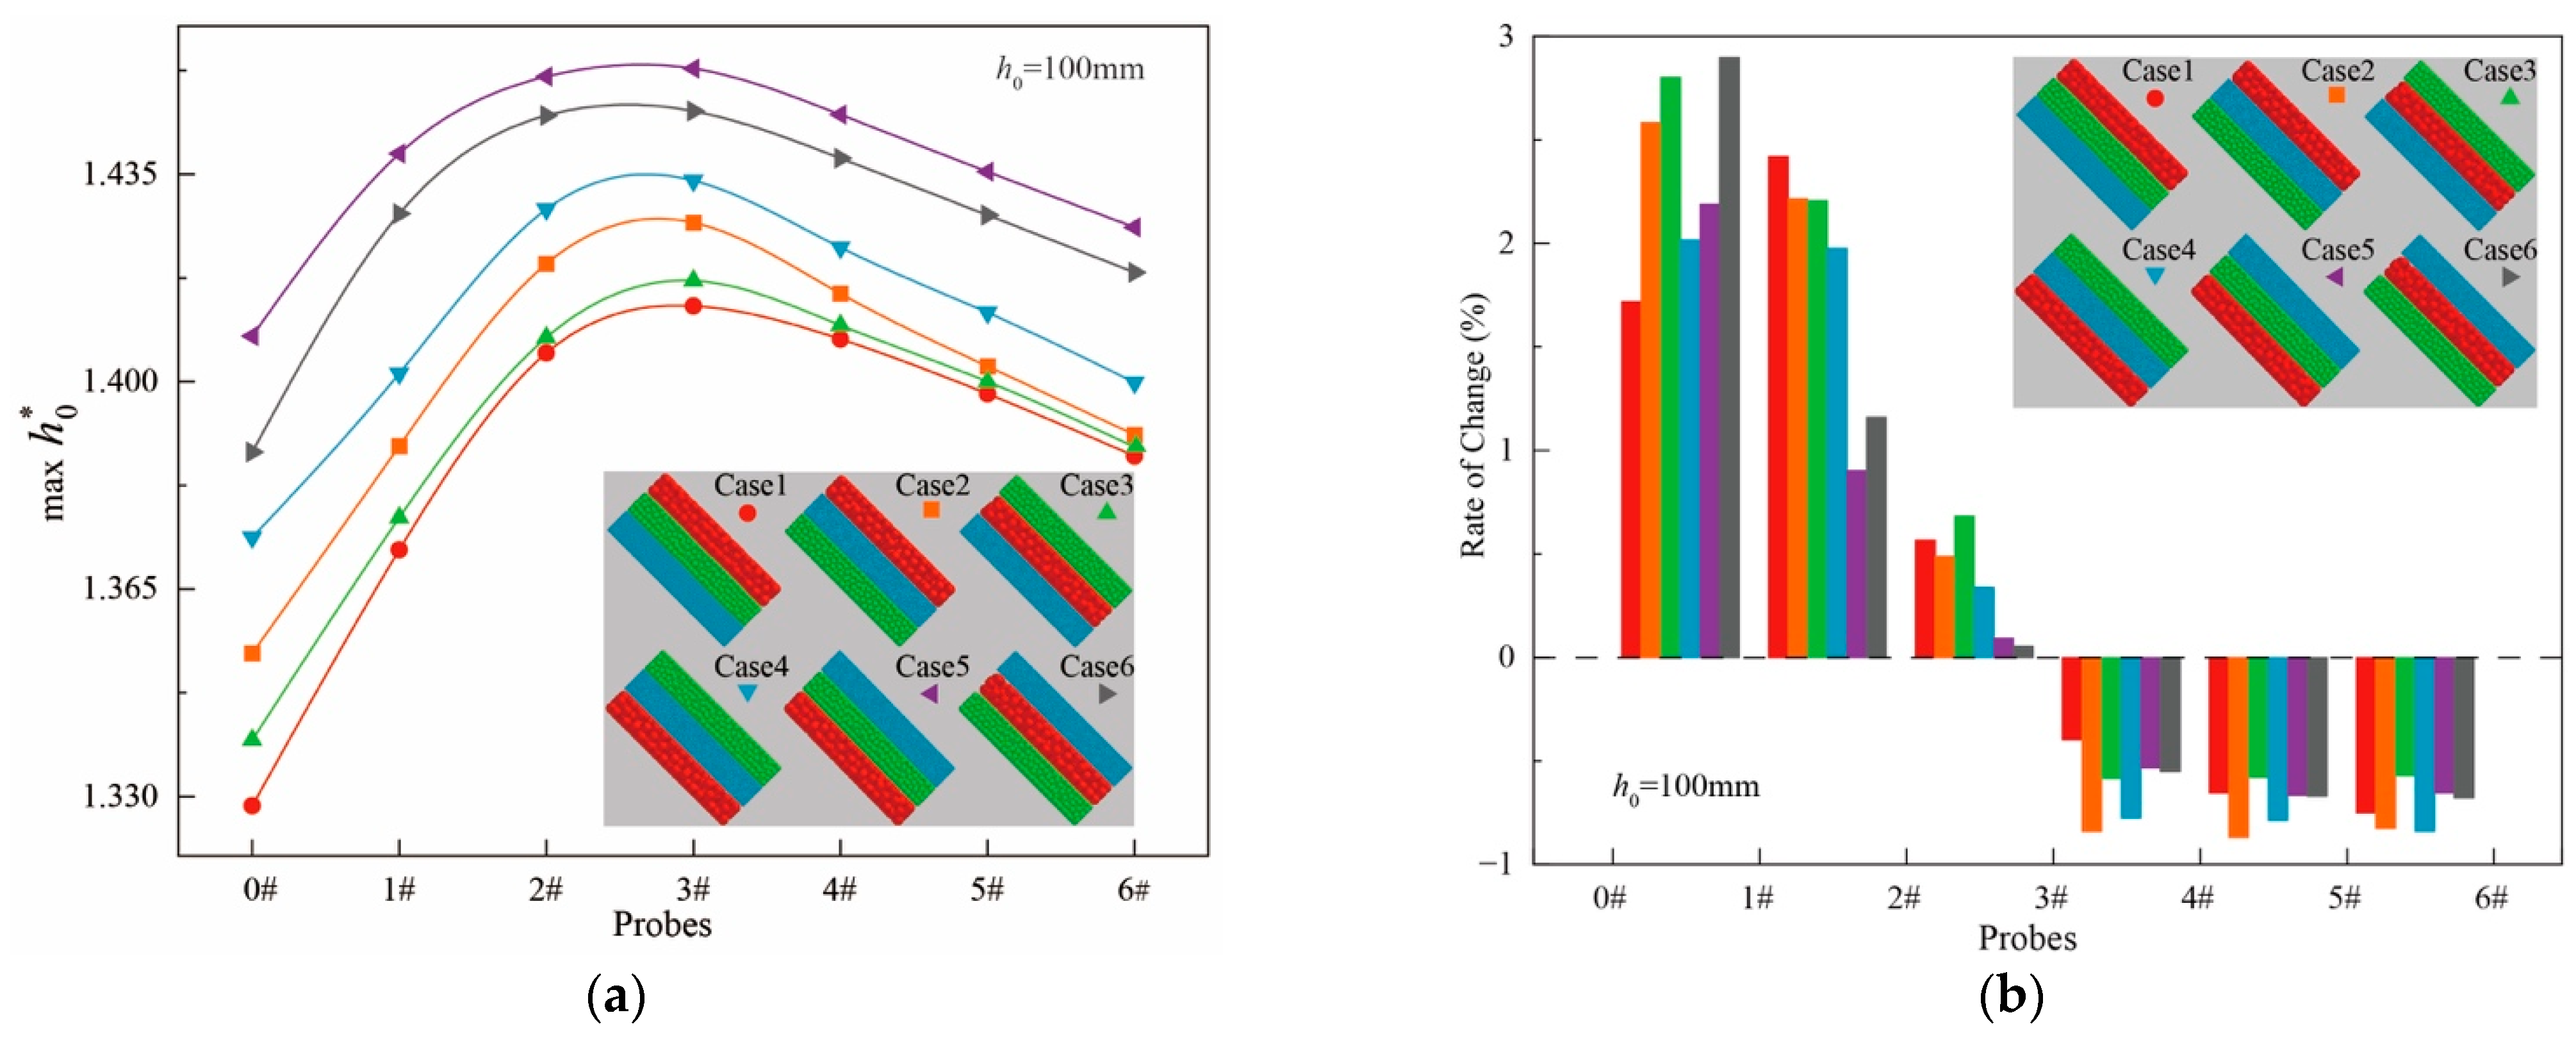
Figure 16a shows the maximum relative wave height at various monitoring points for different particle arrangements under the same still-water depth. All cases exhibit a growth–peak–decay pattern, with the peak consistently occurring at monitoring point 3. Wave height amplitudes differ significantly among cases due to the distinct impact conditions created by the initial particle size combinations, yet the relative ranking of amplitudes remains stable throughout propagation. The wave height change rate between monitoring points (see
Figure 16b) indicates that the maximum growth rate predominantly occurs between points 0 and 1, identifying this as the dominant zone for wave energy accumulation, a process largely independent of the initial particle arrangement.
For Case 1, the leading wave height increases from 1.34 at monitoring point 0 to 1.41 at point 3, yielding an overall growth rate of 5.22%. The overall wave height growth rate from monitoring points 0 to 3 is defined as Rtotal = (A3 − A0)/A0 × 100% = 5.22%, where A0 and A3 stand for the peak normalized surge amplitude at points 0 and 3, respectively. The maximum local growth rate between points 1 and 2 is calculated by Rlocal = (A2 − A1)/A1 × 100% = 2.42%. All amplitude values subtract the static still-water baseline before percentage calculation to exclude the offset of the hydrostatic water level. The maximum local growth rate of 2.42% occurs between points 1 (1.37) and 2 (1.40). This indicates that the 1 mm particles first impact the water and excite the surge, but the leading wave height requires a finite time (t = 0.48 s) to reach its peak, with the growth rate increasing gradually along the propagation direction and peaking at point 1.
Beyond point 3, the wave height decays along the path, with the decay rate decreasing as the propagation distance increases. The surge run-up and recession cycle exhibits a clear downstream delay, and its total duration correlates positively with travel distance. This attenuation is primarily driven by boundary friction and internal viscous dissipation, which reduce the equivalent water depth and consequently decrease the wave celerity (e.g.,
). Fine particles possess larger specific surface area and produce stronger fluid–particle drag interaction (Equation (11)), which realizes sufficient interphase momentum exchange within a short particle–water contact duration. As shown in the velocity contours in
Figure 9, fine particles form a more widespread high-velocity flow field during impact, transferring more kinetic energy to the free surface and yielding higher near-field peak surge amplitude relative to coarse-grained sliding masses. As the surge propagates downstream, continuous energy dissipation via channel wall friction and internal fluid shear gradually counteracts the granular impact energy input, leading to steady wave attenuation along the propagation path.
5. Conclusions
The model investigated in this study reproduces granular column collapse experiments with a relative error below 5%. Particle size segregation significantly controls deposit morphology: larger particles migrate preferentially along the flow direction, while fine particles fill vertical interstices, resulting in a strong linear correlation between the dimensionless deposit parameters and the front Froude number. Fine particles (r = 1 mm) dominate leading wave formation through efficient momentum transfer, yielding an overall wave height growth of 5.22% and a maximum local growth rate of 2.42% between monitoring points 1 and 2. With increasing still-water depth, the surge transitions from a strongly nonlinear, high-amplitude shallow-water wave toward a more linear, longer-wavelength, smaller-amplitude deep-water feature, accompanied by delayed peak arrival and prolonged wave height recession.
The adopted numerical scheme relies on simplified physical treatments that constrain direct extrapolation to field-scale events. Spherical particle geometry omits intergranular interlocking from angular natural sediments, while contact calculations exclude cohesive bonding originating from silty-clay matrices within colluvial deposits. All simulations were performed within laboratory geometric bounds, introducing scale-dependent deviations when translating derived correlations to full-scale reservoir bank slopes; moreover, air entrainment effects during intense granular–water impact are also not adequately addressed by the present multiphase solver.
The derived quantitative relations deliver actionable support for reservoir landslide hazard evaluation. Stratification-dependent surge scaling and particle segregation patterns enable preliminary risk classification for colluvial slope catchments, while predicted deposit extents inform targeted deployment of shoreline mitigation infrastructure. The dominant wave amplification zone identified between the initial and secondary monitoring stations further provides practical guidance for field surge sensor placement.
Future extensions of this work will incorporate bespoke small-scale physical tests with layered granular assemblies to refine contact parameter calibration, alongside cohesive contact formulations that reproduce natural fine-grained landslide compositions. Multi-variable sensitivity assessments will quantify the relative influence of particle friction, slide thickness, and incline angle on surge magnitude, and subsequent simulations will integrate irregular three-dimensional bank topography to replicate complex real-world wave propagation pathways.



 ,
,