Article

Practitioner-Informed AI Decision Support for Maritime Accident-Type Risk in Korean Waters

1
Pangyo Headquarters AX Center, Suresoft Technologies Inc., Seongnam 13453, Republic of Korea
2
Maritime Digital Transformation Research Center, Korea Research Institute of Ships & Ocean Engineering, Daejeon 34103, Republic of Korea
3
DA Research Lab, SureDataLab Inc., Daejeon 34050, Republic of Korea
*
Author to whom correspondence should be addressed.
J. Mar. Sci. Eng. 2026, 14(15), 1443; https://doi.org/10.3390/jmse14151443
Submission received: 8 July 2026 / Revised: 31 July 2026 / Accepted: 4 August 2026 / Published: 6 August 2026
(This article belongs to the Section Ocean Engineering)

Abstract

In maritime accident prevention, it is important to identify not only high-risk sea areas but also which accident-types are most likely to occur there. This study combines survey responses from 826 Korea Coast Guard practitioners with 3856 maritime accidents mapped onto an H3 grid over Korean territorial waters during 2021–2023, and proposes a practitioner-informed framework for predicting accident-type-specific risk. The survey showed limited use of quantitative, standardized accident risk criteria but high demand for AI-based prediction and area-level risk analysis. Practitioners’ perceived accident frequency differed substantially from the empirical accident distribution, whereas their prevention priorities aligned more closely with the actual pattern. Accordingly, this study treats the accident-type taxonomy not as a fixed prediction target but as a design variable of the label space for decision support. A two-stage framework first estimates accident occurrence at the H3 grid-time level and then classifies the accident-type conditional on occurrence. Comparing survey-aligned, data-aligned, union, sufficient-sample, and full administrative (7-class) framings under a common training protocol shows that accident-type organization creates trade-offs among field interpretability, coverage, class granularity, and predictive stability. The study thus reframes maritime accident prediction as an accident-type-specific decision-support problem-linking practitioner perception with empirical evidence.

1. Introduction

The territorial waters of Korea, surrounded by sea on three sides and characterized by complex coastal topography with numerous islands, narrow channels, reefs, and aquaculture farms, constitute a high-risk zone of maritime activity in which fishing vessels, merchant ships, passenger ships, and leisure boats operate together. Combined with large tidal ranges and the variability of meteorological and sea-state conditions, navigational risk increases, and approximately 3000 maritime accidents occur each year [1]. Major accident-types such as collision, grounding, drift entanglement (i.e., a vessel’s propeller or rudder becoming entangled with floating objects such as ropes or fishing nets), flooding, capsizing, sinking, and contact not only cause loss of life and property but are also directly linked to the Coast Guard’s preventive activities, patrols, rescue operations, and allocation of response resources. In particular, maritime accidents are influenced not only by physical factors such as meteorological and sea-state conditions or vessel density, but also by human and operational factors such as on-site judgment, risk perception, and prevention priorities [2,3]. A system for predicting maritime accident risk therefore needs to go beyond merely estimating the probability of accident occurrence and to consider which accident-type operators actually perceive as important and respond to them.
In the field of maritime safety, machine-learning-based accident risk prediction research has recently expanded rapidly [4]. Some prior studies on Korean territorial waters have focused on predicting accident occurrence at the port- or grid-level, and some have also examined accident-type-specific risk. However, studies that link the mismatch between practitioners’ survey-derived accident-type perceptions and the empirical accident distribution, and extend this into a grid-time accident-type-specific risk estimation system for operational decision support, remain scarce. Identifying sea areas with a high probability of accidents is important, but actual prevention activities also require understanding which accident-types carry the highest risk. For example, areas with high collision risk require vessel-traffic monitoring and navigation management; areas with high grounding risk require inspection of reef, depth, and channel conditions; and areas with high drift entanglement risk require preventive activities around aquaculture farms, fishing gear, and floating obstacles. Because the prevention strategies and resource allocation required differ by accident-type, it is necessary to observe accident-factor information—such as meteorological and sea-state conditions, vessel density, and coastal topography—at the area level and to convert it into accident-type-specific risk.
Another important gap is the lack of quantitative examination of how closely the accident-types that frontline practitioners perceive as frequent match the accident-type distribution observed in the actual accident data. In this study, Korea Coast Guard (KCG) frontline practitioners are defined to include not only vessel-based personnel but also shore-based operational personnel such as those at coastal substations, situation rooms, and administrative offices. Field experience and intuition play important roles in maritime accident prevention, but when certain accident-types are repeatedly experienced or impose a heavy on-site workload, a risk perception that differs from the actual accident distribution may form. Accordingly, in this study, the survey data are used not as a simple background survey but as key evidence to quantify the mismatch between on-site accident perception and the actual accident distribution, and to connect this to the need for an accident-type-specific risk prediction framework. The machine-learning models are then used as empirical tools to verify whether, based on this mismatch, accident-type-specific risk signals can be provided at the grid-level.
To address these gaps, this study combines a quantitative survey of 826 frontline practitioners affiliated with the five Regional Headquarters of the Korea Coast Guard (West Sea, Central, East Sea, South Sea, and Jeju) with 3856 maritime accident records based on the hexagonal hierarchical geospatial indexing system (H3) grid over Korean territorial waters during 2021–2023. The survey data are used to characterize the participating practitioners’ accident perceptions, prevention priorities, information needs, and system acceptance, while the accident data are used for the empirical distribution of actual accident-types and for building type-specific prediction models. The H3 grid serves as the analytical basis for combining accident records, meteorological and oceanographic conditions, vessel density, and spatial risk factors within the same spatial unit [5]. Based on these two data sources, this study quantifies the discrepancy between the accident-type categories presented in the survey and the empirical distribution of the actual accident data, and compares how survey-aligned and data-aligned accident-type category framings affect prediction performance and operational interpretation. In particular, it analyzes whether perceived accident frequency and operational prevention priority show different alignment patterns relative to the actual accident distribution, and connects this to an H3 grid-time accident-type-specific risk prediction framework.
The contribution of this study lies less in proposing a new algorithm and more in the framing of the prediction problem and the comparison of accident-type label spaces. The main contributions of this study are as follows.
Using a survey of 826 Korea Coast Guard practitioners, it quantitatively documents a consistent misalignment within the participating sample among accident perception, prevention priorities, and information-use needs.
It confirms that the participating practitioners’ operational prevention priority shows a different alignment pattern from their perceived accident frequency, and argues that an AI framework should complement on-site perception through data-driven accident-type risk information rather than replace on-site judgment.
Based on this mismatch, it implements an H3 grid- and accident-type-specific decision-support framework, and compares the prediction performance and operational interpretability of survey-aligned and data-aligned accident-type compositions.
This study addresses four research questions. RQ1: To what extent do frontline practitioners operate with quantitative, standardized accident risk criteria and integrated information tools? RQ2: How closely do practitioners’ perceived accident frequency and operational prevention priority align with the empirical 2021–2023 accident distribution? RQ3: How can the accident-type categories identified in the survey be mapped onto accident-type framings for a practitioner-informed label space? RQ4: What trade-offs in accident coverage, predictive stability, and operational interpretability arise across accident-type framings in the two-stage H3 grid-time framework?
This paper is organized as follows. Section 2 reviews prior work on maritime accident prediction, multi-class accident-type prediction, and stakeholder-informed AI design, and on this basis presents the distinctiveness and significance of this study. Section 3 describes the survey data, accident data, H3 grid-based feature engineering, two-stage model design, and evaluation methods. Section 4 presents the survey-based misalignment analysis and the performance-evaluation results of the accident-type prediction framework. Section 5 discusses the operational and academic implications and limitations of this study, and Section 6 presents the conclusions.

2. Related Works

2.1. Operational Maritime Accident Risk Prediction

Research on predicting maritime accident risk using observational information available at the operational stage has developed mainly around accident occurrence probability, specific accident risks, or spatiotemporal risk assessment. Nourmohammadi et al. [6] proposed a grid-level deep spatiotemporal model (DSTOAP) for Korean territorial waters, integrating accident records, sea-state conditions, seabed topography, and vessel activity to predict maritime accident risk at the grid-time level. That study addresses grid-based maritime accident risk prediction for Korean territorial waters and also examined accident-type-specific risk.
Shin and Yang [7] combined maritime accident reports from Busan Port with Vessel-Traffic Service (VTS) data to predict the probability of accidents and near-misses, and compared the performance of several machine-learning models, including XGBoost, Random Forest, Neural Network, and SVM. Jo et al. [8] assessed collision risk in Korean coastal waters in the form of risk-level classification using a CNN and Grad-CAM, while Korupoju et al. [9] assessed vessel collision risk by combining Automatic Identification System (AIS) and meteorological data with fuzzy logic and deep learning. These studies demonstrated the feasibility of predicting maritime accident risk using operational-stage data and machine learning, but they focused mainly on accident occurrence probability, the risk level of specific sea areas, or the assessment of a specific accident risk such as collision.

2.2. Multi-Class Accident-Type Prediction in International Contexts

Multi-class accident-type prediction research has been conducted mainly on overseas accident data, particularly from Norway and China. Munim et al. [10] used long-term Norwegian maritime accident records to perform AutoML-based multi-class classification for five major accident-types—grounding, contact damage, fire or explosion, collision, and heavy weather damage—and reported that, among 29 ML algorithms, Light Gradient Boosted Trees achieved the best performance. Brandt et al. [11] combined 51 weather-related variables with Norwegian Maritime Authority accident data and showed that meteorological information can contribute to improving the performance of maritime accident risk prediction. Zhang et al. [12] combined XGBoost with SHAP, based on features extracted and expanded from accident reports in Zhejiang Province, China, to perform accident-type classification and interpretability analysis. Zhao et al. [13] combined BERT, BiLSTM, and the Apriori association-rule algorithm to propose a cause-analysis framework for marine traffic accidents on China’s coasts, and Feng et al. [14] used improved ML approaches to predict the severity of maritime accidents. Balas and Balas [15] proposed a hybrid maritime risk-assessment model combining AutoML, deep learning, hydrodynamic modeling, and Monte Carlo simulation. These studies are important in that they expanded the scope of maritime accident analysis to include accident-type classification, accident-cause analysis, and accident-severity prediction. However, most focus on per-accident analysis at the level of compiled accident records or accident reports after an accident has occurred, and the accident-type schemes they use are also based on the accident data and taxonomy of each country.
Internationally, marine casualties are reported under a small number of standardized accident categories. The harmonized reporting procedures of the IMO [16] classify a casualty event as collision, grounding, contact, fire/explosion, hull failure, loss of control, ship/equipment damage, capsize/listing, flooding/foundering, or one of a few further categories, and the EMCIP taxonomy maintained by EMSA [17] uses a closely corresponding set. Recent international studies adopt the same vocabulary: Jiang et al. [18] quantify risk-influencing factors across a global accident database using collision, grounding, contact, fire or explosion, hull damage, machinery damage and foundering as accident categories, and Cao et al. [19] model accident severity treating the accident-type itself as a principal explanatory feature. This study adopts the same terminology for the accident-types it shares with these frameworks: collision, contact, grounding and capsizing are used in the sense defined there and are referred to by those names consistently throughout the manuscript.
Two points of difference remain. First, both category sets treat flooding and foundering as a single casualty-event category—in the IMO list they are sub-values of one flooding/foundering entry—whereas the administrative taxonomy of the Korea Maritime Safety Tribunal records flooding and sinking as two separate accident-types. This study follows the administrative taxonomy and retains them as distinct classes, because the two correspond to different stages of accident progression and therefore to different preventive responses. Second, drift entanglement, in which a vessel’s propeller or rudder becomes entangled with floating ropes, nets or other debris, has no counterpart in either category set, where such occurrences are absorbed into broader equipment- or control-related categories. It is nevertheless a frequent and separately recorded accident-type in Korean waters: Lee et al. [20] report approximately 2439 entanglement accidents associated with navigational obstacles between 2017 and 2023, an average of 348.4 per year. Drift entanglement is therefore retained as a region-specific operational category and is referred to by that name consistently throughout this study.

2.3. Practitioner Perspectives and Human Factors in Maritime Safety

The importance of human and operational factors in maritime accidents has long been emphasized. Hetherington et al. [2] comprehensively reviewed the human factors in maritime safety and showed that human and organizational factors such as fatigue, communication, decision-making, and safety culture are closely associated with maritime accidents. Akhtar and Utne [3] used a Bayesian Network to model the effect of navigational watchkeepers’ fatigue on the risk of vessel grounding, and Hassel et al. [21] analyzed the problem of underreporting in maritime accident databases and pointed out the uncertainty that accident-data-based research may carry. These studies show that maritime safety analysis must consider not only accident data but also on-site operational conditions and human factors.
Meanwhile, in other high-stakes decision-making fields such as healthcare, there has been active discussion that, for an AI-based decision-support system to be applied in practice, it must consider user needs, workflows, explainability, operational acceptability, and continuous monitoring [22,23,24,25]. This suggests that what matters is not only the predictive performance of the model but also how the model output is interpreted and used in the context of on-site decision-making. However, in maritime safety AI, cases in which such a stakeholder-informed perspective is explicitly combined with accident-type-specific risk prediction are still lacking.
Although prior work has advanced maritime accident risk prediction and accident-type classification in various ways, studies that directly connect the actual accident distribution and frontline practitioners’ accident perception and prevention priorities to an accident-type-specific risk prediction framework are limited. This study combines a KCG practitioner survey with accident data for Korean territorial waters to propose a practitioner-informed accident-type risk prediction framework at the H3 grid-time level. The differences in problem setting between this study and major prior studies are summarized in Table 1.

3. Materials and Methods

This section describes data construction, analysis procedures, and evaluation methods, focusing on the distinct roles of the survey data and the accident data, accident-type framing, and the two-stage framework.

3.1. Overall Study Design

This study follows a multi-source quantitative design that combines survey data with integrated accident–environment data. The primary data are a 17-item quantitative survey of frontline personnel affiliated with the five Regional Headquarters of the Korea Coast Guard (KCG) (West Sea, Central, East Sea, South Sea, and Jeju). The secondary data are integrated accident–environment data constructed by partitioning Korean territorial waters into an H3 grid for 2021–2023, consisting of 3856 accident rows together with environmental, vessel density, and spatial features observable at the operational stage.
In this study, the Three-Gap Framework refers to three discrepancies or deficiencies that arise in maritime accident risk management. The operational gap denotes the problem that quantitative, standardized criteria for judging accident risk are not sufficiently shared among the participating practitioners; the cognitive gap denotes the problem that the participating practitioners’ perception of accident frequency and prevention focus are not fully aligned with the actual accident distribution; and the information integration gap denotes the lack of decision-support information that integrates meteorological conditions, vessel activity, accident history, and spatial risk factors and provides them by sea area and accident-type.
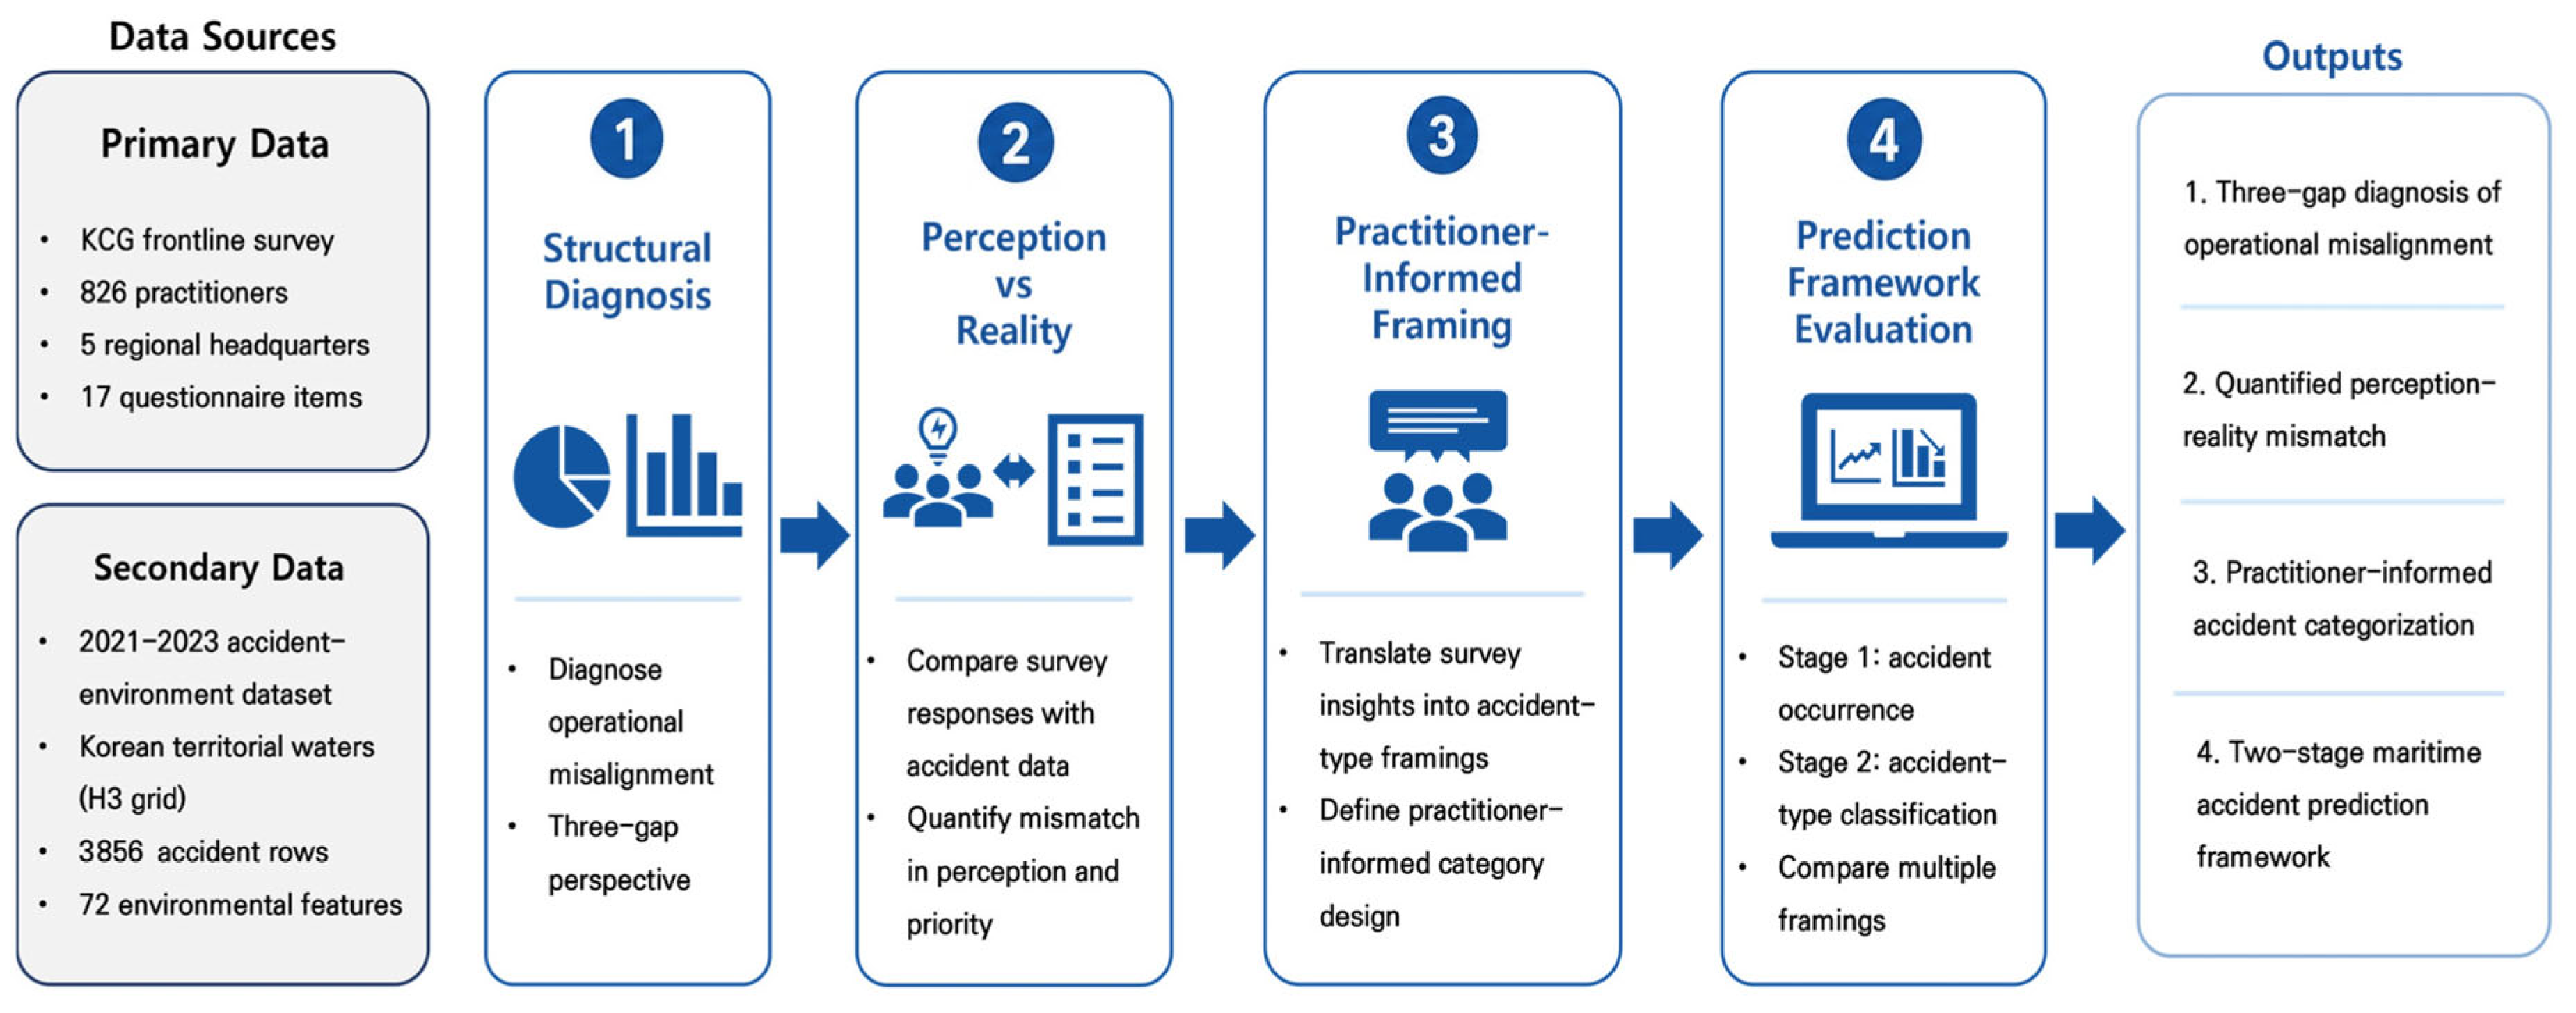
The result analysis was conducted in four stages. First, using the survey responses, the study quantitatively documented a consistent misalignment within the participating sample that manifests as a lack of quantitative risk judgment criteria, a discrepancy between on-site perception and the actual accident distribution, and the absence of information integration tools (RQ1). Second, by comparing the survey responses with the 2021–2023 historical accident baseline, the study evaluated how closely perceived accident frequency and operational prevention priority align with the actual accident distribution (RQ2). Third, the accident-type perceptions and prevention focus identified in the survey were mapped onto accident-type categorization framings to construct a practitioner-informed model design (RQ3). Fourth, a two-stage framework at the H3 grid-time row level was implemented, and through Stage 1 binary accident risk estimation and Stage 2 multi-class accident-type classification, the study evaluated the trade-offs in coverage, predictive stability, and operational interpretability across accident-type framings (RQ4). The overall analytical workflow of this study is summarized in Figure 1.

3.2. Practitioner Survey

3.2.1. Participants and Data Collection

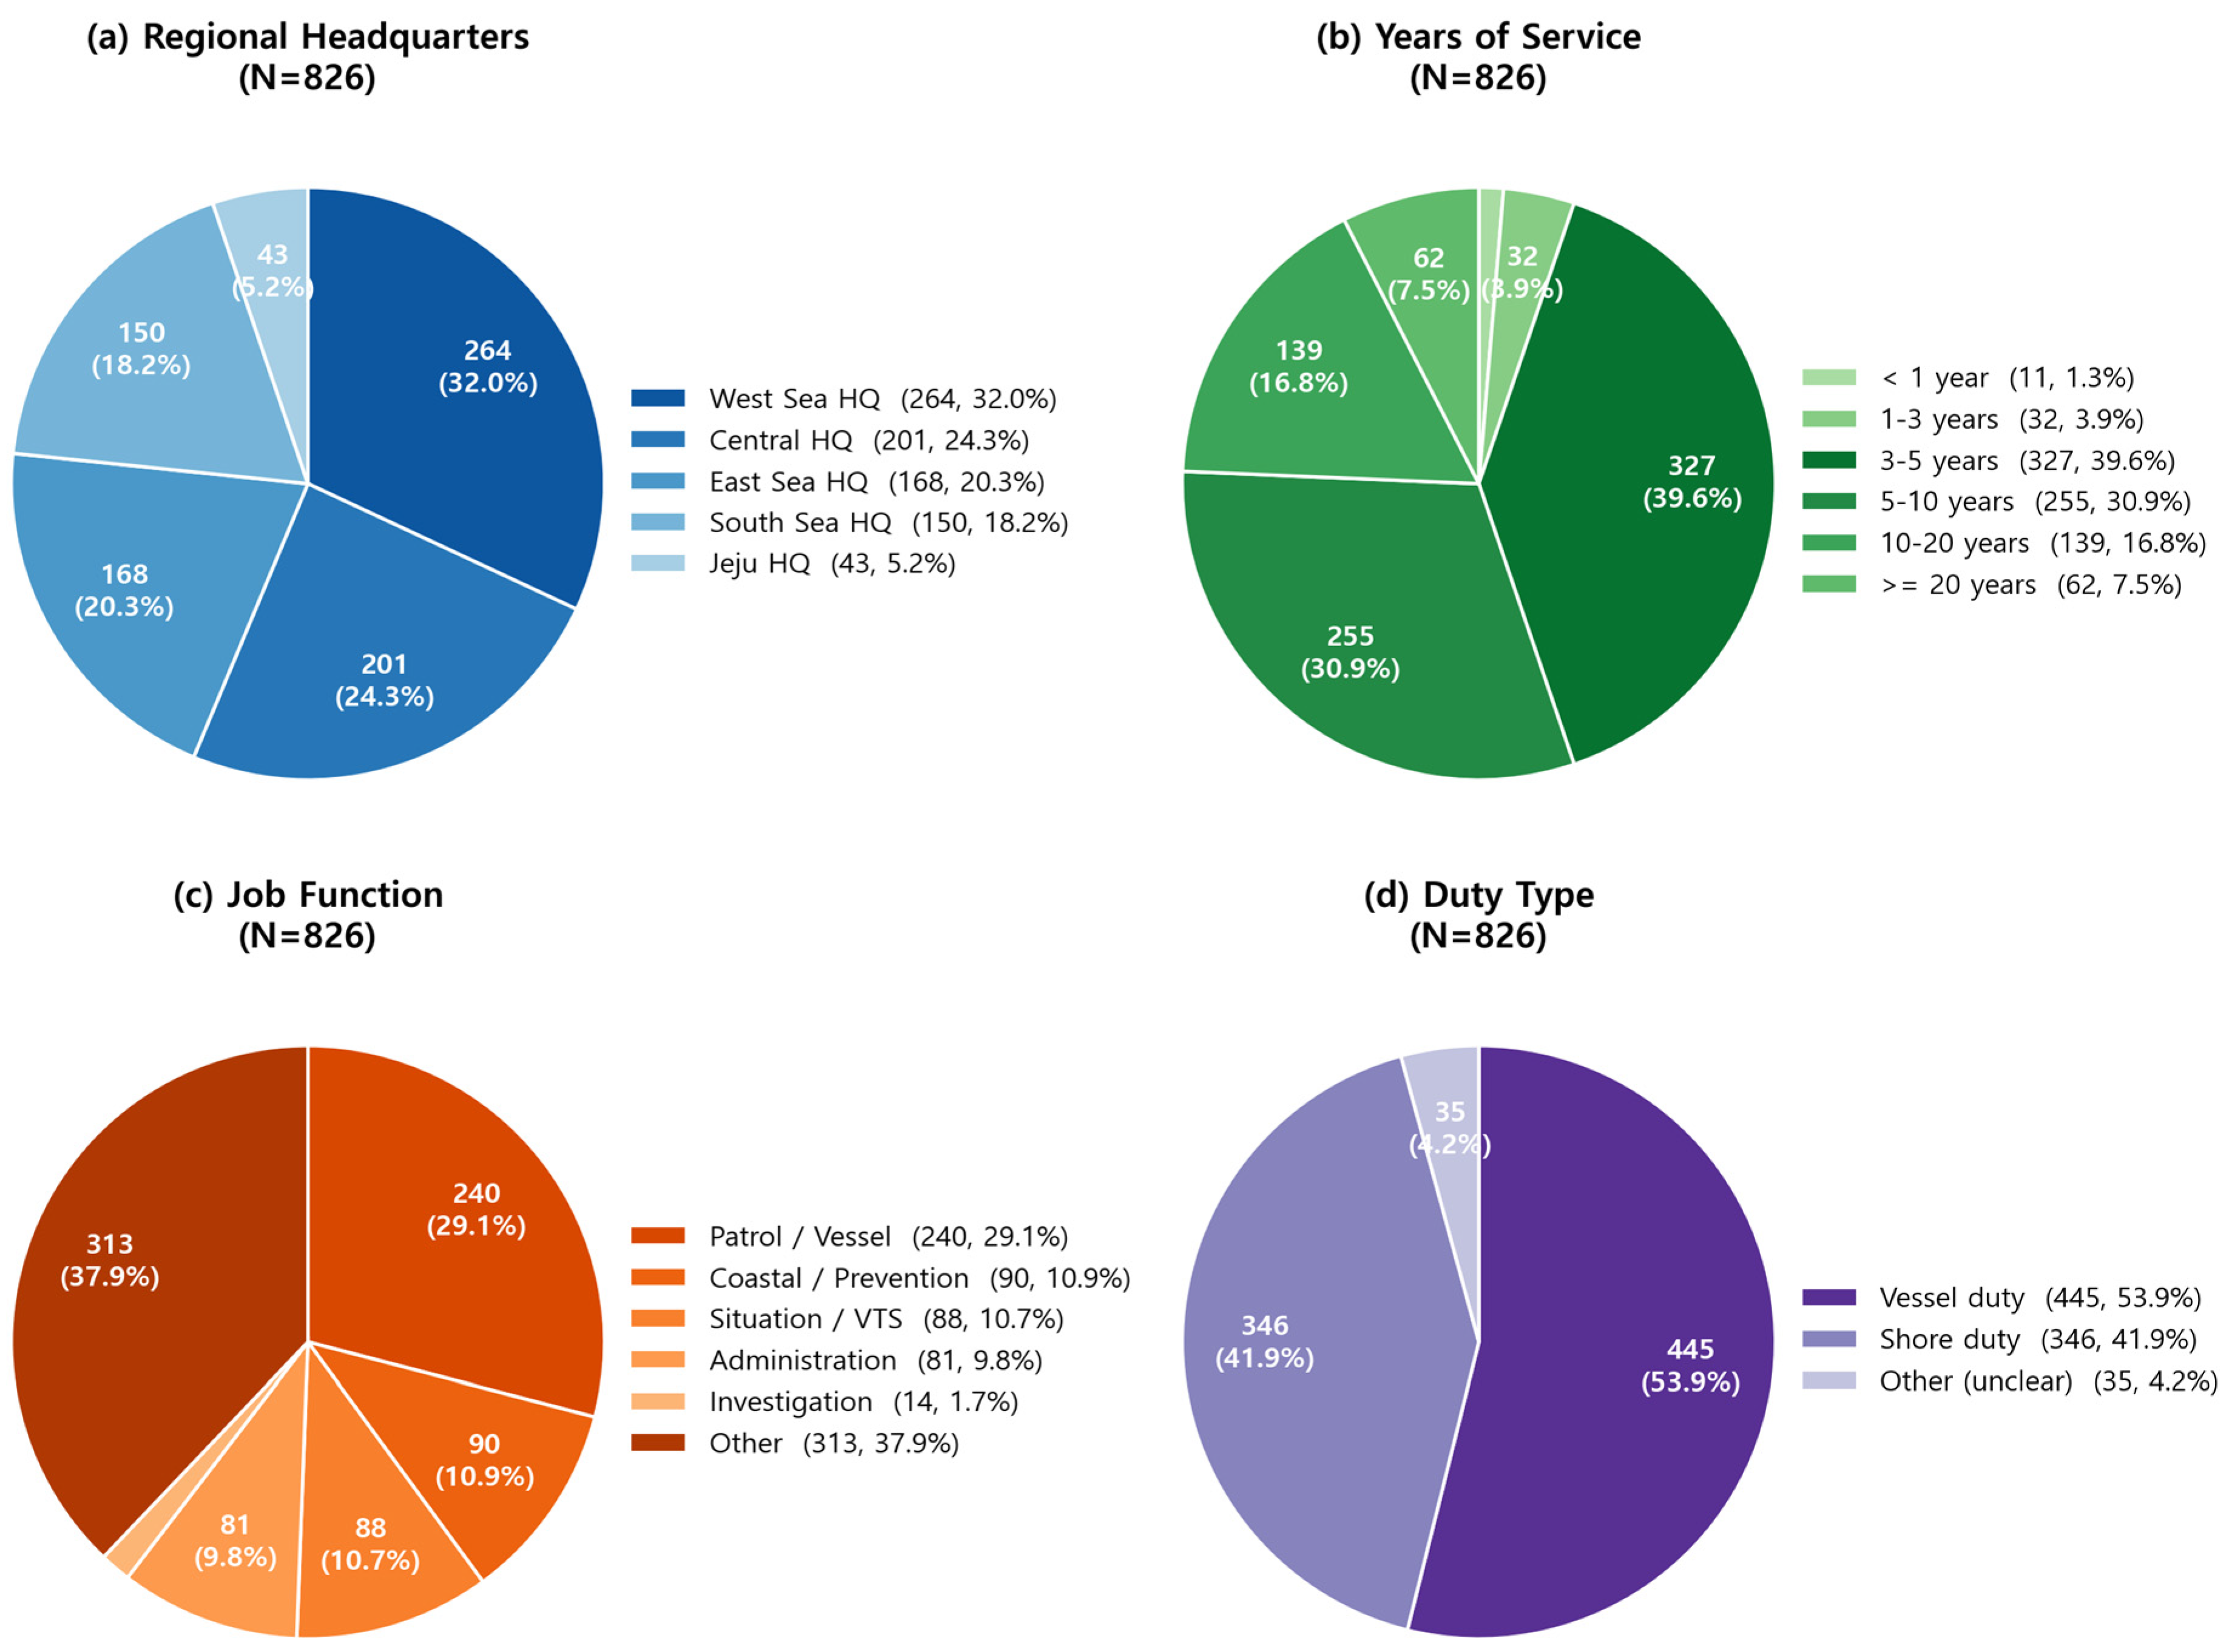
The survey targets of this study were personnel of frontline departments under the five Regional Headquarters of the KCG. About 54% of the final respondents were vessel-based personnel and about 42% were shore-based personnel at coastal substations, situation rooms, and similar units; thus, most of the sample corresponds to frontline operational personnel were involved in maritime accident prevention and response.
The survey was conducted by requesting, through the cooperation of KCG Headquarters, that the relevant frontline departments under the five Regional Headquarters complete the questionnaire. No random sampling was performed, and neither the total number of personnel per department nor the number of distributed questionnaires was recorded. A formal response rate was therefore not calculated, and the results are interpreted not as probability-sample-based representative estimates for the entire KCG workforce, but as practitioner-informed evidence from the 826 respondents who participated in this survey. The survey was conducted on paper from 28 October to 14 November 2025. Of the 828 returned responses, two with missing key items were excluded, and a total of N = 826 were used in the final analysis.
This survey was conducted as an anonymous, de-identified, job-related field needs assessment in accordance with the institutional cooperation procedures of the Korea Coast Guard, with the aim of identifying practical requirements for developing a maritime accident risk prediction and decision-support framework. The response sheets were designed so as not to directly collect personally identifiable or sensitive information, and the research team received and analyzed only de-identified response data. All results were reported only at the aggregate level. As this survey was an anonymous, de-identified, job-related opinion survey that did not involve interventional research or individual evaluation, prior Institutional Review Board (IRB) review was not conducted.
Because the total number of personnel per surveyed department was not recorded, Figure 2 summarizes the composition of the 826 final valid respondents rather than the coverage relative to the population.

3.2.2. Survey Instrument

The survey consisted of 17 items spanning four categories. Of these, this study used the 10 core items that are directly linked to the quantitative analysis and the research questions. The 10 core items used in the quantitative analysis are summarized in Table 2, and the full 17-item questionnaire (Korean original with English translation) is provided in Appendix A.
The survey items were designed to measure the three gaps defined in Section 3.1. Q5, Q12, and Q13 diagnose how quantified and standardized maritime accident risk judgment is among the participating practitioners, and were used as evidence quantitatively demonstrating the operational gap—that is, the lack of accident risk judgment criteria and information integration systems. Q7-1 and Q10 are the key items measuring perceived accident frequency and operational prevention priority, respectively, and were used to analyze the cognitive gap and prevention-focus alignment by comparing the survey responses with the distribution of the actual accident data. Q15–Q17 were used as information-need and system-acceptance items to identify the form in which accident risk prediction information should be provided to the participating practitioners.
Q7-1 and Q10 reach the model only through the definition of the label space: the three accident-types offered as explicit options in these two items form the class set of the survey-aligned framing (Exp A) in Section 3.4.3. No individual survey response is used as a model input.
Because the two key comparison variables, Q7-1 and Q10, used the same single-response options—① collision, ② grounding/stranding, ③ drift entanglement, and ④ other—the comparison between these items and the accident data is interpreted not as a direct comparison with the full seven-class administrative accident taxonomy, but as a comparison based on the survey-presented accident categories. Accident-types not directly presented as survey options, such as flooding, capsizing, sinking, and contact, could be entered through the ‘other’ option, and the free text ‘other’ responses were examined as supplementary data to check for possible option-presentation limitations. The categories pre-presented in Q7-1/Q10 were selected as operationally important accident-types during the design of the KCG field needs survey.

3.2.3. Survey Analysis Methods

Handling of multiple responses—because Q7-1 and Q10 are single-choice questions, responses that selected multiple options were treated as missing (no response) for that item only and excluded from the analysis. This is an item-level missing-data treatment; for a respondent who selected multiple options in Q7-1 but a single option in Q10, the Q10 response is still included in the analysis. The valid responses used were N = 788 for Q7-1 and N = 763 for Q10, and the within-respondent agreement (Cohen’s κ) between the two variables was calculated only for the N = 741 respondents who gave a single response to both items.
Survey response proportions were summarized together with 95% confidence intervals obtained through 5000 bootstrap resamples. The agreement between the survey response distribution and the actual accident distribution was evaluated using a chi-square goodness-of-fit test and Cohen’s w effect size, and differences in the Q7-1 and Q10 response distributions by respondent characteristics (region, job type, experience) were tested using chi-square independence tests. The within-respondent agreement between Q7-1 (perceived accident frequency) and Q10 (operational prevention priority) was evaluated using Cohen’s κ.
Given that the sample size (N = 826) is relatively large, this study interpreted the results centering on the magnitude and direction of substantive effects rather than on the p-value itself. Specifically, it jointly considered percentage-point differences, bootstrap 95% confidence intervals, effect sizes such as Cohen’s w and Cramér’s V, directional consistency under both row-level and incident-level accident-distribution criteria, and directional consistency across subgroup analyses. The comparison between the survey response distribution and the actual accident distribution was performed against the pooled 2021–2023 historical accident baseline defined in Section 3.3.1.

3.3. Maritime Accident Data and Feature Engineering

3.3.1. Data Sources and Spatiotemporal Coverage

The maritime accident records used were the official accident data of the Korea Maritime Safety Tribunal (KMST) (1 January 2021 to 31 December 2023, three years in total). These data cover accidents that occurred within Korean territorial waters (territorial waters as defined by the Territorial Sea and Contiguous Zone Act) and include variables such as accident location (latitude and longitude), time of occurrence, and accident-type (seven administrative classes: collision, contact, grounding, capsizing, sinking, flooding, and drift entanglement). The distribution of accident-types for 2021–2023 is presented in Table 3.
Because the survey for this study was conducted in 2025 while the accident data cover 2021–2023, the survey–accident data comparison is interpreted not as same-year validation but as an alignment analysis with the most recent three-year historical accident baseline. To check whether using the pooled 2021–2023 accident distribution as the baseline relies excessively on any particular year, the annual accident-type distribution was first examined (Table 3). A Year × Accident-type chi-square independence test showed that the differences in annual distribution were statistically significant (χ2 = 24.92, df = 12, p = 0.0152), but the effect size was very small (Cramér’s V = 0.0568). This study therefore used the pooled 2021–2023 distribution as the empirical historical baseline representing the accident-type structure over the most recent three years.
Meteorological and oceanographic variables were collected through the public meteorological API provided by the Korea Meteorological Administration (KMA) and the public data of the Korea Hydrographic and Oceanographic Agency (KHOA) [26]. Vessel activity data were obtained by aggregating, at the time- and grid-cell-level, the AIS-based vessel activity information provided by the General Information Center on Maritime Safety and Security (GICOMS) operated by the Ministry of Oceans and Fisheries [27]. Static spatial variables (distance to ports, bridges, buoys, aquaculture farms, anchorages, and reefs; water depth) were obtained from spatial data of the Ministry of Oceans and Fisheries. Vessel activity volume was aggregated at the time- and grid-cell-level from the vessel activity records.
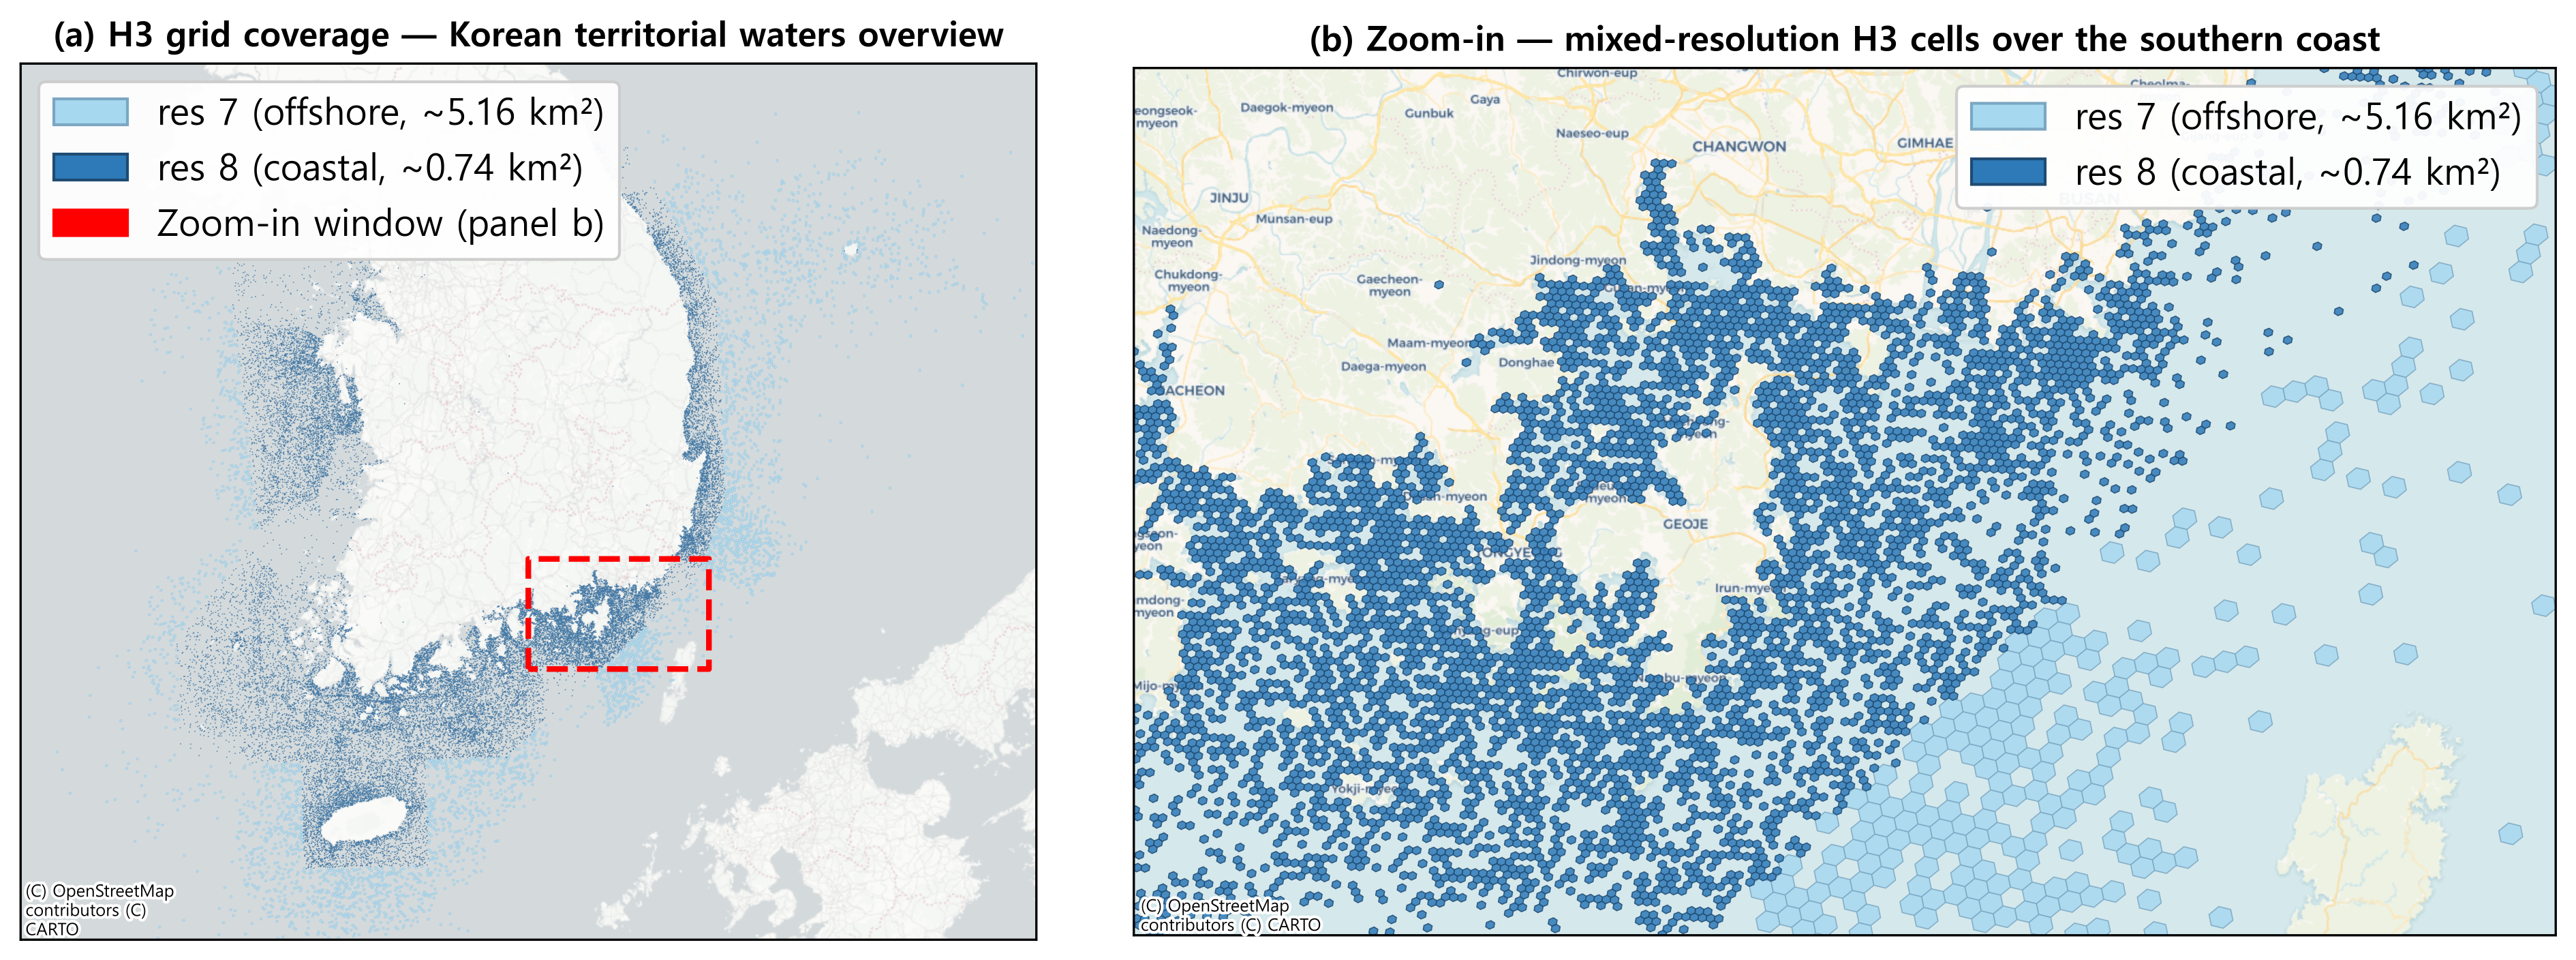
The spatial unit of analysis is the H3 [5] grid. H3 assigns each cell a unique hierarchical index, which makes it easy to combine, aggregate, and retrieve heterogeneous data such as accidents, weather, vessel density, and spatial factors within the same spatial unit; because the cells are hexagonal, the distances to all six neighboring cells are uniform, so area and shape distortion is smaller than with a rectangular latitude–longitude grid; and the resolution can be adjusted hierarchically, allowing everything from wide sea areas to port-level areas to be handled within the same system. Using this hierarchical structure, and to spatially reflect the difference between the high activity and accident density of the coast and the low density of the open sea in Korean territorial waters, this study applied H3 resolution 8 (cell area ≈ 0.74 km2) to coastal areas and resolution 7 (cell area ≈ 5.16 km2) to the open sea. This mixed-resolution design mitigates data sparsity in the open sea while preserving the hexagonal shape and hierarchical relationships of H3, and is therefore used as a natural unit for the spatially contiguous block cross-validation (Section 3.4.6). The coverage and a visual example of the mixed-resolution structure are presented in Figure 3.
The coastal and open-sea areas are not defined ad hoc. They follow the sea-area classification of the Korean marine environmental standards, which divides the waters around the Korean peninsula into ten areas—five designated as coastal and five as open sea—each delimited by a listed set of boundary coordinates. Areas designated as open sea were assigned resolution 7 and the remaining areas resolution 8. Land was removed using the 2025 national coastline layer, the coastal grid was taken as the intersection of the coastal areas with the resulting sea surface, and the open-sea grid as the remainder. Resolution-8 cells were then generated over the whole sea surface and resolution-7 cells over the open-sea surface, and every resolution-8 child of a selected resolution-7 cell was removed from the coastal set. The grid therefore contains 330,481 cells at resolution 8 and 66,164 cells at resolution 7, of which 27,054 and 5439 respectively carry observed vessel activity and enter the dataset. Because the children of the selected resolution-7 cells are excluded from the resolution-8 set by construction, no location is covered by cells of both resolutions: the intersection between the resolution-8 coastal set and the 463,148 resolution-8 children of the resolution-7 cells is empty, and no coastal cell has a resolution-7 parent that belongs to the open-sea set. Exposure variables are therefore accumulated once per location, and no area is counted at both resolutions.

3.3.2. H3 Grid Mapping and Stage 1 Dataset Construction

Each accident record was mapped to the corresponding H3 cell and time bucket based on its location and time of occurrence, and defined as an accident row (positive sample) of the form (h3_cell, occurred_at, accident_type). Non-accident rows (negative samples) were constructed by random sampling from (h3_cell, time bucket) combinations in which vessel activity was observed during the same period but no accident was recorded. This procedure prevents trivial negative samples, in which no vessel is present, from being included in model training.
The final Stage 1 dataset comprised 42,416 rows in total, consisting of 3856 accident rows and 38,560 non-accident rows. The non-accident rows were sampled to be ten times the number of accident rows. Whether the training partition should be undersampled further was examined with eight settings (1:1 to 8:1, and the 10:1 design retained without further undersampling) and five random seeds each, compared on the validation partition; the validation and test partitions were always kept at the 10:1 distribution (Appendix D, Table A9). Settings from 4:1 to the retained 10:1 design are statistically indistinguishable. No further undersampling was applied, since within that equivalent set it is the only setting that discards none of the available training data. The train, validation, and test splits were constructed by year, set to 14,385 rows for 2021, 14,069 rows for 2022, and 13,962 rows for 2023.
Because collision inherently involves two or more vessels, verification based on maritime accident record numbers confirmed that 98.49% of collision incidents were multi-vessel. By contrast, the multi-vessel proportion of the remaining accident-types was below 7%, corresponding mostly to single-vessel incidents. In the model training pipeline, this study retained each multi-vessel sub-event—that is, the record of one vessel involved in a single incident—as an independent training sample. Accordingly, the perception–reality comparison reports both row-level and incident-level normalization.

3.3.3. Feature Engineering

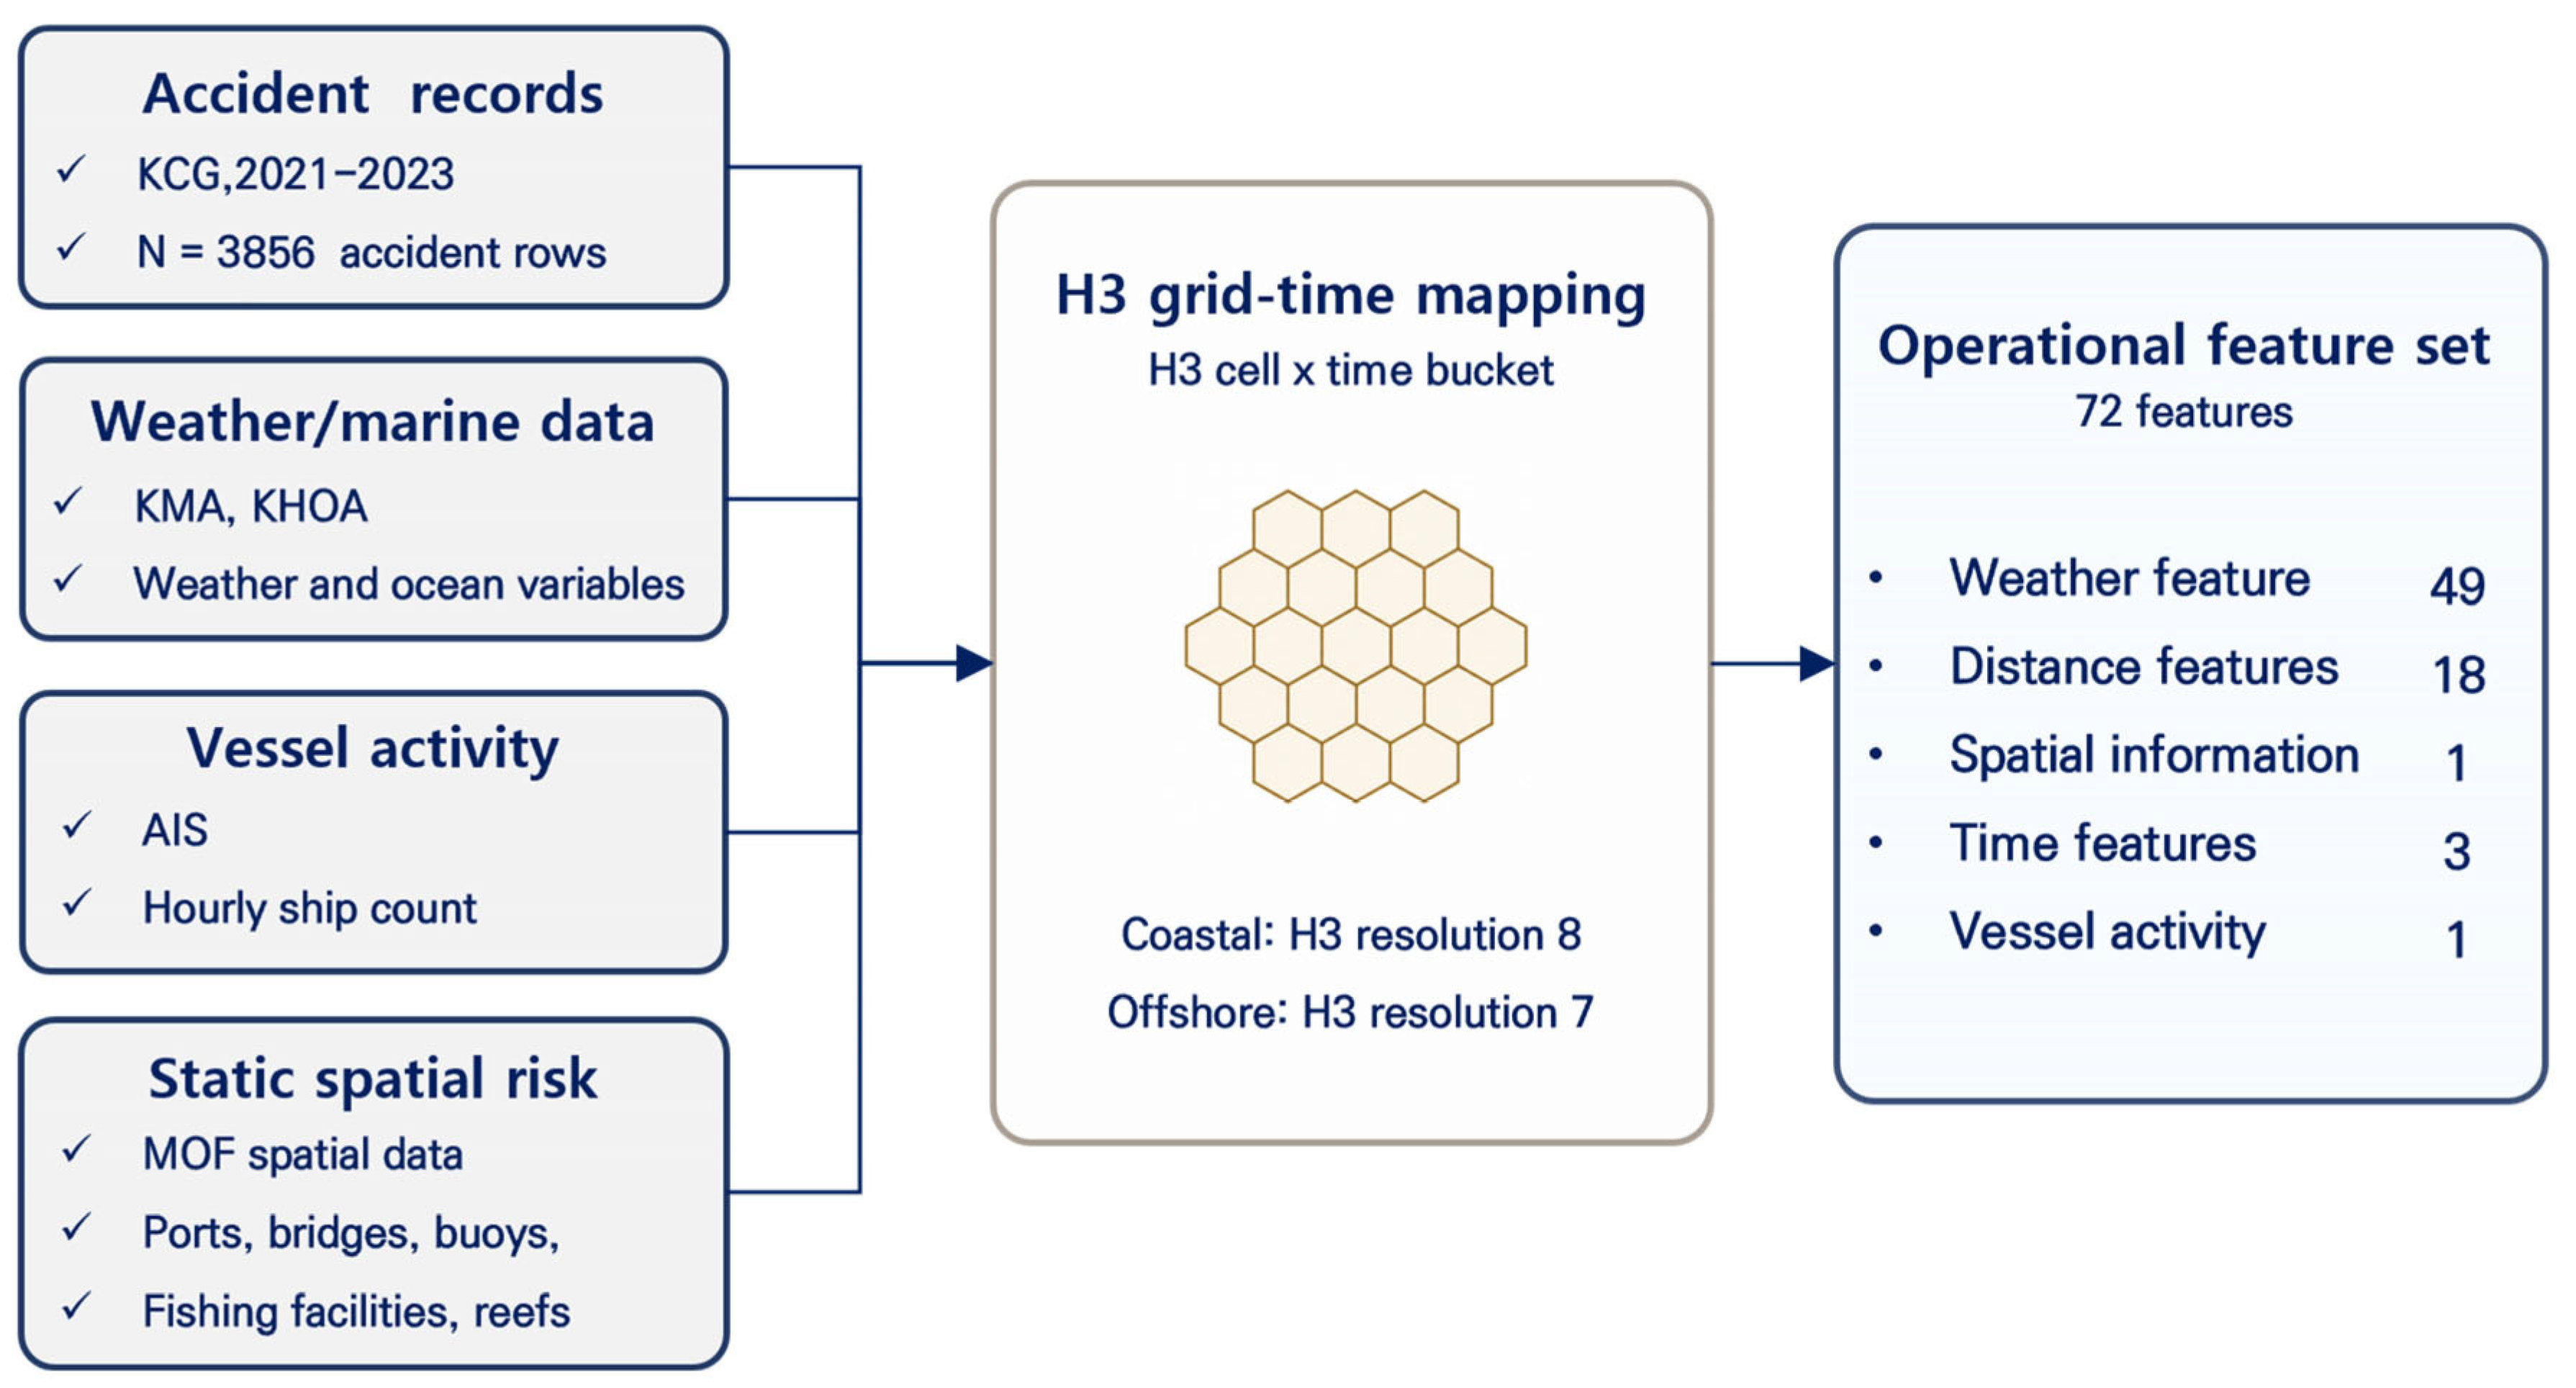
All features in this study were limited to information observable before an accident occurs; post-accident information such as damage extent, dispatched resources, and casualties was entirely excluded. The feature categories and variable composition are organized in Table 4. Stage 1 (accident/non-accident detection) and Stage 2 (accident-type classification) use the same total of 72 features (70 numerical + 2 categorical).
To prevent the model from directly memorizing the location of a specific H3 cell, exact coordinate variables such as h3_lat and h3_lon were excluded from the training features. Instead, only variables usable at the operational stage—such as environment, distance to facilities, time, and vessel activity volume—were used, and the effect of residual spatial leakage was evaluated through the cross-validation designs in Section 3.4.6.
The missing-value rate of the environmental variables varied by variable. The variables with high missing rates, ‘maximum wave period’ (69.8%) and ‘significant wave period’ (66.0%), were excluded from the training features because noise was judged likely to dominate after imputation; no fixed exclusion threshold was applied in advance, and these were the only two variables whose missing rate was far above that of the remaining environmental variables. Missing values of the remaining numerical features were handled by train-fold median imputation, and categorical features (sea_region, season_name) were handled using LightGBM’s native categorical handling without one-hot encoding.
Variables that cannot be used directly for operational-stage accident risk estimation or that pose leakage concerns were also excluded. Because the tonnage of the vessel involved is information attributed to an individual accident record only after the accident occurs, it was not used as an input for grid-time risk scoring. The water-depth variable was not included in the main operational feature set because some sea areas showed spatially structured missingness and large differences in coverage.
The H3 grid-based data construction procedure and the composition of the final operational feature set are presented in Figure 4. Figure 4 shows the process by which accident records, meteorological and oceanographic variables, vessel activity volume, and static spatial risk factors are combined into the same H3 grid-time row.

3.4. Two-Stage Framework

3.4.1. Two-Stage Conditional Risk Decomposition

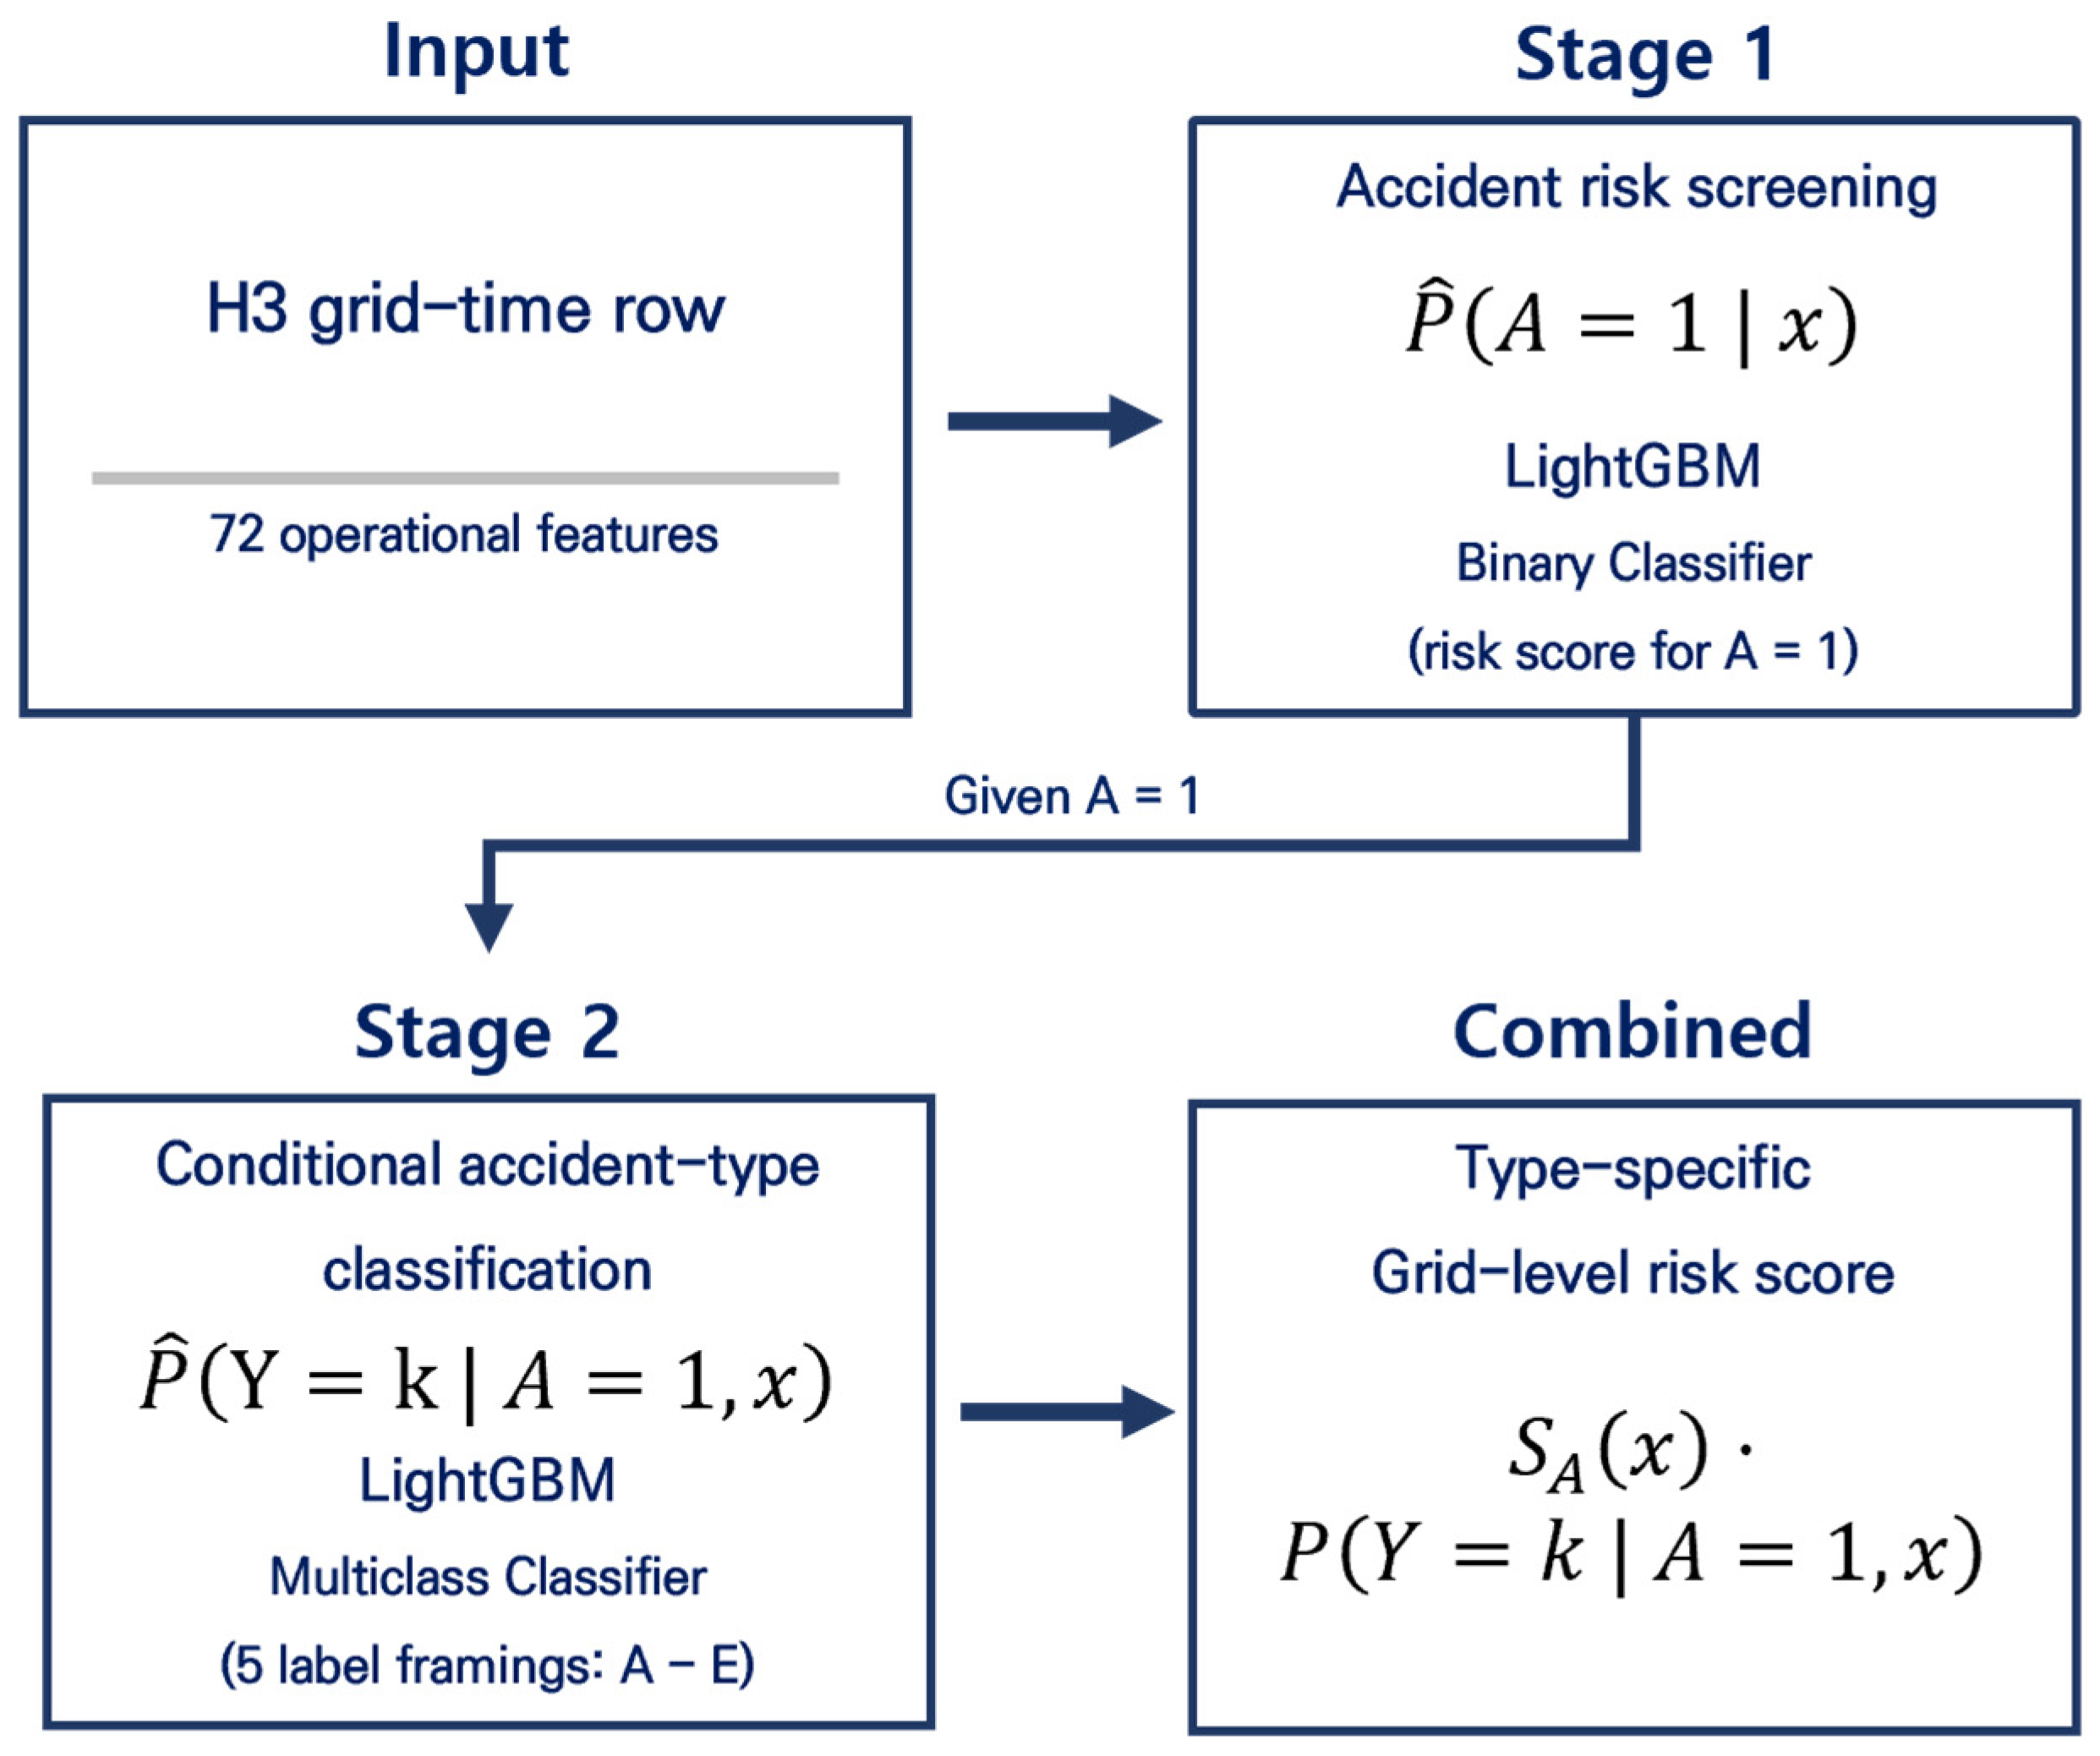
This study aims to jointly estimate, at the H3 grid-time row level, the probability of accident occurrence and the relative risk of each accident-type. The accident-type label is not a value that exists independently for every row; it has meaning only in rows where an accident occurred. Therefore, this study did not construct accident-type prediction directly as a single multi-class classification, but instead used a two-stage structure that first estimates whether an accident occurs and then estimates the accident-type distribution conditional on accident occurrence.
This design draws conceptual motivation from a two-part decomposition perspective that first distinguishes zero from non-zero outcomes and then separately models the detailed distribution of non-zero outcomes. In this study, this perspective was applied not to accident-count prediction but to the problem of estimating accident-type-specific risk, where the non-zero outcome corresponds to the case in which an accident occurred in that grid-time row. In Stage 1, a LightGBM-based binary classifier produces an accident risk score for each grid-time row, and in Stage 2, a LightGBM-based multi-class classifier estimates the accident-type distribution conditional on accident occurrence.
Because Stage 1 was trained and evaluated on an active-vessel grid-time dataset in which non-accident rows were about 10 times the accident rows, the Stage 1 output is interpreted not as an absolute accident-occurrence probability in the operational environment but as a relative accident risk score across grid-time rows. Accordingly, the final accident-type-specific output is also interpreted not as a calibrated probability but as a model-derived type-specific risk score that combines the accident risk screening score with the conditional accident-type distribution.
The final accident-type-specific risk score is computed by combining the Stage 1 accident risk score with the Stage 2 conditional accident-type score, as in Equation (1).
R k x = s A x P Y = k | A = 1 , x
Here, R k x denotes the model-derived risk score for accident-type k in grid-time row x, and s A x denotes the relative accident risk score produced in Stage 1. A = 1 denotes the case in which an accident occurred in that grid-time row, and Y = k denotes accident-type k. Through this structure, Stage 1 prioritizes grid-time rows with high accident risk, and Stage 2 estimates which accident-type carries relatively higher risk given that an accident occurs. Section 3.4.3 then compares the survey-aligned, data-aligned, union, sufficient-sample, and full administrative (7-class) framings on the same Stage 2 structure to evaluate the effect of the accident-type categorization method on predictive stability and operational interpretability.

3.4.2. Stage 1: Binary Accident Risk Estimation

Stage 1 is a binary classifier that produces a relative accident risk score for an arbitrary H3 grid-time row. In this study, a LightGBM-based binary classifier was trained. The classification threshold was not fixed in advance but selected as the value that maximizes macro F1 on the validation set. This setting balances the classification performance of the two classes under the imbalanced accident/non-accident condition. In addition, to check whether the model simply relies on the past accident frequency of a specific H3 cell, a naive cell-historical-rate baseline that uses the per-cell accident rate observed during the training period directly as the risk score was also evaluated.

3.4.3. Stage 2: Multi-Class Accident-Type Classification

Stage 2 classifies the accident-type as a multi-class problem under the assumption that an accident occurs. To evaluate the effect of categorization framing, this study compared five framings under identical data conditions and a common tuning protocol (Table 5). The five framings were ordered from fewer to more training classes, so that the effect of categorization granularity on prediction performance and operational interpretability could be evaluated.
Section 4.5 evaluates the five framings side by side on the same metrics. Exp A is a survey-aligned 3-class framing based on the explicit options of survey items Q7-1 and Q10, and Exp B is a data-aligned 3-class framing using the three most frequent accident-types in the actual accident data. Exp C is a 4-class union framing combining the class sets of Exp A and Exp B, constructed to compare the difference between survey-based categories and data-frequency-based categories within a single label space.
Exp D is a sufficient-sample 5-class framing, including the five accident-types for which at least 50 accident rows are observed in each train/validation/test split. This setting prioritizes training stability by excluding extreme minority classes with very few samples, such as sinking and contact. Exp E is an administratively complete 7-class framing including all seven administrative accident-types, corresponding to a boundary case that maximally expands accident-type coverage and categorization granularity.
Because the survey option ‘other’ consists of free text responses and includes items outside the administrative accident-types or mixtures of several types, it was not trained as a separate fixed class. Accordingly, Exp A was constructed as a survey-aligned framing including only the three accident-types explicitly presented in the survey: collision, grounding, and drift entanglement.
Across the five framings, Stage 2 used the same learner (LightGBM multi-class), the same feature set, the same temporal split, the same class-balanced weighting, and the same hyperparameter selection protocol. The hyperparameter values themselves were selected separately for each framing by the same Optuna procedure on the 2022 validation partition, so that no framing is advantaged or disadvantaged by a value set chosen for a different number of classes. The complete configuration is reported in Appendix D. This made it possible to compare the effect of the accident-type label space definition on prediction performance and operational interpretability, rather than the effect of differences in the learner, the feature set, or the evaluation design.

3.4.4. Algorithm Selection

To ensure consistency in the comparison across accident-type framings, this study used LightGBM as the reference learner. LightGBM is a gradient-boosting decision-tree model that can effectively handle tabular features with different scales and nonlinear relationships, such as meteorological and oceanographic variables, vessel activity volume, distance to facilities, and time variables. In particular, because it can learn nonlinear relationships and interactions among variables without assuming an explicit functional form, it is suitable for a setting such as this one that combines heterogeneous operational features.
In addition, because LightGBM supports efficient iterative training by combining histogram-based learning with Gradient-based One-Side Sampling (GOSS) and Exclusive Feature Bundling (EFB) [28], it is suitable for the experimental structure of this study, in which the Stage 1 and Stage 2 models must be evaluated together with multiple accident-type framings, temporal splits, threshold analyses, and spatial robustness checks. LightGBM and other gradient-boosting models have also shown competitive performance in prior maritime accident prediction studies [11,14]. This study therefore focuses not on comparing the best performance across algorithms, but on evaluating how the accident-type label space design affects coverage, macro F1, Top-K hit rate, and operational interpretability under the same learner conditions.
All analyses were implemented in Python 3.12.5 (Python Software Foundation, Wilmington, DE, USA) using LightGBM 4.6.0 (Microsoft Corporation, Redmond, WA, USA) and Optuna 4.8.0 (Preferred Networks, Inc., Tokyo, Japan).

3.4.5. Evaluation Metrics

To evaluate the ranking ability and screening utility of accident/non-accident rows, Stage 1 reported the receiver operating characteristic area under the curve (ROC-AUC), the precision–recall area under the curve (PR-AUC), positive recall/precision, and top-decile lift. The classification threshold was selected as the value that maximizes macro F1 on the validation set, and the threshold sensitivity is presented in Appendix B.
The way Stage 1 and Stage 2 are combined and interpreted as an accident-type-specific grid-level risk score, together with the overall evaluation design, is summarized in Figure 5. Figure 5 shows the process of producing type-specific risk through Stage 1 accident risk estimation, Stage 2 conditional accident-type classification, and the combination of the two scores.
To evaluate the trade-off across accident-type framings, Stage 2 reported accident coverage, macro F1, and Top-2 and Top-3 hit rates. Macro F1 was used as the primary metric to reflect the performance of each class in a balanced manner in accident-type classification where class imbalance exists.
End-to-end performance was evaluated using an accident-only cascaded Top-K metric on the actual accident rows. This metric reflects the overall decision-support performance in which Stage 1 accident risk screening and Stage 2 accident-type candidate presentation are combined. A direct quantitative performance comparison with prior studies was not performed, because the target sea area, the accident-type label space, the unit of analysis, the sampling strategy, and the evaluation partition differ across studies.

3.4.6. Spatially Contiguous Block Cross-Validation

To check whether the model performance is overestimated due to repeated exposure to the same H3 cell and to spatial autocorrelation between neighboring cells, a spatially contiguous block 5-fold cross-validation [29,30] was additionally performed.
To this end, the 32,493 unique H3 cells in Korean territorial waters were assigned to five blocks by k-means clustering on their centroid latitude and longitude (k = 5, random_state = 42, 10 initialisations), which places each block in one compact sea area. The number of blocks was set to five: with fewer blocks each fold would hold out a larger share of the data, while with more blocks each block would be smaller and a larger proportion of test cells would lie on a block boundary. The cell set, C , is therefore partitioned into five disjoint blocks, and in each fold the entire set of cells in one block was used as the test set and the remaining blocks as the training set, so that the cells surrounding a test cell are themselves held out, except along the boundary between blocks. The centroid coordinates are used only for this assignment and are never used as model features. This partition is defined as in Equation (2):
C = b = 1 5 B b , B b B b = for   all   b b
Here, denotes a disjoint partition. Fold b uses B b as the test set and C B b as the training set, and a cell overlap of 0 between train and test is enforced. Because the mixed-resolution grid of this study (coastal resolution 8, open-sea resolution 7) covers the area without overlap, each location corresponds to a single cell, so parent–child overlap problems do not arise. This cross-validation was applied only to the Stage 1 binary classifier. The mean and standard deviation of ROC-AUC across folds were computed and compared with the year-based temporal holdout results. Region-level generalization at the Regional Headquarters level remains outside the scope of this design and is discussed as a limitation of this study.

4. Results

This section reports RQ1–RQ4, stated in Section 1, in order. Test statistics and effect sizes are presented together in the relevant results subsections.

4.1. Operational and Information Integration Gap

4.1.1. Limited Use of Quantitative and Standardized Risk Criteria

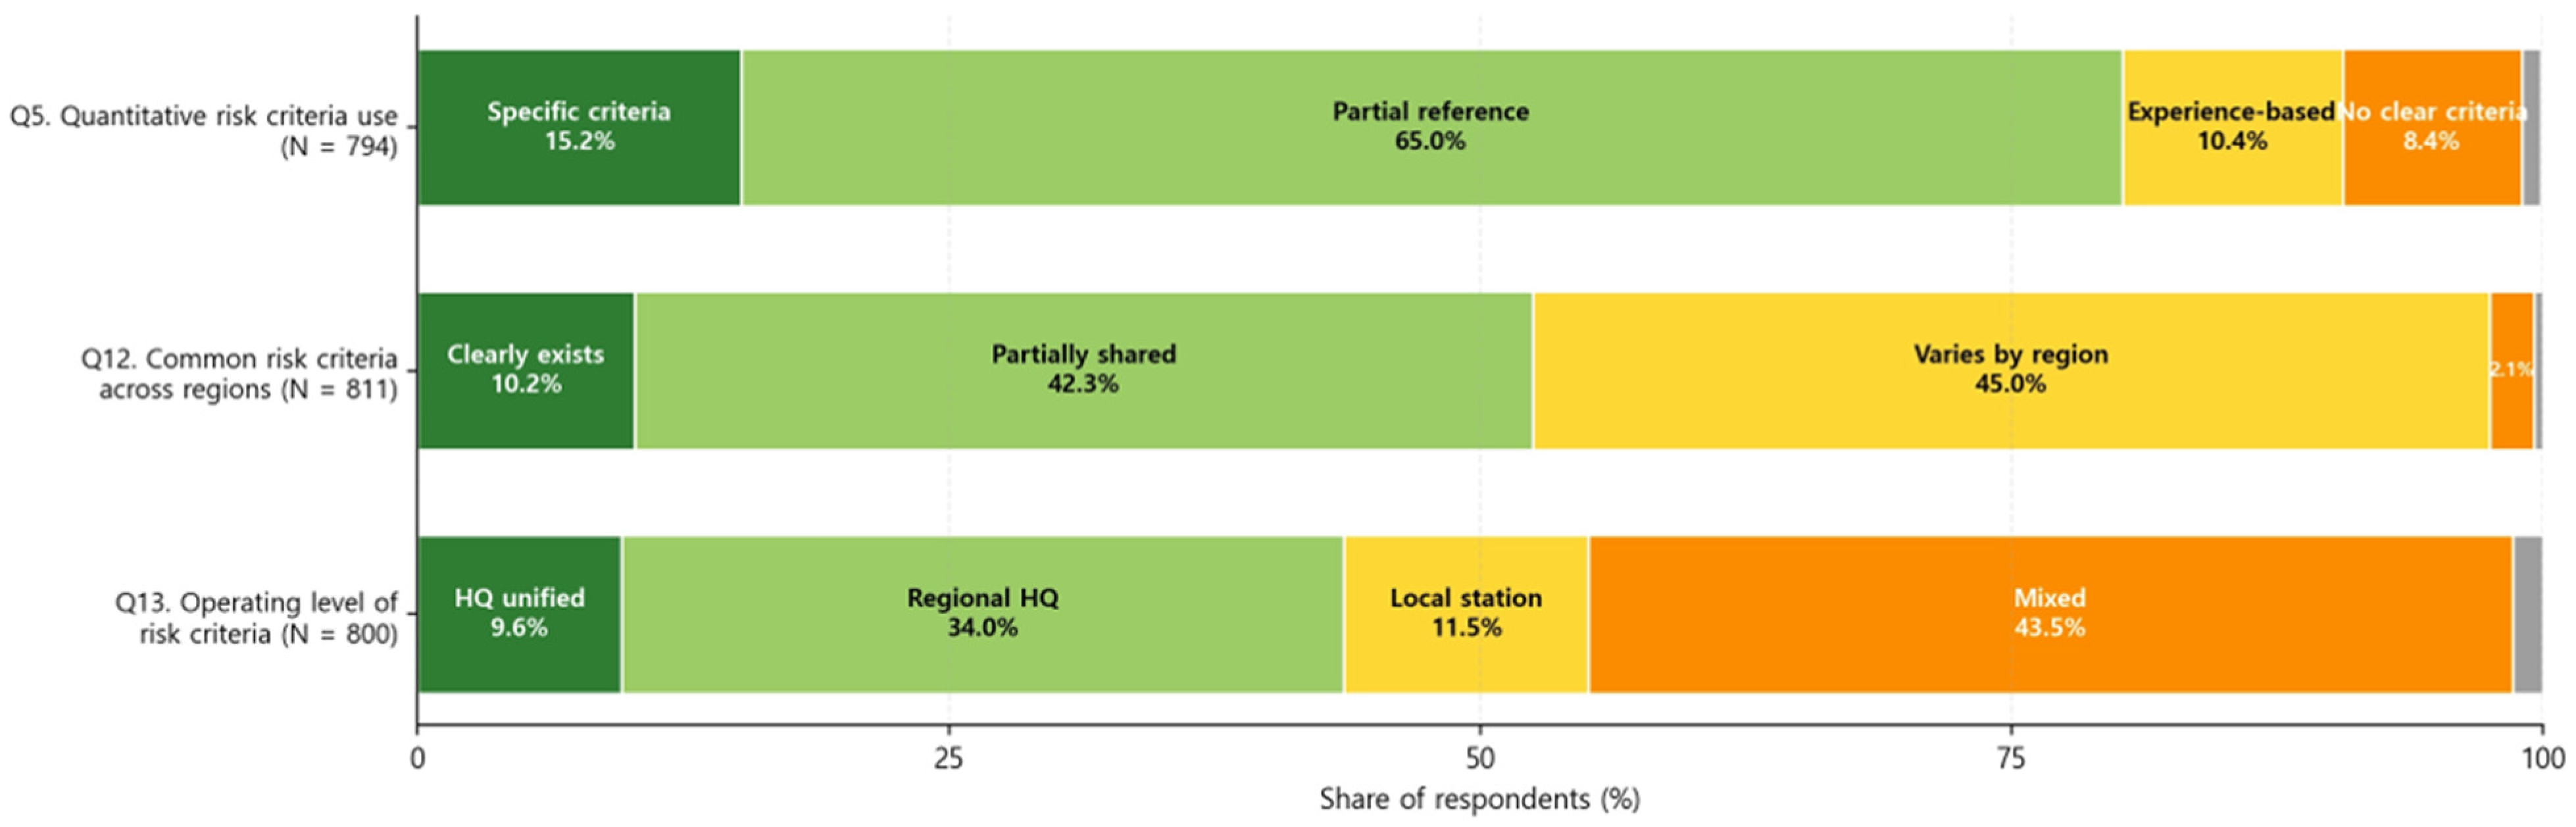
These three items jointly diagnose whether accident risk judgment is based on quantitative evidence (Q5), whether it is shared as a common criterion within the organization (Q12), and at which operational level—Headquarters, Regional Headquarters, or coastal substation—such criteria are formed (Q13).
The proportion of respondents who reported explicitly using quantitative risk criteria was only 15.2% (Q5 ① Specific criteria), while the rest were distributed across qualitative reference (65.0%), experience-based judgment (10.4%), and the absence of clear criteria (8.4%), and other free-text responses (1.0%). The proportion reporting that common risk judgment criteria ‘clearly exist’ across Regional Headquarters was 10.2% (Q12 ① Clearly exists), and the proportion reporting the operation of unified criteria at the Headquarters level was 9.6% (Q13 ① HQ unified). The three items (Q5, Q12, Q13) consistently show the absence of quantitative criteria and the lack of standardization across Regional Headquarters and at the Headquarters level (Figure 6).

4.1.2. Demand for Data-Driven Decision Support

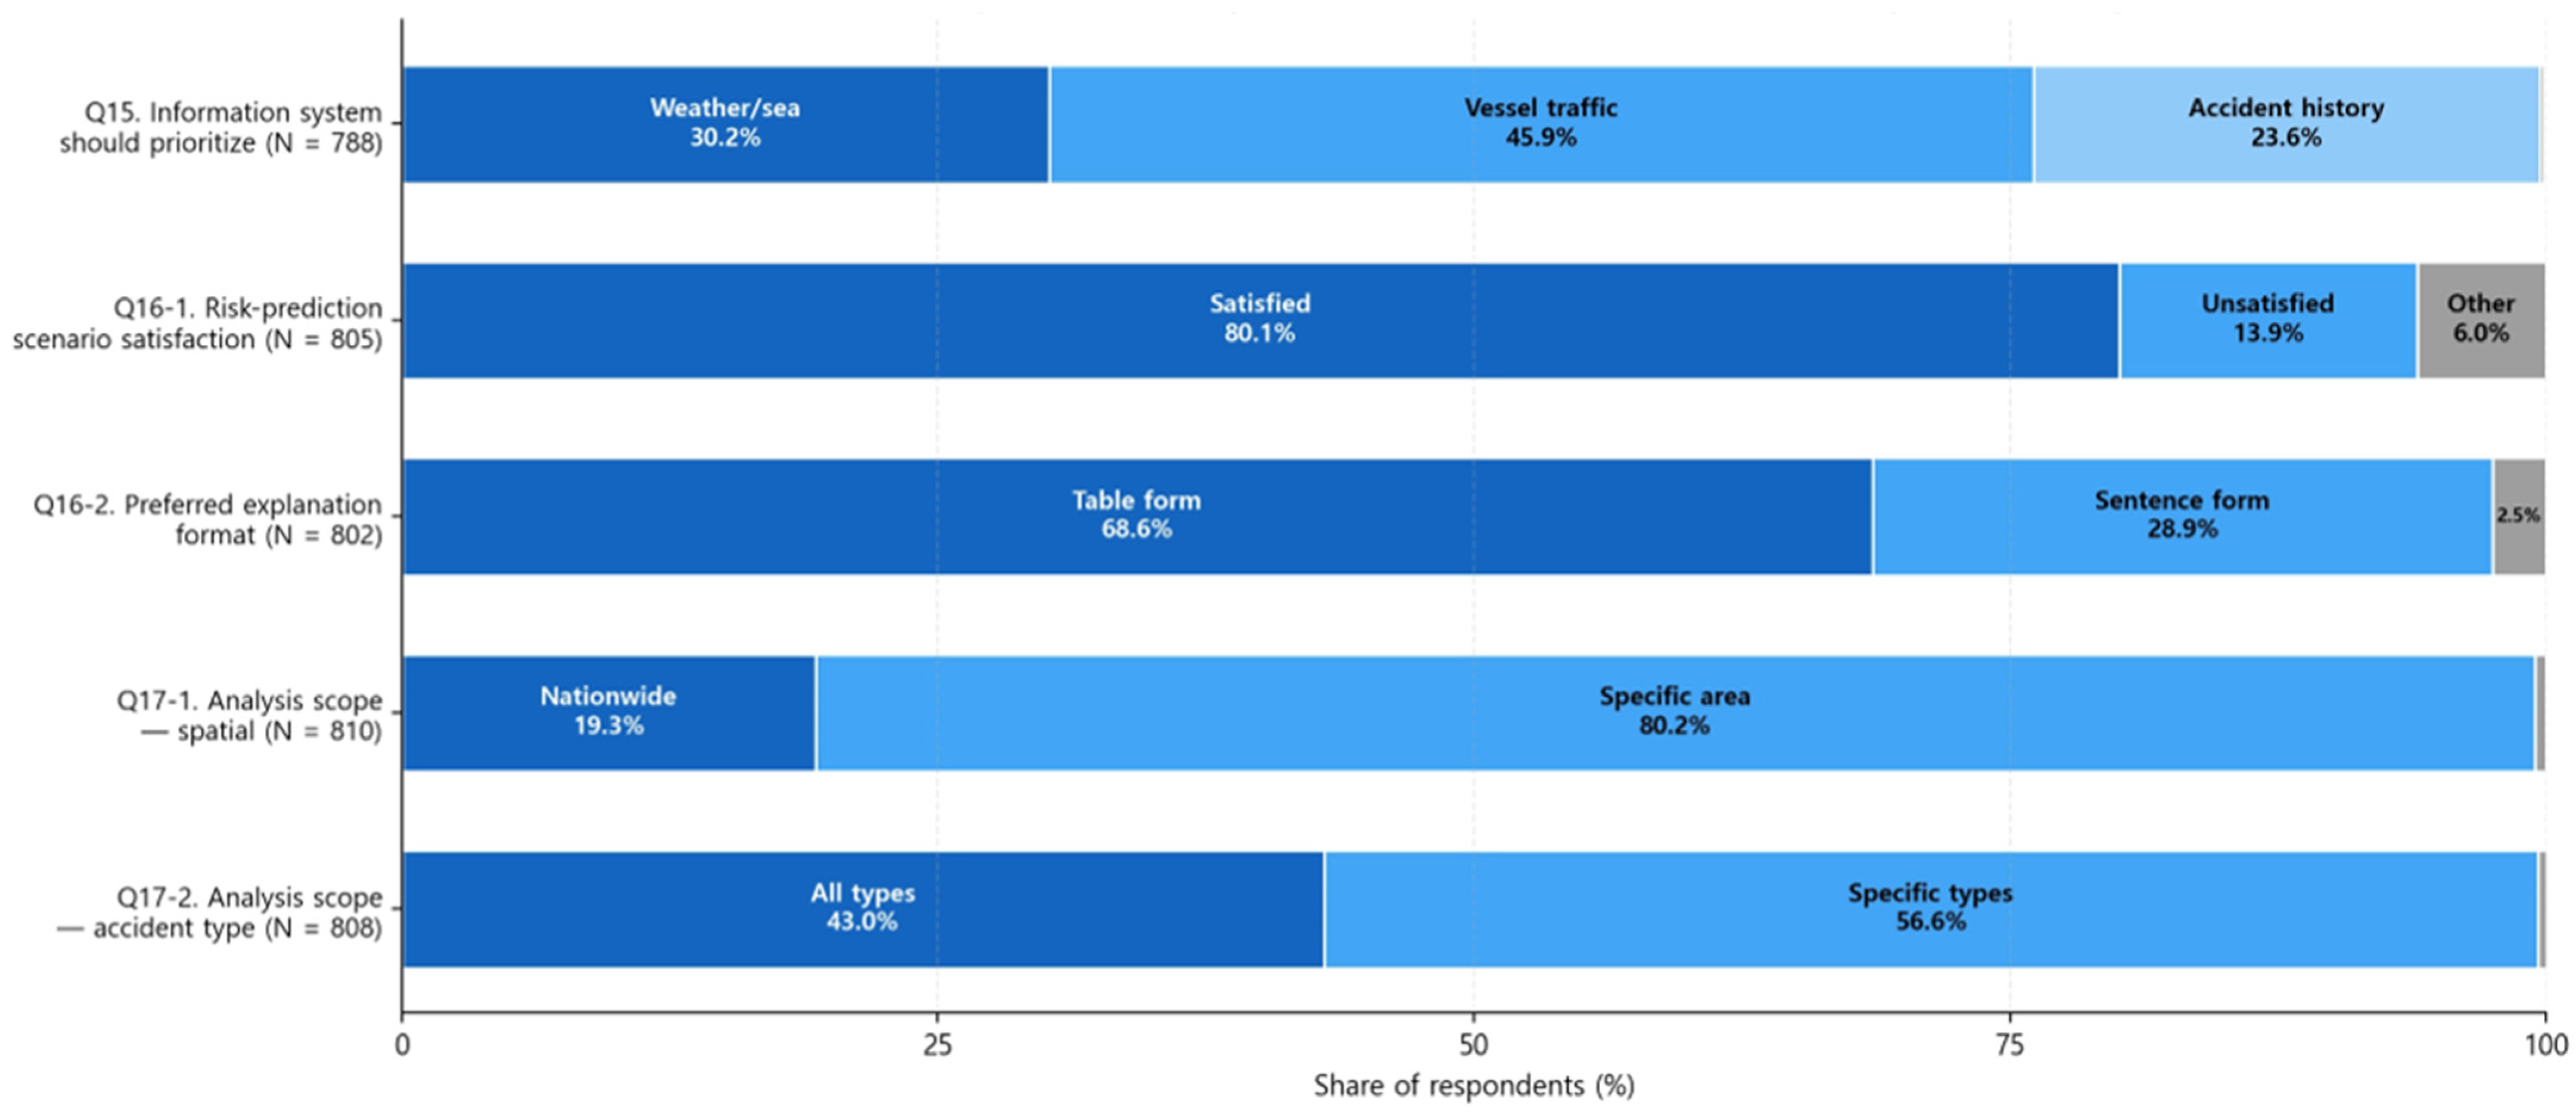
To diagnose the second aspect of RQ1, the participating practitioners’ acceptance of information integration tools, this study analyzed responses to five items: acceptance of AI decision support (Q16-1), preferred explanation format (Q16-2), preferences regarding analysis scope and accident-type separation (Q17-1, Q17-2), and information priority (Q15). Together, these five items indicate the form and operational scope in which the participating practitioners want AI-based information to be provided (Figure 7).
Satisfaction with the AI-based accident-prediction scenario was 80.1% (Q16-1 Satisfied), and for the risk-explanation format, preference for a table form was 68.6% (Q16-2 Table form), greatly exceeding preference for a sentence form (28.9%). Regarding analysis scope, a specific-area unit (80.2%, Q17-1 Specific area) was overwhelmingly preferred over a nationwide unit (19.3%), and regarding accident-type scope, selection of specific types (56.6%, Q17-2 Specific types) was somewhat more prevalent than all types (43.0%). The information that the AI system should provide first was vessel-traffic information (45.9%, Q15 Vessel-traffic), followed by meteorological and sea-state information (30.2%) and accident history (23.6%).
The response patterns of these five items show that (i) the participating practitioners want information provided in a standardized table form and based on specific sea areas and specific accident-types, and (ii) when these conditions are met, their acceptance of AI-based risk information is high. Combined with the operational-gap diagnosis in Section 4.1.1, this supports framing the system as a grid-level decision-support form consistent with field acceptance.

4.2. Survey-Framed Perception–Baseline and Prevention-Focus Mismatch

4.2.1. Perceived Accident Frequency Versus Historical Accident Baseline

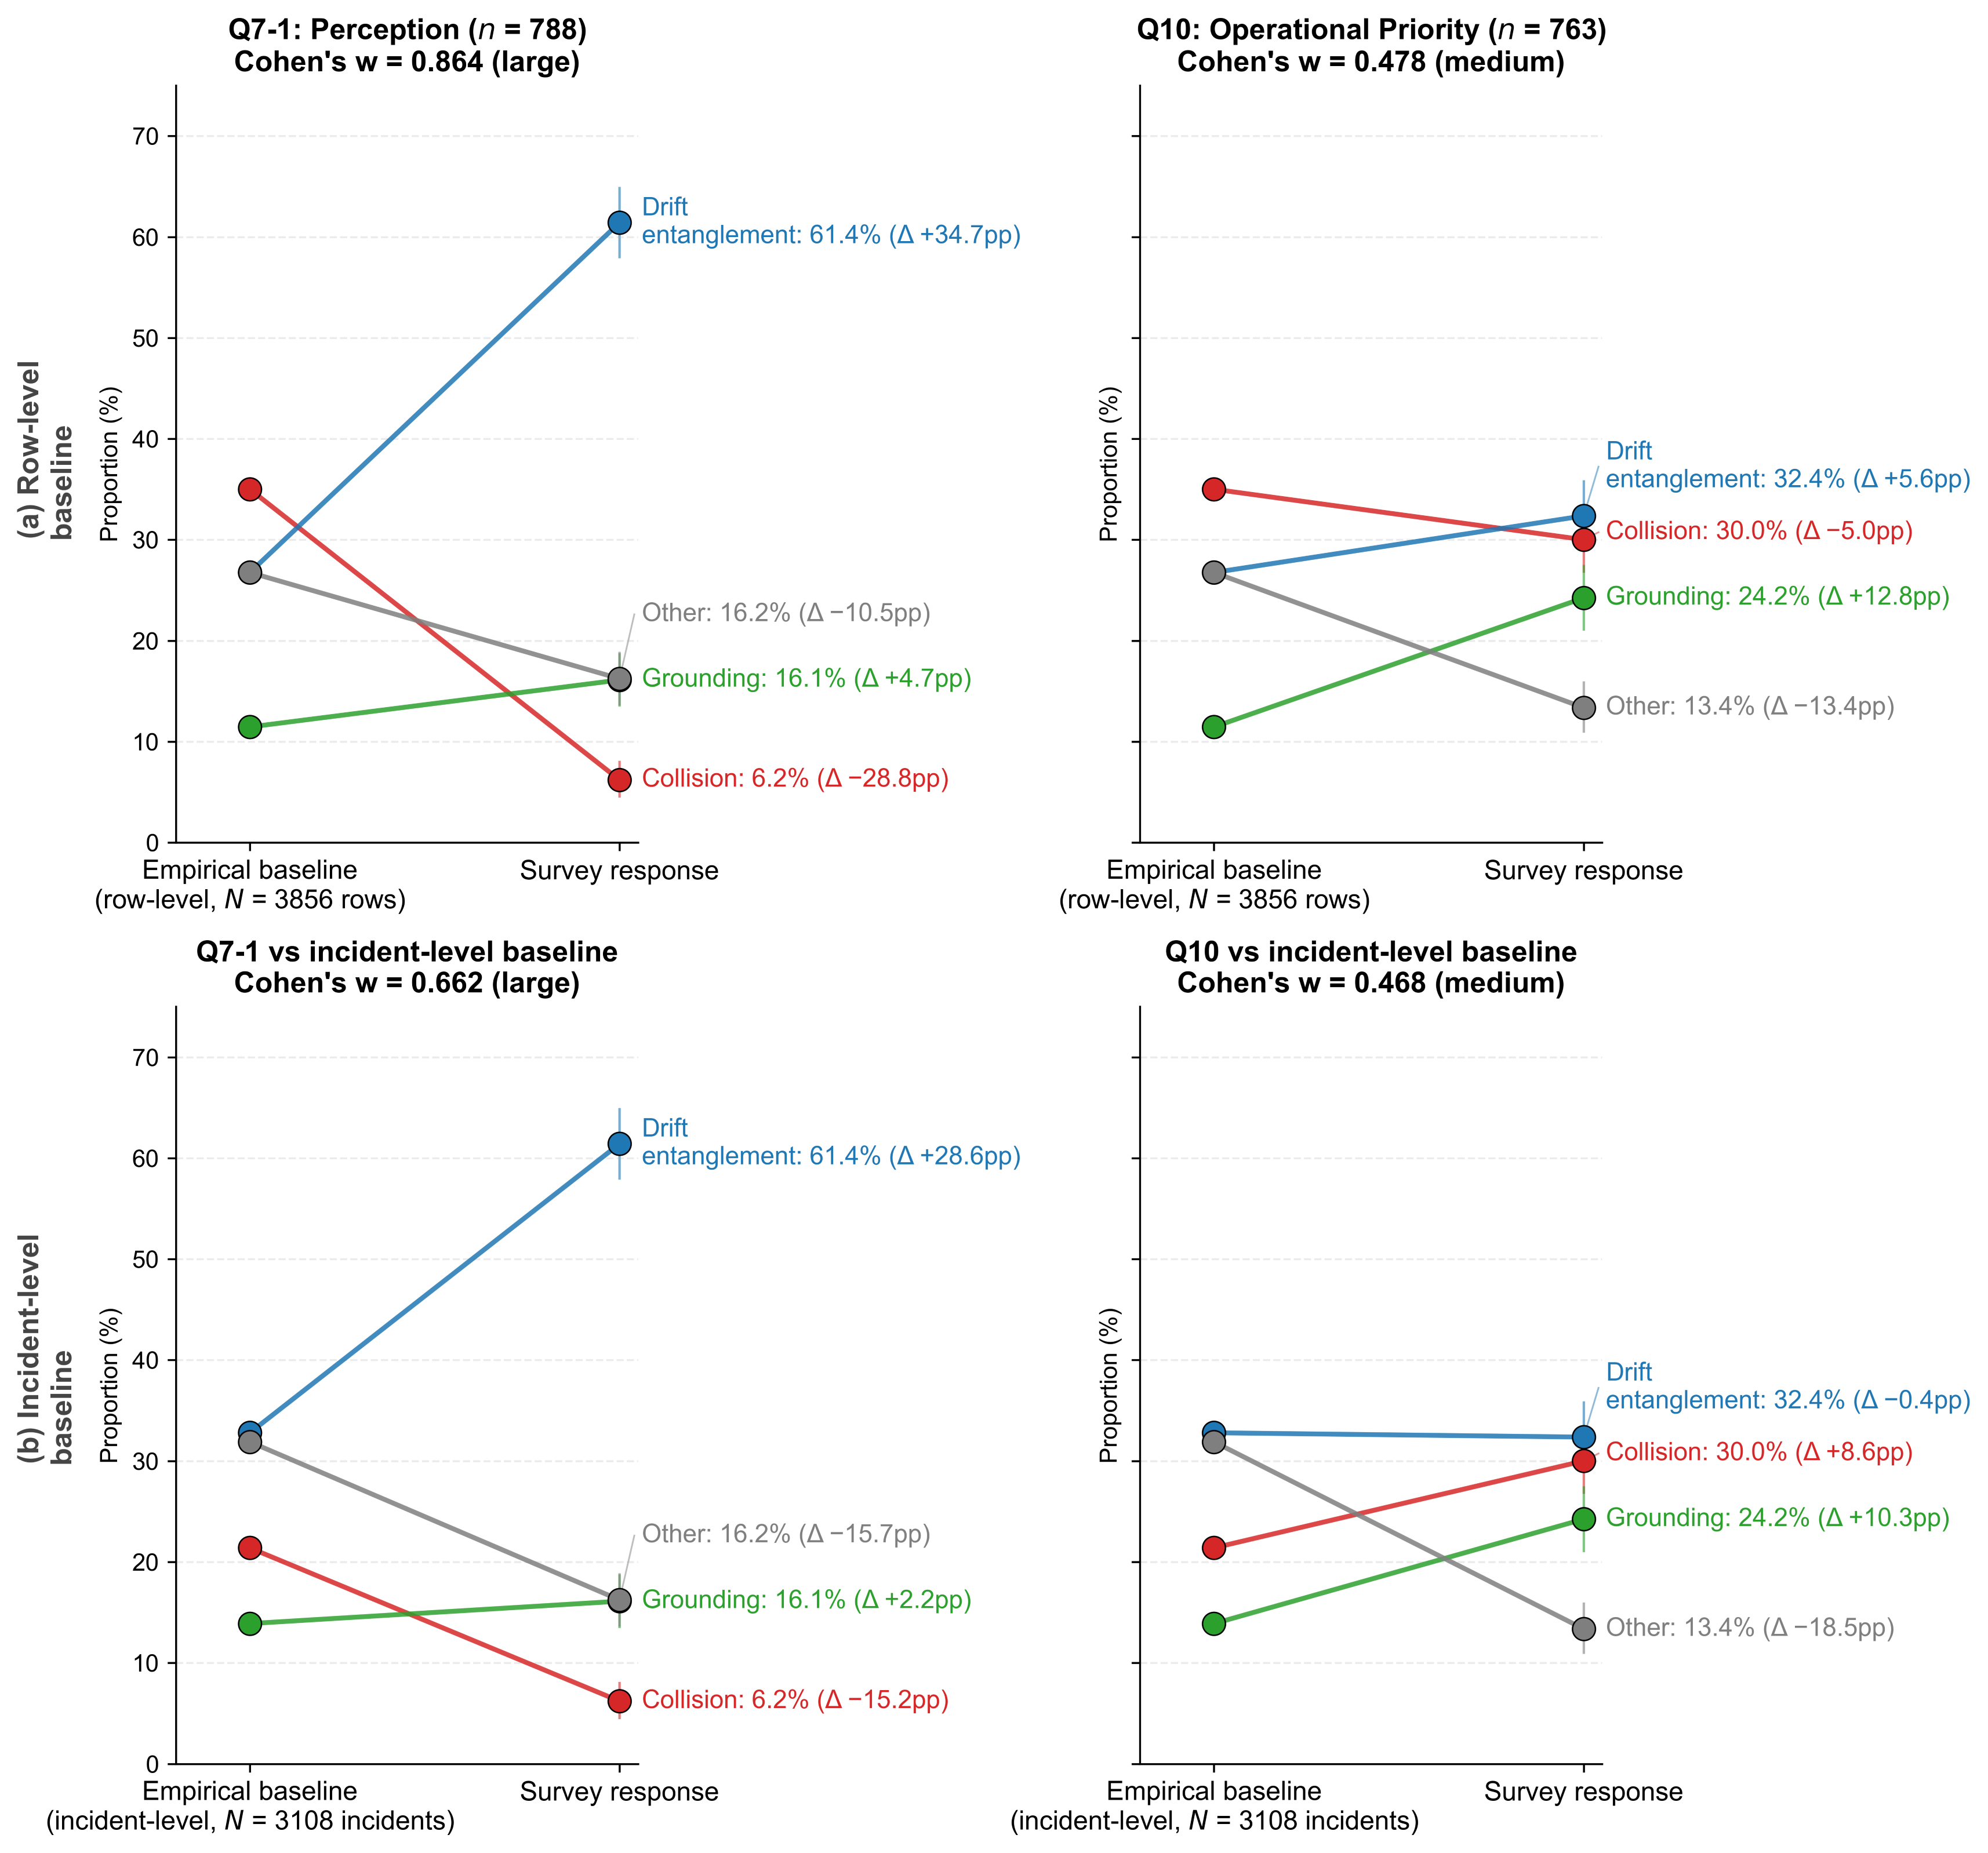
The comparison of the accident-type perceived as most frequent in the respondents’ jurisdictional waters (Q7-1, N = 788) with the 2021–2023 Korean territorial-waters accident baseline ( N = 3856 ) is presented in Table 6. Collision perception was 6.2%, 28.8 percentage points (pp) below the actual accident distribution of 35.0%, whereas drift entanglement perception was 61.4%, 34.7 pp above the actual distribution of 26.8%. The differences from the actual distribution for grounding and ‘other’ responses were relatively small, within ± 10 pp. The goodness-of-fit test showed that the difference between the survey response distribution and the actual accident distribution was statistically significant, with χ 2 3 = 587.72 , p < 10 15 , and Cohen’s w = 0.864, corresponding to a large effect.
The results in Table 6 are based on the row-level baseline including multi-vessel sub-events ( N = 3856 ). However, because 98.5% of collision accidents are multi-vessel incidents (Methods Section 3.3.2), the share of collision accidents may appear larger on a row-level basis than on a per-incident basis. To check this, the same analysis was performed again with the incident-level baseline of unique incidents ( N = 3108 incidents). As a result, the perception–baseline difference for collision narrowed from −28.8 pp to −15.2 pp, and the difference for drift entanglement also narrowed from +34.7 pp to +28.6 pp. Cohen’s w, representing the overall distributional difference, likewise decreased from 0.864 to 0.662, but still corresponded to a large effect. That is, although the magnitude of the perception–reality gap depends on whether row-level or incident-level normalization is used, the direction—drift entanglement being over-perceived and collision being under-perceived relative to reality—was consistently maintained under both criteria (Figure 8).

4.2.2. Prevention Focus Shows a Different Alignment Pattern

The responses on the accident-type prioritized for prevention at the workplace (Q10, N = 763) were compared with the same 2021–2023 accident baseline, with the results presented in Table 7. The prevention focus in Q10 tended to align more closely with the actual accident distribution than the perceived accident frequency in Q7-1. Collision priority was 30.0%, 5.0 percentage points (pp) below the actual accident distribution of 35.0%, indicating mild under-allocation, while drift entanglement was 32.4%, 5.6 pp above the actual distribution of 26.8%, indicating mild over-allocation. By contrast, grounding was 24.2%, 12.8 pp above the actual distribution of 11.5%, showing the most pronounced over-allocation among the three types.
In terms of the overall distributional difference, the goodness-of-fit result between Q10 and the actual accident baseline was χ 2 3 = 174.35 , p < 10 35 , and Cohen’s w = 0.478, corresponding to a medium effect. This is a milder level than the large mismatch observed in Q7-1 perception, showing that the participating practitioners’ ‘perception of the most frequent accident-type’ diverges greatly from the actual accident distribution, whereas ‘the accident-type prioritized for prevention at the workplace’ is adjusted relatively more closely to the actual accident distribution.
In terms of effect size, the perception–baseline mismatch was about 1.81 × larger than the priority–baseline mismatch. This shows that, for the participating practitioners, ‘the accident-type perceived as frequent’ and ‘the accident-type prioritized for prevention’ are not responses at the same level. That is, accident-frequency perception diverges greatly from the actual accident distribution, whereas operational priority is adjusted relatively more closely to the baseline. This asymmetry is interpreted in Section 5.2 as a separation between the perception layer and the operational-priority layer, and the main patterns under row-level and incident-level normalization are presented in Figure 8.

4.2.3. Limited Within-Respondent Agreement Between Perception and Prevention Focus

Within-respondent agreement was computed for the respondents who gave a single response to both Q7-1 and Q10 (N = 741). The observed agreement was p o = 0.528 and the agreement expected by chance was p e = 0.283 , yielding a Cohen’s κ of 0.342, corresponding to a fair level of agreement. That is, although the probability that the same respondent selects the same accident-type for perception and priority was clearly higher than chance expectation, the two responses cannot be regarded as strongly concordant. In particular, of the 455 respondents who perceived ‘drift entanglement’ as the most frequent accident-type in Q7-1, 135 (29.7%) selected ‘collision’ as the priority prevention accident-type in Q10.

4.2.4. Subgroup Robustness Across Region, Job, and Experience

To check whether the gaps in Section 4.2.1, Section 4.2.2 and Section 4.2.3 were driven by particular respondent groups, chi-square independence tests were performed between the three axes—Regional Headquarters, job, and work experience—and the Q7-1 and Q10 responses. The results are organized in Appendix C (Table A5). Region and job showed small-to-medium associations with both Q7-1 and Q10, with Cramér’s V in the range of 0.135–0.200. This indicates that accident-type perception and prevention priority may vary somewhat with the regional operating environment or job characteristics.
By contrast, work experience showed almost no association with Q7-1 perception (V = 0.040, p = 0.987). For Experience × Q10, V = 0.095 and p = 0.058 indicated a borderline association, but the effect size was still small. Therefore, the differences in accident-type perception and prevention priority are interpreted not as being explained by a particular experience group, but as a pattern that, while partly influenced by region- and job-specific operational contexts, appears consistently at the overall sample level.
Furthermore, in a separate subgroup robustness analysis, the direction of the perception–reality gap was maintained in all 16 subgroups, including 5 regions, 5 jobs, 5 experience groups, and overall. Specifically, in every subgroup, collision was under-perceived (collision under-perception 25.1   p p ) and drift entanglement was over-perceived (drift entanglement over-perception +14.6 pp; Appendix C, Table A3). The perception–reality mismatch can therefore be interpreted not as a within-sample artifact produced by particular region, job, or experience groups, but as a consistent pattern within the participating sample.

4.2.5. Robustness Checks

Three additional robustness analyses were performed to confirm that the conclusions of Section 4.2.1 and Section 4.2.2 are robust to normalization and response-format choices.
(a) The accident baseline was defined both at the row level (including multi-vessel sub-events) and at the incident level (unique incidents), and the same analysis was repeated; as a result, the core pattern was confirmed to hold. For Q7-1 perception, the over-perception of drift entanglement showed Cohen’s w = 0.864 at the row level and w = 0.448–0.926 at the incident level per region, ranging from medium to large effect sizes. The main direction was likewise preserved for Q10 priority. This shows that the conclusions of Section 4.2.1 and Section 4.2.2 do not depend solely on row-level normalization.
(b) 3-class normalized (excluding ‘Other’). To check the effect of how ‘other’ responses are handled, the response proportions were renormalized using only the three accident-types explicitly presented in the survey (collision, grounding, and drift entanglement). As a result, Q7-1 perception showed Cohen’s w = 0.848 at N = 660 (large effect), and Q10 priority showed Cohen’s w = 0.366 at N = 661 (medium effect). As in the 4-class analysis, this means that the perception–baseline mismatch is larger than the priority–baseline mismatch. The perception/priority asymmetry is therefore interpreted as being maintained regardless of whether ‘other’ responses are included.
(c) Free-text check for option-presentation bias. To check the effect of how the survey options were presented, the free-text ‘other’ responses to Q7-1 and Q10 were examined. In Q7-1, 126 of the 128 respondents who selected ‘other’ provided an entry, giving 138 entries in total; engine failure was written by 100 respondents, whereas flooding was written by none (see Section 5.3 for the full breakdown). This suggests that the over-reporting of drift entanglement observed in Q7-1 perception is difficult to attribute simply to an option-presentation effect. At the same time, it shows that accident types outside the seven-class taxonomy—such as engine failure, marine pollution, and personal-injury accidents—are perceived by the participating practitioners as a separate operational burden.
(d) Region-matched baselines. Because respondents answered about their own jurisdictional waters while the main comparison uses the national distribution, the Q7-1 comparison was repeated with region-matched baselines: each Regional Headquarters was mapped to its jurisdictional sea area (West Sea and Central HQ to the West Sea; South Sea and Jeju HQ to the South Sea, all 428 Jeju-area accident rows carrying the South Sea label; East Sea HQ to the East Sea), and each headquarters’ response distribution was compared against the accident-type distribution of its own sea area. The mismatch persisted in every matched region (Cohen’s w = 0.60–1.19), with collision under-perceived and drift entanglement over-perceived in all five headquarters, and pooling respondents against a survey-composition-weighted regional baseline yields w = 0.839, essentially unchanged from the national-baseline value of 0.864; the accident-type shares themselves vary only moderately across the three sea areas (collision 28.9–40.6%, drift entanglement 24.0–32.8%).
(e) Baseline-year sensitivity. Because the survey was conducted in 2025 while the accident baseline covers 2021–2023, the Q7-1 and Q10 comparisons were repeated against each single-year baseline. The accident-type shares vary little across the three years (collision 34.0–35.7%, grounding 10.5–12.4%, drift entanglement 24.3–28.9%), and the mismatch persists against every single-year baseline: Cohen’s w is 0.872, 0.940 and 0.795 for Q7-1 and 0.518, 0.517 and 0.415 for Q10 against the 2021, 2022 and 2023 baselines respectively, compared with 0.864 and 0.478 against the pooled baseline (all p < 10−27). The 2023 baseline, the one closest to the survey date, gives the lowest value for both items: 0.795 for Q7-1, still a large effect, and 0.415 for Q10, in the same medium range as the pooled baseline.
(f) Clustered bootstrap. Respondents are nested within Regional Headquarters and departments, so the respondent-level bootstrap described in Section 3.2.3 assumes an independence that may not hold. The Q7-1 and Q10 proportions were therefore recomputed with a cluster bootstrap that resamples clusters rather than individual respondents, using Regional Headquarters (5 clusters) and departments (426 clusters for Q7-1, 419 for Q10) in turn, with 5000 resamples each. Department-level clustering gives intervals close to the respondent-level ones, since more than half of the departments contributed a single respondent (244 of 426 for Q7-1, 239 of 419 for Q10). Regional-Headquarters clustering, with only five clusters, widens them substantially, but the two proportions that carry the Q7-1 mismatch remain separated from the baseline: collision 6.2% (95% CI 3.8–8.2) against a baseline of 35.0%, and drift entanglement 61.4% (50.9–71.9) against 26.8%. For Q10, grounding 24.2% (22.0–27.2) against 11.5% and the residual category 13.4% (9.2–18.2) against 26.8% likewise remain separated, whereas the collision and drift entanglement intervals widen to include the baseline.

4.3. Survey-Informed Accident-Type Framing

Section 4.2 confirmed that, within the accident-type categories presented in the survey, a clear mismatch exists between the participating practitioners’ perceived accident frequency and the 2021–2023 empirical accident baseline. In particular, drift entanglement was perceived with a higher perceived accident frequency than its actual distribution, whereas collision tended to be perceived as lower. By contrast, operational prevention priority showed a different alignment pattern from perceived accident frequency, suggesting that accident-type-specific prevention priority is formed as a separate operational-judgment layer rather than a mere repetition of frequency perception.
These results show that accident-type-specific risk judgment requires a practitioner-informed framing that considers both on-site perception and past accident frequency together, rather than relying on either alone. Accordingly, to connect the survey–accident-distribution mismatch of Section 4.2 to model design, this section defines five accident-type label framings based on the accident-type categories identified in the survey and the empirical distribution of the actual accident data. Section 4.5 then compares, on the same two-stage framework, the trade-offs that each framing creates among accident coverage, class granularity, predictive stability, and operational interpretability.

4.3.1. Coverage–Granularity Trade-Off Across Five Framing Designs

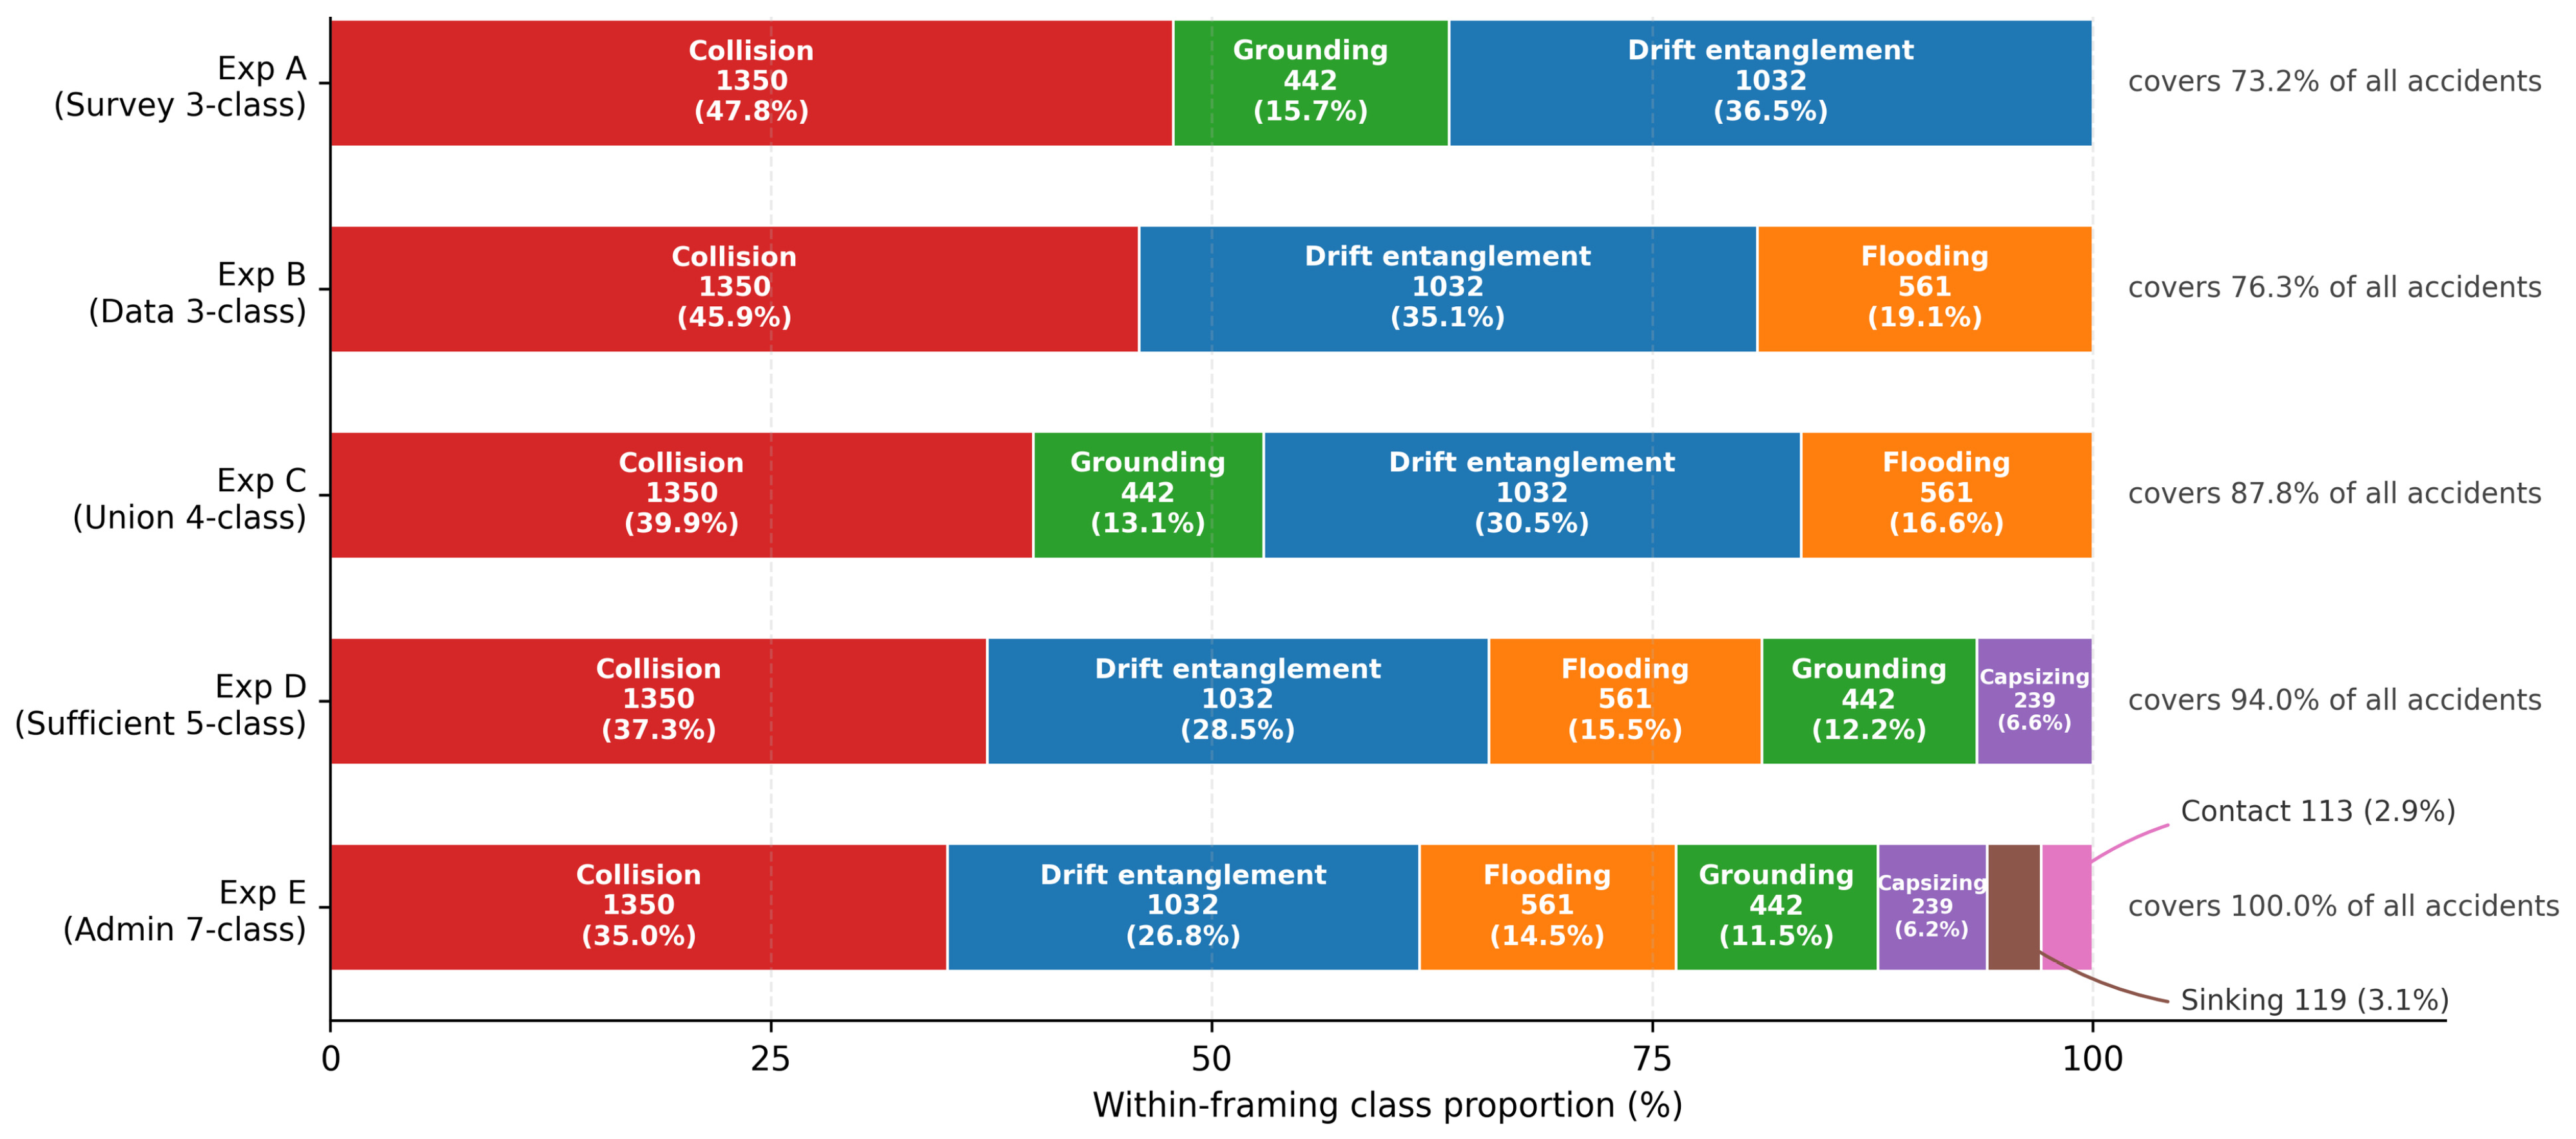
The training classes of the five accident-type framings compared in Stage 2 and the accident distribution by train/validation/test split are organized in Table 8. Based on all N = 3856 accidents in 2021–2023, coverage by framing increases as Exp A 73.2%, Exp B 76.3%, Exp C 87.8%, Exp D 94.0%, and Exp E 100.0%. Here, coverage denotes the proportion of all 2021–2023 accidents that fall into the training classes of the given framing. Figure 9 visually shows the class composition and coverage change in each framing.
The five framings were therefore designed as a comparison structure that progressively expands accident coverage and class granularity.

4.3.2. Positioning the Survey-Aligned Framing Relative to Data-Aligned and Administrative Framings

The survey-aligned framing and the data-aligned framing both included the two major accident-types of collision and drift entanglement. Because these two types account for 61.8% of all accident rows, the accident-types presented in the survey can be regarded as partially reflecting the main structure of the actual accident distribution. However, the two framings differ in one important respect. Grounding is included among the survey’s explicit options but not among the top three types by actual accident frequency, whereas, conversely, flooding is among the top three types by actual accident frequency but is not explicitly listed among the survey options.
This difference shows that the survey-aligned framing reflects accident-types that are operationally more recognizable to the participating practitioners or more readily linked to prevention activities, whereas the data-aligned framing reflects types that are frequent in the accident records. Accordingly, the union and extended framings are interpreted not as simple variants of the same label space, but as a stepwise design for comparing how practitioner alignment, empirical coverage, class granularity, and prediction stability change with the scope of accident-types included.

4.4. Stage 1 Binary Accident Risk Screening

Before evaluating, in Section 4.6, the cascaded performance combining Stage 1 and Stage 2, this section first verifies the performance of Stage 1 alone in judging accident occurrence. The purpose of Stage 1 is to discriminate the probability of an accident occurring in a specific H3 grid-time row using only environmental, vessel-activity, and spatial features observable at the operational stage.
On the 2023 test set ( N = 13,962 ; 1390 accidents, 12,572 non-accidents), the performance of the Stage 1 LightGBM binary classifier was evaluated. The accident base rate of the test set is 0.100, and the Stage 1 model showed ROC-AUC 0.767 and PR-AUC (AP) 0.325 (Table 9). The PR-AUC being higher than the base rate means that the model places grid-time rows with a higher accident probability at the top more effectively than random.
The naive baseline predicts the historical accident rate of each H3 cell calculated from the training set, falling back to the overall training-set accident rate for unobserved cells.
LightGBM outperformed the baseline, with a Brier Skill Score of 0.160 relative to the naive cell-historical-rate baseline. This means that the probability-prediction error of LightGBM was 16.0% lower than that of the cell-history-based baseline. The Stage 1 model can therefore be interpreted as having learned some additional predictive signal from environmental, vessel-activity, and spatial features, beyond simple cell-level historical risk. However, because the improvement is limited, it is appropriate to interpret Stage 1 as a screening step that narrows down grid-time rows with relatively higher accident probability, rather than as an independent high-accuracy accident detector.
The threshold maximizing the F1 score on the validation set was 0.15, and when applied to the 2023 test set, positive recall was 0.371 and positive precision was 0.365. The full threshold sweep and the recall–precision trade-off are presented in Appendix B.
Among the operational features, vessel activity volume is by far the largest contributor to the Stage 1 model, with a gain more than four times that of the next feature. This is the information category that respondents ranked first in Q15 (vessel operation information, 45.9%; Section 4.1.2).

4.5. Accident-Type Framing Trade-Off in Stage 2

4.5.1. Predictive Stability Decreases as Label Granularity Increases

The Stage 2 performance of the five accident-type framings defined in Section 4.3 was compared under a common training and tuning protocol. All experiments used the same feature set, the same LightGBM multi-class classifier, the same temporal split (train/validation/test = 2021/2022/2023), the same class weighting, and the same tuning protocol (Appendix D), with the only difference being the definition of the accident-type label space and the included class set; within that common protocol, the hyperparameter values were selected per framing on the 2022 validation partition. The performance differences in this section are therefore interpreted as showing the effect of categorization-framing choice on predictive stability and operational interpretability.
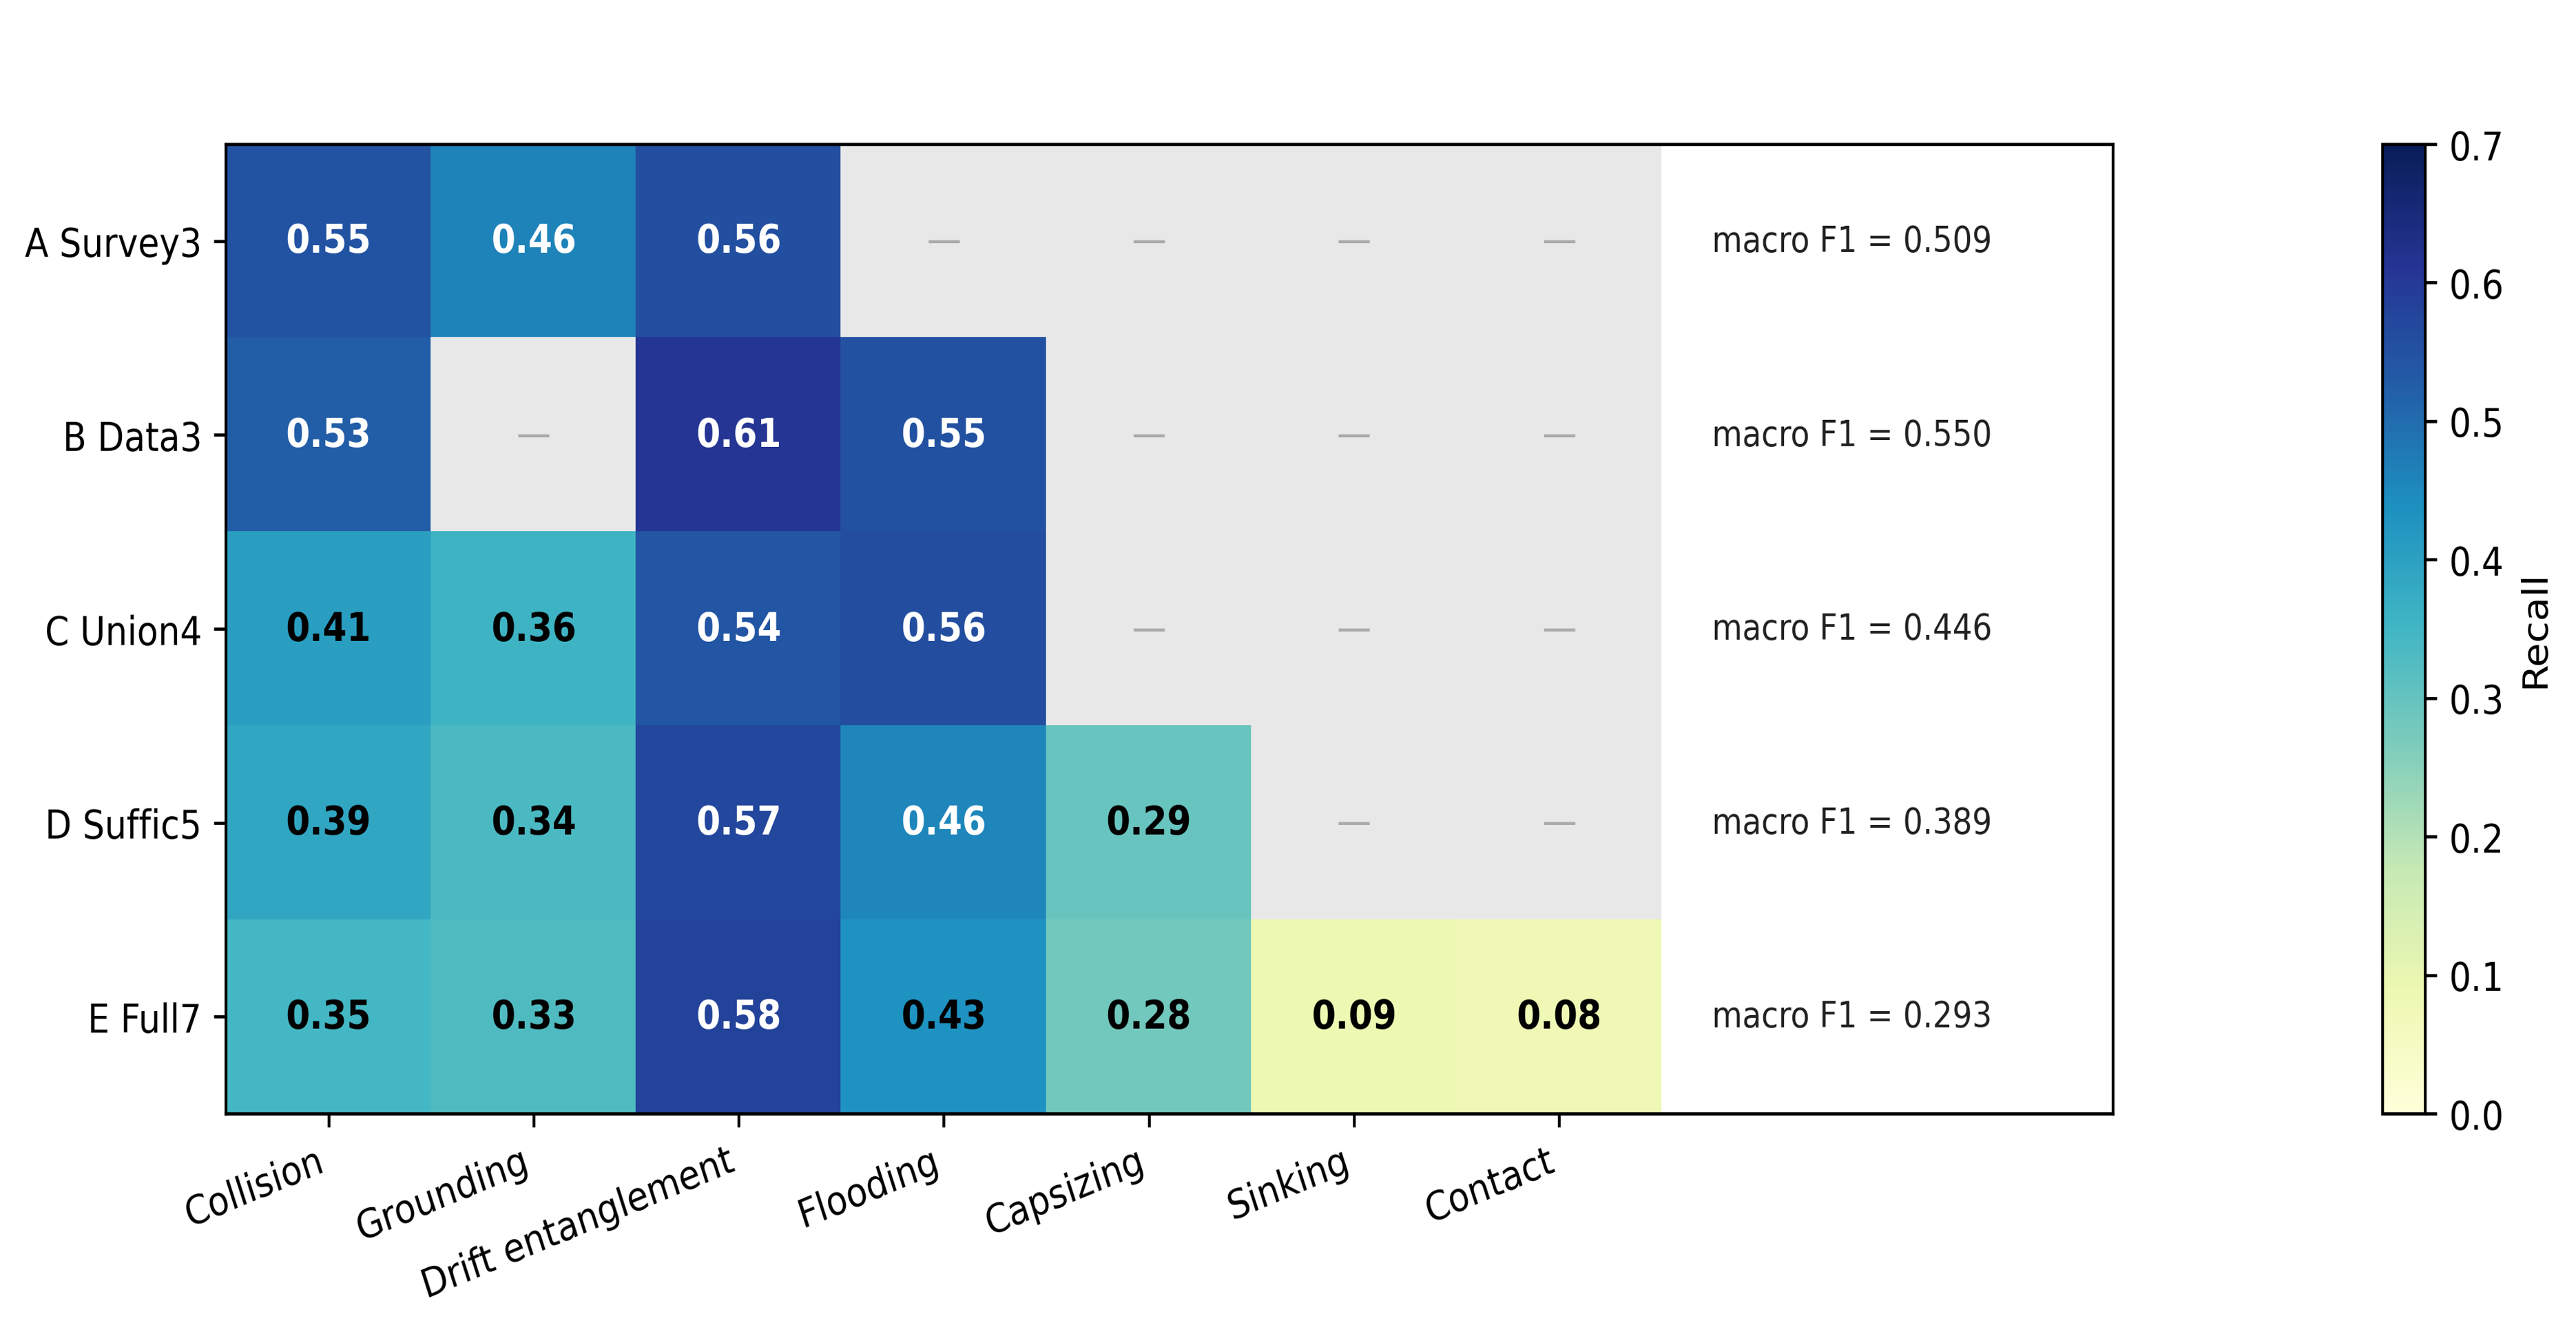
Table 10 summarizes accident coverage, macro F1, and Top-K hit rate by framing. Exp B (data-aligned 3-class) showed the highest performance with macro F1 = 0.550, and Exp A (survey-aligned 3-class) also showed relatively stable performance with macro F1 = 0.509. By contrast, as the number of classes increased, macro F1 decreased to 0.446 for Exp C, 0.389 for Exp D, and 0.293 for Exp E. This shows a trade-off in which expanding accident-type coverage and class granularity increases operational comprehensiveness but lowers predictive stability as minority classes are included.
Figure 10 shows how this macro-level trade-off appears in the per-class recall pattern. In the 3-class framings, the recall of the major classes was relatively stable, but as the label space expanded to four or more classes, the recall variance across classes increased and the low recall of rare classes contributed to the overall decline in macro F1. Accident-type framing is therefore interpreted not simply as a matter of increasing the number of classes, but as a design variable that must jointly consider field alignment, accident coverage, class granularity, and predictive stability.
Because multi-vessel sub-events are retained as separate training samples (Section 3.3.2), the same comparison was repeated on incident-level data, obtained by de-duplicating the vessel-level records of a single occurrence (3856 rows to 3108 unique incidents; only collision changes materially, from 1350 rows to 664 incidents). Re-training the Stage 2 models on those data under the same pipeline changes macro F1 by at most 0.013 and preserves the ordering of the framings.
The per-class breakdown of the seven-class framing is reported as a confusion matrix in Appendix D (Table A8), and it shows that the errors of the rare classes are systematic rather than random. Sinking (n = 47, recall 0.085), contact (n = 38, recall 0.079) and capsizing (n = 68, recall 0.279) are absorbed predominantly into flooding: 44.7%, 31.6% and 20.6% of all cases of each class respectively are predicted as flooding. The low recall of these classes therefore reflects a combination of very small sample sizes and genuine physical overlap between adjacent accident-types—sinking is typically preceded by flooding—rather than instability of the model. This is what drives the decline of the unweighted macro average as the label space expands, while the recall of the major classes remains comparatively stable.

4.5.2. Stage 2 Models Learn Beyond Cell-Level Accident-Type History

Following the same logic as in Section 4.4, this study also checked, in Stage 2, whether LightGBM learns additional predictive signal beyond simple cell-level accident-type history. To this end, the Stage 2 LightGBM performance of each framing was compared with a naive cell-historical-rate baseline. The Stage 2 naive baseline calculates the accident-type distribution of each H3 cell on the training set and then assigns that cell’s past accident-type proportions as the prediction for validation/test rows. When a cell has no accident-type history in the training set, the overall accident-type distribution of the training set was used as the fallback value.
According to Table 11, LightGBM showed higher macro F1 than the naive baseline in all framings. In Exp A–D, it showed about a 1.76–1.81-fold improvement in macro F1 over the naive baseline, and even in the 7-class complete framing (Exp E), it showed a 1.65-fold improvement. This suggests that the Stage 2 model learned additional signal needed to distinguish accident-types from environmental, vessel density, and spatial features, going beyond simply repeating which accident-types frequently occurred in a particular cell in the past.
The fallback rate of the naive baseline was high, at 80.2–90.1%. This means that many accident rows in the test set did not have sufficient cell-level accident-type history in the training set. It is therefore difficult to predict accident-types stably from cell history alone, and ML models that use environmental, vessel-activity, and spatial features play a role in compensating for this sparsity. However, in Exp E, as the number of classes increased to seven and minority classes were included, the ML improvement over the naive baseline also became relatively smaller, again confirming that the complete framing has the highest prediction difficulty.

4.6. End-to-End Decision-Support Interpretation

From a decision-support perspective, the key question is how well the framework captures accident candidates in rows where an actual accident occurred, and how well it includes the accident-type among the Top-K candidates. To evaluate this, the accident-only cascaded Top-K was computed on the 1390 actual accident rows only.
In the accident-only evaluation, a hit was counted only when both conditions were satisfied. First, the accident row must be flagged as a risk row in Stage 1. Second, the actual accident-type must be included among the Top-K accident-type candidates presented by Stage 2. Because this definition reflects both Stage 1 accident-detection failures and Stage 2 accident-type-classification failures, it is an end-to-end metric closer to actual operational conditions.
The accident-only cascaded Top-1, Top-2, and Top-3 hit rates were 0.145, 0.214, and 0.263, respectively (Table 12). The framework is therefore better interpreted not as a model that automatically determines the accident-type as a single correct answer, but as a prioritization-based decision-support framework that selects high-risk rows at the H3 grid-time level and presents possible accident-type candidates.

4.7. Robustness Against Spatial Cell Memorization

The temporal split is suitable for evaluating temporal generalization performance, but because the same H3 cell can be included in both training and test sets, the possibility of performance overestimation due to repeated exposure to specific cells remains. To check this, the spatially contiguous block 5-fold cross-validation described in Methods Section 3.4.6 was performed. In this analysis, five geographically contiguous blocks were constructed from the H3 cell centroids, and in each fold one entire block was used as the test set, forcing the train–test cell overlap to zero and holding out the cells surrounding each test cell.
As shown in Table 13, macro F1 was 0.649 for the temporal hold-out and 0.606 ± 0.003 on average for the contiguous block CV, and ROC AUC was 0.767 for the temporal hold-out and 0.744 ± 0.031 for the contiguous block CV. Across the five blocks, macro F1 ranged from 0.604 to 0.612 and ROC AUC from 0.696 to 0.774, against 0.5 for random ranking, and the positive rate in the held-out blocks was 9.1%; it is therefore difficult to conclude that the ranking performance of the Stage 1 model depends solely on repeated exposure to the same cell or to its neighbors. This suggests that the model learned, in part, general risk patterns contained in environmental, vessel-activity, and spatial features.
However, a difference appeared in the threshold-dependent metrics. In the contiguous block CV, positive recall was 0.180, lower than the temporal hold-out’s 0.371, while positive precision was 0.518, higher. The contiguous block results therefore support the robustness of the ranking signal, but in actual operational deployment, threshold calibration and recall-oriented tuning may additionally be needed for cells observed for the first time in a given region.

5. Discussion

5.1. Main Findings and Operational Implications

This study documented, within the participating sample, a consistent misalignment in maritime accident risk management in Korean territorial waters, in which operational criteria, on-site perception, and integrated decision-support information are not sufficiently aligned. The survey results show that the use of quantitative, standardized accident risk judgment criteria is limited among the participating practitioners, while at the same time there is high demand for interpretable risk information by accident-type and sea area. This suggests that the core problem among the participating practitioners is not low interest in data-driven decision support, but rather the lack of a system for converting diverse operational information into standardized risk signals.
To address this gap, the framework proposed in this study organizes accident risk at the H3 grid-time level and is designed to provide not merely whether an accident occurs but also accident-type-specific risk information. This is directly linked to the practical needs identified in the survey—namely, analysis by specific sea area, provision of information by accident-type, and interpretable risk reports. The framework therefore extends accident risk prediction beyond a simple model-performance problem into the question of in which spatial unit and accident-type unit the information needed for on-site decision-making should be provided.

5.2. Practitioner–Data Mismatch and Decision-Support Framing

The difference between perceived accident frequency and the historical accident baseline shows that it is difficult to assume that the participating practitioners’ accident perception directly reflects the actual accident distribution. At the same time, operational prevention priority tended to align more closely with the actual accident distribution than perceived accident frequency did. This suggests that prevention priority may be a separate decision-making layer that reflects regional operating conditions, resource allocation, policy emphasis, and field experience, rather than a simple copy of ‘accidents that feel frequent.’
This difference is important from the perspective of designing a maritime AI framework. An accident risk prediction system should not be designed as a tool that unilaterally replaces or corrects on-site judgment. Rather, it should be designed as a decision-support layer that, by providing accident-type-specific risk signals based on actual accident data and environmental, vessel, and spatial information, complements on-site perception and makes the perception–data gap visible. From this perspective, the survey-aligned framing of this study serves as a bridge connecting the accident-type categories used by the participating practitioners with accident-data-based modeling.
The connection between the perception analysis and the model results runs through a single class. The label space presented to the participating practitioners in Q7-1 and Q10 and the label space formed by the three empirically most frequent accident-types differ in exactly one position: grounding appears in the former but not the latter, and flooding the reverse (Section 4.3.2). The survey-aligned and data-aligned framings therefore differ by that one substitution, so the performance gap between them reported in Section 4.5—about 0.04 in macro F1—shows what it costs to organize the label space around the categories the survey placed in front of practitioners rather than around empirical frequency. The perceptual difference is thus not reported merely alongside the model results: it determines which label space is worth testing, and the model result quantifies the price of adopting it.

5.3. Accident-Type Framing as a Design Decision

The Stage 2 experimental results show that accident-type framing is not a simple preprocessing choice but a key design element that simultaneously determines prediction performance and operational interpretability. As the label space expands from a survey-aligned or data-aligned 3-class setting to an administratively complete 7-class setting, accident coverage increases, but predictive stability decreases because of the insufficient samples of minority classes.
It is therefore difficult to regard any single framing as optimal for all purposes. The survey-aligned framing is aligned with the categories presented to the participating practitioners, whereas the data-aligned framing can show relatively higher predictive stability. The full administrative (7-class) framing has high coverage and administrative completeness, but has limitations in terms of training stability for rare accident-types. Therefore, in accident-type-specific risk prediction, rather than treating the use of the administrative accident-type scheme as the self-evident default, it is necessary to explicitly report the trade-offs among practitioner alignment, accident coverage, class granularity, and predictive stability.
For the setting studied here, we would recommend the two 3-class framings as the operating points: the data-aligned framing where predictive stability matters most (macro F1 0.550, Top-2 0.859), and the survey-aligned framing where alignment with the categories that the survey presented to practitioners matters more, at a cost of 0.041 in macro F1. Where flooding coverage is operationally required, the union framing raises coverage from 76.3% to 87.8% and remains usable, whereas the five- and seven-class framings should be adopted only when administrative completeness is mandatory, since the classes they add cannot be estimated stably from fewer than 70 test cases each (Section 4.5.1).
From this perspective, the survey-aligned framing is not proposed as the optimal predictor, but should be understood as a design choice that prioritizes alignment with the accident-type categories presented to the participating practitioners in the survey. In this study, the macro F1 of the survey-aligned framing was about 0.04 lower than that of the data-aligned framing, but this difference can be interpreted as the performance cost of organizing the label space around those categories. That is, the choice of accident-type framing is not simply a matter of selecting the highest performance metric, but a matter of balancing predictive stability, accident coverage, and alignment with the categories used in operations.
The single class that separates the two 3-class framings is grounding, which was presented as an explicit option in Q7-1 and Q10, against flooding, which was not. Because that difference could reflect the option list rather than the categories the participating practitioners work with, the free text entries of respondents who selected “other” were examined. In Q7-1, 128 respondents selected “other” and 126 of them wrote an entry, giving 138 entries in total. Engine failure, which was not among the options, was written by 100 respondents, stranding of persons by 17, person-in-water or medical emergencies by 12, and marine pollution by 6, while flooding was written by none. Among the 104 entries for Q10, flooding appears seven times, five of which enumerate the six administrative accident categories as a whole rather than name flooding as a priority. Grounding, already available as an option, appears three times in the Q7-1 entries and three times in the Q10 entries, the latter only inside such enumerations. The option list therefore constrains what could be selected, and the free text entries do show that a category outside the option list is recorded when respondents consider it important; on that evidence, the absence of flooding from the option list does not appear to be what kept it out of the responses.

5.4. Methodological Implications and Relation to Prior Work

The contribution of this study lies less in proposing a new algorithm and more in reframing the maritime accident prediction problem as a practitioner-informed decision-support problem. Prior maritime accident prediction research has focused mainly on predicting accident occurrence, post hoc accident-type classification at the accident level, or multi-class classification based on overseas accident-type taxonomies. By contrast, this study combined KCG practitioner survey data with H3 grid-time-based accident and environment data to evaluate how accident-type label design affects operationally interpretable risk prediction.
The purpose of this study is therefore not a simple numerical performance comparison with prior work. As set out in Section 3.4.5, a direct numerical comparison across studies has large interpretive limitations. This study used LightGBM as a consistent reference learner to compare the effect of differences in accident-type framing—rather than differences in model structure—on prediction performance and operational interpretability.
The framework is defined in terms that are not specific to Korean waters, and its transferability can be stated at three levels. The design is portable: the H3 grid-time unit, the two-stage decomposition into occurrence and conditional accident-type, and the protocol for comparing label spaces make no assumption about the sea area. The inputs are also generally available, since AIS-derived vessel activity, meteorological and oceanographic observations, and static spatial features such as distance to ports, anchorages and aquaculture facilities are recorded in many maritime jurisdictions. What does not transfer is the label space itself. It has to be re-derived for each jurisdiction, both from the administrative accident taxonomy in use—the IMO and EMCIP category sets differ from the Korean one in their treatment of flooding and sinking, as set out in Section 2.2—and from the accident-types that local operators actually work with; drift entanglement is a Korean example of a category with no counterpart elsewhere, and other regions may have their own. The reported performance does not transfer either. The cross-validation results in Section 4.7 indicate that the ranking signal is not tied to particular cells, but it also shows that the recall and precision obtained at a fixed threshold change when the model is applied to cells it has not seen, so deployment in a new area would require its own threshold calibration (Appendix B) and its own validation.

5.5. Limitations and Practical Considerations

This study has several limitations. First, the survey was conducted through the cooperation of KCG frontline departments and is not a probability-sample-based random survey. In addition, because of the self-reported nature of the responses, social desirability bias cannot be entirely ruled out, and the absence of a response rate makes it difficult to quantitatively assess non-response bias. To mitigate this, anonymous and de-identified collection, aggregate-level reporting, and within-respondent agreement (Cohen’s κ) analysis of Q7-1 and Q10 were performed.
Second, the survey was conducted as a one-time survey, and Q7-1 and Q10 consisted of three pre-presented accident-types plus an ‘other’ option. The perception–baseline comparison should therefore be interpreted not as a complete perception analysis of all seven administrative accident-types, but as a comparison based on the survey-presented categories. Future research should verify the perception structure more directly through a survey design that includes all accident-types.
Third, the accident data are based on 2021–2023 data, and prospective validation in an actual operational environment was not performed. The cross-validation designs in Section 3.4.6 provide evidence for checking the possibility of memorization due to repeated exposure to the same cell, but they do not fully validate new operational sea areas, real-time calibration, threshold setting, or field-user responses. In addition, minority accident-types such as sinking and contact have few samples and are difficult to train stably.
The H3 grid-time risk information presented in this study should be understood not as an absolute accident probability but as a relative risk score for deriving operational priorities. Applying this framework in practice would require establishing region-specific threshold-calibration strategies and integrating it with actual patrol and prevention tasks, while a longer accident-data period would further improve its robustness.

6. Conclusions

This study combined survey responses from 826 Korea Coast Guard frontline practitioners with 2021–2023 H3 grid-time accident data for Korean territorial waters to reframe maritime accident risk prediction not as a simple estimation of accident-occurrence probability but as an accident-type-specific decision-support problem. The survey analysis showed a lack of quantitative accident risk judgment criteria and of an integrated information-provision system, and confirmed that perceived accident frequency and operational prevention priority align with the actual accident distribution in different ways. On this basis, the study compared survey-aligned and data-aligned accident-type framings and showed that label space design creates trade-offs among accident coverage, class granularity, predictive stability, and operational interpretability.
The results of this study suggest that AI-based maritime accident prediction systems should be designed not to replace on-site judgment but as a decision-support layer that complements the gap between the risk the participating practitioners perceive and the actual accident data. In conclusion, this framework offers a design option that balances practitioner alignment with data-driven prediction. Such a foundation would require linkage with real-time data and validation in the field before it could be applied in maritime safety operations, and the present study is significant in that it lays this groundwork.

Author Contributions

Conceptualization, W.C., S.S. and D.K.; methodology, W.C., S.S. and D.K.; software, D.K.; validation, W.C., H.C., S.S., S.O. and D.K.; formal analysis, D.K.; investigation, S.S., H.C. and D.K.; resources, W.C. and H.C.; data curation, W.C. and D.K.; writing—original draft preparation, W.C. and D.K.; writing—review and editing, W.C., S.S., S.O. and D.K.; visualization, D.K.; supervision, W.C. and S.O.; project administration, W.C. and S.O.; funding acquisition, S.O. All authors have read and agreed to the published version of the manuscript.

Funding

This research was supported by the Korea Institute of Marine Science & Technology Promotion (KIMST) grant funded by the Ministry of Oceans and Fisheries, Republic of Korea (grant number RS-2024-00415504, Development of AI-based convergence maritime data analysis and utilization technology for civil, military, and coast guard).

Institutional Review Board Statement

Ethical review and approval were not prospectively obtained because the survey was conducted as an anonymous institutional occupational needs assessment under the cooperation of the Korea Coast Guard. The survey collected work-related opinions on maritime accident prevention and decision-support requirements and did not collect direct personal identifiers or sensitive personal information. The authors received only de-identified response data and analyzed all results at an aggregate level.

Informed Consent Statement

Informed consent was obtained from all participants involved in the survey. Consent was implied by voluntary completion of the anonymous survey after participants were informed of the study purpose and data-use conditions.

Data Availability Statement

The datasets presented in this article are not readily available because the data are confidential and provided by the Korea Coast Guard and other relevant authorities.

Acknowledgments

The authors would like to thank the Korea Coast Guard practitioners who participated in the survey and provided valuable operational insights for this study.

Conflicts of Interest

Author Dayoung Kim was employed by the company Pangyo Headquarters AX Center, Suresoft Technologies Inc. And author Seung Sim was employed by the company DA Research Lab, SureDataLab Inc. The remaining authors declare that the research was conducted in the absence of any commercial or financial relationships that could be construed as a potential conflict of interest.

Abbreviations

The following abbreviations are used in this manuscript:
AISAutomatic Identification System
CIConfidence interval
CVCross-validation
H3Hexagonal hierarchical geospatial indexing system
KCGKorea Coast Guard
KHOAKorea Hydrographic and Oceanographic Agency
KMAKorea Meteorological Administration
PR-AUCPrecision–recall area under the curve
ROC-AUCReceiver operating characteristic area under the curve
GICOMSGeneral Information Center on Maritime Safety and Security
IRBInstitutional Review Board
VTSVessel-Traffic Service
KMSTKorea Maritime Safety Tribunal

Appendix A

Full Survey Questionnaire (Survey Block 2-1: AI-Based Maritime Accident Prediction)

This appendix presents, in the original Korean (verbatim) and in English translation, the full set of items in the ‘AI-based maritime accident prediction technology’ area (survey area 2-1) of the KCG frontline-personnel survey described in Section 3.2. This area consists of 17 items, Q1–Q17, with Q7, Q16, and Q17 each divided into two sub-items, comprising 20 sub-items in total (Table A1, Korean original + English translation). Table 2 in the main text is an excerpt of the 10 core items directly used in the quantitative analysis. All items provided a free text ‘other’ option in addition to the pre-presented choices.
Table A1. Survey block 2-1 (AI-based maritime accident prediction)—full item set, Korean verbatim with English translation.
CodeQuestion (Korean, Verbatim)Response Options (Korean, Verbatim)Question (English Translation)Response Options (English Translation)
Q1귀 기관(파출소)에서는 현장에서 사고위험구역을 자체적으로 선정하고 있습니까?① 예/② 아니오/③ 검토 중이다/④ 기타의견Does your agency (substation) independently designate accident risk zones in the field?① Yes/② No/③ Under review/④ Other (free text)
Q2자체적으로 사고위험구역을 선정하신다면, 주로 어떤 정보를 활용하십니까?① 과거 사고 통계(신고, 출동 빈도 등)/② 선박 항적 데이터(AIS, V-PASS 등)/③ 현장 경험 및 관측 정보/④ 기타의견If you designate accident risk zones independently, what information do you mainly use?① Past accident statistics (reports, dispatch frequency, etc.)/② Vessel track data (AIS, V-PASS, etc.)/③ Field experience and observation/④ Other (free text)
Q3사고위험구역을 판단할 때 가장 중요한 요인은 무엇이라고 생각하십니까?① 선박 통항량(교통량)/② 기상·해황 조건/③ 지형적 요인(암초, 수심 등)/④ 기타의견What do you consider the most important factor when judging accident risk zones?① Vessel-traffic volume/② Weather and sea-state conditions/③ Topographic factors (reefs, water depth, etc.)/④ Other (free text)
Q4만약 사고위험구역이 변경된다면, 그 주요 원인은 무엇이라고 생각하십니까?① 계절·기상 변화/② 어장 이동 또는 활동 구역 변화/③ 선박 운항 패턴 변화/④ 기타의견If accident risk zones were to change, what do you think would be the main cause?① Seasonal/weather change/② Shift in fishing grounds or activity areas/③ Change in vessel operation patterns/④ Other (free text)
Q5사고위험구역을 설정할 때 정량적 기준(예: 교통량, 출항 수, 날씨 등)을 사용하십니까?① 예, 구체적인 기준이 있다/② 일부 상황에서 참고한다/③ 경험에 근거한다/④ 명확한 기준은 없다/⑤ 기타의견When setting accident risk zones, do you use quantitative criteria (e.g., traffic volume, number of departures, weather)?① Yes, specific criteria exist/② Referenced in some situations/③ Based on experience/④ No clear criteria/⑤ Other (free text)
Q6사고가 잦은 경우, 주요 원인은 무엇이라고 생각하십니까?① 항로 혼잡/② 어선 밀집/③ 기상 급변/④ 기타의견When accidents are frequent, what do you think is the main cause?① Route congestion/② Fishing-vessel density/③ Sudden weather change/④ Other (free text)
Q7-1귀하의 관할 해역에서 가장 빈번하게 발생하는 사고 유형은 무엇입니까?① 충돌/② 좌초/좌주/③ 부유물 감김/④ 기타의견What is the most frequent accident-type in your jurisdictional waters?① Collision/② Grounding/stranding/③ Drift entanglement/④ Other (free text)
Q7-2가장 자주 발생하는 사고 유형의 주요 요인은 무엇이라고 생각하십니까?① 항로 교차 또는 혼잡 구간/② 저수심·암초 등 지형적 요인/③ 기상 급변 구간/④ 기타의견What do you think is the main factor behind the most frequent accident-type?① Route crossing or congested segments/② Topographic factors such as shallow water and reefs/③ Areas of sudden weather change/④ Other (free text)
Q8사고 발생이 빈번한 시기나 조건이 있다면, 그에 영향을 미치는 주요 요인은 무엇이라고 생각하십니까?① 계절적 요인(여름 장마, 겨울 한파 등)/② 시간대 요인(야간, 새벽 등)/③ 기상·기후 요인(강풍, 안개 등)/④ 선박 활동량 증가 시기/⑤ 기타의견If there are periods or conditions of frequent accidents, what do you think is the main influencing factor?① Seasonal factors (summer monsoon, winter cold wave, etc.)/② Time-of-day factors (night, dawn, etc.)/③ Weather/climate factors (strong wind, fog, etc.)/④ Periods of increased vessel activity/⑤ Other (free text)
Q9귀하의 관할 구역 내 사고위험구역은 어떤 기상·지형적 특성을 보입니까?① 조류 세기, 수심, 암초 등 지형적 요인/② 풍속, 파고, 안개 등 기상 요인/③ 선박 운항 밀집도/④ 계절·시간대 요인/⑤ 기타의견What weather and topographic characteristics do the accident risk zones in your jurisdiction show?① Topographic factors such as current strength, water depth, and reefs/② Weather factors such as wind speed, wave height, and fog/③ Vessel operation density/④ Seasonal and time-of-day factors/⑤ Other (free text)
Q10현재 귀하의 근무지에서 중점적으로 예방하고 있는 해양사고 유형은 무엇입니까?① 충돌/② 좌초/좌주/③ 부유물 감김/④ 기타의견What maritime accident-type is currently the focus of prevention at your workplace?① Collision/② Grounding/stranding/③ Drift entanglement/④ Other (free text)
Q11해당 사고 유형을 예방하기 위해 가장 중요하게 고려하는 요인은 무엇입니까?① 선박 운항 통제/② 항로 관리/③ 기상 모니터링/④ 안전 교육 강화/⑤ 기타의견What factor do you consider most important for preventing that accident-type?① Vessel operation control/② Route management/③ Weather monitoring/④ Strengthened safety education/⑤ Other (free text)
Q12귀하께서는 현재 해양경찰 조직 내에 ‘공통된 사고위험 판단 기준’이 존재한다고 생각하십니까?① 명확히 존재함/② 일부 기준이 공유됨/③ 지역별로 상이함/④ 존재하지 않음/⑤ 기타의견Do you think a ‘common accident risk judgment criterion’ currently exists within the Korea Coast Guard organization?① Clearly exists/② Some criteria are shared/③ Varies by region/④ Does not exist/⑤ Other (free text)
Q13사고위험 판단 기준은 주로 어느 수준에서 운영되고 있다고 생각하십니까?① 본청 공통 기준 중심/② 지방청(지역본부) 기준 중심/③ 파출소 자체 판단 중심/④ 혼합 형태/⑤ 기타의견At what level do you think accident risk judgment criteria are mainly operated?① Centered on headquarters-wide common criteria/② Centered on regional-command (regional headquarters) criteria/③ Centered on substation independent judgment/④ Mixed form/⑤ Other (free text)
Q14(해양사고 위험도 예측 알고리즘 설계) 사고 위험도 예측 시 AI가 가장 중점적으로 고려해야 할 데이터는 무엇이라고 생각하십니까?① 기상·해황 정보(풍속, 파고 등)/② 선박 운항 정보(AIS, V-PASS 등)/③ 사고 이력 데이터/④ 기타의견(Accident risk prediction algorithm design) What data do you think AI should focus on most when predicting accident risk?① Weather/sea-state information (wind speed, wave height, etc.)/② Vessel operation information (AIS, V-PASS, etc.)/③ Accident history data/④ Other (free text)
Q15(해양사고 위험도 예측 제공 정보) 사고 예측 시스템이 제공해야 할 가장 유용한 정보는 무엇이라고 생각하십니까?① 기상·해황 정보(풍속, 파고 등)/② 선박 운항 정보(AIS, V-PASS 등)/③ 사고 이력 데이터/④ 기타의견(Accident risk prediction output information) What is the most useful information the accident prediction system should provide?① Weather/sea-state information (wind speed, wave height, etc.)/② Vessel operation information (AIS, V-PASS, etc.)/③ Accident history data/④ Other (free text)
Q16-1(해양사고 위험도 예측) 위의 해양사고 예측 결과 조회 시나리오에 대해 만족하십니까?① 만족/② 불만족/③ 기타의견(Accident risk prediction) Are you satisfied with the accident-prediction result lookup scenario described above?① Satisfied/② Unsatisfied/③ Other (free text)
Q16-2(해양사고 위험도 예측) 사고 위험도 해석 리포트를 제시할 때, 어떤 방식이 이해에 도움이 된다고 생각하십니까?① 위험 요인에 대한 관측값, 위험 영향도, 기준값을 포함한 테이블 형태 (위의 예시 그림 참고)/② 위험 요인에 대한 문장 형태의 설명 (예: 이 구역은 풍속 증가로 사고 위험도 높습니다.)/③ 기타의견(Accident risk prediction) When presenting the accident risk interpretation report, which presentation format do you find more helpful for understanding?① A table format containing the observed value, risk-impact magnitude, and reference value for each risk factor (see the example figure above)/② A sentence-form explanation of the risk factors (e.g., ‘This zone has elevated accident risk due to increased wind speed.’)/③ Other (free text)
Q17-1(해양사고 경향도 분석) 분석 결과에 대해 전국 단위 혹은 해양사고 위험도 예측과 같이 특정 구역을 선호하십니까? (위의 해양사고 경향도 분석 결과 조회 시나리오를 참고)① 전국/② 특정 구역/③ 기타의견(Accident trend analysis) For the analysis results, do you prefer a nationwide scope, or a specific zone as in the accident risk prediction? (Refer to the trend-analysis result lookup scenario above.)① Nationwide/② Specific zone/③ Other (free text)
Q17-2(해양사고 경향도 분석) 분석 결과를 확인하고 싶은 유형의 범위가 있으십니까?① 모든 유형/② 특정 유형/③ 기타의견(Accident trend analysis) Is there a specific range of accident-types whose analysis results you would like to review?① All types/② Specific types/③ Other (free text)
Q16-1 and Q16-2 were presented following this scenario description in the survey—‘On the initial screen of the web system, after selecting the desired area and clicking the query button, the maritime-accident-probability algorithm result for the selected area at the time of clicking the query button is displayed on screen.’ Q17-1 and Q17-2 were presented following this scenario description—‘On the initial screen of the web system, after selecting the start/end dates for maritime accident information retrieval and clicking the query button, the trend-analysis result for maritime accidents in the selected period is displayed on screen.’

Appendix B

Stage 1 Threshold Sweep

As described in Section 3.4.5, the operational threshold of the Stage 1 binary classifier was selected as the value that maximizes macro F1 on the validation set, and that value is 0.15. This appendix presents the recall, precision, F1, and F2 of the positive (accident) class and the macro F1 measured on the 2023 test set (N = 13,962; 1390 accident rows) as the classification threshold is varied from 0.05 to 0.80 (Table A2).
Table A2. Stage 1 threshold sweep (Test 2023, N = 13,962; 1390 accident rows).
ThresholdRecall (Accident)Precision (Accident)F1 (Accident)F2 (Accident)Macro F1
0.050.7570.1810.2920.4630.523
0.100.5050.2870.3660.4380.633
0.15 (selected)0.3710.3650.3680.3690.649
0.200.2890.4180.3410.3080.641
0.250.2170.4630.2950.2420.620
0.300.1690.4950.2520.1950.599
0.350.1320.5450.2120.1550.580
0.400.0990.5800.1700.1190.559
0.500.0420.5960.0790.0520.514
0.600.0120.6800.0240.0150.486
0.700.0040.7500.0090.0050.478
0.800.0011.0000.0010.0010.475
The ‘0.15 (selected)’ row is the operational threshold selected by maximizing macro F1 on the validation set. Lowering the threshold increases recall but decreases precision (at a threshold of 0.05, recall 0.757, precision 0.181), and raising the threshold shows the opposite tendency. Macro F1 reaches its maximum of 0.649 at a threshold of 0.15. This sweep shows that it is difficult to keep both recall and precision high at a single threshold, and indicates that when operating Stage 1 as a screening step that narrows down risky grid-time rows, the threshold can be adjusted according to the operational scenario.

Appendix C

Subgroup Robustness of the Perception–Reality and Priority–Reality Gaps

This presents the full results of the subgroup robustness analysis summarized in Section 4.2.4. The gap is the value obtained by subtracting the actual 2021–2023 accident-frequency proportion from the survey response proportion for each accident-type (percentage points, %p). It is reported for each of 16 subgroups, including Regional Headquarters (5), job (5), work experience (5), and all respondents (overall).
Table A3. Perception (Q7-1) subgroup robustness—gap (survey perception − empirical accident frequency, %p).
Subgroup DimensionSubgroupNCollision GapGrounding GapDrift Entanglement GapOther GapDirection Preserved
Regional CommandSouth Sea145−26.0+1.6+14.6+9.9
Regional CommandEast Sea165−32.0+0.6+51.4−20.0
Regional CommandWest Sea262−25.1+7.2+34.7−16.8
Regional CommandJeju43−30.3−6.8+47.6−10.4
Regional CommandCentral200−29.0+11.5+28.7−11.2
Job CategoryAdmin79−28.7−6.4+47.9−12.8
Job CategoryCoastal/Prev89−27.1+0.9+41.7−15.5
Job CategoryOther307−29.8+12.3+26.0−8.5
Job CategoryPatrol/Vessel238−25.8+2.4+32.4−9.1
Job CategorySituation/VTS88−28.2+3.3+44.8−19.9
Experience1–3 y31−25.3+4.6+31.3−10.6
Experience3–5 y323−28.5+4.9+35.4−11.8
Experience5–10 y255−27.5+5.4+30.8−8.7
Experience10–20 y137−28.4+7.5+33.8−12.8
Experience20 y+62−28.5+3.0+36.1−10.6
OverallAll respondents815−27.9+5.2+33.7−11.0
✓ indicates that the direction of the perception–reality gap is preserved in that subgroup, that is, collision is under-perceived and drift entanglement is over-perceived relative to the empirical accident distribution.
In the subgroup analysis, the direction of the perception–reality mismatch was consistently maintained across all 16 subgroups. In every subgroup, collision was under-perceived (gap = −25.1 to −32.0 pp) and drift entanglement was over-perceived (gap = +14.6 to +51.4 pp). This shows that the mismatch is not driven by a particular respondent group but is an overall field-perception pattern. The prevention-focus results based on Q10 are presented in Table A4.
Table A4. Priority (Q10) subgroup robustness—gap (survey priority − empirical accident frequency, %p).
Subgroup DimensionSubgroupNCollision GapGrounding GapDrift Entanglement GapOther Gap
Regional CommandSouth Sea146+14.3+10.4−17.2−7.5
Regional CommandEast Sea168−9.4+8.7+13.7−13.0
Regional CommandWest Sea259+5.5+11.7+2.9−20.1
Regional CommandJeju42+5.5+21.8−14.9−12.4
Regional CommandCentral196−18.2+14.5+16.1−12.4
Job CategoryAdmin81−14.0+8.3+13.9−8.2
Job CategoryCoastal/Prev87−7.4+10.3+12.3−15.2
Job CategoryOther305−3.5+20.0−1.2−15.2
Job CategoryPatrol/Vessel236+2.3+6.3+7.1−15.7
Job CategorySituation/VTS88+9.3+5.5−6.3−8.5
Experience1–3 y30−5.0+21.8−0.1−16.7
Experience3–5 y322−3.9+11.5+6.7−14.3
Experience5–10 y253−4.2+11.4+6.8−14.1
Experience10–20 y137+4.4+11.1−2.7−12.8
Experience20 y+62+6.9+17.5−10.7−13.8
OverallAll respondents811−1.7+12.1+3.8−14.1
The gap for priority (Q10) is smaller than that for perception (Q7-1) and its sign varies across subgroups, showing that operational priority is allocated more closely to the actual accident frequency than simple perception is (consistent with the prevention-focus discussion in Section 4.2).
The results of the chi-square independence tests between the three axes—region, job, and experience—and the Q7-1 and Q10 responses are presented in Table A5.
Table A5. Region·Job·Experience × {Q7-1, Q10} chi-square independence + Cramér’s V.
Dimension × Itemχ2 (df = 12)NCramér’s Vp
Region × Q7-190.687880.196<10−13
Job × Q7-143.197880.1352.1 × 10−5
Experience × Q7-13.797810.0400.987
Region × Q1091.597630.200<10−13
Job × Q1052.287630.1515.5 × 10−7
Experience × Q1020.517560.0950.058

Appendix D

Model Configuration and Reproducibility

This appendix reports the complete configuration of the two-stage framework. Stage 1 uses a fixed hyperparameter set (Table A6). Stage 2 applies the same tuning protocol to every accident-type framing, with the hyperparameter values selected separately for each framing on the 2022 validation partition (Table A7). All stochastic components—the learner, the training-data shuffling, the inner split used for early stopping during tuning, and the hyperparameter search sampler—are governed by a single seed (random_state = 42). Table A8 additionally reports the Stage 2 confusion matrix of the administratively complete seven-class framing.
Table A6. Stage 1 binary classifier: complete model, hyperparameter and data-processing configuration.
SettingValue
LearnerLightGBM (LGBMClassifier), objective = binary
Number of treesn_estimators = 4000 (early stopping applied)
Learning rate0.02
Number of leavesnum_leaves = 63
Maximum tree depthmax_depth = −1 (unlimited)
Minimum child observationsmin_child_samples = 20
Feature fractioncolsample_bytree = 0.8
Bagging fractionsubsample = 0.8
L1/L2 regularizationreg_alpha = 0.0/reg_lambda = 0.0
Class weightingNone (scale_pos_weight = 1.0); the accident/non-accident imbalance is handled by the 10:1 dataset design (Section 3.3.2) and by threshold selection
Early stopping300 rounds, binary log-loss on the 2022 validation partition
Random seedrandom_state = 42
Missing valuesNumerical features: train-fold median imputation; the two wave-period variables with the highest missing rates excluded (Section 3.3.3). Categorical features: LightGBM native handling, no one-hot encoding
Negative samplingNo additional undersampling; the 10:1 accident/non-accident dataset design of Section 3.3.2 retained
Train/validation/test2021 (14,385 rows)/2022 (14,069 rows)/2023 (13,962 rows); temporal split
Table A7. Stage 2 multi-class classifier: model configuration and hyperparameter selection. Values given as a range were selected separately for each framing on the 2022 validation partition (Section 3.4.3).
SettingValue
LearnerLightGBM (LGBMClassifier), objective = multi-class
Number of treesn_estimators ∈ [1000, 4000] (early stopping applied)
Learning rate∈ [1 × 10⁻³, 1 × 10⁻¹], log scale
Number of leavesnum_leaves ∈ [16, 128]
Maximum tree depthmax_depth = −1 (unlimited)
Minimum child observationsmin_child_samples ∈ [5, 100]
Feature fractioncolsample_bytree ∈ [0.5, 1.0]
Bagging fractionsubsample ∈ [0.6, 1.0]
L1/L2 regularizationreg_alpha ∈ [1 × 10⁻³, 10]/reg_lambda ∈ [1 × 10⁻³, 10], log scale
Class weightingclass_weight = “balanced”
Early stopping100 rounds on the 2022 validation partition
Random seedrandom_state = 42
Train/validation/test2021/2022/2023; temporal split, accident rows only
Table A8. Stage 2 confusion matrix for the administratively complete (seven-class) framing (test partition 2023; N = 1390 accident rows). Rows are the recorded accident-type and columns the predicted accident-type.
Actual\PredictedCollisionDrift EntanglementFloodingGroundingCapsizingSinkingContact
Collision164143596824105
Drift entanglement5423323671753
Flooding222982212663
Grounding233334571484
Capsizing101314101920
Sinking28218341
Contact97122503
The diagonal holds correctly classified accident rows; each off-diagonal entry shows where the misclassified rows of that accident-type were placed. The flooding column concentrates the errors of the three rarest classes, which is interpreted in Section 4.5.1.
Table A9. Stage 1 negative-sampling sweep. Eight settings were run with five random seeds each (40 runs); undersampling was applied to the training partition only, and the validation and test partitions were kept at the 10:1 distribution throughout. Values are mean ± standard deviation over the five seeds. The decision threshold of each run was selected on the validation partition, and the settings were compared on that partition. The settings from 4:1 downwards in this table lie within one combined standard deviation of the best validation mean; the adopted setting is the one that retains all available training negatives.
Negative-to-Positive RatioValidation Macro F1Test Macro F1Validation PR-AUCTest PR-AUCTraining Negatives
1:10.620 ± 0.0110.630 ± 0.0100.2880.3031196
2:10.628 ± 0.0040.639 ± 0.0040.3010.3122392
3:10.629 ± 0.0050.639 ± 0.0020.3060.3173588
4:10.631 ± 0.0080.640 ± 0.0040.3160.3184784
6:10.639 ± 0.0080.648 ± 0.0030.3280.3257176
7:10.631 ± 0.0060.643 ± 0.0080.3220.3258372
8:10.635 ± 0.0060.646 ± 0.0040.3250.3279568
10:1 (retained; adopted)0.634 ± 0.0090.647 ± 0.0080.3250.32713,189
The 2022 validation partition is used for four model-selection decisions—early stopping, Stage 1 decision-threshold selection, the Stage 1 negative-sampling setting, and Stage 2 hyperparameter selection—whereas the 2023 test partition is used only to report the results and enters no selection step.

References

  1. Marine Accident Statistics. Available online: https://www.kmst.go.kr/web/stcAnnualReport.do?menuIdx=126 (accessed on 8 June 2026).
  2. Hetherington, C.; Flin, R.; Mearns, K. Safety in Shipping: The Human Element. J. Saf. Res. 2006, 37, 401–411. [Google Scholar] [CrossRef] [PubMed]
  3. Akhtar, M.J.; Utne, I.B. Human Fatigue’s Effect on the Risk of Maritime Groundings—A Bayesian Network Modeling Approach. Saf. Sci. 2014, 62, 427–440. [Google Scholar] [CrossRef]
  4. Lin, Y.; Li, X.; Yuen, K.F. Machine Learning Applications for Risk Assessment in Maritime Transport: Current Status and Future Directions. Eng. Appl. Artif. Intell. 2025, 155, 110959. [Google Scholar] [CrossRef]
  5. Uber Technologies, Inc. H3: Hexagonal Hierarchical Geospatial Indexing System. Available online: https://github.com/uber/h3 (accessed on 20 May 2026).
  6. Nourmohammadi, Z.; Nourmohammadi, F.; Kim, I.; Park, S.H. A Deep Spatiotemporal Approach in Maritime Accident Prediction: A Case Study of the Territorial Sea of South Korea. Ocean Eng. 2023, 270, 113565. [Google Scholar] [CrossRef]
  7. Shin, G.; Yang, H. Maritime Accident Prediction in Busan Port Using Machine Learning: An Integrated Approach with Maritime Accident Reports and VTS Data. Ocean Eng. 2025, 316, 119968. [Google Scholar] [CrossRef]
  8. Jo, S.; Lee, G.; Park, S.; Heo, J.; Kim, D.; Sim, S.; Bae, H. Deep Learning Framework for Regional Maritime Collision Risk Assessment Using CNN and Grad-CAM. Ocean Eng. 2026, 343, 123452. [Google Scholar] [CrossRef]
  9. Korupoju, A.K.; Kapadia, V.; Vilwathilakam, A.S.; Samanta, A. Ship Collision Risk Evaluation Using AIS and Weather Data through Fuzzy Logic and Deep Learning. Ocean Eng. 2025, 318, 120116. [Google Scholar] [CrossRef]
  10. Munim, Z.H.; Sørli, M.A.; Kim, H.; Alon, I. Predicting Maritime Accident Risk Using Automated Machine Learning. Reliab. Eng. Syst. Saf. 2024, 248, 110148. [Google Scholar] [CrossRef]
  11. Brandt, P.; Munim, Z.H.; Chaal, M.; Kang, H.-S. Maritime Accident Risk Prediction Integrating Weather Data Using Machine Learning. Transp. Res. D Transp. Environ. 2024, 136, 104388. [Google Scholar] [CrossRef]
  12. Zhang, C.; Zou, X.; Lin, C. Fusing XGBoost and SHAP Models for Maritime Accident Prediction and Causality Interpretability Analysis. J. Mar. Sci. Eng. 2022, 10, 1154. [Google Scholar] [CrossRef]
  13. Zhao, Z.; Liu, X.; Feng, L.; Grifoll, M.; Feng, H. Causation Analysis of Marine Traffic Accidents Using Deep Learning Approaches: A Case Study from China’s Coasts. Systems 2025, 13, 284. [Google Scholar] [CrossRef]
  14. Feng, Y.; Wang, X.; Chen, Q.; Yang, Z.; Wang, J.; Li, H.; Xia, G.; Liu, Z. Prediction of the Severity of Marine Accidents Using Improved Machine Learning. Transp. Res. E Logist. Transp. Rev. 2024, 188, 103647. [Google Scholar] [CrossRef]
  15. Balas, E.A.; Balas, C.E. Maritime Risk Assessment: A Cutting-Edge Hybrid Model Integrating Automated Machine Learning and Deep Learning with Hydrodynamic and Monte Carlo Simulations. J. Mar. Sci. Eng. 2025, 13, 939. [Google Scholar] [CrossRef]
  16. International Maritime Organization (IMO). Reports on Marine Casualties and Incidents: Revised Harmonized Reporting Procedures, MSC-MEPC.3/Circ.4/Rev.1. Available online: https://www.imo.org/en/OurWork/MSAS/Pages/Casualties.aspx (accessed on 27 July 2026).
  17. European Maritime Safety Agency (EMSA). Annual Overview of Marine Casualties and Incidents 2025. Available online: https://www.emsa.europa.eu/publications/item/5562-annual-overview-of-marine-casualties-and-incidents-2025.html (accessed on 27 July 2026).
  18. Jiang, H.; Zhang, J.; Wan, C.; Zhang, M.; Guedes Soares, C. A Data-Driven Bayesian Network Model for Risk Influencing Factors Quantification Based on Global Maritime Accident Database. Ocean Coast. Manag. 2024, 259, 107473. [Google Scholar] [CrossRef]
  19. Cao, W.; Wang, X.; Feng, Y.; Zhou, J.; Yang, Z. Improving Maritime Accident Severity Prediction Accuracy: A Holistic Machine Learning Framework with Data Balancing and Explainability Techniques. Reliab. Eng. Syst. Saf. 2026, 266, 111648. [Google Scholar] [CrossRef]
  20. Lee, D.; Namgung, H.; Yoo, S.-L. Development of a Risk Assessment System for Navigational Obstacles Considering Collision and Pollution Risks. Appl. Sci. 2025, 15, 2325. [Google Scholar] [CrossRef]
  21. Hassel, M.; Asbjørnslett, B.E.; Hole, L.P. Underreporting of Maritime Accidents to Vessel Accident Databases. Accid. Anal. Prev. 2011, 43, 2053–2063. [Google Scholar] [CrossRef] [PubMed]
  22. Cabitza, F.; Rasoini, R.; Gensini, G.F. Unintended Consequences of Machine Learning in Medicine. JAMA 2017, 318, 517–518. [Google Scholar] [CrossRef] [PubMed]
  23. Tonekaboni, S.; Joshi, S.; McCradden, M.D.; Goldenberg, A. What Clinicians Want: Contextualizing Explainable Machine Learning for Clinical End Use. In Proceedings of the 4th Machine Learning for Healthcare Conference (MLHC), Ann Arbor, MI, USA, 9–10 August 2019; Volume 106, pp. 359–380. [Google Scholar]
  24. Sendak, M.P.; D’Arcy, J.; Kashyap, S.; Gao, M.; Nichols, M.; Corey, K.; Ratliff, W.; Balu, S. A Path for Translation of Machine Learning Products into Healthcare Delivery. EMJ Innov. 2020, 4, 1–14. [Google Scholar] [CrossRef]
  25. Endsley, M.R. Toward a Theory of Situation Awareness in Dynamic Systems. Hum. Factors 1995, 37, 32–64. [Google Scholar] [CrossRef]
  26. Korea Meteorological Administration (KMA). Marine Observation Data, KMA API Hub. Available online: https://apihub.kma.go.kr/apiList.do?seqApi=3 (accessed on 20 May 2026).
  27. Ministry of Oceans and Fisheries (MOF). General Information Center on Maritime Safety and Security (GICOMS). Available online: https://www.gicoms.go.kr/ (accessed on 20 May 2026).
  28. Ke, G.; Meng, Q.; Finley, T.; Wang, T.; Chen, W.; Ma, W.; Ye, Q.; Liu, T.-Y. LightGBM: A Highly Efficient Gradient Boosting Decision Tree. In Proceedings of the 31st International Conference on Neural Information Processing Systems (NIPS’17), Long Beach, CA, USA, 4–9 December 2017; pp. 3149–3157. [Google Scholar]
  29. Roberts, D.R.; Bahn, V.; Ciuti, S.; Boyce, M.S.; Elith, J.; Guillera-Arroita, G.; Hauenstein, S.; Lahoz-Monfort, J.J.; Schröder, B.; Thuiller, W.; et al. Cross-validation Strategies for Data with Temporal, Spatial, Hierarchical, or Phylogenetic Structure. Ecography 2017, 40, 913–929. [Google Scholar] [CrossRef]
  30. Meyer, H.; Reudenbach, C.; Hengl, T.; Katurji, M.; Nauss, T. Improving Performance of Spatio-Temporal Machine Learning Models Using Forward Feature Selection and Target-Oriented Validation. Environ. Model. Softw. 2018, 101, 1–9. [Google Scholar] [CrossRef]
Figure 1. Overall research workflow. The diagram shows the full analytical pipeline, from the KCG practitioner survey and the construction of H3 grid-time accident–environment features to the two-stage accident-type risk prediction framework.
Jmse 14 01443 g001
Figure 2. Characteristics of the survey respondents (N = 826). Each panel shows the distribution of respondents by (a) regional headquarters, (b) work experience, (c) job type, and (d) work arrangement. Counts and percentages for all categories are given in the legends; percentages are rounded to one decimal place and may not sum to exactly 100%.
Jmse 14 01443 g002
Figure 3. Coverage of the mixed-resolution H3 grid over the territorial waters of Korea. (a) shows the overall distribution of H3 cells with observed vessel activity during 2021–2023; (b) shows an example area off the southern coast where coastal resolution 8 and offshore resolution 7 are jointly applied.
Jmse 14 01443 g003
Figure 4. Construction procedure of the H3 grid-time operational feature set. Accident records, meteorological–oceanographic variables, vessel activity, and static spatial risk factors were mapped onto H3 grid-time rows.
Jmse 14 01443 g004
Figure 5. Two-stage accident-type risk decomposition and evaluation design. The figure shows how the Stage 1 accident risk score and the Stage 2 conditional accident-type distribution are combined to produce a grid-level, type-specific risk score.
Jmse 14 01443 g005
Figure 6. Distribution of responses related to the operational gap. Based on Q5, Q12, and Q13, the figure shows whether quantitative risk criteria are used, whether shared organizational criteria exist, and the operational level at which accident risk criteria are formed. The narrow grey segment at the right end of each bar corresponds to ‘Other’ (free-text) responses; in Q12, the 2.1% segment denotes ‘Does not exist’. N differs across items because of item-level missing responses.
Jmse 14 01443 g006
Figure 7. Distribution of responses related to information needs and AI receptiveness. Based on Q15–Q17, the figure shows responses on priority information, satisfaction with the AI prediction scenario, preferred explanation format, analysis scope, and accident-type scope. Grey segments at the right end of each bar correspond to ‘Other’ (free-text) responses; those too narrow to carry an on-chart label are shown without one, and in Q16-2 only the percentage is shown. N differs across items because of item-level missing responses.
Jmse 14 01443 g007
Figure 8. Alignment between survey responses and the empirical accident-distribution baseline. (a) compares Q7-1 perceived accident frequency (left) and Q10 operational prevention priority (right) against the row-level baseline; (b) shows the same comparison against the incident-level baseline. Each line indicates the direction and magnitude of the survey response relative to the empirical baseline, and the vertical error bars denote the bootstrap 95% confidence intervals of the survey-response proportions.
Jmse 14 01443 g008
Figure 9. Composition of the Stage 2 accident-type framings. The figure compares the class composition and accident coverage of the five framings (A–E).
Jmse 14 01443 g009
Figure 10. Stage 2 per-class recall and macro F1 by accident-type framing. Recall is computed on the 2023 test partition—the accident rows of each framing—using the LightGBM multi-class classifier configured as reported in Appendix D; gray cells mark accident-types that are not part of a framing’s label space, and macro F1 is the unweighted mean over the classes of that framing. The inter-class differences and the decline of macro F1 with label granularity are interpreted in Section 4.5.1.
Jmse 14 01443 g010
Table 1. Comparison of the problem setting between this study and major maritime accident prediction studies.
StudyRegionMain OutputUnit of AnalysisAccident-Type HandlingPractitioner Involvement
Nourmohammadi et al. [6]Korean territorial watersGrid-based spatiotemporal accident risk, accident-type riskGrid × timeIncludes type-specific riskNone
Shin & Yang [7]Busan PortBinary accident occurrenceAccident/near-miss vs. non-accidentAccident-type not distinguishedNone
Jo et al. [8]Korean coastal watersCollision risk levelEncounter/image-like representationCollision only (single type)None
Munim et al. [10]NorwayMulti-class accident-typePer-accident5-class taxonomyNone
Brandt et al. [11]NorwayMulti-class accident-typePer-accident5-class taxonomyNone
Zhang et al. [12]ChinaMulti-class accident-typePer-accidentAccident-record-based taxonomyNone
Zhao et al. [13]ChinaAccident cause classificationPer-accidentAccident-cause-focusedNone
Feng et al. [14]Multiple countriesAccident severityPer-accidentSeverity-focusedNone
This studyKorean territorial watersH3 grid-level accident-type riskGrid × timeBased on Korean maritime accident-typesReflects prevention focus from a survey of 826 KCG practitioners
Table 2. The 10 survey items used in the quantitative analysis of this study.
CodeCategoryQuestionResponse Options
Q5OperationalWhen setting accident risk zones, do you use quantitative criteria (e.g., traffic volume, number of departures, weather)?① Yes, specific criteria exist/② Referenced in some situations/③ Based on experience/④ No clear criteria/⑤ Other (free text)
Q7-1PerceptionWhat is the most frequent accident-type in your jurisdictional waters?① Collision/② Grounding/③ Drift entanglement/④ Other (free text)
Q10PriorityWhat maritime accident-type is currently the focus of prevention at your workplace?① Collision/② Grounding/③ Drift entanglement/④ Other (free text)
Q12OperationalDo you think a ‘common accident risk judgment criterion’ currently exists within the Korea Coast Guard organization?① Clearly exists/② Some criteria are shared/③ Varies by region/④ Does not exist/⑤ Other (free text)
Q13OperationalAt what level do you think accident risk judgment criteria are mainly operated?① Centered on headquarters-wide common criteria/② Centered on regional-command (regional headquarters) criteria/③ Centered on substation independent judgment/④ Mixed form/⑤ Other (free text)
Q15Information needsWhat is the most useful information the accident prediction system should provide?① Weather/sea-state information (wind speed, wave height, etc.)/② Vessel operation information (AIS, V-PASS, etc.)/③ Accident history data/④ Other (free text)
Q16-1System acceptanceAre you satisfied with the accident-prediction result lookup scenario described above?① Satisfied/② Unsatisfied/③ Other (free text)
Q16-2Explanation formatWhen presenting the accident risk interpretation report, which presentation format do you find more helpful for understanding?① A table format containing the observed value, risk-impact magnitude, and reference value for each risk factor (see the example figure above)/② A sentence-form explanation of the risk factors (e.g., ‘This zone has elevated accident risk due to increased wind speed.’)/③ Other (free text)
Q17-1Analysis scopeFor the analysis results, do you prefer a nationwide scope, or a specific zone as in the accident risk prediction? (refer to the trend-analysis result lookup scenario above.)① Nationwide/② Specific zone/③ Other (free text)
Q17-2Type scopeIs there a specific range of accident-types whose analysis results you would like to review?① All types/② Specific types/③ Other (free text)
Table 3. Annual distribution of maritime accident-types, 2021–2023.
Accident-Type2021202220232021–2023 Pooled
Collision424 (35.5%)453 (35.7%)473 (34.0%)1350 (35.0%)
Drift entanglement321 (26.8%)309 (24.3%)402 (28.9%)1032 (26.8%)
Flooding162 (13.5%)210 (16.5%)189 (13.6%)561 (14.5%)
Grounding126 (10.5%)143 (11.3%)173 (12.4%)442 (11.5%)
Capsizing80 (6.7%)91 (7.2%)68 (4.9%)239 (6.2%)
Sinking44 (3.7%)28 (2.2%)47 (3.4%)119 (3.1%)
Contact39 (3.3%)36 (2.8%)38 (2.7%)113 (2.9%)
Total1196127013903856
Table 4. Feature categories and number of variables.
CategoryCountVariables
Weather: base (t)13Water temperature/salinity/significant wave height/maximum wave height/mean wave height/wave period/air temperature/air pressure/wind speed/maximum instantaneous wind speed/current speed/tidal level, precipitation
Weather: lag (1/2/3/6/12/24 h)18Wind speed/current speed/tidal level × 6 steps
Weather: delta (1/2/3/6/12/24 h)18Change in wind speed/current speed/tidal level × 6 steps
Distance: distance to facilities18dist_nearest_* (AnchorageArea, Beacon (4 types), Bridge, Buoy (7 types), FishingFacility, OffshorePlatform/ProductionArea, ShorelineConstruction, pile)
Spatial: spatial information1sea_region
Time3dayofweek, season_num, season_name
Ship/vessel1total_ship_count
Total 72
The asterisk in dist_nearest_* is a wildcard denoting the facility-specific distance variables listed in parentheses (e.g., dist_nearest_Bridge).
Table 5. Stage 2 categorization framing experiments. The five framings were constructed to compare the trade-off in coverage, granularity, macro F1, and Top-K hit rate of the accident-type label space under a common LightGBM training and tuning protocol (Appendix D).
ExpFramingTraining ClassesNo. of Classes Classes
ASurvey-alignedCollision/Grounding/Drift entanglement3
BData-alignedCollision/Drift entanglement/Flooding3
CUnion (A ∪ B)Collision/Grounding/Drift entanglement/Flooding4
DSufficient-sampleCollision/Drift entanglement/Flooding/Grounding/Capsizing5
EAdministratively completeAll seven administrative classes7
Table 6. Q7-1 perception versus accident baseline (4-class, row-level).
CategoryCountSurvey % (95% CI)Reality %Δpp
Collision496.2 [4.6, 8.0]35.0−28.8
Grounding12716.1 [13.7, 18.6]11.5+4.7
Drift entanglement48461.4 [58.0, 64.7]26.8+34.7
Other12816.2 [13.7, 18.9]26.8−10.5
Table 7. Q10 priority versus accident baseline (4-class, row-level).
CategoryCountSurvey % (95% CI)Reality %Δpp
Collision22930.0 [26.9, 33.2]35.0−5.0
Grounding18524.2 [21.2, 27.3]11.5+12.8
Drift entanglement24732.4 [29.1, 35.6]26.8+5.6
Other10213.4 [11.0, 15.9]26.8−13.4
Table 8. Stage 2 categorization framing class definitions and split distributions.
ExpFramingClassesNo. of Classes ClassesCoverageTrain (2021)Val (2022)Test (2023)
ASurvey-alignedCollision · Grounding · Drift entanglement373.2%8719051048
BData-alignedCollision · Drift entanglement · Flooding376.3%9079721064
CUnion (A ∪ B)Collision · Grounding · Drift entanglement · Flooding487.8%103311151237
DSufficient-sampleCollision · Drift entanglement · Flooding · Grounding · Capsizing594.0%111312061305
EAdministratively completeAll 7 classes7100.0%119612701390
Table 9. Detailed performance of the Stage 1 binary classifier (Test 2023, threshold = 0.15).
MetricValue
ROC AUC0.767
PR AUC0.325
positive recall0.371
positive precision0.365
Top-decile lift3.68×
Table 10. Stage 2 five framing performance comparison (test 2023, LightGBM).
ExpNo. of Classes clsCoverage (n)Macro F1Top-1Top-2Top-3 1
A Survey3310480.5090.5350.8341.000
B Data3310640.5500.5620.8591.000
C Union4412370.4460.4670.7410.888
D Suffic5513050.3890.4410.6900.836
E Full7713900.2930.4040.6400.778
1 The Top-3 hit rate is 1.0 by definition in the 3-class framings and is presented only for comparison with framings that have more classes. The informative metrics are Top-1, Top-2, and the cascaded metrics.
Table 11. ML (LightGBM) vs. naive baseline macro F1 by framing.
ExpML Macro F1Naive Macro F1Lift (×)Naive Fallback Rate
A Survey30.5090.2811.8190.1%
B Data30.5500.3111.7786.2%
C Union40.4460.2541.7683.4%
D Suffic50.3890.2161.8082.6%
E Full70.2930.1771.6580.2%
Table 12. Accident-only cascaded Top-K (Test 2023, based on 1390 accident rows).
MetricAccident-Only
Cascaded Top-10.145
Cascaded Top-20.214
Cascaded Top-30.263
Table 13. Spatially contiguous block 5-fold CV vs. temporal hold-out.
MetricTemporal Hold-Out (2023)Contiguous Block 5-Fold (Mean ± SD)Δ (Temporal − Contiguous)
macro F10.6490.606 ± 0.003+0.043
positive F10.3680.262 ± 0.015+0.106
positive recall0.3710.180 ± 0.028+0.191
positive precision0.3650.518 ± 0.096−0.153
ROC AUC0.7670.744 ± 0.031+0.023
PR AUC0.3250.315 ± 0.017+0.010
Disclaimer/Publisher’s Note: The statements, opinions and data contained in all publications are solely those of the individual author(s) and contributor(s) and not of MDPI and/or the editor(s). MDPI and/or the editor(s) disclaim responsibility for any injury to people or property resulting from any ideas, methods, instructions or products referred to in the content.