1. Introduction
Forecasting the trajectory of oil slicks at sea remains one of the most complex and urgent challenges in marine pollution response. Past spills, such as the
Erika (1999) and
Grande America (2019) incidents, have demonstrated how rapidly evolving oceanographic and meteorological conditions, including currents, winds, tides, and temperature gradients, can render trajectory predictions uncertain, particularly in coastal and dynamic environments featuring fine-scale phenomena such as coastal eddies, wind-driven surface currents, and thermal gradients, which global or regional oceanic models often underrepresent. These uncertainties complicate response strategies, delaying critical decisions on containment, recovery, and shoreline protection, while exacerbating ecological and socioeconomic impacts [
1,
2,
3,
4,
5].
To address these challenges, France established the French Drift Committee (CODER, Comité de Dérive), which brings together scientific and operational expertise from CEDRE, Météo-France, Ifremer and Shom with the logistical support of the French Navy’s anti-pollution practical expertise center CEPPOL.
Before the committee’s formal creation, CEDRE and Météo-France had already collaborated on oil drift forecasting during marine pollution incidents, using the MOTHY (Modèle Océanique de Transport d’Hydrocarbures) modeling system [
6]. The
Erika oil spill in the Bay of Biscay in December 1999 highlighted the value of this partnership in managing marine pollution incidents [
7]. During the
Prestige oil spill in 2002, off the coast of Galicia, Spain, under the impetus of the French General Secretariat for the Sea, experts from Shom and Ifremer were brought in, enabling a more efficient and structured approach [
8,
9,
10]. CODER was subsequently created and formally established in 2006 through a Prime Ministerial instruction to create a permanent, multi-agency framework for oil drift modeling and crisis management [
11]. The committee’s operational value was again demonstrated during the
Grande America spill in 2019, during which it provided critical drift forecasts to guide recovery operations over several weeks [
12]. The 19 July 2022 Prime Ministerial instruction updated CODER’s roles and responsibilities in marine pollution response [
13].
In the event of an incident, CODER is activated by the maritime authorities. Its mission is to improve the accuracy of drift predictions by leveraging the complementary expertise of its members. Among their respective missions, CEDRE contributes expertise on pollutant behavior and operates the OILMAP drift model [
14], Météo-France provides weather forecasts and operates the MOTHY drift modeling system, Shom and Ifremer provide oceanographic expertise and supply high-resolution oceanographic data and hydrodynamic models, and CEPPOL (French Navy) ensures logistical support and integrates CODER’s analyses into operational decision-making. This collaborative approach enables the committee to cross-validate simulations with real-time observations, account for local hydrodynamic complexities, and deliver actionable recommendations to maritime authorities, thereby avoiding conflicting interpretations that might lead stakeholders to overreact.
Building on these operational experiences and the lessons learned from past incidents, the RAMOGEPOL 2025 exercise was designed to further refine CODER’s methodologies, particularly in addressing the persistent challenges of fine-scale coastal dynamics and real-time model recalibration, and to demonstrate how multi-model ensemble forcing reduces prediction uncertainty compared to a single model in contrasting hydrodynamic regimes.
This paper explores how CODER’s collaborative approach—grounded in real-time recalibration during exercises and actual incidents, knowledge gleaned through annual exercises like RAMOGEPOL, which simulate real conditions without causing environmental impacts, and inter-agency coordination—has enhanced the accuracy of drift predictions, deepened our understanding of coastal and open-sea dynamics, and strengthened operational resilience. Using the RAMOGEPOL 2025 exercise as a case study, we illustrate how CODER’s scope addresses the technical and logistical challenges of oil spill response. The following sections detail CODER’s operational structure, methodological innovations, and lessons learned from over two decades of exercises and real-world applications.
2. Data and Methods
2.1. Marine Oil Drift Models
The MOTHY drift model (Modèle Océanique de Transport d’Hydrocabures), operated by Météo-France (France), serves as the primary reference tool for the French maritime authorities, CEDRE and CODER, in the event of confirmed or suspected oil pollution at sea. Available 24/7, MOTHY delivers results within a maximum of 30 min, with forecasts for up to several days. As a comprehensive 3D model, MOTHY tracks oil slicks on the water surface and within the water column. Its unique feature lies in its being a system that combines an integrated hydrodynamic model, calculating the high-frequency current components from wind and tidal data using a sophisticated Ekman-type approach, with low-frequency currents from operational oceanography systems [
15]. MOTHY can be activated using satellite observations of slick contours and can perform backtracking to reconstruct drift trajectories in order to identify the possible origin of pollution. Regular updates to the model ensure its reliability and adaptability, and the expertise of Météo-France is essential for selecting the most appropriate meteorological and oceanographic conditions.
In addition to MOTHY, CEDRE holds a license and receives support for the use of the OILMAP drift and weathering model, developed by RPS, a Tetra Tech Company (USA). OILMAP is a comprehensive model that tracks various hydrocarbon components at the water surface and in the water column. It is widely used throughout the world by major oil companies and public institutions in spill management and contingency planning contexts.
There are numerous commercial and institutional models available for predicting the oil spill drift at sea. As each has its own specific characteristics, the results of the simulations will therefore vary. For example, regarding the wind drift coefficients, MOTHY calculates them based on wind conditions, whereas OILMAP uses coefficients defined by the user for the entire duration of the simulation. The MOTHY system integrates Stokes drift to improve real-time tracking of pollutants and floating objects by accounting for wave-driven surface shear currents. Concerning the consideration of ocean currents, these are resolved by MOTHY through an embedded hydrodynamic module. Unlike OILMAP, MOTHY explicitly simulates vertical mixing by combining a 2D shallow-water formulation with a 1D eddy-viscosity scheme. To avoid double-counting wind effects, the background current is extracted at the base of the Ekman layer. Another notable difference between these two models concerns weathering processes. OILMAP includes detailed parametrization for evaporation, dispersion, emulsification, and biodegradation, while MOTHY does not directly account for these processes.
In 2019–2020, CEDRE conducted a major comparative study of drift models to assess the functioning, performance and limitations of 26 such models and tested 11 of these models based on three hypothetical scenarios and two real-life incident scenarios: the spill caused by the collision between the ro-ro vessel
Ulysse and the container ship
CSL Virginia, in 2018, 15 nautical miles off Cap Corse, France, and the
Grande America incident in 2019, in the Bay of Biscay. In 2021, several models were tested in an operational context as part of a study conducted by CEDRE and involving CODER [
16]. Through this study, which involved deploying buoys off the coasts of French Guiana and the French Mediterranean coast to simulate oil slick drift, the drift models were analyzed in terms of both the quality of the modeling results and more technical aspects such as data accessibility, result delivery time and integration into CODER’s tools.
Thanks to this work, CODER is now able to use several drift models and analyze the results. For example, it can perform simulations using WebGNOME [
17], a NOAA-developed model (USA), or request simulations from international partners. In the case of an incident requiring international cooperation, a partner outside CODER could run their operationally used oil spill model (e.g., OSERIT (Belgium) [
18] and OPENDRIFT (Norway) [
19] in the event of a spill in the English Channel or the North Sea), and the results can be compared with CODER’s results.
Another key outcome of this comparative study was the recognition of the importance of using the entire slick area as the starting point for simulations, rather than a single point source. Post-analysis of the
Ulysse/CLS Virginia and
Grande America incidents highlighted that modeling based on the full slick contour—as provided by the European marine oil monitoring network CleanSeaNet, operated by the European Maritime Safety Agency (EMSA)—significantly improves the accuracy of drift simulations, especially for large or fragmented slicks. This finding led to a change in French modeling procedures, allowing MOTHY simulations to be initialized directly from the slick contours downloaded from the CleanSeaNet platform [
20].
2.2. Hydrodynamics and Atmospheric Forcings
Drift models require accurate meteorological and oceanographic input data to characterize and predict environmental conditions affecting the trajectories of an oil spill or drifter. The forecasts produced are particularly useful, especially in an operational context. Depending on the location of the incident, different model outputs may be available, with spatial resolutions ranging from a global scale to a more regional scale, or even the scale of a particular coastline.
CODER usually tests different sets of meteorological and oceanographic data using drift models to identify the most accurate forecasts and better understand the limitations and advantages of these combinations. With this multi-metocean data-forcing approach, CODER can assess the reliability of simulation outputs. When multiple simulations yield consistent trajectories, this may indicate robust forecasts; conversely, systematic discrepancies can reveal shared biases in input data or model parameters [
21].
The atmospheric models commonly used by CODER as input data for MOTHY or OILMAP are Météo-France’s AROME [
22] and ARPEGE [
23] forecasts (
Table 1). CODER operations can also rely on the expertise of Météo-France marine forecasters. Based on their operational experience, these experts are able to determine which model is more likely to deliver the most accurate and realistic forecasts over the coming days.
Regarding the oceanographic models (
Table 2), the Copernicus Marine Environment Monitoring Service (CMEMS) provides free, open-access hydrodynamic forecasts at global and regional scales, which can be used in several drift models, including MOTHY and OILMAP. The Operational Mercator global ocean analysis and forecast system (GLOBAL_ANALYSISFORECAST_PHY_001_024), with a resolution of 1/12°, offers hourly mean 3D and surface fields for sea level, temperature and currents [
24]. These outputs are commonly used as input datasets when higher-resolution data are unavailable or as a reference for comparison with regional model outputs. CMEMS also provides regional-scale datasets such as the Atlantic Ocean Physics Analysis and Forecast System (IBI_ANALYSISFORECAST_PHY_005_001), which covers the European IBI waters (Iberia Biscay Ireland) on a 1/36° grid and provides high-frequency (15 min) instantaneous data for sea level, temperature and surface currents [
25]. The Mediterranean Sea Physics Analysis and Forecast System (MEDSEA_ANALYSISFORECAST_PHY_006_013) is a coupled hydrodynamic-wave model for the entire Mediterranean basin, featuring a horizontal resolution of 1/24° [
26].
Other datasets are also available. For example, Shom has developed its own operational 3D regional models for the Bay of Biscay and the Mediterranean Sea, based on the HYCOM community code [
27]. These models provide free, open-access hourly surface current, sea temperature and salinity data, as well as daily means for temperature, salinity and currents throughout the water column (available at
https://data.shom.fr).
Ifremer has developed and operates a coastal model based on the MARS code, which provides essential data on currents and water column dynamics [
28]. These forecasts are open-access and available free of charge (MARC project:
https://marc.ifremer.fr).
Table 2.
Key features of hydrodynamic models frequently used by CODER.
Table 2.
Key features of hydrodynamic models frequently used by CODER.
| Hydrodynamic Model | Geographical
Coverage | Spatial
Resolution | Forecast
Period | Temporal Resolution | Tides |
|---|
CMEMS GLO12
GLOBAL Analysis Forecast Phy 001 024 hourly | Global | 1/12° | 10 days | 1 h | No |
CMEMS IBI
IBI Analysis Forecast Phys 005 001 | Iberian Biscay Ireland | 1/36° | 10 days | 1 h | Yes |
CMEMS NWS
NORTHWESTSHELF Analysis Forecast PHY 004 013 | European North-West Shelf Seas | 1/36° | 10 days | 1 h | Yes |
CMEMS MEDSEA
MEDSEA Analysis Forecast PHY 006 013 | Mediterranean Sea | 1/24° | 10 days | 1 h | Yes |
Navy Global
Hycom | Global | 1/12° | 7 days | 3 h | Yes |
NCEP Global
Hycom | Global | 1/12° | 6 days | 3 h | No |
MARS-3D
Ifremer | English Channel
Bay of Biscay | 2.5 km | 4 days | 1 h | Yes |
| Mediterranean Sea | 1.2 km | 4 days | 3 h | No |
| Corsica | 400 m | 4 days | 3 h | No |
MARS-2D
Ifremer | North-East
Atlantic | 2 km | 4 days | 1 h | Yes |
English Channel
Bay of Biscay | 700 m | 4 days | 1 h | Yes |
English Channel
Finistère
Southern Brittany
Aquitaine | 250 m | 4 days | 15 min. | Yes |
Hycom 3D
Shom | English Channel
Bay of Biscay
Mediterranean Sea | 1/60° | 5 days | 1 h on the surface
24 h in 3D | Yes |
2.3. Drifting Buoys
In the event of an oil spill at sea, deploying drifting buoys to mark oil slicks provides critical assistance in response efforts, particularly by helping to locate slicks. While drifting buoys were not yet a standard component of French response equipment in 1999 during the
Erika incident, their use had become widespread by 2002, at the time of the
Prestige incident, providing decision-makers with invaluable information [
29]. Today, drifting buoys are commonly used worldwide to monitor marine pollution.
Tracking the drift of slicks and anticipating their movements are essential for planning recovery operations at sea, guiding response vessels, and alerting shore-based authorities when there is a risk of pollution reaching the coast. Alongside aerial observations and satellite images, experience from past spills has demonstrated that drifting buoys offer several key advantages. These include continuous monitoring of pollutant drift, supplementing and extending the capabilities of costly aerial resources, which are limited by flight endurance and weather conditions. Drifting buoys help maintain visual contact with observed slicks between the alert phase, mobilization, and the arrival of response teams on site. They can be used to mark the contours of slicks or areas of high pollutant concentration, thereby guiding response vessels and enhancing the effectiveness of dispersion or recovery operations. They are also useful for estimating the trajectory of potential leaks from wrecks or illegal discharges and provide data to calibrate and evaluate slick drift models. Additionally, they support preparedness efforts, from developing response plans to conducting exercises.
For CODER, drifting buoys serve multiple purposes. As instruments designed to be transported by ocean currents and influenced by wind and waves, similarly to particles simulated in Lagrangian models, they are invaluable for validating oil spill model simulations. By comparing buoy drift data with simulation results, CODER can determine which model performs best. Buoy positions are also used to initiate new drift simulations, thereby updating drift forecasts. In training exercises, during which no actual pollutant is released, buoys simulate the movement of an oil slick, allowing CODER to evaluate the quality of its simulations and the decisions made during the exercise.
A wide variety of drifting buoys are commercially available, each differing in design features that must be carefully considered to select the most suitable option for pollution response managers. Key factors include the certification for a drop from a military aircraft, the shape and durability of the float, whether a floating anchor is needed (depending on whether the buoy is tracking a surface or subsurface oil slick), tracking and data transmission systems, power source and battery life, and the inclusion or not of physicochemical data sensors, for instance [
30].
In 2024, CEDRE led a sea trial in the English Channel, off the French coast, involving CODER and the deployment of several types of commercial buoys as well as buoys built by CEDRE. The trial demonstrated that differences in buoy design can significantly affect drift behavior [
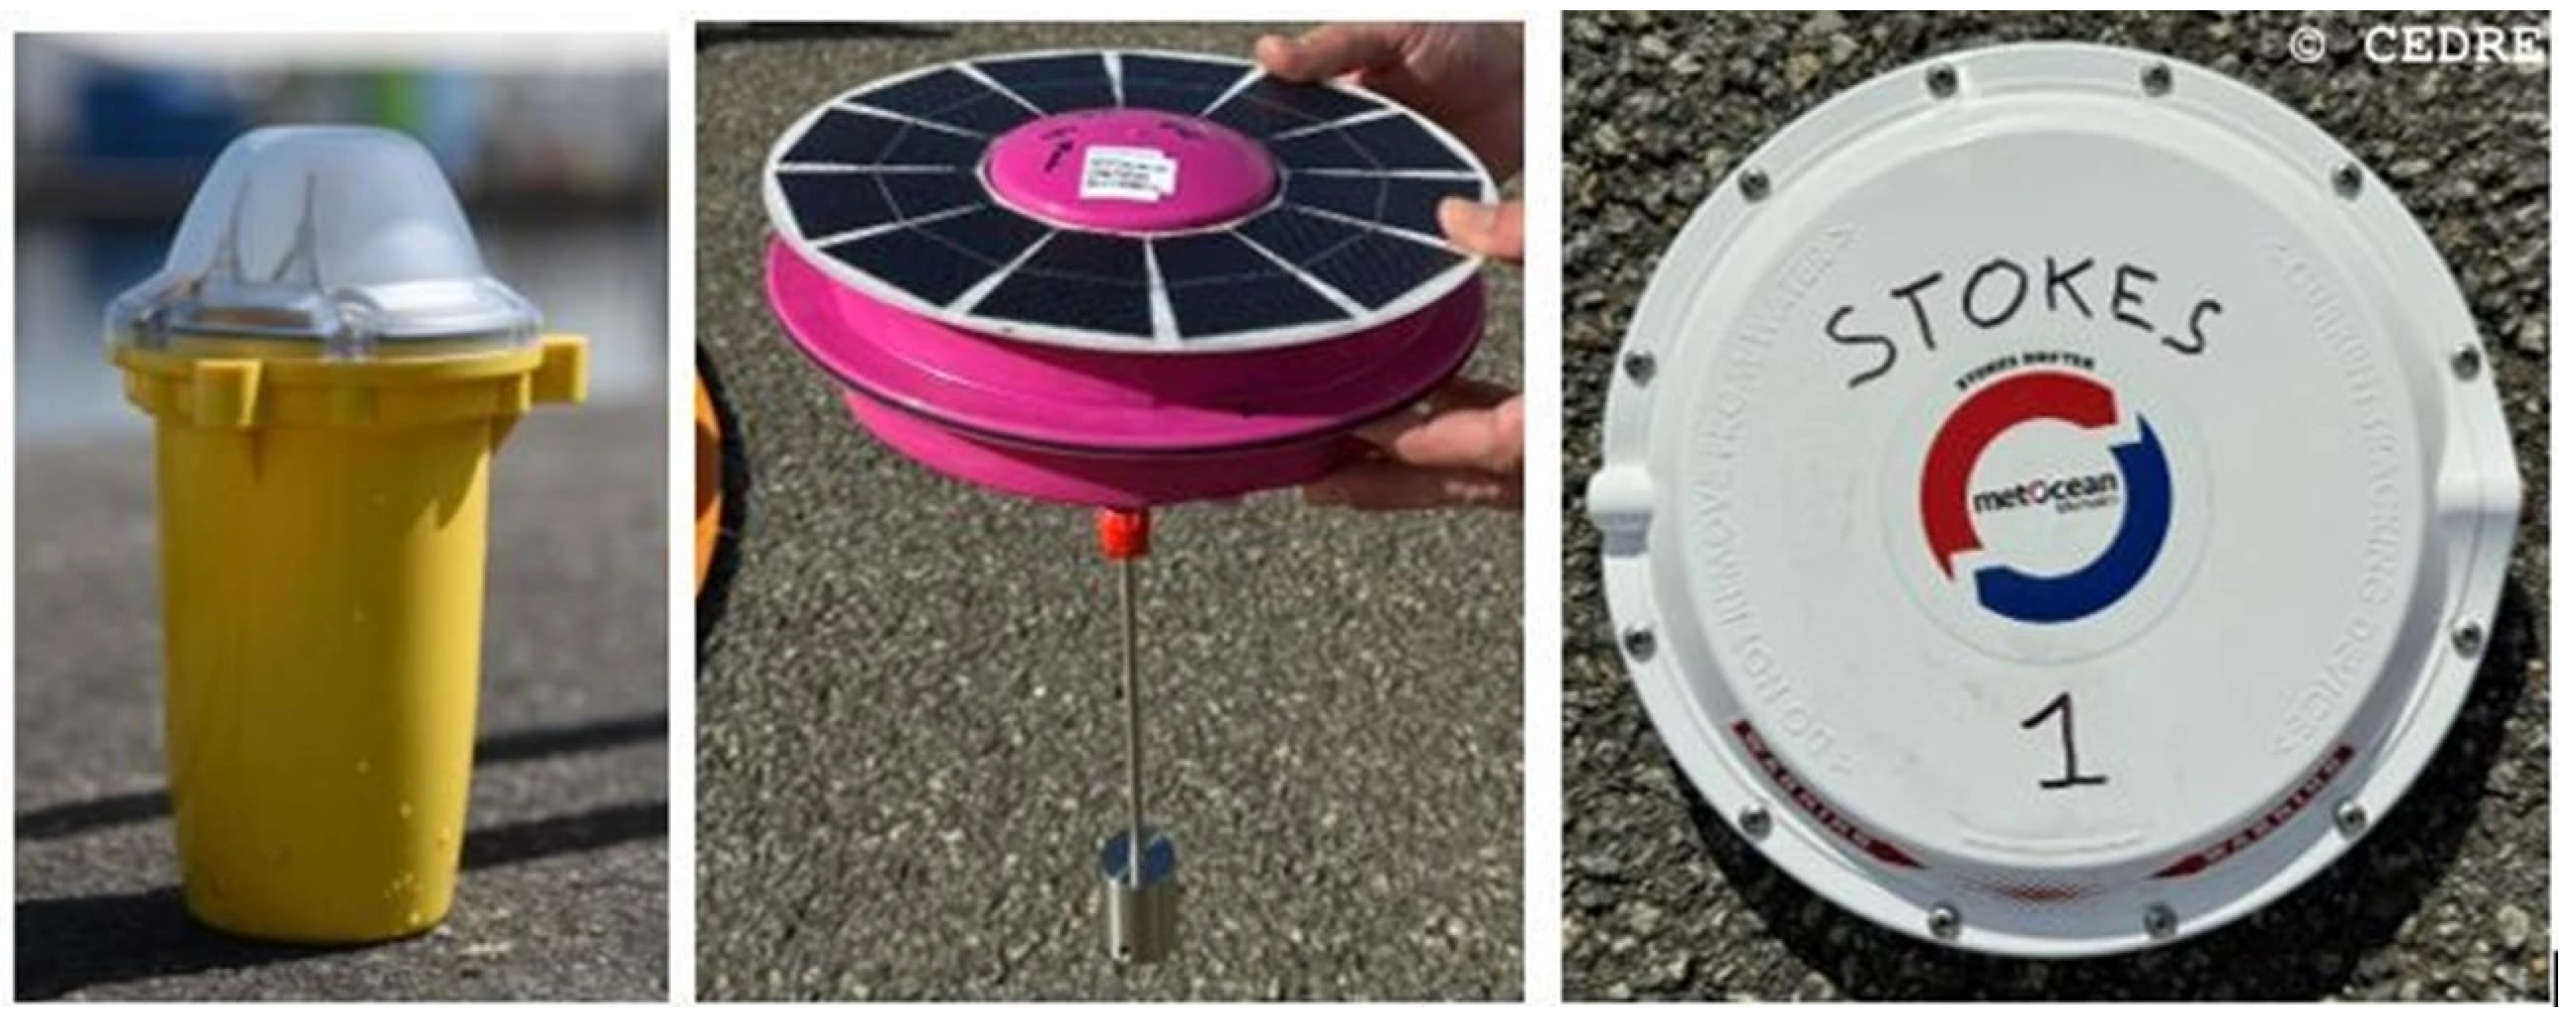
31]. Among the commercially manufactured buoys tested and deemed suitable for future operations to track surface oil slicks at sea were the MARGET-II (produced by CLS), the MELODI (by eOdyn), and the STOKES (by MetOcean) (
Figure 1).
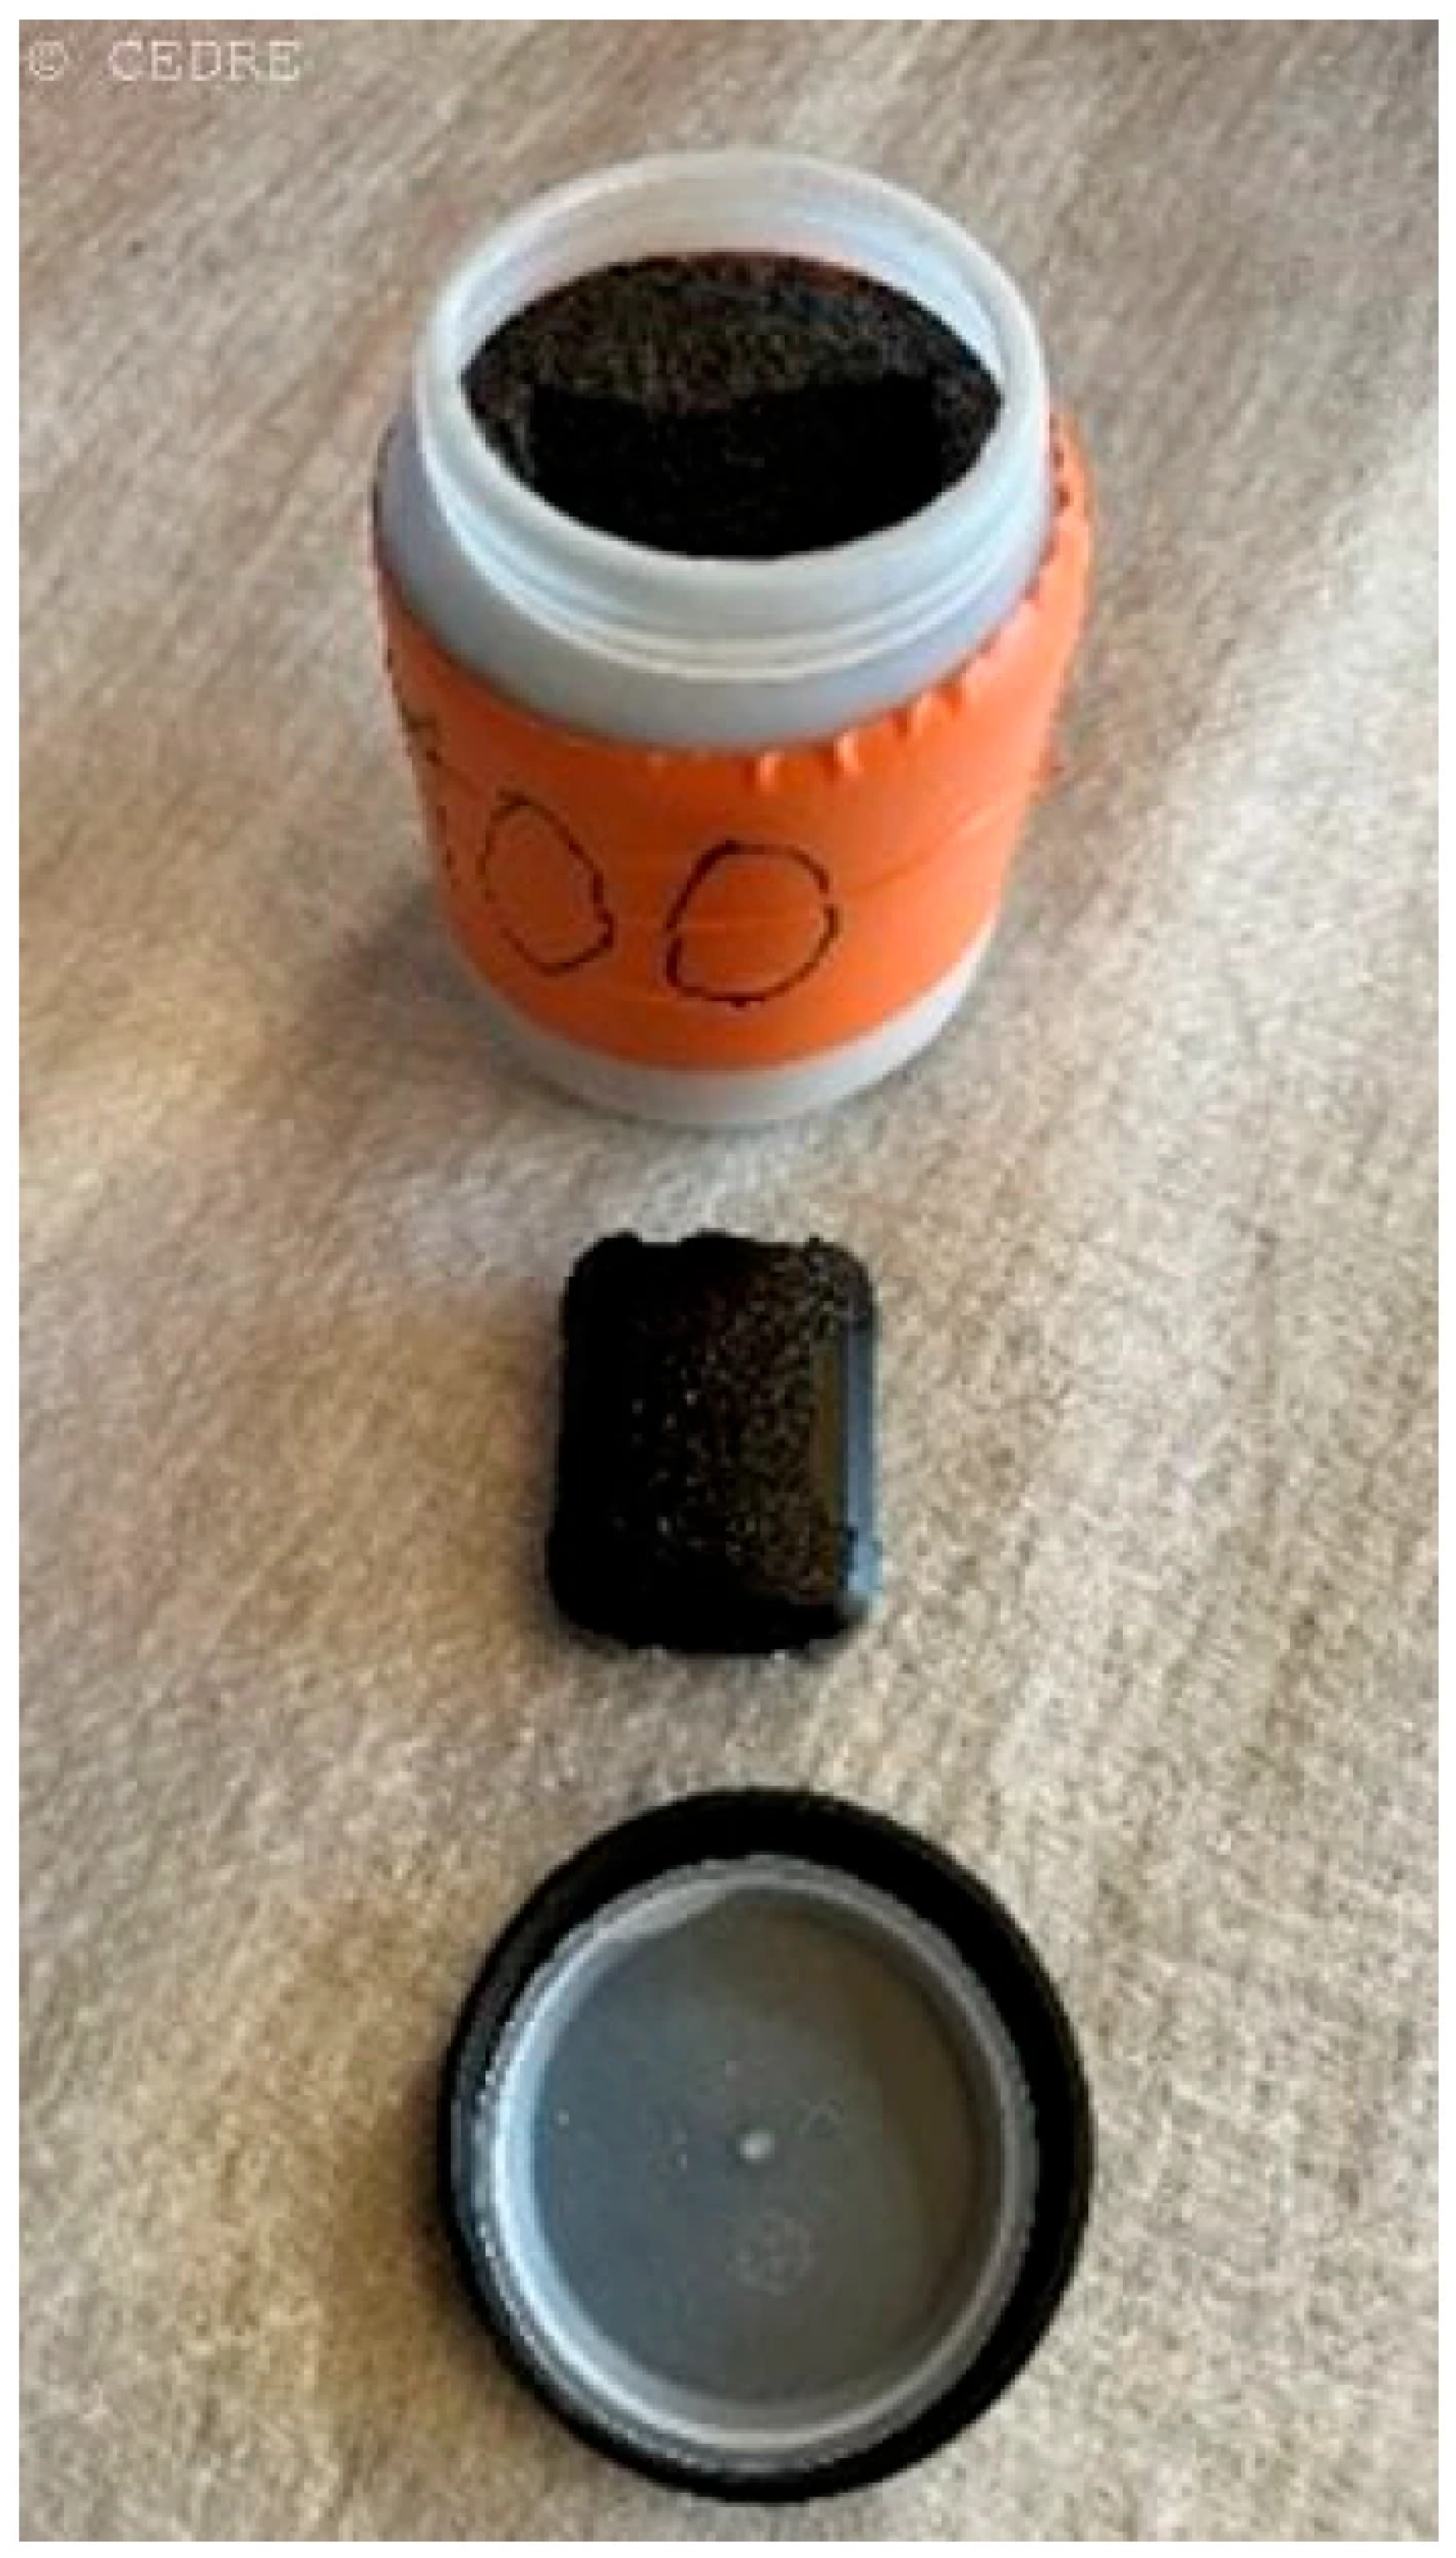
The buoys built by CEDRE all shared a common design feature: a GPS tracker inserted into a floating plastic container (
Figure 2). Drift comparisons were conducted between buoys with different degrees of submersion, adjusted by adding sand to the bottom of the container, and between buoys with and without a floating anchor, also developed by CEDRE. Based on these tests, CEDRE chose to maintain 75% submersion, without a floating anchor, to ensure effective monitoring of surface oil slicks. A trial conducted off the coast of Norway in 2025 later confirmed the validity of this approach [
32].
2.4. Sharing and Analysis Tools
Given the vast amount of data and the numerous partners involved in its analysis, CEDRE has developed specialized tools to streamline CODER’s operations.
CEDRE has created and maintains a mapping platform that enables the rapid import and clear visualization of MOTHY and OILMAP simulation results, with the support of Météo-France and RPS, as well as buoy trajectories and other geospatial data critical for pollution management. This platform is also able to rapidly generate maps, which can then be shared with the maritime authorities to support decision-making.
To further enhance efficiency, CEDRE has also developed automated scripts to convert simulation results from external partners, ensuring seamless integration into the mapping platform. Additionally, Web Feature Services (WFS) and Web Map Services (WMS) have been established between CEDRE and its modeling partners for faster data exchange. By providing real-time visualization and analysis capabilities, the platform promotes timely decision-making and ensures that all stakeholders work from a consistent, up-to-date understanding of the situation.
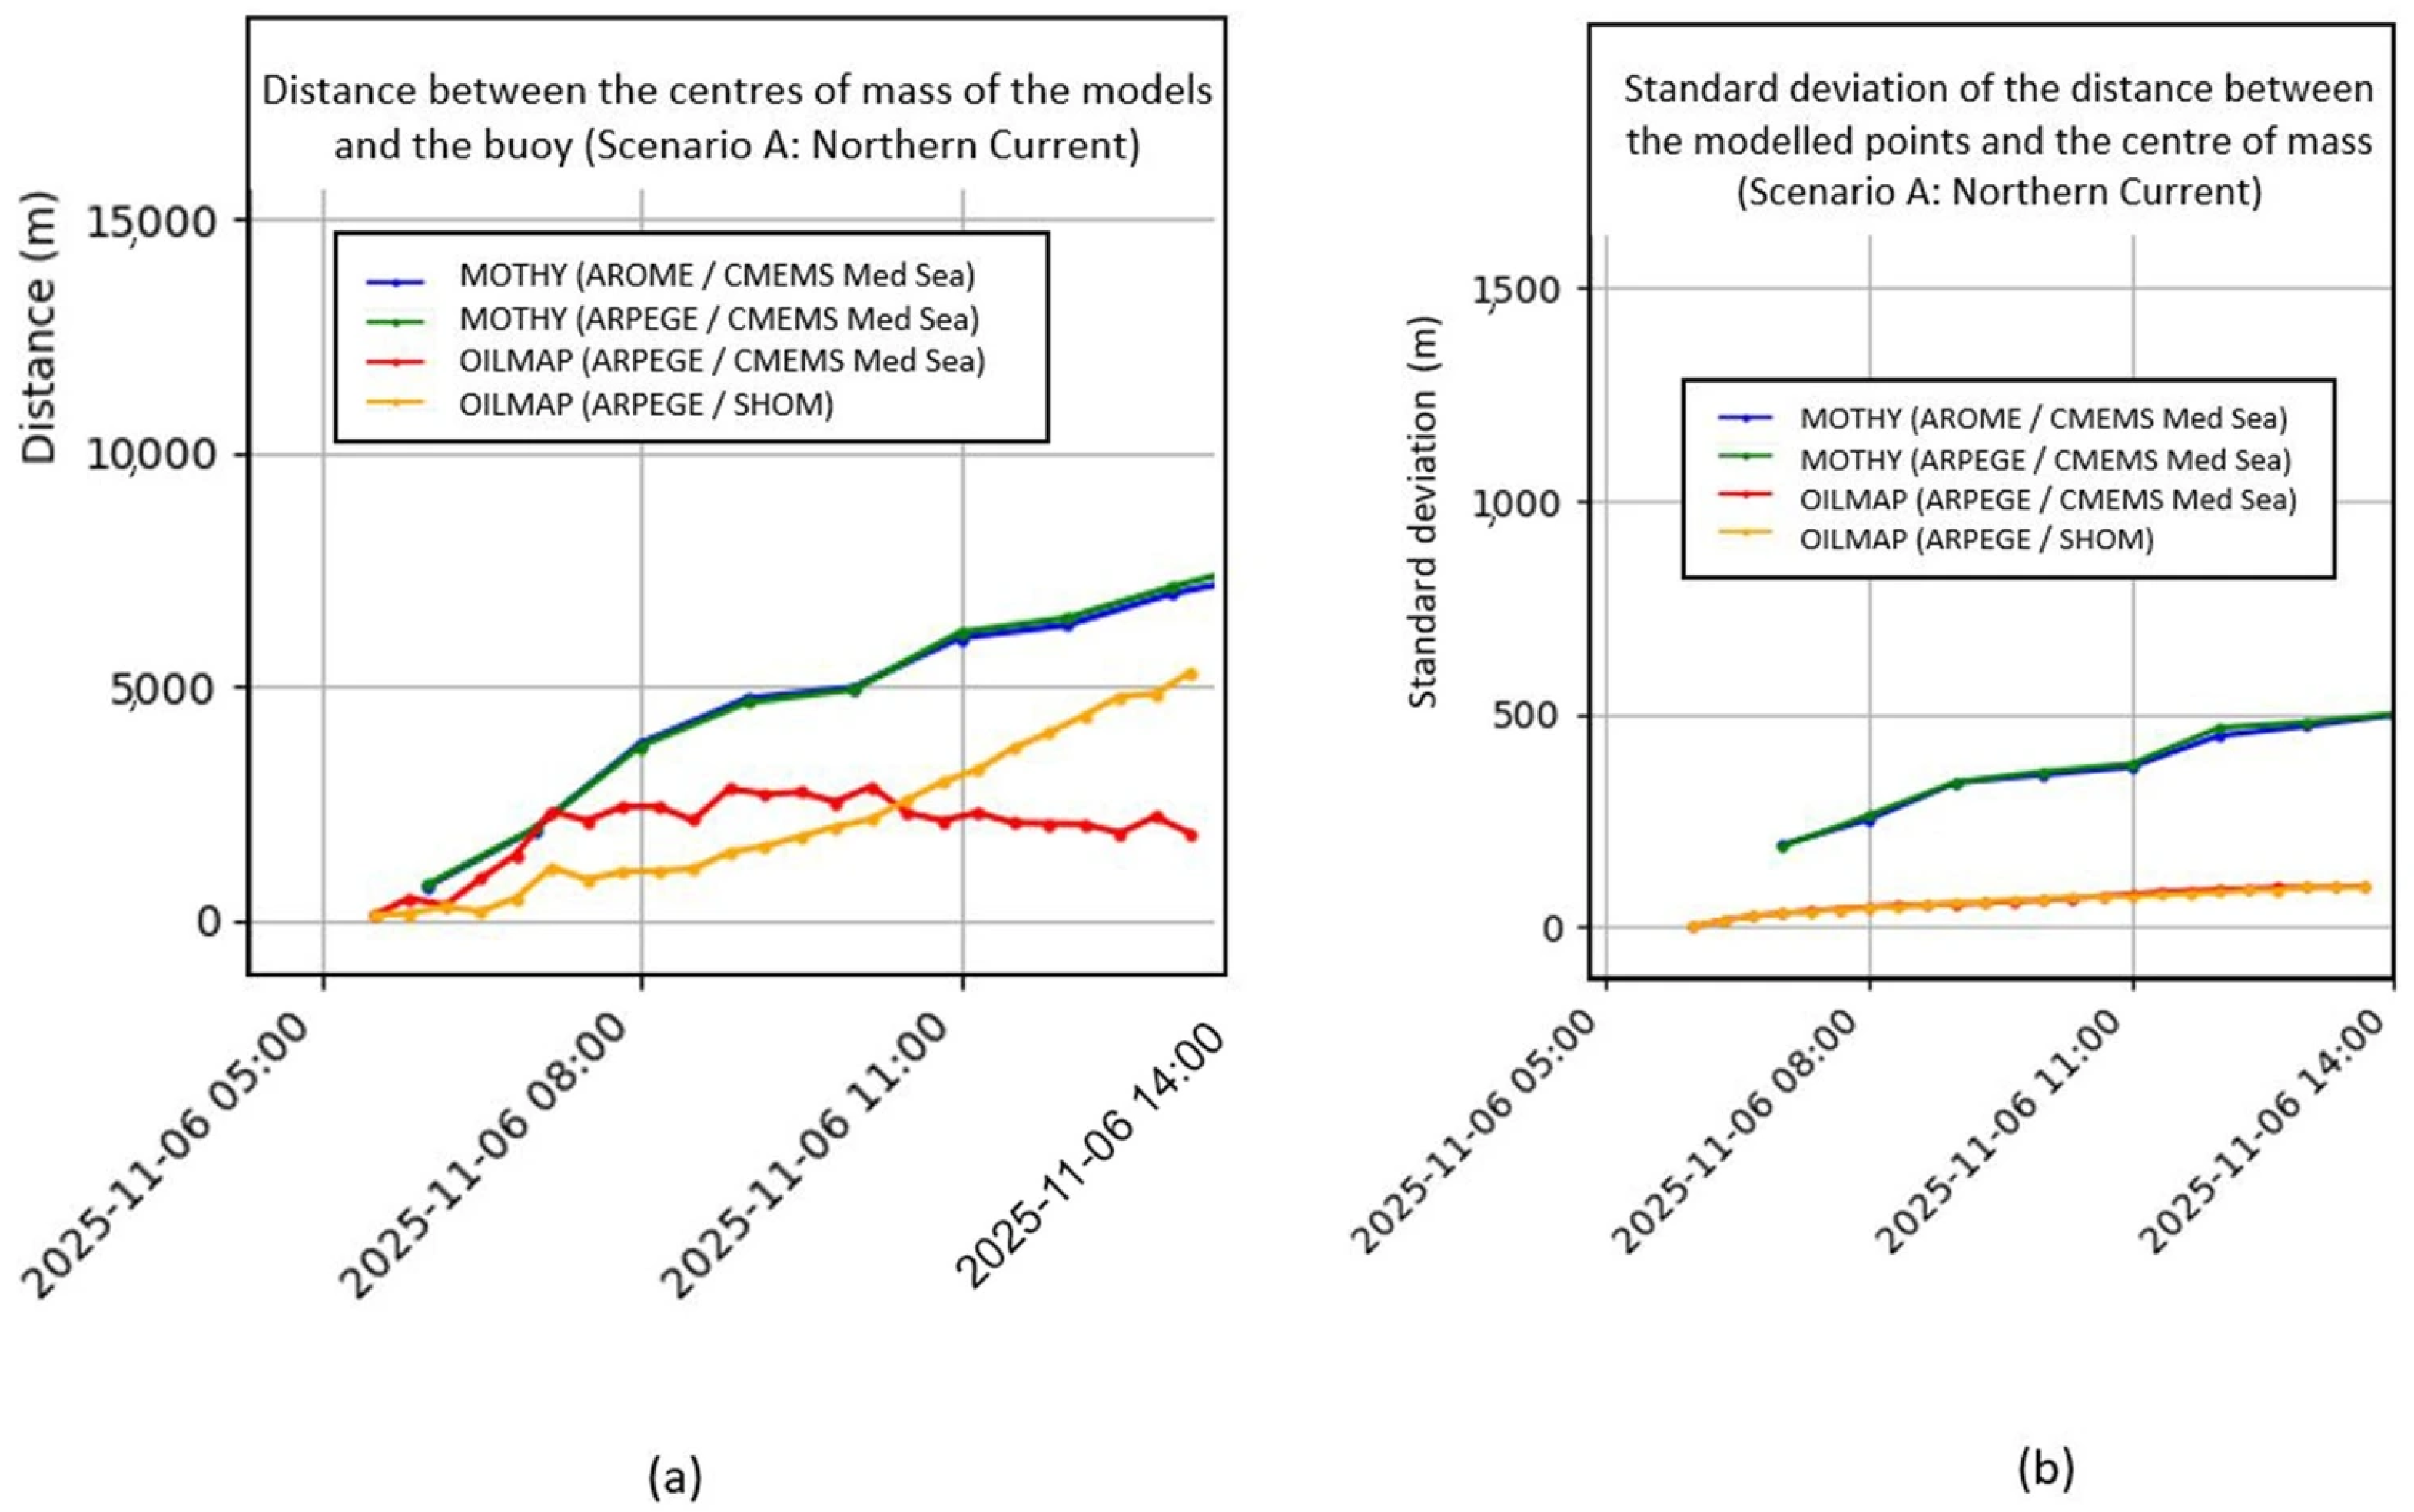
While not exhaustive, one particularly valuable tool is worth mentioning: CEDRE has developed Python (Version 3.13) scripts that generate analytical graphs, including visual tracking of the differences in distances between model predictions and observed buoy trajectories. This script generates graphs using temporal matching of observations and model outputs. It calculates the center point of the simulated slick for each time step and calculates the Euclidean distance between this point and the position of the corresponding buoy at the corresponding time. If no buoy data was sent at the exact time in question, the script will retrieve the buoy’s position at the nearest time, with a maximum tolerance of 30 min, which is an appropriate threshold relative to the rate of change in model-buoy distance over time. To complement the analysis and take into account the fact that a high degree of horizontal dispersion would be more likely to occur in the proximity of the buoy, the script also generates a graph showing the standard variation over time, calculated based on the distance of all modeled points from the center point.
The reports produced by CODER, compiling these analyses, are systematically transmitted to the maritime authorities, CEPPOL, and other response agencies, promoting a unified and coordinated approach to spill management.
3. CODER Training Exercises. Case Study on the RAMOGEPOL 2025 Exercise
3.1. Annual Training Exercises: Organization and Main Objectives
To maintain its level of preparedness to respond to spills and carry out its missions, CODER is involved in an annual exercise organized by the French authorities, in which real spill situations are simulated. Since 2022, these exercises have been conducted in coordination with the ORSEC (Organization of Civilian Emergency Services) Maritime POLMAR (Pollution Marine) exercises, which are equivalent to tier 3 antipollution exercises, in different maritime regions (BIRVIDEAUX 22 and ARCACHON 23 exercises in the Atlantic Ocean, POL’NORD 24 in the English Channel and RAMOGEPOL 2025 in the Mediterranean Sea).
For environmental protection reasons, no actual oil is released during these exercises. Instead, drifting buoys, deployed by CEPPOL, in accordance with CODER’s recommendations, are used to simulate the movement of hypothetical oil slicks. This approach allows the committee to evaluate drift model performance under realistic hydrodynamic conditions while adhering to strict environmental regulations.
Building on past experiences, CODER exercises associated with ORSEC exercises are conducted according to an established process. As soon as CEPPOL is informed of the ORSEC exercise scenario, it passes on this information to CEDRE. CEDRE and Météo-France review the weather and ocean forecasts for the time of the exercise, run the MOTHY and OILMAP drift forecast models, and propose one or several locations for deploying buoys. CEPPOL is responsible for launching the buoys. On the day of the exercise, CODER is activated, and CEDRE runs simulations using the OILMAP model, while Météo-France operates the MOTHY model; both, along with any international partners involved, generate drift predictions based on the real-time positions of the deployed buoys. CODER meets to analyze the drift of the buoys and the forecasts generated by the models. Within a few hours, the committee provides the maritime authorities in charge of the exercise with a report enabling them to anticipate the drift and any possible arrivals on the coast as accurately as possible, so that they can consider deploying the appropriate resources in a real-world scenario. The Drift Committee usually meets again a few days after the exercise to compare the modeling results with the trajectory of the buoys over a longer period to verify the relevance of the recommendations provided to the maritime authorities, and carry out improvement tests. This post-exercise meeting is very important and provides the opportunity to analyze the models in more depth. Certain limitations of the models can also be identified in greater detail and brought to the attention of the developers, who may then adjust their modeling systems whenever possible.
A comprehensive case study based on the RAMEGEPOL 25 exercise is detailed to provide insight into CODER’s operational framework.
3.2. RAMOGEPOL 2025 Exercise
3.2.1. Operational Context, Meteorological Conditions and Site Selection
The CODER 2025 exercise was linked to the major ORSEC Maritime “RAMOGEPOL 2025” marine pollution response exercise (POLMAR) which took place on 6 November 2025 off the coast of Saint-Tropez, France. This exercise was part of the operational plan for the prevention and control of marine pollution known as “RAMOGEPOL”, signed in 1993 by France, Italy, and Monaco, in the framework of the trilateral RAMOGE Agreement. Its area of application extends from the mouth of the Rhône River in the west to the Capo d’Anzio lighthouse in the east and includes Sardinia and Corsica. The objective of this plan is to harmonize pollution response resources and operational procedures in the Mediterranean basin. To test its effectiveness, “full-scale” exercises simulating spill response operations are regularly organized.
The 2025 exercise order defined the following general hypothetical scenario (Excerpt from exercise order No. 501423/PREMAR_MED/AEM/NP of 3 November 2025):
“On Thursday, 6 November 2025 at 08:00 LT (Local Time), CROSS Med received a call from an oil tanker that had just been struck off the coast of Saint-Tropez by a vessel that had continued on its way. It reported a breach in its hull, with two rear holds appearing to be torn open and heavy fuel oil spilling out. The pollution has been confirmed by a French Navy overflight, which reported a ‘discontinuous true color’ slick splitting into two, with one part drifting towards Cap Camarat and the other towards Île du Levant. The maritime authorities triggered level 3 of the ORSEC maritime plan, activated the RAMOGE response plan and informed the specialized coastal court (JULIS).”
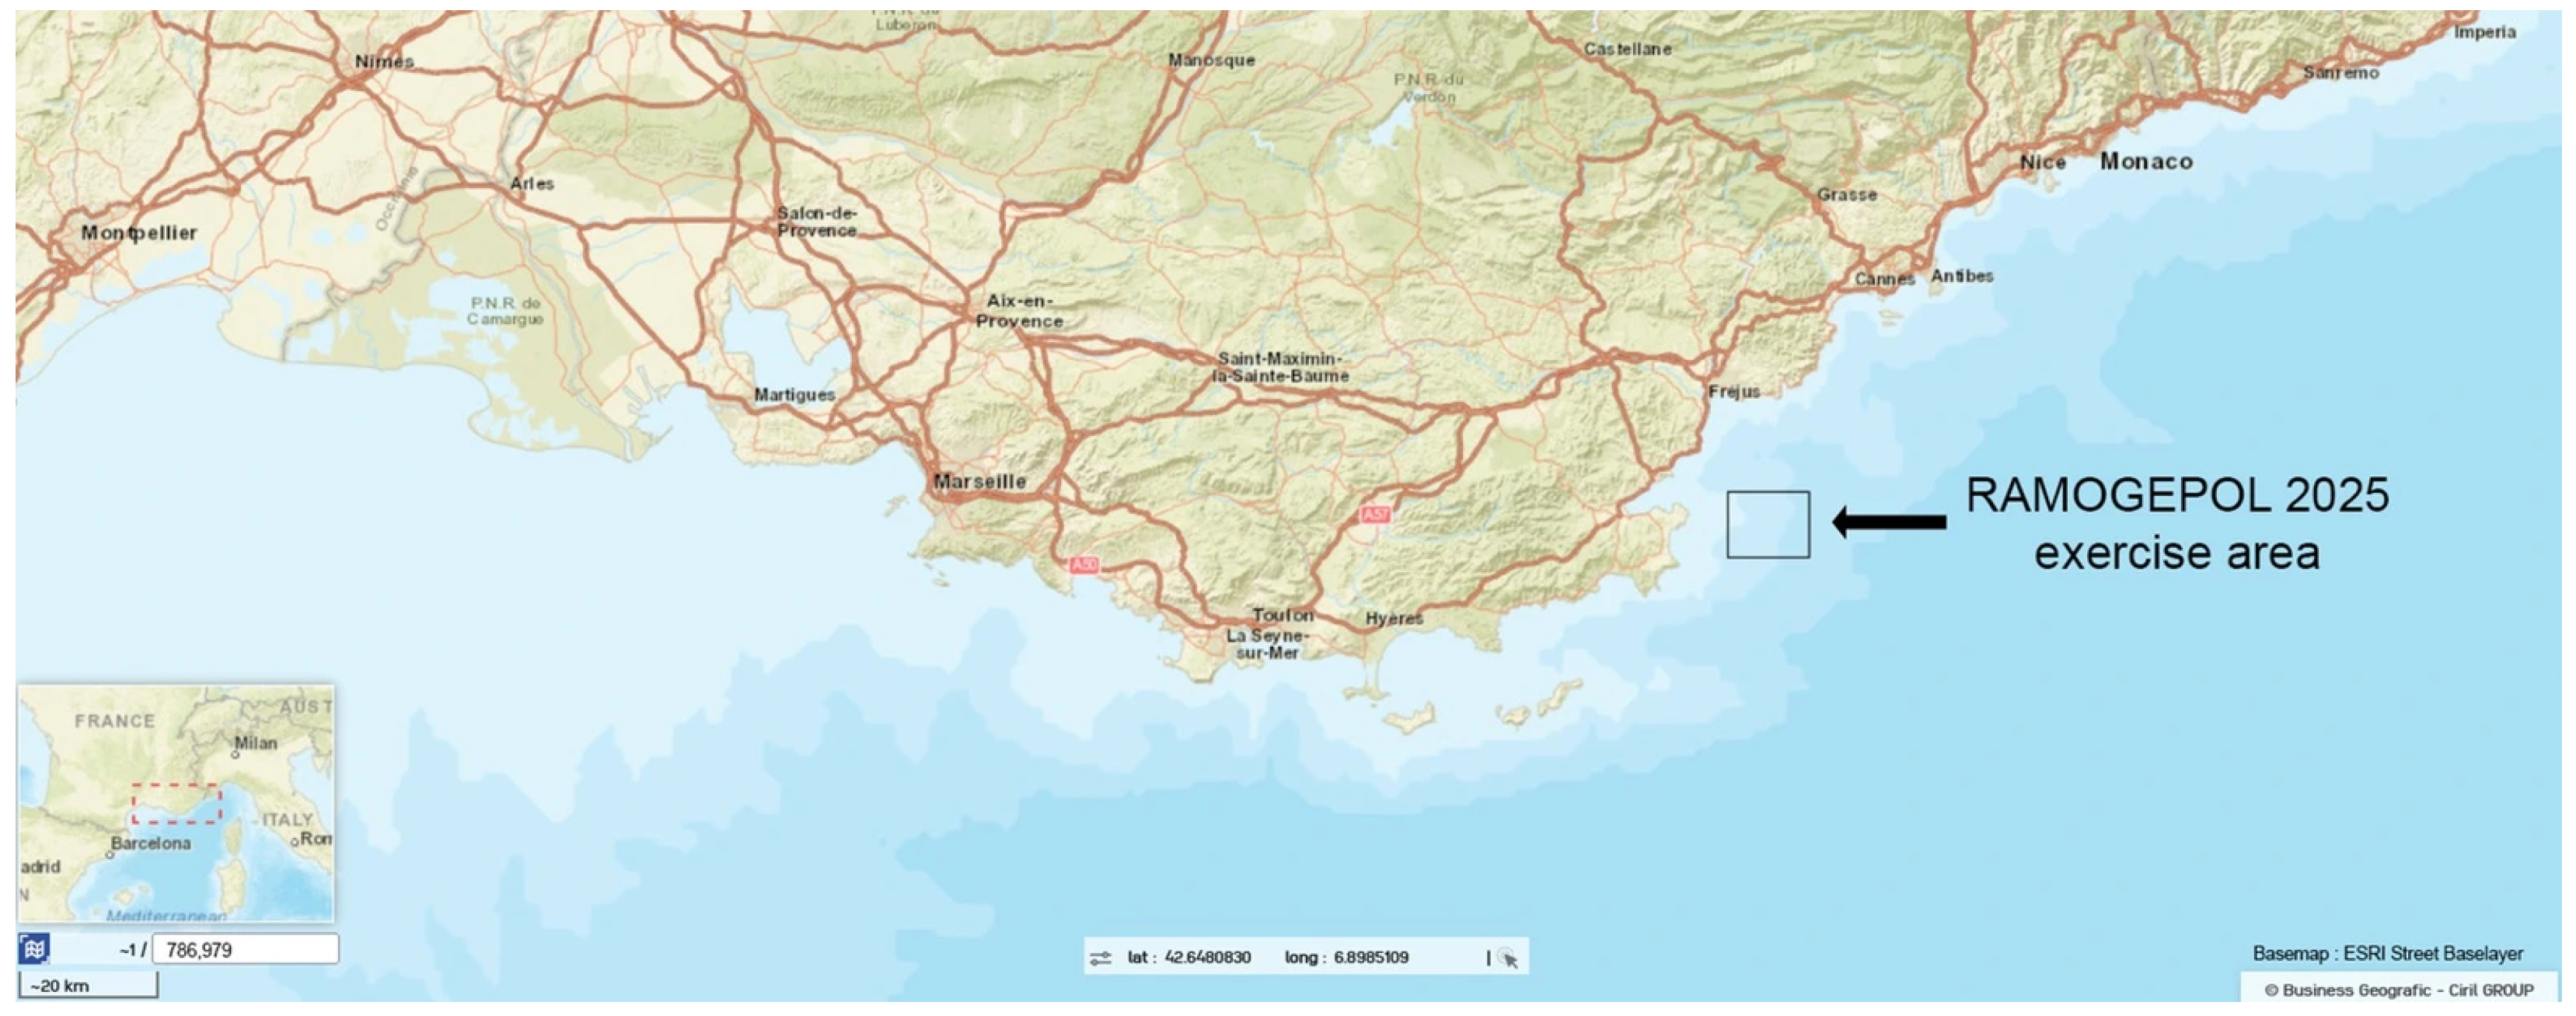
The ORSEC scenario defined an exercise area, without specifying the exact location of the incident (
Figure 3).
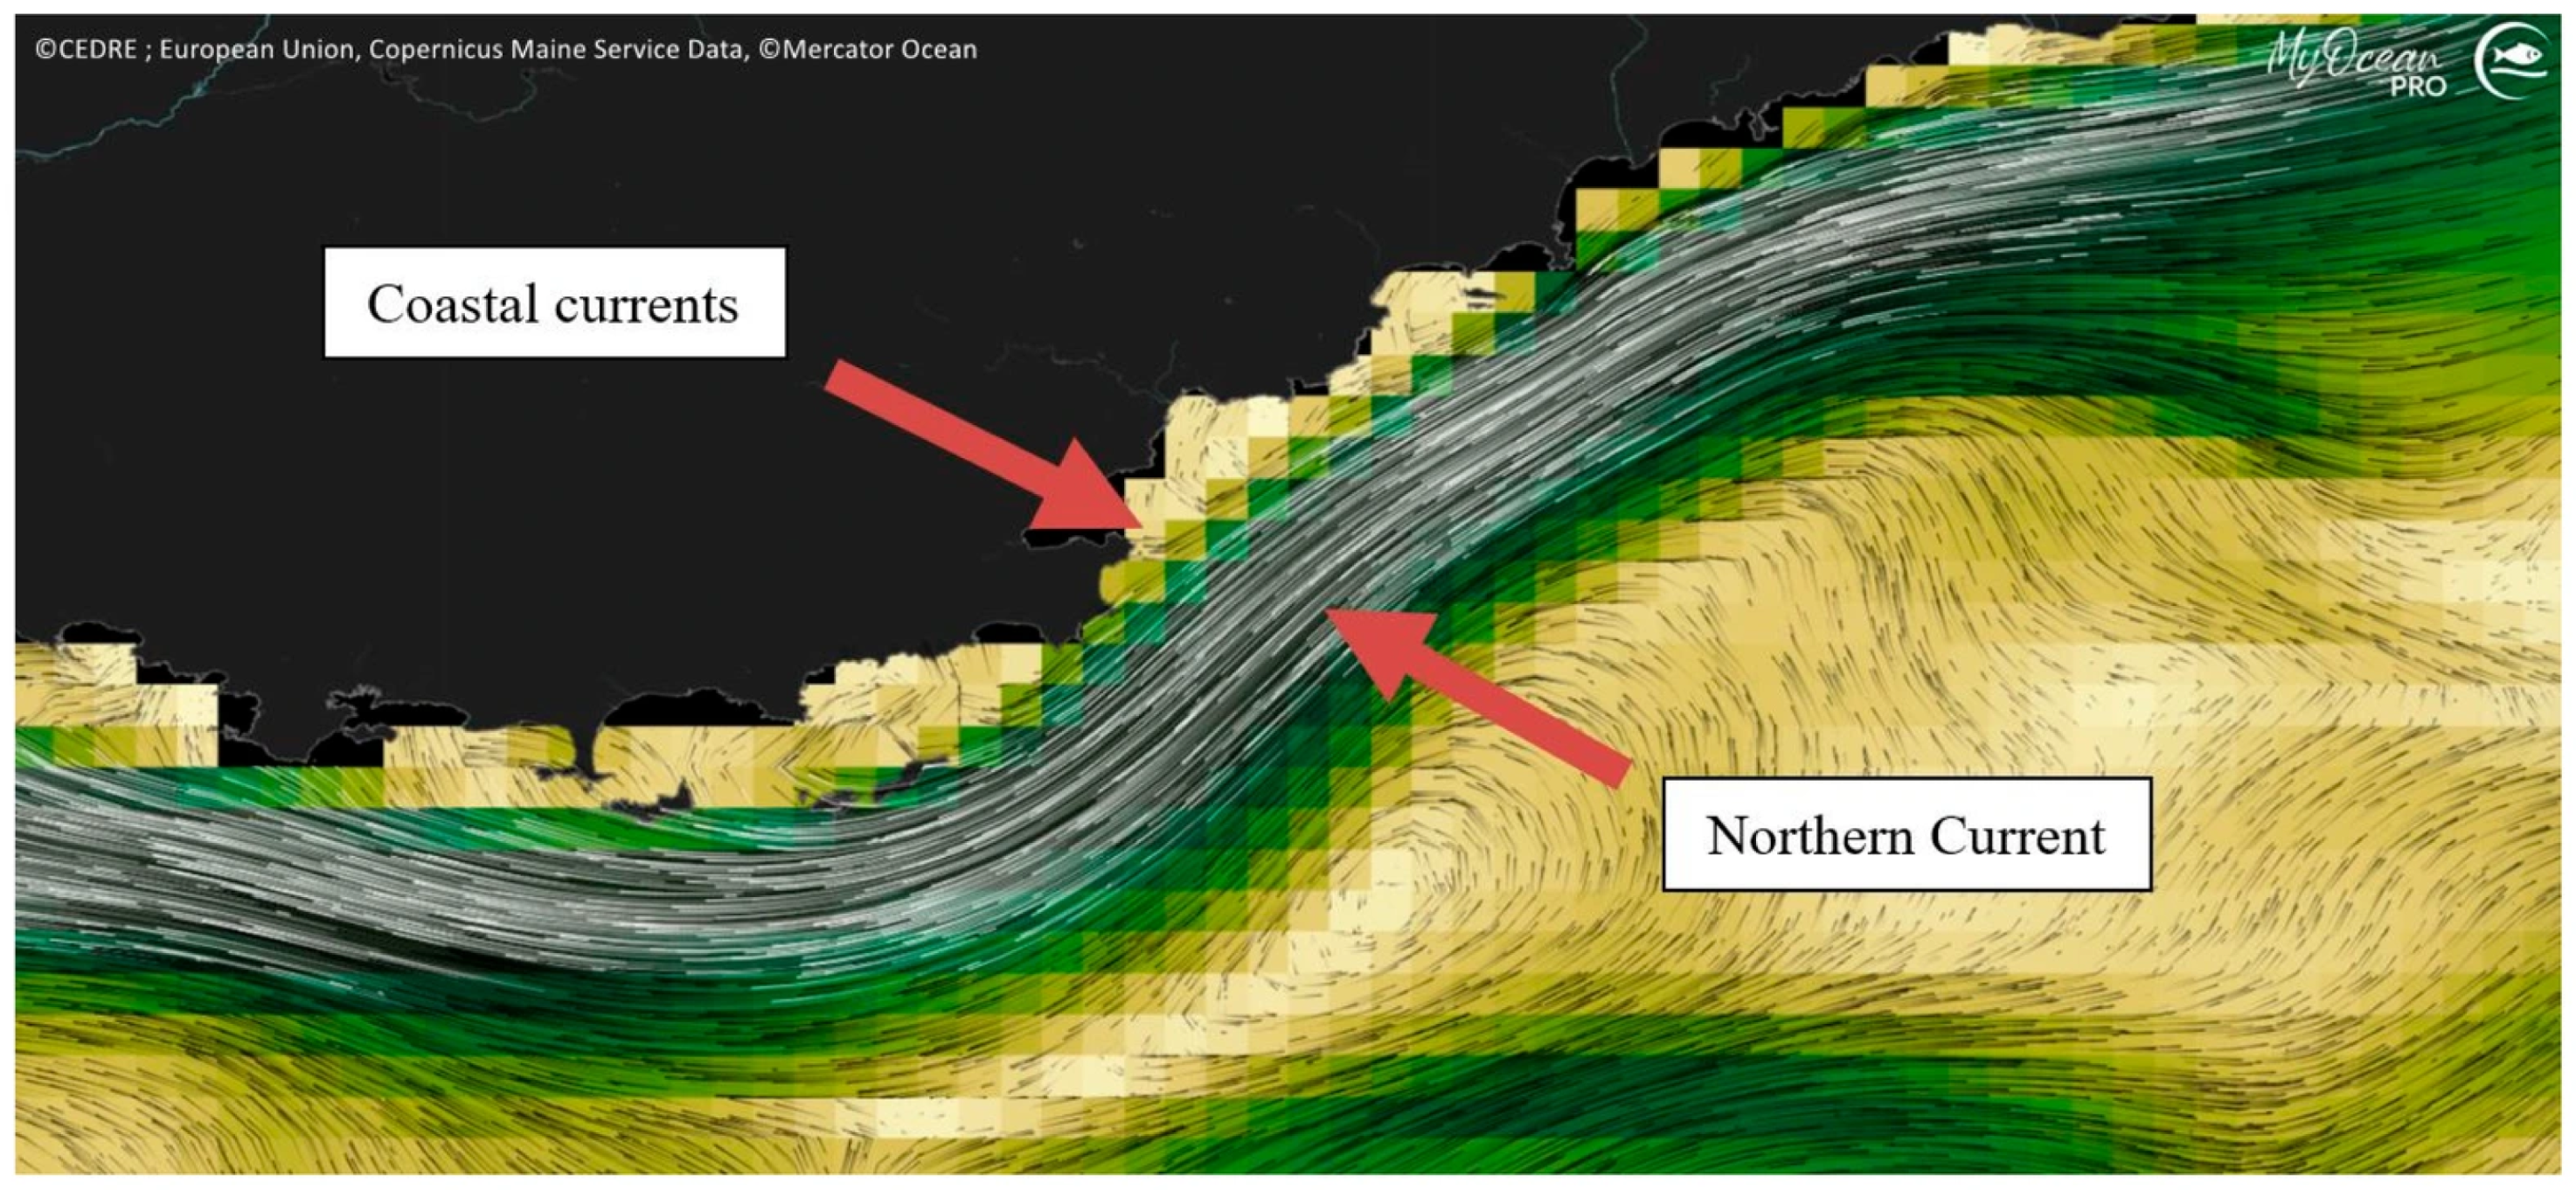
The exercise area is characterized by the presence of a persistent surface current along the French Mediterranean coast, the Northern Current (
Figure 4) [
33]. This slope current flows predominantly from East to West and is located 20–80 km from the coast in the study area at this time of year. It separates the denser waters of the open sea from the coastal waters [
34]. This current demonstrates marked seasonal variability with distinct winter (January–March) and summer (late spring-autumn) conditions. During summer conditions, the current is about 35–50 km wide, shallow (<250 m) and currents reach maximum velocities of 30–50 cm/s. These conditions are in contrast to the winter conditions, during which the current is narrower, 20 to 30 km, deeper, 250 to 500 m, and increases in speed up to 60–80 cm/s [
35]. Additionally to the Northern Current, the exercise area also shows weaker and more unstable nearshore currents closer to the shoreline. These currents are strongly influenced by local winds. Current- and wind-induced drift in this region presents great challenges for modeling in a realistic way, making this area particularly interesting.
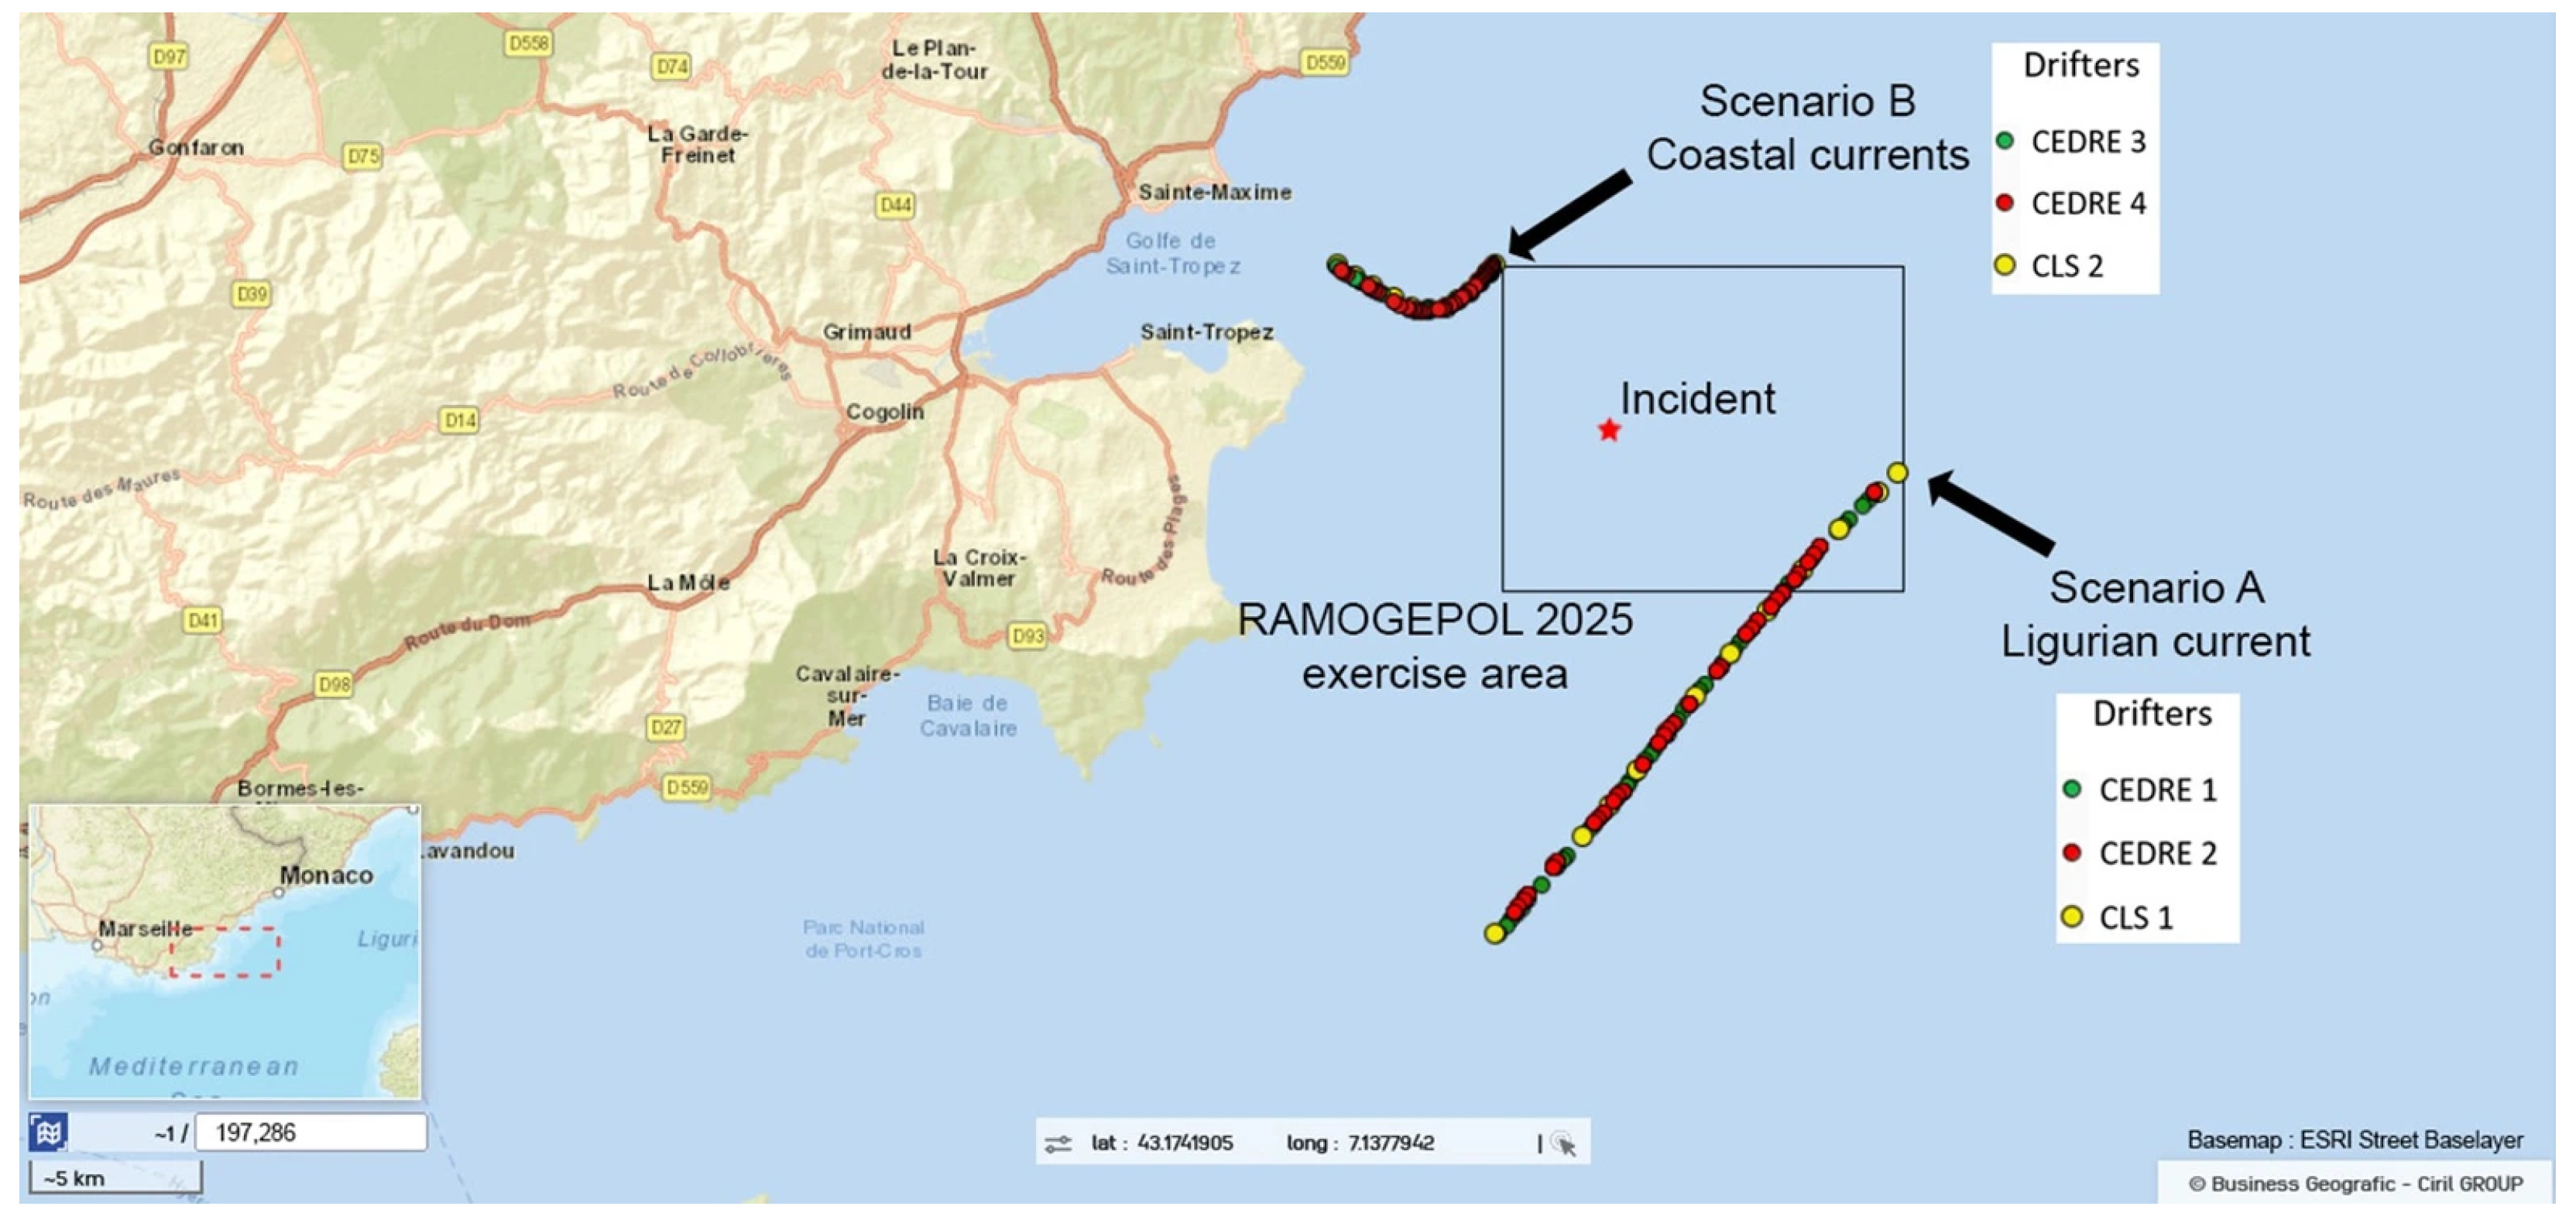
A few days before the exercise, Météo-France and CEDRE met to optimize buoy deployment strategies. To test the performance of predictive models in these distinct environmental conditions, two scenarios were prepared and buoys were to be deployed in two areas: (i) scenario A, where an oil slick might be mainly influenced by the regional well-established current and (ii) scenario B, where drifting might be driven by the interactions of more coastal currents and local winds. These two locations are also positioned to realistically reproduce the oil slick dispersal patterns under non-homogeneous hydrodynamic conditions. Additionally, these scenarios provide operational advantages: the sites are located at adequate distances from the coast, preventing buoys from being rapidly reaching the shore due to wind-driven currents.
3.2.2. The Real-Time CODER Exercise Operation
On Thursday, 6 November 2025, CEPPOL deployed six drifting buoys: one CLS MARGET-II and two CEDRE GPS-equipped buoys in the Northern Current, and another set of one CLS MARGET-II and two CEDRE GPS-equipped buoys in the coastal currents. The first set of buoys was released at 05:12 UTC (Coordinated Universal Time) in the Northern Current, while the second set was deployed in coastal waters at 05:58 UTC (
Table 3).
At 07:15 UTC on 6 November, Météo-France forecasters issued a weather report predicting a moderate east to north-east wind, force 4 to 5 (15 to 20 knots), which was expected to strengthen in the evening to reach force 5 to 6 (20 to 25 knots). Strong gusts during thunderstorms would accompany this average wind during the night and the following morning. The bulletin also mentioned that sea conditions would deteriorate in the evening, with waves reaching up to 2 m to 2.5 m during the night and the following day.
Between 07:30 and 08:30 UTC, Météo-France conducted two MOTHY simulations based on the CODER scenarios (scenario A: Northern Current; scenario B: coastal currents), using the buoy deployment positions as inputs. These simulations relied on forecasts from the CMEMS MEDSEA current model and the ARPEGE and AROME wind models. Simultaneously, CEDRE ran two OILMAP simulations for the same CODER scenarios, using forecasts from the CMEMS MEDSEA and Shom current models and the ARPEGE wind model.
All simulation results, along with the buoy positions, were integrated into the CODER mapping platform before the committee convened at 09:00 UTC. The buoys’ actual trajectories were then compared with the model predictions. With this approach, CODER was able to assess the models’ ability to replicate real-world conditions, especially in areas where fine-scale processes and atmospheric disturbances could affect drift patterns.
During the first two hours of the meeting, CODER analyzed the data and ran updated simulations whenever new AROME and ARPEGE atmospheric forecasts became available, i.e., every 6 h, before issuing an initial report to the maritime authorities at 11:30 UTC.
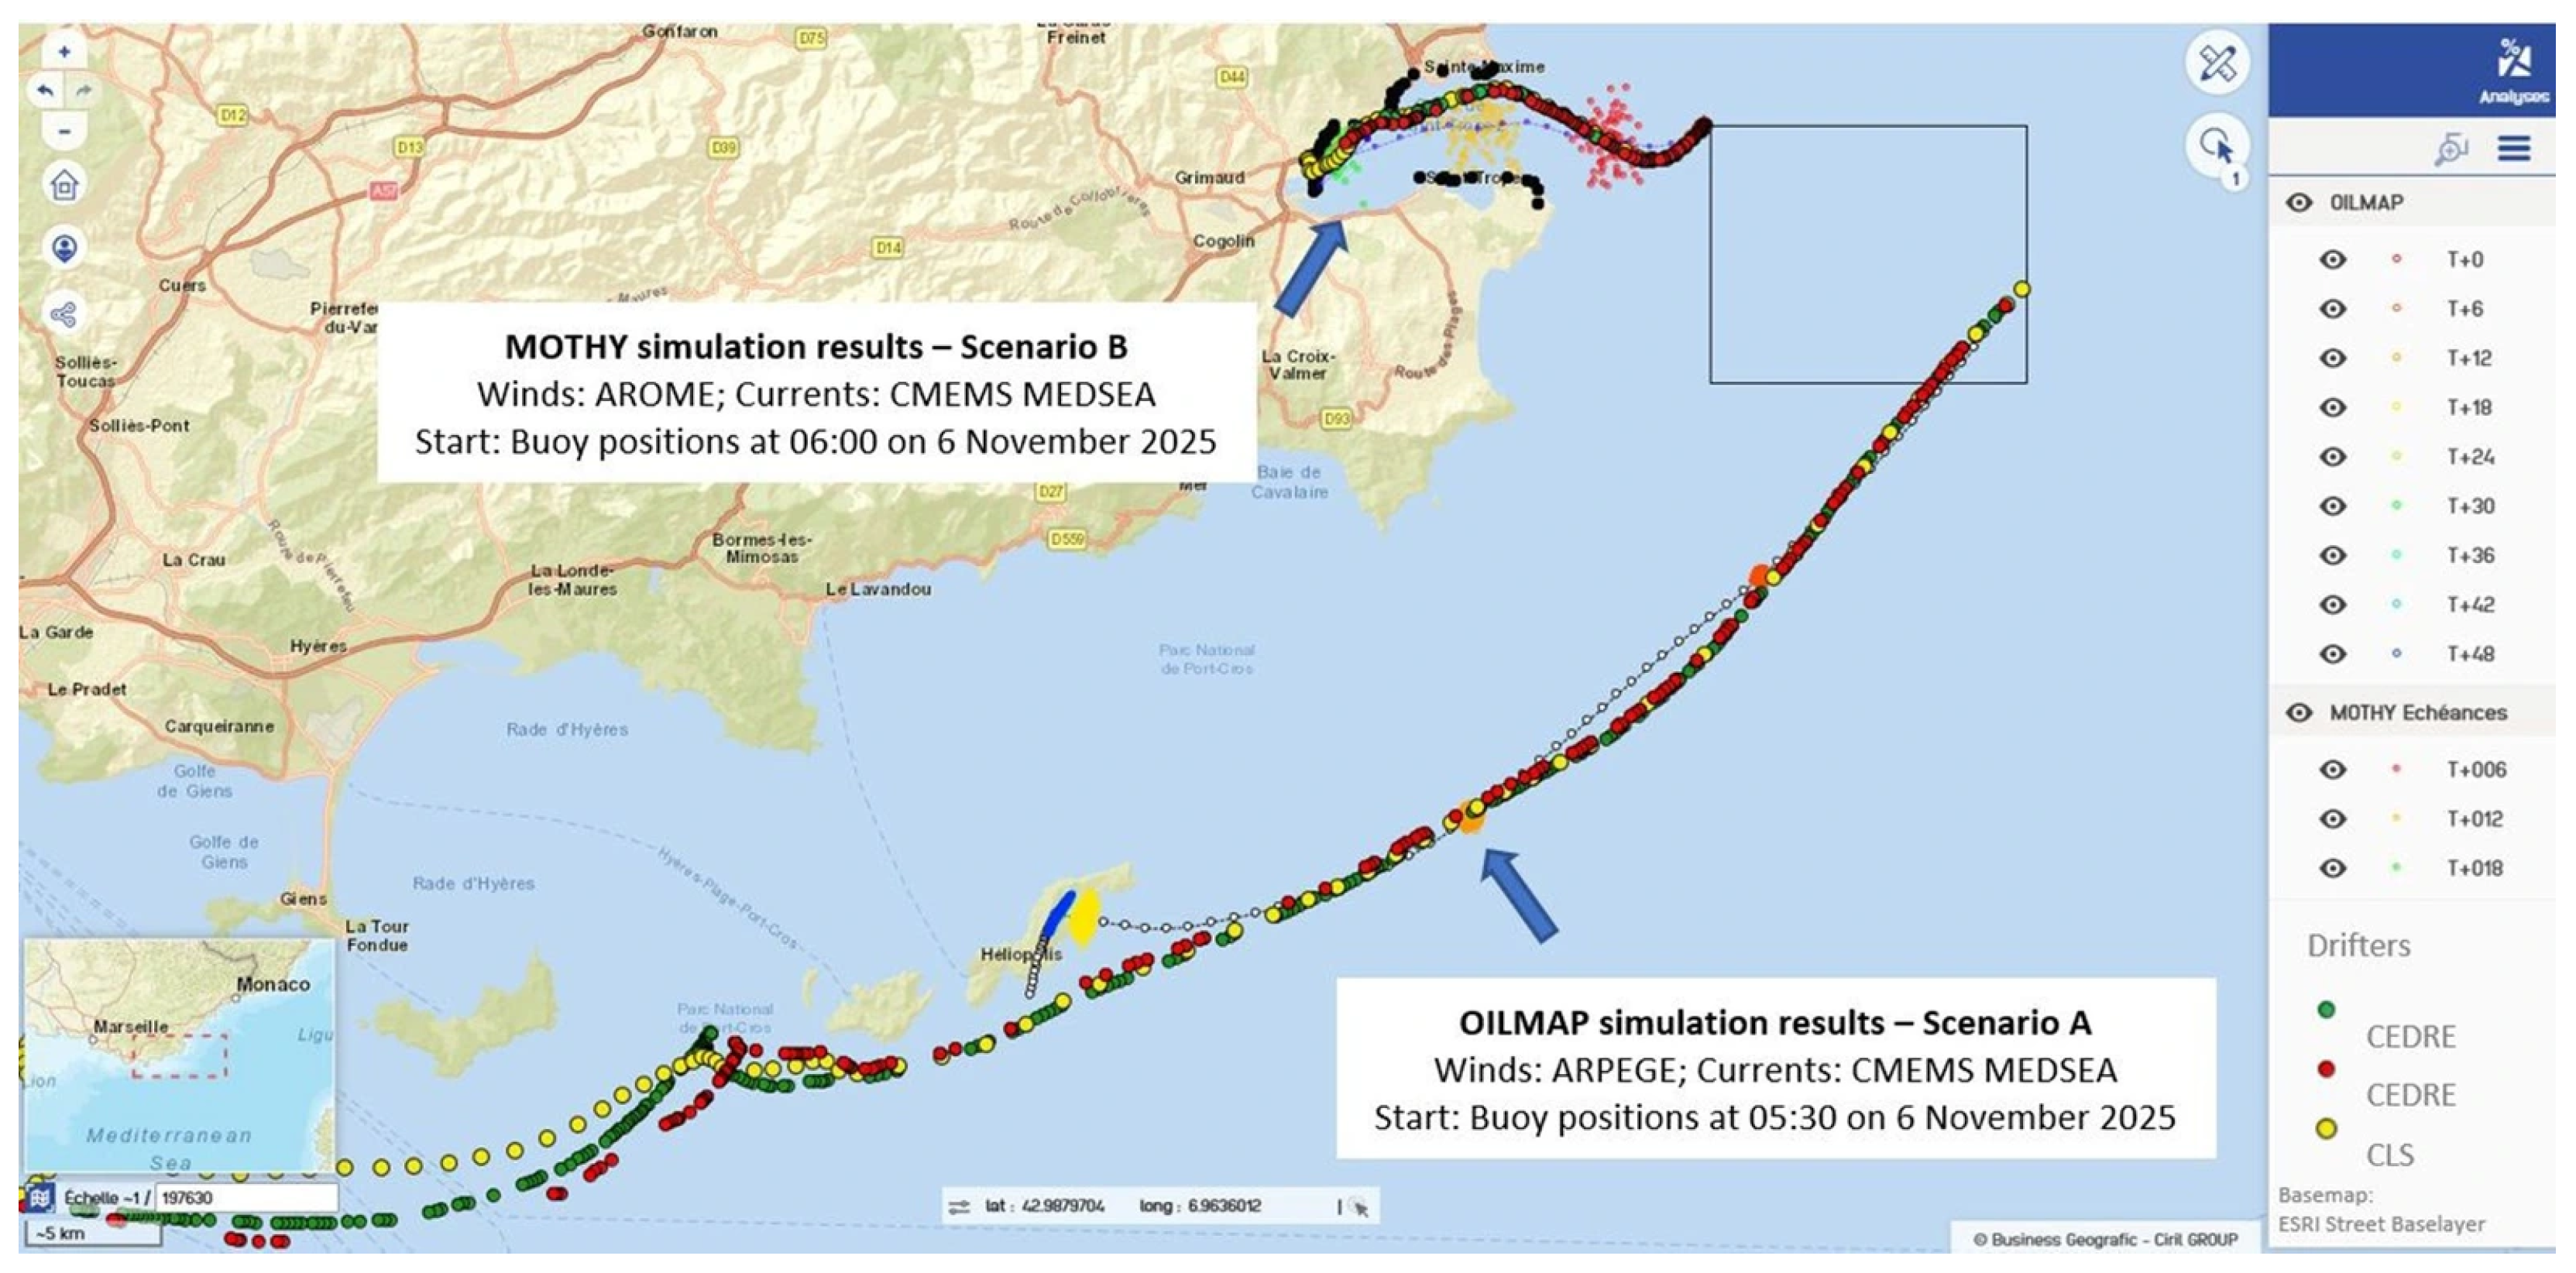
At that time, the situation was as follows: in each of the two sets, the three drifters were moving along the same trajectory at the same speed, further validating the design of the CEDRE buoys (at 11:30 UTC, 100 m between the buoys in Scenario A; 50 m in Scenario B). Those deployed in the Northern Current were being carried by this current, while those launched closer to the coast, more exposed to wind, were being pushed towards the shore (
Figure 5).
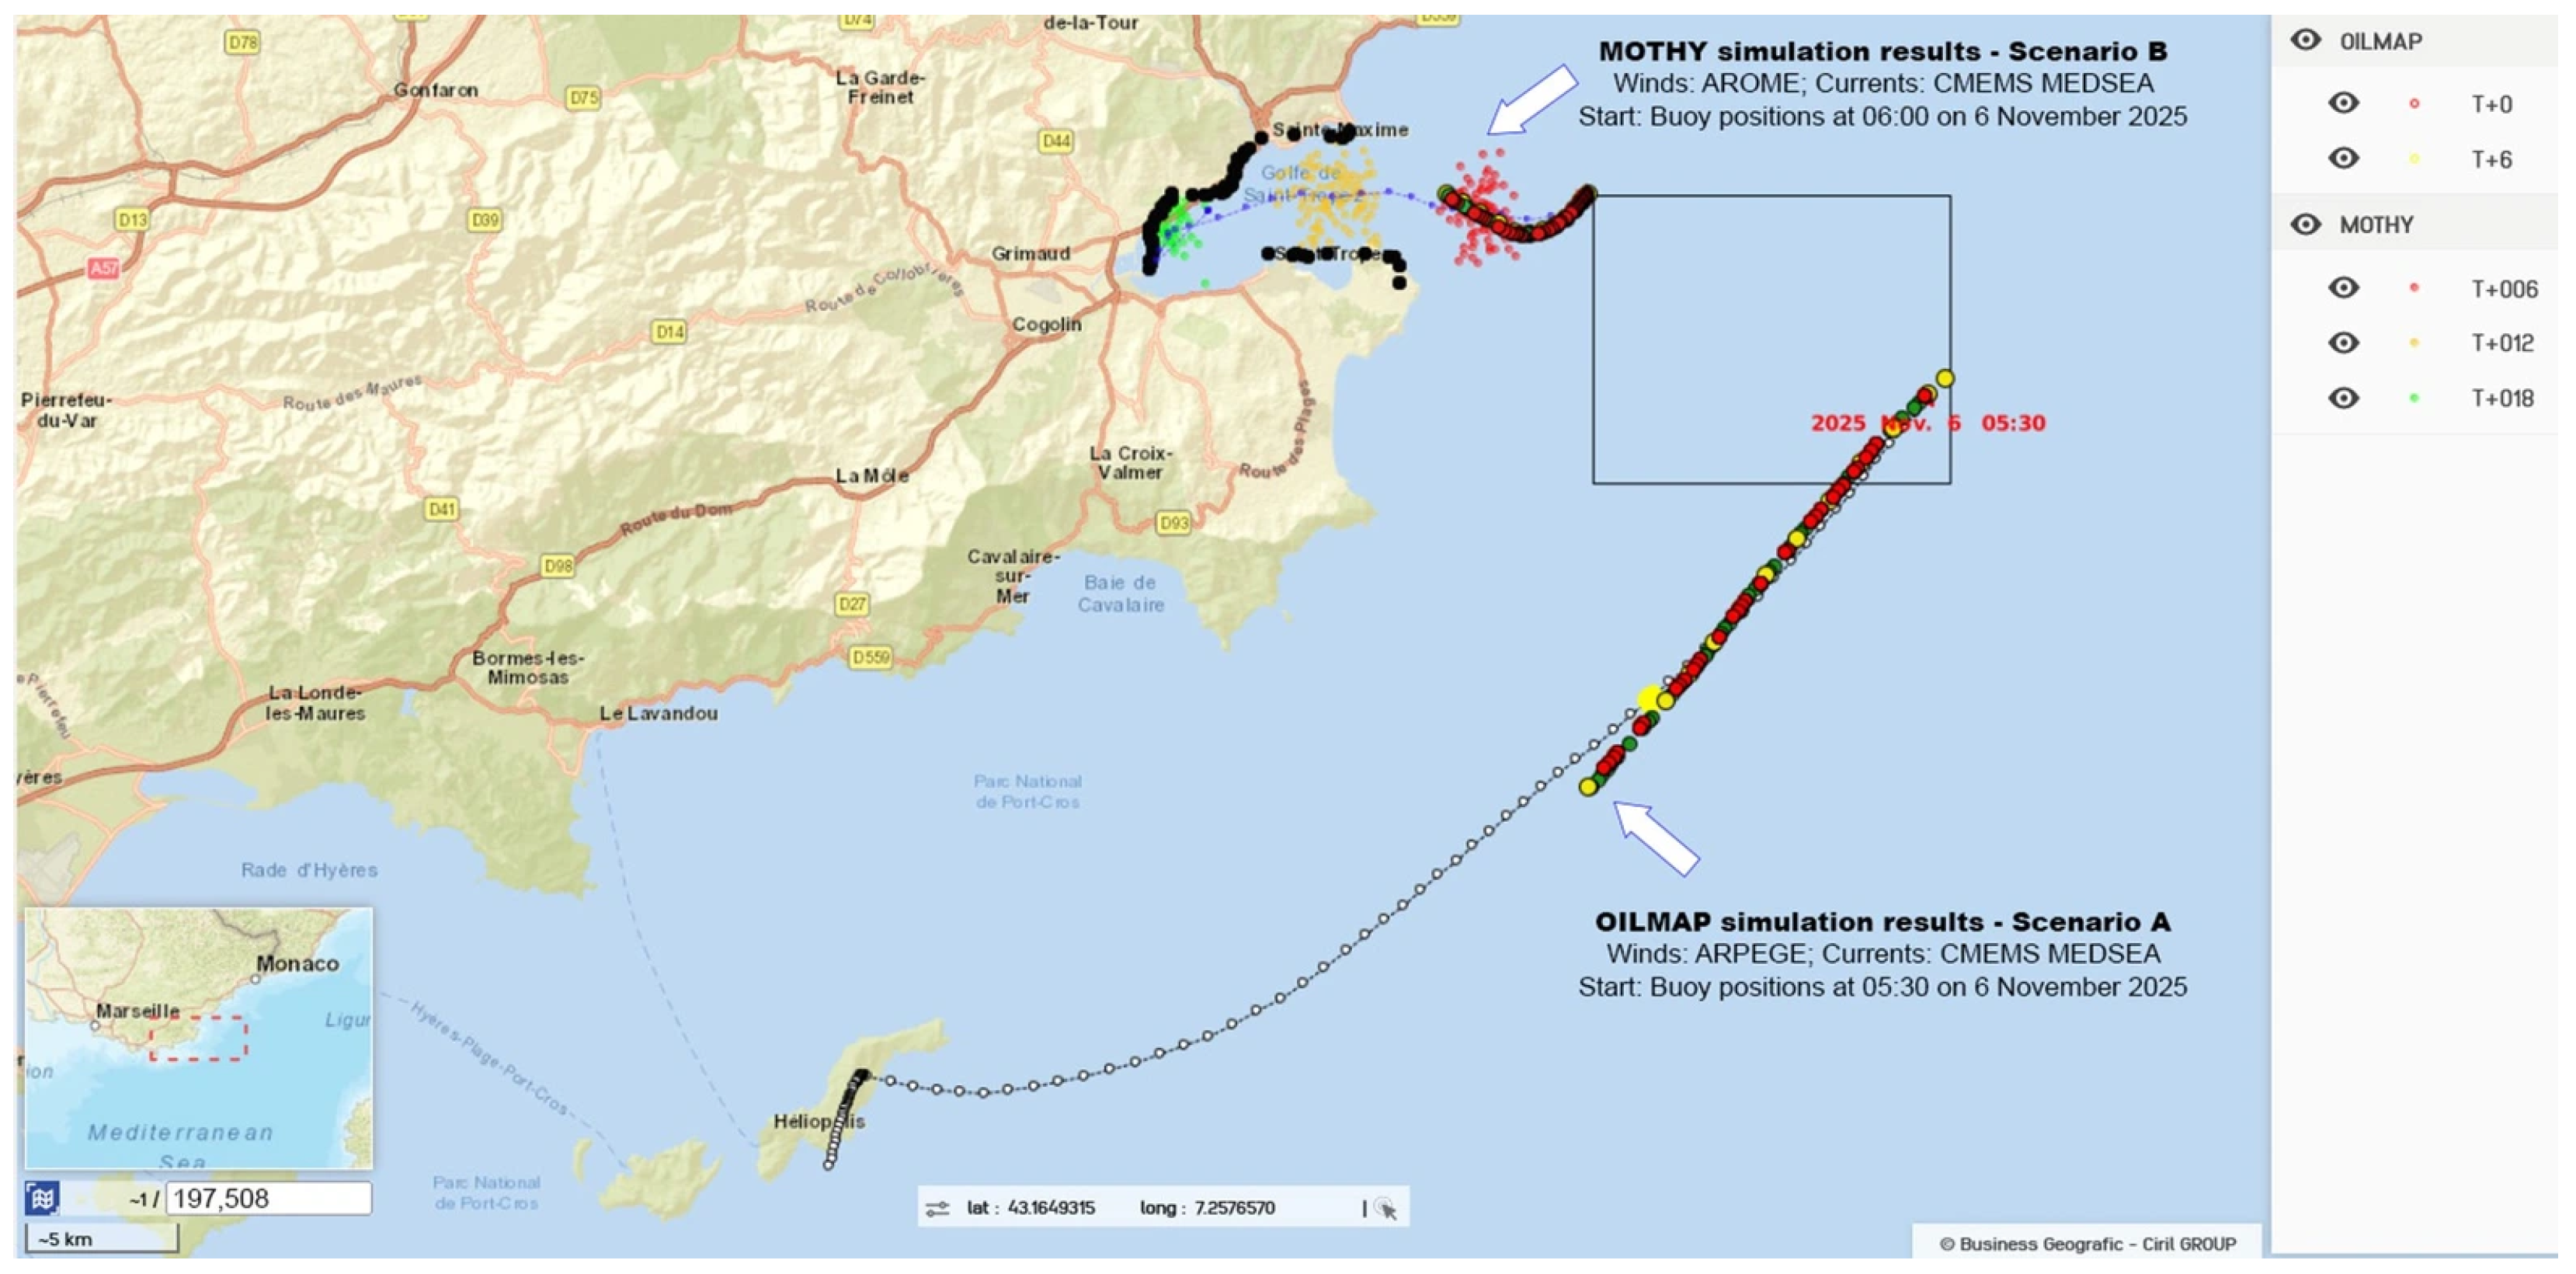
The four simulations based on the buoys’ launch positions in the Northern Current produced trajectories that closely matched the actual buoy paths during the first eight hours of drift. The best alignment was achieved using the OILMAP drift model, driven by CMEMS MEDSEA currents and ARPEGE winds (distance between the buoys and the center of mass at T + 8 h: ~2.4 km; ~4.9 km using OILMAP driven by Shom currents; ~6.6 km using MOTHY driven by AROME winds; ~6.8 km using MOTHY driven by ARPEGE winds,
Figure 6 and
Figure 7).
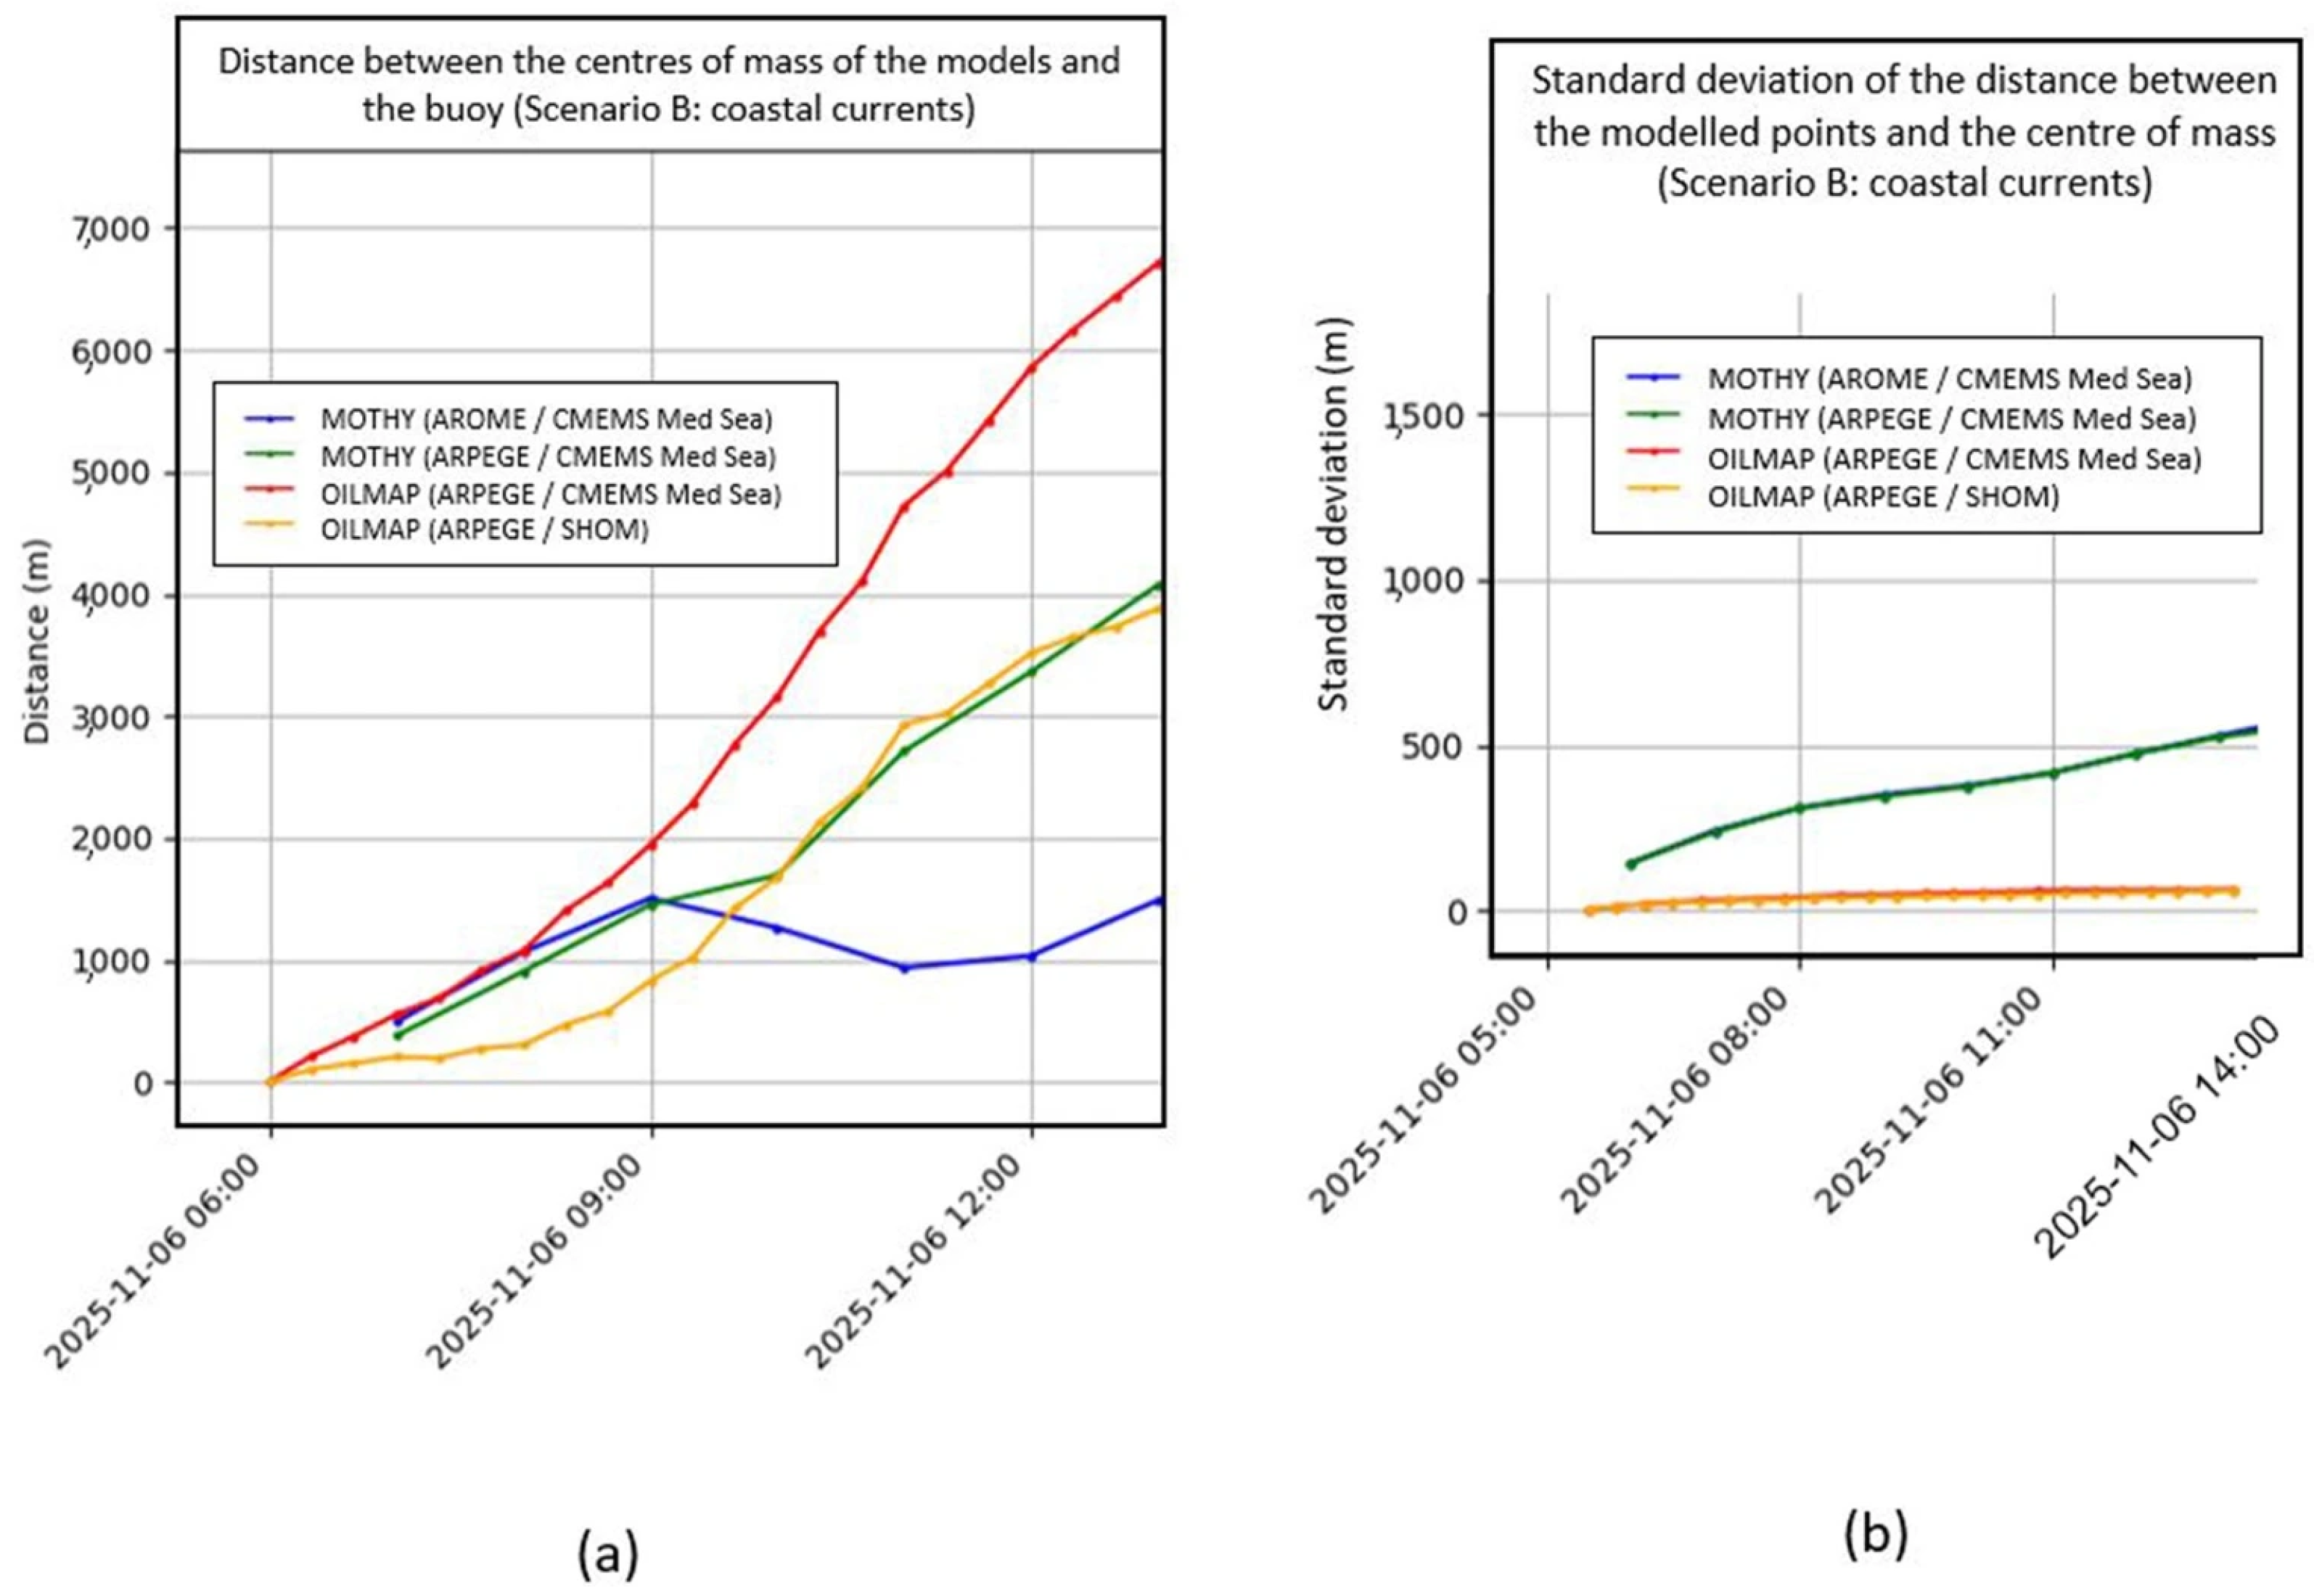
For the buoys deployed in the weaker currents, all four simulations predicted strandings, though at different locations. These discrepancies primarily arise from the challenges of near-coast modeling, particularly due to the limited spatial resolution of current models. After seven hours of drift, the MOTHY model simulation driven by CMEMS MEDSEA currents and AROME winds provided the closest match to the observed buoy trajectories (distance between the buoys and the center of mass at T + 7 h: ~1.6 km; ~3.9 km using OILMAP driven by Shom currents; ~4.1 km using MOTHY driven by ARPEGE winds; ~6.6 km using OILMAP driven by CMEMS MEDSEA currents,
Figure 6 and
Figure 8).
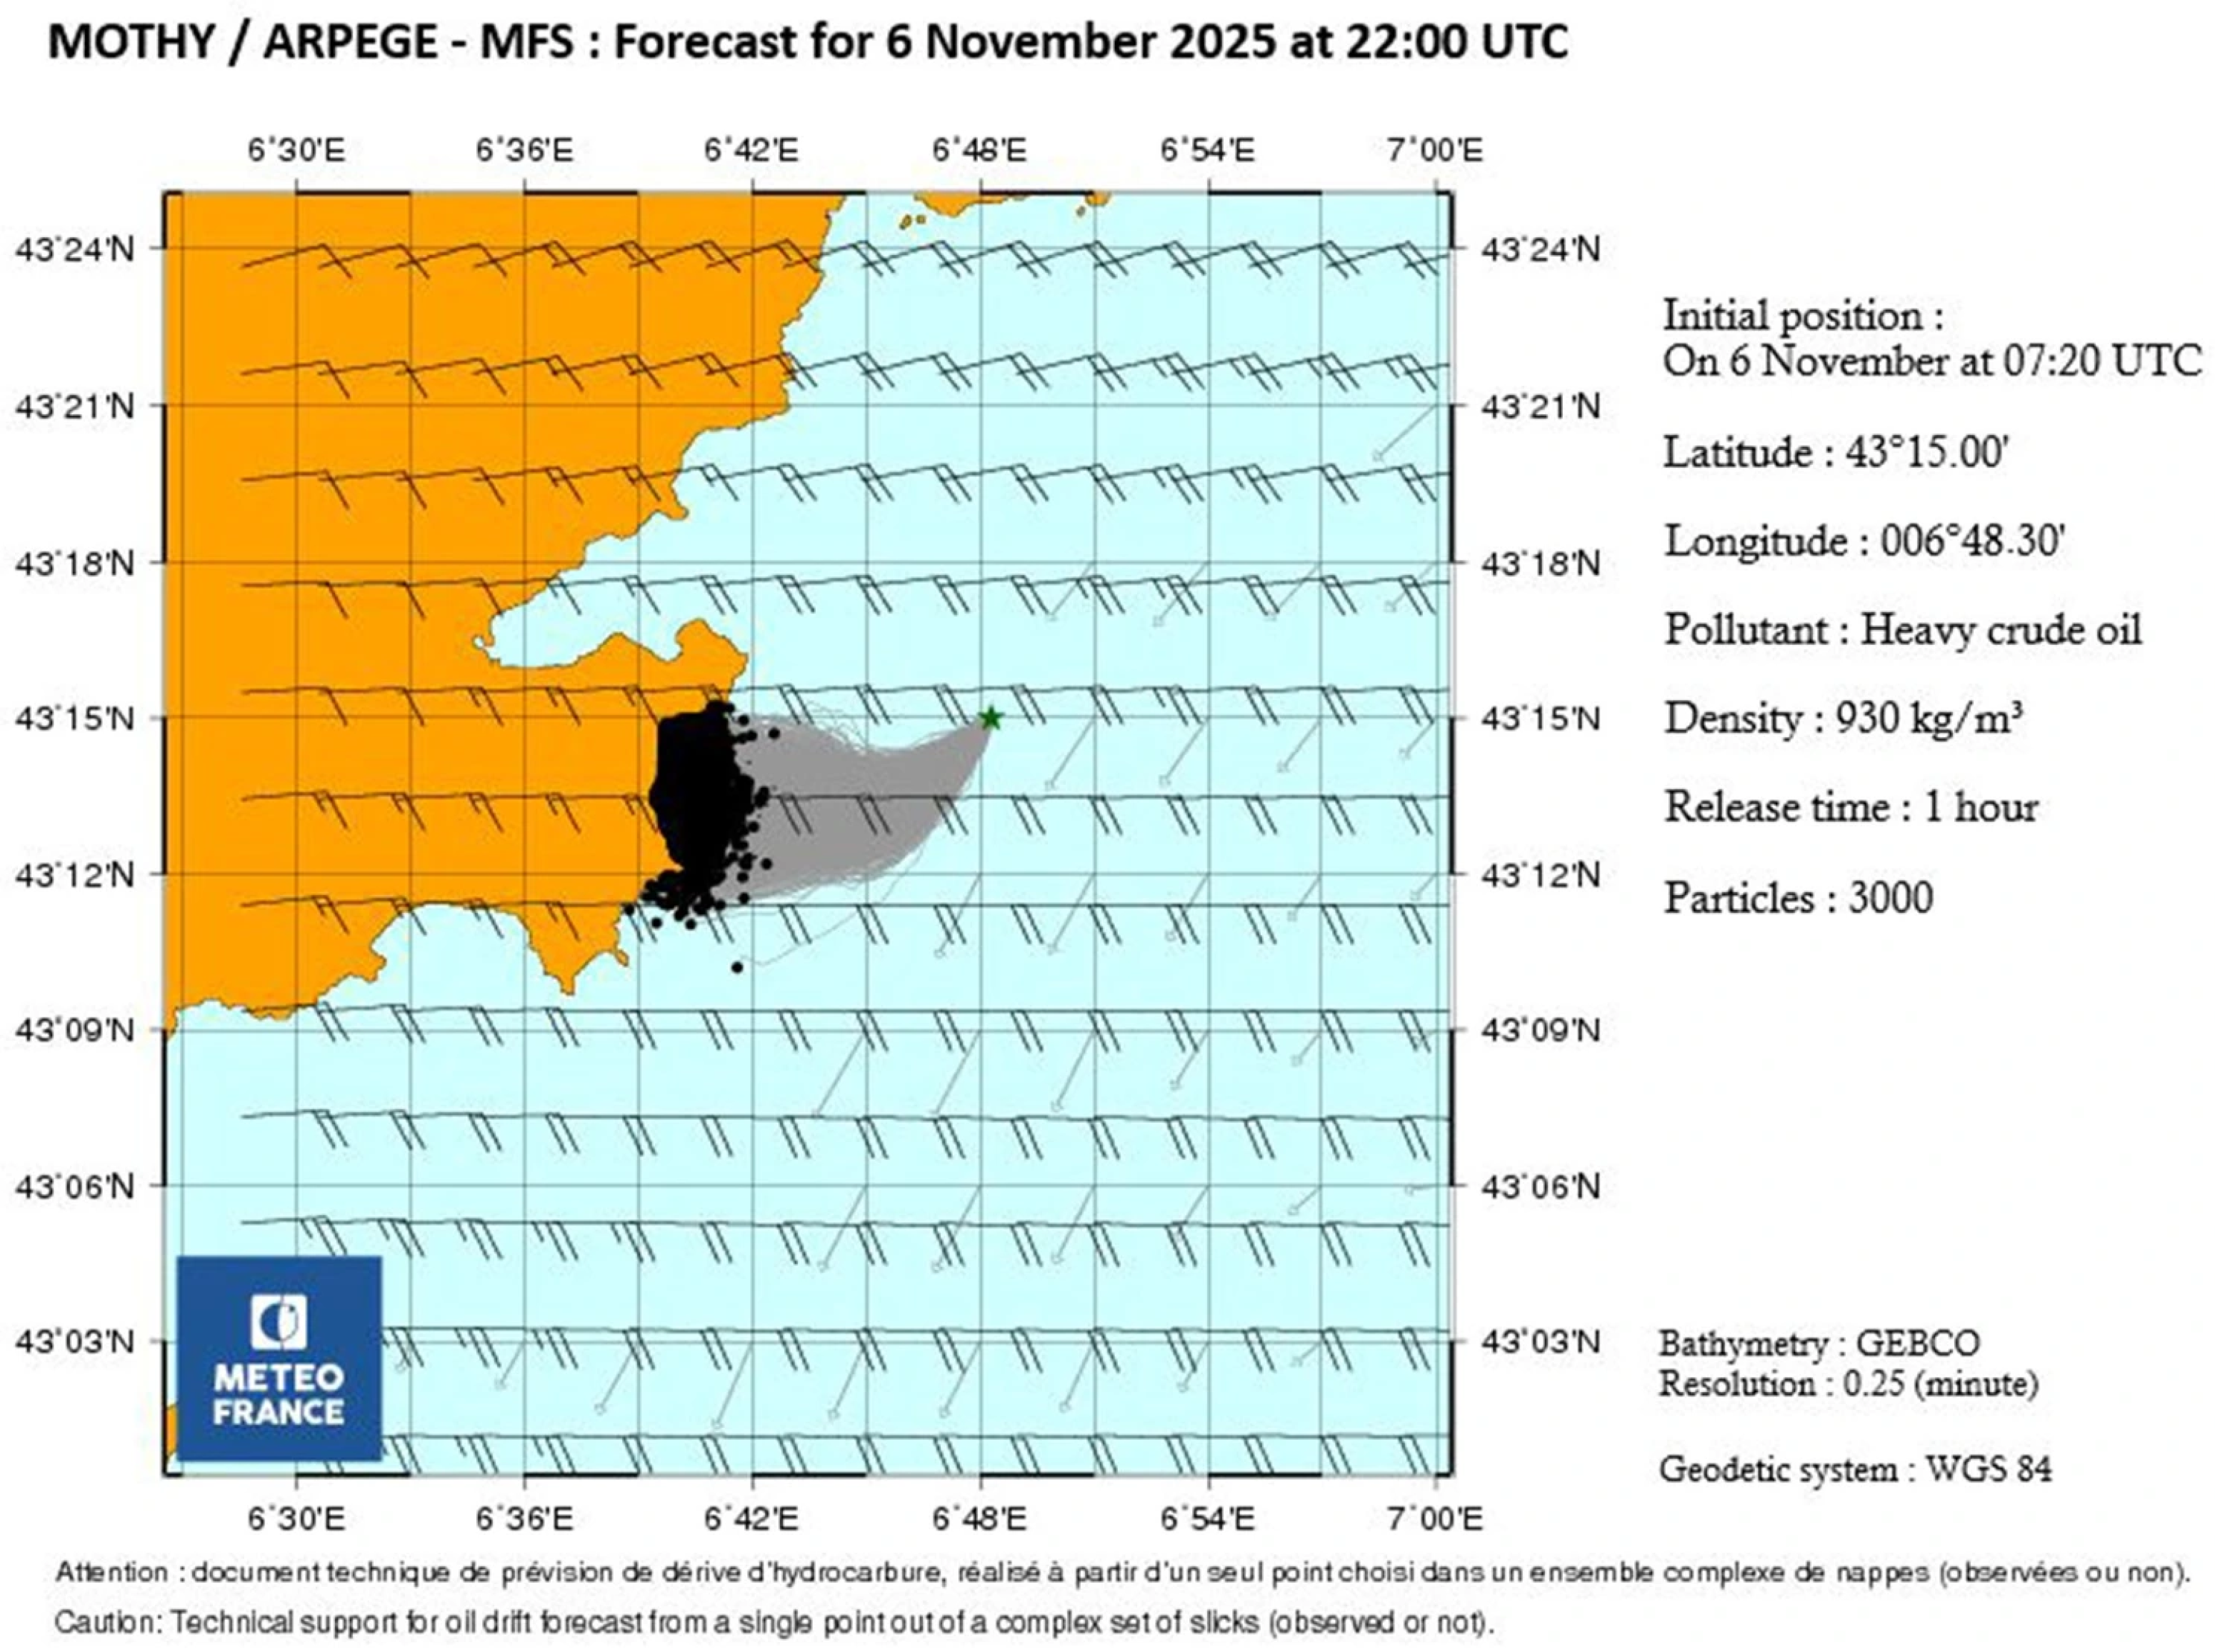
In the ORSEC scenario, the hypothetical spill location, which differed from those in the CODER scenarios (A and B), was not located in the Northern Current, and the drift pattern was more similar to that of the coastal scenario (B). As MOTHY produced better results for this scenario, this model was selected, using the CMEMS MEDSEA currents. As the simulations carried out using the AROME and ARPEGE wind data for the ORSEC scenario were very similar, the ARPEGE model was chosen because, according to Météo-France forecasters, it offered greater reliability on that particular day. An initial report was subsequently drafted and submitted to the maritime authorities at 11:30 UTC, highlighting the fact that the pollution was very likely to reach the coast within 11 h of the simulated incident (
Figure 9).
On the afternoon of 6 November, the Drift Committee resumed work on the two scenarios developed specifically for the CODER exercise. When the updated 6 h forecasts from the AROME and ARPEGE wind models became available, Météo-France ran new MOTHY simulations. A revised scenario was then established based on the position of the buoys deployed in the Northern Current at 13:00 UTC, allowing for model recalibration. A second report was subsequently drafted and submitted to the maritime authorities.
Figure 6.
Buoy trajectories (CLS buoys in yellow dots; CEDRE buoys in red and green dots) until 11:30 UTC on 6 November 2025 and simulation results nearest to the buoys at this time. Scenario A: OILMAP using ARPEGE winds and CMEMS MEDSEA currents; Scenario B: MOTHY using AROME winds and CMEMS MEDSEA currents. Sources: ©CEDRE; ©Business Geografic–Ciril GROUP.
Figure 6.
Buoy trajectories (CLS buoys in yellow dots; CEDRE buoys in red and green dots) until 11:30 UTC on 6 November 2025 and simulation results nearest to the buoys at this time. Scenario A: OILMAP using ARPEGE winds and CMEMS MEDSEA currents; Scenario B: MOTHY using AROME winds and CMEMS MEDSEA currents. Sources: ©CEDRE; ©Business Geografic–Ciril GROUP.
Figure 7.
Evolution over time of the distance between simulated drift trajectories and observed buoy drift (a) and standard deviation of the distance between the modeled points and the center of mass (b) for scenario A (Northern Current)-RAMOGEPOL 2025 Exercise.
Figure 7.
Evolution over time of the distance between simulated drift trajectories and observed buoy drift (a) and standard deviation of the distance between the modeled points and the center of mass (b) for scenario A (Northern Current)-RAMOGEPOL 2025 Exercise.
Figure 8.
Evolution over time of the distance between simulated drift trajectories and observed buoy drift (a) and standard deviation of the distance between the modeled points and the center of mass (b) for scenario B (coastal currents)-RAMOGEPOL 2025 Exercise.
Figure 8.
Evolution over time of the distance between simulated drift trajectories and observed buoy drift (a) and standard deviation of the distance between the modeled points and the center of mass (b) for scenario B (coastal currents)-RAMOGEPOL 2025 Exercise.
Figure 9.
MOTHY simulation results driven by CMEMS MEDSEA and ARPEGE forecasts, based on the incident location in the ORSEC scenario–RAMOGEPOL 2025 exercise.
Figure 9.
MOTHY simulation results driven by CMEMS MEDSEA and ARPEGE forecasts, based on the incident location in the ORSEC scenario–RAMOGEPOL 2025 exercise.
3.2.3. A Posteriori CODER Meeting
On 17 November 2025, 11 days after the RAMOGEPOL 2025 exercise, the Drift Committee reconvened to compare the drift simulation results with the actual buoy trajectories. The buoys for coastal scenario (B) arrived during the night of 6 to 7 November, as predicted by the models. CODER therefore did not carry out any further analyses for this scenario. For scenario A, over a 48 h period, the models selected by the Drift Committee yielded results that closely matched the observed drift for both sets of buoys (
Figure 10). Given the proximity of the two simulation points (~15 km/~8 nautical miles), the spatial resolution of the models (e.g., ~4.6 km/~2.5 nautical miles for CMEMS MEDSEA), and the presence of finer-scale, weaker coastal currents, it was not certain that the drift models would perform well. However, they ultimately proved satisfactory.
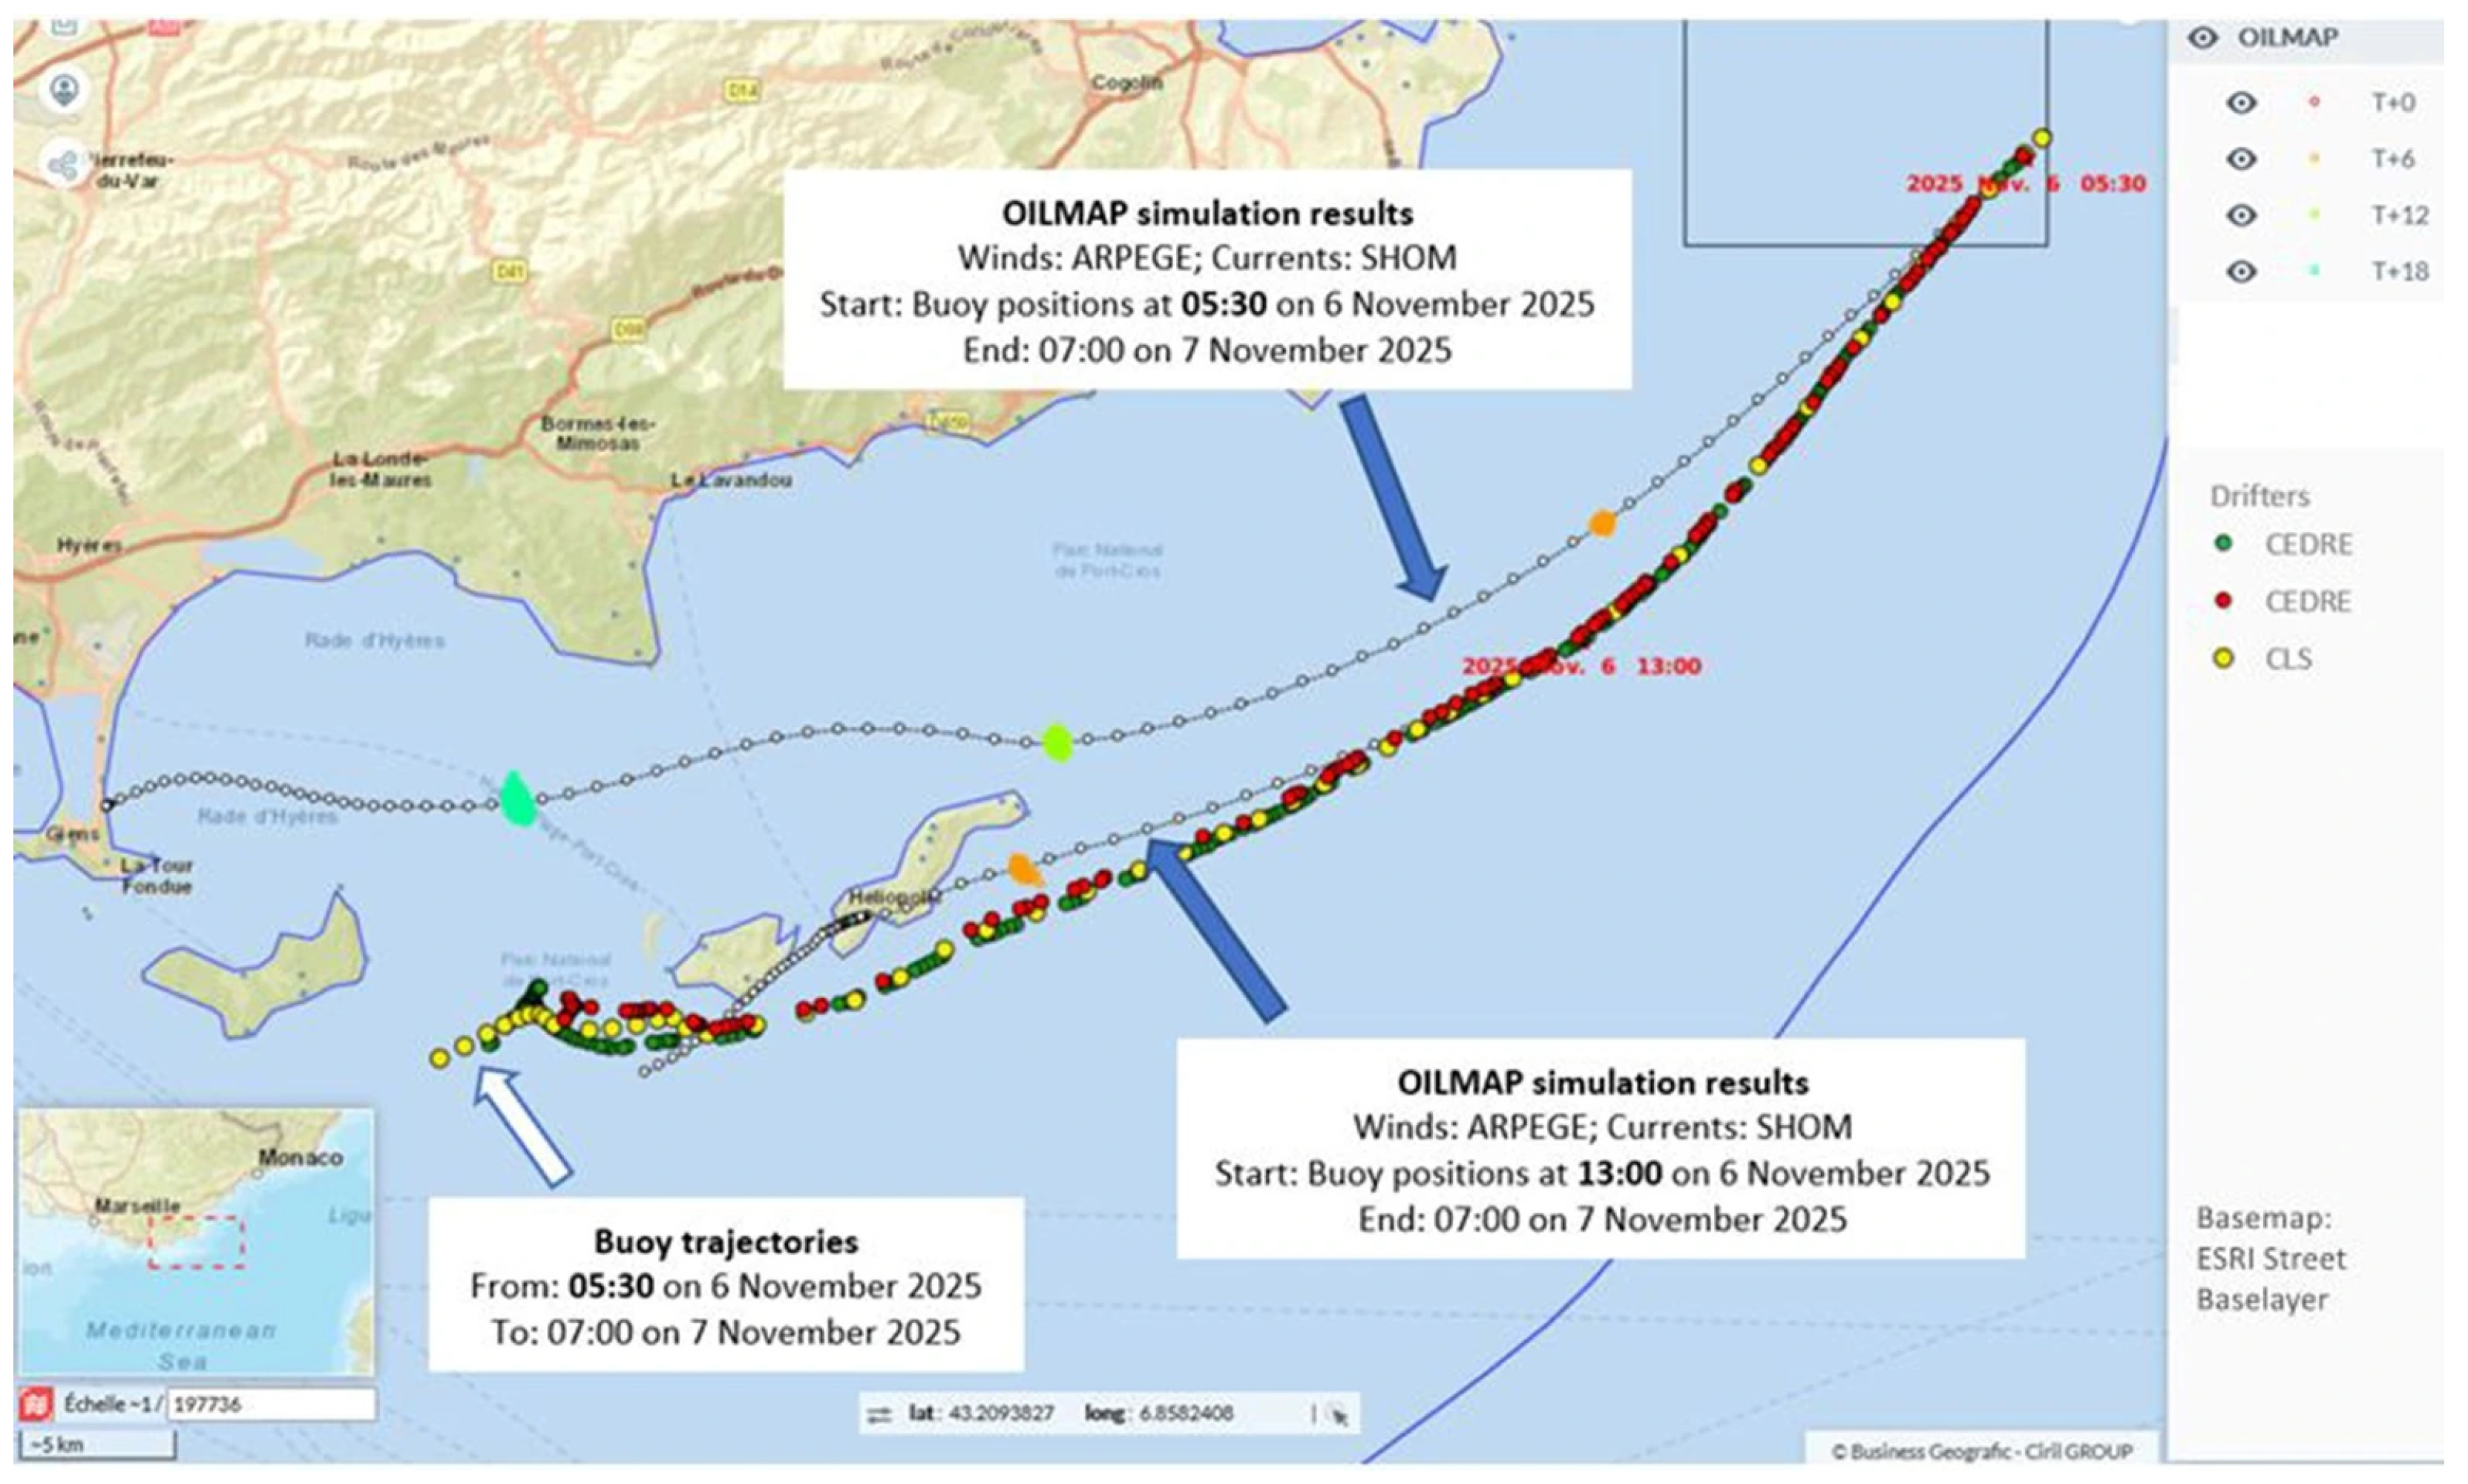
During this post-exercise analysis, CODER also evaluated the effectiveness of the model recalibration performed for the Northern Current scenario, using buoy positions at 13:00 UTC on 6 November (T + 8 h). The recalibrated drift simulation, notably for OILMAP with Shom currents, corresponded more closely to the observed buoy trajectories, highlighting the critical role of pollution observation data in improving model accuracy (On 6 November at 20:00 UTC, T + 15 h, 4 km from the buoys according to the recalibrated drift simulation, compared with 10 km according to the initial simulation,
Figure 11).
Generally speaking, CODER’s experience has shown the importance of counteracting the decline in simulation accuracy over time by recalibrating the models, if possible, at least every 24 h. Certain specific circumstances, such as the presence of a vortex or proximity to the coast, even require more frequent recalibrations.
CODER conducted additional tests during this post-evaluation exercise. For instance, rather than initializing simulations from a single point, representing the buoys’ location, the committee opted to model drifts from a linear source. This approach reflects operational reality: as it drifts at sea, an oil slick will disperse and spread rather than remaining concentrated at a single point. The simulations initiated from this line produced slightly different trajectories, with the slick drifting further north than in point-source simulations. This adjustment underscored the importance of realistic initial conditions in drift modeling, especially when recalibrating models based on observed buoy positions. The updated simulations thus provided a more accurate representation of potential slick drift, reinforcing the value of pollution observation data, whether from aircraft or satellites, for initiating simulations with physically plausible conditions.
More generally, this exercise highlighted many of the challenges faced by the Drift Committee and how it addressed them. First and foremost, CODER successfully met its ultimate goal of providing the maritime authorities with a forecast, analysis and recommendation report that was as accurate as possible within the shortest possible timeframe.
4. Discussion and Inputs from CODER
The simulation of oil slick trajectories remains a complex and challenging task, as it depends on a wide range of factors, including the characteristics of the pollutant, the accuracy of metocean condition forecasts, and the configuration of drift models. Conducting these exercises annually enables the progressive accumulation of operational experience and contributes to the improvement of the CODER’s response capacity in the case of a real pollution incident. These exercises are therefore essential, although they present both advantages and limitations, which are presented below.
Although metocean models are continuously improving in terms of spatial resolution, significant limitations remain, particularly for hydrodynamic models when incidents occur in very nearshore environments [
36]. The operational models commonly used are generally at global or regional scales, designed with a multi-kilometer-scale resolution to reproduce large-scale to mesoscale circulation. As a result, they are not necessarily adapted to highly coastal environments, where hydrodynamic processes are often more complex (e.g., high frequency, small scale). Consequently, modeled hydrodynamics in these areas may not always be realistic. Thus, in very coastal environments, as in the case of Scenario B in the RAMOGEPOL 2025 exercise, drift simulations must be interpreted with caution, especially under weak wind conditions when local unresolved hydrodynamic processes may have a dominating effect on the buoys. Conversely, when winds get stronger, the drift dynamics tend to be increasingly controlled by wind-driven transport, leading to more realistic and robust simulation results.
In addition, the resolution of many operational current models remains insufficient for detailed shoreline geometry. Small islands and coastal structures may therefore be absent from the computational grid in the immediate vicinity of the coast. These limitations can significantly affect the reliability of drift predictions in coastal areas.
The multiplication of operational exercises conducted under different real-world conditions enables a more effective selection of the appropriate drift models and a more accurate configuration of these models. Among the difficulties encountered, the committee noted that some drift models gave inaccurate forecasts in low wind conditions. After several tests, it appeared that it was sometimes possible to improve the results obtained with MOTHY by using Copernicus currents instead of those calculated automatically by the model. This is not a rule that applies in all circumstances or in all locations, but it is important for the Drift Committee to be aware of it. With regard to OILMAP, an improvement in modeling in low winds was observed by reducing the wind drift factor, an element determining the proportion of wind’s effect on oil particles.
Another observation made by the committee during these exercises was the difficulty in making correct predictions in the presence of current eddies. Faced with this highly localized phenomenon, it may be tempting to choose a current model with the best possible spatial resolution. However, experiments have shown that this is not necessarily what will give the best results. In fact, even a slight temporal or spatial shift between the actual position of the oil slick and the modeled position will cause an error in the rest of the simulation. A current model with lower spatial resolution, however, even if it does not provide information about these eddies, will not be affected by this discrepancy and may ultimately forecast a drift closer to reality in the longer term. Again, this is not a systematic rule but a point to be aware of. In any case, it highlights the limitations of drift models and the importance of recalibrating them based on visual observation or, failing that, the position of buoys.
The use of buoys during exercises remains highly valuable: they provide a practical and environmentally safe way to simulate pollution events and to test the operational methods employed. Moreover, in the event of a real oil spill, such devices could potentially be deployed directly within the slick in order to improve tracking of the pollution. This approach has been adopted during past major incidents such as the Grande America oil spill. Real-time buoy trajectories could then be used to regularly recalibrate drift simulations and refine the recommendations provided by the CODER to maritime authorities. Nevertheless, the drifting buoys do not behave exactly like floating oils and therefore cannot perfectly reproduce the dynamics of an actual oil spill. The wind effect sometimes seems to be overestimated with buoys. The wind acts not only through wind-driven currents but also directly on the buoy itself since part of it is above the sea surface. The use of drifting buoys to simulate the transport of oil slicks could therefore be seen as a limitation. Each type of buoy behaves in a different way at sea, mainly depending on their design. It has to be taken into account during results analysis and comparison with simulation outputs. In order to decrease the influence of direct wind to the buoy, CEDRE designed it to be 75% submerged.
The value of the Drift Committee’s analyses can also be used to validate or invalidate an improvement proposed by model developers. Thus, when Météo-France chose, in equatorial and certain tropical areas, to take into account currents in the first 100 m below the surface instead of those at the base of the Ekman layer, the French Guiana 2021 experiment validated this decision by confirming the accuracy of MOTHY’s modeling results.
The comparison of results from multiple oil drift models provides more reliable and comprehensive spill trajectories as well as better fate simulations. By comparing the outputs of different models, CODER can either validate and reinforce the consistency of the findings or identify discrepancies that may point to overlooked factors. This comparative analysis benefits from the expertise of international partners, who can contribute unique methodologies, regional knowledge, or access to localized data. For example, wind and current datasets used in various models can sometimes incorporate finer-scale, local phenomena that might not show up in initial simulations. Such a multi-model approach not only improves confidence in the results but also enhances the understanding of potential spill behaviors under diverse environmental conditions. Ultimately, this process ensures more informed decision-making, improves response strategies, and fosters collaboration across borders, leading to more effective and adaptive oil spill management.
This achievement was made possible by the increasingly smooth communication and mutual understanding developed over the course of the exercises, both among committee members and with external partners. Although the committee did not engage modelers from other countries during this exercise, maintaining these international links remains essential for a more effective response in the event of a real incident.
Moreover, the committee’s improved understanding of drift and metocean models allowed for much faster analysis than would have been possible if research had needed to be conducted during the meeting. The enhancements to the CEDRE mapping platform also played a role, once again proving their effectiveness. The platform enabled the rapid integration of modeling results and buoy positions (within minutes) and offered high-quality visualization tools that greatly facilitated comparison and analysis.
5. Conclusions
The French Drift Committee (CODER) represents a paradigm shift in marine pollution response, demonstrating how a structured, multi-agency collaboration can transform the challenges of oil drift modeling into actionable crisis management strategies. Since its inception during the Prestige spill (2002) and formalization in 2006, CODER has evolved from an ad hoc crisis response unit into a permanent, exercise-tested framework that systematically refines drift predictions through collaborative analysis, high-resolution data integration, and real-time recalibration. The RAMOGEPOL 2025 exercise off Saint-Tropez, France, exemplifies this progress, illustrating how annual simulations, combining drifting buoys, multi-model forecasting (MOTHY/OILMAP), and regional hydrodynamic data (e.g., CMEMS MEDSEA currents, AROME winds), can reduce prediction uncertainties and enhance operational coordination.
Three key advancements emerge from CODER’s two decades of exercises and real-world applications. First, the committee has refined drift modeling techniques by adopting realistic initial conditions, such as modeling oil slicks as linear or polygon sources rather than point sources (as validated during RAMOGEPOL 2025), and by systematically recalibrating models using observational data from buoys, satellites, and aerial surveys. This approach, first tested during the Grande America incident (2019) and later confirmed during the French Guiana 2021 exercise, improved the alignment of predicted trajectories with field observations, particularly in complex coastal environments where wind-driven currents and eddies are dominant. Second, CODER has deepened the understanding of local hydrodynamics by leveraging regional models (e.g., Ifremer’s MARS-3D, Shom’s HYCOM) to capture fine-scale phenomena often missed by global systems. For instance, the Northern Current interactions studied during RAMOGEPOL 2025 revealed how spatial resolution trade-offs in current models can affect long-term drift predictions, a lesson now integrated into CODER’s standardized recalibration protocols. Third, the committee has strengthened inter-agency coordination through tools like CEDRE’s mapping platform, which enables real-time visualization of model-buoy comparisons and reduces decision-making delays.
Beyond France, CODER’s framework offers a scalable model for regions facing similar hydrodynamic complexities. The committee’s multi-model cross-validation approach, combined with systematic post-exercise analyses, provides a blueprint for improving oil spill response worldwide. Ultimately, CODER’s experience demonstrates that combining scientific rigor, operational agility, and collaborative governance can significantly improve marine pollution response, ensuring that lessons from past incidents, such as the Prestige or Grande America, and from RAMOGEPOL exercises, translate into more effective and adaptive strategies for future spills.
Author Contributions
Conceptualization, S.M. and V.G.; methodology, S.M. and V.G.; software, S.M., V.G., E.D. and C.N.; validation, S.M., V.G., E.D., C.N., Y.F. and J.-F.L.R.; formal analysis, S.M., V.G., E.D., C.N., Y.F. and J.-F.L.R.; investigation, S.M., V.G., E.D., C.N., Y.F. and J.-F.L.R.; resources, S.M. and V.G.; data curation, S.M. and V.G.; writing—original draft preparation, S.M.; writing—review and editing, S.M., V.G., E.D., Y.F., J.-F.L.R., M.M., G.D., S.L. and V.U.; visualization, S.M.; supervision, S.M.; project administration, S.M. All authors have read and agreed to the published version of the manuscript.
Funding
This research received funding from French Navy/Cedre Contract No. 2025.1050015534.
Data Availability Statement
Ocean current data are available from the Copernicus Marine Service.
Conflicts of Interest
This study received funding from CEPPOL. Co-authors Gauthier Dupire and Morgane Mignot are CEPPOL staff, and they enabled operations at sea to be carried out. The funding sponsors had no role in the design of the study; in the collection, analyses, or interpretation of data; in the writing of the manuscript; or in the decision to publish the results.
References
- Keramea, P.; Spanoudaki, K.; Zodiatis, G.; Gikas, G.; Sylaios, G. Oil Spill Modeling: A Critical Review on Current Trends, Perspectives, and Challenges. J. Mar. Sci. Eng. 2021, 9, 181. [Google Scholar] [CrossRef] [Scilit]
- Keramea, P.; Kokkos, N.; Zodiatis, G.; Sylaios, G. Modes of Operation and Forcing in Oil Spill Modeling: State-of-Art, Deficiencies and Challenges. J. Mar. Sci. Eng. 2023, 11, 1165. [Google Scholar] [CrossRef] [Scilit]
- Paluszkiewicz, T.; Marshall, C.-F. Comparison of techniques for forcing an oil spill trajectory model. Int. Oil Spill Conf. Proc. 1989, 1, 547–553. [Google Scholar] [CrossRef] [Scilit]
- Skancke, J.; Nepstad, R.; Kotzakoulakis, K. Modelling Oil Thickness in Lagrangian Oil Spill Models: Consequences for Natural Entrainment by Breaking Waves. Int. Oil Spill Conf. Proc. 2024, 1, 231. [Google Scholar]
- Dandin, P.; Daniel, P.; Josse, P. Suivi des nappes en fonction des paramètres météorologiques et océanographiques. In Les Conséquences Du Naufrage de L’Erika: Risques, Environnement, Société, Réhabilitation; Presses Universitaires de Rennes: Rennes, France, 2005; pp. 25–33. Available online: http://www.meteorologie.eu.org/mothy/references/erika.pdf (accessed on 31 March 2026).
- Daniel, P. Operational forecasting of oil spill drift at Météo-France. Spill Sci. Technol. Bull. 1996, 3, 53–64. [Google Scholar] [CrossRef] [Scilit]
- Daniel, P.; Josse, P.; Dandin, P.; Gouriou, V.; Marchand, M.; Tiercelin, C. Forecasting the Erika Oil Spills. Int. Oil Spill Conf. Proc. 2001, 1, 649–655. [Google Scholar] [CrossRef] [Scilit]
- Daniel, P.; Josse, P.; Dandin, P.; Lefevre, J.-M.; Cabioc’h, F.; Gouriou, V. Forecasting the Prestige Oil Spills. In Proceedings of the Paper Presented at Interspill 2004 Conference, Trondheim, Norway, 14–17 June 2004; Available online: http://www.meteorologie.eu.org/mothy/references/Interspill_2004.pdf (accessed on 31 March 2026).
- Cabioc’h, F.; NedellecCommander; LambertCommissaire. ERIKA vs PRESTIGE: Two similar accidents, two different responses. The French case. In Proceedings of the International Oil Spill Conference 2005, Miami Beach, FL, USA, 15–19 May 2005; Volume 2025, pp. 1055–1061. [Google Scholar] [CrossRef] [Scilit]
- Centre de Documentation de Recherche et d’Experimentations sur les Pollutions Accidentelles Des Eaux (CEDRE). 20 years on: The sinking of the prestige. In Cedre Information Bulletin; n°43; Centre de Documentation de Recherche et d’Expérimentations sur les Pollutions Accidentelles des Eaux (CEDRE): Brest, France, 2022; Available online: https://doc.cedre.fr/index.php?lvl=notice_display&id=12543 (accessed on 31 March 2026).
- Instruction du 11 Janvier 2006 Portant Adaptation de la Réglementation Relative à la Lutte Contre la Pollution du Milieu Marin (POLMAR), JORF n°11 du 13 Janvier 2006 (PRMX0609020J). Available online: https://www.legifrance.gouv.fr/eli/instruction/2006/1/11/PRMX0609020J/jo/texte (accessed on 31 March 2026).
- Centre de Documentation de Recherche et d’Experimentations sur les Pollutions Accidentelles des Eaux (CEDRE). Aquatic Litter. CEDRE Information Bulletin, N°40, November 2020; Centre de Documentation de recherche et d’Expérimentations sur les pollutions accidentelles des eaux (CEDRE): Brest, France, 2020; Available online: https://doc.cedre.fr/index.php?lvl=notice_display&id=12540 (accessed on 31 March 2026).
- Secrétaire général de la mer. Instruction Relative à la Lutte Contre la Pollution du Milieu Marin. Acte juridique PRMX2227260C. 2022. Available online: https://www.legifrance.gouv.fr/circulaire/id/45367 (accessed on 31 March 2026).
- Spaulding, M.L.; Howlett, E.; Anderson, E.; Jayko, K. OILMAP: A Global Approach to Spill Modeling. In Proceedings of the Fifteenth Arctic and Marine Oilspill Program Technical Seminar, Edmonton, AB, Canada, 10–12 June 1992; pp. 15–21. Available online: https://inis.iaea.org/records/4nx66-yx597 (accessed on 31 March 2026).
- Daniel, P. Prévisions de dérives en mer avec Mothy. La Météorologie 2025, 130, 29–38. [Google Scholar] [CrossRef] [Scilit]
- CEDRE. Etude Comparative des Modèles de Prévision de Dérive et de Comportement des Polluants Hydrocarbures en Mer. Rapport 2ème Année (R.20.40); Centre de Documentation de recherche et d’Expérimentations sur les Pollutions Accidentelles des Eaux (CEDRE): Brest, France, 2020. [Google Scholar]
- MacFadyen, A.; Barker, C.H. NOAA’s Response Modeling—Challenges and Innovations. Int. Oil Spill Conf. Proc. 2024, 1, 318. [Google Scholar]
- Dulière, V.; Ovidio, F.; Legrand, S. Development of an Integrated Software for Forecasting the Impacts of Accidental Oil Pollution (OSERIT2013); Belgian Science Policy Office: Brussels, Belgium, 2013. [Google Scholar]
- Dagestad, K.-F.; Röhrs, J.; Breivik, Ø.; Ådlandsvik, B. OpenDrift v1.0: A Generic Framework for Trajectory Modelling. Geosci. Model Dev. 2018, 11, 1405–1420. [Google Scholar] [CrossRef] [Scilit]
- Trieschmann, O.; Bal, L.; Chintoan-Uta, M.; Djavidnia, S.; Hayes, A.M.; Journel, M.; Lourenco-Bento, P.; Pelizzari, S.; Price, M.; del Rio Vera, J. Identification of Oil Spills by Satellite. In Proceedings of the ESA Living Planet Symposium, Bergen, Norway, 28 June–2 July 2010; Volume 686, p. 257. Available online: https://ui.adsabs.harvard.edu/abs/2010ESASP.686E.257T (accessed on 31 March 2026).
- De Dominicis, M.; Bruciaferri, D.; Gerin, R.; Pinardi, N.; Poulain, P.M.; Garreau, P.; Zodiatis, G.; Perivoliotis, L.; Fazioli, L.; Sorgente, R.; et al. A multi-model assessment of the impact of currents, waves and wind in modelling surface drifters and oil spill. Deep Sea Res. Part II Top. Stud. Oceanogr. 2016, 133, 21–38. [Google Scholar] [CrossRef] [Scilit]
- Seity, Y.; Brousseau, P.; Malardel, S.; Hello, G.; Bénard, P.; Bouttier, F.; Lac, C.; Masson, V. The AROME-France convective-scale operational model. Mon. Weather Rev. 2011, 139, 976–991. [Google Scholar] [CrossRef] [Scilit]
- Bouyssel, F.; Janisková, M.; Bazile, E.; Bouteloup, Y.; Piriou, J.-M. L’évolution opérationnelle du modèle Arpège et de ses paramétrisations physiques. La Météorologie 2021, 112, 47–54. [Google Scholar] [CrossRef] [Scilit]
- Global Ocean Physics Analysis and Forecast. E.U. Copernicus Marine Service Information (CMEMS). Marine Data Store (MDS). Available online: https://data.marine.copernicus.eu/product/GLOBAL_ANALYSISFORECAST_PHY_001_024/description (accessed on 31 March 2026).
- Atlantic-Iberian Biscay Irish-Ocean Physics Analysis and Forecast. E.U. Copernicus Marine Service Information (CMEMS). Marine Data Store (MDS). Available online: https://data.marine.copernicus.eu/product/IBI_ANALYSISFORECAST_PHY_005_001/description (accessed on 31 March 2026).
- Mediterranean Sea Physics Analysis and Forecast. E.U. Copernicus Marine Service Information (CMEMS). Marine Data Store (MDS). Available online: https://data.marine.copernicus.eu/product/MEDSEA_ANALYSISFORECAST_PHY_006_013/description (accessed on 31 March 2026).
- Louazel, S.; Casitas, S.; Corréard, S.; Ferret, Y.; Quilfen, V.; Voineson, G. Shom operational regional ocean forecasting system. In Proceedings of the 9th EuroGOOS International Conference, Brest, France, Advances in Operational Oceanography: Expanding Europe’s Observing and Forecasting Capacity; Ifremer; EuroGOOS AISBL: Brest, France, 2021; pp. 216–222. Available online: https://hal.science/hal-03328371 (accessed on 31 March 2026).
- Lazure, P.; Dumas, F. An external–internal mode coupling for a 3D hydrodynamical model for applications at regional scale (MARS). Adv. Water Resour. 2008, 31, 233–250. [Google Scholar] [CrossRef] [Scilit]
- Girin, M. The Use of Drifting Buoys and Related Remote Sensing Tools in Operational Response to Oil and Other Spills at Sea. A Report Prepared for ENSIETA in the Frame of the Interegg Project MARINE (R.08.38.C); Centre de Documentation de Recherche et d’Expérimentations sur les Pollutions Accidentelles des Eaux (CEDRE): Brest, France, 2008; Available online: https://doc.cedre.fr/index.php?lvl=notice_display&id=2567 (accessed on 31 March 2026).
- Novelli, G.; Guigand, C.M.; Özgökmen, T.M. Technological Advances in Drifters for Oil Transport Studies. Mar. Technol. Soc. J. 2018, 52, 53–61. [Google Scholar] [CrossRef] [Scilit]
- Martin, S. Conception et Utilisation de Bouées de Dérive, Modélisation de Dérive En Mer (R.24.63.C).; Centre de Documentation de Recherche et d’Expérimentations sur les Pollutions Accidentelles des Eaux (CEDRE): Brest, France, 2024; Available online: https://doc.CEDRE.fr/index.php?lvl=notice_display&id=12195 (accessed on 31 March 2026).
- Martin, S. Conception et Utilisation de Bouées de Dérive, Modélisation de Dérive En Mer. Comparaison de Dérives de Bouées et de Modélisations À La Dérive de Nappes d’hydrocarbures. Exercice NOFO25 (Norvège) (R.25.62.C); Centre de Documentation de Recherche et d’Expérimentations sur les Pollutions Accidentelles des Eaux (CEDRE): Brest, France, 2025; Available online: https://doc.CEDRE.fr/index.php?lvl=notice_display&id=13178 (accessed on 31 March 2026).
- Millot, C. Circulation in the Western Mediterranean Sea. J. Mar. Syst. 1999, 20, 423–442. [Google Scholar] [CrossRef] [Scilit]
- Millot, C. Mesoscale and seasonal variabilities of the circulation in the western Mediterranean. Dyn. Atmos. Oceans 1991, 15, 179–214. [Google Scholar] [CrossRef] [Scilit]
- Gatti, J. Intrusions du Courant Nord sur la partie Est du Plateau Continental du Golfe du Lion. Ph.D. Thesis, Université Aix-Marseille, Marseille, France, 2 June 2008. [Google Scholar]
- Greenberg, D.A.; Dupont, F.; Lyard, F.H.; Lynch, D.R.; Werner, F.E. Resolution issues in numerical models of oceanic and coastal circulation. Cont. Shelf Res. 2007, 27, 1317–1343. [Google Scholar] [CrossRef] [Scilit]
| Disclaimer/Publisher’s Note: The statements, opinions and data contained in all publications are solely those of the individual author(s) and contributor(s) and not of MDPI and/or the editor(s). MDPI and/or the editor(s) disclaim responsibility for any injury to people or property resulting from any ideas, methods, instructions or products referred to in the content. |




 ,
,