1. Introduction
Wave-in-deck slamming is a critical impact-loading scenario that occurs when incident wave crests strike the underside of coastal bridges, offshore platforms, and other elevated marine structures. Similar challenges associated with complex hydrodynamic responses have also been reported for large marine structures subjected to harsh environmental loading conditions [
1]. Unlike quasi-static wave loading, deck slamming generates highly transient pressures with large spatial gradients, posing a considerable threat to structural safety and serviceability. As the incident wave crest approaches the deck underside, part of the air beneath the deck may become entrapped, forming transient air cavities that can substantially modify the subsequent impact process [
2,
3,
4].
Early theoretical and experimental studies primarily focused on the pressure characteristics of wave impacts on rigid decks, demonstrating that wave-in-deck slamming is strongly influenced by the incident wave scenarios and deck geometry [
5,
6,
7,
8]. With the development of high-speed visualization techniques, subsequent experiments revealed that air can become entrapped beneath the deck during wave impact, forming transient air cavities that evolve together with the surrounding water motion [
9,
10,
11,
12]. Further experimental and numerical investigations demonstrated that entrapped air can substantially modify the pressure response by reducing the initial pressure peak, generating post-impact pressure oscillations, and redistributing impact loads beneath the deck [
13,
14,
15,
16,
17,
18].
Despite these advances, the hydrodynamic mechanisms responsible for the observed pressure response remain incompletely understood. Most previous investigations have relied primarily on pressure measurements and high-speed visualizations, from which the underlying flow processes are inferred indirectly. Although numerical studies have provided valuable insight into the evolution of entrapped air cavities and the associated pressure-generation mechanisms [
19,
20,
21], direct experimental evidence linking pressure evolution with the corresponding air-cavity dynamics throughout the complete slamming process remains limited. In particular, the respective roles of the impact, oscillation, and suction stages in governing pressure generation have not yet been systematically quantified. Consequently, the physical relationship between liquid-phase flow, air-cavity evolution, and pressure response beneath the deck remains insufficiently understood.
To address these knowledge gaps, the present study experimentally investigates wave-in-deck slamming beneath a rigid horizontal deck under regular-wave scenarios. Pressure measurements and high-speed imaging are combined with Particle Image Velocimetry (PIV) and Bubble Image Velocimetry (BIV) techniques to investigate the evolution of pressure response, velocity, vorticity, turbulence intensity, and entrapped air-cavity dynamics throughout the slamming event. The effects of incident wave height and wave period on the magnitude and spatial distribution of peak impact pressures are first examined based on 35 regular-wave conditions. Subsequently, one representative slamming event is analyzed in detail to examine the stage-dependent evolution of the liquid-phase flow, free surface, and entrapped-air structures.
The present study provides direct experimental observations to clarify the relationship between air-cavity dynamics and the resulting pressure distributions during aerated wave-in-deck slamming. A representative slamming event is further resolved into impact, oscillation, and suction stages to enable a process-resolved interpretation of the associated hydrodynamic evolution and pressure response. Collectively, the present study improves the physical understanding of aerated wave-in-deck impacts and provides a valuable experimental dataset for the development and validation of numerical models of aerated wave-in-deck slamming.
The remainder of this paper is organized as follows.
Section 2 describes the experimental setup, optical measurement techniques, and test scenarios.
Section 3 presents the repeatability assessment of the pressure measurements together with the validation of the generated regular waves.
Section 4 presents the free-surface evolution, pressure responses associated with different air-entrapment scenarios, the influence of wave scenarios on peak impact pressures, and the stage-dependent flow characteristics during the impact, oscillation, and suction stages. Finally, the main conclusions are summarized in
Section 5.
2. Experimental Methodology
2.1. Experimental Setup
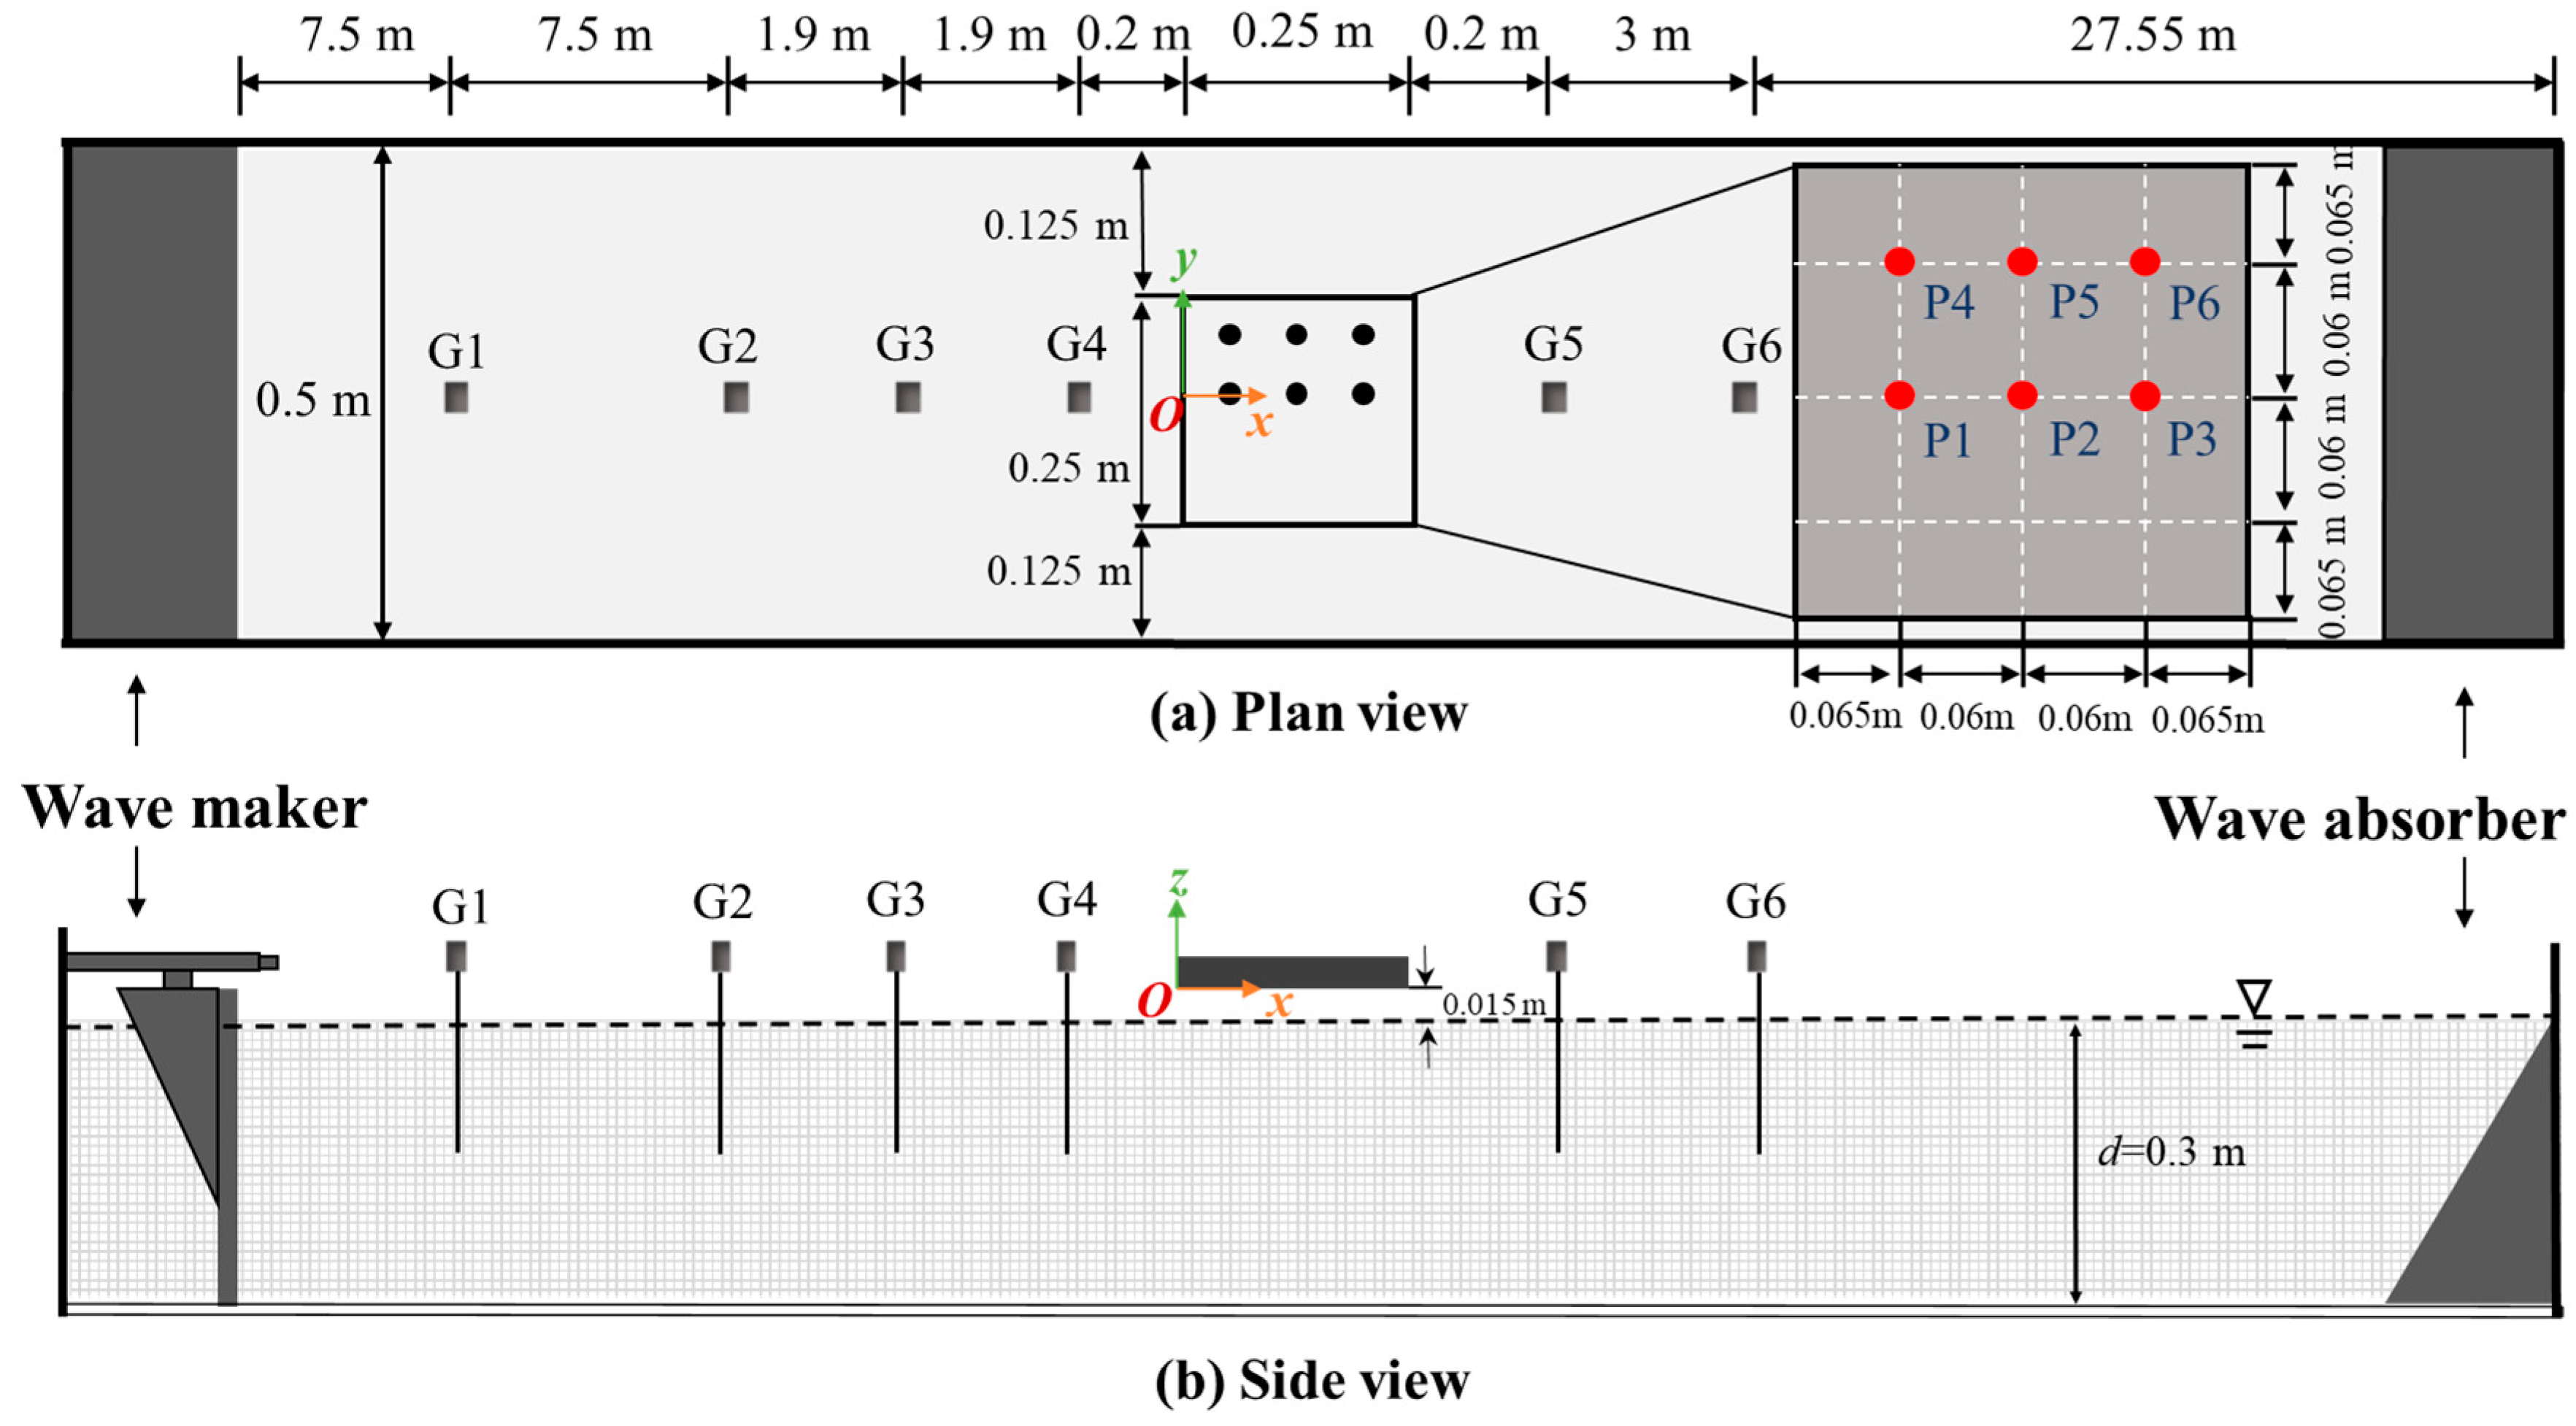
The experiments were carried out in a glass-walled wave flume at the Hydraulic Engineering Laboratory, Changsha University of Science and Technology. The flume is 50 m long, 0.5 m wide, and 0.8 m high, and is equipped with a piston-type wave maker at the upstream end and a wave-absorbing beach at the downstream end to minimize wave reflections. The overall experimental arrangement and instrumentation layout are illustrated in
Figure 1.
A simplified three-dimensional rigid horizontal deck model fabricated from transparent acrylic is installed at the center of the flume, with its leading edge located 19 m downstream of the wave maker. The model measures 0.25 m × 0.25 m × 0.01 m (length × width × thickness) and is mounted on a rigid steel supporting frame. The rigid-deck configuration enables the hydrodynamic response to be examined without the influence of structural deformation, which is not considered in the present study. The deck soffit is positioned 0.015 m above the still water level and firmly fixed throughout the experiments, thereby preventing vibration or displacement during wave impacts.
The experiments are designed according to Froude similarity with a geometric scale of 1:200, thereby preserving the dominant balance between inertia and gravity that governs the large-scale free-surface wave motion and global slamming response. Reynolds, Weber, and compressibility-related similarities associated with entrapped air are not fully preserved, and their possible influence should be considered when interpreting the laboratory-scale results and extrapolating them to prototype conditions, which is beyond the scope of present laboratory-scale study. A Cartesian coordinate system is established with the origin located at the leading edge of the deck underside, where the positive
x-,
y- and
z-axes denote the wave-propagation, transverse, and vertically upward directions, respectively (
Figure 1b).
The hydrodynamic response beneath the deck is monitored using wave-elevation, pressure, and optical measurements. Six resistance-type wave gauges (G1–G6) are installed along the flume to record free-surface elevations at a sampling frequency of 100 Hz. Six miniature pressure transducers (P1–P6) are flush-mounted along the deck underside to measure transient slamming pressures. Before the experiments, the pressure transducers are calibrated using the manufacturer-provided calibration coefficients. According to the manufacturer specifications, the dynamic response characteristics of the pressure transducers, including the response time and natural frequency, are suitable for transient pressure measurements. The pressure signals are acquired using an SQS1F data-acquisition system at a sampling frequency of 10 kHz, corresponding to a temporal resolution of 0.1 ms. The acquired signals are processed in MATLAB R2022a using a three-point moving-average filter to reduce high-frequency measurement noise while limiting distortion of the impact-pressure peaks. The same filtering procedure is applied to all test records, and a short averaging window is selected to limit distortion of the impact-pressure peaks. To minimize side-wall effects, the deck model is positioned symmetrically within the flume, leaving a clearance of 0.125 m between each deck edge and the corresponding side wall.
2.2. PIV and BIV Measurements
PIV and BIV are employed as complementary optical techniques because the flow beneath the deck alternates between a clear liquid phase and strongly aerated regions during wave-in-deck slamming. The two techniques require different illumination scenarios and are therefore conducted in separate experimental runs under identical incident-wave scenarios. PIV uses laser-sheet illumination to resolve the liquid-phase velocity field beneath the deck, whereas BIV employs backlight imaging to quantify the apparent flow within the aerated region. During each optical experiment, the pressure measurements are synchronized with the corresponding image acquisition.
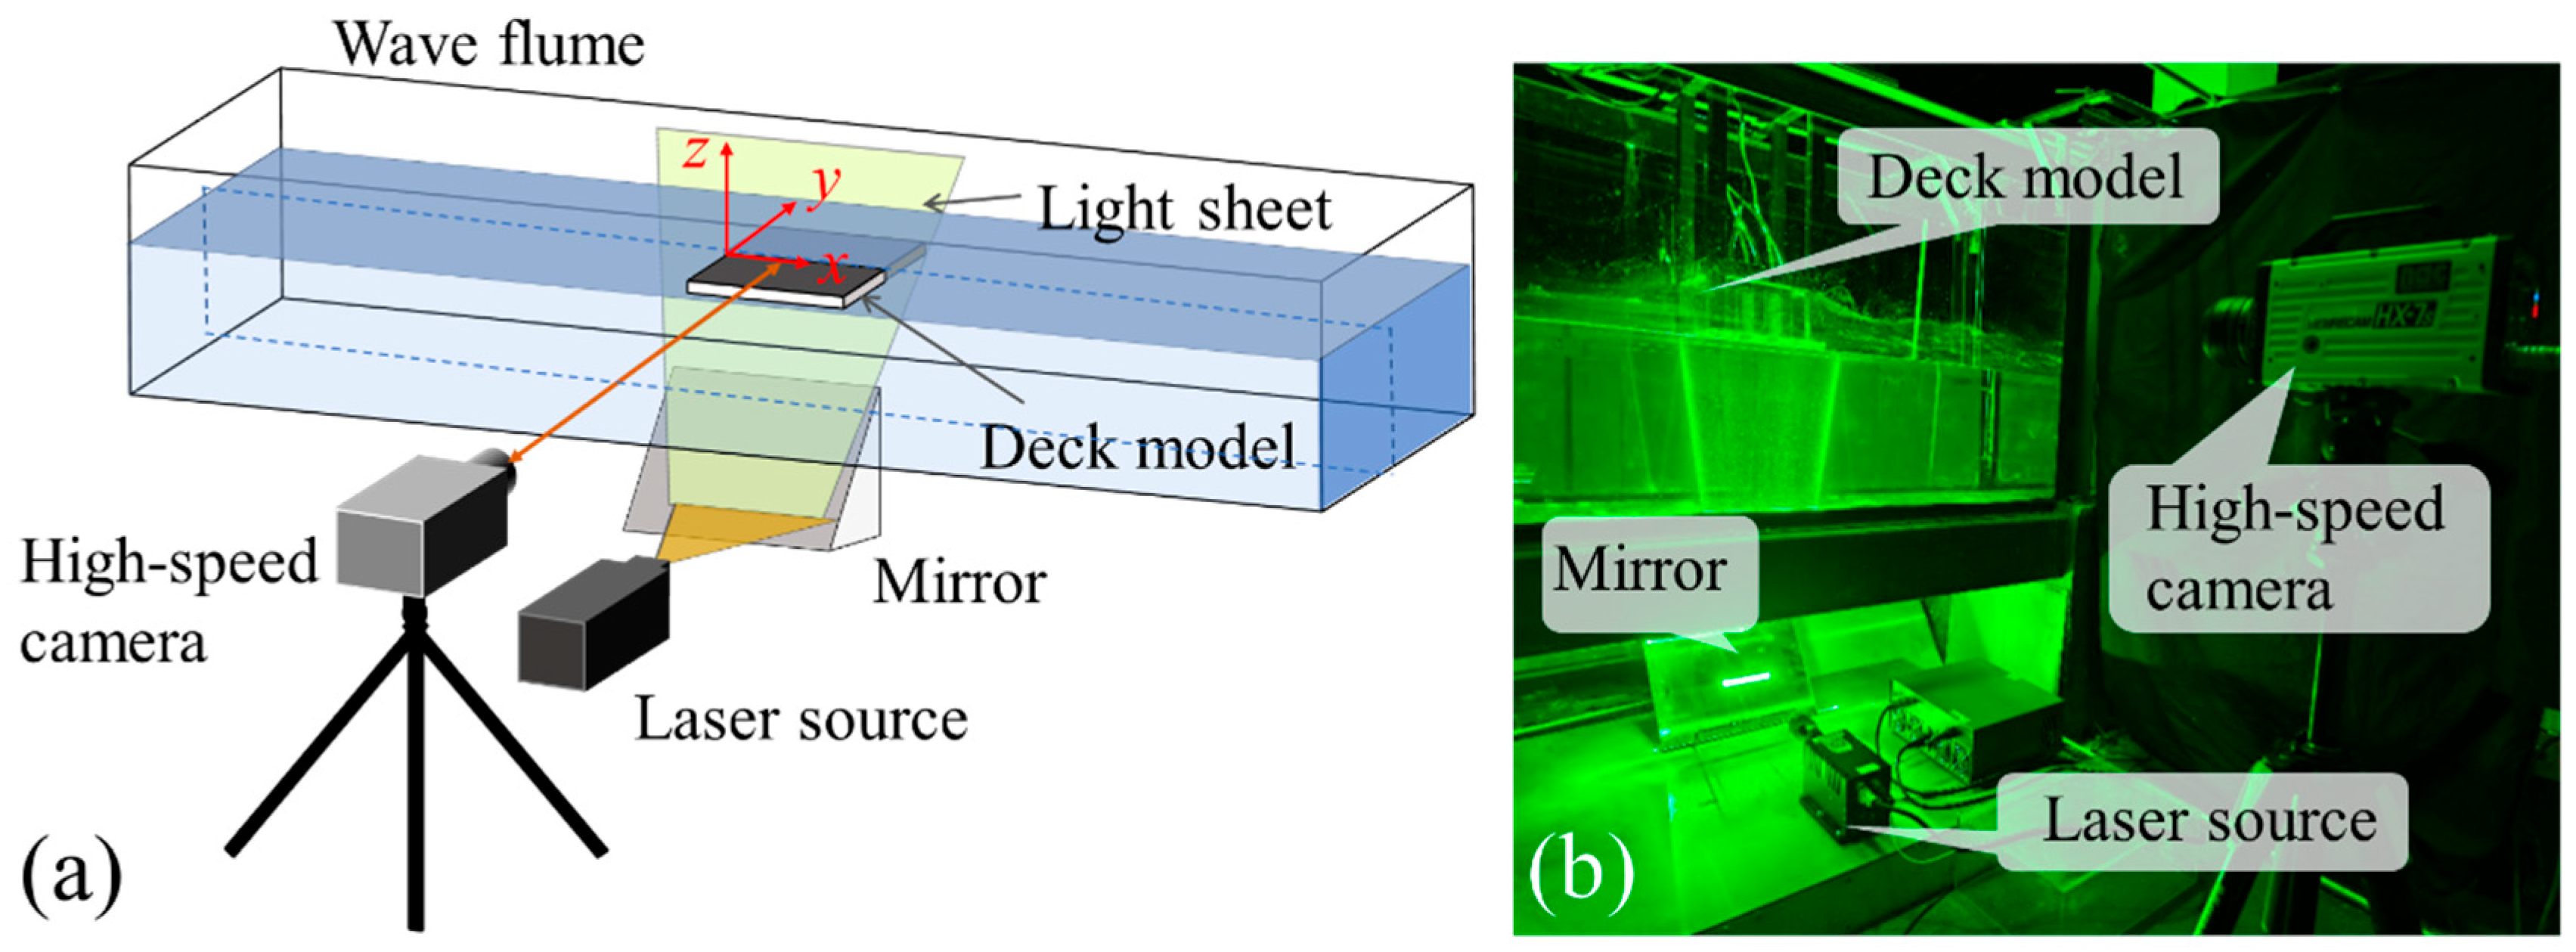
For the PIV measurements, a laser source and mirror system generate a vertical light sheet aligned with the measurement plane beneath the deck (
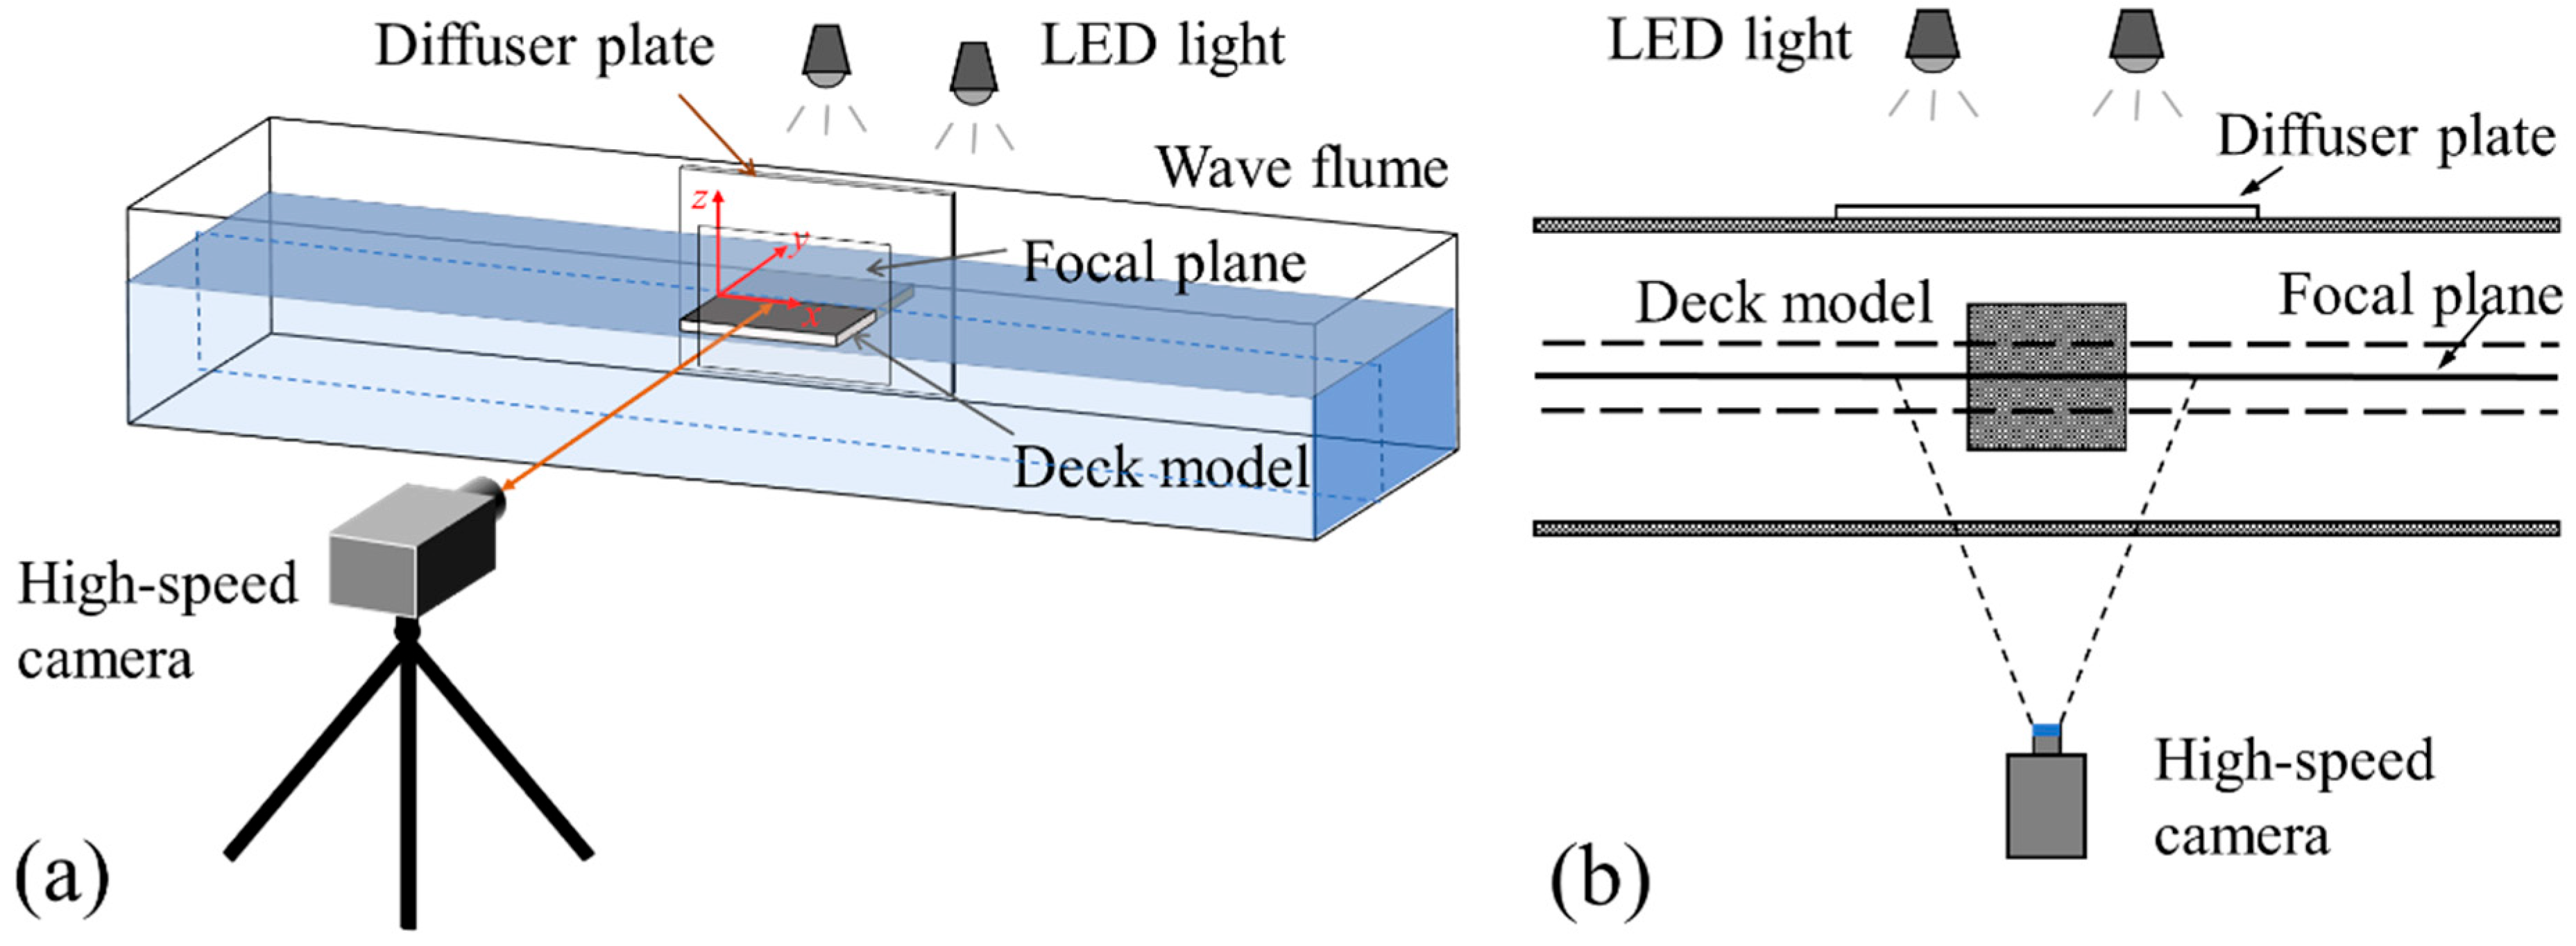
Figure 2). The flow is seeded with tracer particles, and their motion within the illuminated plane is recorded by a high-speed camera. For the BIV measurements, a high-speed shadowgraph arrangement is adopted (
Figure 3). LED lights and a PMMA diffuser plate are installed on the opposite side of the flume to provide uniform backlight illumination, allowing the camera to capture the motion of air-cavity boundaries, bubbles, and aerated interfaces within the focal plane beneath the deck. Both PIV and BIV measurements are performed using a MEMRECAM HX-7S high-speed camera, operated with HXLink Ver1.91, at a frame rate of 4000 fps, corresponding to a time interval of 0.25 ms between consecutive images. The PIV images are acquired at a resolution of 1280 × 720 pixels over a field of view of 0.30 × 0.1687 m
2, whereas the BIV images are acquired at 1280 × 1024 pixels over a field of view of 0.32 × 0.256 m
2. For the PIV measurements, 20 μm PSP tracer particles with a density of 1.03–1.05 g/cm
3 are used. A continuous 532 nm laser with a sheet thickness below 1 mm is employed to illuminate the measurement plane.
The camera is focused on a local field of view (FOV) beneath the deck to obtain sufficient spatial resolution for the PIV and BIV analyses. For the PIV measurements, the camera is positioned normal to the laser-sheet plane, with the field of view adjusted to cover the target region at sufficient spatial resolution. For the BIV measurements, the camera-to-focal-plane distance is set to 0.9 m based on the required field of view and depth-of-field range. The resulting depth of field is approximately 0.031 m, ensuring clear imaging of the target region beneath the deck. The image sequences are processed in PIVlab using an FFT-based cross-correlation algorithm. Three interrogation passes with window sizes of 16 × 16, 8 × 8, and 4 × 4 pixels are applied with 50% overlap. Spurious vectors are identified using prescribed global velocity limits and a local median filter. Invalid vectors are removed and replaced by interpolation from neighboring valid vectors. The resulting vector-grid spacings are approximately 0.47 × 0.47 mm
2 for PIV and 0.50 × 0.50 mm
2 for BIV. The instantaneous velocity is decomposed into mean and fluctuating components as
where
Ui and
u′
i denote the mean and fluctuating velocity components in the
i-th direction, respectively. Here,
Ui is obtained by averaging the velocity component over the selected image sequence. Based on the two measured in-plane velocity components, the planar velocity-fluctuation intensity
I is defined as
where
u′ and
w′ are the fluctuating velocity components in the streamwise and vertical directions, respectively. Because the PIV and BIV measurements are restricted to a two-dimensional plane,
I does not include the transverse velocity fluctuation and should therefore be interpreted as a planar indicator of flow-fluctuation intensity rather than a complete characterization of three-dimensional turbulence.
In the BIV analysis, the cross-correlation procedure tracks image patterns generated by bubbles, cavity boundaries, and aerated interfaces. Consequently, the BIV-derived vectors represent the apparent in-plane motion of aerated structures and do not necessarily correspond to the true liquid-phase velocity. They are therefore used primarily to characterize the motion and deformation of the aerated region. The velocity estimates may be affected by image-calibration uncertainty, displacement-detection error, finite interrogation-window size, out-of-plane motion, and reduced correlation quality in strongly aerated regions. Since the PIV and BIV measurements are conducted in separate experimental runs, the repeatability of the slamming process is verified through pressure measurements, as described in
Section 3.1.
2.3. Test Scenarios
A series of regular-wave experiments is conducted to investigate the effects of wave height and wave period on wave-in-deck slamming. Five incident wave heights (
H = 0.03, 0.04, 0.05, 0.06, and 0.07 m) and seven wave periods (
T = 0.99, 1.06, 1.13, 1.20, 1.27, 1.34, and 1.41 s) are considered, resulting in a total of 35 scenarios, as summarized in
Table 1. The still-water depth is maintained at 0.30 m throughout all experiments. Based on the adopted geometric scale, the model-scale wave heights and periods correspond to prototype wave heights of approximately 6–14 m and prototype wave periods of 14.0–19.9 s, respectively. These wave scenarios represent typical energetic sea states capable of producing wave-in-deck slamming.
Each test scenario is repeated at least three times. The repeatability of the generated slamming events is evaluated using pressure measurements synchronized with free-surface observations, as presented in
Section 3.1. Owing to the extensive optical datasets generated by the high-speed imaging system, one representative scenario (
H = 0.04 m and
T = 1.06 s), for which complete and high-quality optical records are obtained over the slamming event, is selected for detailed PIV and BIV analysis on the temporal and spatial evolution of the liquid-phase flow, free surface, and entrained-air structures in
Section 4.
3. Experimental Repeatability and Incident-Wave Validation
3.1. Repeatability of Slamming-Pressure Measurements
Repeatability is assessed to ensure that the PIV and BIV measurements, which are conducted in separate runs, are dynamically comparable. It is necessary because slamming pressures are sensitive to small variations in free-surface deformation and air entrapment.
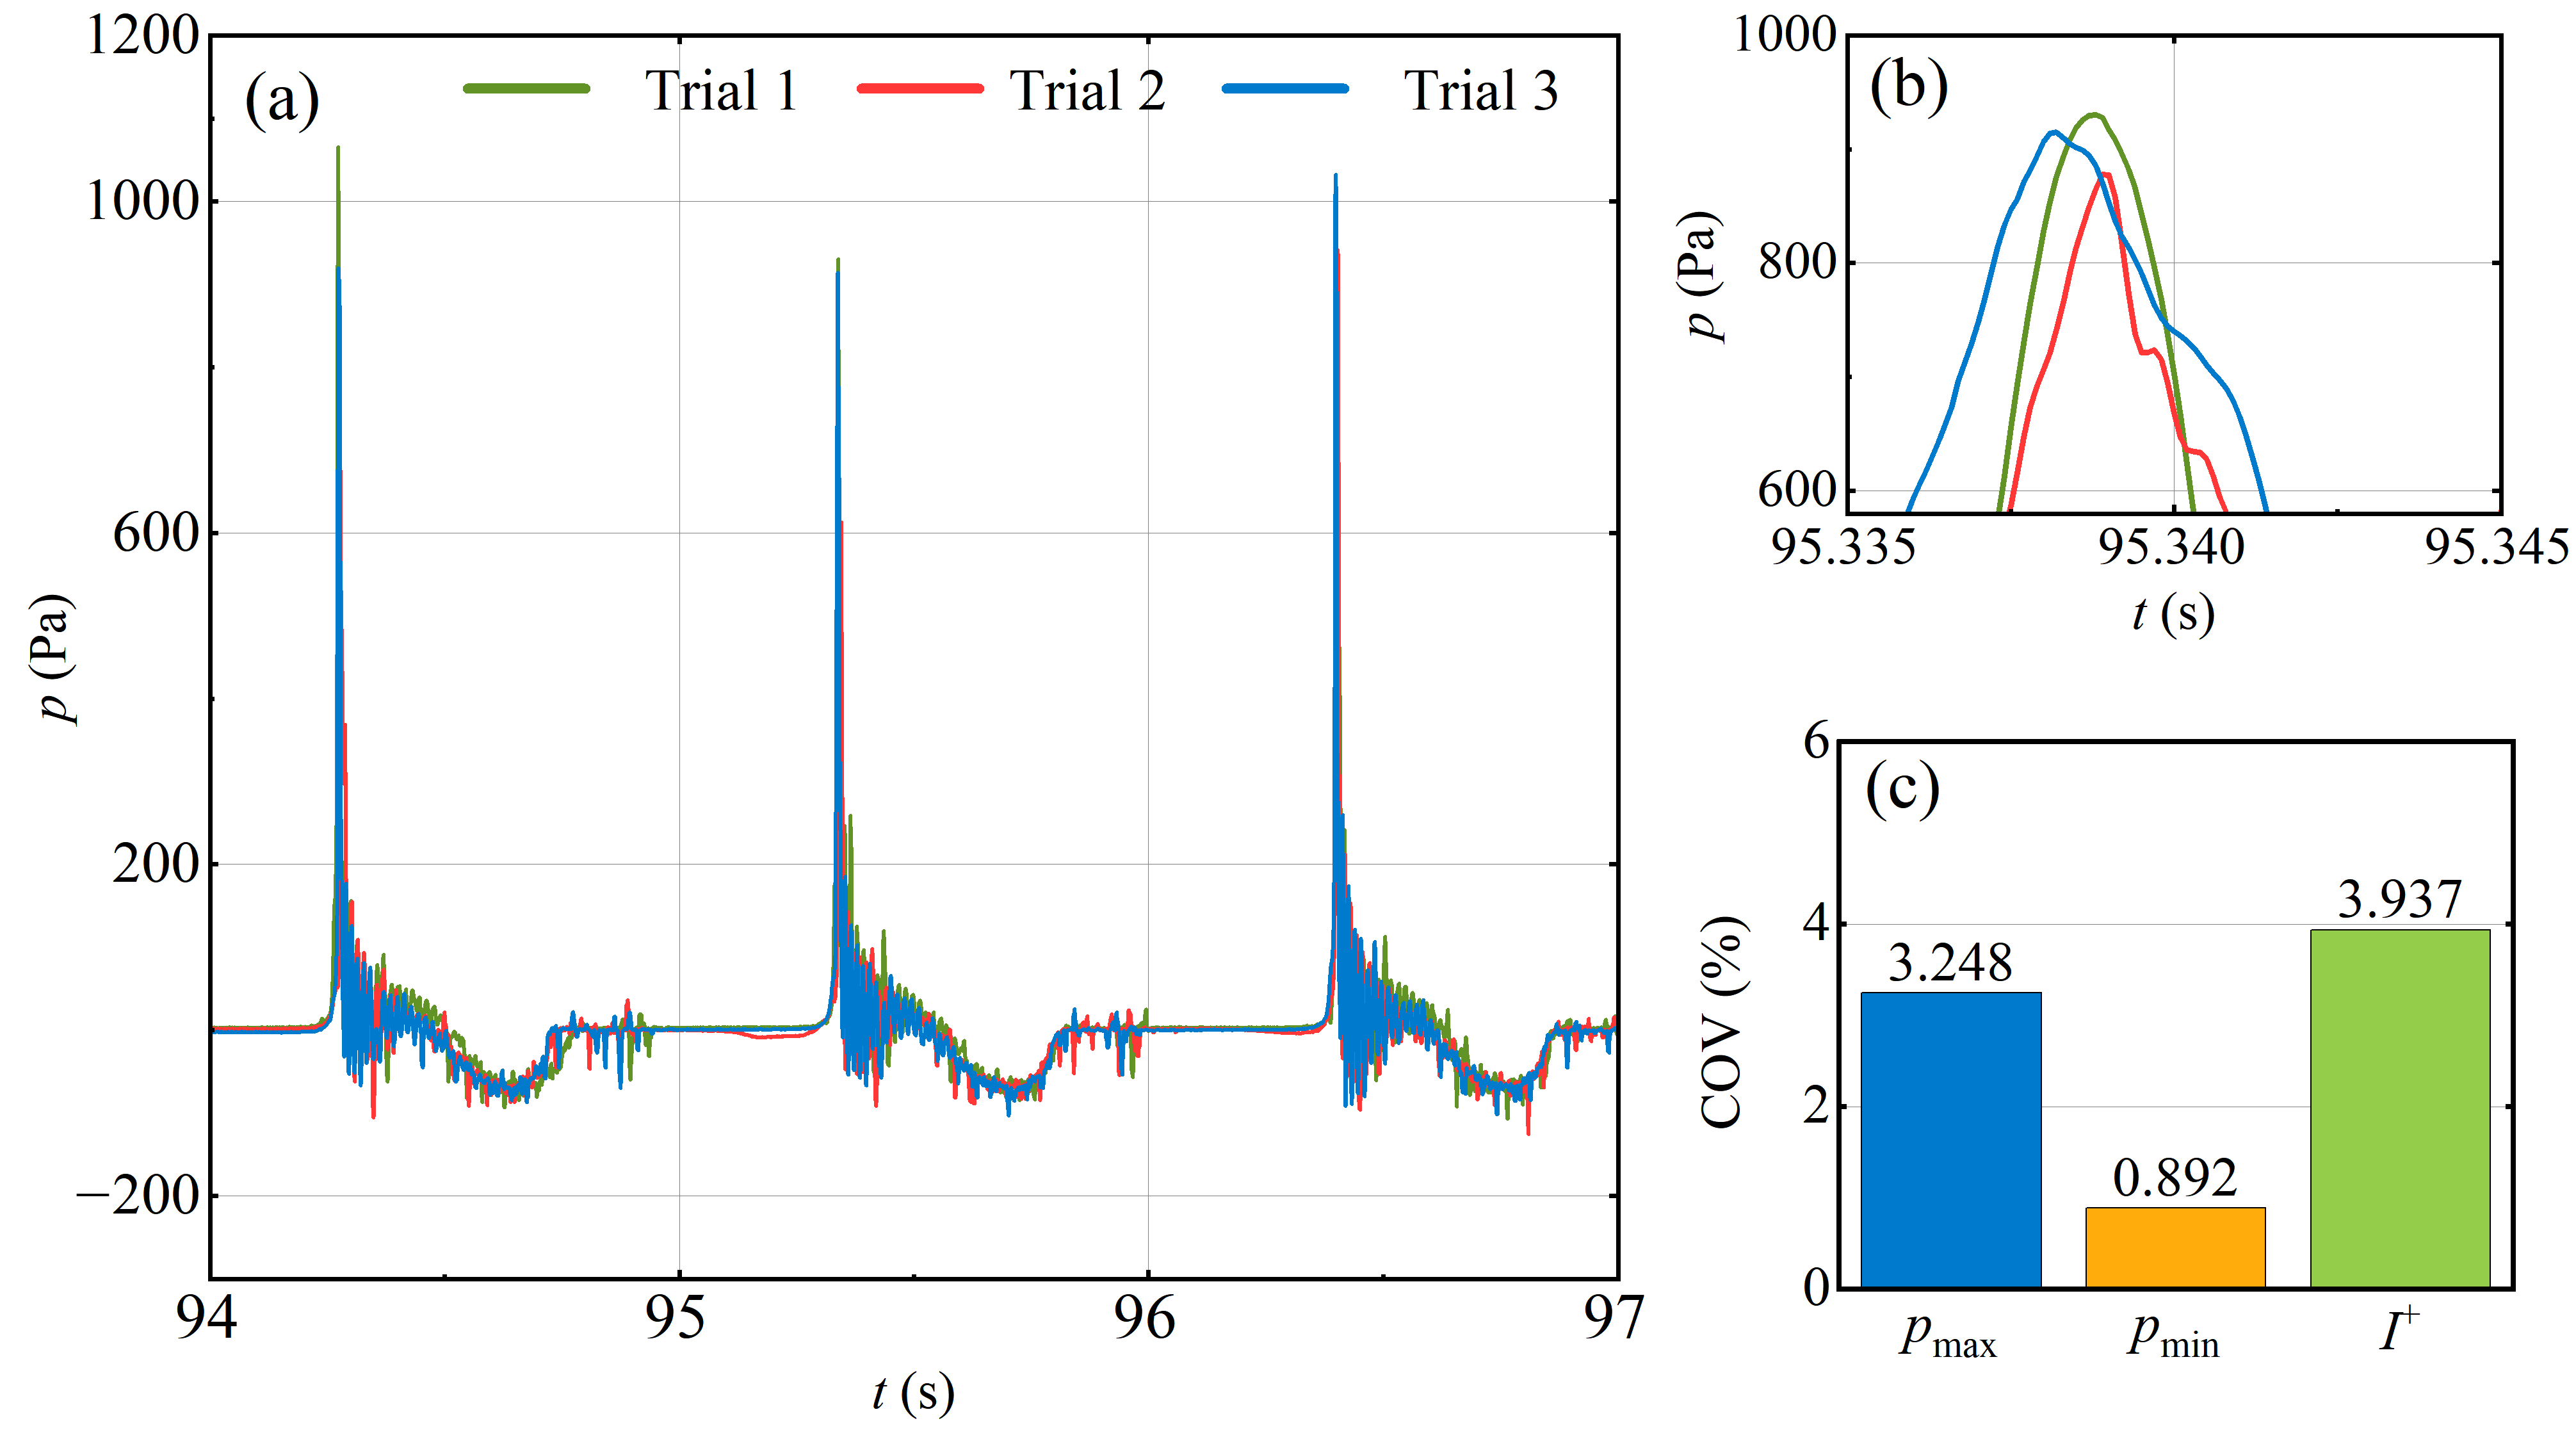
Figure 4a compares three repeated pressure records measured at P1 under the representative wave scenario (
H = 0.04 m,
T = 1.06 s). The three records show highly consistent pressure evolution, including the primary impulsive peak, the subsequent oscillatory response, and the final negative-pressure stage. An enlarged view of the primary impact peak is shown in
Figure 4b. The peak occurs at nearly the same instant in all three runs, although slight differences in peak magnitude are observed. These differences are likely caused by small run-to-run variations in the instantaneous free-surface shape and local air-cavity deformation immediately before impact.
The repeatability of the measured pressure response is further quantified using the coefficient of variation (COV) of the maximum pressure (
pmax), minimum pressure (
pmin), and impulse integrated by the positive pressure (
I+), as shown in
Figure 4c. The corresponding COV values are 3.248%, 0.892%, and 3.937%, respectively. All three values are below 4%, indicating that the main features of the slamming-pressure response are highly repeatable despite the stochastic nature of local air-cavity evolution. In particular, the consistent occurrence and magnitude of the primary pressure peak and the subsequent negative-pressure response also provide indirect support for the comparability of the overall stage-dependent slamming dynamics, including the associated air-entrapment processes, among repeated runs. These repeated pressure measurements therefore provide a reliable basis for comparing the independently acquired PIV and BIV results in the subsequent flow-field analysis.
3.2. Validation of Generated Regular Waves
Before analyzing the slamming response, the generated regular waves are validated to confirm that the prescribed incident-wave scenarios are accurately reproduced in the flume. The validation is performed under empty-flume scenarios, with the deck model removed. Among the six wave gauges, G4 is selected because it is located immediately upstream of the deck position and therefore records the incident waves before they are affected by wave–deck interaction. For each test scenario, the measured free-surface elevation at G4 is compared with the corresponding second-order Stokes wave solution. The analytical wave elevations are calculated based on the prescribed incident wave height, wave period, and water depth using the second-order Stokes wave equation:
where
H is the wave height,
k is the wave number,
h is the water depth, and
ω is the angular frequency.
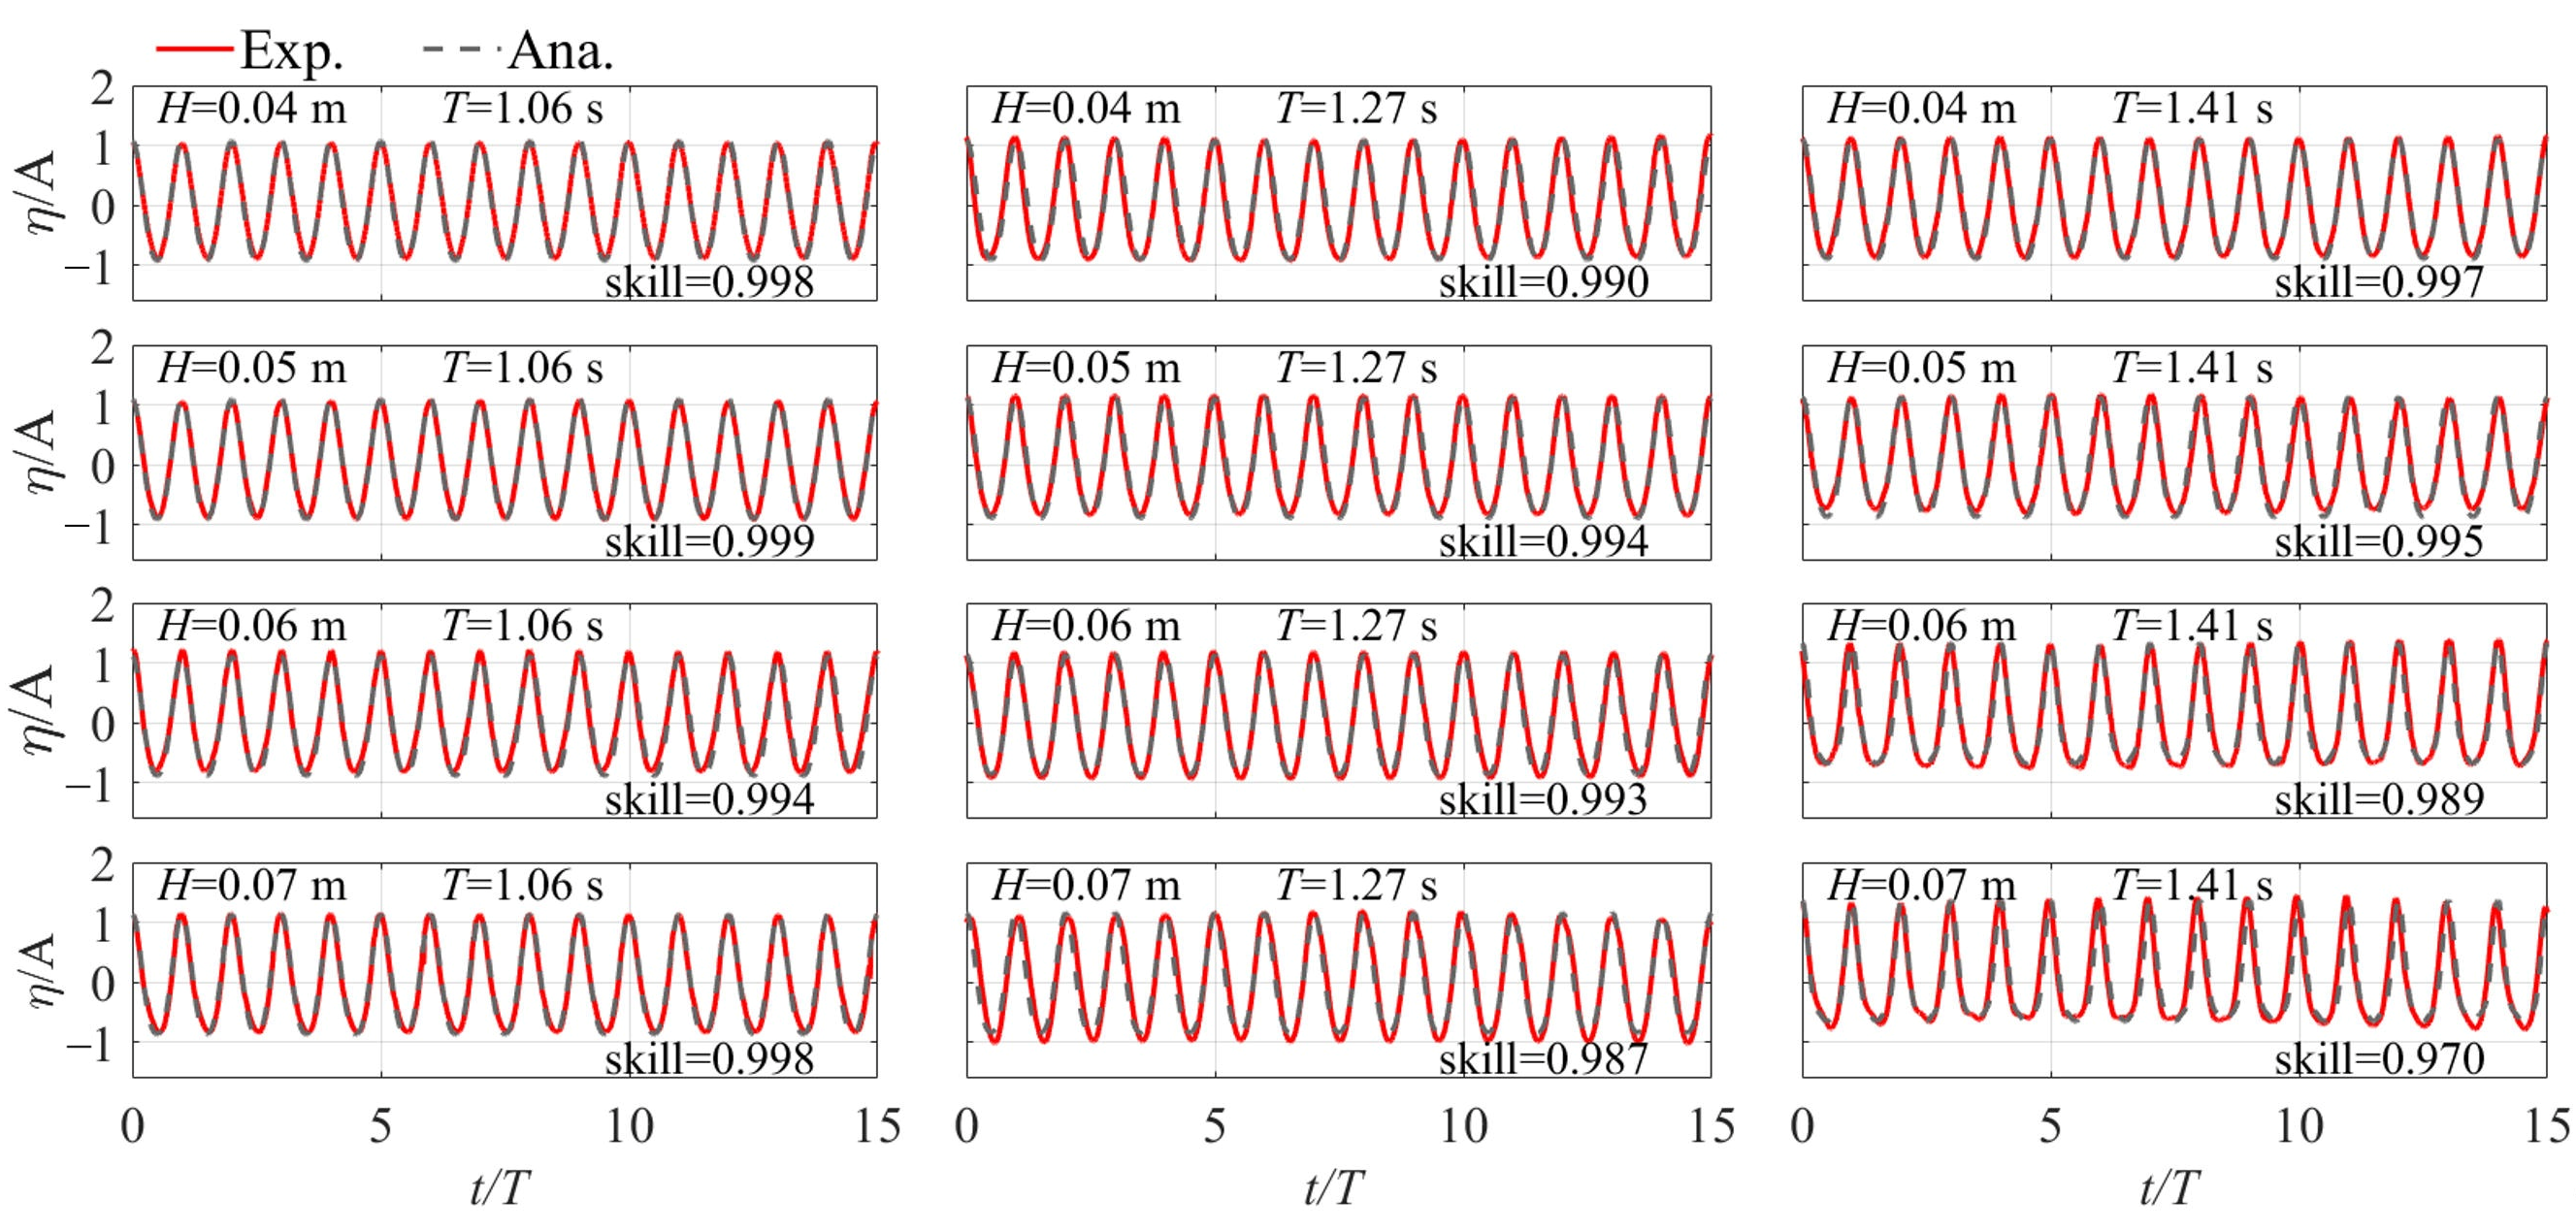
Figure 5 compares the normalized free-surface elevations,
η/
A, for all tested wave scenarios, where
η is the measured free-surface elevation and
A is the incident-wave amplitude. The measured and analytical time series are compared using the same sampling interval after phase alignment based on the measured wave period. The agreement is quantified using the skill score [
22]:
where
XExp and
XStokes are the measured and analytical free-surface elevations, respectively. The overbar denotes the averaged value.
N = 15 is the total number of samples included in the comparison. A skill value close to 1 indicates excellent model performance.
As shown in
Figure 5, the measured wave profiles agree well with the second-order Stokes solutions for all tested wave scenarios. Both wave amplitude and phase are accurately reproduced, with all skill scores exceeding 0.97 and most exceeding 0.99. These results confirm the consistency of wave generation throughout the experimental matrix. Therefore, the differences observed in slamming pressure, air-entrapment behavior, and flow evolution can be attributed mainly to the wave–deck interaction rather than to uncertainties in the incident waves.
4. Results
4.1. Free-Surface Evolution and Stage Classification of Wave-in-Deck Slamming
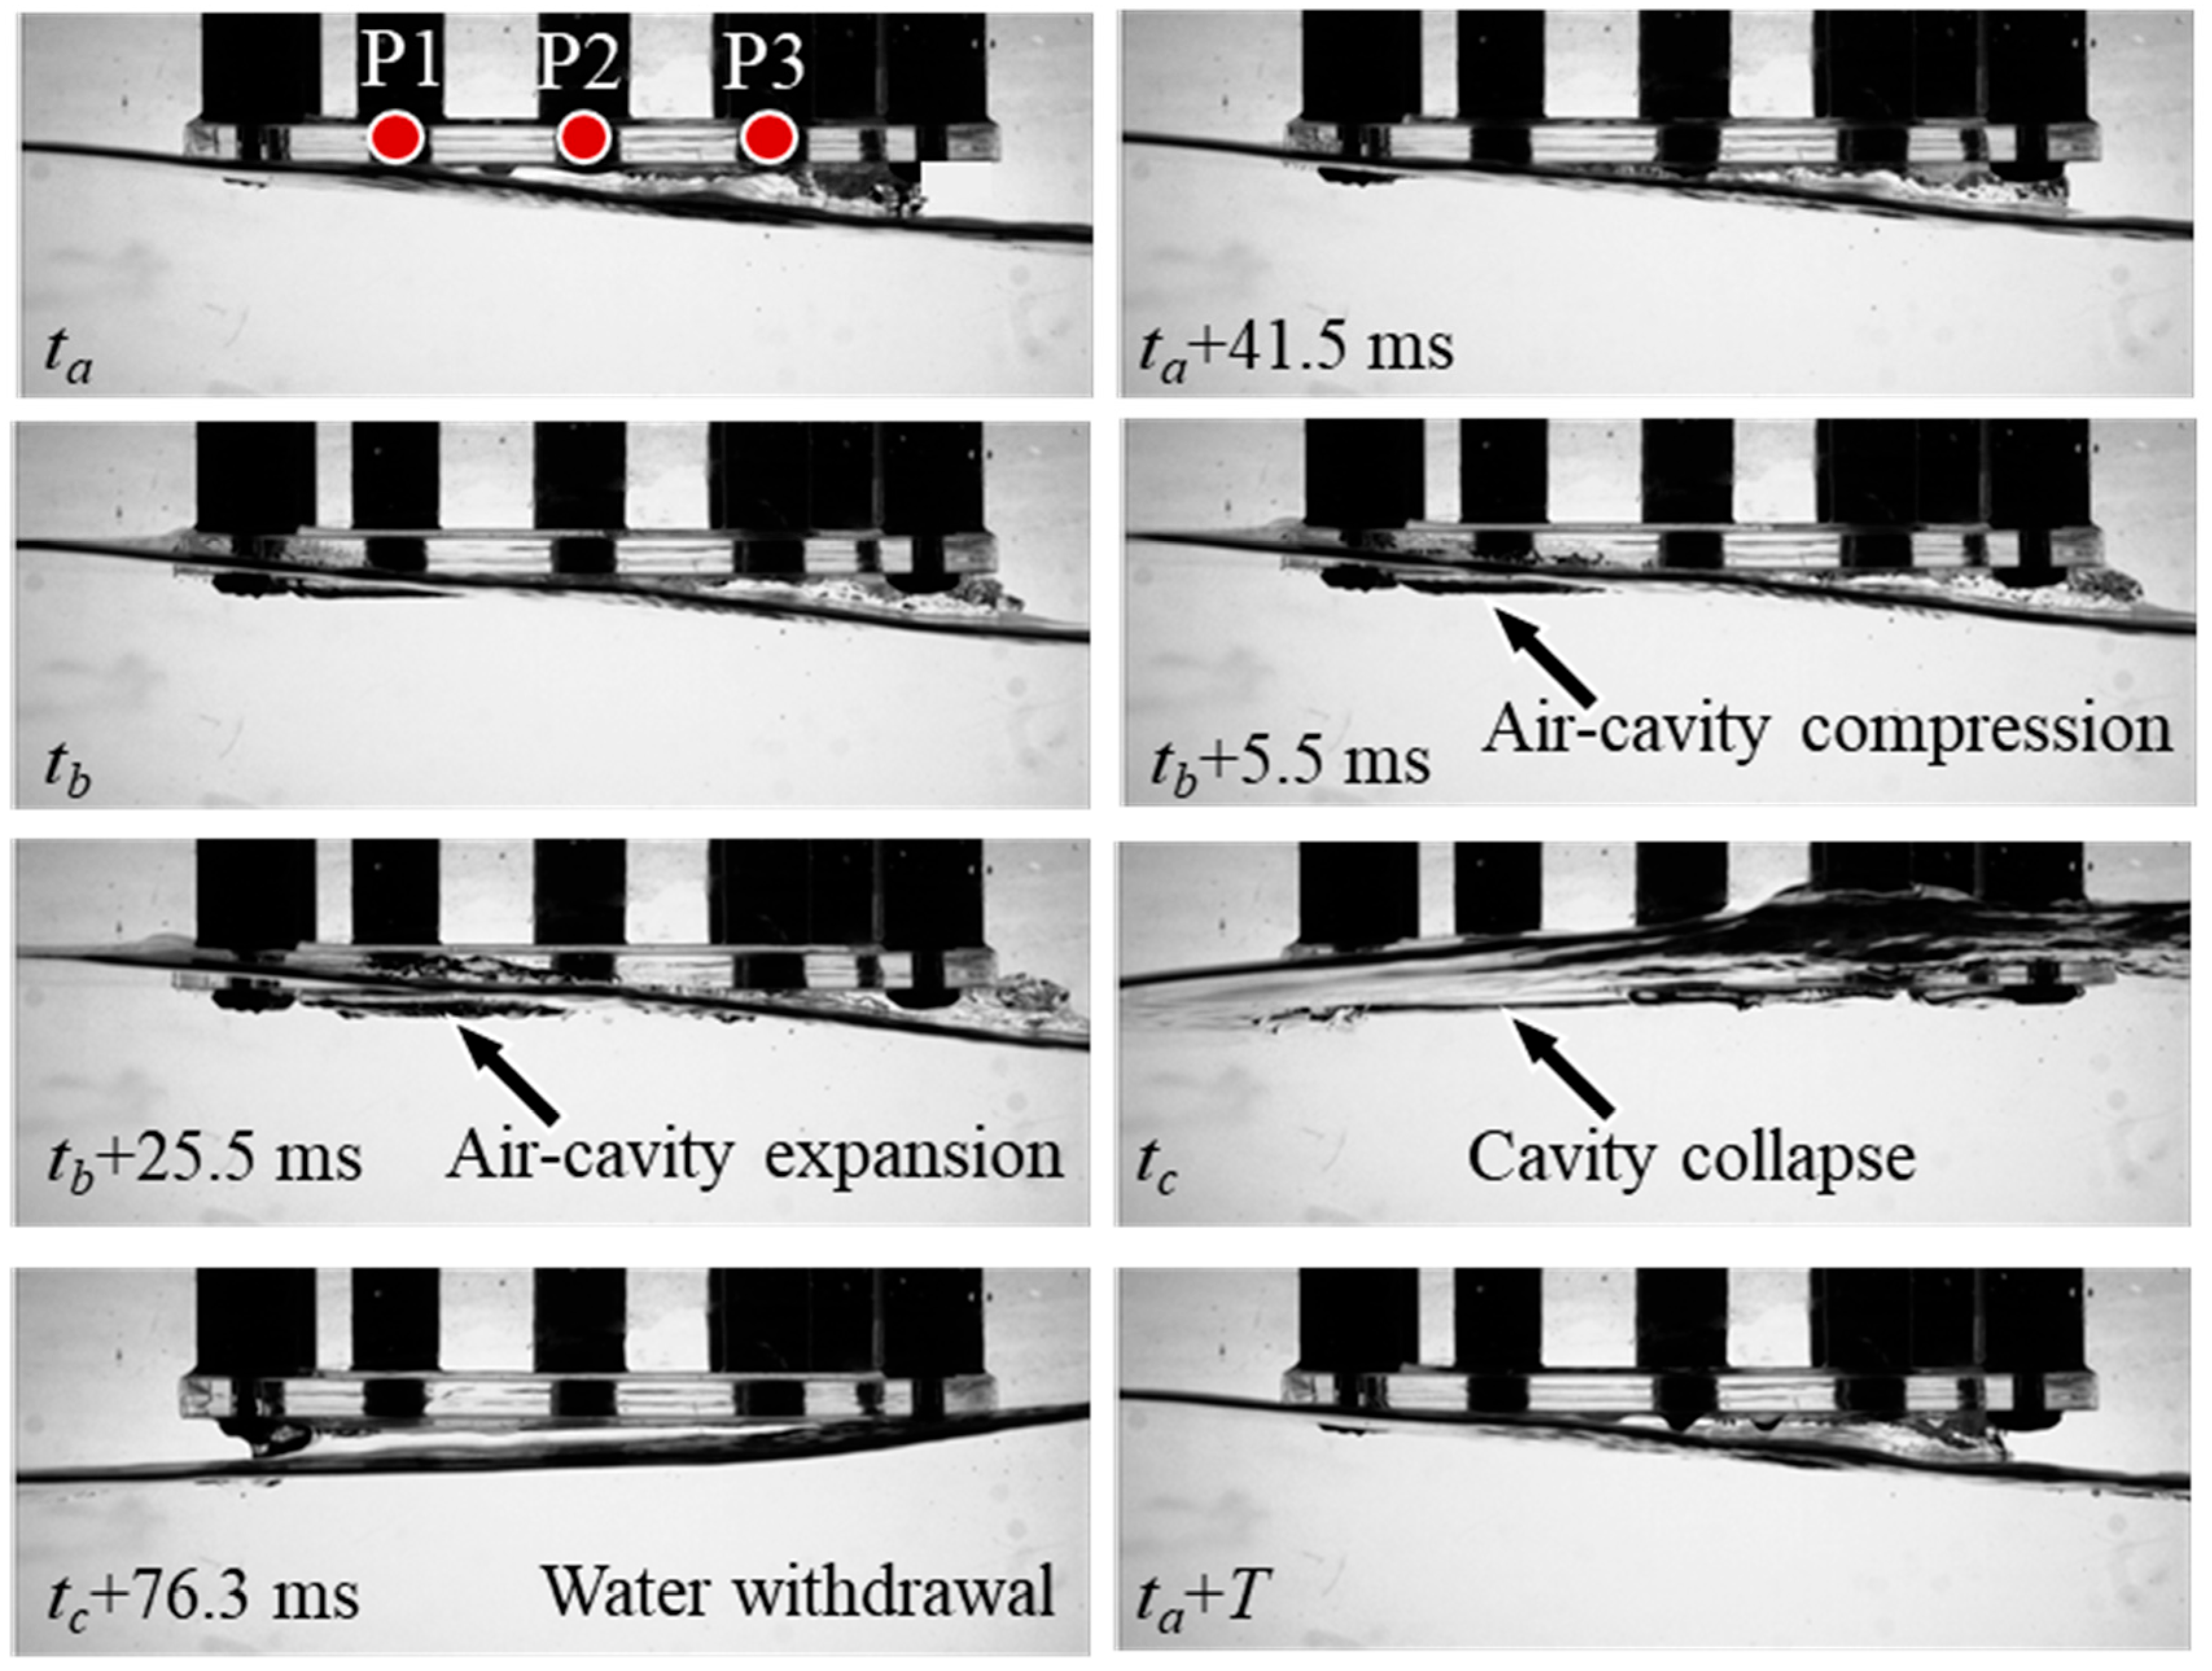
Figure 6 and
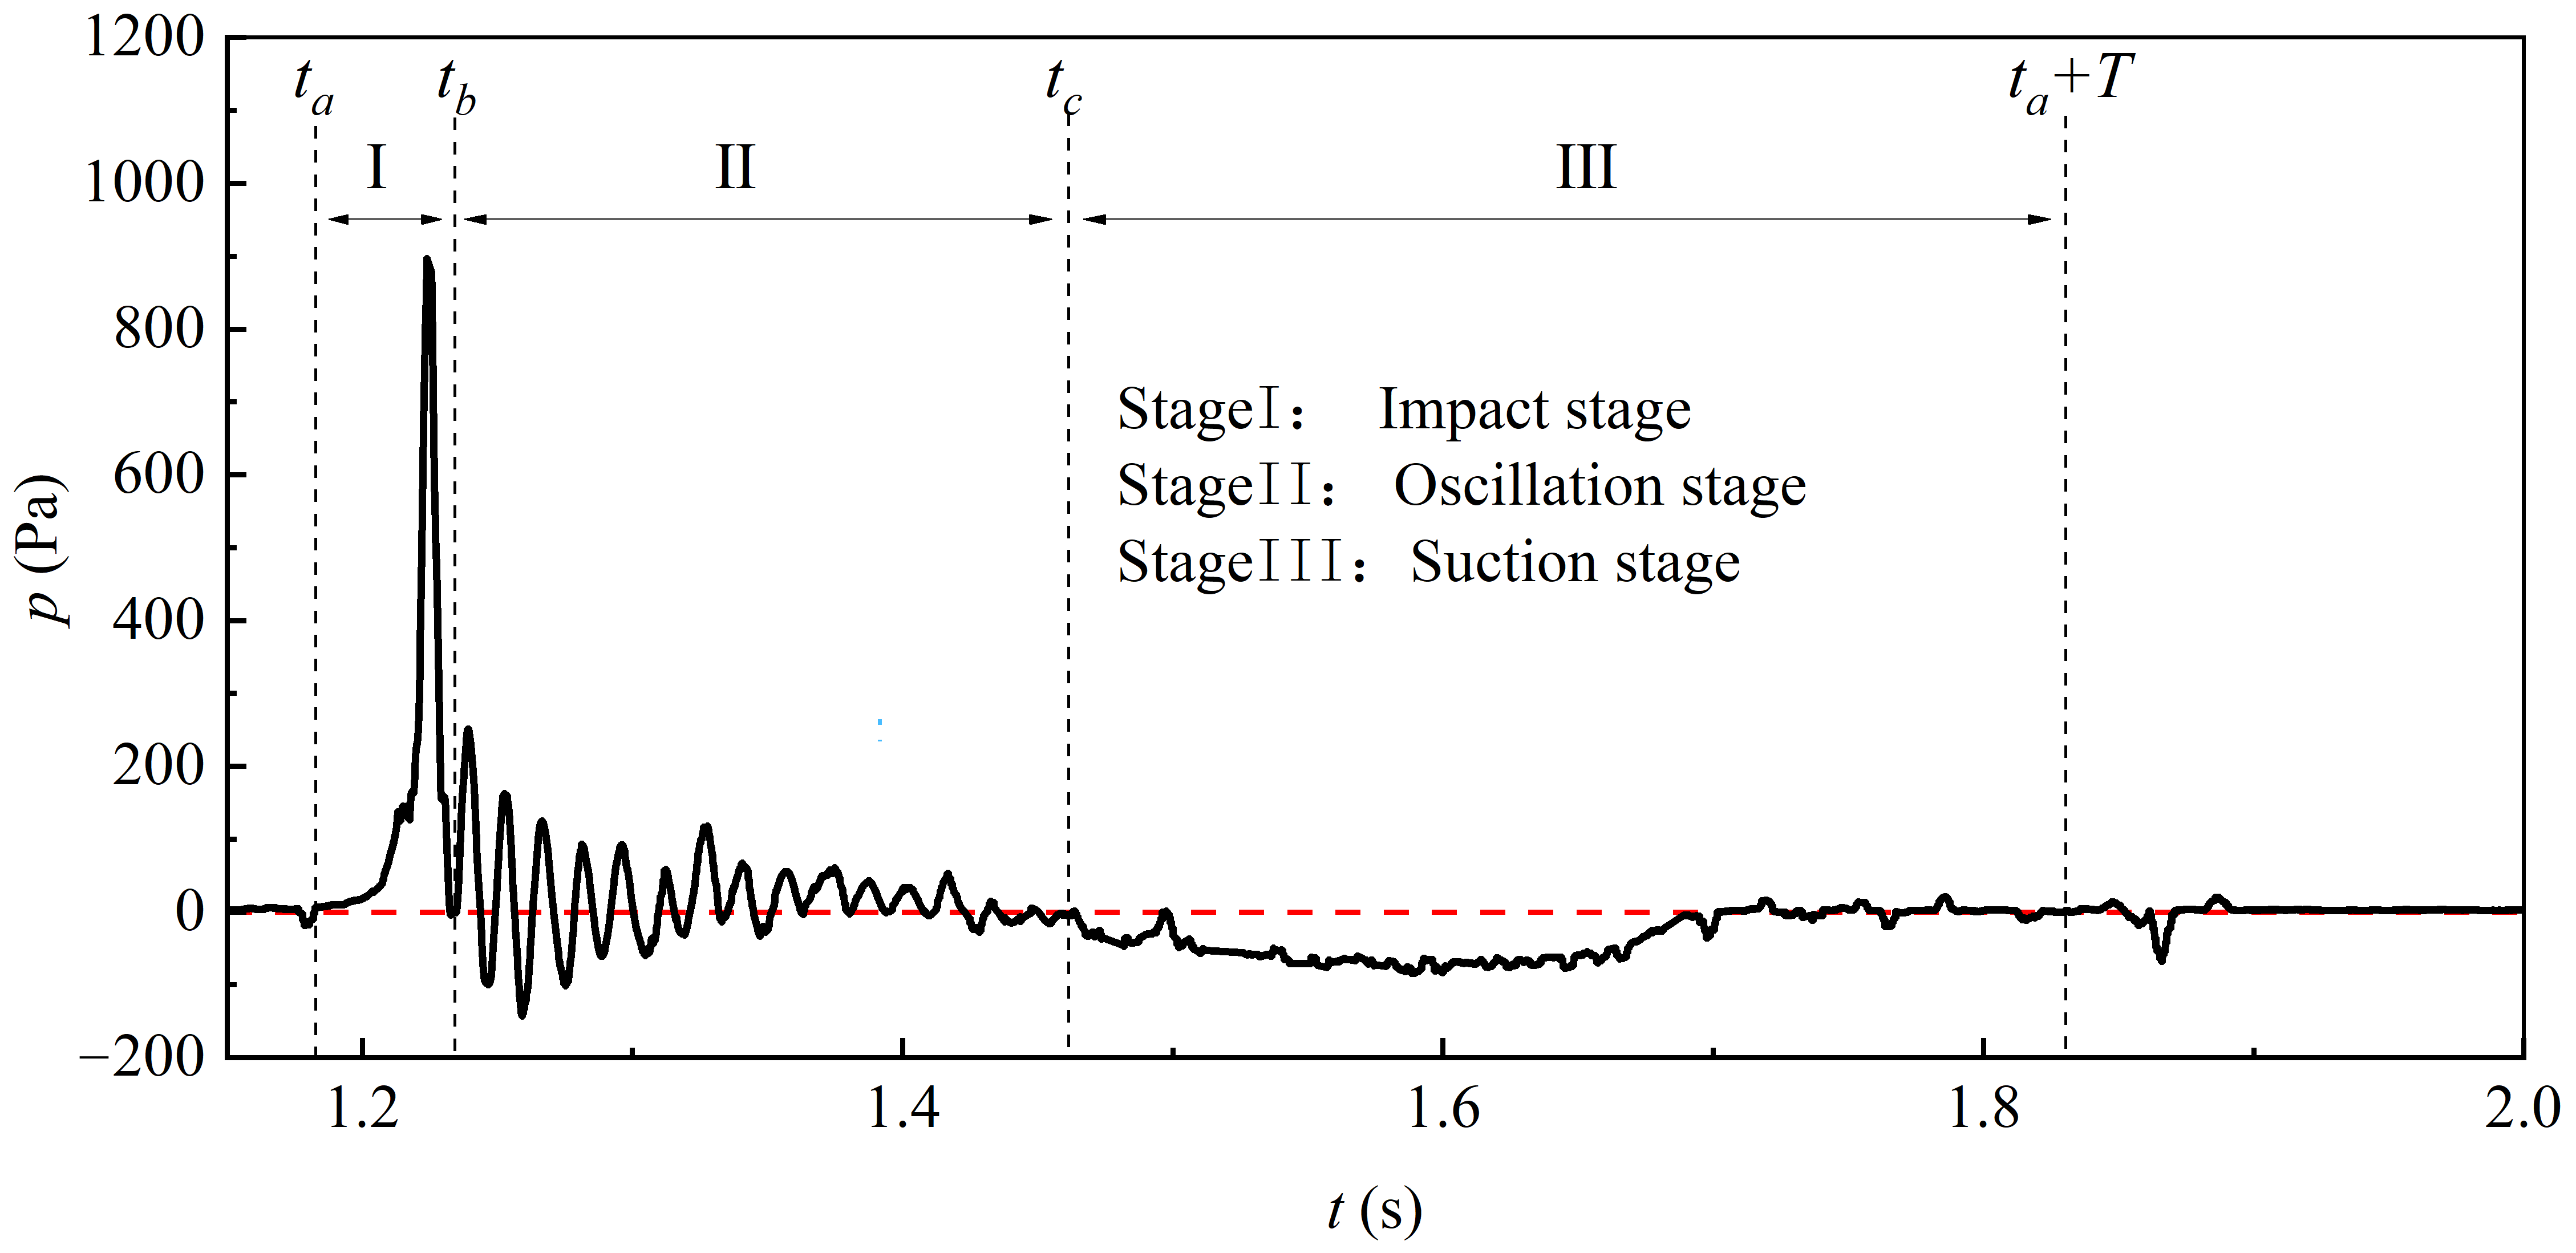
Figure 7 illustrate the free-surface evolution beneath the deck and the corresponding pressure response, respectively, under the representative wave-in-deck scenario.
The incident wave crest first reaches the deck underside at t = ta, marking the onset of wave–deck interaction. The free surface continues to rise beneath the deck until the upward-moving water impacts the deck, producing the maximum positive pressure at t = ta + 41.5 ms. Immediately after the impact, a localized air cavity becomes entrapped beneath the deck. As the pressure response enters the oscillation stage (t = tb), the entrapped air cavity becomes clearly identifiable and undergoes continuous deformation beneath the deck. The cavity alternately compresses (t = tb + 5.5 ms) and expands (t = tb + 25.5 ms), while the pressure exhibits a series of damped oscillations. As the slamming event progresses, the air cavity gradually loses stability and eventually collapses (t = tc), marking the transition to the final stage of the pressure response.
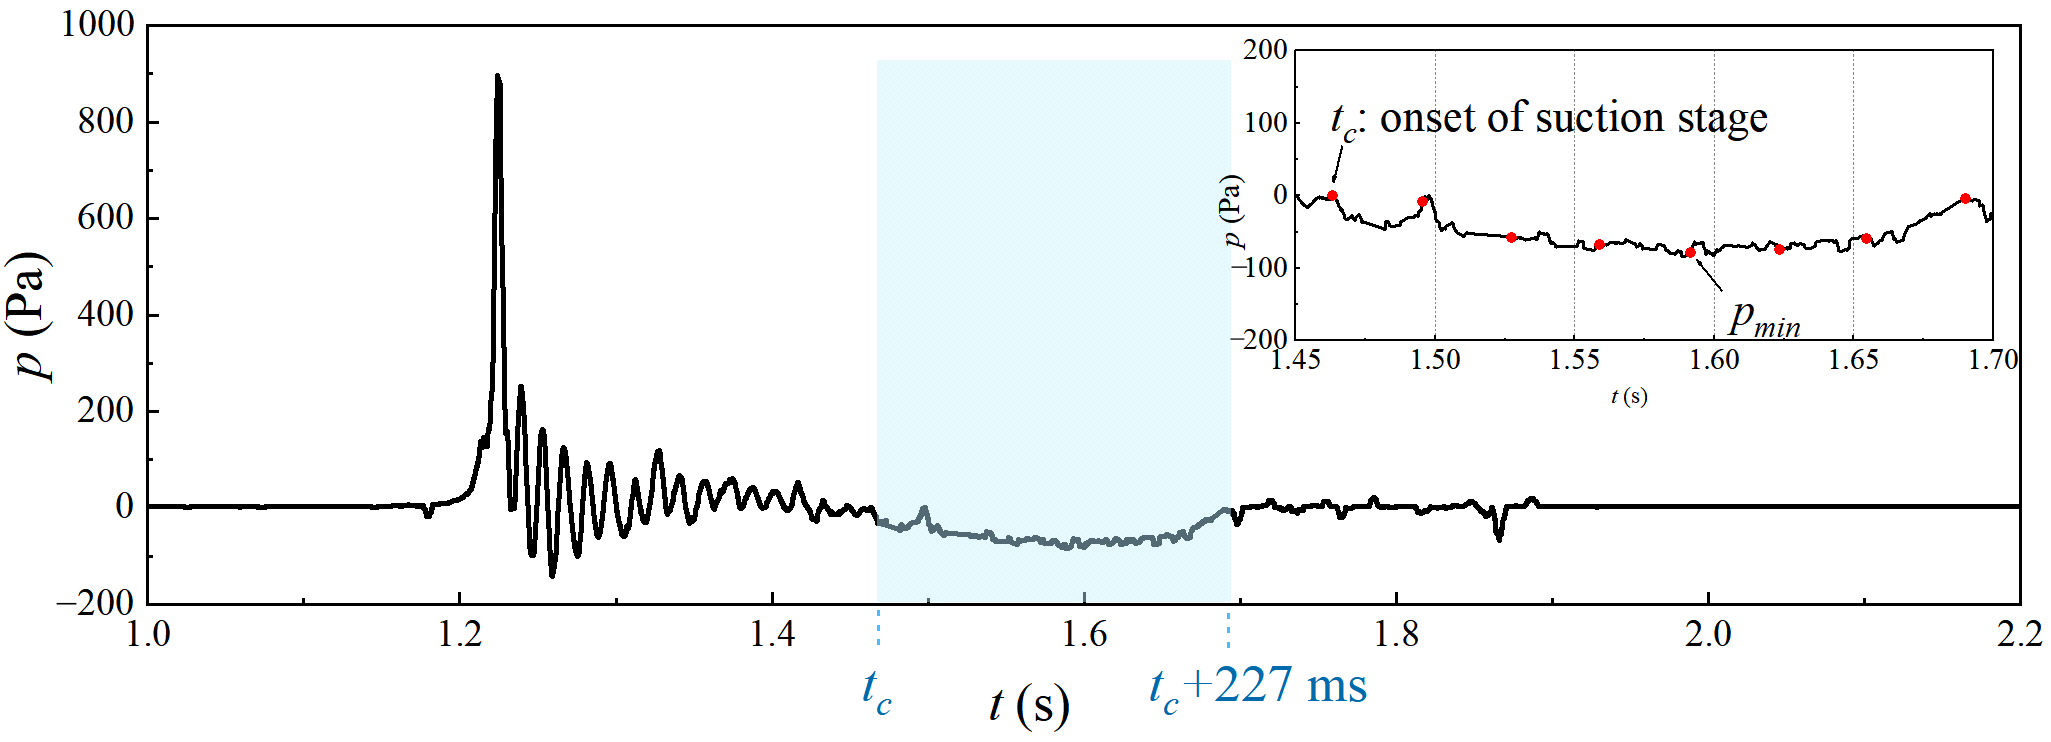
Following cavity collapse, the water mass begins to withdraw from the deck underside and a separated flow region develops beneath the structure. The strongest suction occurs at t = tc + 76.3 ms, when the pressure reaches its minimum value. Subsequently, the separated region expands and ambient air progressively re-enters the space beneath the deck as the water continues to descend. At the end of the wave period (t = ta + T), both the free surface and the pressure return to their pre-impact states, completing one slamming cycle.
Based on the synchronized observations of the free-surface evolution and pressure response, the slamming event is divided into three successive stages, as indicated in
Figure 7. Stage I (impact stage) is characterized by the initial wave–deck interaction and the generation of the primary pressure peak. Stage II (oscillation stage) is distinguished by repeated pressure oscillations accompanied by the evolution of the entrapped air cavity beneath the deck. Stage III (suction stage) begins with cavity collapse and is characterized by water withdrawal, flow separation, and a prolonged negative-pressure response before the pressure gradually recovers to the ambient level.
The stage classification established here provides the framework for the subsequent analysis. The generation of the primary impact load is examined in
Section 4.3, the air-cavity dynamics responsible for the oscillatory pressure response are analyzed in
Section 4.4, and the flow evolution associated with the suction stage is discussed in
Section 4.5.
4.2. Slamming-Response Classification Based on Air-Entrapment Morphology
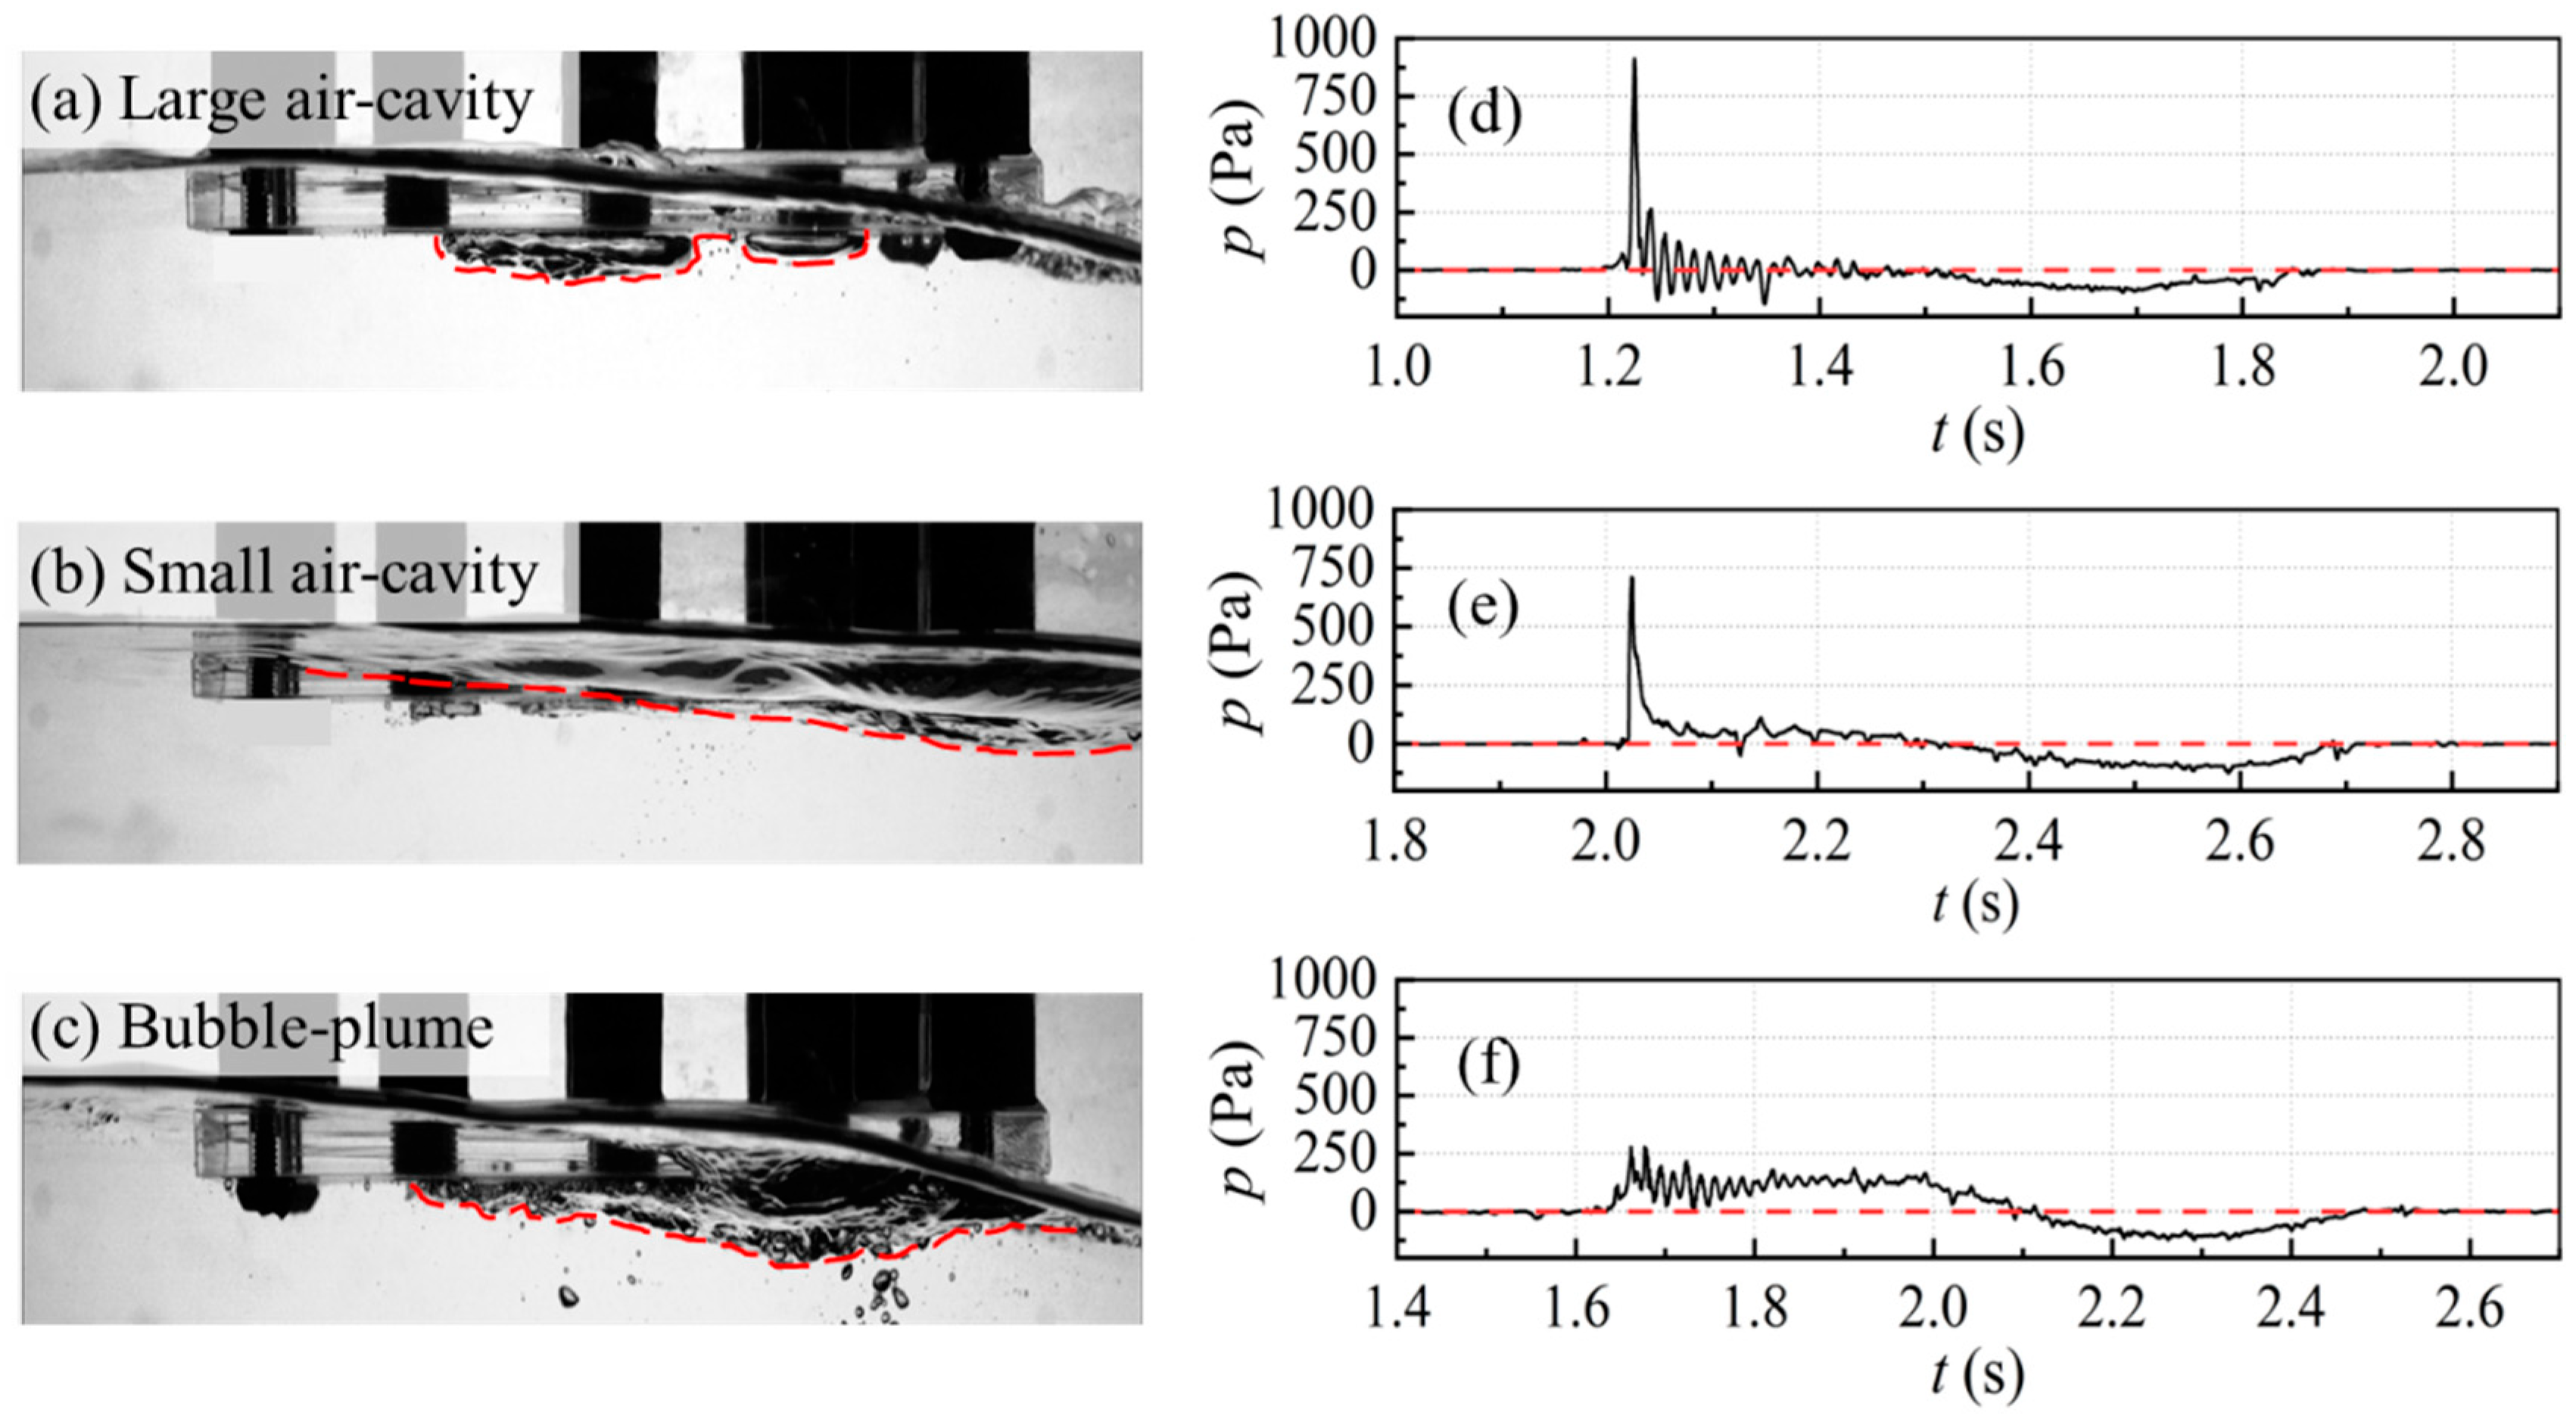
The pressure response after initial impact varies markedly with the morphology of the entrapped air beneath the deck. To clarify this dependence, three representative air-entrapment patterns are identified from the pressure records synchronized with high-speed images: a large coherent air cavity, a small dissipating air cavity, and bubble plumes. To provide quantitative support for this image-based classification, an air-region ratio is introduced as:
where
Aair(
t) is the projected area occupied by air-containing regions extracted from the images at time
t, and
AFOV is the fixed field-of-view area used for BIV image analysis. The identified air-containing regions include the connected cavity and visible dispersed bubbles within the prescribed region of interest. The temporal variation of
Ar (
t) and its maximum value,
Ar,max, are used to quantify the relative extent of the air-containing region and to supplement the morphology-based classification.
After the initial impact, a large coherent air cavity forms beneath the deck (
Figure 8a). The pressure record exhibits a pronounced impulsive peak followed by a series of damped oscillations. The entrapped air remains as a spatially connected cavity occupying a relatively large portion of the observed deck underside during the post-impact stage. Correspondingly, this pattern exhibits a relatively large
Ar,max, consistent with the extensive coherent air region observed in the image. In contrast,
Figure 8b represents a small dissipating air-cavity pattern. Although a distinct impact peak is still observed, the subsequent pressure oscillations are much weaker and decay rapidly. The entrapped air is confined to a relatively limited region beneath the deck and dissipates shortly after impact. Accordingly, this pattern exhibits a lower
Ar,max and a more rapid reduction in
Ar (
t), with the pressure response dominated by the initial impulsive load. A third response type is shown in
Figure 8c, where the entrapped air rapidly fragments into numerous bubbles and forms bubble plumes beneath the deck. Compared with the coherent-cavity scenarios, the initial impact peak is less pronounced, whereas weaker pressure oscillations persist over a longer duration. In this case,
Ar (
t) quantifies the total projected air-containing area, while the fragmented nature of the air region is identified from the spatial distribution of the dispersed bubbles in the image.
4.3. Impact-Stage Flow Characteristics
4.3.1. Spatial Distribution of Peak Impact Pressure
To enable a consistent comparison of the peak impact pressures among wave conditions with different incident wave heights, the nondimensional peak impact pressure
p*
max is defined as
where
pmax is the measured peak impact pressure,
ρ is the water density,
g is the gravitational acceleration, and
H is the incident wave height. The spatial distribution of
p*
max is first investigated as it is highly localized and may shift along the deck underside.
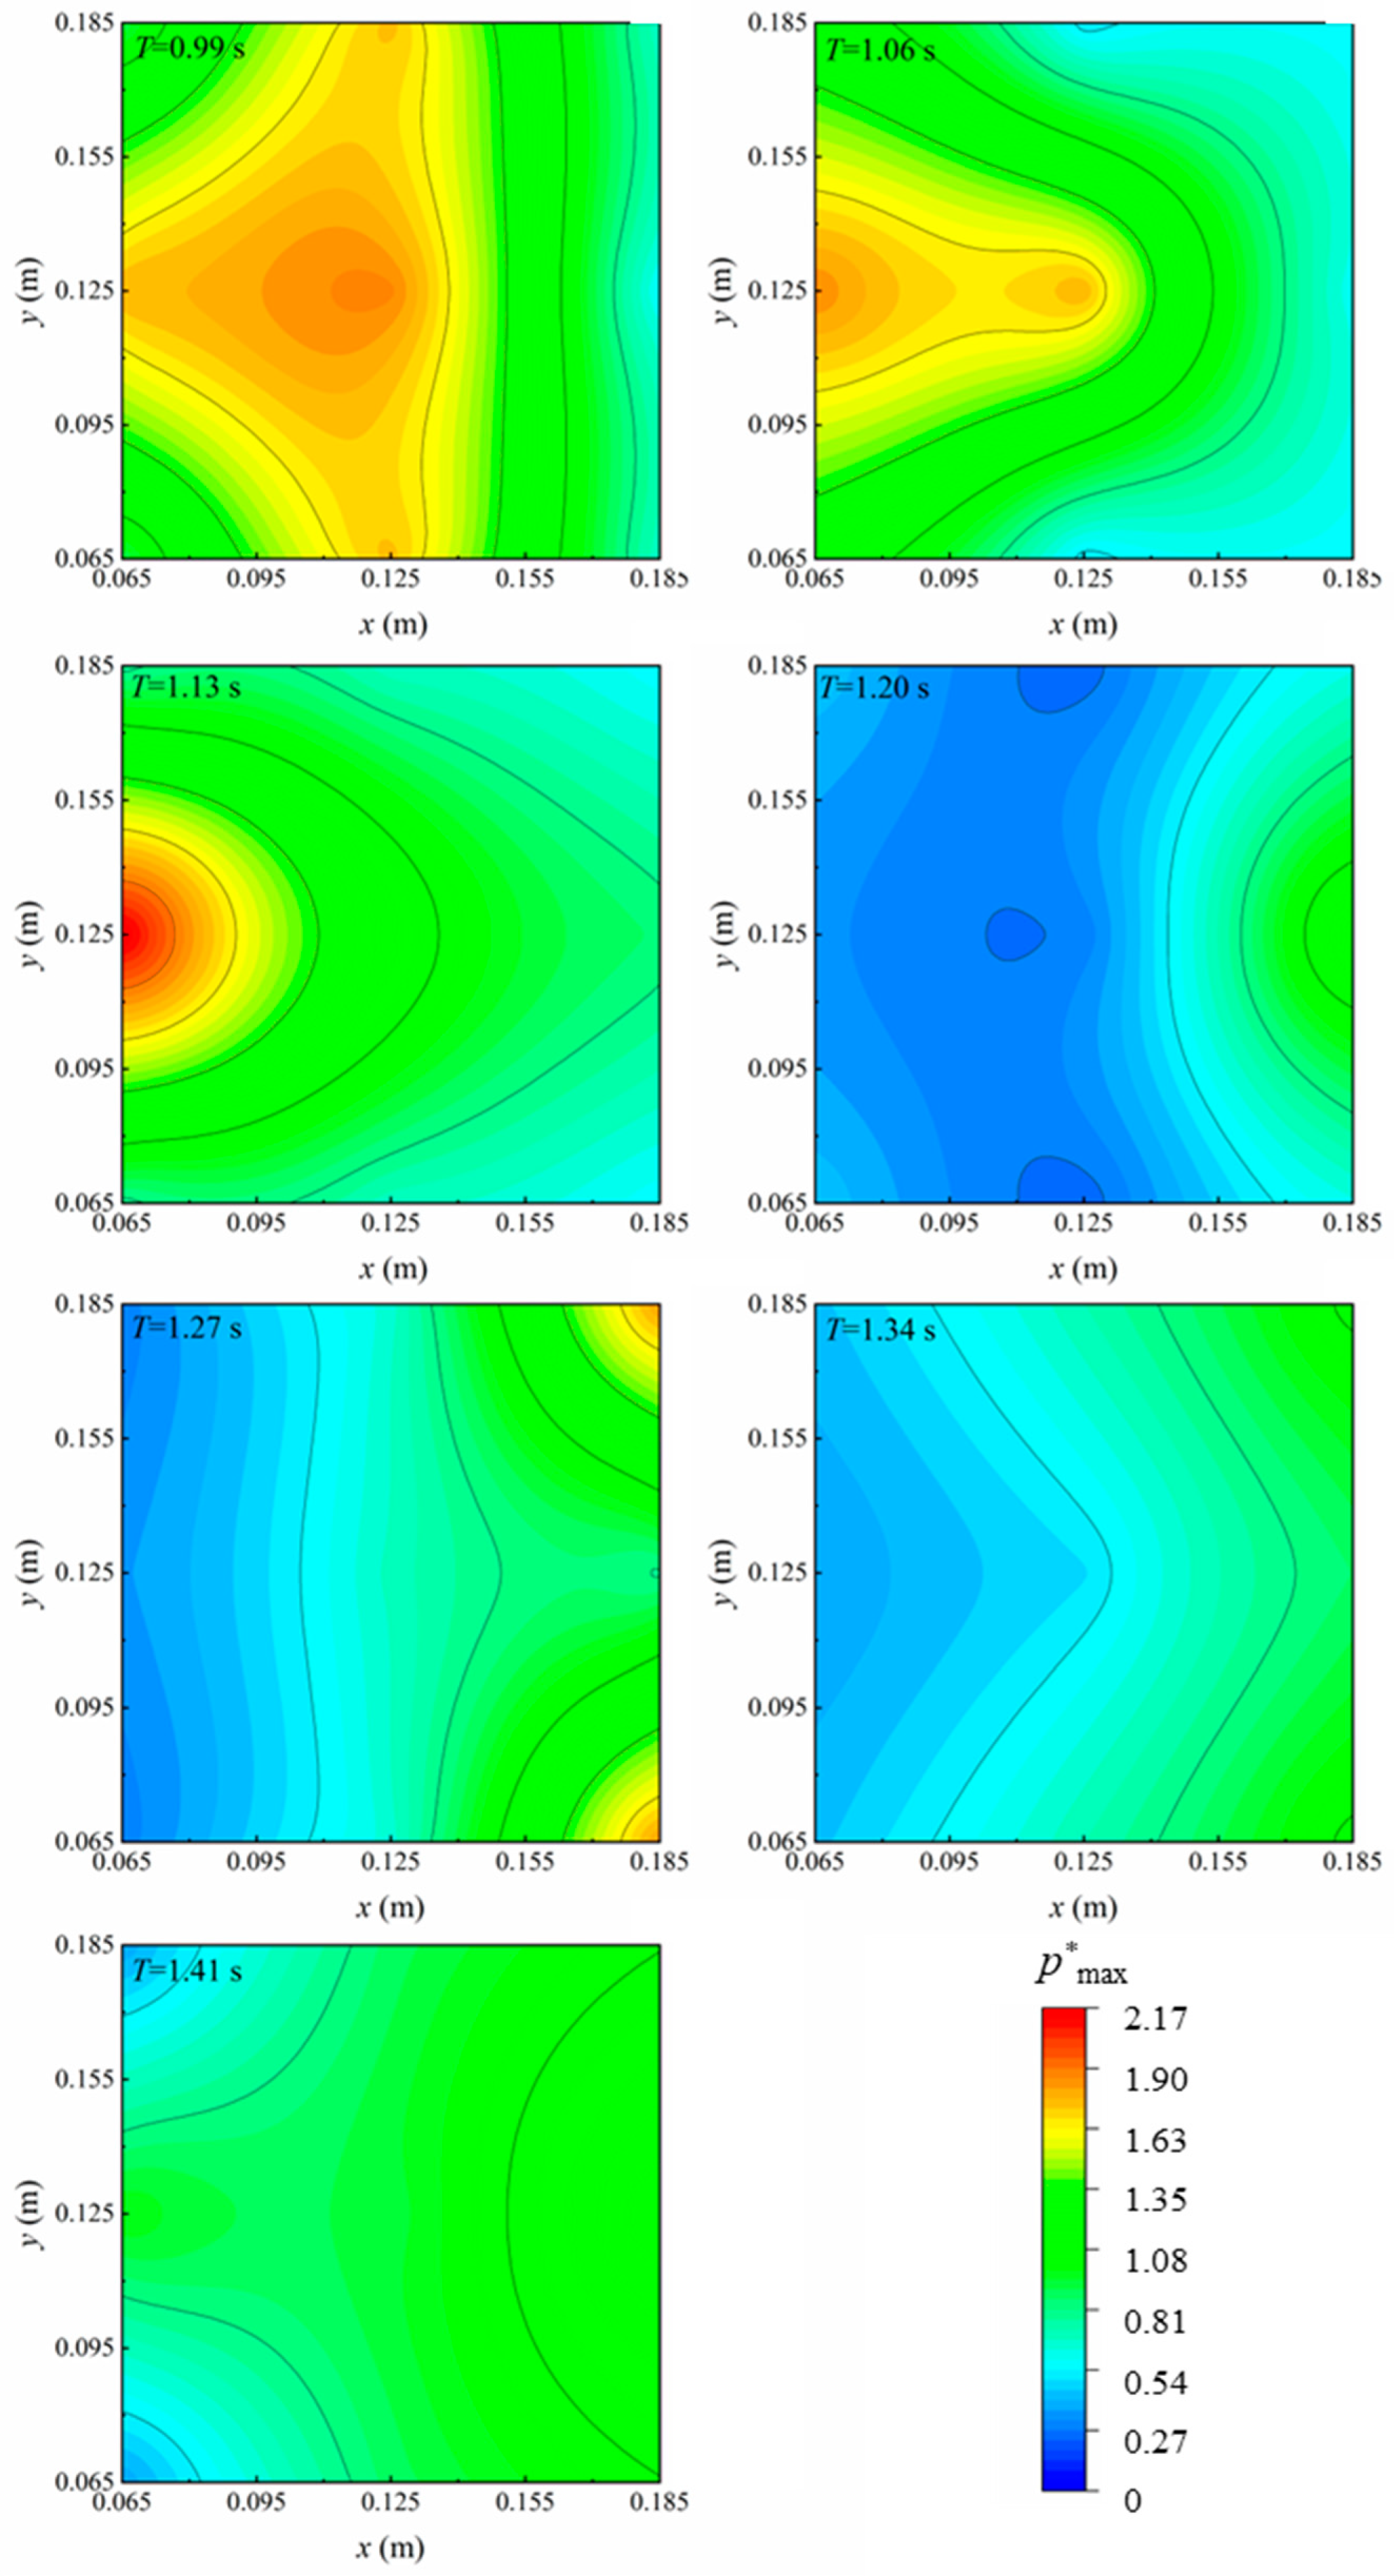
Figure 9 presents the distributions of
p*
max beneath the deck for different incident wave periods at a fixed wave height of
H = 0.04 m to isolate the influence of wave period on the spatial distribution of the impact pressure. The full-deck spatial pressure distribution is reconstructed by interpolating the measurements from six pressure transducers installed on one half of the deck and subsequently mirroring the interpolated field across the longitudinal centerline. This procedure is based on the nominal symmetry of the deck geometry, normally incident regular waves, and experimental conditions about the centerline. However, possible local asymmetries arising from air-cavity deformation, bubble fragmentation, and bubble-plume development cannot be resolved by the present sensor arrangement.
A pronounced dependence of the peak-pressure distribution on the incident wave period is observed. For shorter period waves (T = 0.99 and 1.06 s), the highest pressures are concentrated in the upstream region, indicating that the strongest wave–deck interaction occurs shortly after the incident wave enters beneath the deck. As the wave period increases to T = 1.13 s, the high-pressure region contracts but remains close to the upstream side. At T = 1.20 s, the pressure distribution becomes more uniform, and the maximum pressure decreases substantially. For longer period waves (T = 1.27 and 1.34 s), two localized high-pressure regions develop near the upstream and downstream edges of the deck. When the period further increases to T = 1.41 s, the maximum pressure shifts mainly toward the downstream side. This downstream migration reflects the longer wavelength and the changing relative position between the wave crest and the deck, which alters where upward momentum is transferred most effectively to the deck underside. These results indicate that the maximum slamming load is highly localized and should be evaluated in terms of both magnitude and spatial position.
4.3.2. Influence of Wave Scenarios on Peak Impact Pressure
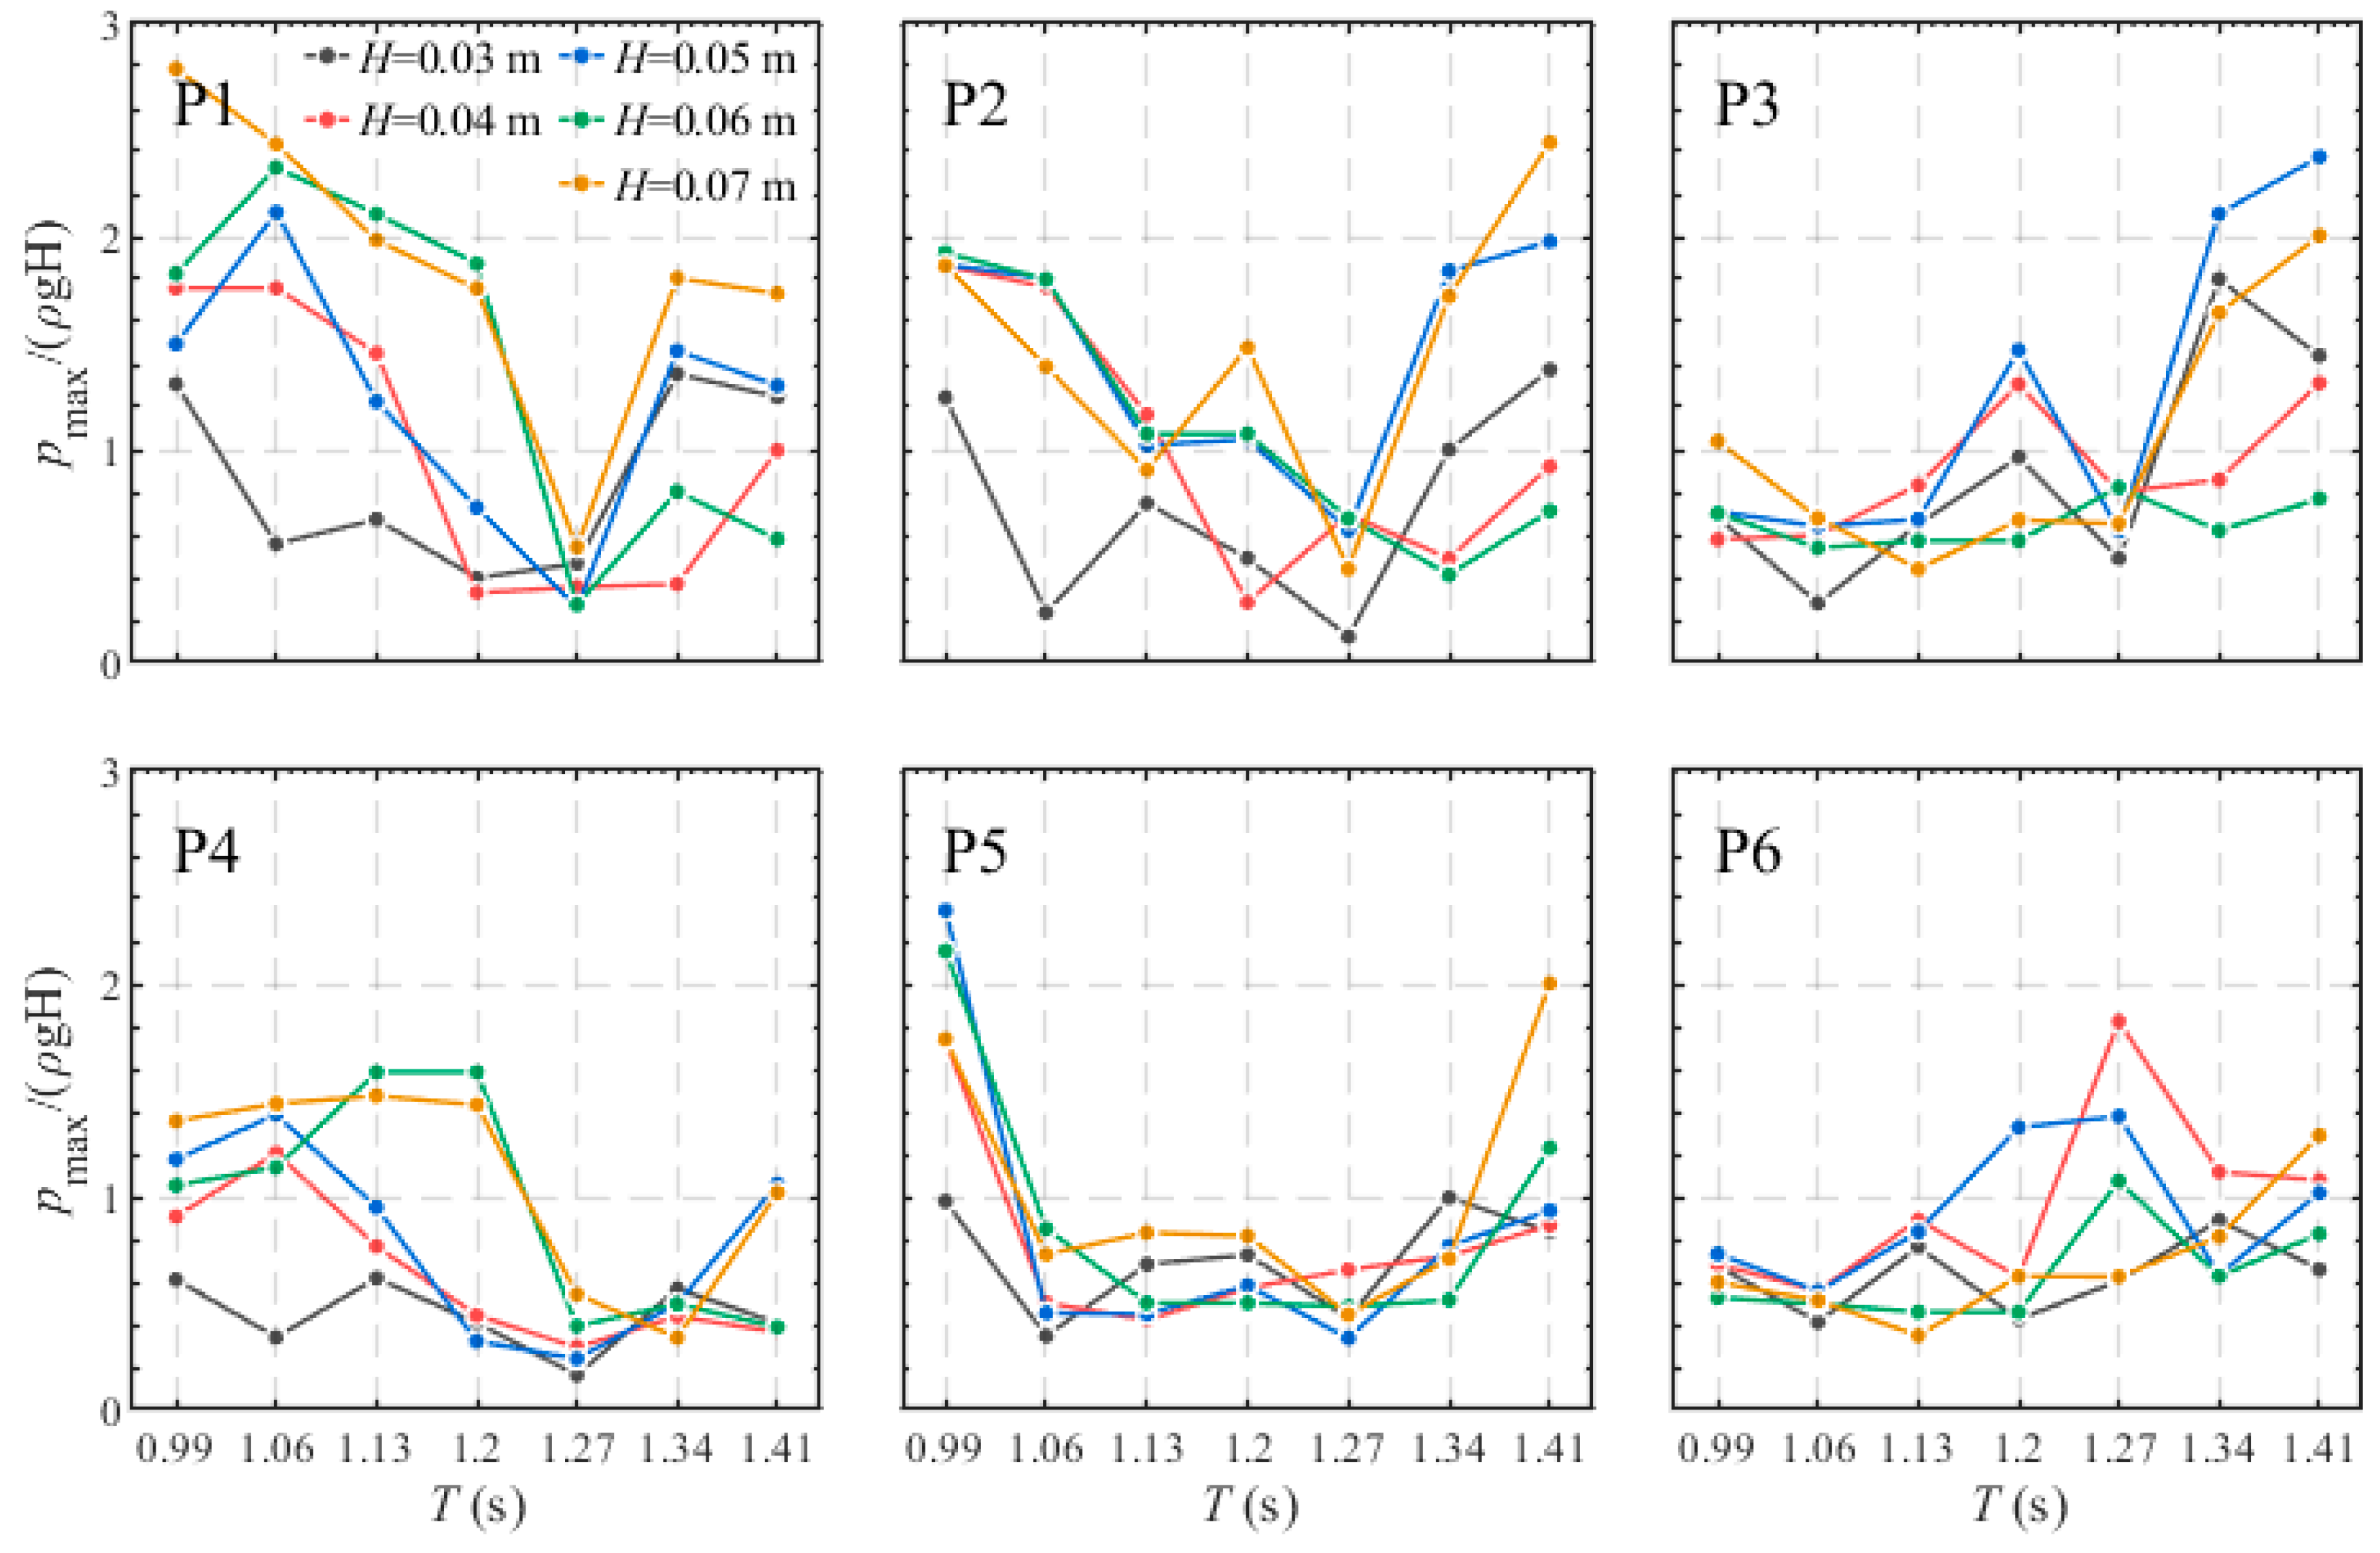
Figure 10 summarizes the nondimensional peak impact pressures,
p*
max, measured at the six pressure sensors under all tested wave scenarios. The influence of wave height on
p*
max is coupled with the effects of wave period, sensor location, and local impact configuration, resulting in a generally non-monotonic variation with increasing wave height. The maximum relative deviation of the peak impact pressure among the repeated measurements is less than 8%, indicating satisfactory repeatability considering the highly transient and inherently variable nature of wave-in-deck slamming.
The influence of wave period exhibits a clear dependence on sensor location. At sensors P1, P2, P4, and P5, located from the upstream side to the central region of the deck,
p*
max generally decreases as the wave period increases from
T = 0.99 s to approximately
T = 1.20–1.27 s, and then increases again for longer period waves. In contrast, the leeward-side sensors P3 and P6 show an overall increasing tendency with wave period, although some fluctuations are present for individual wave heights. This spatially varying response is consistent with the downstream migration of the high-pressure region shown in
Figure 9, indicating that longer period waves tend to shift the dominant impact loading toward the leeward side of the deck.
The largest p*max occurs at P1 under a short-period condition, while relatively large values are also observed at downstream locations for several longer period waves. In particular, P2 and P3 exhibit pronounced increases in p*max at the longer tested periods. These results indicate that significant local slamming loads may occur away from the initial wave–deck contact region and that both the magnitude and location of the peak response depend on the incident wave condition.
The above trends describe the variation in peak impact pressure under the investigated model-scale wave conditions. It should be noted that, although Froude similarity preserves the dominant gravity–inertia balance of the incident waves and large-scale impact flow, Reynolds, Weber, and compressibility-related similarities are not simultaneously preserved between the model and prototype. Consequently, the measured peak pressures and their dependence on air-entrapment behavior should be interpreted as model-scale results and should not be extrapolated directly to prototype conditions using Froude scaling alone [
15].
4.3.3. Velocity Evolution During the Impact Stage
To elucidate the hydrodynamic relationship responsible for the generation of the primary impact load, the representative slamming event is analyzed in detail.
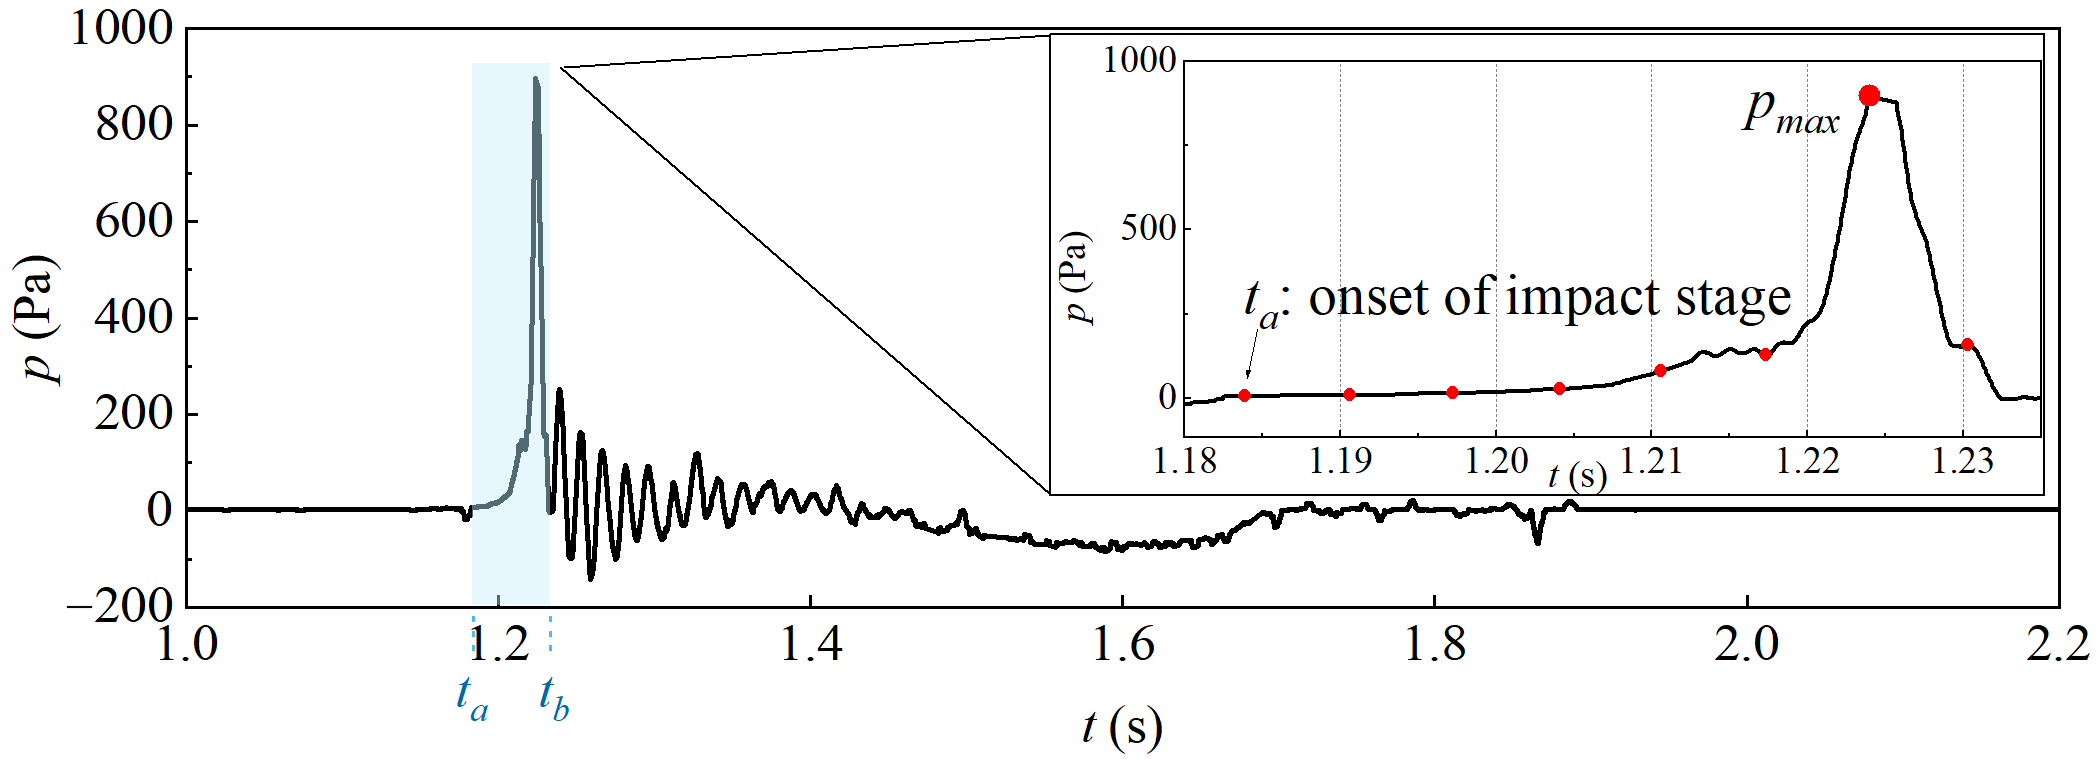
Figure 11 presents the pressure record measured at P1 during the impact stage together with an enlarged view of the impulsive pressure peak. The onset of the impact stage is defined as
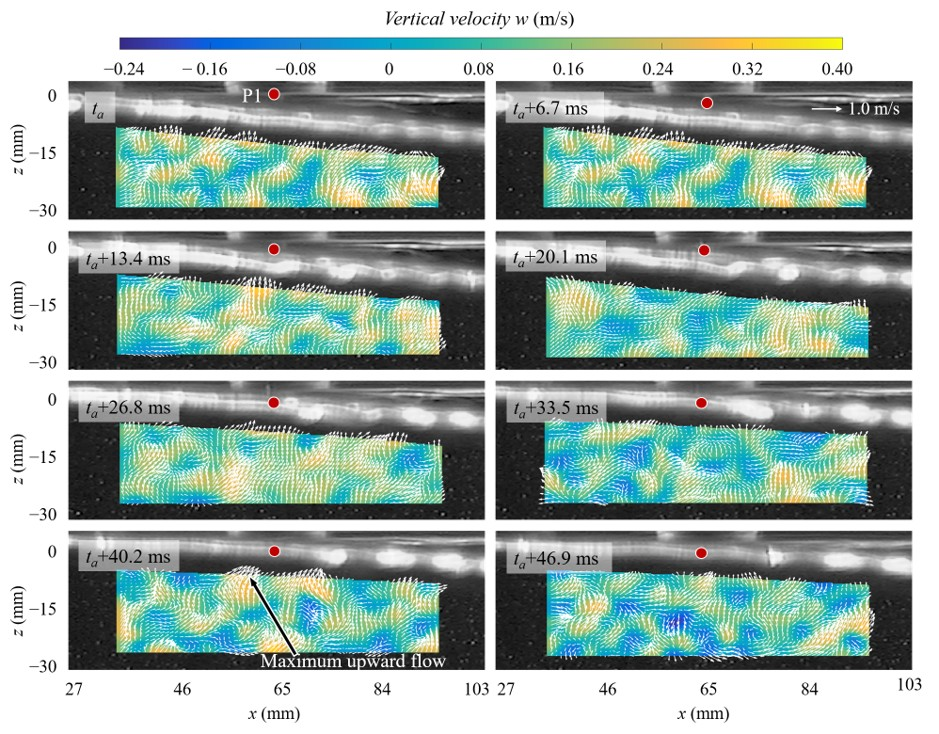
ta, corresponding to the instant when the incident wave first reaches the deck underside. Owing to the highly transient nature of the impact process, eight representative instants at intervals of 6.7 ms are selected for the PIV measurements shown in
Figure 12.
At the onset of impact (
ta), the upward-moving wave crest has just reached the deck underside and the velocity field remains relatively weak. As the water continues to rise, the region of upward flow progressively expands beneath the deck, accompanied by a gradual increase in pressure (
Figure 11). From
ta to
ta + 33.5 ms, the vertical momentum of the water continuously accumulates beneath the deck as the upward flow intensifies and occupies an increasingly larger portion of the measurement region.
The maximum impact pressure is reached at approximately ta + 41.5 ms. At this instant, the strongest upward flow is observed immediately beneath the pressure sensor P1, coinciding with the location of the primary pressure peak. The velocity vectors further show that the upward-moving water is rapidly redirected along the deck underside after impact, producing pronounced lateral flow adjacent to the deck. The close correspondence between the maximum upward flow and the pressure peak indicates that the primary slamming load is generated by the rapid transfer of the vertical momentum of the water to the deck, followed by flow redirection along the solid boundary.
Following the pressure peak, the upward flow weakens rapidly. Although the water continues to move toward the deck at ta + 46.9 ms, both the magnitude and spatial extent of the high-velocity region decrease markedly compared with those at the peak-impact instant. The decay of the upward flow is accompanied by a rapid reduction in pressure, indicating that the impulsive loading diminishes as the accumulated fluid momentum is progressively redistributed beneath the deck.
4.4. Air-Cavity Dynamics During the Oscillation Stage
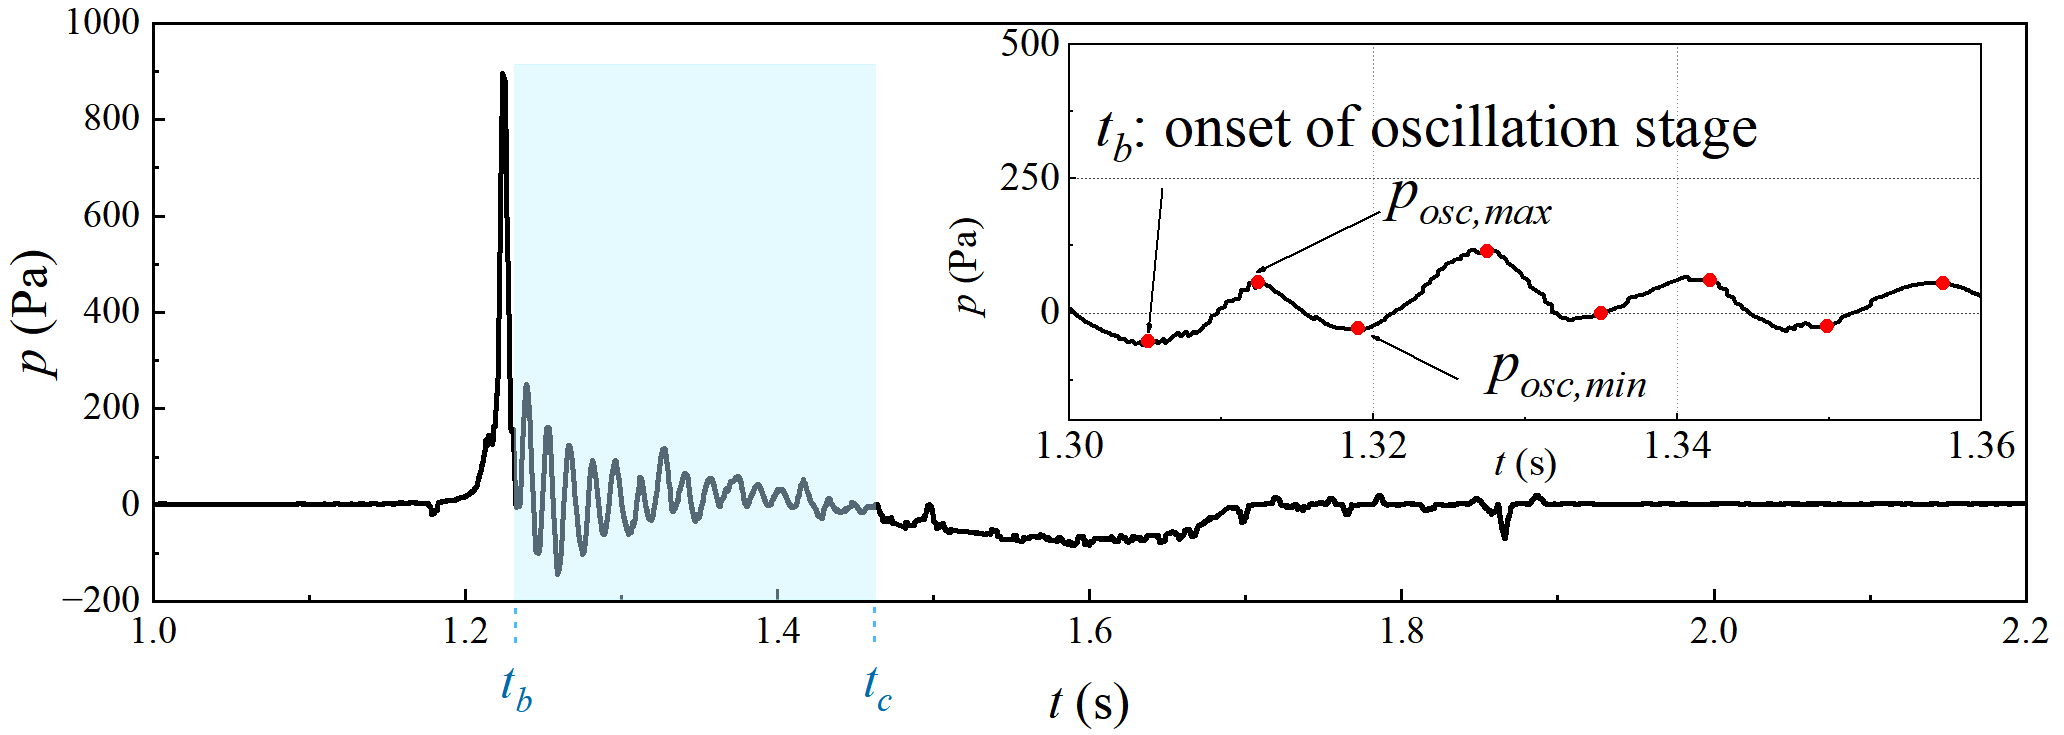
Following the impact stage, the pressure response enters the oscillation stage, during which a series of damped pressure fluctuations develops, as shown in
Figure 13. Unlike the primary impact peak analysis in
Section 4.3, the pressure variations during this stage are no longer governed by the direct transfer of water momentum to the deck underside. Instead, they are closely associated with the repeated compression and expansion of the entrapped air cavity beneath the deck. The pressure records synchronized with BIV measurements therefore provide experimental observations of the coupled evolution of air-cavity dynamics and the associated flow field within the aerated region.
Figure 13 presents the pressure history during the oscillation stage for the representative scenario. The onset of the oscillation stage is defined as
tb, corresponding to the instant immediately following the primary impact peak. Eight representative instants are selected from the oscillatory pressure record for the BIV analysis presented in
Figure 14,
Figure 15 and
Figure 16, allowing the evolution of the velocity field, vorticity and turbulence intensity to be examined throughout one oscillation cycle.
4.4.1. Velocity Evolution During Cavity Oscillation
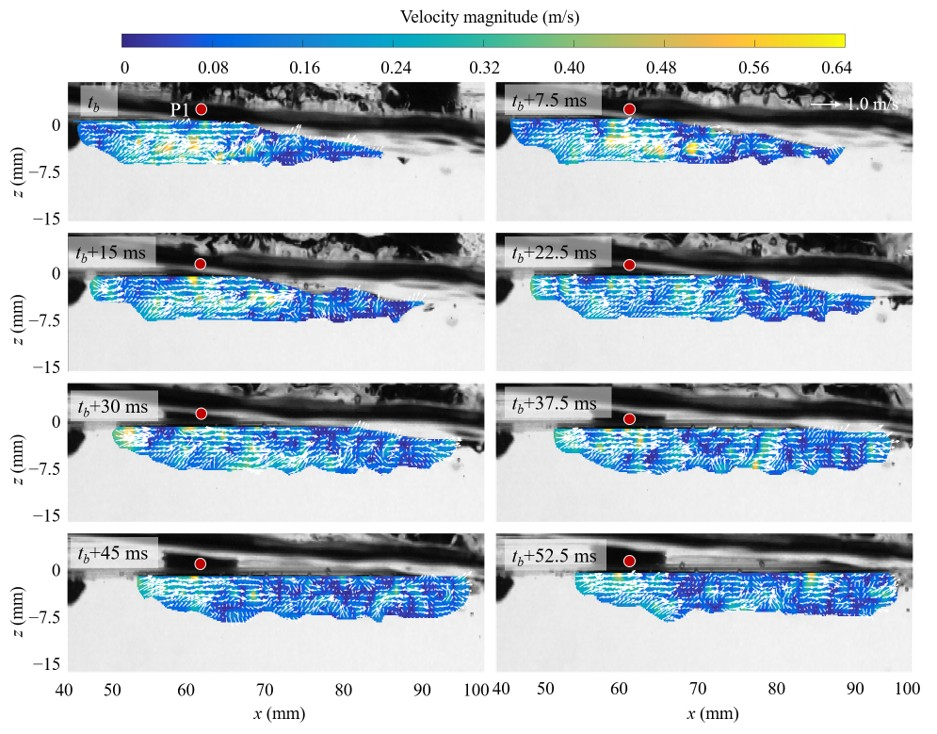
Figure 14 presents the BIV-derived velocity fields during the oscillation stage. Compared with the relatively coherent upward flow observed during the impact stage, the flow within the aerated region exhibits a much more heterogeneous structure accompanied by continuous deformation of the entrapped air cavity. As the cavity repeatedly compresses and expands, the surrounding flow is continuously redistributed, producing alternating regions of flow acceleration and deceleration beneath the deck.
At the beginning of the oscillation stage (
t =
tb), a coherent air cavity has already developed beneath the deck. As the surrounding water continues to move upward, the cavity is compressed and its volume decreases. During this period (
tb to
tb + 15 ms), relatively high velocities are concentrated near the central and downstream portions of the aerated region, indicating intensified fluid motion accompanying cavity compression. Correspondingly, the pressure increases towards a local oscillation peak (
posc,max) in
Figure 13.
Following the compression phase, the surrounding flow gradually weakens and the entrapped air cavity begins to expand. From approximately tb + 22.5 ms to tb + 52.5 ms, the cavity thickness increases while the velocity magnitude within the aerated region decreases progressively. The reduction in flow intensity is accompanied by a gradual decrease in pressure towards the local oscillation minimum (posc,min), indicating that the energy temporarily stored during cavity compression is released back into the surrounding flow as the cavity expands.
Throughout the oscillation stage, the repeated compression and expansion of the entrapped air cavity continuously redistribute the surrounding flow beneath the deck. Unlike the impact stage, where the dominant feature is the rapid upward momentum transfer immediately before impact, the oscillation stage is characterized by repeated exchanges of momentum between the surrounding water and the entrapped air cavity. Consequently, the velocity field no longer exhibits a single dominant upward jet but instead evolves into a highly heterogeneous flow pattern associated with cavity deformation.
4.4.2. Vorticity Dynamics During Cavity Oscillation
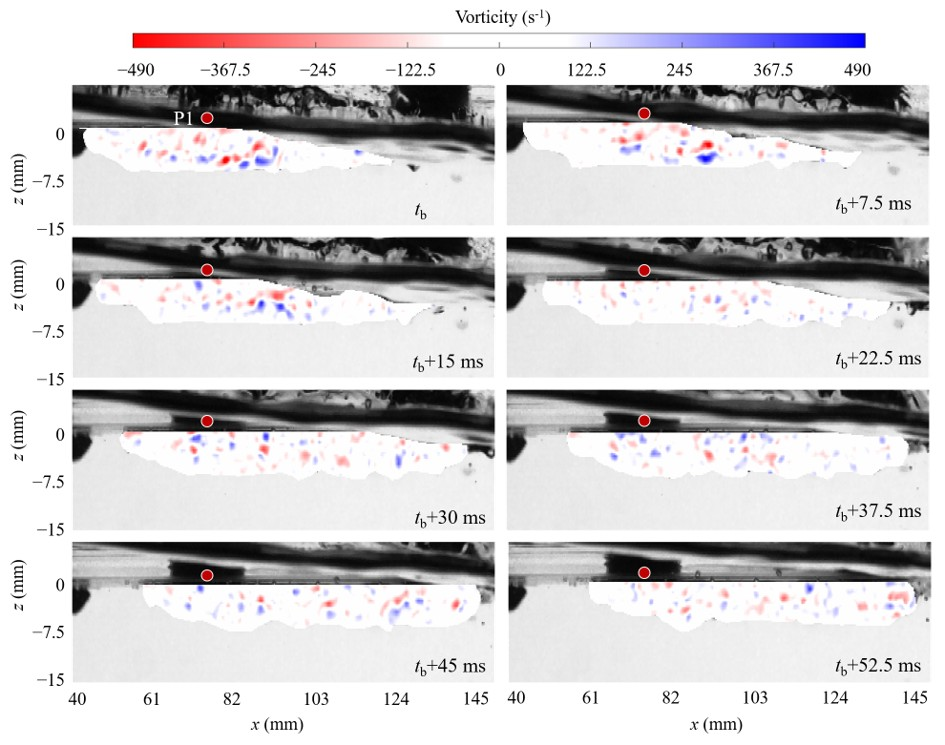
To further elucidate the flow structures generated during cavity oscillation, the instantaneous vorticity fields corresponding to the BIV measurements are presented in
Figure 15. Compared with the impact stage, the oscillation stage is characterized by substantially stronger rotational motion associated with the continuous deformation of the entrapped air cavity.
The instantaneous vorticity varies approximately between −490 and 490 s−1, with peak values nearly 2.5 times larger than those observed during the impact stage. The increase in vorticity indicates that cavity oscillation generates markedly stronger interfacial shear than the initial wave impact. As the entrapped air cavity repeatedly compresses and expands, the surrounding flow undergoes continuous acceleration and deceleration, producing intense velocity gradients along the air–water interface.
At the beginning of the oscillation stage (t = tb), several localized regions of positive and negative vorticity are concentrated near the cavity interface. As cavity deformation progresses, these vortical structures continuously evolve, migrate and interact within the aerated region. Rather than remaining fixed beneath the deck, the vortices are repeatedly stretched, fragmented and redistributed following the oscillatory motion of the cavity. Consequently, the vorticity field becomes increasingly heterogeneous as the oscillation develops.
The most intense vortical activity coincides with the period of strongest cavity deformation, corresponding to the largest pressure oscillations shown in
Figure 13. As the oscillation gradually decays, both the intensity and spatial extent of the high-vorticity regions decrease, indicating a progressive weakening of the interfacial shear generated by cavity motion.
4.4.3. Turbulence Intensity During Cavity Oscillation
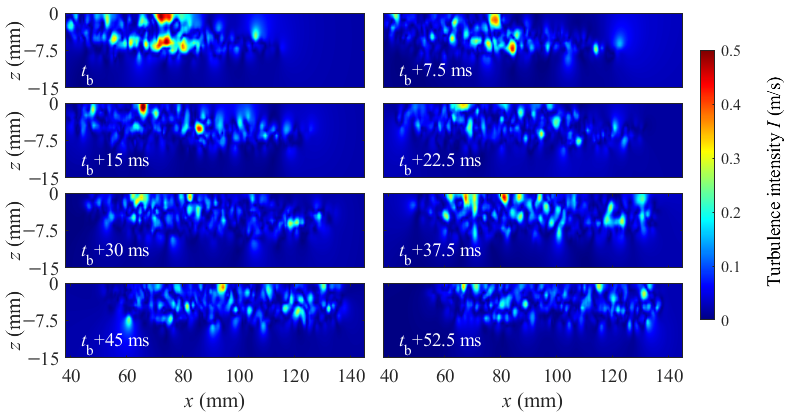
Figure 16 presents the evolution of the turbulence intensity within the aerated region during the oscillation stage. Compared with the relatively uniform flow observed during the impact stage, turbulence becomes increasingly localized and intermittent as the entrapped air cavity repeatedly compresses and expands.
High turbulence intensity is concentrated primarily beneath the deck underside and along the air–water interface, where strong interfacial shear develops during cavity deformation. The maximum turbulence intensity reaches approximately 0.5 m s−1, considerably exceeding that observed during the impact stage. These energetic regions occupy only a limited portion of the aerated region but evolve rapidly throughout the oscillation cycle.
The temporal evolution of turbulence intensity exhibits a clear correspondence with the cavity motion. During cavity compression (tb + 15 ms), the intensified interfacial shear promotes the production of turbulent fluctuations, leading to localized regions of elevated turbulence intensity. As the cavity subsequently expands, the turbulence intensity decreases progressively together with the weakening of the surrounding flow. This repeated increase and decrease in turbulence intensity closely follows the oscillatory behavior of the entrapped air cavity.
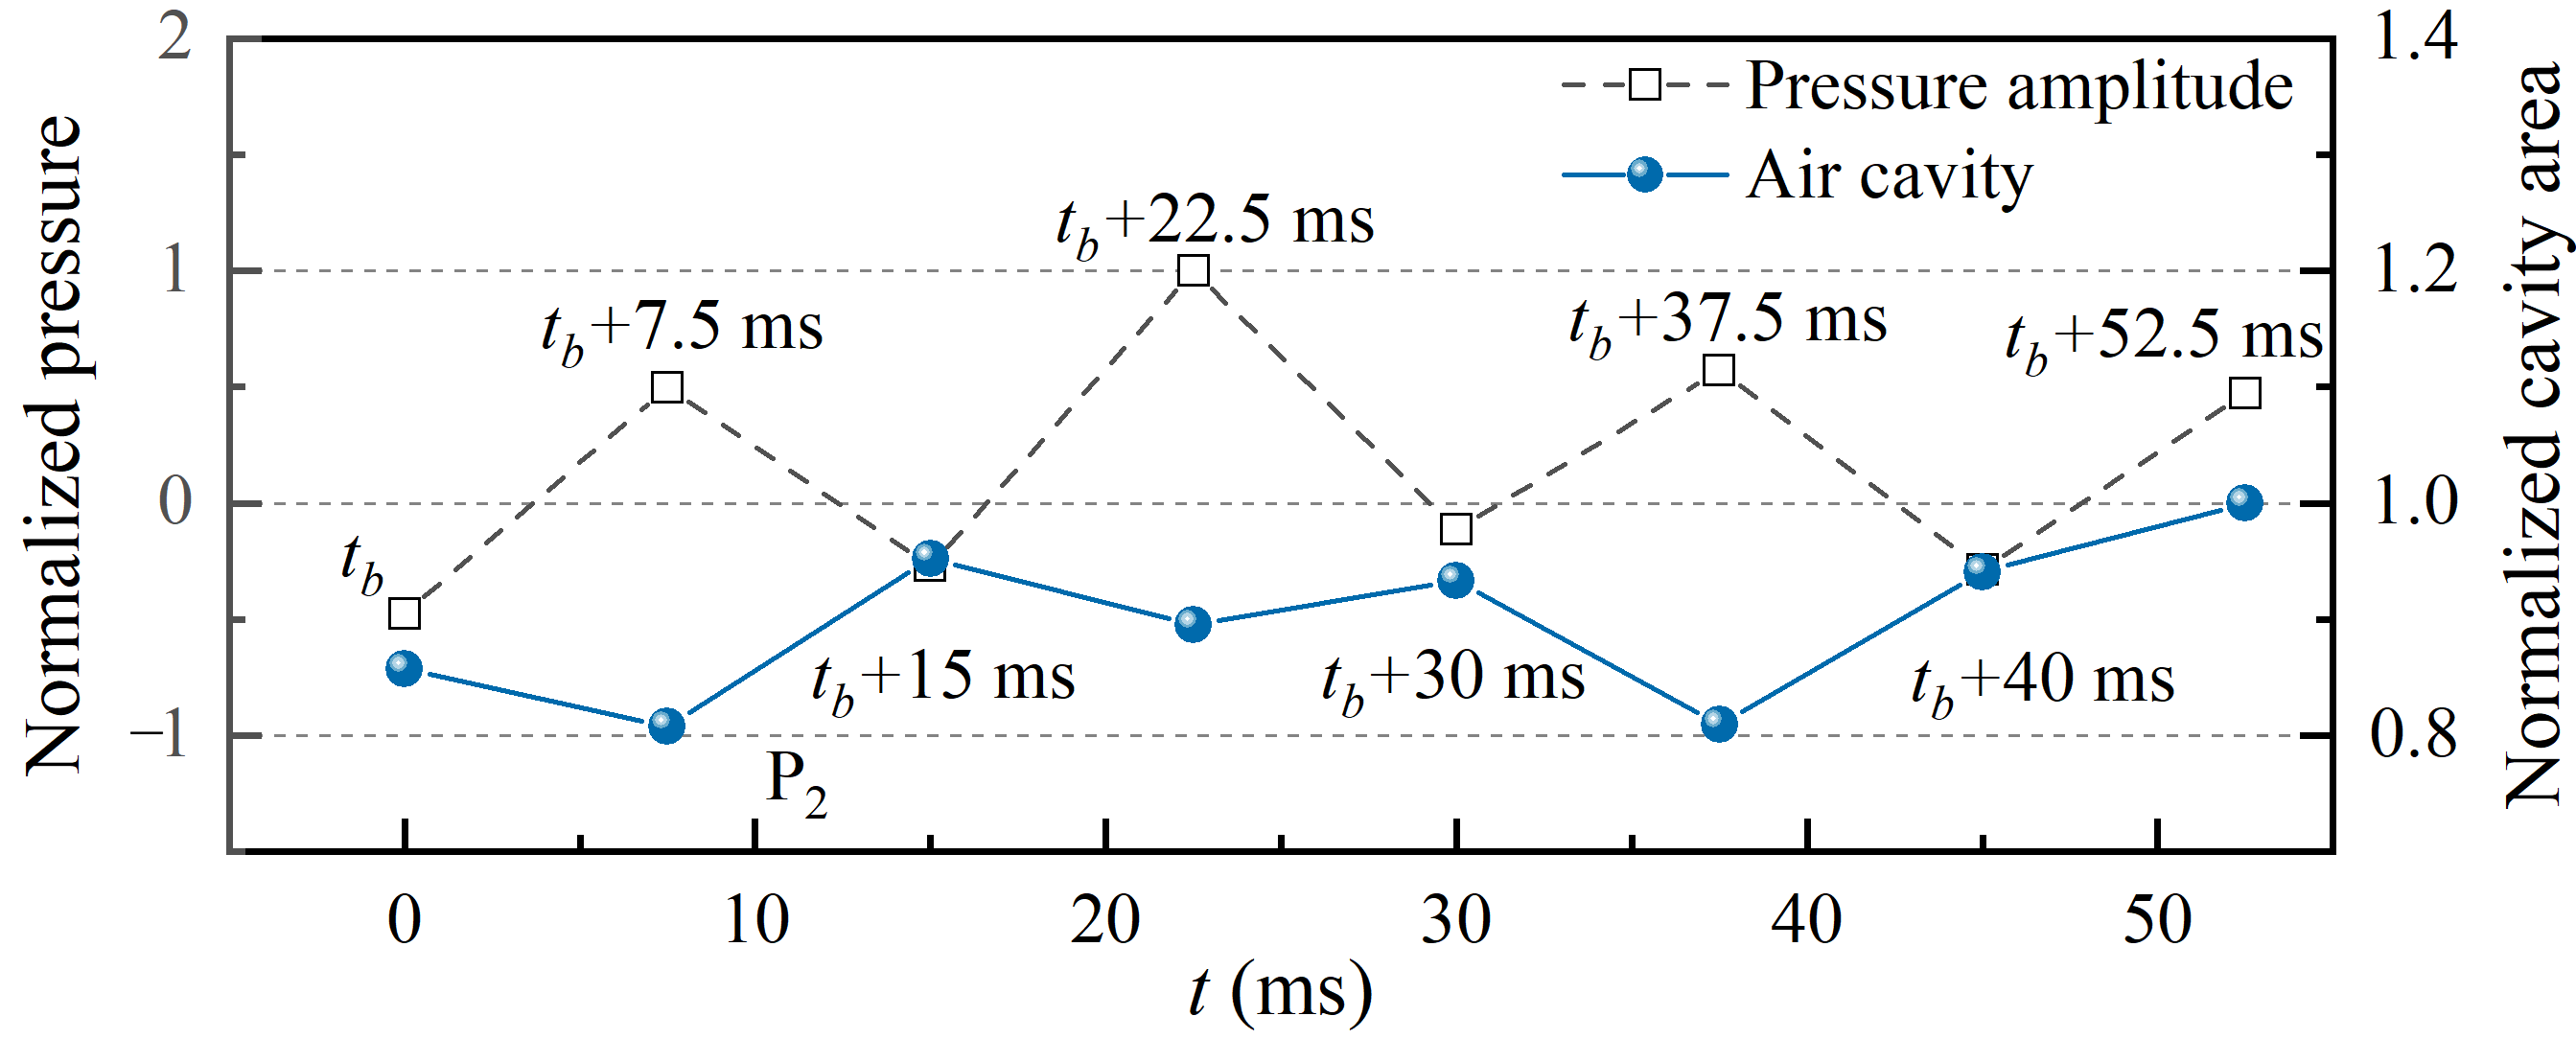
4.4.4. Quantitative Relationship Between Air-Region Variation and Pressure Oscillation
Figure 17 compares
Aair(
t) with the synchronized pressure record during the oscillation stage to further examine the temporal relationship between the air-containing region and the pressure response. The corresponding air-region areas and pressure values at the selected instants are summarized in
Table 2.
During the early oscillation cycles, the air-region ratio and pressure generally exhibit an approximately out-of-phase relationship. From tb to tb + 7.5 ms, Aair decreases while the pressure changes from negative to positive, indicating compression of the entrapped air region. The subsequent increase in Aair at tb + 15 ms is accompanied by a return to negative pressure, corresponding to cavity expansion. A similar alternating behavior is observed between tb + 15 ms and tb + 40 ms: local minima in Aair broadly coincide with positive-pressure states, whereas larger air-region ratios are generally associated with negative-pressure states. Nevertheless, the relationship is not strictly monotonic throughout the entire oscillation stage. At tb + 52.5 ms, for example, the air-region ratio increases while the pressure is again positive, which may be attributed to the inclusion of dispersed bubbles in the identified air-containing area and the local nature of the pressure measurement at P1. Overall, the results indicate that the oscillatory pressure response is closely related to the repeated compression and expansion of the entrapped air region.
4.5. Suction-Stage Flow Characteristics
Following the oscillation stage, the entrapped air cavity has largely collapsed and the flow beneath the deck enters the suction stage [
23]. Unlike the impact and oscillation stages, where the hydrodynamics are governed primarily by momentum transfer and cavity oscillation, respectively, the suction stage is dominated by the downward withdrawal of the water curtain and the progressive development of flow separation beneath the deck.
Figure 18 presents the pressure history measured at P1 during the suction stage for the representative scenario. Compared with the sharp impulsive pressure peak during the impact stage and the rapidly decaying oscillations during the oscillation stage, the suction pressure develops more gradually and persists over a substantially longer period. Eight representative instants are selected from the suction stage to analyze the corresponding velocity and vorticity fields shown in
Figure 19 and
Figure 20.
4.5.1. Velocity Evolution During the Suction Stage
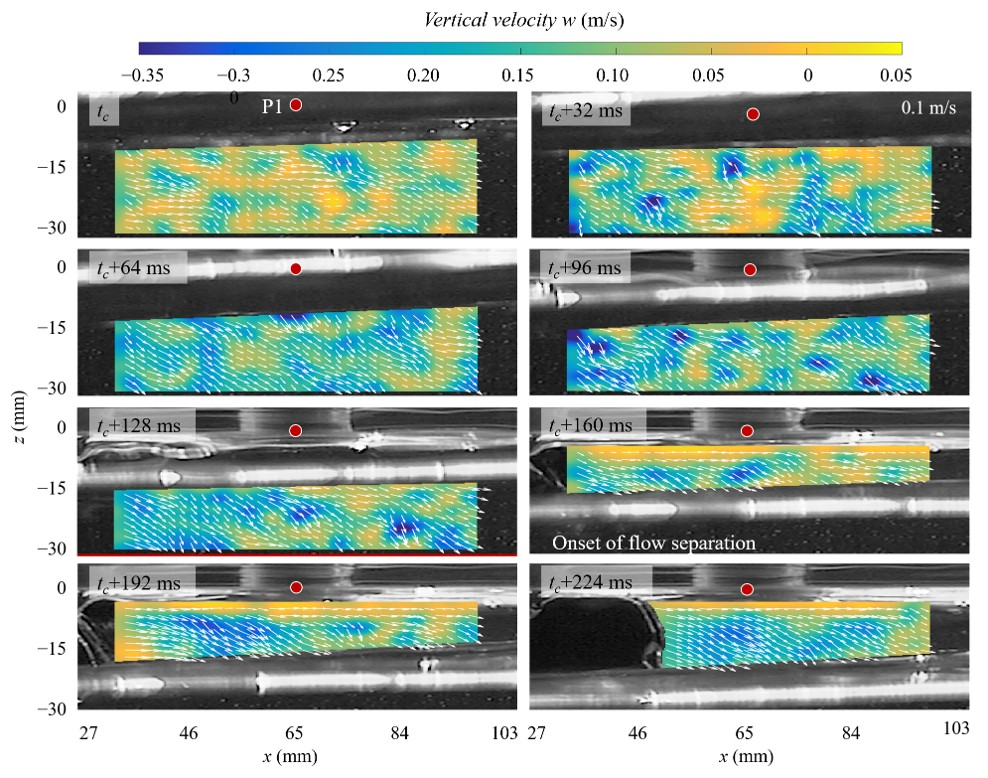
Figure 19 illustrates the evolution of the velocity field during the suction stage. Following cavity collapse, a continuous water curtain remains attached to the deck underside and subsequently withdraws downward under gravity. As the water curtain descends, the wetted area beneath the deck decreases progressively and air gradually re-enters the space beneath the deck from both sides.
At the beginning of the suction stage (
t =
tc), the downward motion is relatively weak and the flow remains attached to most of the deck underside. As water withdrawal continues, the downward velocity increases progressively while the water curtain becomes thinner. The maximum downward flow occurs at approximately
tc + 128 ms, coinciding with the minimum pressure (
pmin) shown in
Figure 18. This close correspondence indicates that the strongest suction develops when the downward momentum of the withdrawing water reaches its maximum.
After the pressure minimum is reached, the water curtain continues to contract and detach from the deck underside. Flow separation first appears near the deck edges (tc + 160 ms) and subsequently expands toward the center of the deck as air progressively replaces the withdrawing water. Consequently, both the downward velocity and the magnitude of the negative pressure decrease gradually until the flow finally returns to a quiescent state.
4.5.2. Vorticity Evolution During the Suction Stage
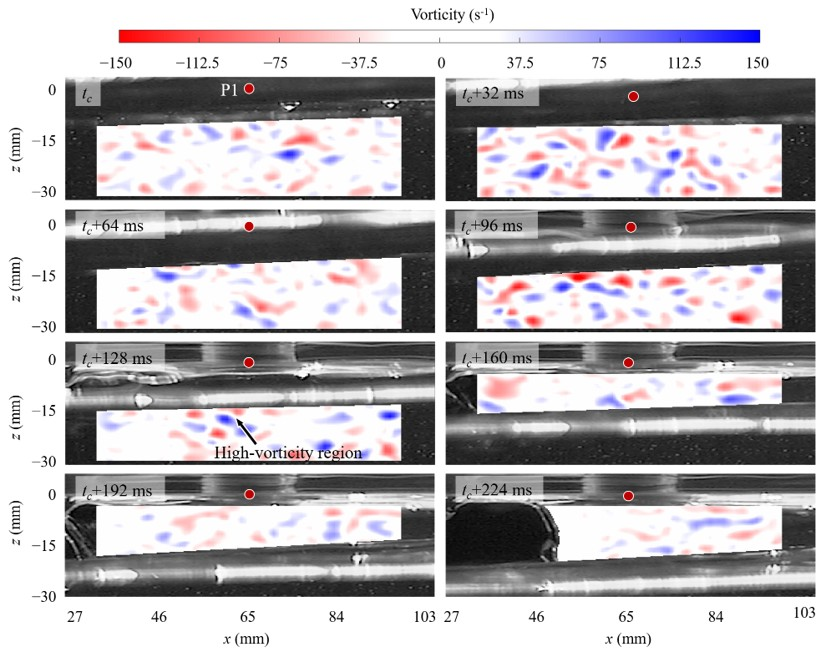
The corresponding instantaneous vorticity fields are presented in
Figure 20 to further examine the evolution of the separated flow beneath the deck. Compared with the oscillation stage, the vorticity field during the suction stage becomes less closely associated with cavity deformation and is instead controlled primarily by the development of flow separation along the water curtain.
At the beginning of the suction stage, localized regions of positive and negative vorticity appear near the edges of the water curtain, indicating the formation of interfacial shear as the attached flow begins to separate from the deck underside. As the water curtain continues to descend, these vortical structures strengthen and gradually propagate toward the central portion of the measurement region. The most intense vorticity occurs at approximately
tc + 128 ms, coinciding with both the maximum downward velocity (
Figure 19) and the minimum pressure (
Figure 18).
Following the onset of large-scale flow separation (tc + 160 ms), the high-vorticity regions gradually weaken as the water curtain contracts and the separated flow dissipates. Eventually, the vortical structures become increasingly diffuse and the flow progressively returns to its pre-impact scenario.
5. Conclusions
This study experimentally investigated wave-in-deck slamming beneath a rigid horizontal deck subjected to regular waves with different incident wave heights and wave periods. Pressure measurements are conducted over 35 wave conditions to examine the variation in slamming loads with incident-wave parameters. By combining pressure-synchronized high-speed imaging with complementary PIV and BIV observations from separate repeated runs, the stage-dependent evolution of the pressure response, free-surface deformation, liquid-phase flow evolution, and air-cavity dynamics are systematically examined under the representative condition.
The results show that the observed wave-in-deck slamming consists of three successive hydrodynamic stages: impact, oscillation, and suction. Depending on the morphology of the entrapped air, three characteristic slamming regimes are identified experimentally, namely large air-pocket impact, small air-pocket impact, and bubble-plume impact. The morphology and evolution of the entrapped air strongly influence both the peak impact pressure and the subsequent oscillatory response. The peak impact pressure exhibits pronounced spatial variability beneath the deck and is governed jointly by the incident wave height, wave period, and impact location. While increasing wave height generally enhances the impact pressure, the influence of wave period is non-monotonic, and the location of the maximum pressure gradually shifts from the upstream side toward the downstream side of the deck as the wave period increases.
The PIV-BIV measurement results demonstrate that the primary impact load is generated by the rapid upward transfer and subsequent redistribution of fluid momentum beneath the deck. The maximum pressure occurs when the upward flow reaches its greatest intensity and is redirected along the deck underside. Following the initial impact, the entrapped air cavity becomes the dominant hydrodynamic feature. Repeated cavity compression and expansion continuously redistribute the surrounding velocity field, enhance interfacial shear, intensify vorticity, and promote localized turbulence within the aerated region, thereby producing the characteristic post-impact pressure oscillations. During the final suction stage, the negative-pressure response is controlled primarily by the downward withdrawal of the water curtain and the progressive development of flow separation beneath the deck.
Overall, the complementary PIV-BIV measurements in this study provide direct experimental observations linking air-cavity dynamics with pressure generation throughout the complete wave-in-deck slamming process. The present results improve the physical understanding of aerated wave-in-deck impacts and provide a valuable experimental dataset for the development and validation of numerical models of wave-impact loading.
Future work should extend the present investigation to more realistic wave, scale, and structural conditions. Experiments under irregular, focused, and breaking waves, together with variations in deck clearance and deck geometry, are needed to assess the generality of the observed relationships between aerated two-phase flow and slamming pressure responses under more realistic sea states. Multi-scale experiments should also be conducted to quantify the influence of Reynolds, Weber, air compressibility, and bubble-scale effects on impact pressures and air-cavity dynamics. In addition, three-dimensional optical measurements and compressible multiphase simulations would help resolve out-of-plane flow, cavity fragmentation, and three-dimensional air-cavity evolution. Flexible deck configurations should further be considered to investigate hydroelastic effects on wave-in-deck slamming and air-entrapment behavior. These developments would support more reliable prediction of wave-impact loading on coastal and offshore deck structures under prototype conditions.
Author Contributions
Conceptualization, T.Z. and Y.Y. (Yu Yao); methodology, T.Z.; software, Y.Y. (Yun Yi); validation, T.Z. and Y.Y. (Yun Yi); formal analysis, Y.Y. (Yu Yao); investigation, Z.M.; resources, Z.M.; data curation, T.Z.; writing—original draft preparation, T.Z.; writing—review and editing, T.Z.; visualization, Y.Y. (Yun Yi); supervision, T.Z.; project administration, T.Z.; funding acquisition, T.Z. All authors have read and agreed to the published version of the manuscript.
Funding
This study is supported financially by the National Natural Science Foundation of China (Grant No. 52401313), the China Postdoctoral Science Foundation (Grant No. 2024M752749), the Postdoctoral Fellowship Program of CPSF (Grant No. GZB20240637), and the National Natural Science Foundation of Hunan Province (Grant No. 2026JJ90009).
Data Availability Statement
The original contributions presented in this study are included in the article. Further inquiries can be directed to the corresponding authors.
Conflicts of Interest
The authors declare no conflict of interest.
References
- Mohapatra, S.C.; Amouzadrad, P.; Bispo, I.B.D.S.; Guedes Soares, C. Hydrodynamic response to current and wind on a large floating interconnected structure. J. Mar. Sci. Eng. 2025, 13, 63. [Google Scholar] [CrossRef]
- Peregrine, D.H. Water-wave impact on walls. Annu. Rev. Fluid Mech. 2003, 35, 23–43. [Google Scholar] [CrossRef]
- Seiffert, B.; Hayatdavoodi, M.; Ertekin, R.C. Experiments and computations of solitary-wave forces on a coastal-bridge deck. Part I: Flat plate. Coast. Eng. 2014, 88, 194–209. [Google Scholar] [CrossRef]
- Abdussamie, N.; Amin, W.; Ojeda, R.; Thomas, G. Vertical wave-in-deck loading and pressure distribution on fixed horizontal decks of offshore platforms. In Proceedings of the 24th International Ocean and Polar Engineering Conference, Busan, Republic of Korea, 15–20 June 2014. [Google Scholar]
- Kaplan, P. Wave impact forces on offshore structures: Re-examination and new interpretations. In Proceedings of the Offshore Technology Conference, Houston, TX, USA, 4–7 May 1992. [Google Scholar]
- Kaplan, P.; Murray, J.J.; Yu, W.C. Theoretical analysis of wave impact forces on platform deck structures. In Proceedings of the Offshore Technology Conference, Houston, TX, USA, 1–4 May 1995. [Google Scholar]
- Baarholm, R.; Faltinsen, O.M. Experimental and theoretical studies of wave impact on an idealized platform deck. In Proceedings of the 4th International Conference on Hydrodynamics, Yokohama, Japan, 7–9 September 2000; pp. 181–186. [Google Scholar]
- Baarholm, R.; Faltinsen, O.M.; Herfjord, K. Water impact on decks of floating platforms. In Proceedings of the 8th International Symposium on Practical Design of Ships and Other Floating Structures, Shanghai, China, 16–21 September 2001; pp. 621–627. [Google Scholar]
- Bullock, G.N.; Obhrai, C.; Peregrine, D.H.; Bredmose, H. Violent breaking wave impacts. Part 1: Results from large-scale regular wave tests on vertical and sloping walls. Coast. Eng. 2007, 54, 602–617. [Google Scholar] [CrossRef]
- Bullock, G.N.; Bredmose, H. Violent breaking-wave impacts. Part 4: A detailed analysis and comparison of field and 1:4 scale measurements on sloping and vertical walls including the influence of air and scale effects. Coast. Eng. 2024, 191, 104520. [Google Scholar] [CrossRef]
- Lugni, C.; Miozzi, M.; Brocchini, M.; Faltinsen, O.M. Evolution of the air cavity during a depressurized wave impact. I. The kinematic flow field. Phys. Fluids 2010, 22, 056101. [Google Scholar] [CrossRef]
- Hayatdavoodi, M.; Seiffert, B.; Ertekin, R.C. Experiments and computations of solitary-wave forces on a coastal-bridge deck. Part II: Deck with girders. Coast. Eng. 2014, 88, 210–228. [Google Scholar] [CrossRef]
- Cuomo, G.; Shimosako, K.; Takahashi, S. Wave-in-deck loads on coastal bridges and the role of air. Coast. Eng. 2009, 56, 793–809. [Google Scholar] [CrossRef]
- Bredmose, H.; Peregrine, D.H.; Bullock, G.N. Violent breaking wave impacts. Part 2: Modelling the effect of air. J. Fluid Mech. 2009, 641, 389–430. [Google Scholar] [CrossRef]
- Bredmose, H.; Bullock, G.N.; Hogg, A.J. Violent breaking wave impacts. Part 3. Effects of scale and aeration. J. Fluid Mech. 2015, 765, 82–113. [Google Scholar] [CrossRef]
- Huera-Huarte, F.J.; Jeon, D.; Gharib, M. Experimental investigation of water slamming loads on panels. Ocean Eng. 2011, 38, 1347–1355. [Google Scholar] [CrossRef]
- Seiffert, B.R.; Ertekin, R.C.; Robertson, I.N. Wave loads on a coastal bridge deck and the role of entrapped air. Appl. Ocean Res. 2015, 53, 91–106. [Google Scholar] [CrossRef]
- Ma, Z.H.; Causon, D.M.; Qian, L.; Mingham, C.G.; Martinez Ferrer, P. Numerical investigation of air enclosed wave impacts in a depressurised tank. Ocean Eng. 2016, 123, 15–27. [Google Scholar] [CrossRef]
- Lugni, C.; Brocchini, M.; Faltinsen, O.M. Evolution of the air cavity during a depressurized wave impact. II. The dynamic field. Phys. Fluids 2010, 22, 056102. [Google Scholar] [CrossRef]
- Zhou, T.; Ma, Z.; Zhai, G.J.; Chen, J.J. Wave-in-deck loads induced by regular wave impact: The role of compressible air entrainment. J. Fluids Struct. 2023, 122, 103974. [Google Scholar] [CrossRef]
- Zhou, T.; Ma, Z.; Chen, J.; Zhai, G. Multiscale air entrainment in wave-in-deck loads. Coast. Eng. 2024, 188, 104431. [Google Scholar] [CrossRef]
- Willmott, C.J. On the validation of models. Phys. Geogr. 1981, 2, 184–194. [Google Scholar] [CrossRef]
- Sun, P.; Luo, M.; Le Touze, D.; Zhang, A. The suction effect during freak wave slamming on a fixed platform deck: Smoothed particle hydrodynamics simulation and experimental study. Phys. Fluids 2019, 31, 117108. [Google Scholar] [CrossRef]
Figure 1.
Schematic of the experimental setup showing (a) the plan view and (b) the side view of the wave flume, including the deck model, wave gauges (G1–G6), and pressure transducers (P1–P6).
Figure 1.
Schematic of the experimental setup showing (a) the plan view and (b) the side view of the wave flume, including the deck model, wave gauges (G1–G6), and pressure transducers (P1–P6).
Figure 2.
Experimental arrangement of the PIV system: (a) schematic layout of the laser-sheet illumination and imaging configuration; and (b) photograph of the experimental setup.
Figure 2.
Experimental arrangement of the PIV system: (a) schematic layout of the laser-sheet illumination and imaging configuration; and (b) photograph of the experimental setup.
Figure 3.
Experimental arrangement of the BIV system: (a) schematic layout of the backlight illumination and imaging configuration; (b) imaging geometry of the shadowgraph measurement beneath the deck.
Figure 3.
Experimental arrangement of the BIV system: (a) schematic layout of the backlight illumination and imaging configuration; (b) imaging geometry of the shadowgraph measurement beneath the deck.
Figure 4.
Repeatability of slamming pressure measurements under the representative regular wave scenario (H = 0.04 m, T = 1.06 s): (a) repeated pressure histories measured at P1; (b) enlarged view of the primary impact peak; and (c) coefficients of variation (COVs) of the maximum positive pressure pmax, minimum negative pressure pmin, and positive pressure impulse I+.
Figure 4.
Repeatability of slamming pressure measurements under the representative regular wave scenario (H = 0.04 m, T = 1.06 s): (a) repeated pressure histories measured at P1; (b) enlarged view of the primary impact peak; and (c) coefficients of variation (COVs) of the maximum positive pressure pmax, minimum negative pressure pmin, and positive pressure impulse I+.
Figure 5.
Validation of generated regular waves under empty-flume scenarios. The normalized free-surface elevations η/A measured at G4 are compared with the corresponding second-order Stokes wave solutions. The skill score is shown in each subplot.
Figure 5.
Validation of generated regular waves under empty-flume scenarios. The normalized free-surface elevations η/A measured at G4 are compared with the corresponding second-order Stokes wave solutions. The skill score is shown in each subplot.
Figure 6.
Representative free-surface evolution beneath the deck during one wave-in-deck slamming event. The selected instants correspond to the pressure record shown in
Figure 7.
Figure 6.
Representative free-surface evolution beneath the deck during one wave-in-deck slamming event. The selected instants correspond to the pressure record shown in
Figure 7.
Figure 7.
Representative pressure record measured at P1 during one wave-in-deck slamming event. The dashed red line denotes the zero-pressure reference, and the three slamming stages are identified according to the synchronized free-surface evolution shown in
Figure 6.
Figure 7.
Representative pressure record measured at P1 during one wave-in-deck slamming event. The dashed red line denotes the zero-pressure reference, and the three slamming stages are identified according to the synchronized free-surface evolution shown in
Figure 6.
Figure 8.
Representative pressure responses corresponding to three typical air-entrapment morphologies: (a,d) large air cavity, (b,e) small air cavity, and (c,f) bubble-plume. The dashed red lines indicate the instantaneous air–water interface beneath the deck.
Figure 8.
Representative pressure responses corresponding to three typical air-entrapment morphologies: (a,d) large air cavity, (b,e) small air cavity, and (c,f) bubble-plume. The dashed red lines indicate the instantaneous air–water interface beneath the deck.
Figure 9.
Reconstructed spatial distributions of the nondimensional peak impact pressure p*max = pmax/(ρgH) beneath the deck for different incident wave periods at H = 0.04 m. Measurements from one half of the deck underside are interpolated and mirrored across the longitudinal centerline based on nominal symmetry.
Figure 9.
Reconstructed spatial distributions of the nondimensional peak impact pressure p*max = pmax/(ρgH) beneath the deck for different incident wave periods at H = 0.04 m. Measurements from one half of the deck underside are interpolated and mirrored across the longitudinal centerline based on nominal symmetry.
Figure 10.
Nondimensional peak impact pressure
p*
max =
pmax/(
ρgH) at the six pressure sensors as a function of incident wave period for different incident wave heights. The maximum relative deviation among repeated measurements is less than 8%. The positions of pressure transducers P1–P6 are illustrated in
Figure 1.
Figure 10.
Nondimensional peak impact pressure
p*
max =
pmax/(
ρgH) at the six pressure sensors as a function of incident wave period for different incident wave heights. The maximum relative deviation among repeated measurements is less than 8%. The positions of pressure transducers P1–P6 are illustrated in
Figure 1.
Figure 11.
Pressure history measured at P1 during the impact stage for the representative scenario (
H = 0.04 m,
T = 1.06 s). The shaded region denotes the impact stage, and the red markers indicate the instants corresponding to the PIV measurements presented in
Figure 12.
Figure 11.
Pressure history measured at P1 during the impact stage for the representative scenario (
H = 0.04 m,
T = 1.06 s). The shaded region denotes the impact stage, and the red markers indicate the instants corresponding to the PIV measurements presented in
Figure 12.
Figure 12.
Evolution of the velocity field beneath the deck during the impact stage for the representative scenario (H = 0.04 m, T = 1.06 s). Velocity vectors represent the instantaneous flow field, while the contours show the vertical velocity component (w). The red dot indicates the location of pressure sensor P1.
Figure 12.
Evolution of the velocity field beneath the deck during the impact stage for the representative scenario (H = 0.04 m, T = 1.06 s). Velocity vectors represent the instantaneous flow field, while the contours show the vertical velocity component (w). The red dot indicates the location of pressure sensor P1.
Figure 13.
Pressure history at P1 during the oscillation stage for the representative scenario (
H = 0.04 m and
T = 1.06 s). The shaded region denotes the oscillation stage, and the red markers indicate the instants corresponding to the BIV measurements presented in
Figure 14,
Figure 15 and
Figure 16.
Figure 13.
Pressure history at P1 during the oscillation stage for the representative scenario (
H = 0.04 m and
T = 1.06 s). The shaded region denotes the oscillation stage, and the red markers indicate the instants corresponding to the BIV measurements presented in
Figure 14,
Figure 15 and
Figure 16.
Figure 14.
Evolution of the BIV-derived velocity field during the oscillation stage for the representative scenario (H = 0.04 m, T = 1.06 s). Velocity vectors represent the instantaneous flow field, while the contours denote the velocity magnitude. The red dot indicates the location of pressure sensor P1.
Figure 14.
Evolution of the BIV-derived velocity field during the oscillation stage for the representative scenario (H = 0.04 m, T = 1.06 s). Velocity vectors represent the instantaneous flow field, while the contours denote the velocity magnitude. The red dot indicates the location of pressure sensor P1.
Figure 15.
Evolution of the instantaneous vorticity field within the aerated region during the oscillation stage for the representative scenario (H = 0.04 m, T = 1.06 s). Positive and negative vorticity indicate counter-rotating vortical structures generated by cavity oscillation. The red dot denotes the location of pressure sensor P1.
Figure 15.
Evolution of the instantaneous vorticity field within the aerated region during the oscillation stage for the representative scenario (H = 0.04 m, T = 1.06 s). Positive and negative vorticity indicate counter-rotating vortical structures generated by cavity oscillation. The red dot denotes the location of pressure sensor P1.
Figure 16.
Evolution of the turbulence intensity within the aerated region during the oscillation stage for the representative scenario (H = 0.04 m, T = 1.06 s).
Figure 16.
Evolution of the turbulence intensity within the aerated region during the oscillation stage for the representative scenario (H = 0.04 m, T = 1.06 s).
Figure 17.
Evolution of the oscillating pressure and air-region area Aair(t) during the oscillation stage for the representative scenario (H = 0.04 m, T = 1.06 s).
Figure 17.
Evolution of the oscillating pressure and air-region area Aair(t) during the oscillation stage for the representative scenario (H = 0.04 m, T = 1.06 s).
Figure 18.
Pressure history measured at P1 during the suction stage for the representative scenario (
H = 0.04 m and
T = 1.06 s). The shaded region denotes the suction stage, and the red markers indicate the instants corresponding to the PIV analysis presented in
Figure 19 and
Figure 20.
Figure 18.
Pressure history measured at P1 during the suction stage for the representative scenario (
H = 0.04 m and
T = 1.06 s). The shaded region denotes the suction stage, and the red markers indicate the instants corresponding to the PIV analysis presented in
Figure 19 and
Figure 20.
Figure 19.
Evolution of the velocity field during the suction stage for the representative scenario (H = 0.04 m, T = 1.06 s). Velocity vectors represent the instantaneous flow field, while the contours denote the vertical velocity component (w). The red dot indicates the location of pressure sensor P1.
Figure 19.
Evolution of the velocity field during the suction stage for the representative scenario (H = 0.04 m, T = 1.06 s). Velocity vectors represent the instantaneous flow field, while the contours denote the vertical velocity component (w). The red dot indicates the location of pressure sensor P1.
Figure 20.
Evolution of the instantaneous vorticity field during the suction stage for the representative scenario (H = 0.04 m, T = 1.06 s). The red dot indicates the location of pressure sensor P1.
Figure 20.
Evolution of the instantaneous vorticity field during the suction stage for the representative scenario (H = 0.04 m, T = 1.06 s). The red dot indicates the location of pressure sensor P1.
Table 1.
Experimental wave scenarios considered in the present study.
Table 1.
Experimental wave scenarios considered in the present study.
| Parameter | Values |
|---|
| Wave height, H (m) | 0.03, 0.04, 0.05, 0.06, 0.07 |
| Wave period, T (s) | 0.99, 1.06, 1.13, 1.20, 1.27, 1.34, 1.41 |
| Total number of scenarios | 35 |
Table 2.
Temporal correspondence between air-cavity area and impact pressure during the slamming event.
Table 2.
Temporal correspondence between air-cavity area and impact pressure during the slamming event.
| Time | Air-Cavity Area (mm2) | Pressure at P1 (Pa) |
|---|
| tb | 346.15 | −55.28 |
| tb + 7.5 ms | 326.35 | 58.01 |
| tb + 15 ms | 384.62 | −31.29 |
| tb + 22.5 ms | 361.54 | 116.55 |
| tb + 30 ms | 376.92 | −13.26 |
| tb + 37.5 ms | 326.92 | 66.87 |
| tb + 45 ms | 380 | −33.4 |
| tb + 52.5 ms | 403.85 | 55.29 |
| Disclaimer/Publisher’s Note: The statements, opinions and data contained in all publications are solely those of the individual author(s) and contributor(s) and not of MDPI and/or the editor(s). MDPI and/or the editor(s) disclaim responsibility for any injury to people or property resulting from any ideas, methods, instructions or products referred to in the content. |