1. Introduction
Modern coastal science places considerable emphasis on coastal systems [
1,
2,
3,
4], whose evolution is governed by the interaction of geological and hydrological processes under various geomorphological settings. In some coastal environments, biotic components play a significant role in landscape development, and such environments are therefore considered biogeomorphological systems [
5,
6,
7,
8,
9]. Within these systems, vegetation and other biogenic components act not only as elements of the ecosystem but also as active geomorphic and sedimentary agents capable of significantly influencing sediment transport, deposition and redistribution processes, as well as the morphodynamics of the coastal zone.
Among coastal systems whose evolution is controlled by emergent aquatic vegetation, a distinct genetic type of coast, referred to as the phytogenic shore, has been recognized [
4,
10,
11]. At the global scale, phytogenic shores are represented by mangrove, salt-marsh and reed-dominated coastal systems.
The formation and evolution of phytogenic shores are controlled by the coupled interaction of biotic and abiotic processes. By modifying local hydrodynamic conditions, vegetation promotes the trapping and retention of predominantly fine-grained sediments within plant communities. The rate of sediment accumulation depends on hydrodynamic forcing, suspended sediment concentration and vegetation density. Progressive sediment deposition leads to gradual surface accretion, reduction in flooding duration and further expansion of vegetation, thereby establishing a positive biogeomorphic feedback that enhances morphodynamic stability and promotes shoreline progradation [
6,
8,
9,
12].
In tropical regions, phytogenic shores are represented predominantly by mangrove systems developing along tidal coasts, estuaries and deltas under conditions of high biological productivity and abundant sediment supply [
5,
13]. In temperate regions, salt marsh and reed-dominated shores prevail and are mainly associated with lagoons, river-mouth and estuarine systems characterized by shallow waters and low hydrodynamic energy [
14]. Reed-dominated phytogenic shores are widely distributed along the coasts of Eurasian microtidal inland seas, including the Black Sea, Azov Sea and Baltic Sea.
In the northwestern Black Sea region, reed-dominated phytogenic shores are widely distributed within the Dniprovsko–Buzky Liman and adjacent shallow semi-enclosed embayments affected by anthropogenic freshening, including the Tendrovsky, Dzharylgachsky, Perekopsky and Karkinitsky bays. The largest of these systems is the Dniprovsko–Buzky Liman, which represents a typical microtidal river-mouth system with extensive reed vegetation and morphodynamic characteristics common to analogous phytogenic shores of Eurasian inland seas. These coastal systems are characterized by pronounced seasonal and interannual variability expressed in changes in morphometric parameters and partial destruction and subsequent recovery of vegetation cover. Consequently, the evolution of reed-dominated phytogenic shores is highly dynamic and cannot be described as a process of continuous linear progradation.
Despite their wide distribution and distinctive geomorphological characteristics, reed-dominated phytogenic shores of inland seas remain poorly investigated. In particular, information on their morphodynamics, spatial organization, long-term changes in the position of the external vegetation boundary, and patterns of surface accretion is still very limited. Despite its large size and extensive development of phytogenic shores, the Dniprovsko–Buzky Liman has received little attention in this respect.
This knowledge gap has become particularly important following the catastrophic events of 2023 associated with the destruction of the Kakhovka Dam [
15], which resulted in a rapid reorganization of the hydrological regime, changes in sediment budget and sediment transport pathways, and substantial modification of coastal processes within the Dniprovsko–Buzky Liman. These events created unique conditions for investigating the morphodynamic response of reed-dominated phytogenic shores to rapid changes in both natural and anthropogenic forcing factors.
In this context, the aim of the present study is to investigate the morphodynamic development of reed-dominated phytogenic shores of the Dniprovsko–Buzky Liman based on an integrated analysis of satellite data and field observations.
The objectives of this study are as follows:
- (1)
to develop a methodological approach for remote sensing investigation of phytogenic shores and to determine the principal morphological characteristics of this type of coastal system;
- (2)
to analyze the spatial distribution and internal structure of phytogenic shores within the Dniprovsko–Buzky Liman;
- (3)
to assess long-term changes in the position of the external vegetation boundary as an indicator of progradational and retrogradational trends in phytogenic shore development;
- (4)
to identify changes in substrate moisture conditions and evaluate their potential relationship with long-term development trends of the depositional substrate;
- (5)
to determine the principal morphodynamic characteristics of reed-dominated phytogenic shores within the largest liman of the northwestern Black Sea region.
2. Study Area
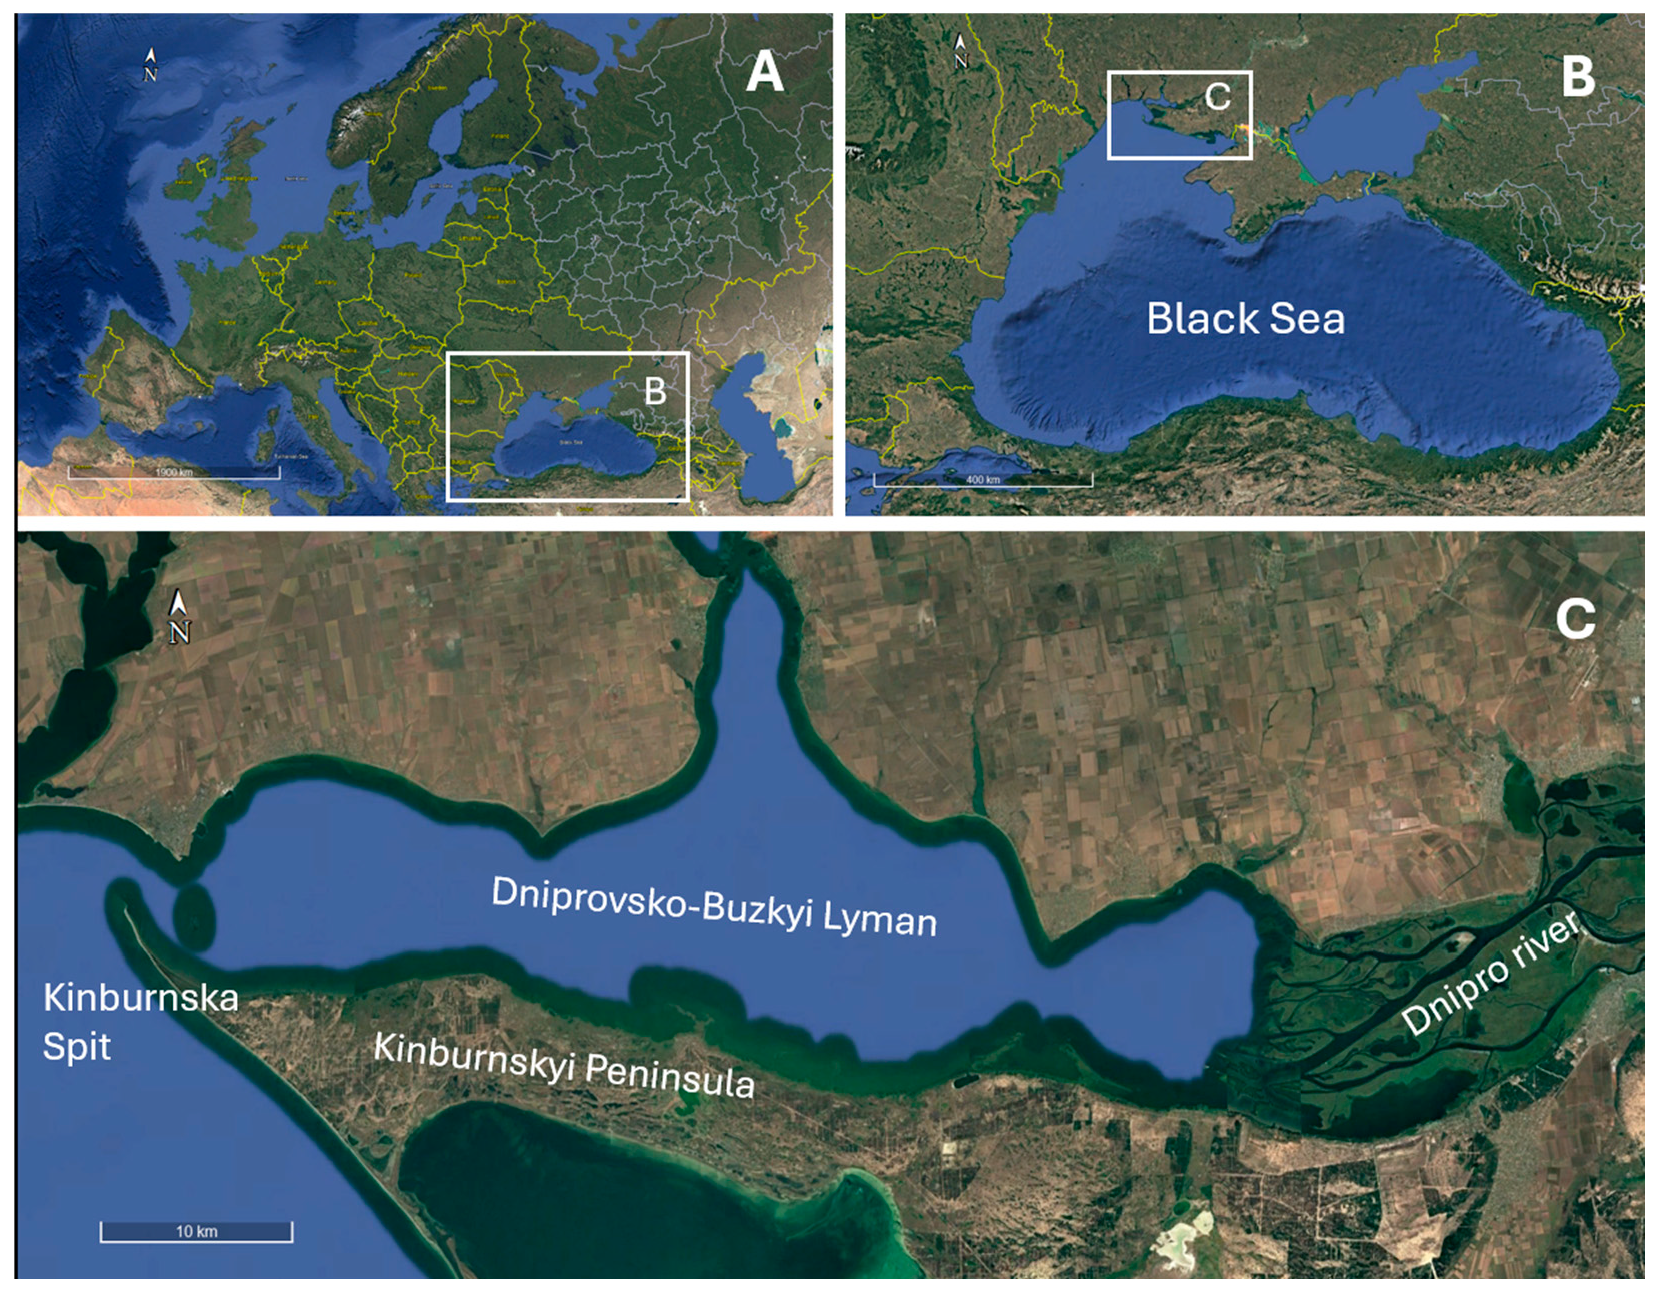
The Dniprovsko–Buzky Liman is a large water body forming part of the river-mouth area of the Dnipro and Pivdennyi Buh rivers, located in the northwestern Black Sea region (
Figure 1B) [
16,
17,
18]. The liman is bounded by a mainland erosional coast to the north, the mouth of the Dnipro River to the east, the low-lying accumulative surface of the Kinburn Peninsula to the south, and the Kinburn Spit to the west (
Figure 1C). The liman is connected to the Black Sea through the Kinburn Strait, which is approximately 3.6 km wide [
19].
The surface area of the liman, calculated from satellite data for 2025, is approximately 695 km
2 [
18]. The Dniprovsko–Buzky Liman has an elongated shape and a predominantly latitudinal orientation. Its length, measured from the islands located at the mouth of the Dnipro River (46°30′33.57″ N; 32°17′13.74″ E) to the Kinburn Strait (46°35′26.43″ N; 31°31′44.24″ E), is approximately 55 km, while its width varies from 5 to 16 km [
17,
20,
21]. The Buzky Liman, representing the river-mouth area of the Pivdennyi Buh River, enters the central part of the Dniprovsko–Buzky Liman from the north. The boundary between the two limans is considered arbitrary and is conventionally drawn along the latitude of Cape Saken (46°39′29.63″ N; 31°54′14.50″ E) (
Figure 1C).
The location of the Dniprovsko–Buzky Liman is controlled by the fault-related block structure of the crystalline basement of the western Black Sea Lowland [
22,
23,
24]. The present-day tectonic movements along the northern and southern coasts exhibit opposite trends, which have contributed to the development of the asymmetric valley of the lower Dnipro River.
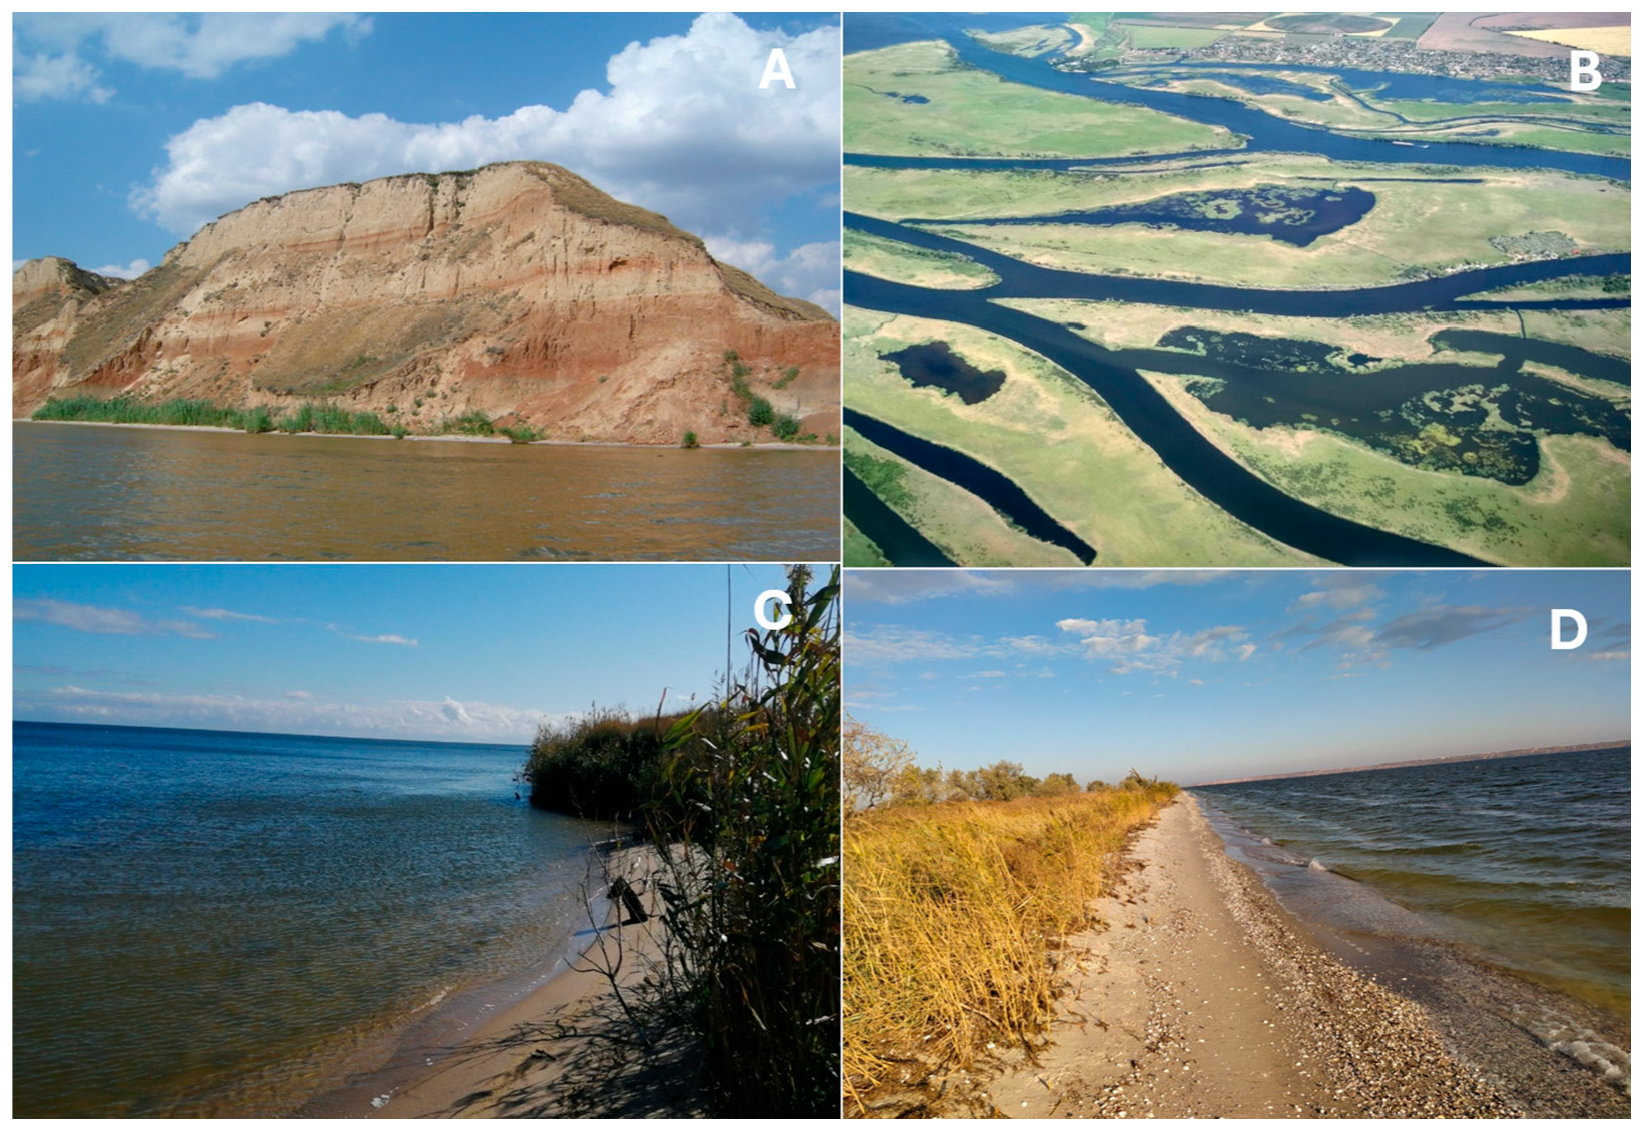
The asymmetric morphology of the lower Dnipro valley has resulted in pronounced differences in the geomorphological structure of the coasts of the Dniprovsko–Buzky Liman. The northern coast is represented by an elevated coastal plain bordered by erosional cliffs reaching heights of up to 41 m above sea level and composed predominantly of loess and clay deposits [
25] (
Figure 2A).
In contrast, the southern as well as the eastern and western margins of the liman are associated with low-lying accumulative surfaces composed predominantly of sandy, shell-rich and silty deposits [
26,
27] (
Figure 2B–D). As a result, erosional coasts prevail along the northern margin, whereas the lowlands of the eastern, southern and western sectors are characterized by the widespread occurrence of accumulative and phytogenic shores.
The liman occupies a drowned river valley of erosional–abrasional origin [
21]. Mean water depths range from 6 to 7 m, while the maximum depth reaches approximately 12 m within the Stanislav Depression. A polygenetic shallow-water zone extends along the coastline and has developed through the combined action of erosional and depositional processes [
23].
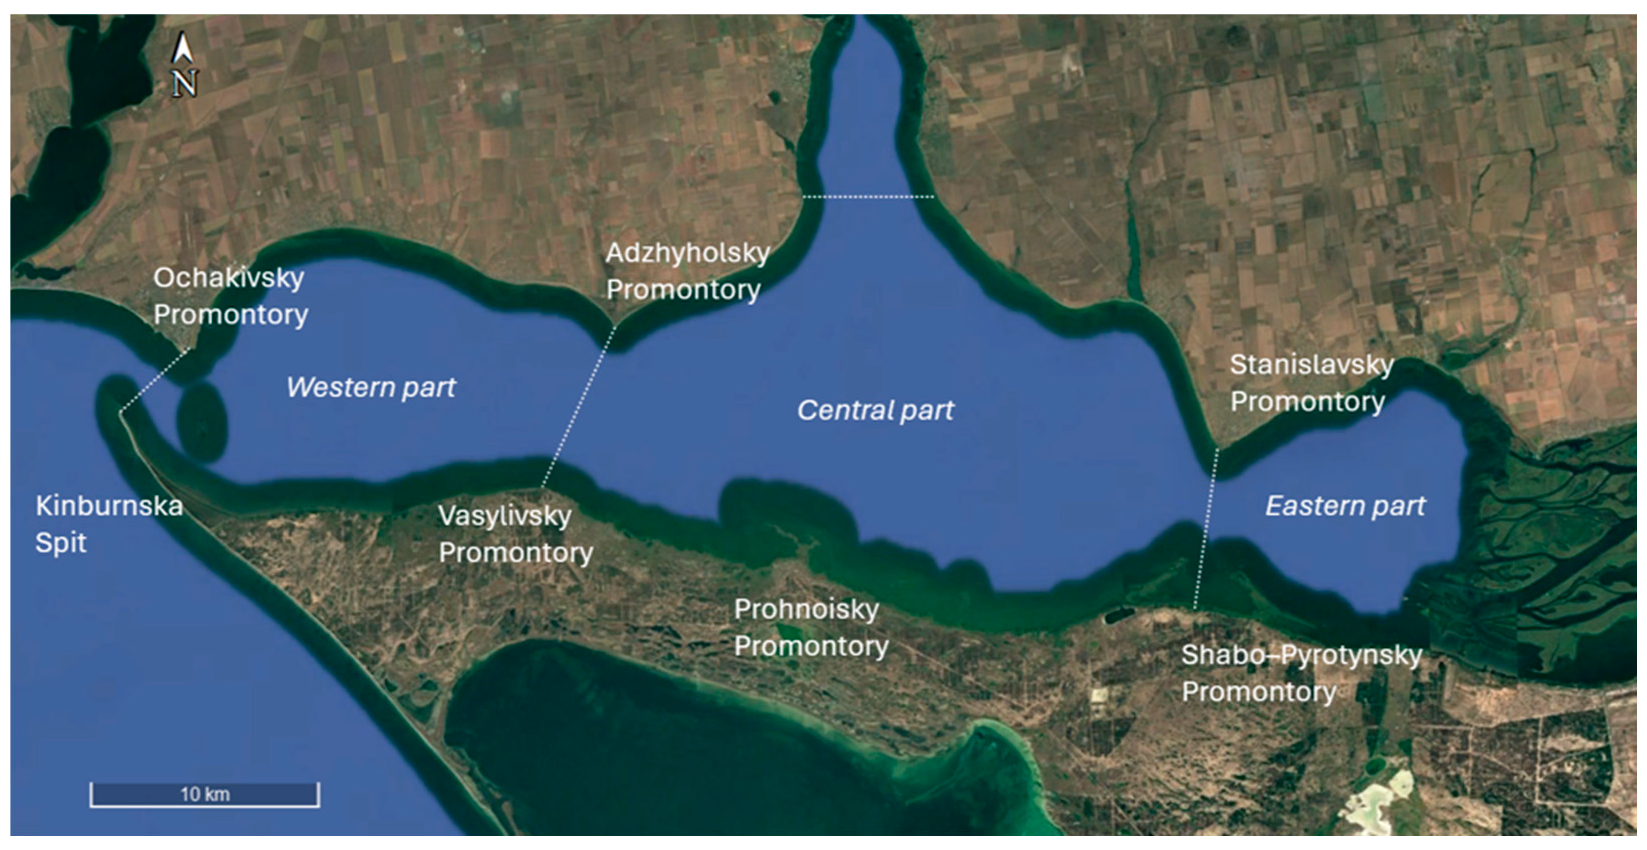
The shoreline is indented by a series of promontories of both erosional and accumulative origin, which divide the Dniprovsko–Buzky Liman into three major sectors [
21] (
Figure 3).
The eastern (Dniprovsky) sector is controlled predominantly by the discharge of the Dnipro River and is characterized by the most extensive development of phytogenic shores. The central (Buzky) sector is influenced by the combined discharge of the Pivdennyi Buh and Dnipro rivers, while reed-dominated phytogenic shores are concentrated mainly along the northern coast of the Kinburn Peninsula. The western (Ochakivsky) sector experiences the strongest influence of Black Sea waters, resulting in a more limited and localized distribution of phytogenic shores [
18].
According to its hydrological characteristics, the Dniprovsko–Buzky Liman belongs to the subtype of open limans [
28], which are characterized by substantial river discharge, active wave processes and pronounced meteorologically induced water-level fluctuations [
20]. Low salinity conditions and abundant sediment supply create favorable conditions for the widespread development of reed-dominated phytogenic shores within the liman.
3. Materials and Methods
The proposed methodology is aimed at identifying morphodynamic trends in the development of phytogenic shores based on the analysis of two interrelated parameters: the long-term dynamics of the external reed vegetation boundary and spatial variations in the moisture conditions of the depositional substrate. Within this framework, displacement of the external vegetation boundary is interpreted as an indicator of progradation and retreat of phytogenic shores, whereas spatial variations in substrate moisture are analyzed as a qualitative environmental characteristic that may be related to differences in inundation frequency, substrate conditions and long-term phytogenic shore development.
The first stage involved reconnaissance field surveys conducted along the coasts of the Dniprovsko–Buzky Liman during different seasons between 2012 and 2021. The purpose of these surveys was to investigate the spatial distribution of phytogenic shores, their morphological and lithological characteristics, and the development patterns of reed vegetation. The field observations provided the basis for understanding the functioning of phytogenic shores and for the subsequent interpretation of remote sensing data.
During the second stage, optical data from Landsat (TM, ETM+, OLI and OLI-2; 1985–2025) and Sentinel-2 MSI (2016–2025), together with Sentinel-1 SAR data (2016–2025), were used to calculate the NDVI, SAVI, MNDWI, LSWI and RVI indices. Their combined interpretation enabled the delineation of open water surfaces, reed vegetation characterized by different densities and stages of development, and areas exhibiting different moisture conditions of the depositional substrate.
During the third stage, vector boundaries of the external edge of phytogenic shores were generated for each time slice based on the integrated analysis of the calculated indices. The external boundary was defined as the interface between open water and the seaward zone of the phytogenic shore, represented by reed vegetation and depositional surfaces at different stages of moisture conditions, vegetation colonization and biogenic stabilization.
During the fourth stage, the cross-section method was applied to quantify the spatial dynamics of phytogenic shores. Baseline segments were established within each study area, from which cross-sections were automatically generated at 100 m intervals and oriented perpendicular to the general direction of shoreline development. The position of the external vegetation boundary was determined for each cross-section and for all observation periods. These data were used to calculate shoreline displacement, identify zones of progradation and retreat, and estimate mean annual rates of change for individual shoreline segments.
During the fifth stage, spatial variations in substrate moisture conditions were analyzed. Based on LSWI values, zones characterized by different moisture conditions were identified, and their spatial positions were determined relative to the baseline segments and the system of cross-sections. The observed variations were interpreted as indicators of differences in substrate moisture conditions and were evaluated for their possible relationship with the formation and development of new phytogenic shore surfaces.
During the final stage, an integrated analysis of field observations and remote sensing data was performed. Comparison of the dynamics of the external vegetation boundary with spatial variations in substrate moisture conditions made it possible to assess the functioning of phytogenic shores as integrated coastal systems and to evaluate possible relationships between shoreline progradation and changes in substrate conditions.
3.1. Field Surveys and Collection of Field Data
Field investigations were conducted during different seasons between 2012 and 2021 along the coasts of the Dniprovsko–Buzky Liman. Approximately 100 km of shoreline was surveyed, covering the principal areas occupied by phytogenic shores.
The field program included mapping of phytogenic shores, description of their morphological characteristics, vegetation composition and hydrodynamic conditions. The main criterion used to identify phytogenic shores was the presence of persistent stands of common reed (Phragmites australis) developing on depositional substrates.
Lithological investigations were carried out using an Eijkelkamp Hand Auger(Royal Eijkelkamp, Giesbeek, The Netherlands). In total, approximately 300 hand-auger cores with depths of up to 0.5 m were obtained. The near-surface deposits were found to consist predominantly of fine-grained sands interbedded with organic material and silty sediments. These observations were used to interpret surface aggradation processes and to validate the results of the remote sensing analysis. Additional field data included GPS positioning of representative sites, photographic documentation, and visual assessment of vegetation condition and substrate moisture.
3.2. Remote Sensing Analysis and Satellite Data Processing
Long-term optical datasets from Landsat (1985–2025), Sentinel-2 MSI (2016–2025), and Sentinel-1 SAR data (2016–2025) available within the Google Earth Engine platform were used in this study.
The long-term analysis was based on atmospherically corrected surface reflectance products from Landsat 5 TM, Landsat 7 ETM+, Landsat 8 OLI and Landsat 9 OLI-2 with a spatial resolution of 30 m. Sentinel-2 MSI imagery (10–20 m) was used for detailed analysis of phytogenic shore structure, whereas Sentinel-1 SAR data (VV and VH polarizations, 10 m) were employed to characterize substrate moisture conditions and inundated vegetation.
Data preprocessing was performed within the Google Earth Engine environment [
29,
30]. The QA_PIXEL mask was applied to Landsat imagery, whereas SCL and QA60 layers were used for Sentinel-2 data. Sentinel-1 backscatter values were converted from dB to linear units prior to processing. After cloud masking and reduction in speckle effects, seasonal median composites were generated.
Based on these composites, NDVI, SAVI, MNDWI, LSWI and RVI indices were calculated (
Table 1). Their combined interpretation enabled the delineation of open water surfaces, reed vegetation, and zones characterized by different substrate moisture conditions.
For automated mapping of phytogenic shores, a binary PhytoMask classification scheme was developed based on the combined use of NDVI, RVI and MNDWI. Areas with NDVI values exceeding 0.3 were initially identified as potential reed vegetation. MNDWI was subsequently used to exclude open water, whereas RVI was applied to confirm vegetation structure. Final classification was based on an integrated interpretation of these indices supported by field observations and high-resolution Google Earth imagery.
The external vegetation boundary was defined as the interface between open water and the phytogenic shore zone. Its delineation was based on the combined interpretation of MNDWI, NDVI, SAVI and RVI indices. The resulting raster masks were converted into vector shorelines and subsequently used for the analysis of long-term phytogenic shore dynamics.
To quantify shoreline changes, the cross-section method was applied. Baseline segments were established for each study area, and cross-sections were automatically generated at 100 m intervals. The position of the external vegetation boundary was determined along each cross-section for all observation periods, providing the basis for calculating shoreline displacement and estimating rates of phytogenic shore development.
Mean annual rates of change were calculated using the following equation:
where
V is the rate of change in the external vegetation boundary (m yr−1);
ΔL is the measured displacement (m);
and Δt is the duration of the analyzed period (years).
Positive values indicate progradation, whereas negative values correspond to retreat.
The LSWI index was used to assess spatial variations in substrate moisture conditions and their possible relationship to long-term phytogenic shore development. It was assumed that substrate moisture conditions reflect the frequency and duration of inundation and may therefore provide indirect information on differences in inundation conditions and the relative position of depositional surfaces within phytogenic shore systems. Boundaries between zones characterized by different moisture conditions were analyzed relative to the baseline segments and the system of cross-sections using the same procedure as that applied to the external vegetation boundary.
Seaward displacement of moisture boundaries was interpreted as a reduction in surface inundation and considered a potential indicator of changes in substrate conditions associated with phytogenic shore development. Conversely, landward migration of moisture zones was interpreted as indicating an increase in inundation frequency.
During the final stage, remote sensing results were integrated with field observations. Relationships between the dynamics of the external vegetation boundary, changes in the position of moisture zones, and the morphological characteristics of phytogenic shores were analyzed. Statistical analyses and visualization of the results were performed in RStudio (Version 2025.09.2, Posit Software, Boston, MA, USA) using the tidyverse (Version 2.0.0) and ggplot2 (Version 4.0.3) packages [
36].
3.3. Methodological Considerations and Uncertainty
The proposed methodology was based on integrated expert interpretation of optical and radar remote sensing data rather than automated pixel-wise image classification. Accordingly, PhytoMask was generated by combining NDVI, MNDWI and RVI indices with field observations and visual interpretation of high-resolution Google Earth imagery.
To ensure methodological consistency throughout the long-term analysis, all satellite images used for shoreline interpretation were selected from the peak vegetation period (July). This period corresponds to the maximum seasonal development of reed vegetation and is characterized by relatively stable hydrological conditions within the Dniprovsko–Buzky Liman. July was also selected because extreme storm events and pronounced meteorologically induced water-level fluctuations are relatively uncommon during this period. Only images with less than 10% total cloud cover were considered, provided that cloud cover did not obscure the shoreline or adjacent coastal zone. Cloud cover outside the study shoreline was considered acceptable provided that it did not obscure shoreline interpretation or affect spectral index calculation. The use of imagery acquired during the same season also minimized the influence of vegetation phenology and short-term hydrological variability on shoreline interpretation.
Baseline segments were digitized approximately parallel to the general shoreline orientation. Transects were generated automatically at 100 m intervals using GIS tools and extended beyond the maximum expected shoreline displacement. Shoreline position was determined as the intersection between each transect and the mapped external vegetation boundary, providing a consistent basis for comparing shoreline displacement between observation periods.
Several sources of uncertainty were considered during shoreline interpretation, including the spatial resolution of satellite imagery, image co-registration accuracy, seasonal environmental variability, and expert interpretation of the external vegetation boundary (
Table 2). Because shoreline delineation was based on the interpretation of a continuous geomorphological feature rather than on individual image pixels, these uncertainties primarily affected local shoreline position but were not considered to substantially influence the identification of long-term morphodynamic trends. A formal quantitative error budget was not calculated because the objective of the study was to identify generalized long-term morphodynamic trends through integrated interpretation of multiple complementary datasets rather than to quantify shoreline displacement from individual satellite scenes. Accordingly, shoreline displacements smaller than approximately one Landsat pixel should be interpreted with caution and regarded as indicative rather than definitive evidence of morphodynamic change.
Because shoreline delineation was based on integrated expert interpretation supported by field observations rather than on automated pixel-wise image classification, conventional confusion-matrix accuracy assessment was not applicable. Validation was therefore performed through comparison with field observations and high-resolution Google Earth imagery.
The consistency of shoreline interpretation between Landsat and Sentinel-2 imagery was visually assessed for representative shoreline sectors during the overlap period (2016–2025). Representative comparisons are presented in
Supplementary Figure S1. The comparison demonstrated a high degree of consistency between both datasets, and no systematic sensor-related displacement of the external vegetation boundary was identified. These results suggest that the combined use of Landsat and Sentinel-2 imagery did not introduce substantial systematic bias into the interpretation of long-term morphodynamic trends.
4. Results
4.1. Spatial Distribution of Phytogenic Shores Within the Dniprovsko–Buzky Liman
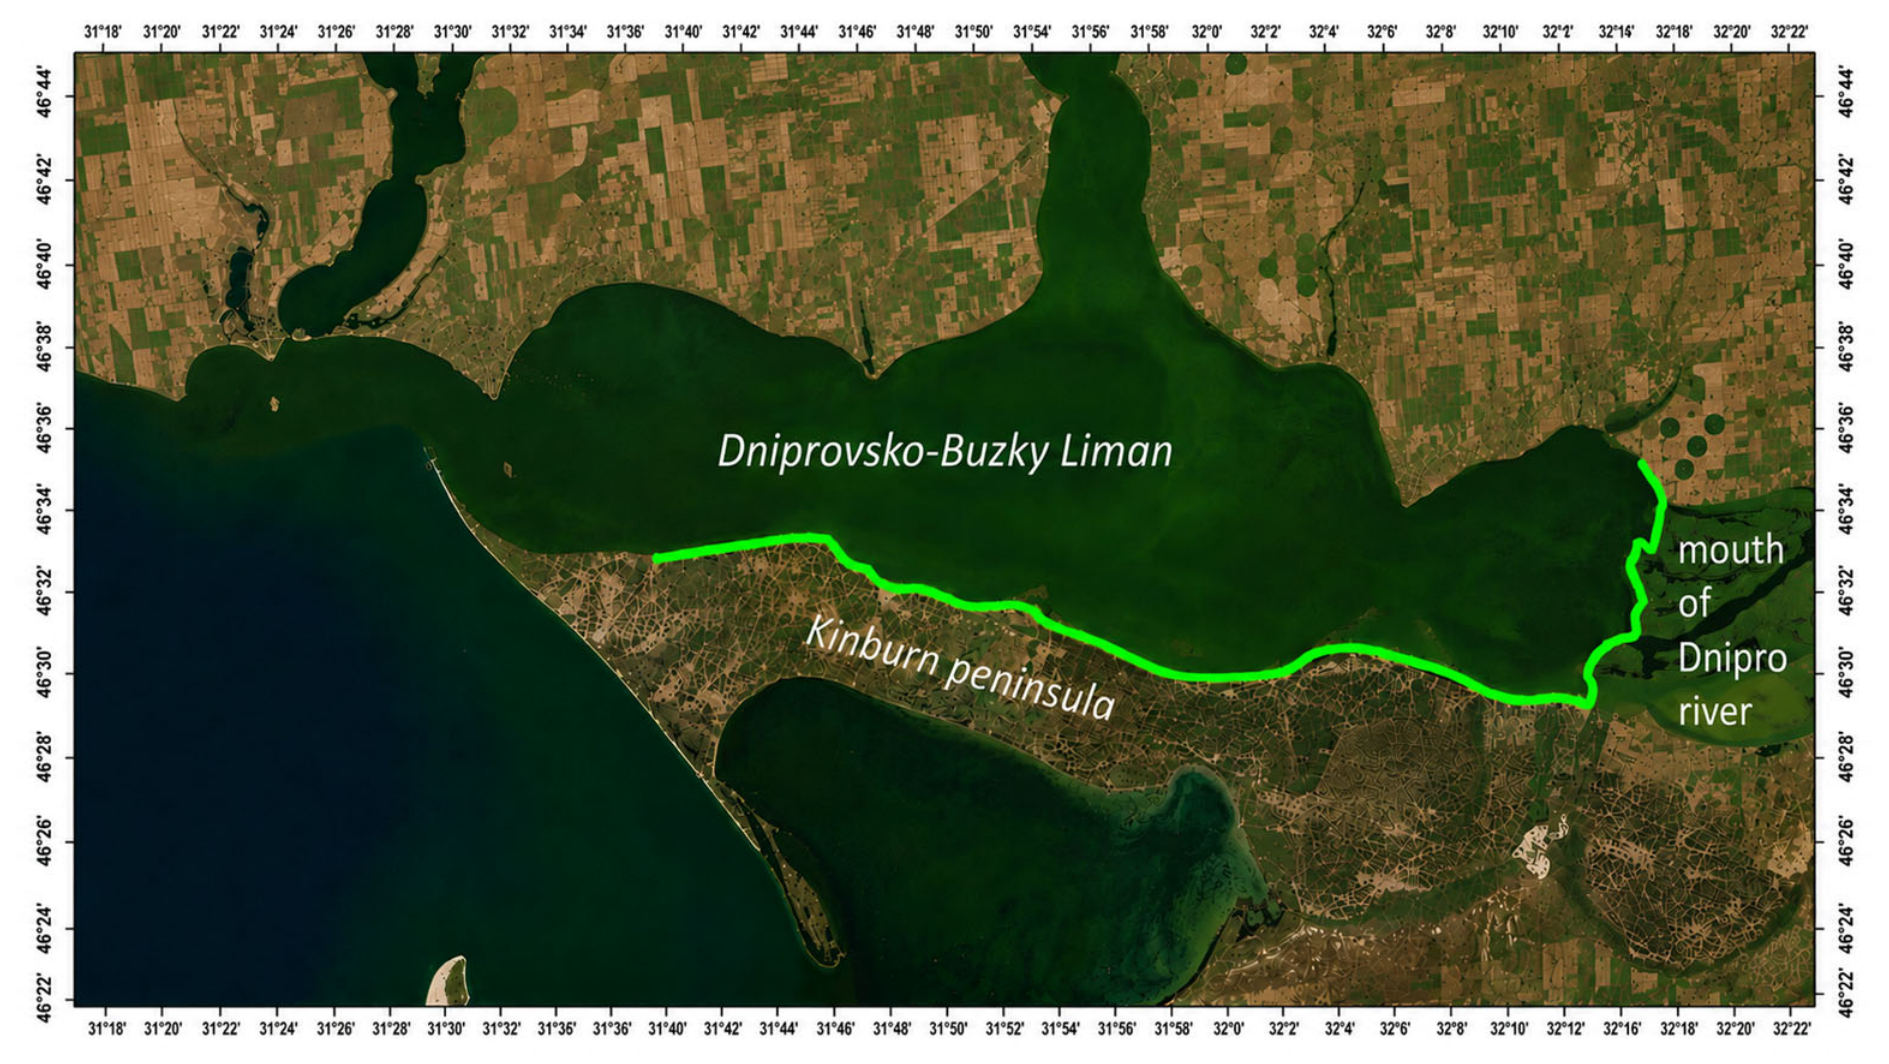
Field observations and interpretation of satellite imagery revealed that phytogenic shores are unevenly distributed along the coastline of the Dniprovsko–Buzky Liman. The most extensive reed-dominated phytogenic shores form an almost continuous coastal belt of variable width extending for approximately 65 km across the Dnipro River mouth area, from the Kiziy Cape sector through the deltaic islands and distributary channels to the northern coast of the Kinburn Peninsula and the Bienkovi Plavni area (
Figure 4).
Remote sensing data combined with field observations indicate that phytogenic shores are mainly confined to low-lying coastal sectors and adjacent shallow-water areas characterized by gentle surface gradients. These environments are associated with reduced hydrodynamic energy and favorable conditions for the accumulation of fine-grained sediments and the development of persistent reed vegetation.
Along the elevated northern coast of the liman, reed vegetation does not form a continuous belt and occurs as isolated patches. Their distribution is mainly associated with the mouths of gullies and temporary streams, as well as with zones of groundwater discharge within the coastal zone.
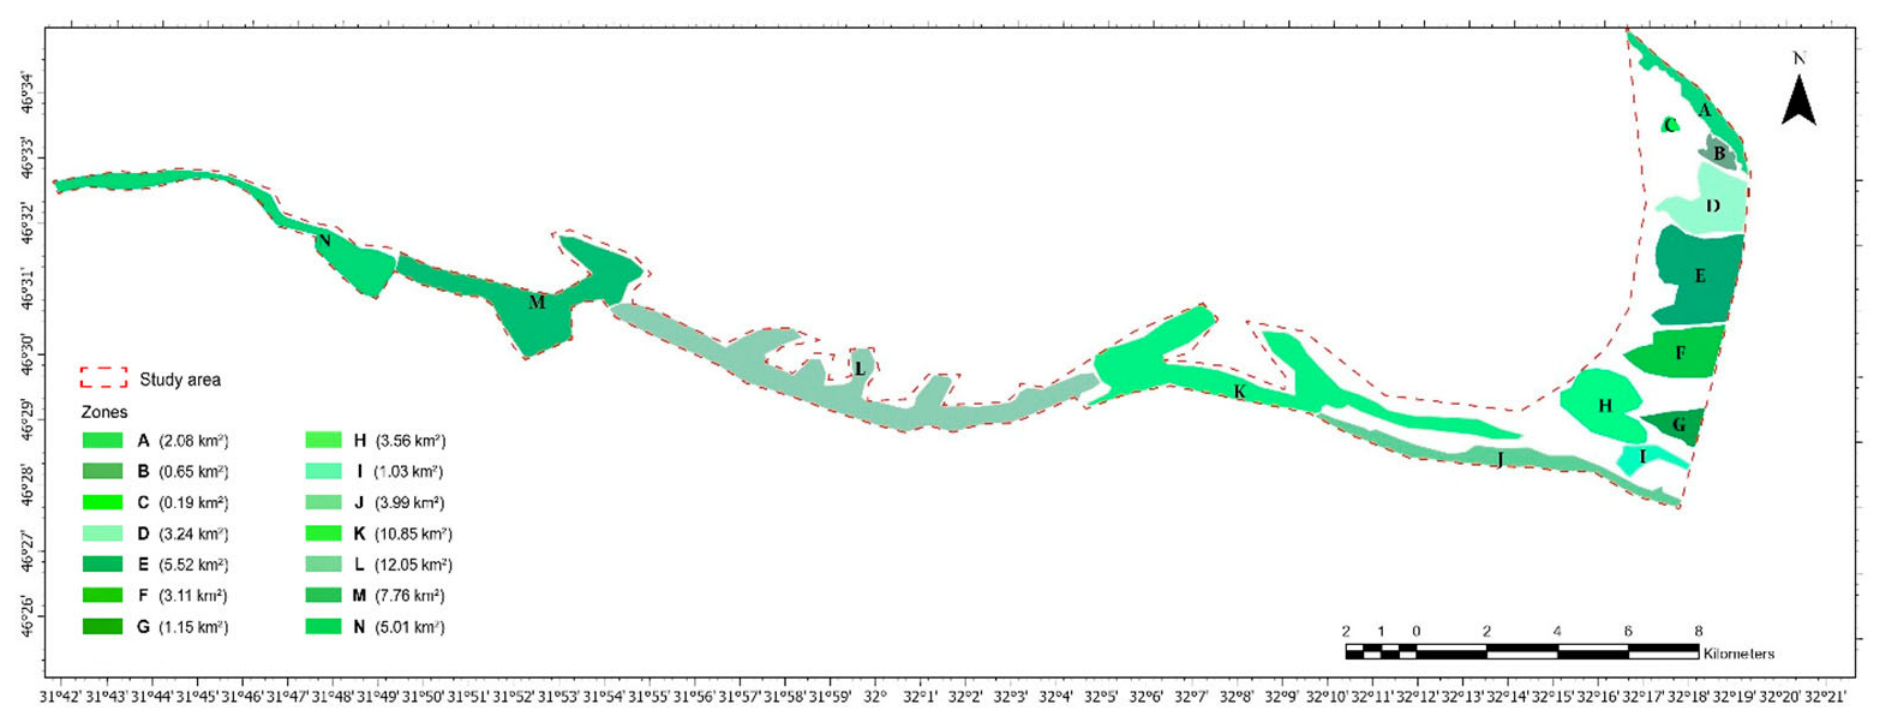
For the analysis of spatial and temporal variability, phytogenic shores were subdivided into 14 morphodynamic sectors (A–N) (
Figure 5). The delineation of individual sectors was based on shoreline configuration, hydrodynamic conditions, sedimentation patterns, coastal morphology, and the spatial organization of reed vegetation.
The obtained results demonstrate pronounced spatial heterogeneity of phytogenic shores within the Dniprovsko–Buzky Liman. This heterogeneity necessitates a differentiated approach to the analysis of their long-term morphodynamic evolution and highlights the complexity of these phytogenic shore systems.
4.2. Spatial Structure of Phytogenic Shores
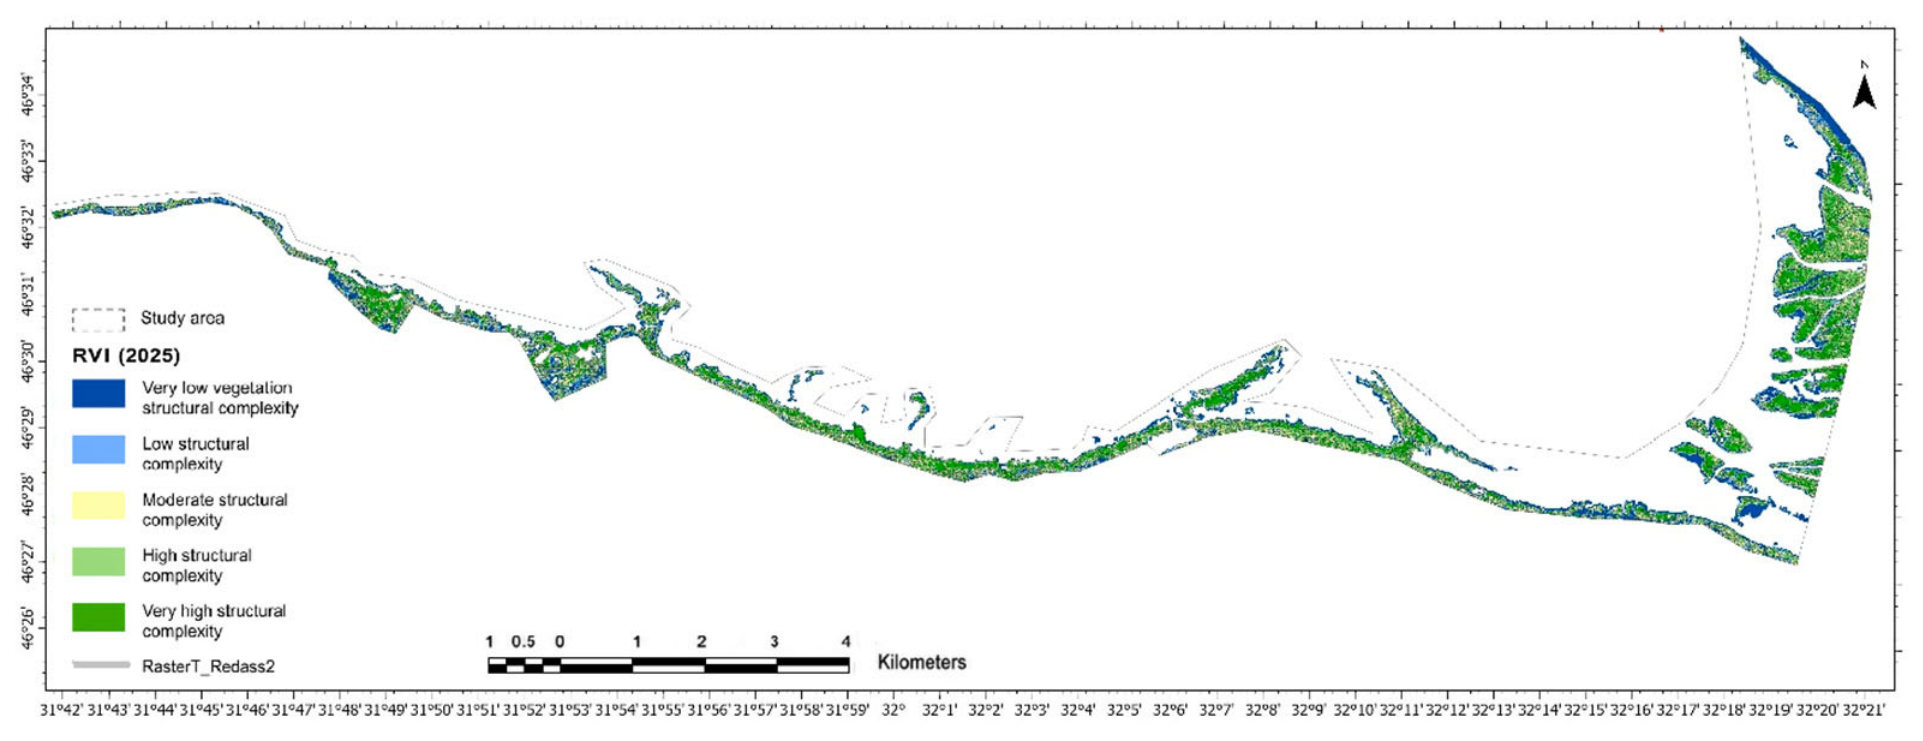
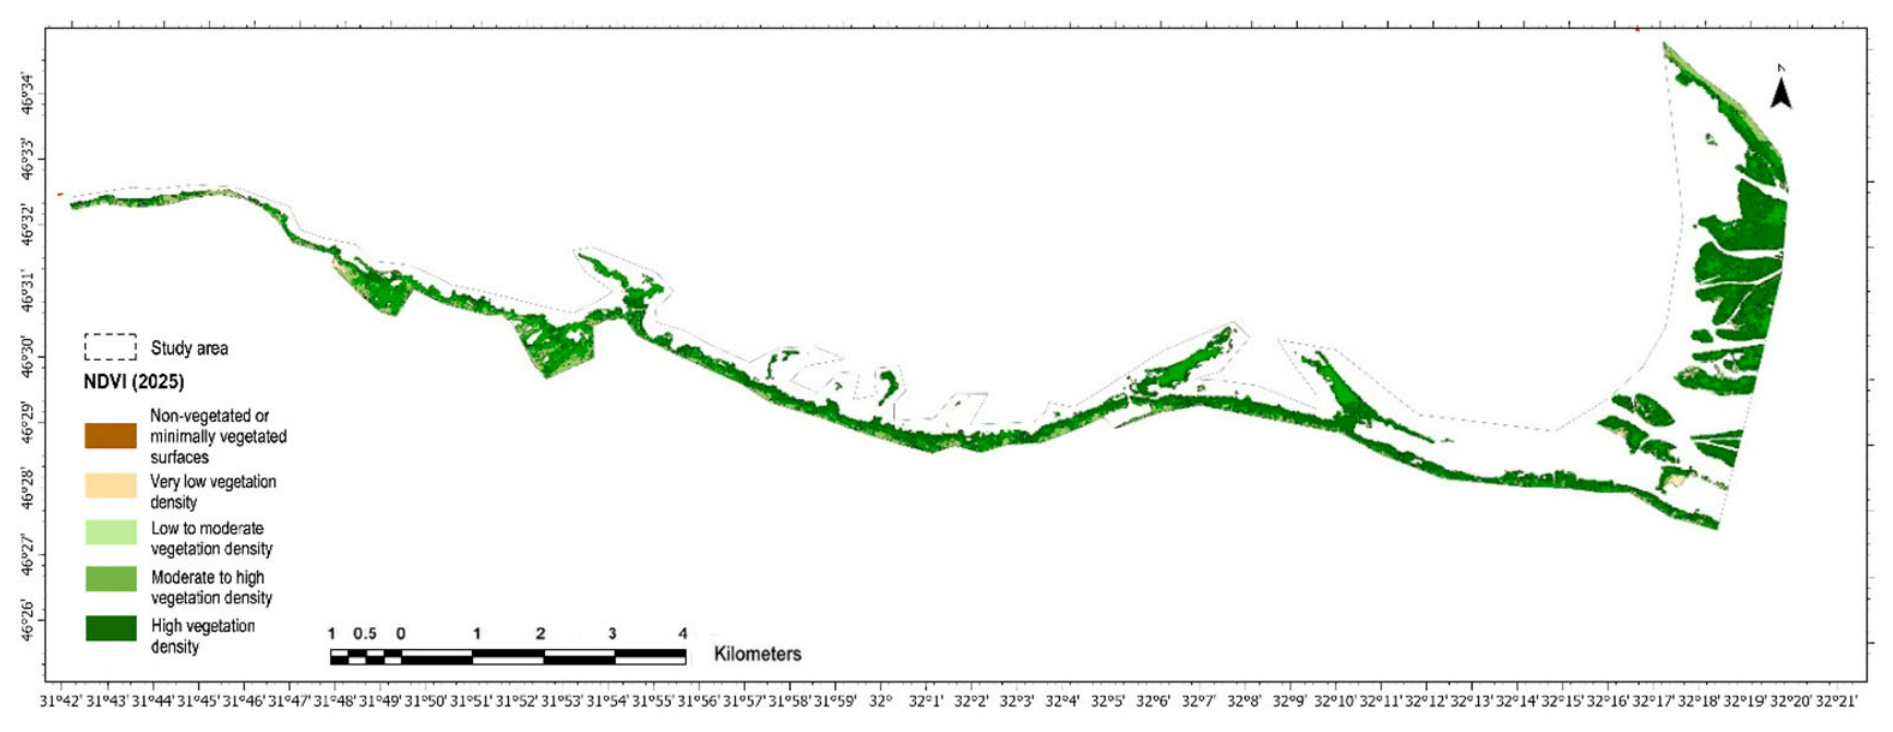
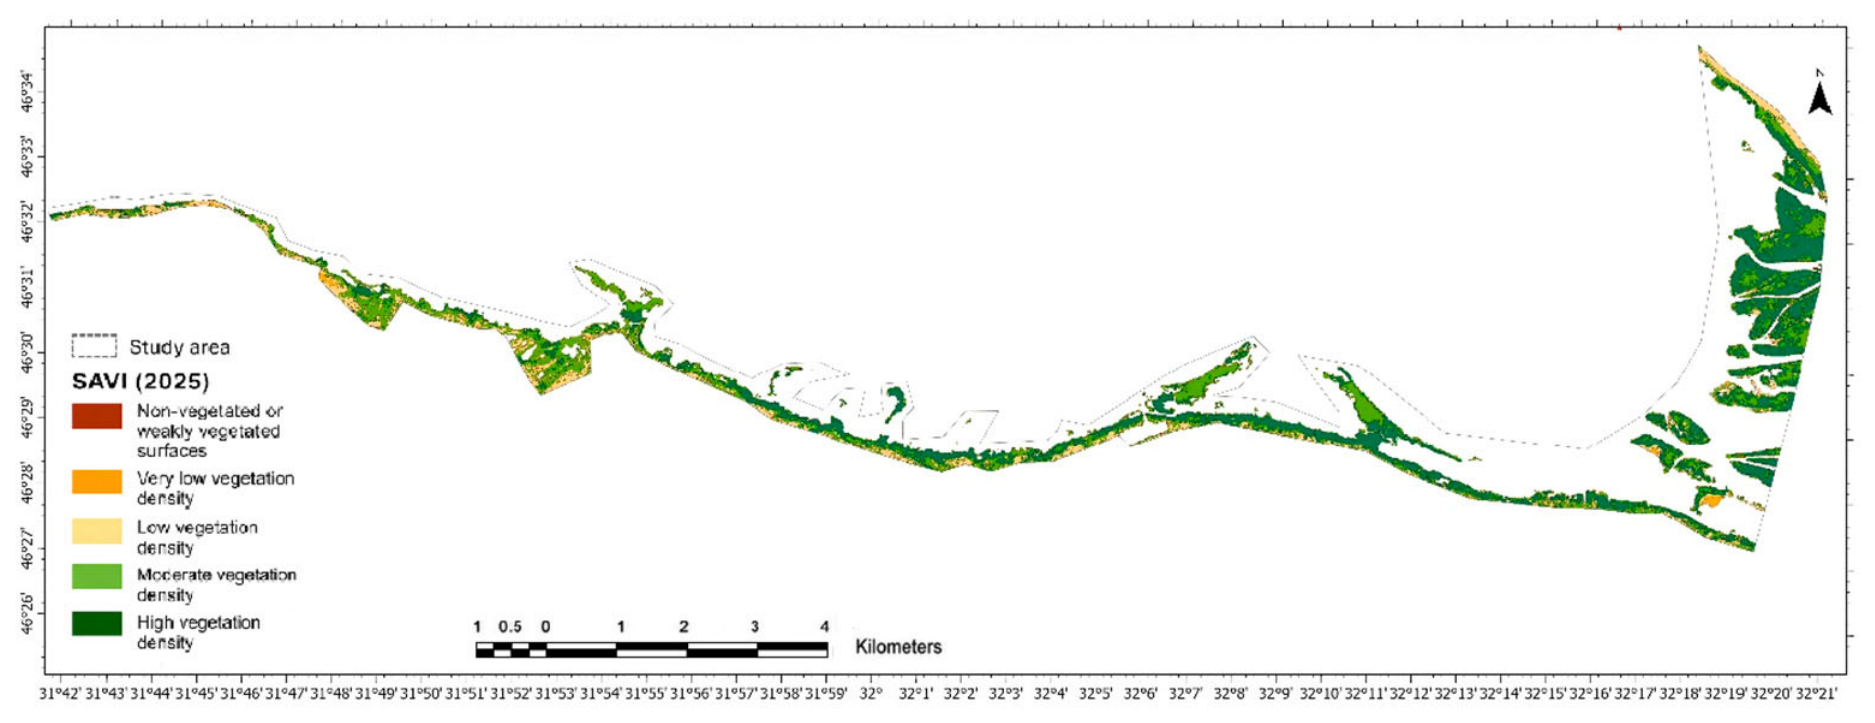
Field observations and remote sensing analysis showed that phytogenic shores of the Dniprovsko–Buzky Liman represent complex coastal systems composed of several interconnected structural elements, including the external vegetation boundary, zones of dense and sparse reed vegetation, and areas characterized by different substrate moisture conditions (
Figure 6,
Figure 7 and
Figure 8).
Field investigations revealed that the depositional substrate supporting reed vegetation is characterized by permanently waterlogged and soft surface conditions. In most cases, the surface is covered by plant debris at different stages of decomposition. The internal structure of the depositional sequence exhibits pronounced layering represented by alternating sandy, silty and organic-rich horizons of variable thickness.
Unlike abiotic shores, the shoreline position within phytogenic systems is determined not by the waterline itself but by the position of the external vegetation boundary. The seaward edge of reed vegetation therefore represents the actual boundary of the phytogenic shore system and serves as the principal indicator of its spatial development.
Remote sensing analysis showed that the external vegetation boundary differs considerably in its degree of expression. On relatively stable shores, it forms a continuous and well-defined belt. In actively prograding areas, the boundary is represented by sparse reed stands and isolated vegetation patches forming a transitional zone between open water and stabilized phytogenic surfaces.
Landward of the external vegetation boundary, a zone of dense reed vegetation is developed, characterized by high vegetation cover and relatively stable depositional conditions. The internal parts of phytogenic shores exhibit heterogeneous moisture conditions expressed by alternating wet and relatively dry surfaces, as well as by the local development of shallow channels and depressions.
The studied phytogenic shores exhibit pronounced spatial variability in the configuration of the external vegetation boundary, vegetation density, hydrological conditions and depositional environments. Their width varies from a few meters to several hundred meters. Minimum widths are typical of some sectors of the Dnipro delta, the central part of the northern coast of the Kinburn Peninsula, and the back-barrier coast of the Kinburn Spit, where reed belts are generally 40–50 m wide. The widest phytogenic shores (up to 300–400 m) occur north of the Dnipro delta in the Kiziy Cape area and south of the delta towards the Prohnoi Promontory.
4.3. Long-Term Dynamics of the External Vegetation Boundary
Comparison of the spatial position of the external vegetation boundary of phytogenic shores within the Dniprovsko–Buzky Liman over the period 1985–2025 revealed substantial changes in shoreline configuration across the study sectors. Analysis of long-term satellite data series showed that the development of phytogenic shores was highly variable both temporally and spatially.
Despite the overall predominance of progradational trends, individual sectors differed considerably in the magnitude and direction of boundary displacement. Some sectors exhibited persistent seaward expansion throughout most of the observation period, whereas others were characterized by alternating phases of progradation and retreat, as well as prolonged periods of relative stability. These differences demonstrate the pronounced morphodynamic heterogeneity of phytogenic shores and emphasize the importance of local hydrodynamic and sedimentary conditions in controlling their evolution.
4.3.1. Mainland Northern Coast of the Liman
Sector A (
Figure 4), located along the mainland coast west of Kiziy Cape, is characterized by the overall predominance of progradational trends. During different periods, both local retreat (up to 3–5 m yr
−1) and intensive seaward expansion (up to 10–14 m yr
−1) were recorded. Despite these reversals, the sector demonstrated persistent development towards the Liman water area. Mean long-term rates of external vegetation boundary displacement reached 7–8 m yr
−1.
4.3.2. Northern Dnipro Delta
Sectors B (Kasperovskyi Island) and D (Zabych Island) (
Figure 4) are generally characterized by alternating phases of progradation and retreat of the external vegetation boundary. The most pronounced retreat was recorded in Sector B during 2000–2005 and 2015–2020, when retreat rates reached 3–5 m yr
−1. In Sector D, retreat phases occurred during 1990–1995, 2000–2005, and 2015–2020, although their intensity usually did not exceed 2–3 m yr
−1. Maximum progradation rates were observed in Sector D during 1985–1990, reaching 3–6 m yr
−1, whereas in Sector B the most intensive seaward expansion occurred in 2020–2023, when rates increased to 7–8 m yr
−1. Despite the pronounced oscillatory behavior, mean long-term rates of external vegetation boundary advance in both sectors ranged between 2 and 4 m yr
−1, indicating the overall predominance of progradational trends.
In contrast to Sectors B and D, Sector C (Bezymiannyi Island) (
Figure 4) is characterized by persistent and considerably more intensive progradation. During the period 1985–2025, a new island approximately 400 m long formed at the site of the former shallow-water area. The cumulative displacement of the external vegetation boundary corresponds to a mean long-term progradation rate of approximately 10 m yr
−1, representing one of the highest values recorded among the phytogenic shores of the Dniprovsko–Buzky Liman.
4.3.3. Central Dnipro Delta
Phytogenic shores of the central Dnipro Delta (Sector E, including Buhaz and Vasylkiv islands, and Sector F, represented by Bokaiskyi Island) are characterized by the most contrasting dynamics of the external vegetation boundary. This group of sectors exhibits alternating phases of active progradation, relative stabilization, and partial retreat.
In Sector E, maximum progradation rates were recorded during 1985–1990 and 2010–2015, reaching 8–10 m yr−1, whereas the most pronounced retreat occurred in 2015–2020, with rates of up to 4–5 m yr−1. Sector F displayed more pronounced oscillatory behavior. The highest retreat rates were recorded during 1985–1990 (up to 8–10 m yr−1) and 2000–2005 (up to 3–4 m yr−1), while maximum progradation occurred in 2020–2023 and reached 7–8 m yr−1.
Despite substantial interperiod variability, both sectors are characterized overall by the predominance of progradational trends, reflecting the high morphodynamic activity of phytogenic shores in the central part of the Dnipro Delta.
4.3.4. Southern Dnipro Delta
The southern part of the Dnipro Delta includes Sectors G (Kruhlyi and Kovtunovskyi islands), H (Velykyi Sokolyn Island, Malyi Sokolyn Island, Martynivska Spit, and Hadiucha Spit), and I (Tender Island) (
Figure 4). These sectors are characterized by the most complex spatial configuration and pronounced mosaic patterns of morphodynamic processes.
Retreat phases were recorded during different periods and were most clearly expressed in Sector G during 2000–2005, when retreat rates of the external vegetation boundary reached 5–6 m yr−1. In Sector H, the most pronounced retreat occurred during 2020–2023, when local retreat rates increased to 10–12 m yr−1.
Maximum progradation rates were mainly associated with the southern parts of the island sectors. The most intensive seaward expansion of the external vegetation boundary was observed during 2010–2015 and again during 2023–2025 in Sectors G and H, where progradation rates reached 15–20 m yr−1. In the remaining sectors of the southern delta, moderate progradational trends prevailed, with rates generally ranging from 3 to 6 m yr−1.
4.3.5. Northern Coast of the Kinburn Peninsula
Phytogenic shores along the northern coast of the Kinburn Peninsula (Sectors J–N) exhibit the most stable development among the investigated sectors of the Dniprovsko–Buzky Liman.
Sector J (from Hlagol Bay to Yanushev Island) is characterized by the predominance of progradational trends. During most observation periods, rates of external vegetation boundary advance ranged from 2 to 3 m yr−1 and locally reached 5–7 m yr−1. Retreat phases were limited in extent and generally did not exceed 2–4 m yr−1.
Sector K (Yanushev and Verbky Islands area) is characterized by persistent progradation with mean rates of 4–5 m yr−1. Local retreat was recorded in 2023, when retreat rates reached 3–4 m yr−1; however, by 2025, progradational processes again became dominant.
Sector L (from Verbky Island to the Prohnoi Promontory) is situated within a natural embayment of the shoreline and was characterized by persistent progradation throughout most of the study period, with rates of 1–2 m yr−1. In 2023, retreat rates of 4–5 m yr−1 were recorded along several coastal segments, although progradational trends resumed during subsequent years.
Despite its protruding shoreline configuration, Sector M (Prohnoi Promontory area) is generally characterized by the predominance of depositional processes. Mean progradation rates ranged from 2 to 3 m yr−1 and were periodically interrupted by short-term retreat phases with rates of 3–4 m yr−1. Overall, this sector remained close to dynamic equilibrium over the long term, and cumulative displacement of the external vegetation boundary did not exceed 1 m.
Sector N (from the Prohnoi Promontory to Bienkovi Plavni) exhibited the most stable position of the external vegetation boundary. No substantial long-term changes were identified, although short-term local retreat with rates of up to 2–3 m yr−1 was recorded at several sites.
Overall, weak to moderate progradational trends prevail along the northern coast of the Kinburn Peninsula, indicating the high stability of phytogenic shores within this sector of the liman. The long-term dynamics of the external vegetation boundary varied considerably among the investigated sectors. A summary of the dominant morphodynamic trends and shoreline change rates is presented in
Table 3.
4.4. Spatial Patterns and Dynamics of Depositional Substrate Moisture
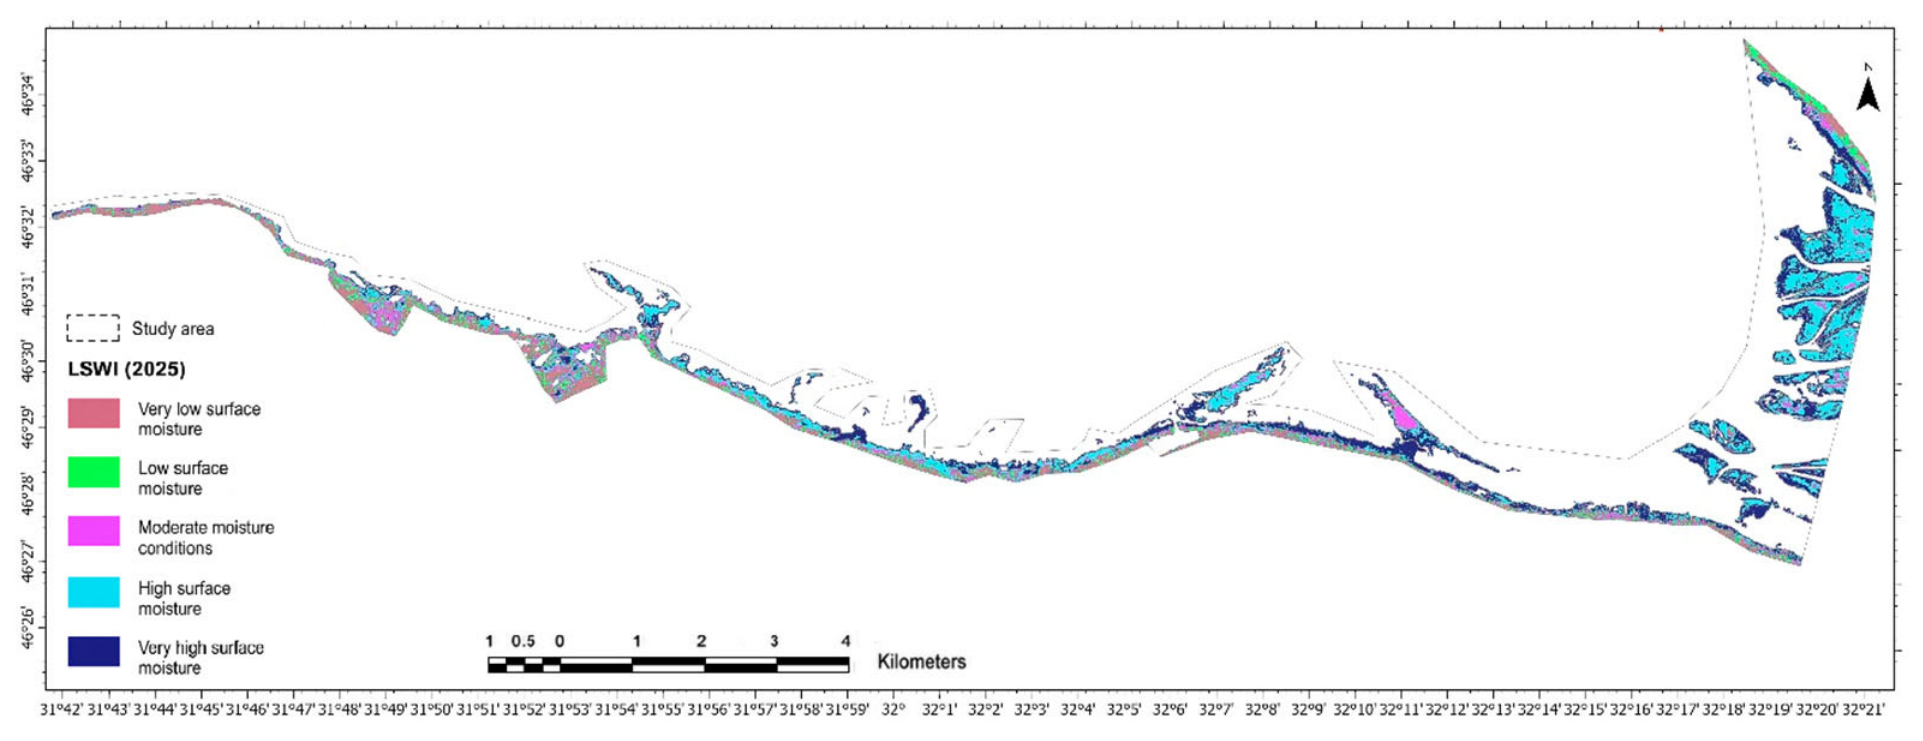
The spatial distribution of LSWI values reveals pronounced heterogeneity in substrate moisture conditions within the phytogenic shores of the Dniprovsko–Buzky Liman (
Figure 9). Areas characterized by maximum moisture content are predominantly confined to the seaward parts of phytogenic shores, as well as to zones adjacent to internal channels and local topographic depressions.
The alongshore distribution of substrate moisture exhibits marked spatial variability. The most complex moisture patterns occur within the Dnipro Delta, where numerous channels, shallow-water areas, and islands produce a mosaic arrangement of surfaces characterized by different degrees of moisture.
Along the northern coast of the Kinburn Peninsula, the distribution of substrate moisture is more organized. Here, the most waterlogged surfaces are represented by a narrow belt extending along the external vegetation boundary, whereas the internal parts of phytogenic shores are characterized by lower LSWI values. In the cross-shore direction, this pattern is expressed by a transition from waterlogged outer zones to relatively dry inner surfaces. Within the delta islands, this sequence can be traced towards natural levees, whereas along the northern coast of the Kinburn Peninsula, the upper boundary of increased moisture generally coincides with the position of a weakly expressed beach ridge.
The identified moisture pattern reflects differences in inundation duration and probably corresponds to different stages of phytogenic shore development. Relatively dry internal sectors may represent more mature surfaces formed through prolonged accumulation of sandy, silty, and organic-rich sediments. In contrast, the most waterlogged areas are associated with recently formed depositional surfaces characterized by frequent inundation and the initial stages of colonization and stabilization by reed vegetation.
Under the conditions of the Dniprovsko–Buzky Liman, vertical surface aggradation of phytogenic shores is expected to be very low because of the gradual accumulation of mineral and organic material. Available field observations suggest that aggradation proceeds slowly, probably on the order of millimeters per year, although direct measurements are currently unavailable.
At such rates, quantitative detection of moisture-boundary migration from satellite observations covering the period 2016–2025 remains difficult. Therefore, LSWI variations are interpreted here not as a direct measure of aggradation but rather as a qualitative indicator of changes in substrate conditions.
Following 2023, increased LSWI values were observed in several sectors. These changes may partly reflect the accumulation of fine-grained and detrital material supplied following the destruction of the Kakhovka Dam. However, alternative explanations should also be considered, including variations in water level, seasonal changes in substrate moisture conditions, vegetation response to hydrological disturbances, and differences associated with the use of satellite data of varying spatial resolution. The most pronounced changes were recorded within the Dnipro Delta and adjacent sectors, whereas their expression generally decreased with increasing distance from the delta.
Comparison of substrate moisture patterns with the long-term dynamics of the external vegetation boundary demonstrates their close spatial relationship. The predominance of progradational trends indicates the gradual expansion of phytogenic shores towards the liman water area and the formation of new depositional surfaces. Consequently, zones characterized by increased moisture are likely to migrate seaward together with the actively developing part of the phytogenic shore system. However, within the available observation period, this relationship can only be assessed qualitatively.
Overall, the spatial distribution of LSWI reveals a cross-shore differentiation from waterlogged outer sectors to relatively dry internal surfaces. This pattern may be consistent with gradual stabilization and long-term development of phytogenic shore surfaces. However, the available remote sensing data do not allow direct measurement of aggradation rates, and the observed moisture gradients should therefore be interpreted primarily as indicators of differences in substrate conditions and inundation regimes.
5. Discussion
The obtained results demonstrate that reed-dominated phytogenic shores of the Dniprovsko–Buzky Liman represent complex biogeomorphological systems whose evolution is controlled by the interaction between sedimentary processes and vegetation development. In contrast to purely abiotic accumulative coasts, the position of the shoreline within phytogenic systems is determined by the external vegetation boundary rather than by the waterline itself. Consequently, the morphodynamic evolution of such shores depends not only on hydrodynamic and sedimentary conditions but also on the state and spatial organization of reed vegetation.
The predominance of progradational trends identified for most study sectors indicates that phytogenic shores of the liman are generally characterized by long-term expansion towards the water area. However, substantial differences in progradation and retreat rates between individual sectors reveal pronounced spatial heterogeneity. These differences are most likely related to variations in hydrodynamic conditions, sediment supply, coastal morphology, and the degree of vegetation development.
The observed patterns are consistent with previously described biogeomorphological feedback mechanisms in marsh and mangrove environments [
6,
9]. Reed vegetation reduces wave energy, promotes sediment deposition, and stabilizes newly formed surfaces. In turn, sediment accumulation creates favorable conditions for further vegetation development. At the same time, the relationship between sediment accumulation and shoreline advance is not strictly linear. Even under conditions of active sediment supply, the external vegetation boundary may remain stable or temporarily retreat because its position is controlled by living plant communities.
The results indicate that the development of phytogenic shores depends not only on sediment availability but also on interannual variations in hydrological and climatic conditions. Changes in water level, flooding duration, salinity, and ice conditions may significantly affect the stability of reed communities. Therefore, short-term retreat of the external vegetation boundary does not necessarily indicate sediment deficiency and may reflect temporary disturbance of vegetation followed by its subsequent recovery. The tendency for short-term retreat to be followed by subsequent recovery is consistent with observations from long-term transect analyses of sandy and beachface coasts, where erosion and recovery are controlled by partly different processes and exhibit considerable alongshore variability rather than uniform shoreline behavior [
37]. Future investigations of reed-dominated phytogenic shores could further benefit from incorporating detailed bathymetric information, which would improve understanding of the interaction between nearshore morphology, hydrodynamic conditions and shoreline evolution [
38].
The spatial distribution of LSWI values revealed a consistent transition from highly waterlogged outer zones to relatively dry internal surfaces. This pattern probably reflects differences in inundation frequency and corresponds to different stages of phytogenic shore development. Since vertical accretion within reed communities is expected to be very low, direct detection of surface elevation changes using satellite data remains difficult. In this respect, spatial variations in substrate moisture may provide an additional qualitative indicator of differences in inundation conditions and substrate development.
The increase in LSWI values observed after 2023 may be associated with environmental changes that followed the destruction of the Kakhovka Dam, including possible increases in the supply of fine-grained and detrital material. However, the observed pattern should be interpreted with caution, as it may also reflect variations in water level, substrate moisture conditions and vegetation response to hydrological disturbances.
One of the main difficulties in studying phytogenic shores is the absence of a clearly defined shoreline and the extremely low rates of vertical surface growth. The methodological approach proposed in this study, based on the analysis of the external vegetation boundary and substrate moisture patterns, provides new opportunities for investigating the long-term evolution of reed-dominated phytogenic shores and may be applicable to similar coastal environments of the Black, Azov, and Baltic seas.
Overall, phytogenic shores should be considered dynamic biogeomorphological systems whose evolution is controlled by the combined influence of sediment supply, hydrodynamic conditions, and vegetation development. Consequently, their morphodynamic behavior cannot be fully explained within the framework of traditional concepts of abiotic accumulative coast evolution.