Article

Optimization Design of Floating Offshore Platforms Based on the Parallel EGO Algorithm

1
School of Marine Science and Engineering, South China University of Technology, Guangzhou 511442, China
2
School of Ocean Engineering, Guangzhou Maritime University, Guangzhou 510700, China
*
Author to whom correspondence should be addressed.
J. Mar. Sci. Eng. 2026, 14(13), 1241; https://doi.org/10.3390/jmse14131241 (registering DOI)
Submission received: 20 May 2026 / Revised: 29 June 2026 / Accepted: 2 July 2026 / Published: 3 July 2026
(This article belongs to the Special Issue Optimized Design of Offshore Wind Turbines)

Abstract

Floating offshore platforms are subjected to significant impact loads from ocean currents, which pose considerable challenges to the safety of floating offshore wind turbines. To address this issue, this study develops a novel infill criterion framework based on the parallel Efficient Global Optimization (EGO) algorithm. Compared with the traditional EGO algorithm, the proposed framework enables the simultaneous addition of multiple infill samples in each iteration, resulting in substantially improved optimization efficiency. The proposed method is applied to the optimization of floating offshore platforms, where drag minimization is considered the primary design objective. The results demonstrate that incorporating the mean squared error (MSE) criterion into the conventional EGO algorithm, while constraining the search space of the MSE criterion, effectively accelerates the convergence of the Expected Improvement (EI) criterion. Furthermore, an optimization method for floating platforms is established, leading to a reduction in drag of approximately 1.69% after optimization. The proposed optimization framework improves the drag performance of floating offshore platforms and provides a new approach for structural optimization in offshore engineering.

1. Introduction

In recent years, offshore wind power has gained increasing prominence in the global renewable energy market due to its abundant reserves, low environmental impact, strong renewability, and high stability [1]. Statistical data indicate that the global offshore wind industry has experienced remarkable growth over the past decade, with an average annual growth rate of 36%, and the cumulative installed capacity has now reached 56 GW. By 2031, the global cumulative installed offshore wind capacity is projected to reach 260–290 GW, more than five times the current total capacity [2]. As floating offshore wind power advances into deeper waters, harsher marine conditions are encountered [3,4,5,6]. Ocean currents and waves exert substantial impact loads on floating platforms, which not only cause fatigue failures in various turbine components but may also result in mooring line breakage under severe conditions, thereby posing significant threats to the safety of floating offshore wind turbines [7,8,9,10,11]. While both waves and currents contribute significantly to the total load, combined analysis is highly complex. As an essential first step, this study focuses on current-induced loads, which are a direct and major contributor to the total drag force. Therefore, mitigating the impact loads from currents and enhancing the safety of floating offshore wind turbines are of critical importance.
Common strategies to mitigate the effects of environmental loads on offshore structures include adding auxiliary devices to alter their motion response and loading conditions [12,13,14]. While effective in modifying hydrodynamic performance of floating bodies, such additions tend to increase manufacturing complexity, as well as installation and maintenance costs. A more fundamental approach is to optimize the platform geometry itself to achieve inherent hydrodynamic load reduction [15,16]. Existing studies have primarily focused on reducing the motion response of floating offshore platforms, with greater emphasis on wave-induced loads. However, current-induced impact loads and their direct implication on drag performance have not been adequately investigated. This gap underscores the need for the present study, which aims to optimize the floating platform for reduced drag under current loads.
For optimization problems in engineering, the Efficient Global Optimization (EGO) algorithm is a well-researched and commonly used method, particularly effective for tackling computationally intensive challenges [17,18]. The EGO algorithm builds a surrogate model based on initial samples. At present, four surrogate models are commonly employed: the Polynomial Response Surface (PRS) model [19], the Artificial Neural Network (ANN) model [20,21,22], the Radial Basis Function (RBF) model [23] and the Kriging model [24,25,26,27], among which Kriging is one of the most representative models [28,29]. However, unreasonable initial samples may result in low global accuracy of the surrogate model, making the initial model unsuitable for direct optimization. Therefore, additional sample points are typically required to improve the accuracy of the initial model, thereby enhancing its global prediction capability and optimization performance. Methods for adding new samples can generally be divided into single-sample infill criteria and multi-sample parallel infill criteria. Traditional single-sample infill criteria include MP, EI, MSE, PI, WEI, and LCB [30,31,32]. Since single-sample infill criteria allow only one point to be added per iteration, their efficiency is limited when computational resources are abundant. As a result, parallel infill criteria are often adopted to add multiple samples simultaneously. Parallel infill criteria can be categorized into two major types. The first type is the parallel extension of a single infill criterion. For example, the q-EI criterion, developed from the EI criterion, selects q samples in each iteration [33]. However, this approach requires solving complex high-dimensional integrals, and its computational efficiency decreases significantly with increasing design variables. The second type involves the combination of multiple infill criteria. For instance, Masato Sekishiro et al. proposed combining EI and MP criteria, adding both selected samples to the training set simultaneously, thereby updating the surrogate model with two new samples per iteration [34]. Although increasing the number of added samples can improve the efficiency of surrogate model construction, optimization problems require not only more samples but also higher-quality samples—i.e., samples that enhance convergence speed and solution accuracy. Current research primarily focuses on adding large numbers of samples per iteration to improve global accuracy, but this approach may provide limited benefits for optimization itself and can lead to resource waste due to the excessive number of samples. Therefore, an open challenge is how to add fewer but higher-quality samples per iteration to accelerate convergence while maintaining computational efficiency.
This study aims to mitigate the impact loads induced by ocean currents on floating offshore platforms by introducing an improved parallel Efficient Global Optimization (EGO) algorithm within a novel optimization framework. Accordingly, an optimization strategy tailored for floating platforms is formulated and applied to a typical floating platform (OC4) as a benchmark case. The remainder of this paper is structured as follows: Section 2 elaborates on the proposed optimization algorithm and verifies its effectiveness. Section 3 establishes the optimization strategy, applies it to the design of floating offshore platforms, and analyzes the optimized results. Section 4 presents the conclusions.

2. Methodology

2.1. Kriging Surrogate Model

The Kriging model was initially created in geology to forecast and estimate mineral deposits. Later, Jerome Sacks et al. introduced it into computer experiment approximation modeling, which led to its widespread application and broad recognition in engineering design and optimization [35]. In this paper, only a brief overview of the Kriging model is provided; the detailed derivation can be found in Sacks et al. [35].
For a set of design points x = x 1 , x 2 , x n with corresponding function values y = y 1 , y 2 , y n , a simple Kriging model can be constructed as follows:
y ( x ) = μ + ε ( x )
Here, μ represents the mean of the Gaussian process, and ε ( x ) denotes the normally distributed error term with zero mean and variance σ 2 . Most regression models assume that the errors at two points x(i) and x(j) are independent. In contrast, the Kriging model assumes that the error terms ε ( x i ) and ε ( x ( j ) ) are correlated, with the correlation depending on the distance between the two points, as expressed in Equation (2).
C o r r ε ( x i ) , ε ( x j ) = exp ( k = 1 d θ k x k ( i ) x k ( j ) p k
Here, d denotes the dimension of the design variables, while θ k and p k are the parameters to be determined.
In addition, the parameters μ , σ 2 , θ 1 , θ d , p 1 , p d in the Kriging model are estimated from the sampling points. The Kriging model also provides not only the predicted value at an unknown point but also the mean squared error of the prediction. The specific formulations are given in Equations (3) and (4).
y ^ ( x ) = μ ^ + r T R 1 ( y 1 μ ^ )
and
s 2 ( x ) = σ ^ 2 1 r T R 1 r + ( 1 1 T R 1 r ) 2 1 T R 1 1
In the equations, R is a matrix with entry R i j = C o r r ε ( x i ) , ε ( x j ) , r is an n-dimensional vector with entry r i = C o r r ε ( x ) , ε ( x i ) , y = ( y ( 1 ) , y ( 2 ) , , y ( n ) ) is the vector of the n observed function values, and 1 is an n-dimensional vector of ones.

2.2. Infill Criterion

The Minimizing the Predicted (MP) criterion is the simplest, most straightforward approach, and also one of the earliest adopted approaches. Its principle is to directly search for the minimum value of the objective function on the surrogate model. The mathematical formulation of this method is given in Equation (5).
M i n y ^ ( x ) s . t . x l b x x u b
The Expected Improvement (EI) criterion was first introduced by J Mockus et al. [36] and later generalized by Donald R. Jones [37]. Since then, EI has rapidly become the most popular infill criterion for computationally expensive optimization problems and has been widely adopted as the standard benchmark for newly developed algorithms [38,39,40,41,42,43,44]. The core concept of EI is to predict candidate points that are expected to yield performance improvement based on existing data. Specifically, it assumes that the current best objective function value is y min , while the Kriging surrogate model prediction follows a normal distribution with mean y ^ ( x ) and standard deviation s ( x ) . For a minimization problem, the objective function variable I ( x ) can be expressed as:
I ( x ) = M a x ( y min Y ^ ( x ) , 0 )
E I ( x ) = ( y min y ^ ( x ) ) Φ y min y ^ ( x ) s ( x ) + s ( x ) ϕ y min y ^ ( x ) s ( x )
Here, Φ ( x ) and ϕ ( x ) denote the standard normal cumulative distribution function and the standard normal probability density function, respectively. By maximizing the EI criterion, the corresponding new sample point x can be determined.
M a x E I ( x ) s . t . x l b x x u b
M a x M S E   y ^ ( x ) s . t . x l b x x u b

2.3. Principles of Efficient Global Optimization (EGO)

The Efficient Global Optimization (EGO) algorithm typically consists of two stages. In the first stage, an initial set of sample points is chosen through a sampling strategy to build the Kriging surrogate model. In the second stage, the Expected Improvement (EI) criterion is used to identify the most promising points, with the Kriging model being updated in each iteration to progressively approximate the global optimum. The procedure of the EGO algorithm is summarized in Algorithm 1.
Algorithm 1: The framework of the EGO algorithm
Require: Initial design set (X, Y)
Ensure: The best observation (xmin, ymin)
1: while the stop condition is not met, do
2: Building a Kriging model based on the current design set (X, Y)
3: xnew = argmax EI(x)
4: Evaluating xnew with the real function
5: X←X ∪ xnew
6: Y←Y ∪ ynew
7: ymin ←min(Y)
8: xmin ←x ∈ X: y(x) = ymin
9: end while
Due to the specific properties of the EI function, its value is zero at sampled points and positive at unsampled points. By selecting the point with the highest EI value in each iteration, the EGO process ensures that the update point can be any location other than the sampled points, thereby guaranteeing convergence. However, a major limitation of the EI criterion is that it can only generate one new sample point per iteration. This restricts the EGO algorithm from performing parallel evaluations of computationally expensive models in the second stage, and the efficiency of the EI criterion decreases in the later stages of optimization, leading to poor convergence performance. Given the widespread use of parallel computing frameworks in modern engineering applications and the growing demand for reducing computational time in practical optimization processes, this study extends the EGO algorithm by incorporating the MP criterion and an improved MSE criterion. This enhancement enables the addition of multiple sample points in each iteration, thereby better exploiting parallel computing resources to further reduce computational time. The details of this approach are discussed in the following subsection.
In the traditional EGO algorithm, the second sample point cannot be updated without first evaluating the initial point, since rebuilding the Kriging surrogate model requires the updated data from the first sample. As a result, the traditional EGO global optimization algorithm evaluates designs sequentially rather than in parallel. To address this limitation, the present study incorporates new infill criteria, namely the MP and MSE criteria, to improve the efficiency of the EGO algorithm. In addition, the search space of the MSE criterion is constrained, as defined in Equation (10). Specifically, new sample points are generated within a certain spatial radius centered on the current optimal solution. For a d-dimensional problem, the initial sample points are set to 10d, evenly spread across the entire design space. The search radius is defined as half of the spatial distance between adjacent initial samples, centered on the optimal solution identified by the current surrogate model. This setting primarily aims to balance the search range and accuracy during the sample addition process.
M a x M S E y ^ ( x ) s . t x x u b x l b 10 d × 1 2 x x + x u b x l b 10 d × 1 2
Here, x denotes the current best sample value, and x u b x l b 10 d × 1 2 represents the spatial radius centered on x . The procedure of this method can be summarized as Algorithm 2.
Algorithm 2: The framework of the parallel EGO algorithm
Require: Initial design set (X, Y)
Ensure: The best observation (xmin, ymin)
1: while the stop condition is not met, do
2: Building a Kriging model based on the current design set (X, Y)
3: xnew1 = argmin MP(x)
4: xnew2 = argmax EI(x)
5: xnew3 = argmax MSE(x)
6: Evaluating xnew1, xnew2 and xnew3 with the real function
7: X←X ∪ xnew1∪xnew2∪xnew3
8: Y←Y ∪ ynew1∪ ynew2∪ ynew3
9: ymin ←min(Y)
10: xmin ←x ∈ X: y(x) = ymin
11: end while

2.4. Method Validation

Yan et al. [45] systematically compared the optimization efficiency of the Efficient Global Optimization (EGO) algorithm with several representative optimization algorithms, including the Radial Basis Function (RBF) method, the DIviding RECTangles (DIRECT) algorithm, and Differential Evolution (DE). The optimization efficiency was assessed in terms of the number of objective function evaluations. As shown in Table 1, the EGO algorithm consistently required fewer function evaluations than the other algorithms on most benchmark functions, demonstrating higher optimization efficiency. The only exception was the Hartman 6 function, for which the EGO algorithm required slightly more function evaluations than the RBF method. Overall, these results indicate that the EGO algorithm generally achieves higher optimization efficiency than the compared algorithms.
To highlight the limitations of individual infill criteria, the single-sample update strategies based on MSP, EI, and MSE were compared with the parallel infill strategies MSP–EI, MSP–MSE, and EI–MSE, in which one and two samples were added per iteration, respectively. The benchmark function f ( x ) = x sin x , which possesses both a local minimum and a global minimum within the range of [0, 10], was adopted for validation. For clarity, the initial design consisted of only three sample points at 0, 5, and 10, corresponding to objective function values of 0, 4.7946, and 5.4402, respectively.
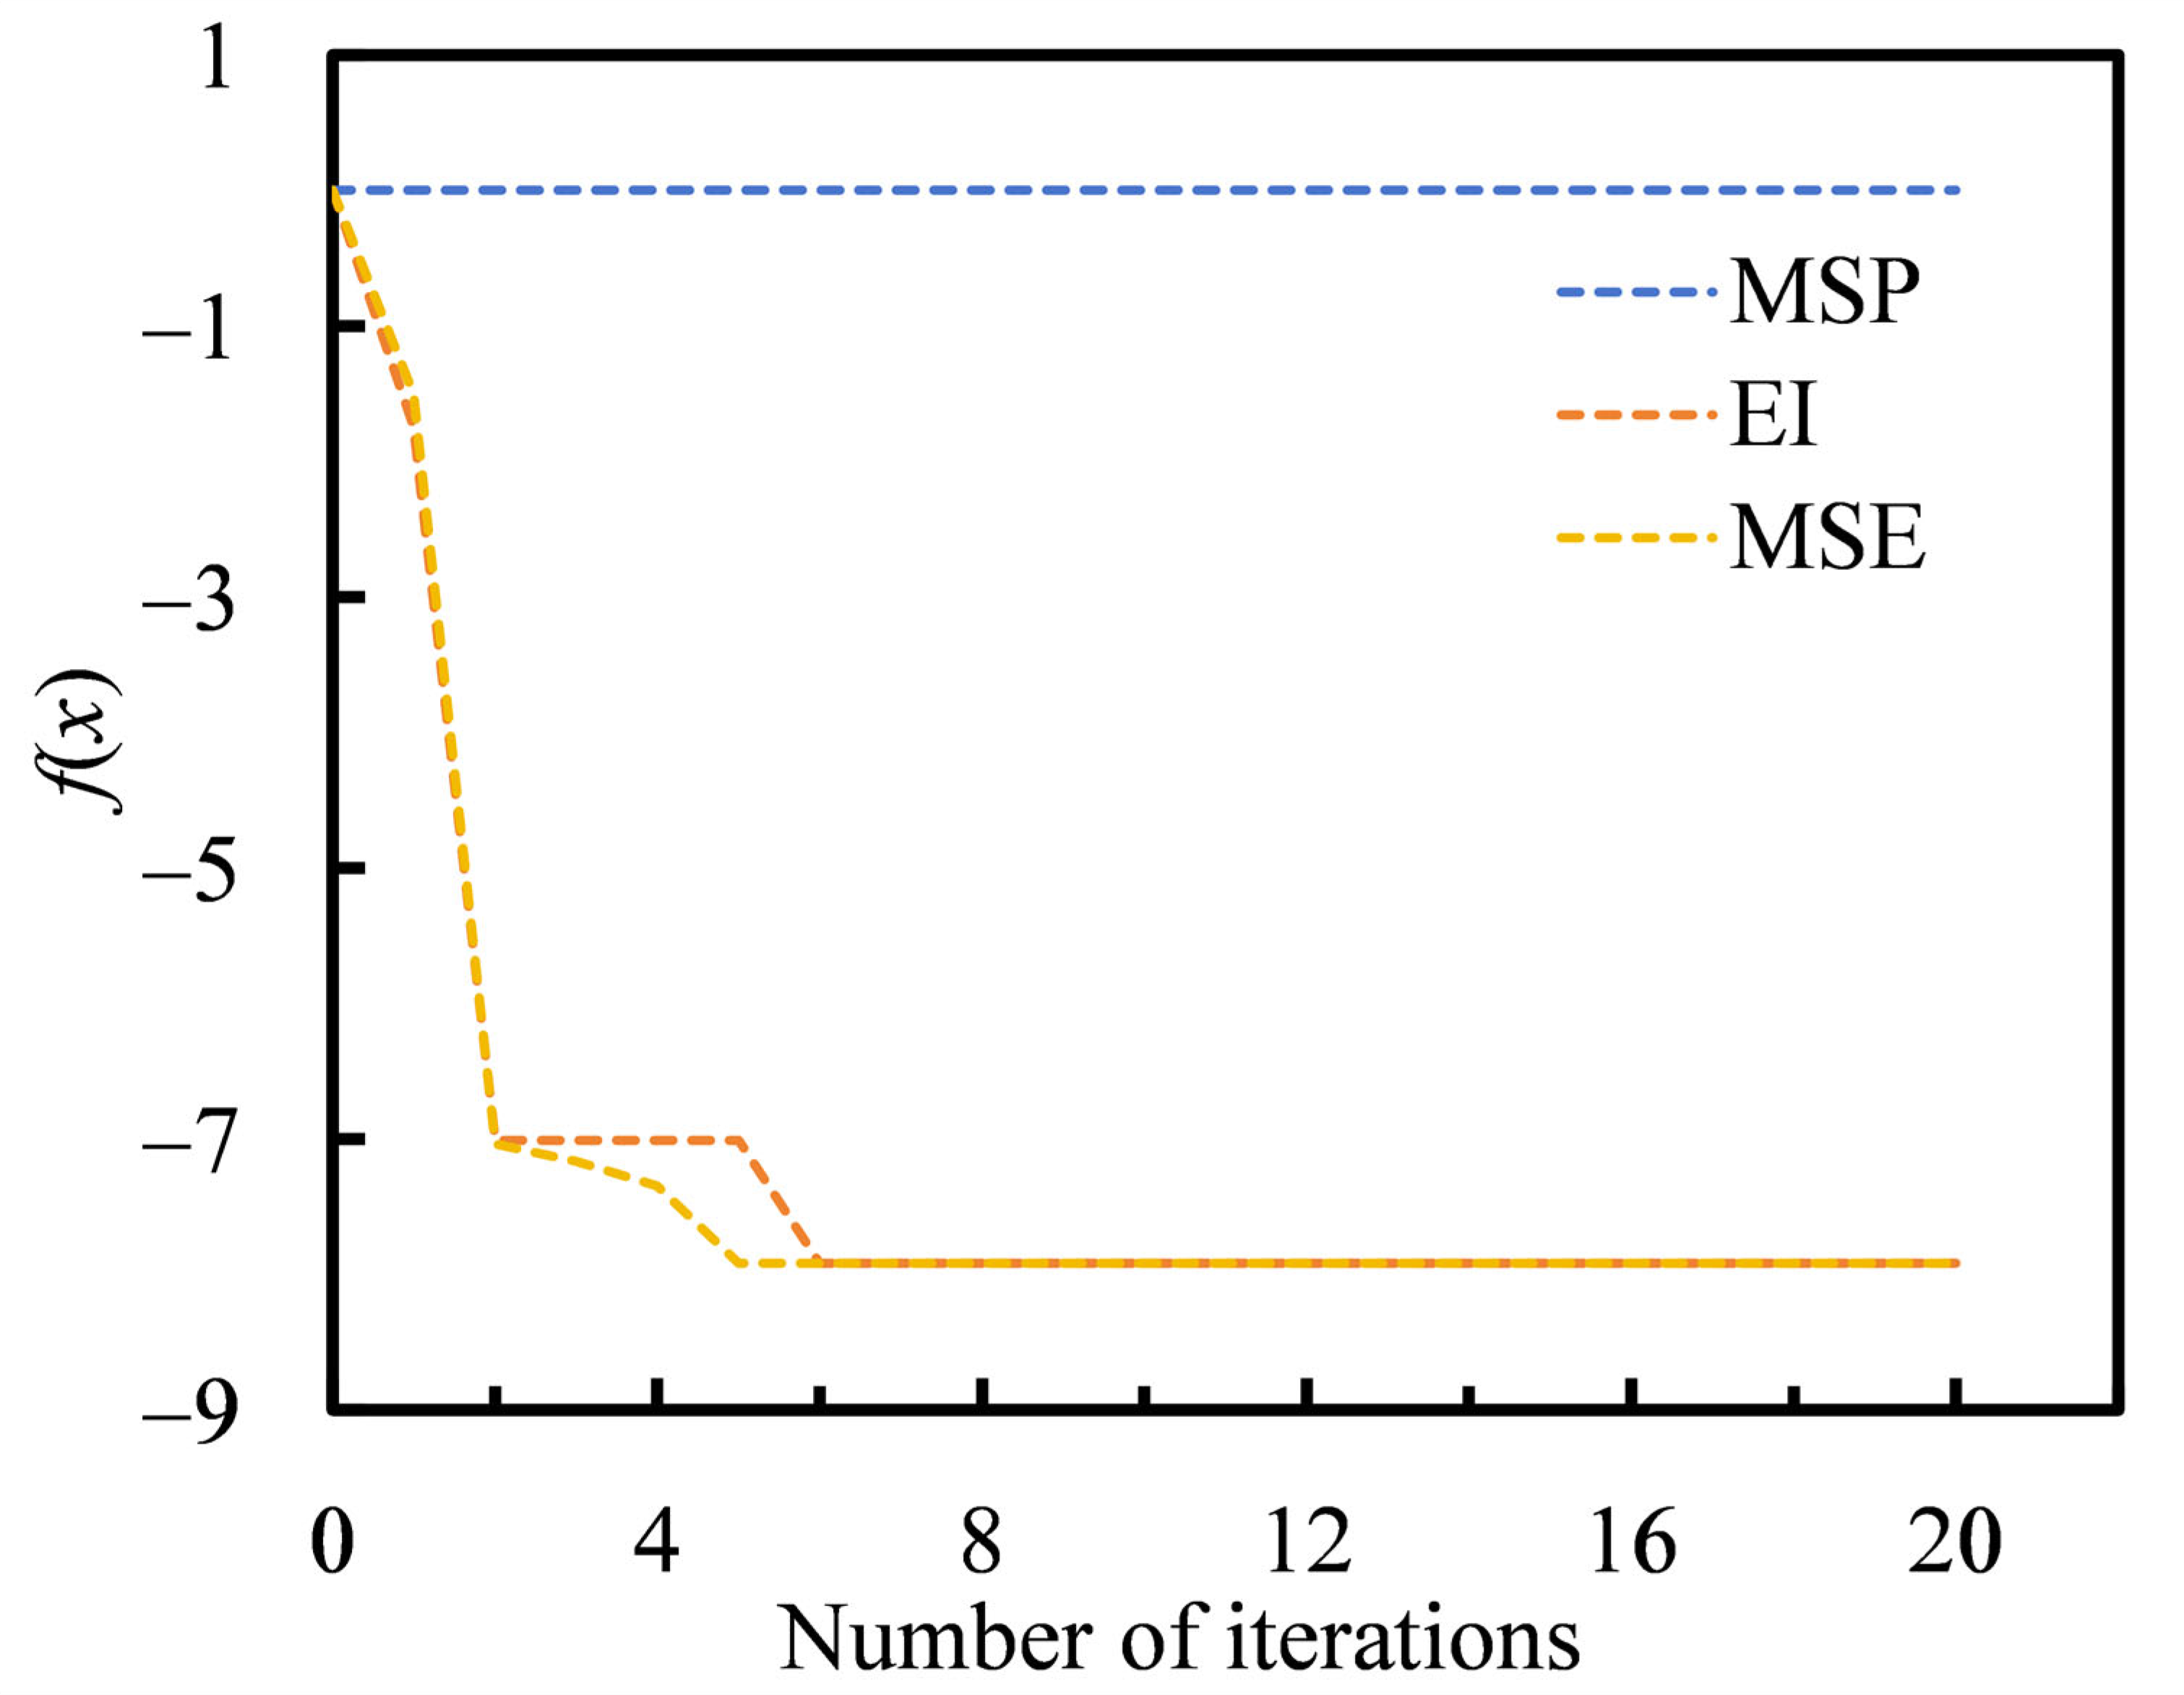
Figure 1 illustrates the convergence curves obtained using the single infill criteria. The results indicate that the MSP criterion exhibits poor convergence performance and remains trapped in a suboptimal region even after numerous iterations. This behavior arises because the initial surrogate model, established from the three initial samples, predicts the minimum objective value at x = 0. As the MSP criterion always selects the optimum of the current surrogate model for further sampling, the search process is confined to the vicinity of the current optimum and is unable to explore unexplored regions. Consequently, MSP behaves as a purely local search strategy and lacks the ability to escape from local optima. By comparison, the EI and MSE criteria converge to the global optimum after only 5–6 iterations. The primary reason is that both criteria incorporate global exploration mechanisms when determining new sampling locations. Therefore, they can effectively balance local exploitation and global exploration, enabling the optimization process to escape local optima and identify the true global optimum with significantly fewer iterations.
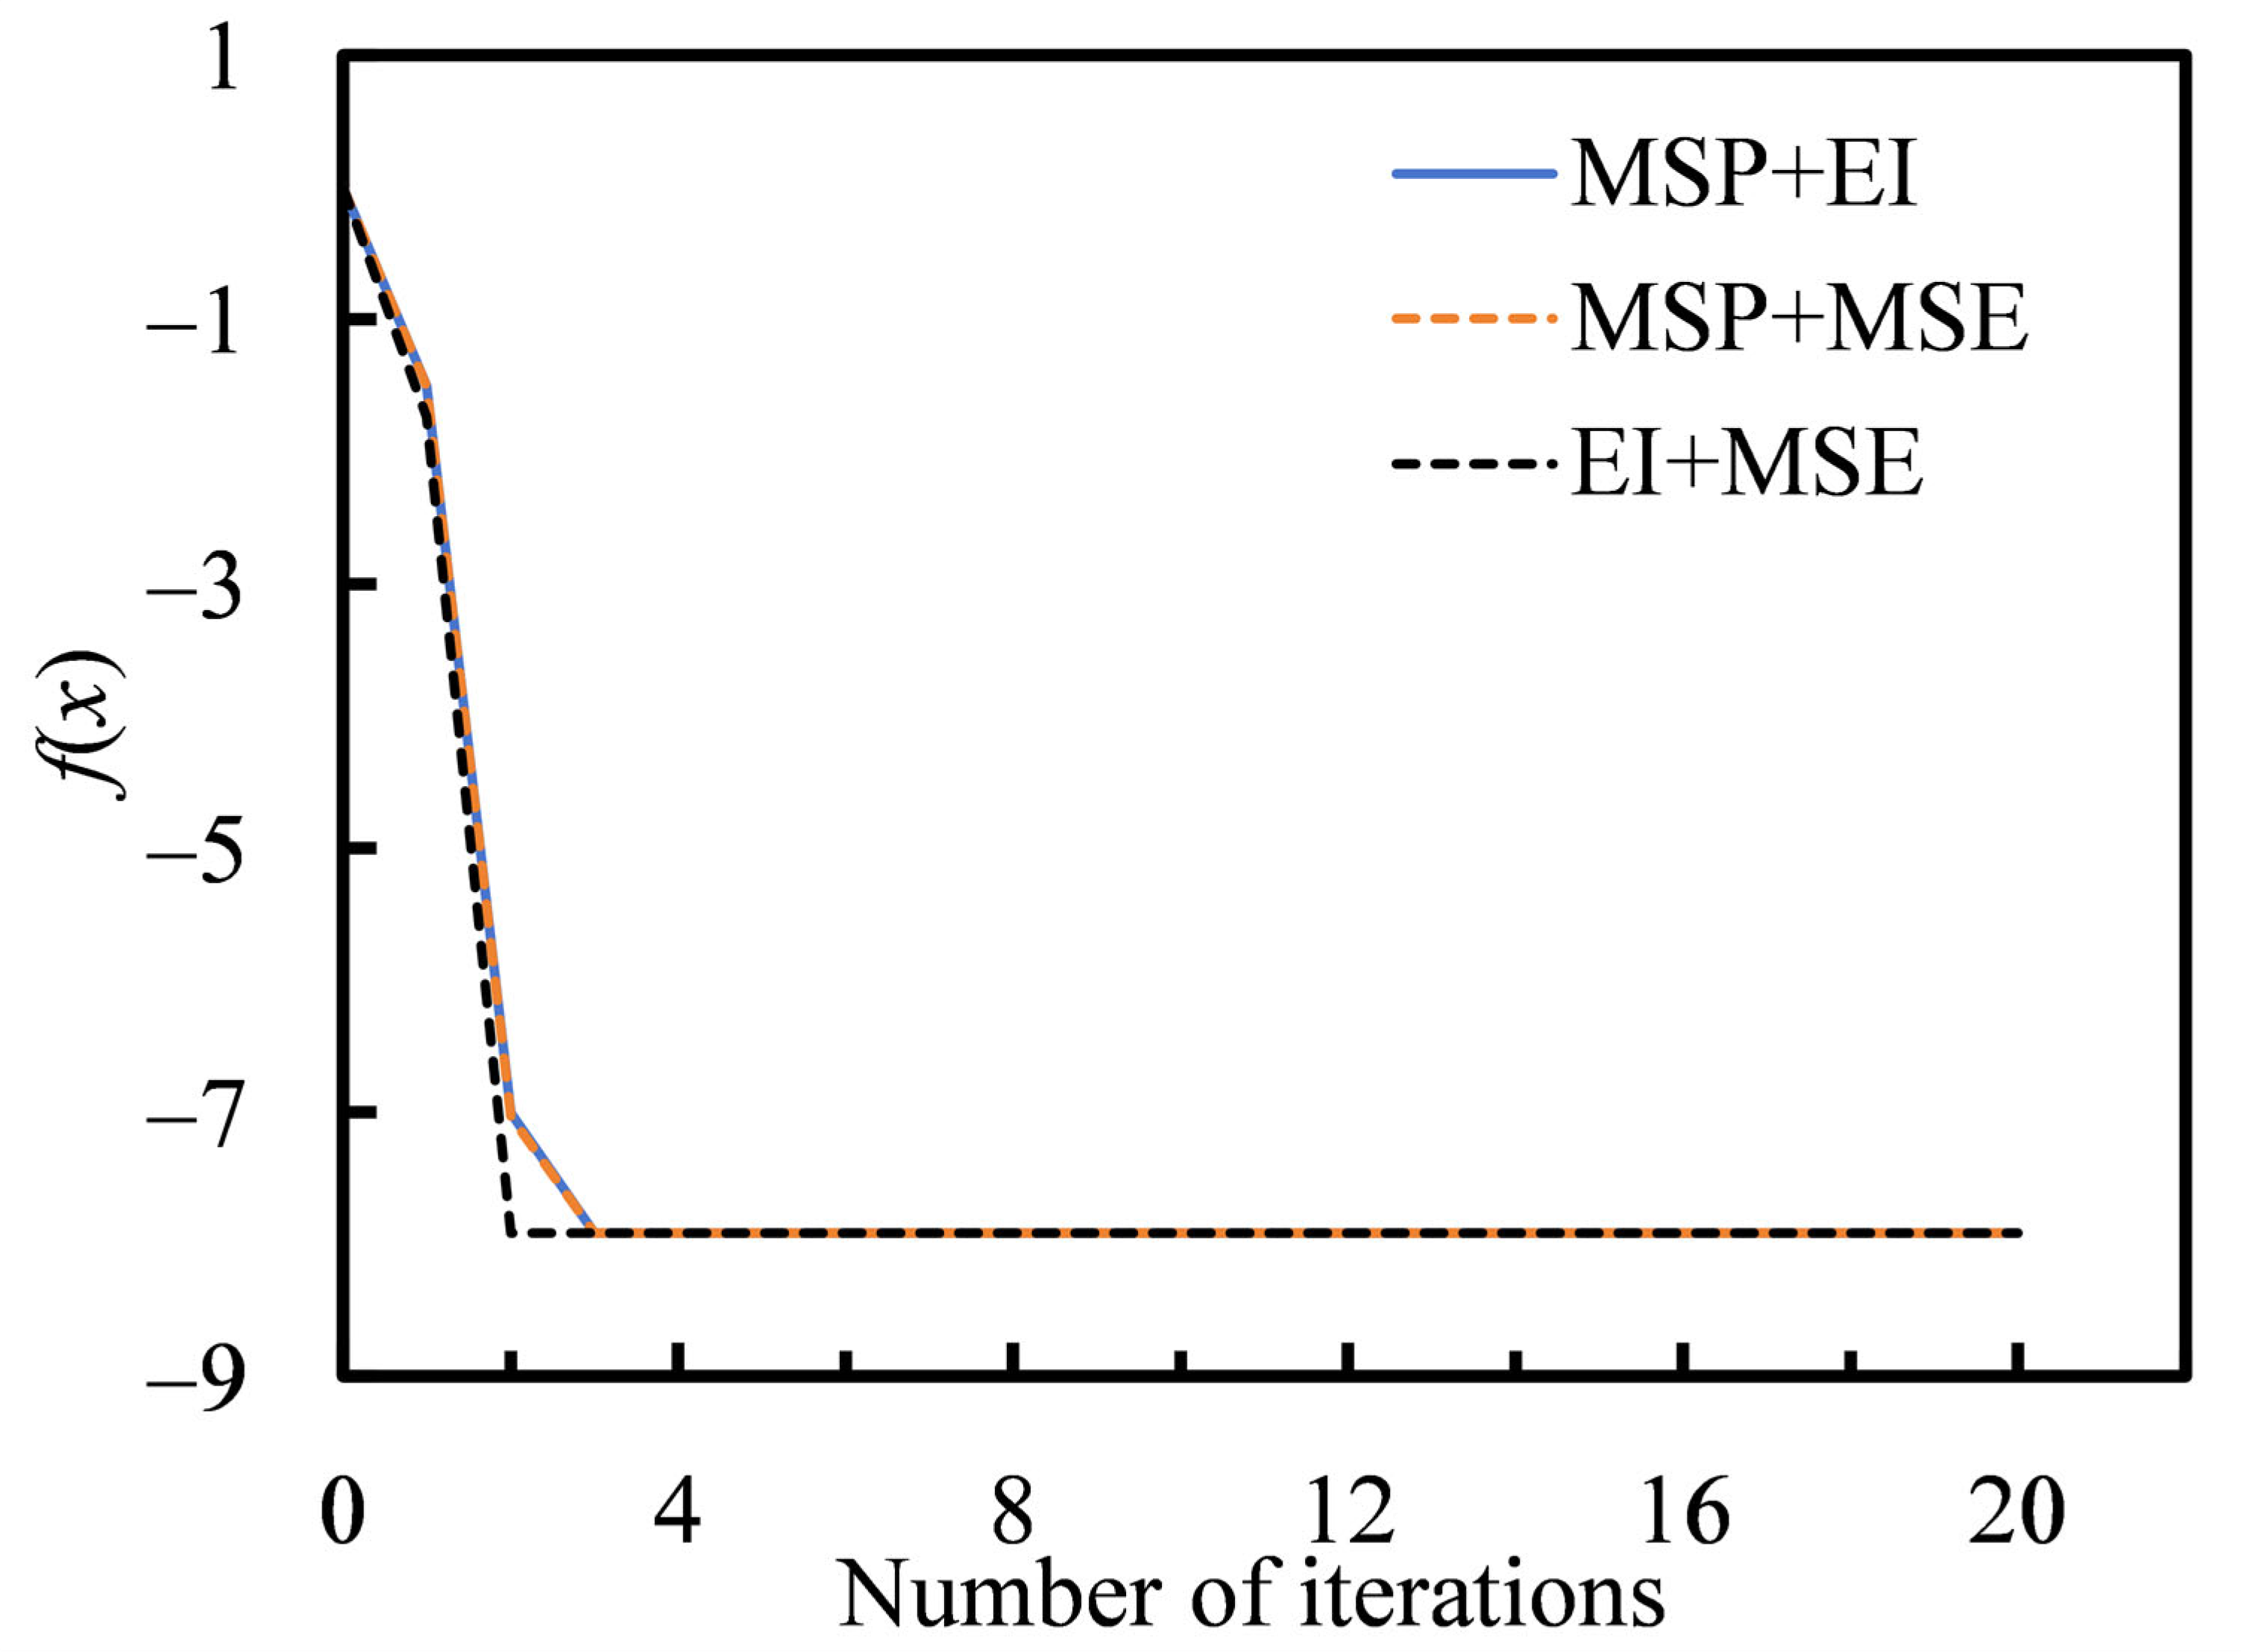
Figure 2 shows the convergence histories of the parallel infill criteria. It is evident that all parallel infill strategies reach the global minimum after only 2–3 iterations. In comparison with the single-point infill strategies, the number of iterations required for convergence is reduced by nearly half, while the total number of sample evaluations remains unchanged. This improvement is attributed to the simultaneous addition of multiple samples during each iteration, which enhances the information acquisition efficiency of the surrogate model. Consequently, parallel infill criteria offer substantially higher optimization efficiency and are particularly advantageous in applications where adequate computational resources are available for parallel evaluations.
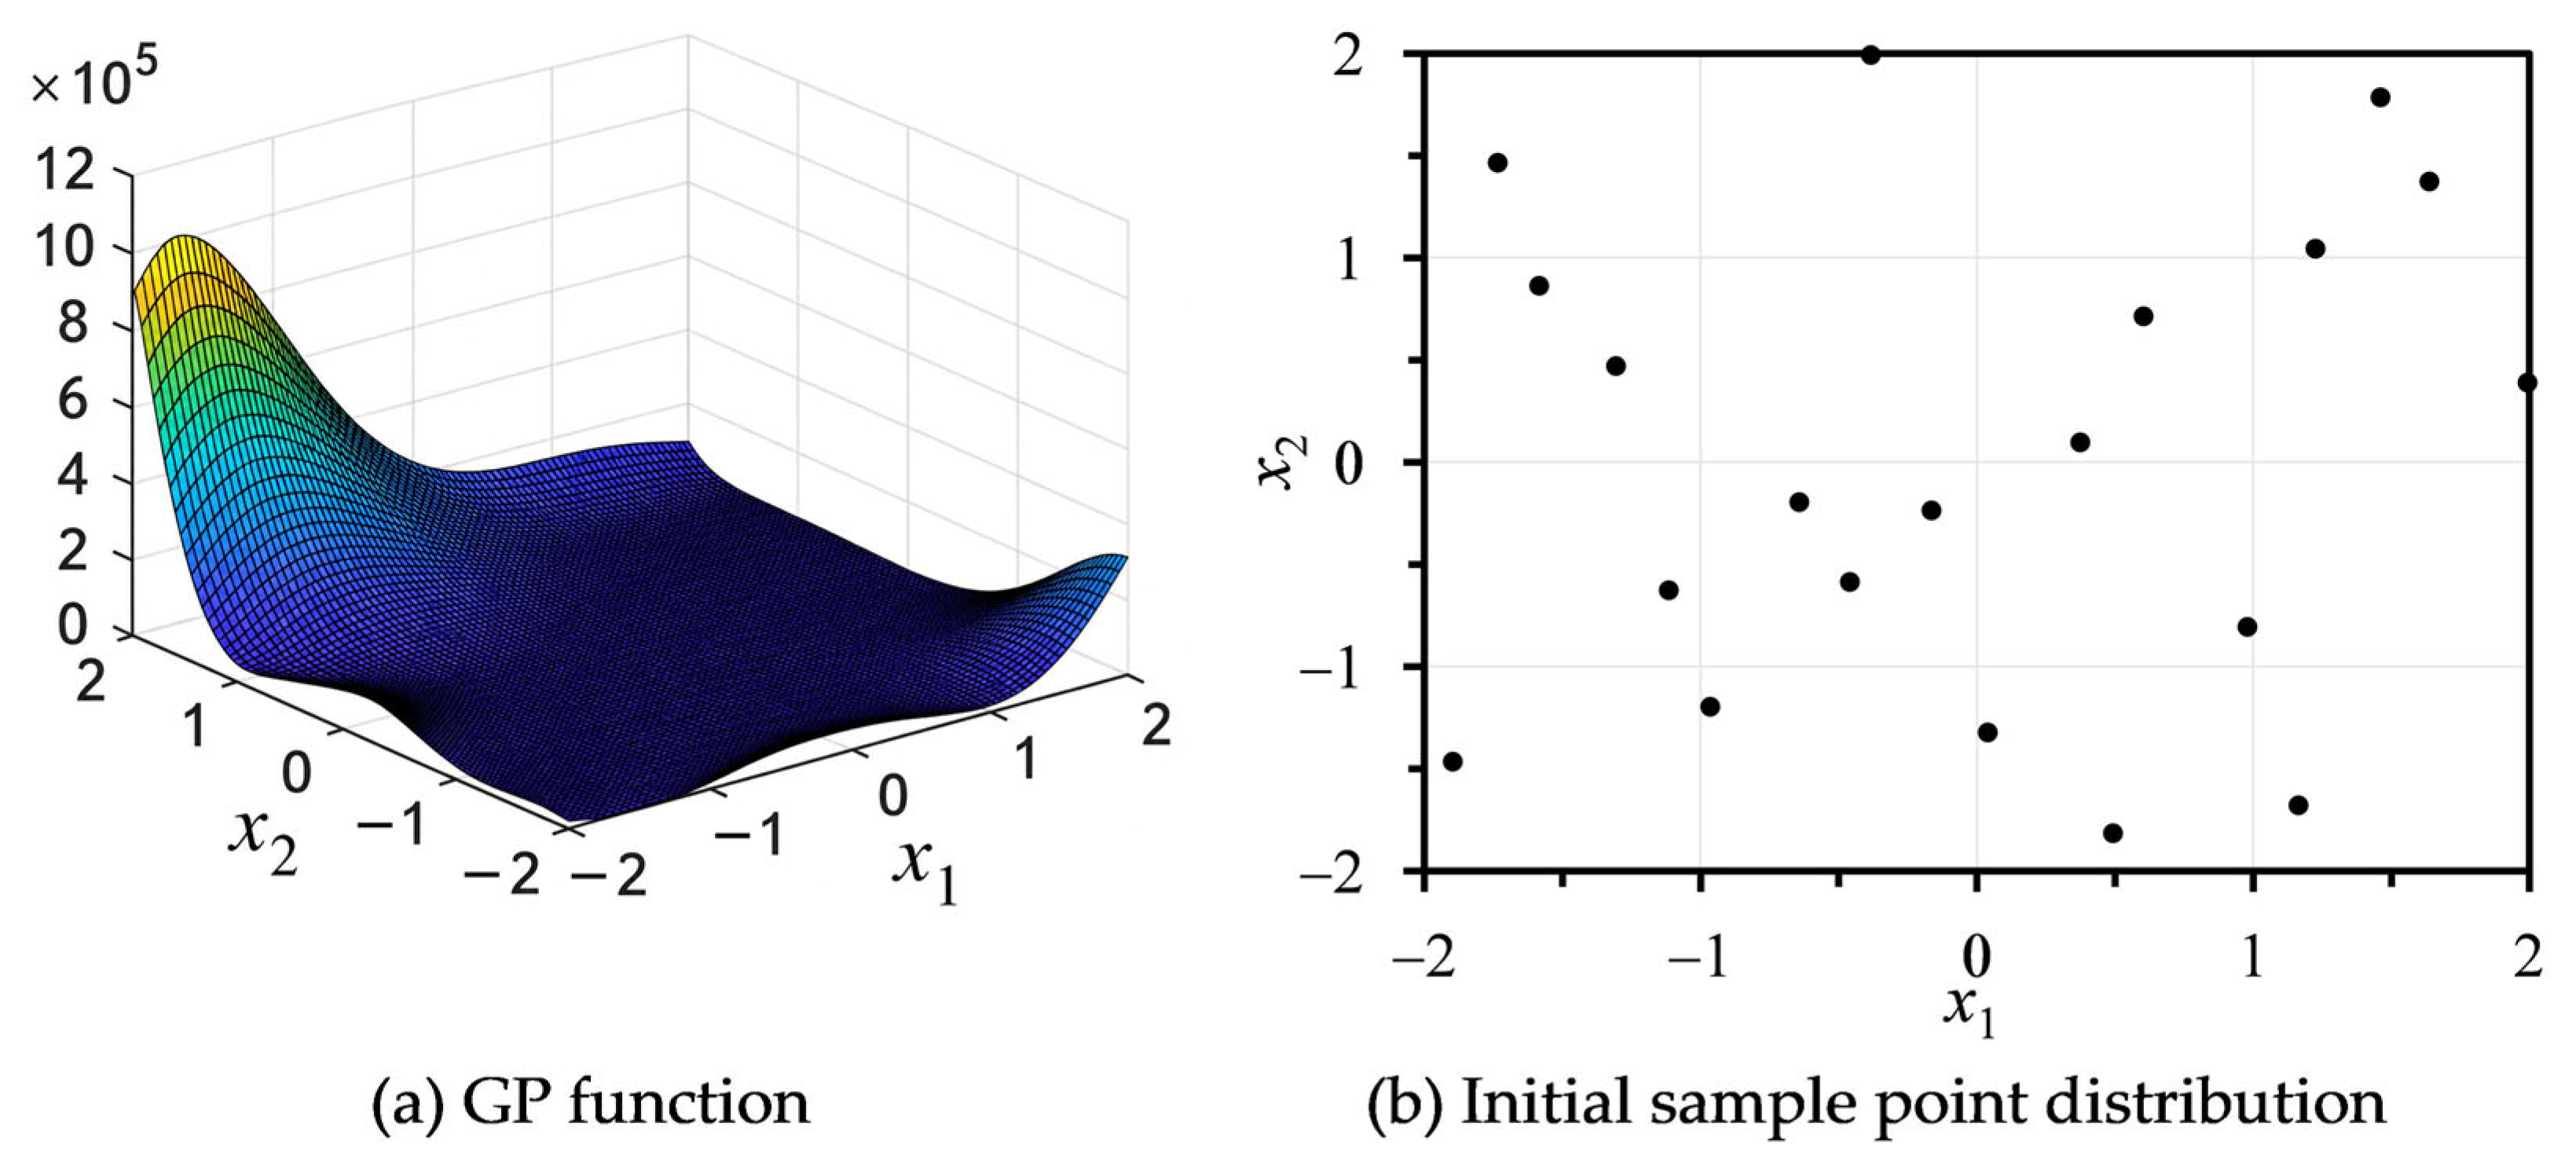
To further evaluate the robustness and reliability of the proposed parallel infill strategies, five dual-point sampling approaches based on the MSP–EI, MSP–MSE, MSP–PI, MSP–WEI, and MSP–LCB criteria were investigated. The well-known Goldstein–Price (GP) benchmark function, given in Equation (11), was employed for performance assessment. Figure 3 depicts the response surface of the GP function within the design space [−2, 2] together with the distribution of the 20 initial sample points generated using Latin Hypercube Sampling (LHS).
f ( x 1 , x 2 ) = [ 1 + ( x 1 + x 2 + 1 ) 2 ( 19 14 x 1 + 3 x 1 2 14 x 2 + 6 x 1 x 2 + 3 x 2 2 ) ] × [ 30 + ( 2 x 1 3 x 2 ) 2 ( 18 32 x 1 + 12 x 1 2 + 48 x 2 36 x 1 x 2 + 27 x 2 2 ) ]
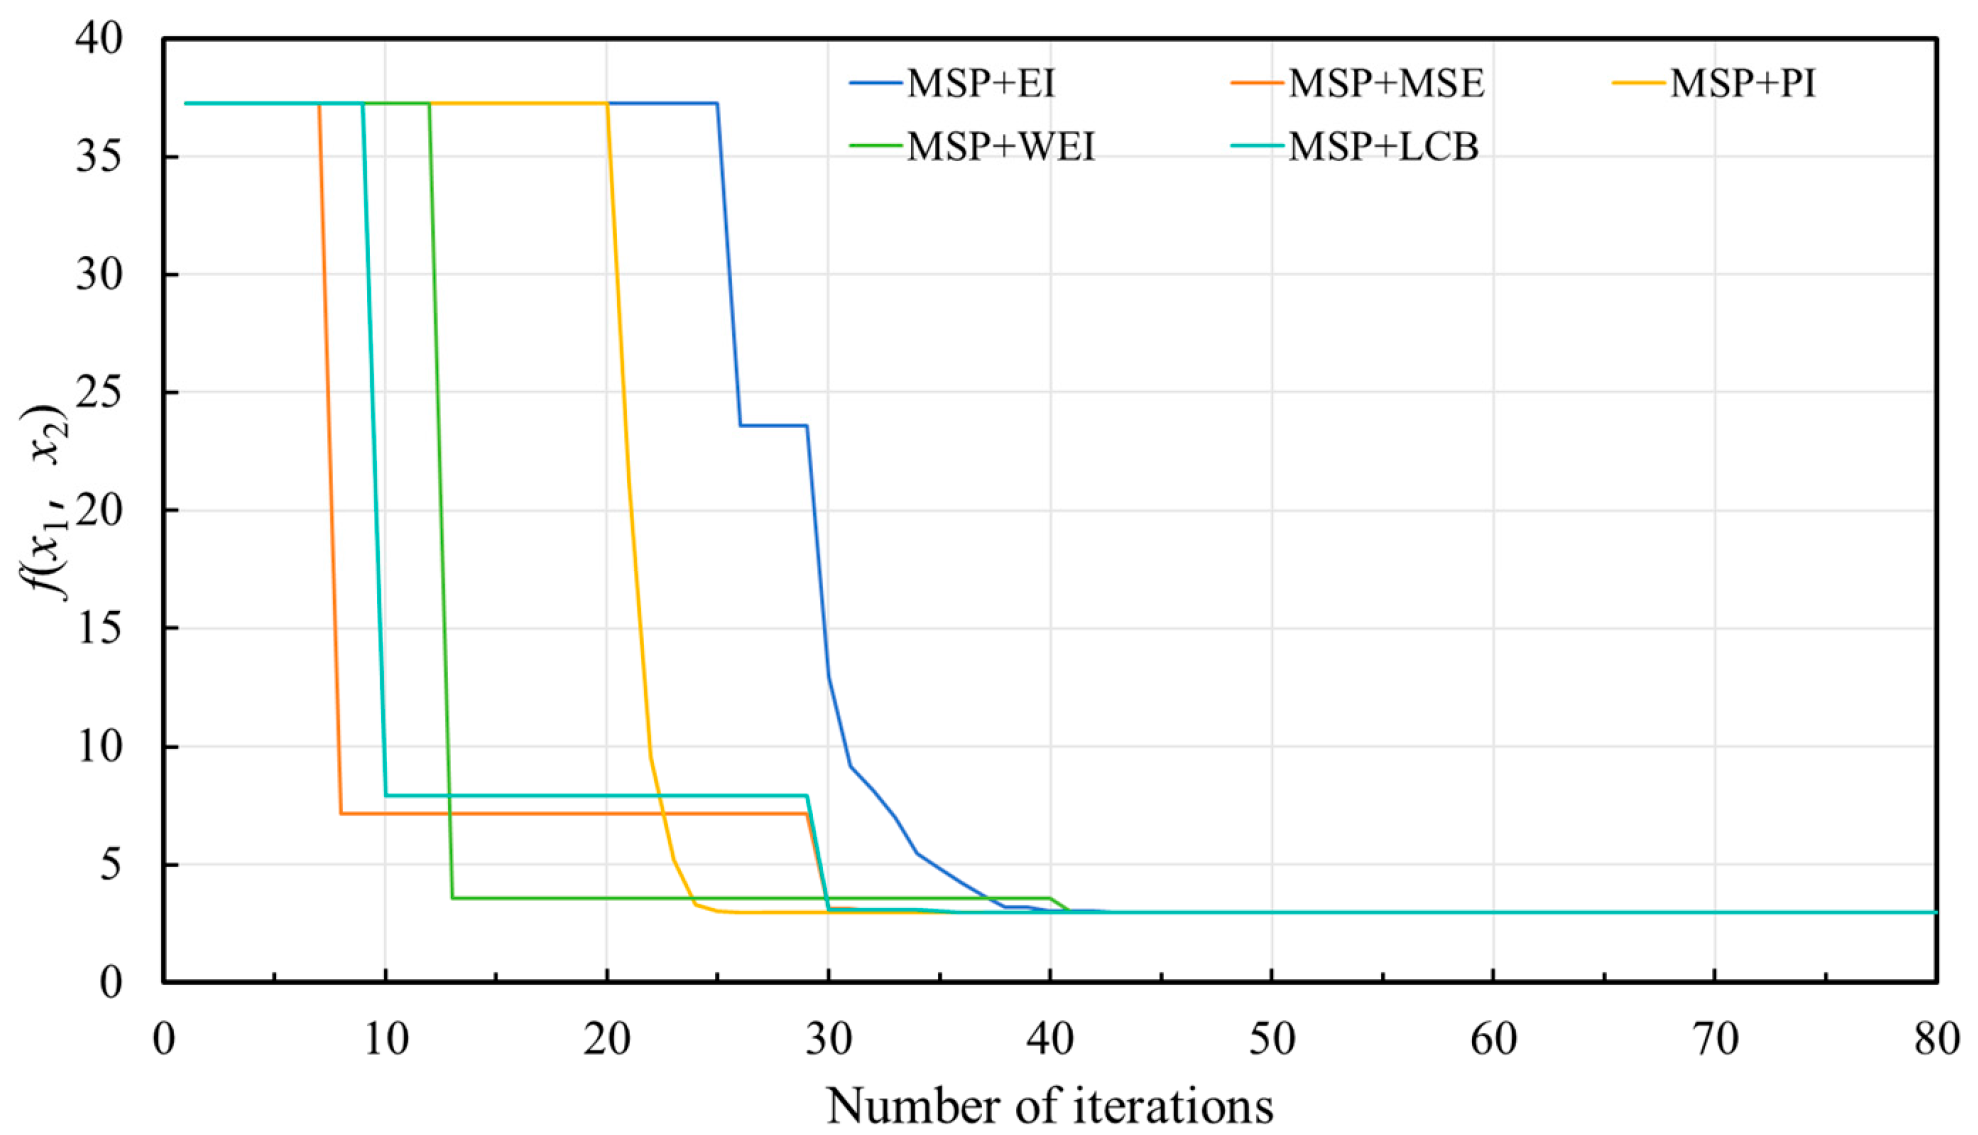
Figure 4 illustrates the convergence behavior of the five dual-point sampling strategies based on different parallel infill criteria. It can be seen that the MSP–EI and MSP–PI strategies begin to converge rapidly only after approximately 20 iterations. By contrast, MSP–LCB, MSP–MSE, and MSP–WEI exhibit a significantly faster convergence rate, approaching the optimum within the first 10 iterations. After this stage, these strategies mainly focus on global exploration of the design space before gradually reaching the final optimum. Despite the differences in convergence rates, all five strategies successfully converge within approximately 40 iterations. This observation demonstrates the strong robustness and reliability of the proposed parallel infill framework. By integrating a local exploitation criterion with a global exploration criterion, the parallel infill strategies effectively maintain a balance between exploitation and exploration, leading to stable and consistent optimization performance.
The foregoing results have verified the effectiveness and stability of the dual-sample parallel infill strategies. Motivated by these observations, a novel three-point parallel infill criterion, denoted as MSP–EI–MSE, is further developed in this study. The proposed strategy simultaneously incorporates the MSP, EI, and MSE criteria to select three candidate samples at each iteration, with the aim of further improving sampling efficiency while maintaining optimization accuracy.
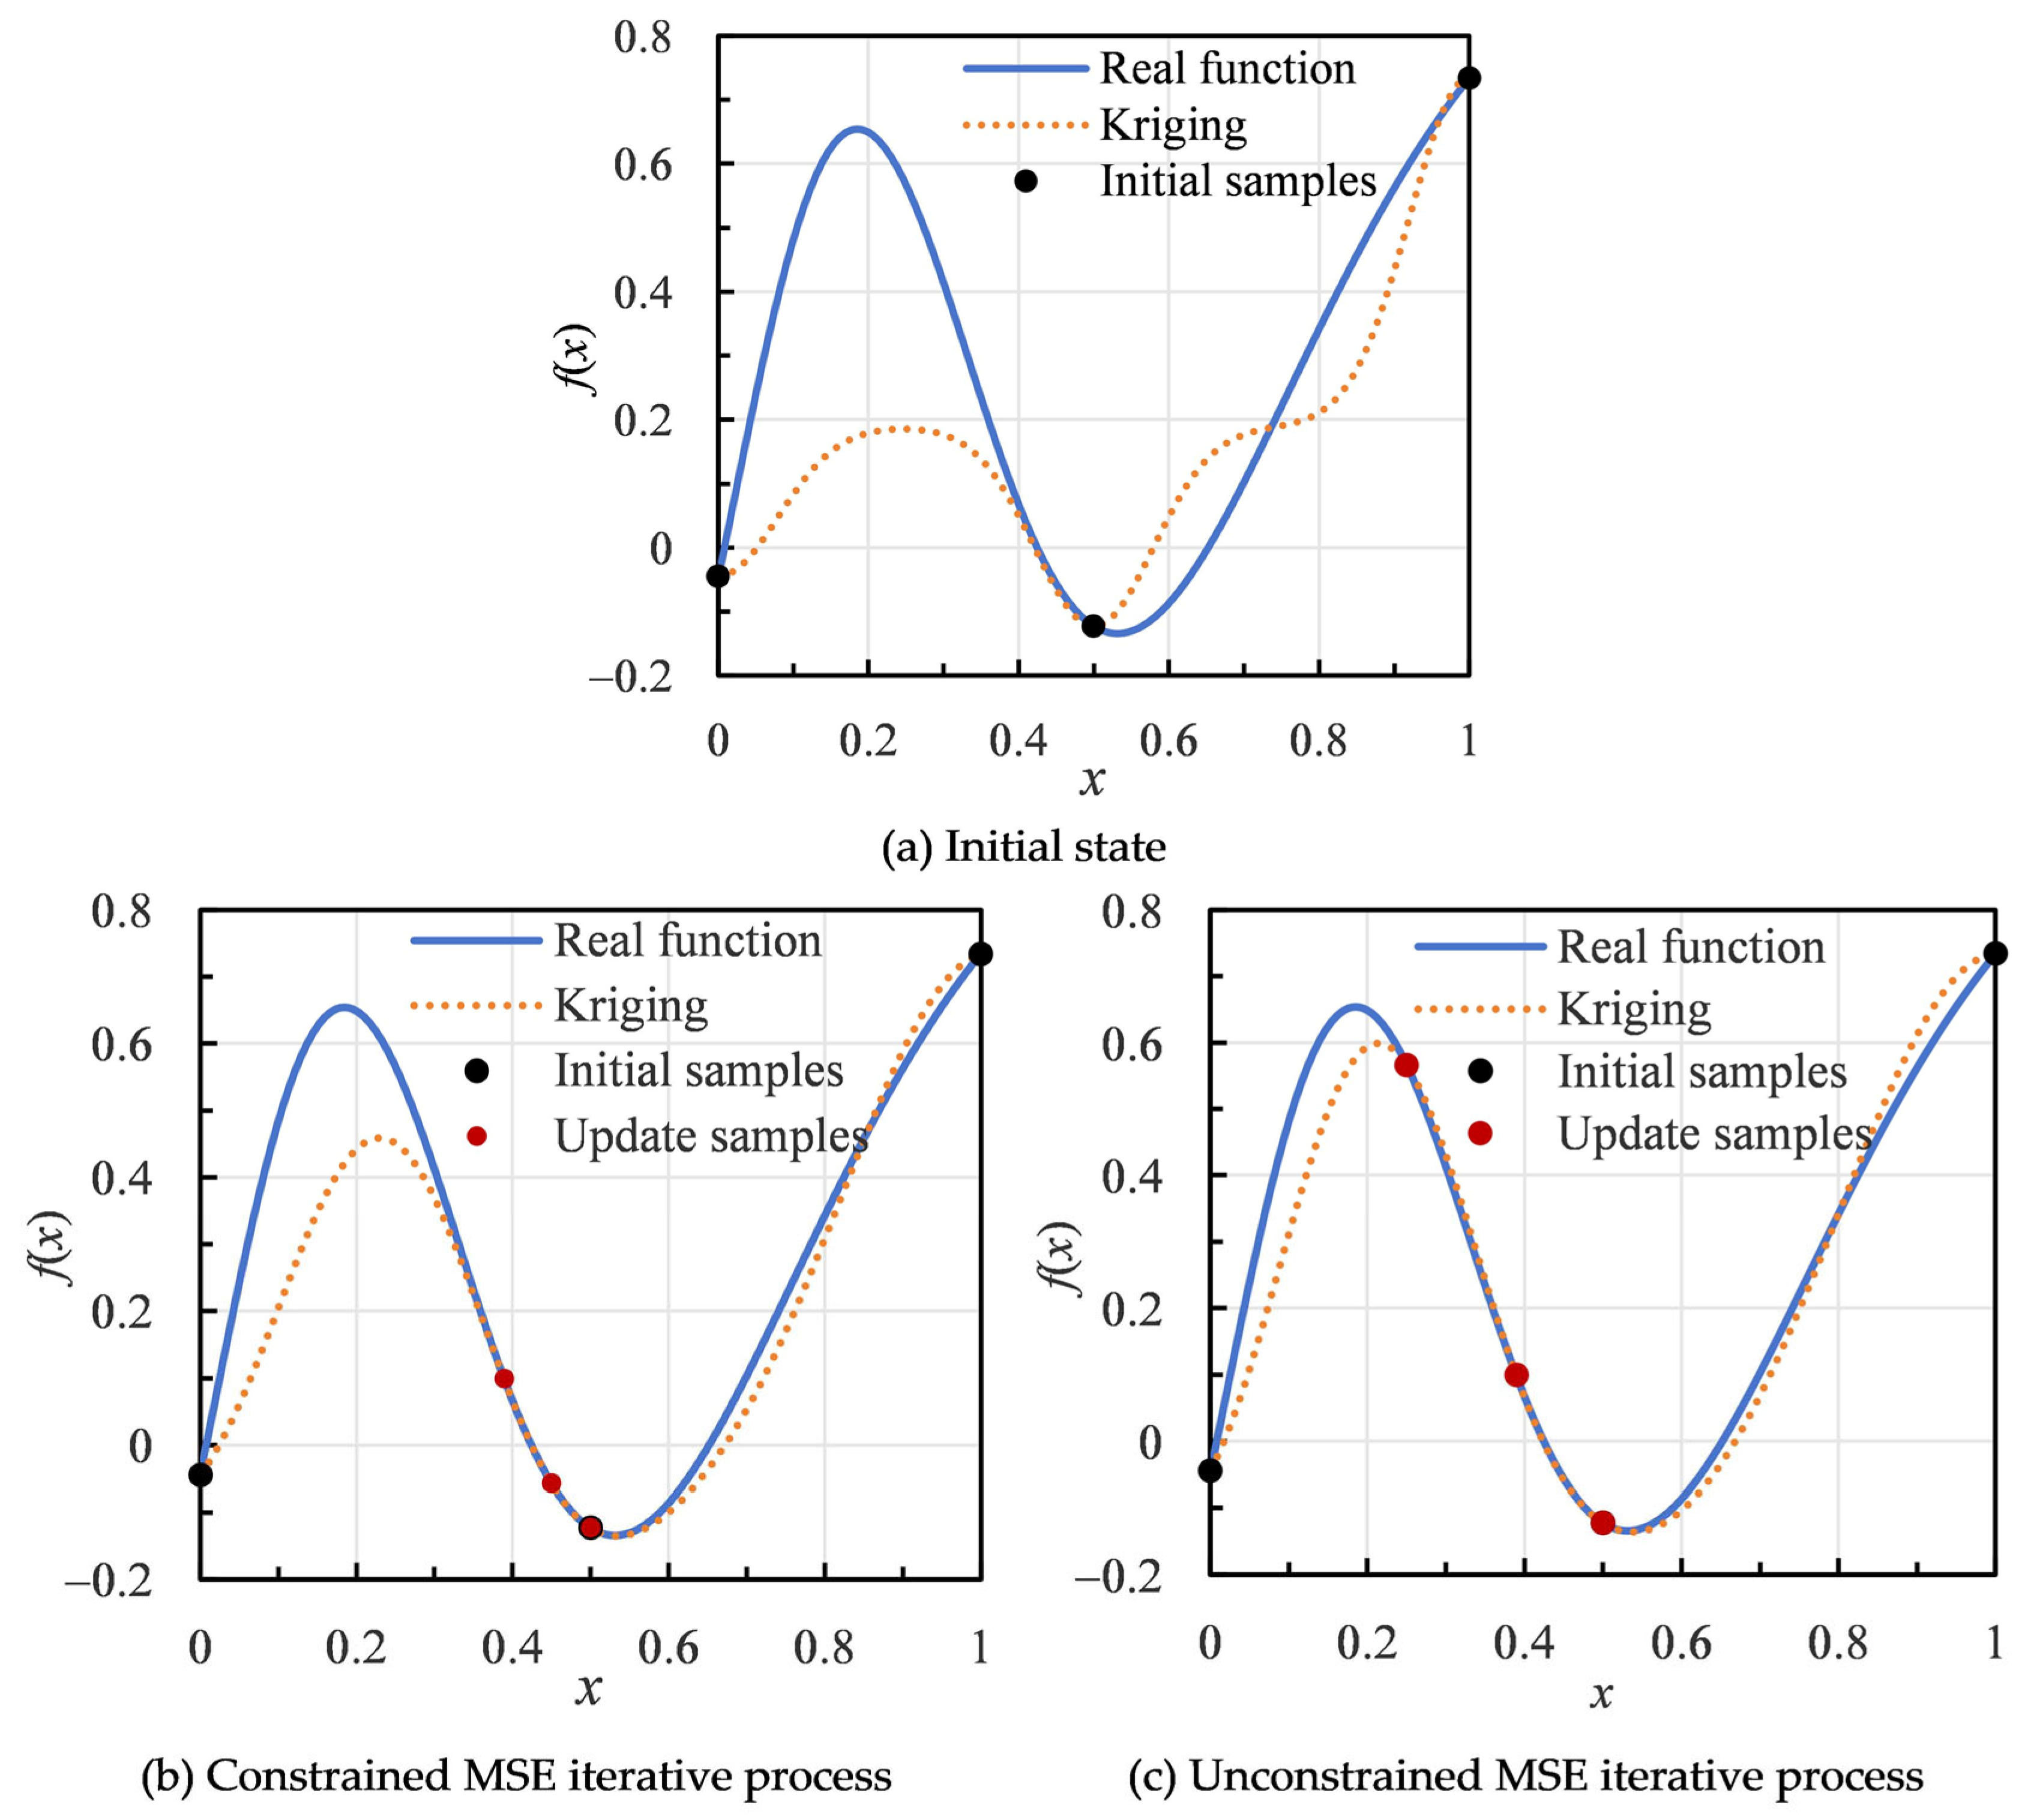
A distinctive feature of this method is the introduction of constraints on the MSE criterion, which ensures faster convergence. To demonstrate the characteristics of the proposed technique, the test function f ( x ) = 0.5 ( 4 π sin ( 0.5 + x ) ) + ( x + 0.5 ) 2 / 3 was selected for comparison with the unconstrained MSE criterion. The minimum of this function is located at x = 0.5312 , with f ( x ) = 0.1341 . The convergence condition was defined as achieving an error within ±0.2% of the minimum value. The initial sample points were set at 0, 0.5, and 1, with the corresponding f ( x ) values being −0.0445, −0.1229, and 0.7343, respectively.
For both the constrained and unconstrained MSE search regions, the Kriging surrogate models established from the initial sample points are shown in Figure 5. At this stage, the error is −8.137%, which does not satisfy the convergence condition; thus, the sample points must be further updated. Under the constrained MSE criterion, the first iteration searches in the vicinity of the current optimum, ensuring high fitting accuracy around the best point. As a result, the global optimum is identified after the first iteration, with an error of −0.102% relative to the true minimum, which satisfies the convergence condition (error < 0.2%). In contrast, for the unconstrained MSE criterion, the first iteration expands the search region. While this improves global accuracy, it reduces convergence efficiency, yielding an error of −0.370% after the first iteration. Therefore, a second iteration is required to meet the convergence condition.
In summary, although the unconstrained MSE criterion explores a wider search space and can improve the overall accuracy of the surrogate model, the sampled regions are not necessarily located near the true optimum. As a result, additional iterations are required, leading to unnecessary consumption of computational resources and time.
Table 2 demonstrates the reliability of the proposed method in terms of efficiency and robustness through standard test functions. Table 3 compares the average number of iterations and variance of the two methods across 11 benchmark functions, as presented in Table 1. The results show that the proposed EGO algorithm significantly outperforms the EW-LCB method, with an improvement in efficiency of 22.46% and a reduction in variance of 45.14%. Further verification can be found in previously published articles [46].

3. Optimization of Floating Platforms

3.1. Optimization Scheme

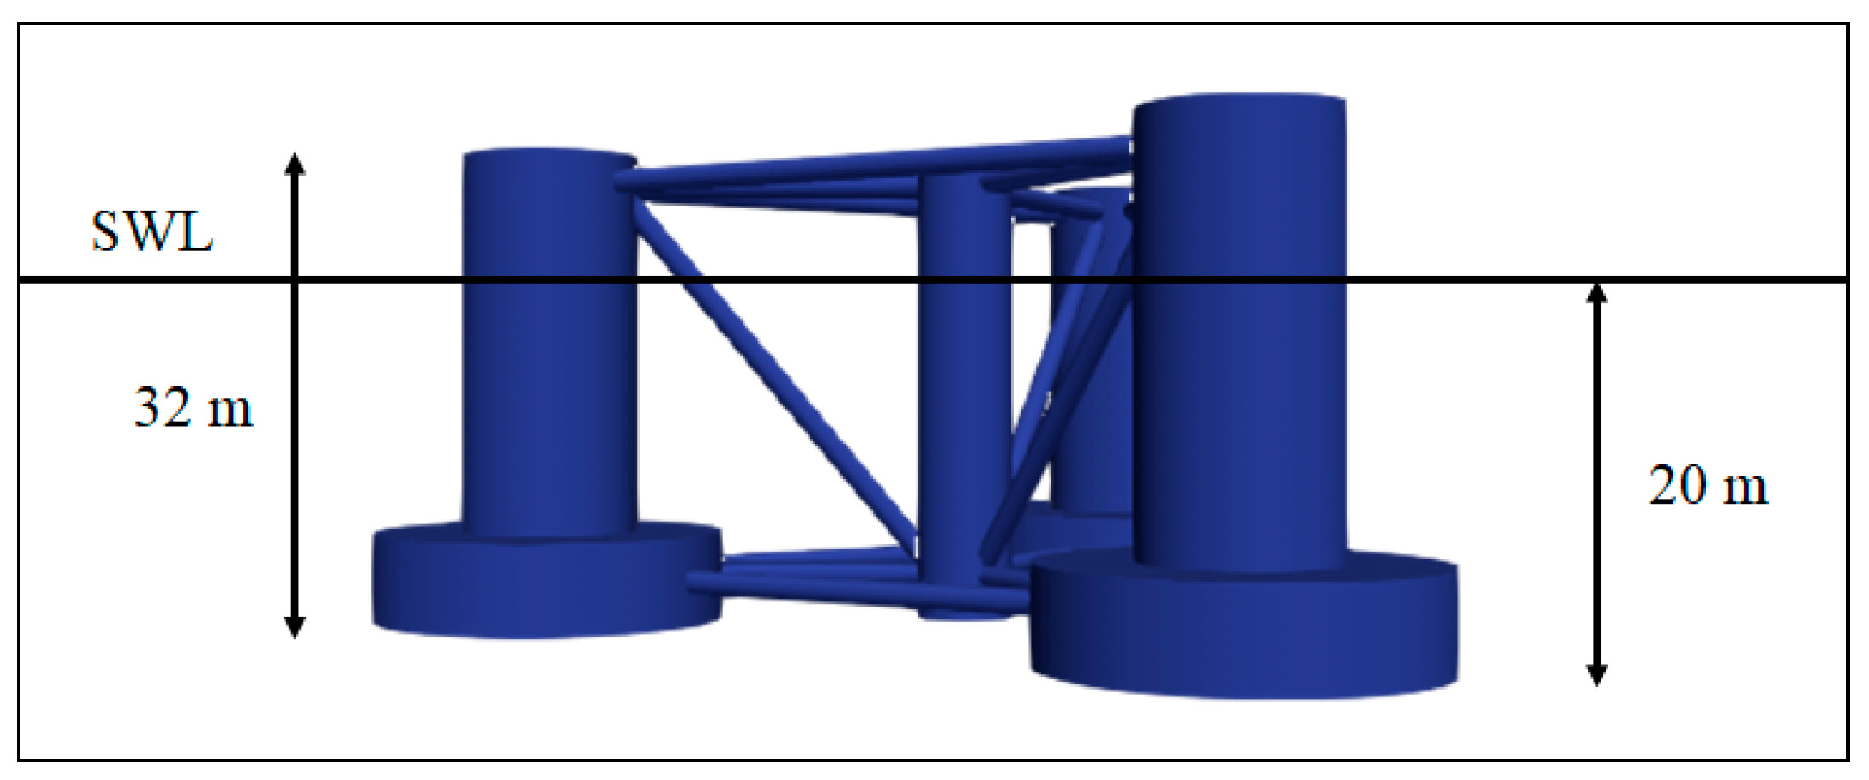
To verify the reliability of the new algorithm proposed in Section 2 for engineering applications, this paper selects the optimization design of a floating wind turbine platform. It should be noted that, to maintain computational tractability, we have simplified the platform design application by considering only the current-induced drag on the substructure, excluding wave loads and mooring line dynamics. The wind turbine model used in this study is the OC4 DeepCwind Semi-submersible 5 MW FWT proposed by the National Renewable Energy Laboratory (NREL) [47], as shown in Figure 6. The OC4 floating platform is designed with a draft of 20 m, a main buoyancy column diameter of 6.5 m, and a main buoyancy column height of 30 m. The upper column has a diameter of 12 m and a height of 26 m, while the base column has a diameter of 24 m and a height of 6 m. A comprehensive list of parameters is provided in Table 4.
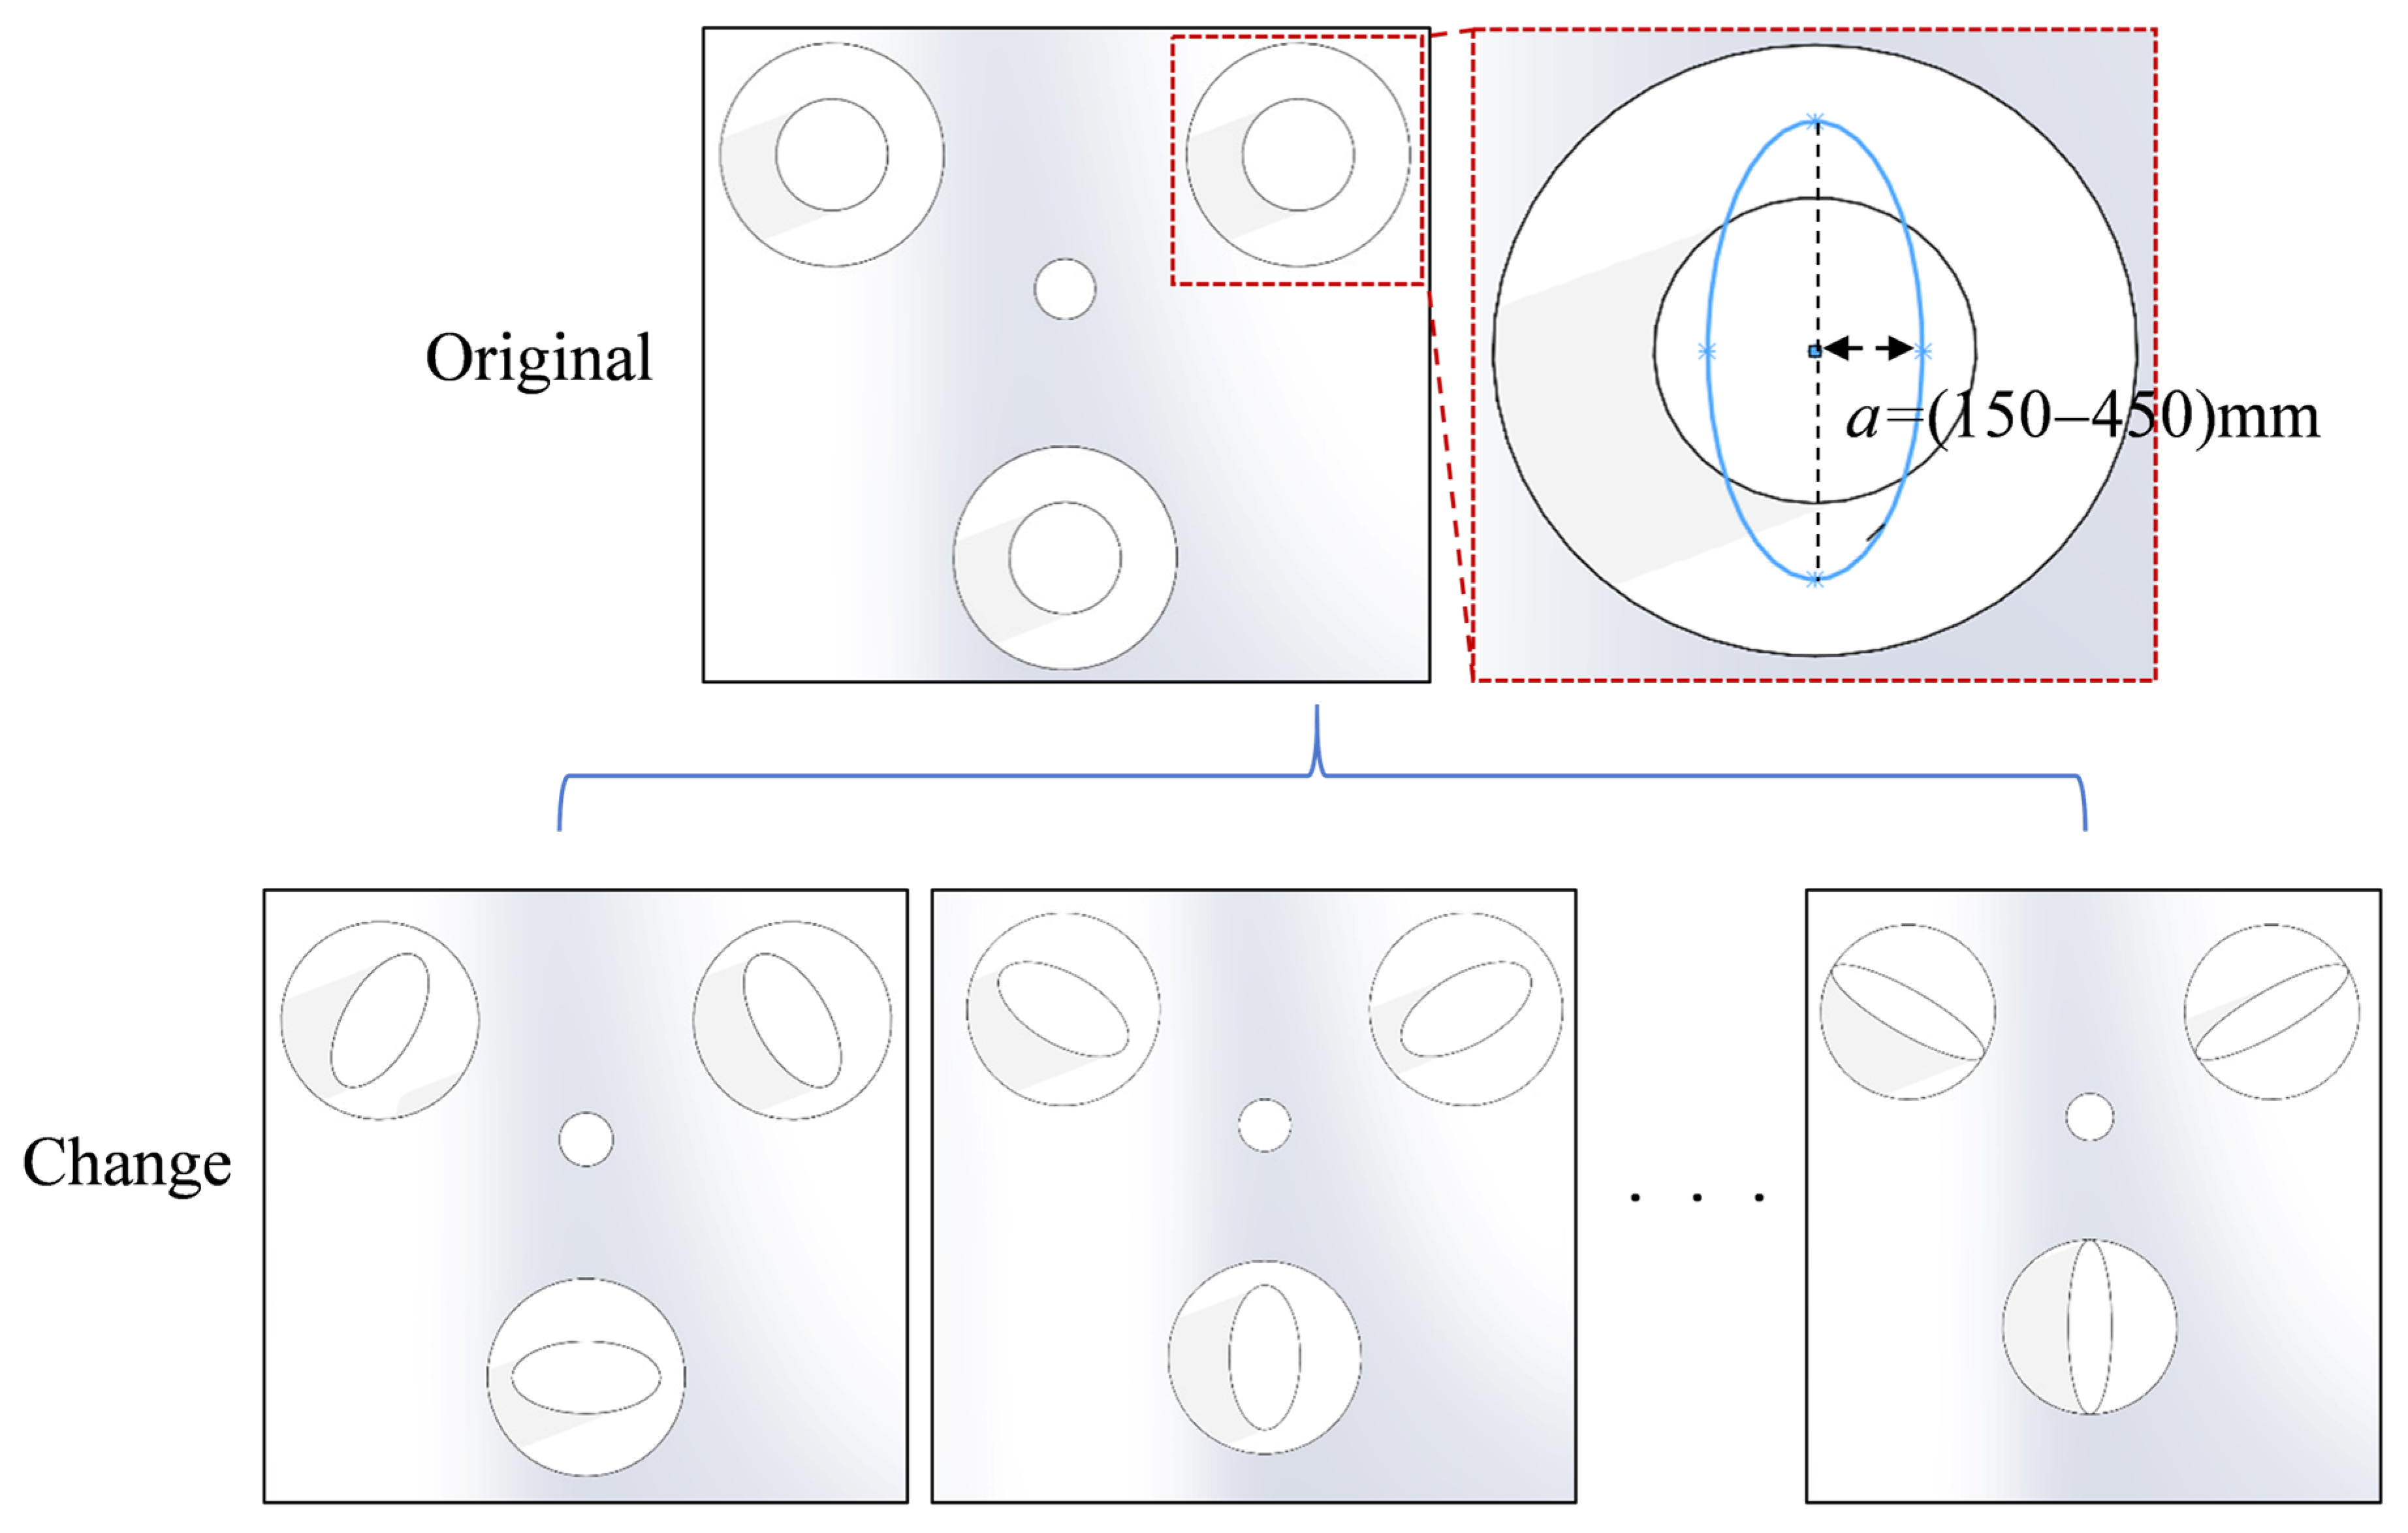
The shape of the offset columns is modified by varying the cross-sectional geometry. The original cross-sectional shape was changed from circular to elliptical because the elliptical shape is more favorable for reducing drag [48,49]. The deformation parameter a, defined as the minor or major axis of an ellipse, is used to control the variation in the cross-section, as illustrated in Figure 7. The constraint is that the total volume of the floating platform remains unchanged. The parameter a ranges from 150 mm to 450 mm (Table 5), with the three offset columns maintaining identical shapes and being evenly distributed around the central column. The bounds are set as ±150 mm from the baseline, which represents a ±50% variation relative to the original geometry. This ensures that the exploration range is sufficiently large while also being consistent with real-world conditions. It is important to note that this optimization design ensures that the draft of the floating platform remains unchanged throughout the optimization process, thereby guaranteeing constant displacement capacity.
For this optimization problem, which is one-dimensional, ten initial sample points were selected at 150, 180, …, 450 mm. Due to limited computational resources and the relatively low dimensionality of the optimization problem, the process was terminated after three iterations. It should be noted that the present engineering application is intentionally simplified, involving a single design variable under steady current loading, and is intended to serve as a proof-of-concept demonstration of the proposed optimization framework rather than a comprehensive engineering design study. The capability of the proposed algorithm for higher-dimensional and more complex problems has been independently demonstrated through the benchmark validation in Section 2.4. Future work will extend the optimization to higher-dimensional design spaces incorporating additional geometric variables (e.g., column spacing, draft, and brace dimensions) and more realistic loading conditions, including wave–current interaction and multi-directional loading. Possible deformations during the optimization are illustrated in Figure 7. Different parameter values ensure that the optimized OC4 floating platform maintains symmetry and isotropy, with symmetry preserved along the longitudinal cross-section.
Therefore, the optimization problem can be formulated mathematically as follows:
min a f ( a ) = R ( a )
s . t . 150 mm a 450 mm
  • Here, a: the geometric parameter of the offset column;
  • R(a): the drag force obtained from the CFD simulation;
  • 150 mm ≤ a ≤ 450 mm: the allowable range of the design variable, as listed in Table 5.

3.2. Numerical Methods

3.2.1. Computational Domain and Mesh Generation

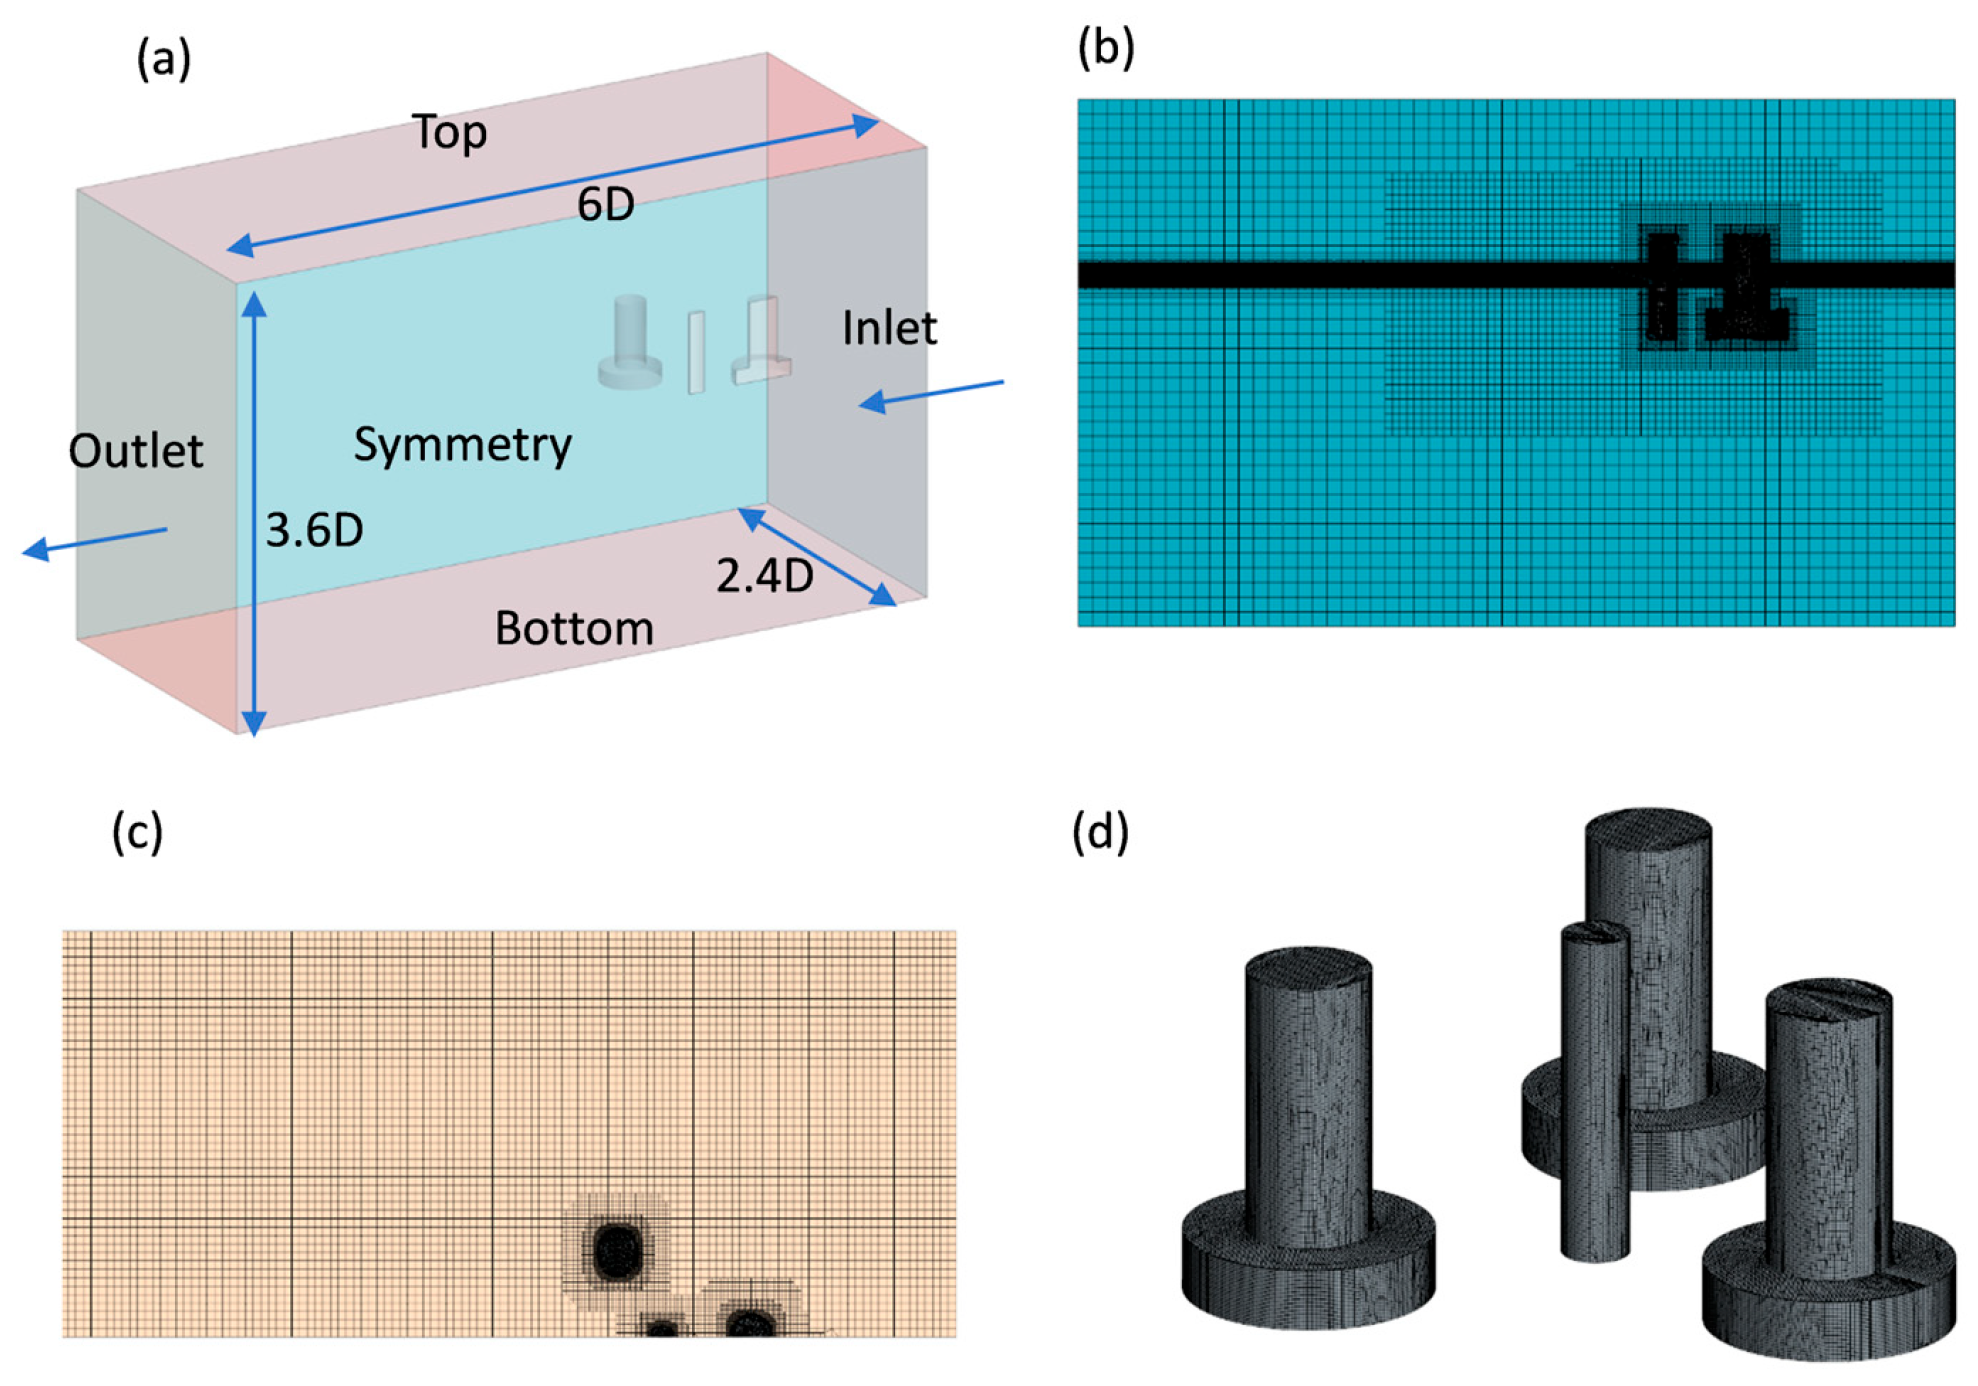
For the numerical simulations, a 1:20 scale model of the OC4 platform was adopted, and all dimensions mentioned below refer to the scaled model. The adoption of reduced-scale CFD for preliminary design optimization represents a standard approach in offshore engineering, as endorsed by ITTC guidelines and validated in recent studies concerning floating platform hydrodynamics [50,51]. The computational domain and mesh details are shown in Figure 8, where the domain dimensions are 6D × 2.4D × 3.6D. A velocity inlet, a pressure outlet, and a symmetry plane were specified as boundary conditions. The turbulence model employed was the S S T k ω model, and symmetry of the computational domain was utilized to reduce computational cost. Mesh refinement was applied to specific regions, such as around the floating platform and at the free surface, with a mesh size of 0.5%D on the platform surface.

3.2.2. Grid Convergence Study

In the numerical simulations, a grid convergence study was conducted to verify the reliability of the computational results. The Grid Convergence Index (GCI) method [52] was employed to evaluate grid independence:
The convergence error ε can be expressed as follows:
ε = f 2 f 1 f 1
Here, f 1 denotes the computational result obtained from the fine grid, while f 2 represents the result from the coarse grid.
The order of convergence p can be expressed as follows:
p = ln ( f 3 f 2 ) / ( f 2 f 1 ) ln ( r )
Here, r denotes the refinement ratio, which is set to 1.33.
The expression for the Grid Convergence Index (GCI) is given as follows:
G C I = F S ε r p 1
Here, Fs is the safety factor, typically set to 1.25. A GCI value below 5% is generally considered to indicate that the computational results are independent of the grid size.
Note: the convergence ratio R k can be expressed as follows:
R k = f 3 f 2 f 2 f 1
Here, f1, f2, f3 represent the computational results of the fine, medium, and coarse grids, respectively. When 0 < Rk < 1, the solution is monotonically convergent; when Rk < 0, it is oscillatory convergent; and when 1 < Rk, it is divergent. The GCI method is applicable only when monotonic convergence is satisfied.
Table 6 presents the grid convergence study, where the time step was set to 0.005 s and the flow velocity to 1.5 m/s. The coarse, medium, and fine grids contained 1.00 million, 1.64 million, and 2.98 million cells, respectively, with corresponding drag force values of 1694.37 N, 1686.51 N, and 1686.48 N. The safety factor Fs was set to 1.25. The results indicate that the GCI is relatively small (less than 3%), satisfying the convergence condition. Considering both computational accuracy and efficiency, the medium grid was selected for the simulations.

3.3. Results and Discussion

3.3.1. Optimization Results

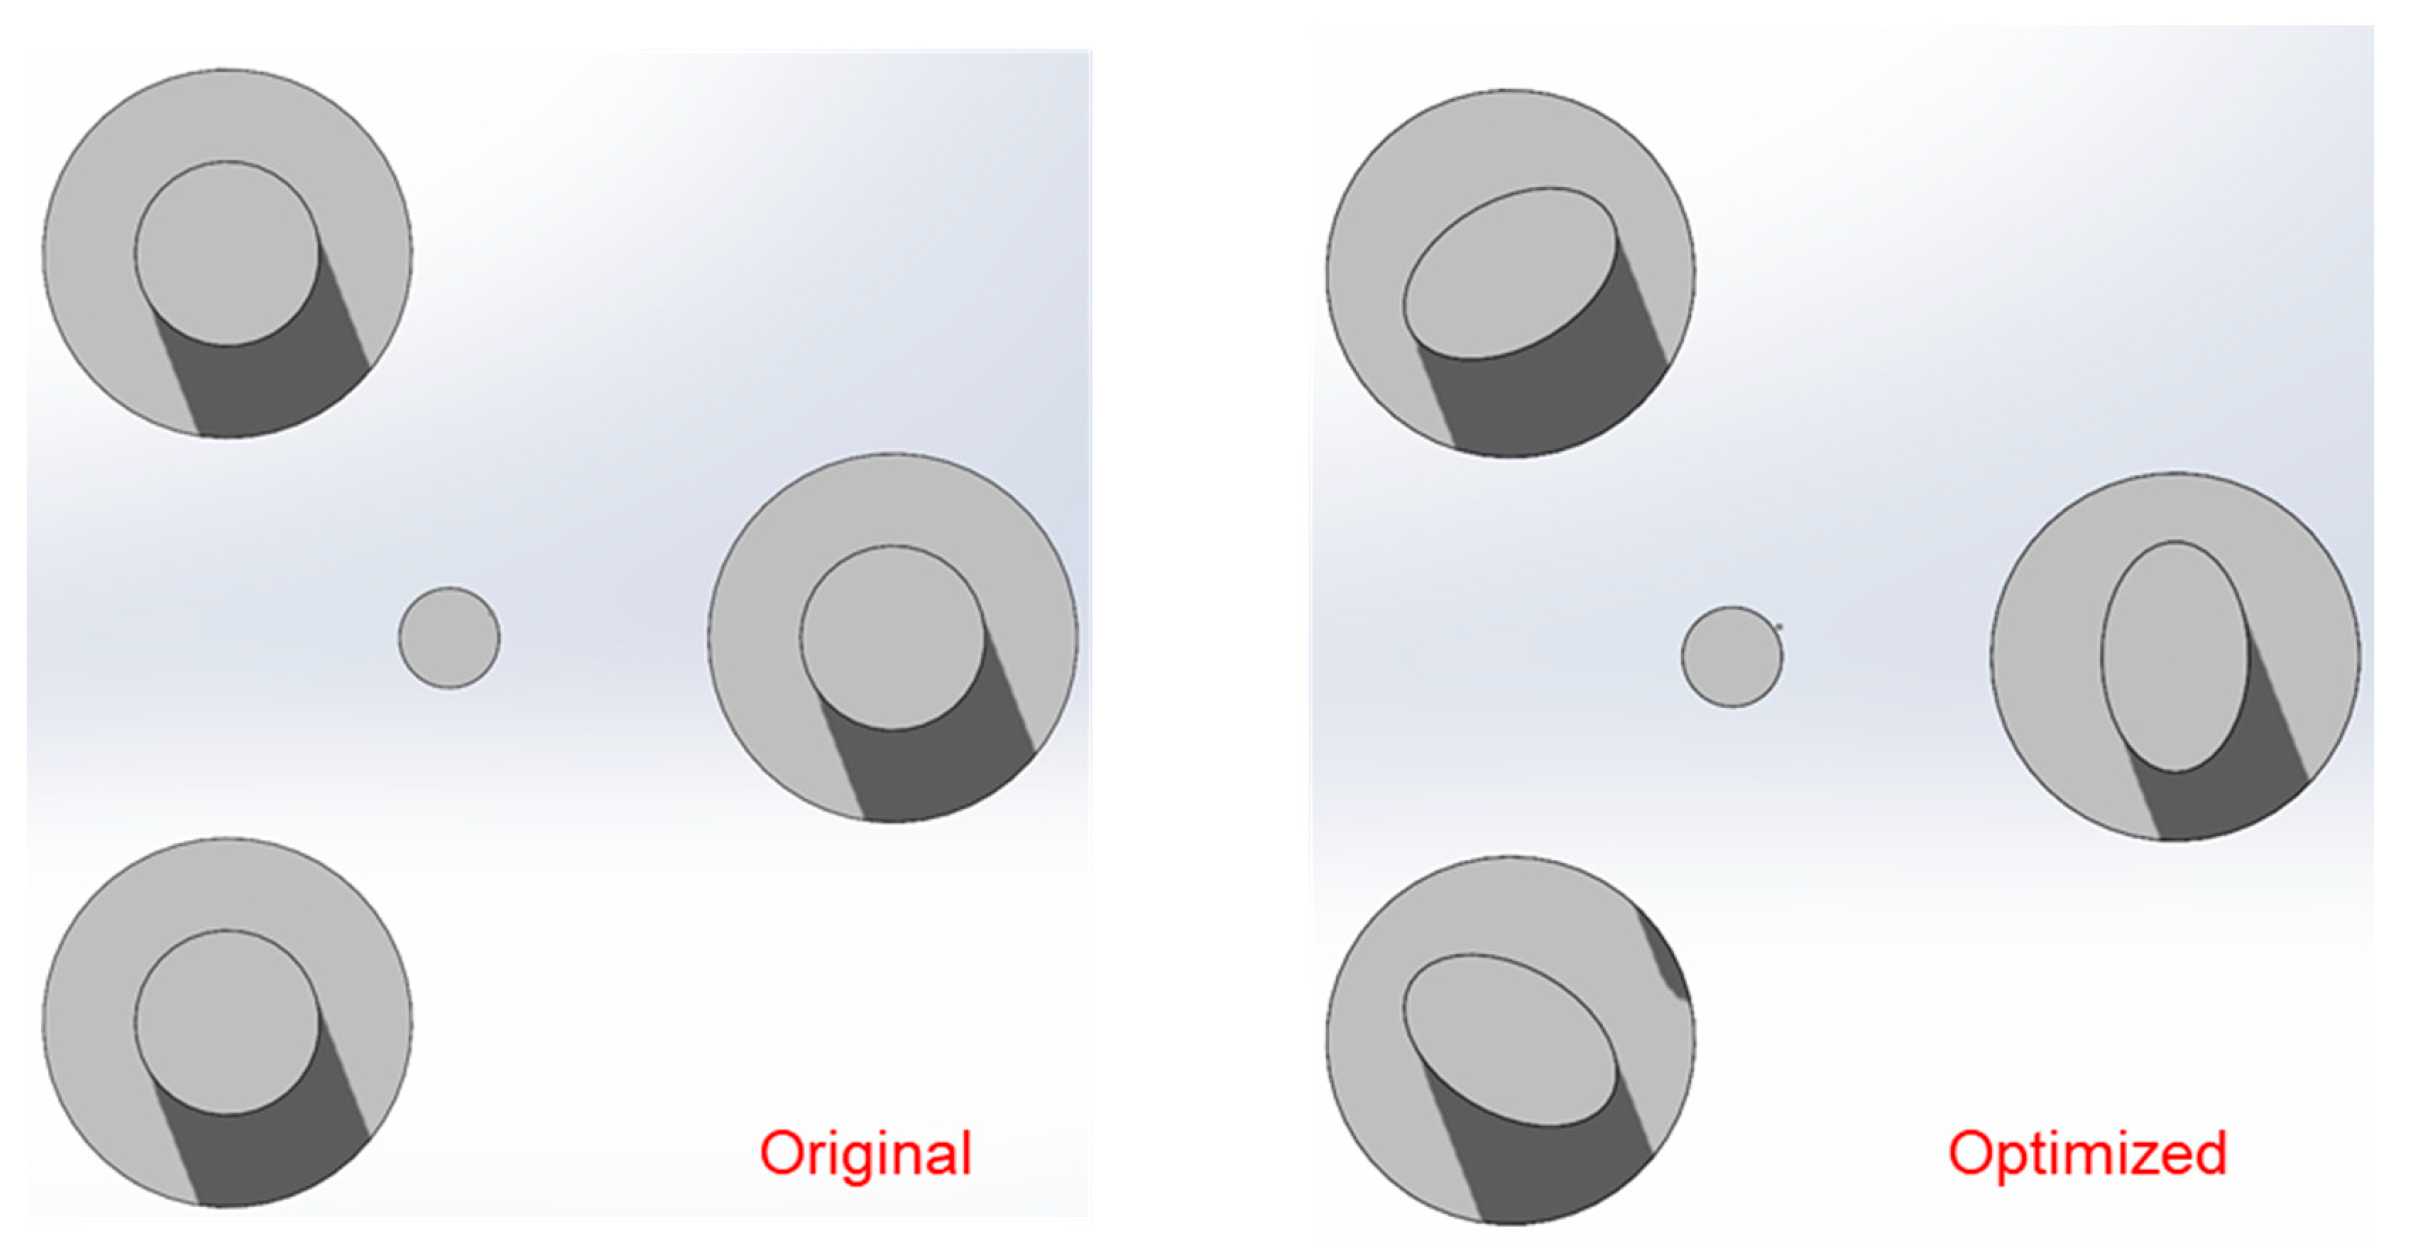
Having completed the grid convergence study, the optimization was conducted at a flow velocity of 0.5 m/s, which is a common operating condition for floating platforms. Figure 9 shows the floating platform before and after optimization, with the optimized results summarized in Table 7. As illustrated, the cross-sectional shape of the offset columns becomes a relatively flatter ellipse after optimization. Specifically, the major axis of the elliptical cross-section increases by 14.93%, while the overall drag of the floating platform is reduced by approximately 1.69%.
The performance of the floating wind turbine platform before and after optimization under different current directions and current speeds was further validated. The results are shown in Table 8 and Table 9. As can be seen from the tables, when the current directions are 30° and 60°, the optimized drag decreases by 6.56% and increases by 0.29%, respectively, compared to the pre-optimization drag. Additionally, at current speeds of 0.7 m/s and 0.9 m/s, the optimized drag increases by 0.84% and decreases by 3.7%, respectively, compared to the pre-optimization drag. Therefore, it can be observed that the optimized results do not always show positive effects under different inflow directions and ship speeds. Overall, the increase in drag is not significant, while the reduction in drag is more noticeable.

3.3.2. Flow Field Analysis

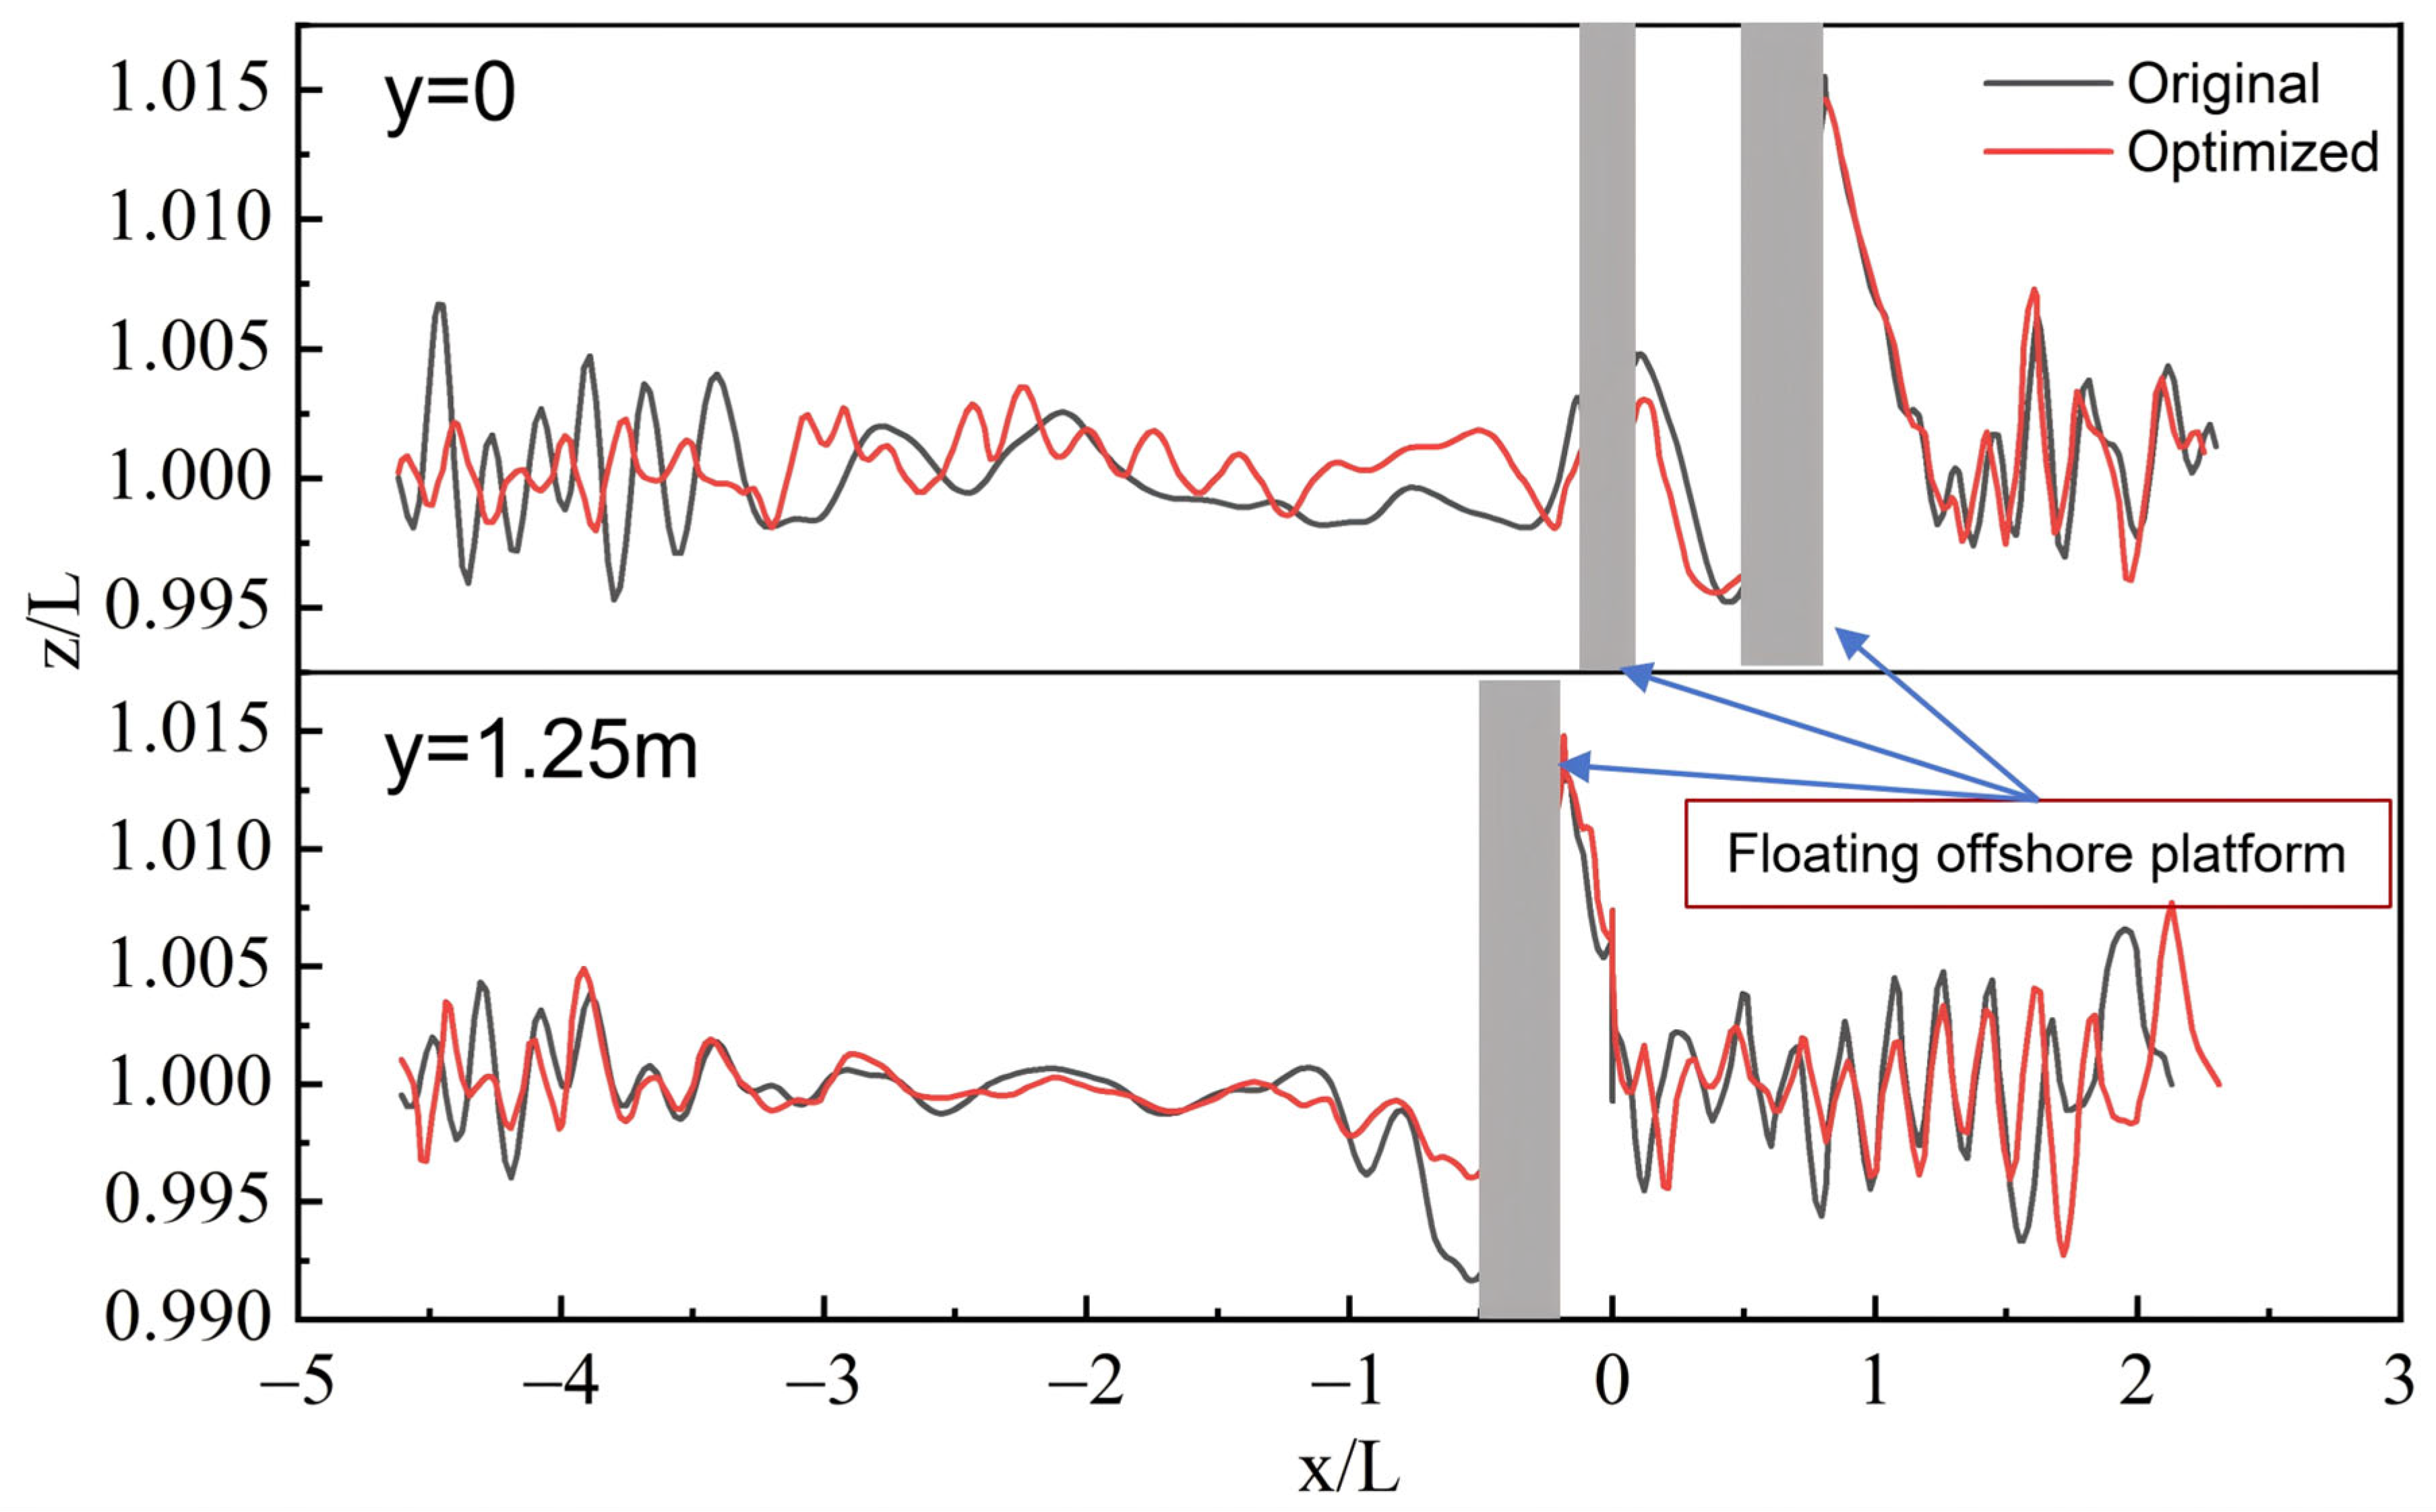
Figure 10 presents a comparison of longitudinal wave elevation profiles of the free surface at different positions, where y = 0 and y = 1.25 m denote the longitudinal wave elevations measured at distances of 0 and 1.25 m from the centerline plane, respectively. As shown in the figure, significant differences can be observed before and after optimization. Specifically, at y = 0, near the aft region of the floating platform, the trough elevations before optimization are noticeably higher than those after optimization, whereas at positions farther downstream, the peak elevations before optimization are significantly greater. At y = 1.25 m, in front of the floating platform, the wave elevations before optimization are also higher than those after optimization. These observations indicate that the pre-optimized floating offshore platform induced stronger disturbances in the flow, leading to higher drag.
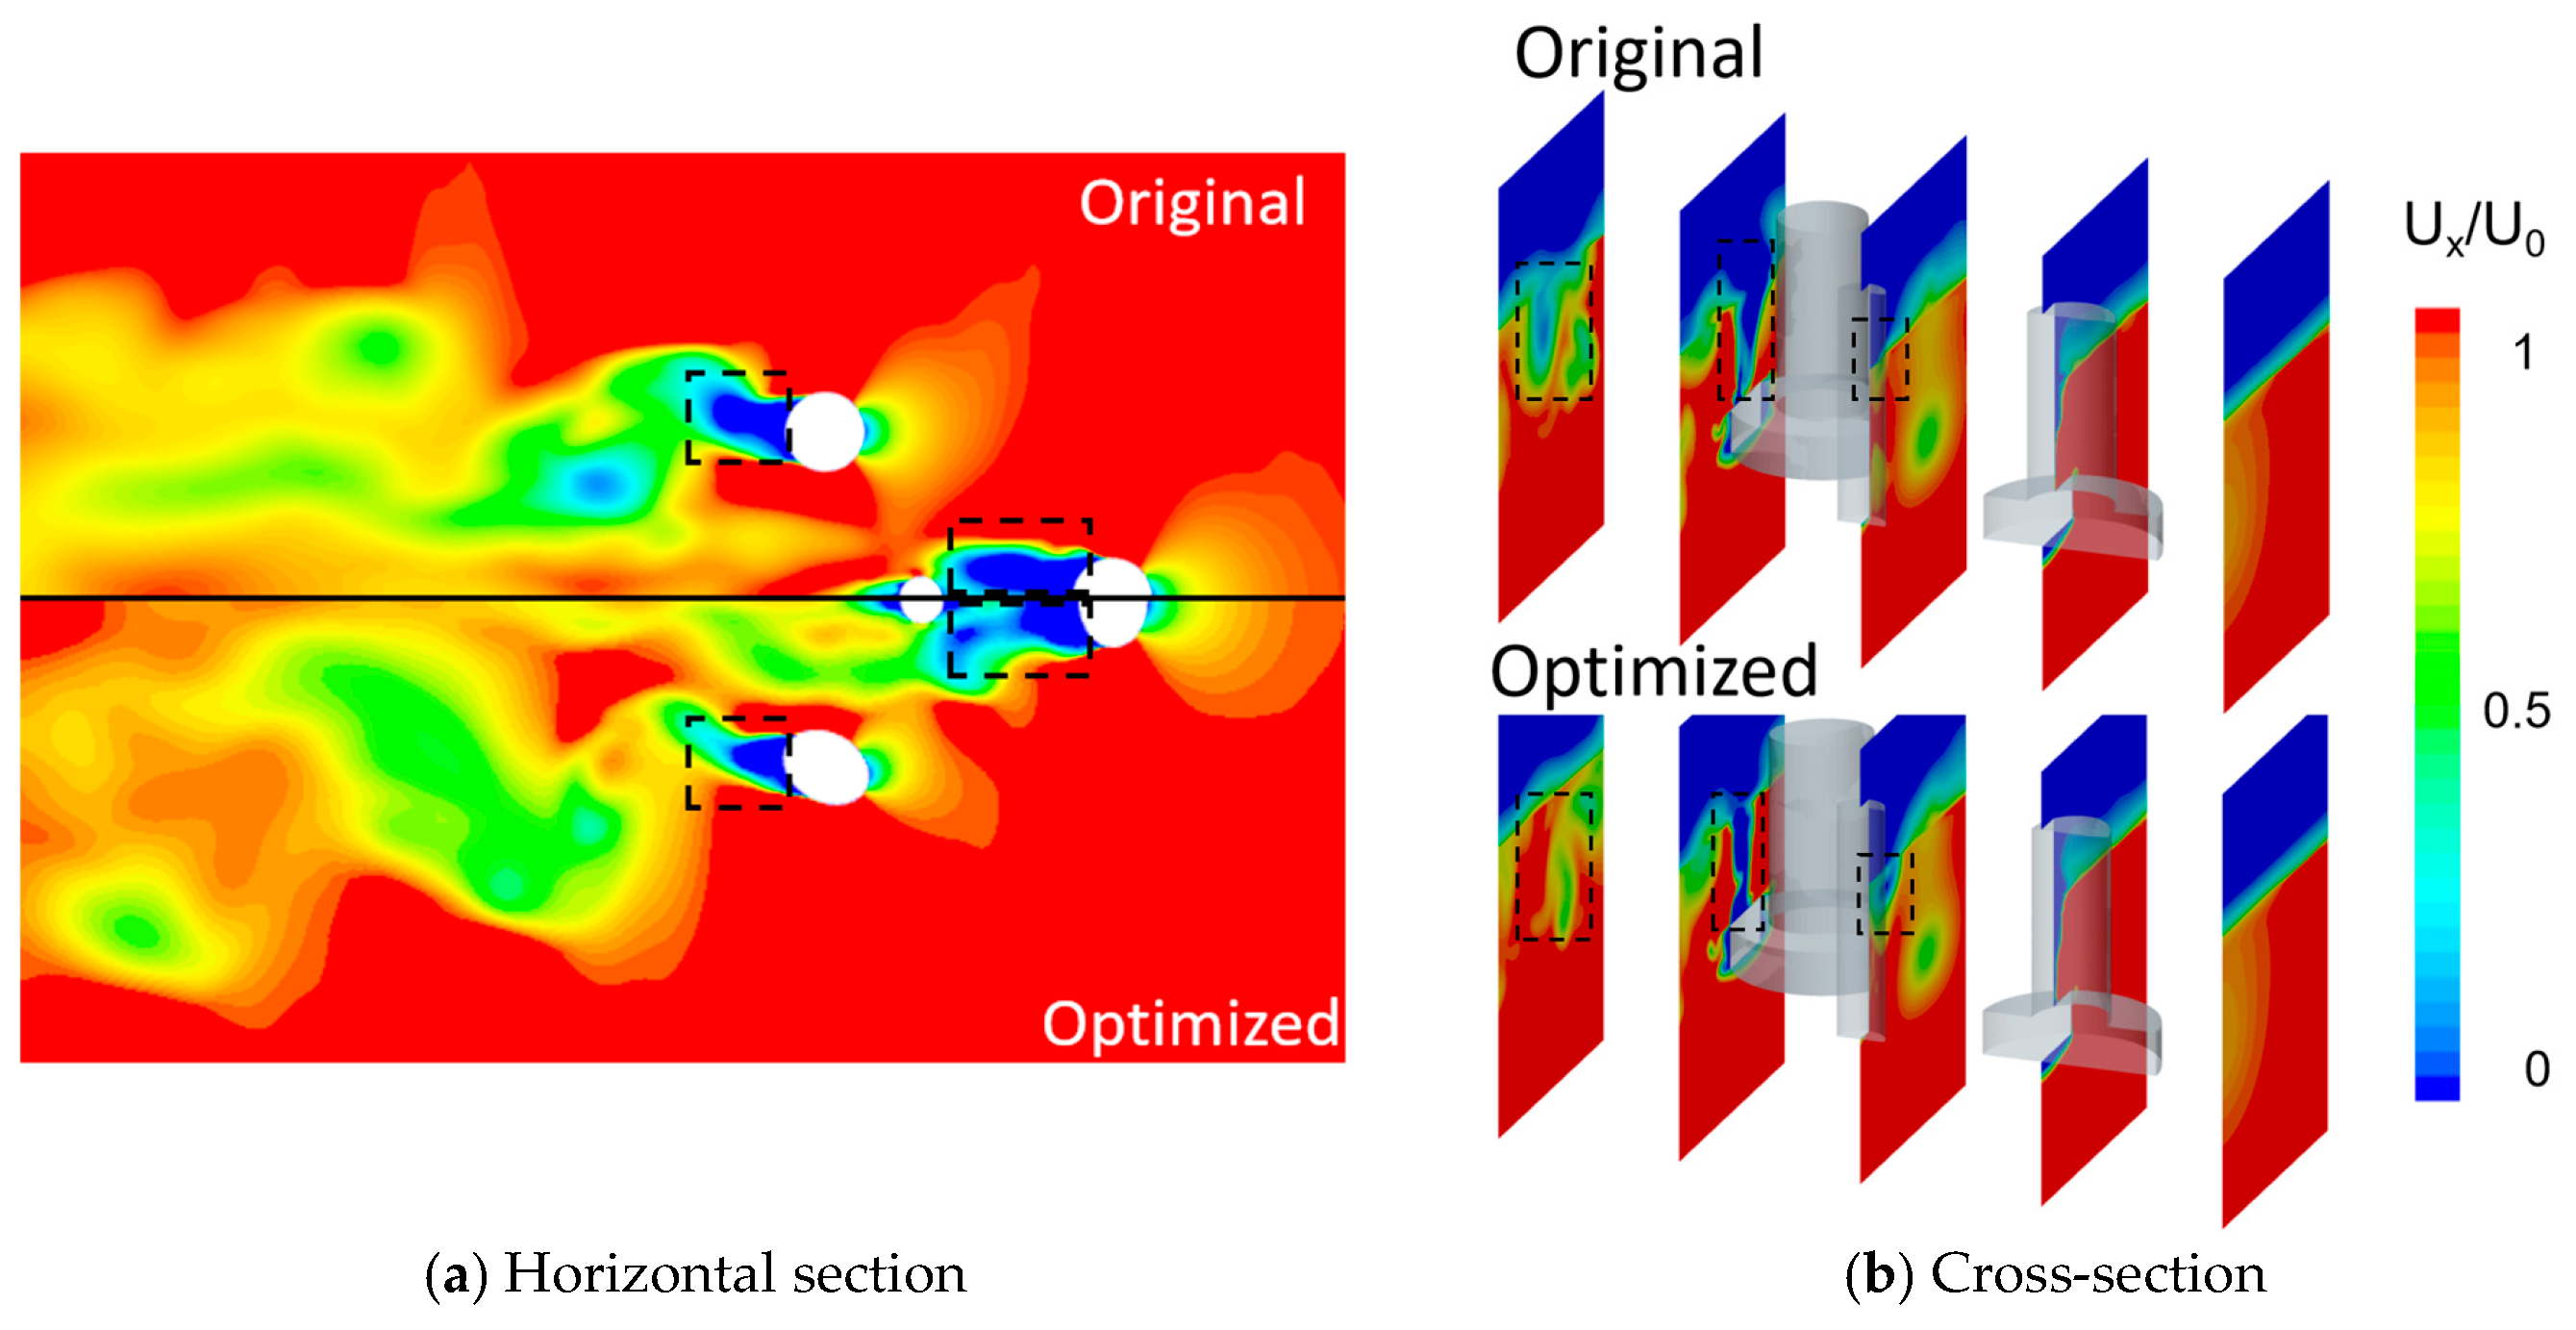
Figure 11 compares the velocity field distributions at a given time on the horizontal and cross-sectional planes before and after optimization. As shown, significant differences are observed between the pre- and post-optimization cases. Specifically, before optimization, a larger low-velocity region is present in the wake of the offset columns (highlighted by the dashed rectangular box in Figure 11), particularly behind the rear offset column. After optimization, the low-velocity region in this area becomes considerably smaller, which may primarily benefit from the structural modifications. This indicates that the optimized floating platform produces less obstruction to the flow.
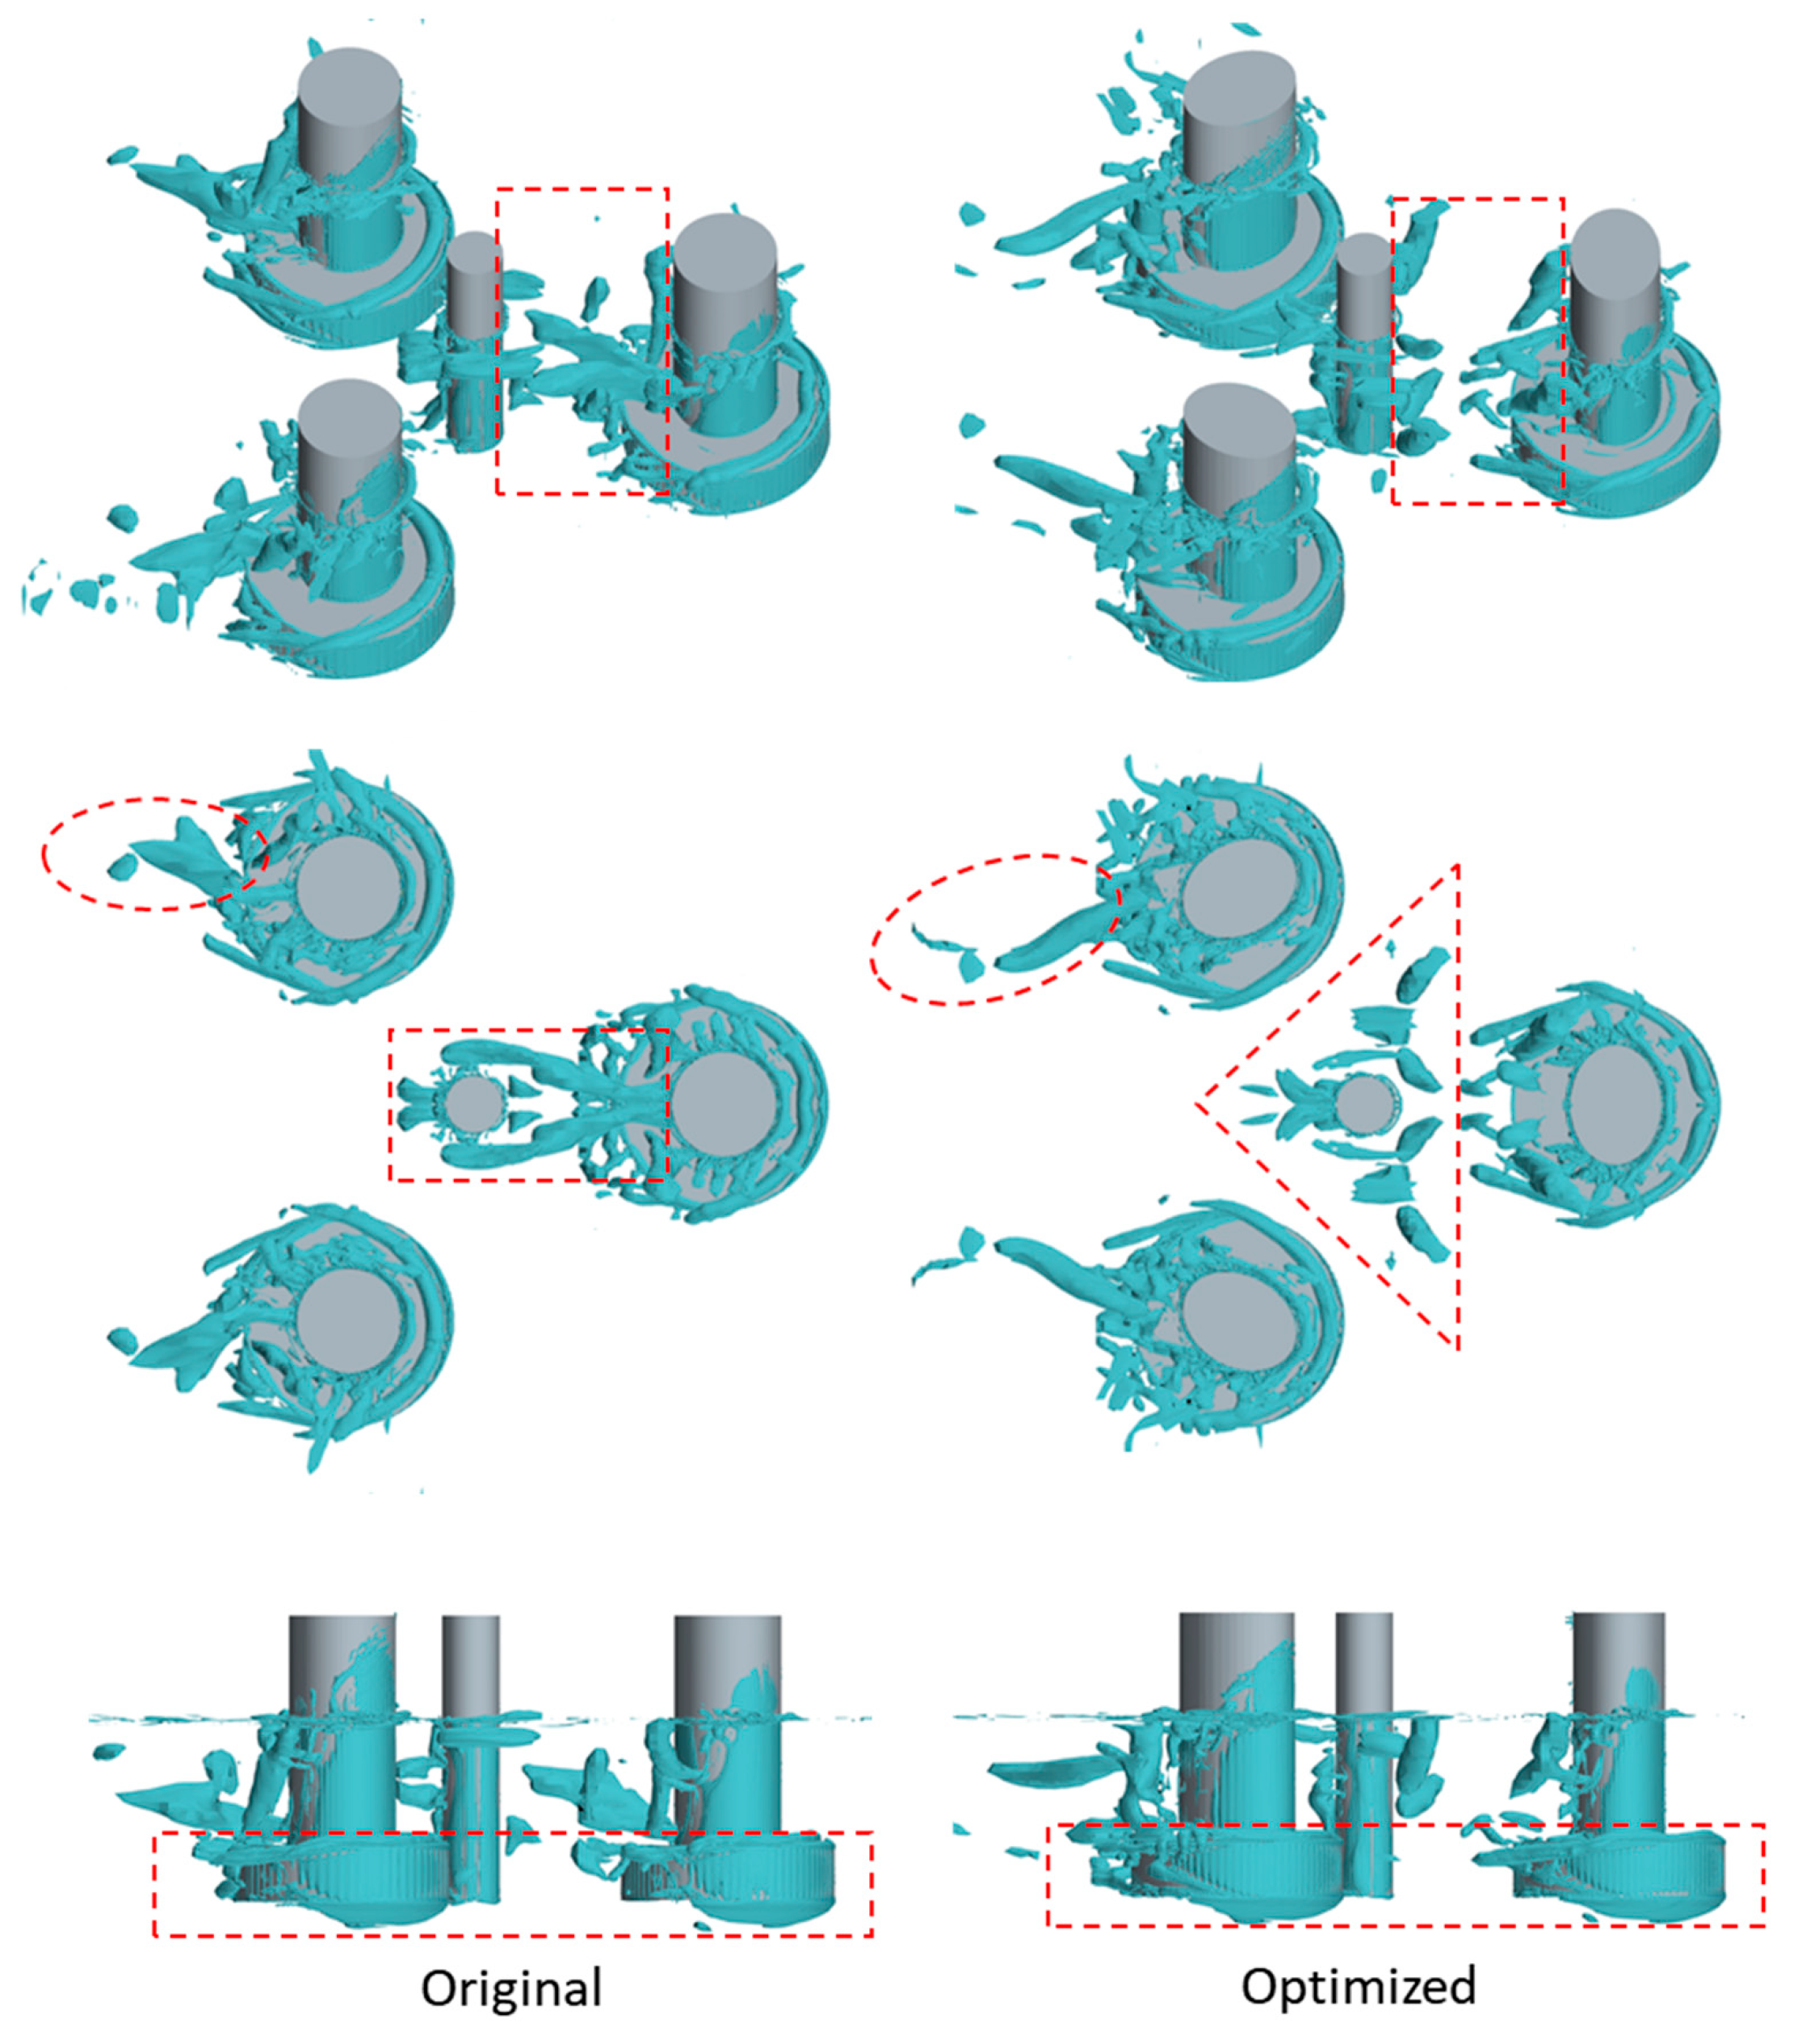
Figure 12 illustrates the vorticity field at Q-criterion = 2.5 s−1 before and after optimization. As shown, significant differences are observed between the pre- and post-optimization floating platforms. Specifically, the comparison of vorticity distributions reveals that flow separation around critical structural regions is alleviated after optimization, while both the scale and intensity of vortices are substantially reduced. In addition, vortex shedding in the wake becomes more aligned with the streamwise direction, thereby reducing lateral diffusion and energy dissipation. These combined effects lead to a reduction in pressure drag and turbulence-induced additional drag, ultimately resulting in an overall decrease in resistance.

4. Conclusions

In this study, the EGO algorithm was employed to optimize the design of a floating offshore platform, and a novel RGO algorithm framework was proposed. Based on this new framework, the floating offshore platform was optimized, resulting in reduced drag. The main conclusions are as follows:
In this study, a new parallel EGO algorithm based on the Kriging surrogate model was proposed for solving computationally expensive black-box problems. Unlike the traditional EGO algorithm, which can only add one sample point per iteration and is therefore unsuitable for modern multi-core parallel optimization frameworks in engineering applications, the proposed parallel EGO algorithm allows three sample points to be added simultaneously. Compared with the conventional EGO, this approach not only improves the accuracy of the Kriging surrogate model but also enhances optimization efficiency.
By purposefully adding multiple sample points per iteration to improve the efficiency of the EGO algorithm, the proposed method overcomes the limitations of traditional approaches, which typically add samples based on maximizing point density within certain regions to ensure global surrogate accuracy. In real-world problems, it is not necessary to maintain high accuracy across the entire design space; rather, accuracy is most critical in the vicinity of the global optimum. Therefore, updating sample points near the most promising optimum candidates makes the optimization process more practical and efficient.
Applying this framework to the drag reduction optimization of a floating offshore platform, the results demonstrate that the optimized platform exhibits reduced drag. This confirms the effectiveness of the proposed optimization method and provides a valuable reference for the structural optimization design of floating offshore wind turbines. It should be noted that the optimization problem addressed in this paper is one-dimensional, and there may be some variations in optimization time and results when applied to multi-dimensional problems.
Despite the promising results obtained in this study, several limitations should be acknowledged. First, although the proposed parallel infill strategy has been validated using both one-dimensional and multi-dimensional benchmark functions, its application to practical engineering problems has so far been demonstrated only through a one-dimensional optimization case under simplified steady-current loading, where the optimization process terminated after three iterations due to computational constraints. Consequently, the full potential of the proposed optimization strategy has not yet been fully explored in real-world engineering applications. Second, only a single optimization objective was considered in the present study. Extending the proposed framework to multi-objective optimization problems, such as motion response amplitude operators (RAOs), structural weight, platform stability (GM), and cost, will constitute an important direction for future research. Finally, to reduce computational cost, the fully coupled interactions among the floating platform, wind turbine, and mooring system were neglected during the optimization process. Future studies will incorporate these coupled effects and extend the optimization to higher-dimensional design spaces and more realistic environmental loading, so that the engineering significance of the modest but numerically robust drag reduction observed in this simplified case can be assessed in a more practical context.

Author Contributions

Conceptualization, S.W. and F.L.; methodology, S.W.; software, S.W. and F.L.; validation, S.W.; formal analysis, S.W.; investigation, S.W.; resources, S.W.; data curation, S.W.; writing—original draft preparation, S.W.; writing—review and editing, S.W. and F.L.; visualization, S.W.; supervision, F.L.; project administration, S.W.; funding acquisition, S.W. All authors have read and agreed to the published version of the manuscript.

Funding

This research was funded by Guangzhou Postdoctoral Research Funding Program (L2260580).

Data Availability Statement

The data that support the findings of this study are available from the corresponding author upon reasonable request.

Conflicts of Interest

The authors declare no conflicts of interest.

References

  1. Chen, Y.; Lin, H. Overview of the development of offshore wind power generation in China. Sustain. Energy Technol. Assess. 2022, 53, 102766. [Google Scholar] [CrossRef]
  2. Xu, H.; Rui, S.; Shen, K.; Jiang, L.; Zhang, H.; Teng, L. Shared mooring systems for offshore floating wind farms: A review. Energy Rev. 2024, 3, 100063. [Google Scholar] [CrossRef]
  3. Ren, Y.; Venugopal, V.; Shi, W. Dynamic analysis of a multi-column TLP floating offshore wind turbine with tendon failure scenarios. Ocean Eng. 2022, 245, 110472. [Google Scholar] [CrossRef]
  4. Yang, R.-Y.; Chuang, T.-C.; Zhao, C.; Johanning, L. Dynamic Response of an Offshore Floating Wind Turbine at Accidental Limit States—Mooring Failure Event. Appl. Sci. 2022, 12, 1525. [Google Scholar] [CrossRef]
  5. Chuang, Z.; Chang, X.; Li, C.; Lu, Y.; Liu, S. Performance change of a semi-submersible production platform system with broken mooring line or riser. Eng. Fail. Anal. 2020, 118, 104819. [Google Scholar] [CrossRef]
  6. Chuang, Z.-j.; Liu, S.-w.; Li, C.-z.; Lu, Y.; Chang, X. Dynamic Analysis of Semi-Submersible Production Platform Under the Failure of Mooring Lines. China Ocean Eng. 2021, 35, 84–95. [Google Scholar] [CrossRef]
  7. Yang, Y.; Bashir, M.; Li, C.; Wang, J. Investigation on mooring breakage effects of a 5 MW barge-type floating offshore wind turbine using F2A. Ocean Eng. 2021, 233, 108887. [Google Scholar] [CrossRef]
  8. Liu, Z.; Zhao, J.; Lin, X. Effects of mooring line failure on semi-submersible wind turbine and the study of its mitigation measures. Ocean Eng. 2024, 311, 118889. [Google Scholar] [CrossRef]
  9. Neisi, A.; Ghassemi, H.; Iranmanesh, M. Effect of the multi-segment mooring system failure on the dynamic motions of the floating platform. Ocean Eng. 2023, 290, 116371. [Google Scholar] [CrossRef]
  10. Subbulakshmi, A.; Verma, M. Transient response reduction of floating offshore wind turbine subjected to sudden mooring line failure. Ocean Eng. 2023, 271, 113702. [Google Scholar] [CrossRef]
  11. Subbulakshmi, A.; Verma, M. Dynamic response analysis of a semisubmersible floating offshore wind turbine subjected to mooring line failure under normal and extreme environmental conditions. Ocean Eng. 2024, 304, 117907. [Google Scholar] [CrossRef]
  12. Huang, H.; Liu, Q.; Iglesias, G.; Yue, M.; Miao, W.; Ye, Q.; Li, C.; Yang, T. A fully-coupled analysis of the spar-type floating offshore wind turbine with bionic fractal heave plate under wind-wave excitation conditions. Renew. Energy 2024, 232, 121088. [Google Scholar] [CrossRef]
  13. Rao, M.J.; Nallayarasu, S.; Bhattacharyya, S.K. Numerical and experimental studies of heave damping and added mass of spar with heave plates using forced oscillation. Appl. Ocean Res. 2021, 111, 102667. [Google Scholar] [CrossRef]
  14. Kharazmi, R.; Ketabdari, M.J. Numerical modeling to develop strake design of Spar platform for Vortex-Induced motions suppression. Ocean Eng. 2022, 250, 111060. [Google Scholar] [CrossRef]
  15. Zhao, H.; Wei, K.; Yang, W. Further study of heave plate designs for enhancing motion control of floating offshore wind turbines. Ocean Eng. 2025, 327, 121016. [Google Scholar] [CrossRef]
  16. Lemmer, F.; Yu, W.; Müller, K.; Cheng, P.W. Semi-submersible wind turbine hull shape design for a favorable system response behavior. Mar. Struct. 2020, 71, 102725. [Google Scholar] [CrossRef]
  17. Zhan, D.; Qian, J.; Cheng, Y. Balancing global and local search in parallel efficient global optimization algorithms. J. Glob. Optim. 2017, 67, 873–892. [Google Scholar] [CrossRef]
  18. Regis, R.G. Trust regions in Kriging-based optimization with expected improvement. Eng. Optim. 2016, 48, 1037–1059. [Google Scholar] [CrossRef]
  19. Jin, F.; Yang, Y.; Hu, B.; Zhou, J.; Gao, B.; Wan, Y. Research on section dimension optimization of high-rise steel–concrete composite buildings based on improved dividing rectangle algorithm and combined response surface model. Structures 2023, 58, 105437. [Google Scholar] [CrossRef]
  20. Christiansen, N.H.; Voie, P.E.T.; Høgsberg, J.; Sødahl, N. Optimized mooring line simulation using a hybrid method time domain scheme. In Proceedings of the International Conference on Offshore Mechanics and Arctic Engineering; American Society of Mechanical Engineers: New York, NY, USA, 2014. [Google Scholar]
  21. Trubat, P.; Herrera, A.; Molins, C. Mooring optimization using ML techniques. In Proceedings of the International Conference on Offshore Mechanics and Arctic Engineering; American Society of Mechanical Engineers: New York, NY, USA, 2022. [Google Scholar]
  22. de Pina, A.C.; de Pina, A.A.; Albrecht, C.H.; de Lima, B.S.L.P.; Jacob, B.P. ANN-based surrogate models for the analysis of mooring lines and risers. Appl. Ocean Res. 2013, 41, 76–86. [Google Scholar] [CrossRef]
  23. Yu, Y.; Zhao, M.; Li, Z.; Zhang, B.; Pang, H.; Xu, L. Optimal design of asymmetrically arranged moorings in a floating production system based on improved particle swarm optimization and RBF surrogate model. Mar. Struct. 2024, 94, 103576. [Google Scholar] [CrossRef]
  24. Zhou, Y.; Yan, C.; Shi, W.; Han, X.; Jiang, Z.; Michailides, C. A surrogate optimization modeling method for floating wind turbine mooring line design. In Proceedings of the ISOPE International Ocean and Polar Engineering Conference; ISOPE: Mountain View, CA, USA, 2024. [Google Scholar]
  25. Li, L.; Jiang, Z.; Ong, M.C.; Hu, W. Design optimization of mooring system: An application to a vessel-shaped offshore fish farm. Eng. Struct. 2019, 197, 109363. [Google Scholar] [CrossRef]
  26. Cressie, N. Spatial prediction and ordinary kriging. Math. Geol. 1988, 20, 405–421. [Google Scholar] [CrossRef]
  27. Kleijnen, J.P. Kriging metamodeling in simulation: A review. Eur. J. Oper. Res. 2009, 192, 707–716. [Google Scholar] [CrossRef]
  28. Qi, B.; Cheng, X.; Han, K. Research on hydrodynamic forces prediction of underwater vehicle based on Co-Kriging model. J. Mar. Sci. Technol. 2024, 29, 656–667. [Google Scholar] [CrossRef]
  29. Serani, A.; Scholcz, T.; Vanzi, V. A Scoping Review on Simulation-Based Design Optimization in Marine Engineering: Trends, Best Practices, and Gaps. Arch. Comput. Methods Eng. 2024, 31, 4709–4737. [Google Scholar] [CrossRef] [PubMed]
  30. Liu, J.; Song, W.-P.; Han, Z.-H.; Zhang, Y. Efficient aerodynamic shape optimization of transonic wings using a parallel infilling strategy and surrogate models. Struct. Multidiscip. Optim. 2017, 55, 925–943. [Google Scholar] [CrossRef]
  31. Cheng, S.; Zhan, H.; Shu, Z.; Fan, H.; Wang, B. Effective optimization on Bump inlet using meta-model multi-objective particle swarm assisted by expected hyper-volume improvement. Aerosp. Sci. Technol. 2019, 87, 431–447. [Google Scholar] [CrossRef]
  32. Zhan, D.; Xing, H. Expected improvement for expensive optimization: A review. J. Glob. Optim. 2020, 78, 507–544. [Google Scholar] [CrossRef]
  33. Zhan, D.; Meng, Y.; Xing, H. A Fast Multipoint Expected Improvement for Parallel Expensive Optimization. IEEE Trans. Evol. Comput. 2023, 27, 170–184. [Google Scholar] [CrossRef]
  34. Sekishiro, M.; Venter, G.; Balabanov, V. Combined Kriging and Gradient-Based Optimization Method. In Proceedings of the 11th AIAA/ISSMO Multidisciplinary Analysis and Optimization Conference; AIAA: Reston, VA, USA, 2012. [Google Scholar]
  35. Sacks, J.; Welch, W.J.; Mitchell, T.J.; Wynn, H.P. Design and Analysis of Computer Experiments. Stat. Sci. 1989, 4, 409–423. [Google Scholar] [CrossRef]
  36. Mockus, J.; Tiesis, V.; Zilinskas, A. The Application of Bayesian Methods for Seeking Extremun. In Toward Global Optimization; North-Holand: Amsterdam, The Netherlands, 2014. [Google Scholar]
  37. Jones, D.R.; Schonlau, M.; Welch, W.J. Efficient Global Optimization of Expensive Black-Box Functions. J. Glob. Optim. 1998, 13, 455–492. [Google Scholar] [CrossRef]
  38. Cai, X.; Qiu, H.; Gao, L.; Yang, P.; Shao, X. A multi-point sampling method based on kriging for global optimization. Struct. Multidiscip. Optim. 2017, 56, 71–88. [Google Scholar] [CrossRef]
  39. Gutmann, H.M. A Radial Basis Function Method for Global Optimization. J. Glob. Optim. 2001, 19, 201–227. [Google Scholar] [CrossRef]
  40. Holmström, K.; Quttineh, N.-H.; Edvall, M.M. An adaptive radial basis algorithm (ARBF) for expensive black-box mixed-integer constrained global optimization. Optim. Eng. 2008, 9, 311–339. [Google Scholar] [CrossRef]
  41. Jie, H.; Wu, Y.; Ding, J. An adaptive metamodel-based global optimization algorithm for black-box type problems. Eng. Optim. 2015, 47, 1459–1480. [Google Scholar] [CrossRef]
  42. Müller, J.; Shoemaker, C.A. Influence of ensemble surrogate models and sampling strategy on the solution quality of algorithms for computationally expensive black-box global optimization problems. J. Glob. Optim. 2014, 60, 123–144. [Google Scholar] [CrossRef]
  43. Regis, R.G.; Shoemaker, C.A. Constrained Global Optimization of Expensive Black Box Functions Using Radial Basis Functions. J. Glob. Optim. 2005, 31, 153–171. [Google Scholar] [CrossRef]
  44. Suprayitno; Yu, J.-C. Evolutionary reliable regional Kriging surrogate for expensive optimization. Eng. Optim. 2019, 51, 247–264. [Google Scholar] [CrossRef]
  45. Yan, C.; Lai, C.; Wang, Q.; Hu, B.; Deng, L. Aerodynamic drag reduction in a vehicle based on efficient global optimisation. J. Eng. 2018, 2019, 384–391. [Google Scholar] [CrossRef]
  46. Yu, Q.; Wang, S.; Deng, R.; Jiang, D.; Zheng, B.; Zeng, S. Hydrofoil performance optimization based on the Kriging method. Ocean Eng. 2025, 342, 122909. [Google Scholar] [CrossRef]
  47. Amy, R.; Jason, J.; Marco, M.; Huimin, S.; Andrew, G.; Alexander, C.; Luan, C. Definition of the Semisubmersible Floating System for Phase II of OC4 [R]; National Renewable Energy Lab. (NREL): Golden, CO, USA, 2014. [Google Scholar]
  48. Uralde-Guinea, X.; Parra, Y.; Uriarte, I.; Fernández-Gámiz, U.; Zulueta, E. Comparison between cylinder and ellipse at 0 degrees angle of attack for low Reynolds numbers. Measurement 2026, 258, 119250. [Google Scholar] [CrossRef]
  49. Li, Y.; Li, B.; Li, T.; Zhang, Y. Numerical study on the flow around an elliptic cylinder with different aspect ratios in the subcritical regime using large eddy simulation. Phys. Fluids 2024, 36, 015154. [Google Scholar] [CrossRef]
  50. Zeng, F.; Zhang, N.; Huang, G.; Gu, Q.; He, M. Dynamic response of floating offshore wind turbines under freak waves with large crest and deep trough. Energy 2023, 278, 127679. [Google Scholar] [CrossRef]
  51. Gueydon, S.; Fernandes, G. Scaling Methodology for Floating Wind Turbines. EWEA Offshore 2013. [Google Scholar]
  52. Roache, P.J. Quantification of uncertainty in computational fluid dynamics. Annu. Rev. Fluid Mech. 1997, 29, 123–160. [Google Scholar] [CrossRef]
Figure 1. Convergence curve for single-sample selection.
Jmse 14 01241 g001
Figure 2. Convergence curve for double-sample selection.
Jmse 14 01241 g002
Figure 3. GP function image and initial sample point sampling distribution.
Jmse 14 01241 g003
Figure 4. Iterative convergence process.
Jmse 14 01241 g004
Figure 5. Iterative process.
Jmse 14 01241 g005
Figure 6. The OC4 floating platform [47].
Jmse 14 01241 g006
Figure 7. Shape variations of the floating platform.
Jmse 14 01241 g007
Figure 8. Computational domain and mesh discretization: (a) domain dimensions and boundary conditions; (b,c) mesh generation; (d) details of the surface mesh.
Jmse 14 01241 g008
Figure 9. Comparison of the floating platform geometry before and after optimization.
Jmse 14 01241 g009
Figure 10. Longitudinal wave profile.
Jmse 14 01241 g010
Figure 11. Velocity field.
Jmse 14 01241 g011
Figure 12. Vorticity field (Q = 2.5 s−1).
Jmse 14 01241 g012
Table 1. Mathematical tests of the EGO algorithm and other advanced algorithms (number of iterations).
Test FunctionEGORBFDIRECTDE
Branin2844631190
Goldstein–Price32631011018
Harman 3354383476
Hartman 61211122137220
Table 2. Comparison of optimization results with the literature [46].
Test FunctionAverage Number of IterationsIteration Number Variance
EW-LCBMSP-EI-MSEEW-LCBMSP-EI-MSE
PK26.7624.165.432.382
BA25.8425.542.982.907
SA28.3224.983.441.653
SC32.4224.95.552.173
HM37.1625.743.391.013
GP91.480.3510.745.023
L3203.21140.2388.9535.698
H336.9218.692.832.08
A5144.7120.3422.4212.754
H466.955.6917.3415.642
H6113.6685.3676.9350.361
Table 3. Comparison of number of iterations and variance means [46].
NameIteration Average (Times)Variance (Statistics)Efficiency (%)Variance (%)
EW-LCB73.3921.82
MSP-EI-MSE56.9111.97+22.46−45.14
Table 4. Main parameters of the OC4-DeepCwind platform.
ParameterValue
Draft 20 m
Main column diameter6.5 m
Main column length30 m
Upper column diameter12 m
Upper column length26 m
Base column diameter24 m
Base column length6 m
Bracing member diameter1.6 m
Mass13,473 t
Displacement13,986.80 m3
CM location below the still water level13.46 m
Roll moment inertia about CM6.827 × 109 kg·m2
Pitch moment inertia about CM6.827 × 109 kg·m2
Yaw moment inertia about CM1.226 × 1010 kg·m2
Table 5. Ranges of design variables.
Design VariableRange (mm)
a 150 a 450
Table 6. Grid convergence verification.
GridTotal Cells (Million)rFsRt (N)εGCI (%)
Coarse11.331.251694.370.00470.0023
Medium1.641686.510.00180.0008
Fine2.981686.48--
Table 7. Comparison of resistance before and after optimization.
NameOriginalOptimizedΔ
a (mm)300344.814.93%
Rt (N)177.71174.70−1.69%
Table 8. Comparison of the resistance before and after optimization in different current directions.
Current DirectionOriginalOptimizedD
30°161.5150.9−6.56%
60°171.7172.20.29%
Table 9. Comparison of the resistance before and after optimization in different current speeds.
Current SpeedOriginalOptimizedD
0.7 m/s166.9168.30.84%
0.9 m/s285.9275.2−3.7%
Disclaimer/Publisher’s Note: The statements, opinions and data contained in all publications are solely those of the individual author(s) and contributor(s) and not of MDPI and/or the editor(s). MDPI and/or the editor(s) disclaim responsibility for any injury to people or property resulting from any ideas, methods, instructions or products referred to in the content.