1. Introduction
The past decade has witnessed an accelerated global shift towards low-carbon energy systems, especially offshore renewable energy, which has grown to a global capacity of almost 83 GW by 2024 (International Renewable Energy Agency, 2025), largely attributed to individual government efforts to meet the targeted net-zero carbon emissions as part of the climate mitigation initiative. Existing national, subnational and regional data reported by the Global Offshore Wind Alliance (GOWA) show a unified global commitment to establish offshore wind systems with 27 countries, 27 subnational governments and 3 regions having established targets in place, to contribute to the combined global target of 263 W by 2030. Europe is still in the lead, with 15 nations aiming for 99 GW by 2030 [
1], and Asia’s pipelines are being built at a quick pace [
2]. India plans to develop 30–37 GW [
3], Japan targets 41 GW by 2040, including 15 GW of floating offshore wind [
4], and South Korea, Taiwan, and Vietnam are all contributing to the region’s overall goal of 41 GW [
5]. Even if 2030 is still a significant milestone, governments are looking beyond the near term, with 18 nations having made commitments to integrating offshore wind into their energy systems for the long term by announcing post-2030 goals [
6,
7]. Additionally, seven nations have set goals for floating offshore wind [
6], which has a lot of promise but is still at a lower pre-commercial level than fixed-bottom wind. Global government leadership has been essential to offshore wind’s current growth [
2,
8]. Continued expansion of offshore wind development is expected to depend on long-term policy commitments, investment frameworks, and national renewable energy targets established by individual countries.
As far as climate change control and mitigation initiatives are concerned, an understanding of the relationship between energy systems and their effect on climatic patterns and biodiversity is essential for aligning targets with timely policy reform and collective action across government and industry for translation of ambition into actionable deliverables. Global offshore marine structure expansion, commonly referred to as ocean sprawl, is thought to be one of the most drastic man-made changes to the maritime environment that has cumulative environmental impacts, most of which are still unknown [
9,
10]. In addition to its effects on the marine environment [
11,
12], these impacts may include underwater noise during construction, habitat alteration caused by turbine foundations and cable installation, changes in benthic community composition, collision risks for seabirds, and potential disruptions to migratory pathways of marine mammals and fish species. The growth of offshore renewables will accelerate competition for space in the already congested offshore and coastal waterways [
10,
13]. Increasing blue growth and economic development present a number of risks, such as the potential for local fishermen to lose their means of subsistence, lack of access to marine resources, unequal distribution of economic gains, and social problems and cultural influences [
14]. The spatial designation of offshore renewables often constitutes a part of integrated spatial management approaches such as marine spatial planning (MSP), which places restrictions on marine activities including restricted access to conventional fishing grounds, prompting the displacement of fishing activities to other locations [
10,
15,
16]. From a technical standpoint, the requirements for the establishment of offshore wind farms such as turbine foundations, inter-array cables, substations, and associated maintenance zones are deeply embedded within the seabed, which alter benthic communities, hydrodynamic conditions, and physical habitat architecture [
17,
18]. While offshore wind power helps mitigate climate change, it may also pose risks to marine biodiversity. To understand the ecological impacts of development projects, comprehensive spatial analyses that account for both ecological sensitivity and the infrastructure’s footprint are necessary. This is particularly important for blue economy initiatives in Taiwan.
As one of the most diverse marine environments with favorable wind regimes and a shallow continental shelf, Taiwan represents one of the world’s most important offshore wind growth frontiers, further supported by the strong national commitment to the transition to renewable energy. By 2035, the Taiwanese government intends to have installed more than 15 GW of offshore wind capacity through staged development initiatives including the “Thousand Wind Turbines Project” and zonal development policies [
19,
20,
21]. The country’s nuclear phase-out policy after the Fukushima Daiichi nuclear disaster has created a significant energy supply gap [
22,
23], which further reinforces the urgency of the development of offshore renewable energy to offset the lost capacity while still maintaining the stability of the national grid and reducing greenhouse gas emissions. The Taiwan Strait offers strategic advantages for the development of renewable energy infrastructure. With stable monsoon winds and suitable seabed conditions, it provides an ideal environment for the construction of fixed offshore wind farms [
24,
25,
26]. Yet, this area also harbors critical fisheries, migratory routes, and highly productive marine ecosystems [
27,
28], raising the possibility of spatial conflicts between the preservation of marine biodiversity and energy infrastructure. The adoption of integrated approaches such as marine spatial planning (MSP) provides the necessary frameworks for spatial allocation of marine resources that minimize ecological conflict while optimizing socioeconomic outcomes through identification of low-conflict development zones and protection of ecologically sensitive areas [
29,
30]. Unlike the distribution of offshore renewable development regions, traditional free-ranging human endeavors like fishing, which are closely related to the spatiotemporal dynamics of fisheries resources, are hardly taken into account throughout the planning processes [
31]. For formulation and adoption of balanced approaches, there is a need for spatially explicit assessment frameworks for quantification of biodiversity exposure, offshore infrastructure overlap, and planning effectiveness.
In addition to ecological risk assessment, effective marine spatial planning requires governance mechanisms capable of responding to evolving environmental conditions and emerging ecological knowledge. Adaptive management has increasingly been recognized as a core component of ecosystem-based marine spatial planning because it allows decision-makers to revise management measures in response to monitoring results, scientific evidence, and changing environmental conditions. Particularly in offshore renewable energy development, where ecological impacts may emerge gradually and involve considerable uncertainty, adaptive governance frameworks can enhance biodiversity protection by facilitating iterative decision-making, stakeholder engagement, and policy adjustment. Consequently, evaluating governance effectiveness alongside biodiversity risk provides a more comprehensive understanding of marine spatial planning’s capacity to balance renewable energy expansion with marine conservation objectives.
Taiwan’s maritime ecosystems are becoming more and more susceptible to cumulative anthropogenic stresses, even with the country’s remarkable marine biodiversity. The country is actively witnessing ecological fragmentation, species extinction, and habitat degradation attributed to the direct effects of coastal industry, maritime transportation, exploitation of fisheries, and climate change [
32,
33]. The expansion of offshore renewable energy adds another level of ecological and spatial tension [
34,
35], especially in shallow coastal areas where there is an intersection of demands for energy infrastructure and biodiversity conservation. Currently, most research on offshore wind power development originates from European contexts, particularly the North Sea and Baltic Sea regions, and primarily focuses on ecological impacts and spatial planning frameworks.
Table 1 shows the comparative analysis of international studies on offshore renewable energy, biodiversity risk, and marine spatial planning. These studies largely employ advanced spatial modeling tools to assess ecological risks, cumulative impacts, and the effectiveness of marine spatial planning. In contrast, most offshore wind energy research in Taiwan focuses on technical feasibility, engineering design, and economic policies, with little attention paid to spatial biodiversity risk assessments or the effectiveness of marine spatial planning. This has resulted in fragmented evidence and a significant knowledge gap. Therefore, against the backdrop of promoting the expansion of offshore renewable energy while mitigating risks to marine biodiversity, there is an urgent need for a quantitative assessment of the effectiveness of marine spatial planning. This study aims to fill this gap by integrating Geographic Information System (GIS) spatial modeling and governance analysis with ecological spatial data, offshore wind development zones, and marine spatial planning frameworks to assess the relationships among offshore renewable energy expansion, marine biodiversity risks, and the effectiveness of marine spatial planning in Taiwan.
2. Methodology
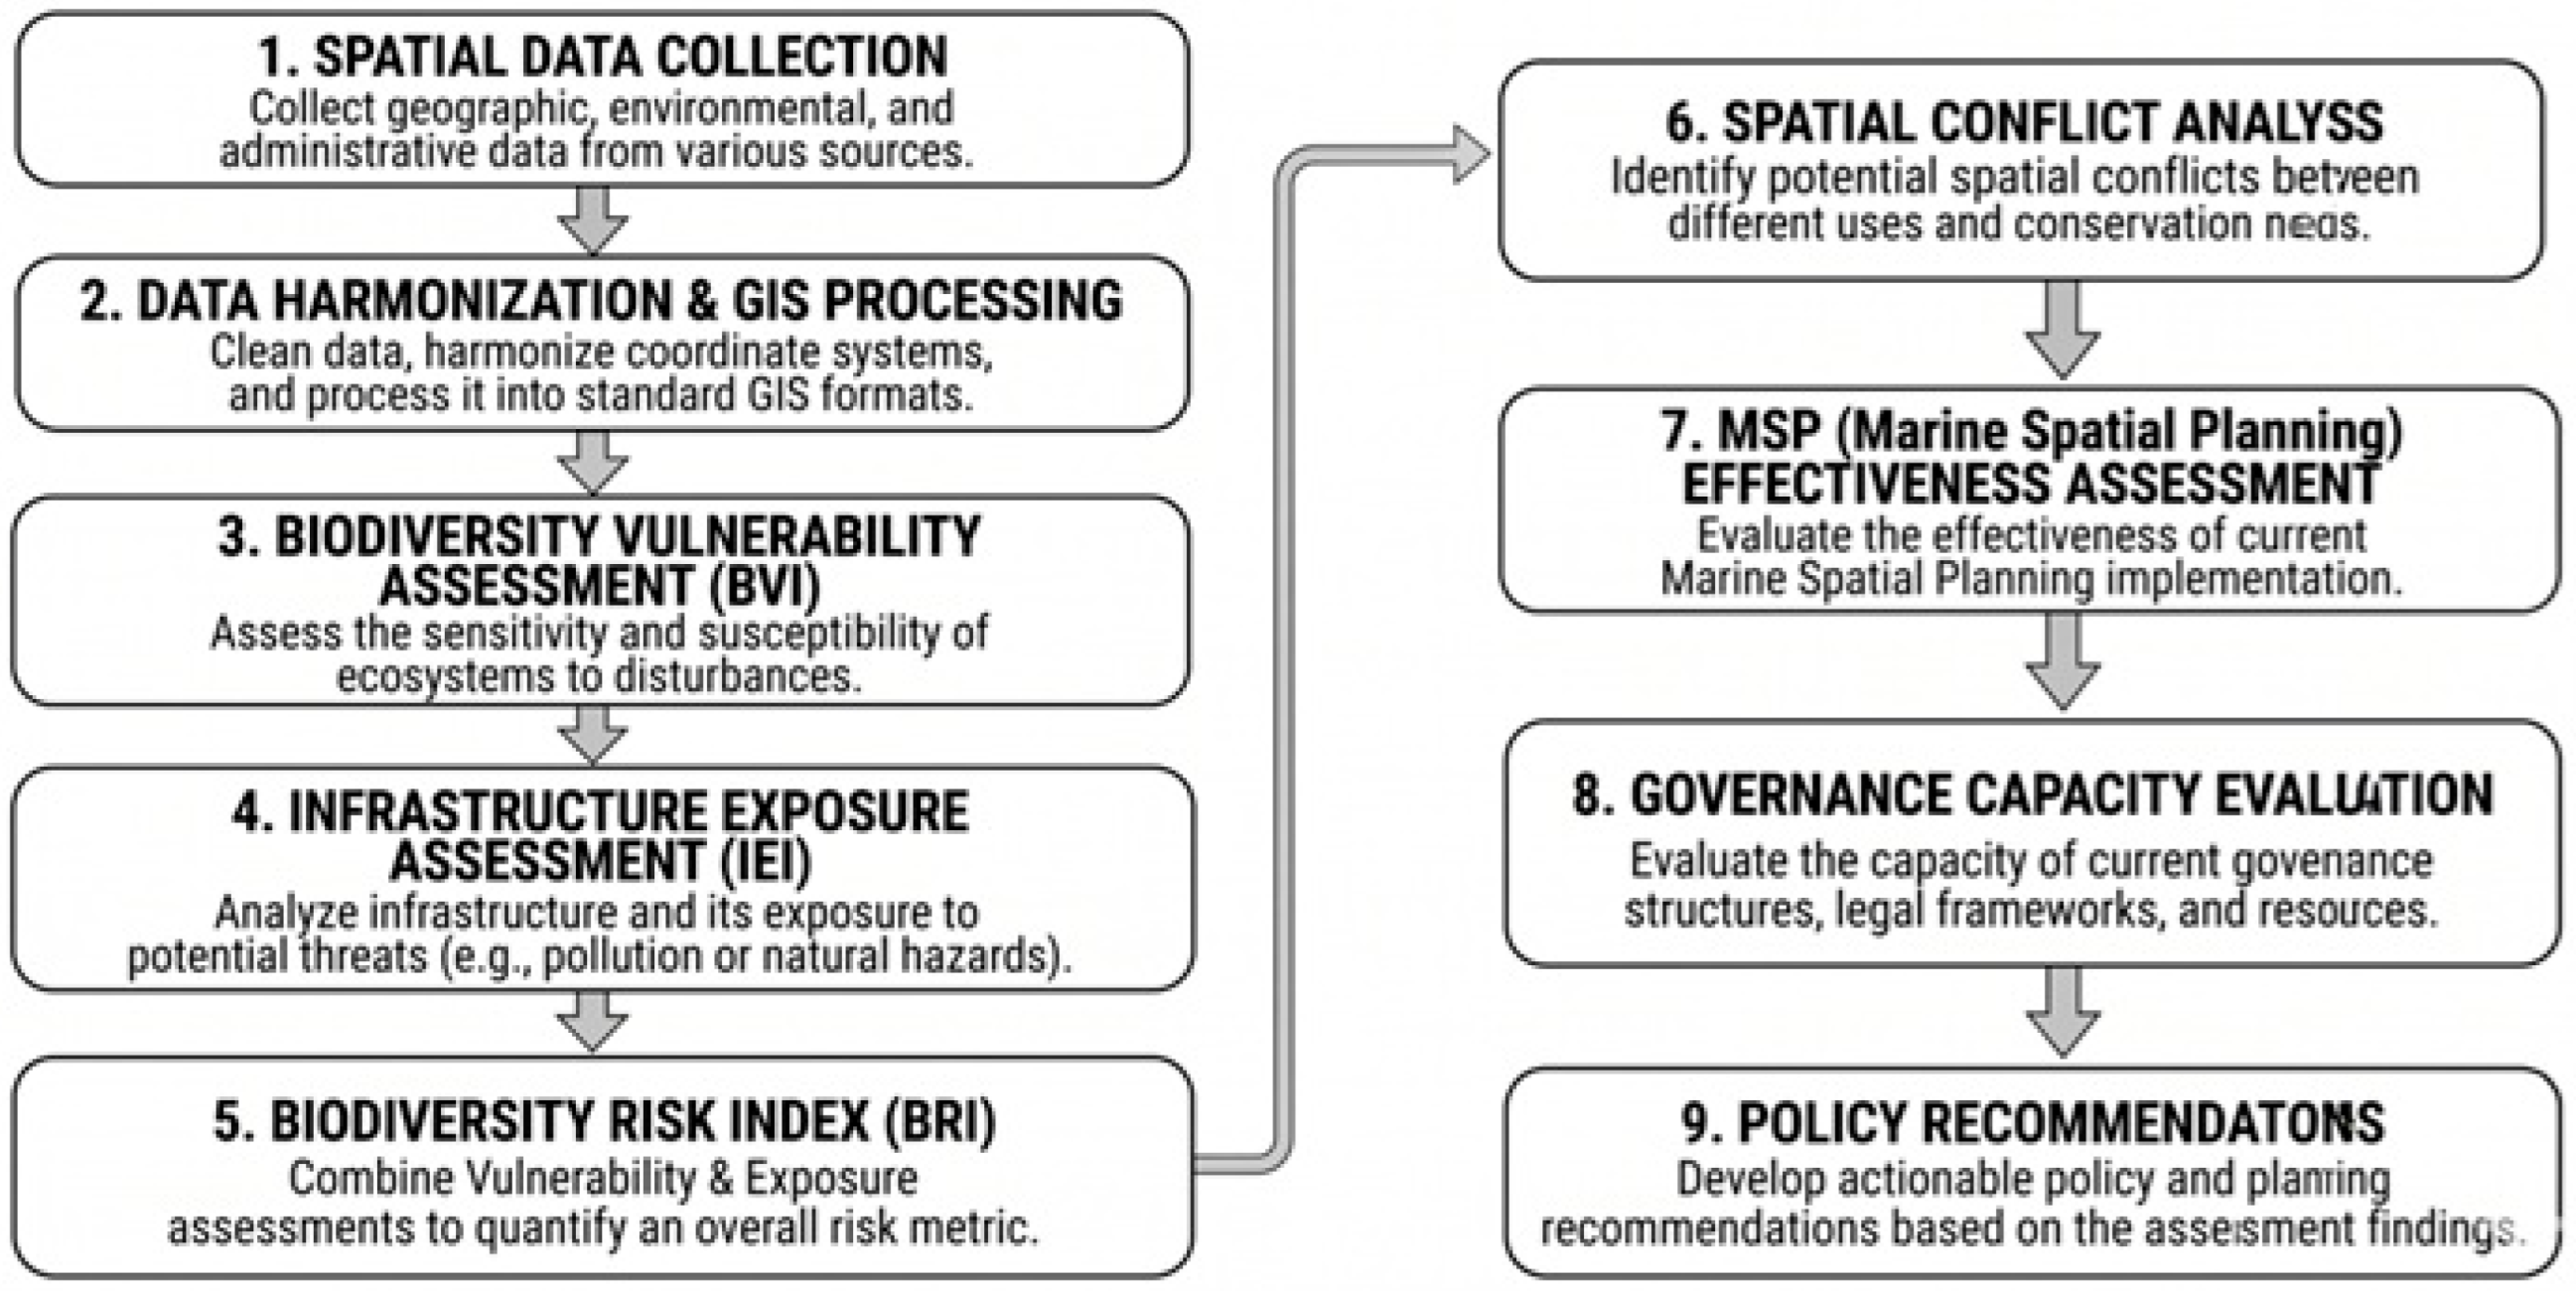
The main objective of this study is to combine Geographic Information System (GIS) spatial modeling with governance analysis to assess the relationships among three key factors in Taiwan: the expansion of offshore renewable energy, risks to marine biodiversity, and the effectiveness of marine spatial planning. Therefore, we adopted a mixed-methods spatial–quantitative research design that integrates geospatial modeling, ecological risk assessment, spatial conflict analysis, and governance evaluation to specifically quantify the extent to which biodiversity is exposed to risks due to offshore wind energy infrastructure, while also assessing the effectiveness of spatial governance mechanisms in mitigating ecological risks. The entire research design is based on GIS spatial modeling, which integrates various spatial datasets representing biodiversity vulnerability, offshore renewable energy infrastructure, and marine spatial planning zones to conduct quantitative assessments. This GIS spatial modeling concept is grounded in the understanding that both marine ecosystems and offshore infrastructure have specific spatial contexts, and that ecological impacts primarily depend on geographical proximity, habitat distribution, and infrastructure density. The Methodological Workflow of the Spatial–Governance Assessment Framework as
Figure 1.
This study contains four core analytical components. First, we conduct GIS-based biodiversity risk modeling to quantify the spatial distribution of ecological vulnerability in Taiwan’s marine environment. This is achieved by integrating indicators such as species richness, habitat sensitivity, conservation status, and ecological connectivity into a composite biodiversity vulnerability index. The second component analyzes the spatial overlap and conflicts between offshore renewable energy infrastructure and areas of high biodiversity vulnerability. Offshore wind energy infrastructure introduces fixed sources of ecological pressure; when these sources overlap with ecologically sensitive areas, biodiversity risks arise. We used spatial overlay analysis to identify where offshore wind development areas intersect with high-vulnerability zones. Part Three focuses on evaluating the effectiveness of marine spatial planning in mitigating biodiversity risks by examining the spatial alignment between offshore wind development areas and biodiversity-vulnerable zones. We use quantitative spatial indicators to determine the extent to which marine spatial planning can reduce the risks to biodiversity posed by offshore renewable energy infrastructure. The final section is a governance capacity assessment that primarily examines whether the marine spatial planning system has sufficient institutional capacity to regulate offshore renewable energy development and protect marine biodiversity.
This analytical framework covers two areas: ecological risk modeling and spatial governance effectiveness assessment. For ecological risk modeling, the primary task is to quantify biodiversity vulnerability and infrastructure exposure. Specifically, this involves developing a spatial biodiversity vulnerability index, an infrastructure exposure index, and a composite biodiversity risk distribution map. For spatial governance effectiveness, the focus is on assessing how marine spatial planning (MSP) influences the spatial distribution of biodiversity risks. Here, “governance effectiveness” refers to the extent to which MSP can reduce biodiversity’s exposure to risk through spatial planning decisions. As for “biodiversity risk,” we define it as the product of ecological sensitivity and infrastructure exposure, a risk that is moderated by governance effectiveness. Simply put, spatial modeling is used to calculate ecological risk, while governance analysis is used to assess the extent to which the planning framework can mitigate or, conversely, exacerbate this risk. Based on this conceptual framework, the core relationship between the two can be expressed using the following model in Equation (1):
The main spatial analysis unit in this study is a unified grid system applied to waters under Taiwan’s jurisdiction. We adopted a 1 km × 1 km grid resolution as the primary analytical scale for assessing biodiversity vulnerability, the exposure of offshore wind energy infrastructure, and spatial conflicts. Within this modeling framework, each grid cell serves as an independent unit of analysis. Within each grid cell, we aggregate and standardize biodiversity indicators to calculate a Biodiversity Vulnerability Index (BVI). We also calculate the presence and density of offshore wind infrastructure to derive an Infrastructure Exposure Index (IEI). Multiplying these two standardized indices yields a spatially continuous map of biodiversity risk. We will also conduct sensitivity analyses to assess how different spatial resolutions affect biodiversity risk classification. All ecological indicators were normalized to a common scale ranging from 0 to 1 using min–max normalization. The Biodiversity Vulnerability Index (BVI) was then calculated using a weighted linear combination of the standardized indicators. Because all indicator values were normalized between 0 and 1 and the weights were constrained to sum to 1.0, the theoretical range of the BVI is also 0–1, where 0 indicates minimal biodiversity vulnerability and 1 indicates maximum biodiversity vulnerability.
The spatial scope of this analysis covers Taiwan’s Exclusive Economic Zone (EEZ), which refers to the maritime areas over which Taiwan exercises jurisdiction regarding marine resource development and environmental management. Within this broader EEZ, the analysis focuses specifically on the offshore wind power development corridor in the Taiwan Strait. Located along the western continental shelf of Taiwan, this corridor features suitable water depths, strong and stable winds, and proximity to grid infrastructure; consequently, the majority of offshore wind facilities currently in operation or under planning are concentrated here. Using the EEZ as the outer analytical boundary ensures that our assessment of offshore wind expansion scenarios through 2035 remains within Taiwan’s jurisdictional and planning framework. All spatial layers were projected and harmonized using the WGS84 geographic coordinate system and were projected onto the appropriate Universal Transverse Mercator (UTM) zone (i.e., Zone 51N) to enable precise area calculations and facilitate grid alignment.
For the purpose of this study, MSP boundaries refer to the spatial management units designated under Taiwan’s marine spatial planning framework. These boundaries include marine protected areas (MPAs), ecological conservation zones, fisheries management areas, offshore renewable energy development zones, and other marine-use zones established within Taiwan’s territorial waters and Exclusive Economic Zone (EEZ). Therefore, MSP boundaries do not represent a single jurisdictional boundary; rather, they constitute a collection of spatially defined management zones used to regulate marine activities and biodiversity conservation.
Also, the spatial scope is further defined by Taiwan’s legally established maritime jurisdiction and the designated offshore renewable energy development zones, covering Taiwan’s territorial waters and exclusive economic zone (EEZ). Within these waters, Taiwan holds sovereign rights over the use of marine resources and environmental governance. Taiwan’s territorial waters extend 12 nautical miles from the baselines, within which Taiwan exercises full sovereignty, including regulatory authority over infrastructure development, conservation measures, and environmental protection. The exclusive economic zone (EEZ), extending 200 nautical miles from the baselines, grants Taiwan rights to resource exploration, renewable energy development, and marine environmental management. Although the EEZ constitutes the outer boundary of the analysis, the ecological framework is structured around several key marine regions. These regions are delineated based on oceanographic, ecological, and habitat characteristics related to biodiversity vulnerability and interactions with offshore renewable energy. Among these, the Taiwan Strait is the primary ecological focus area.
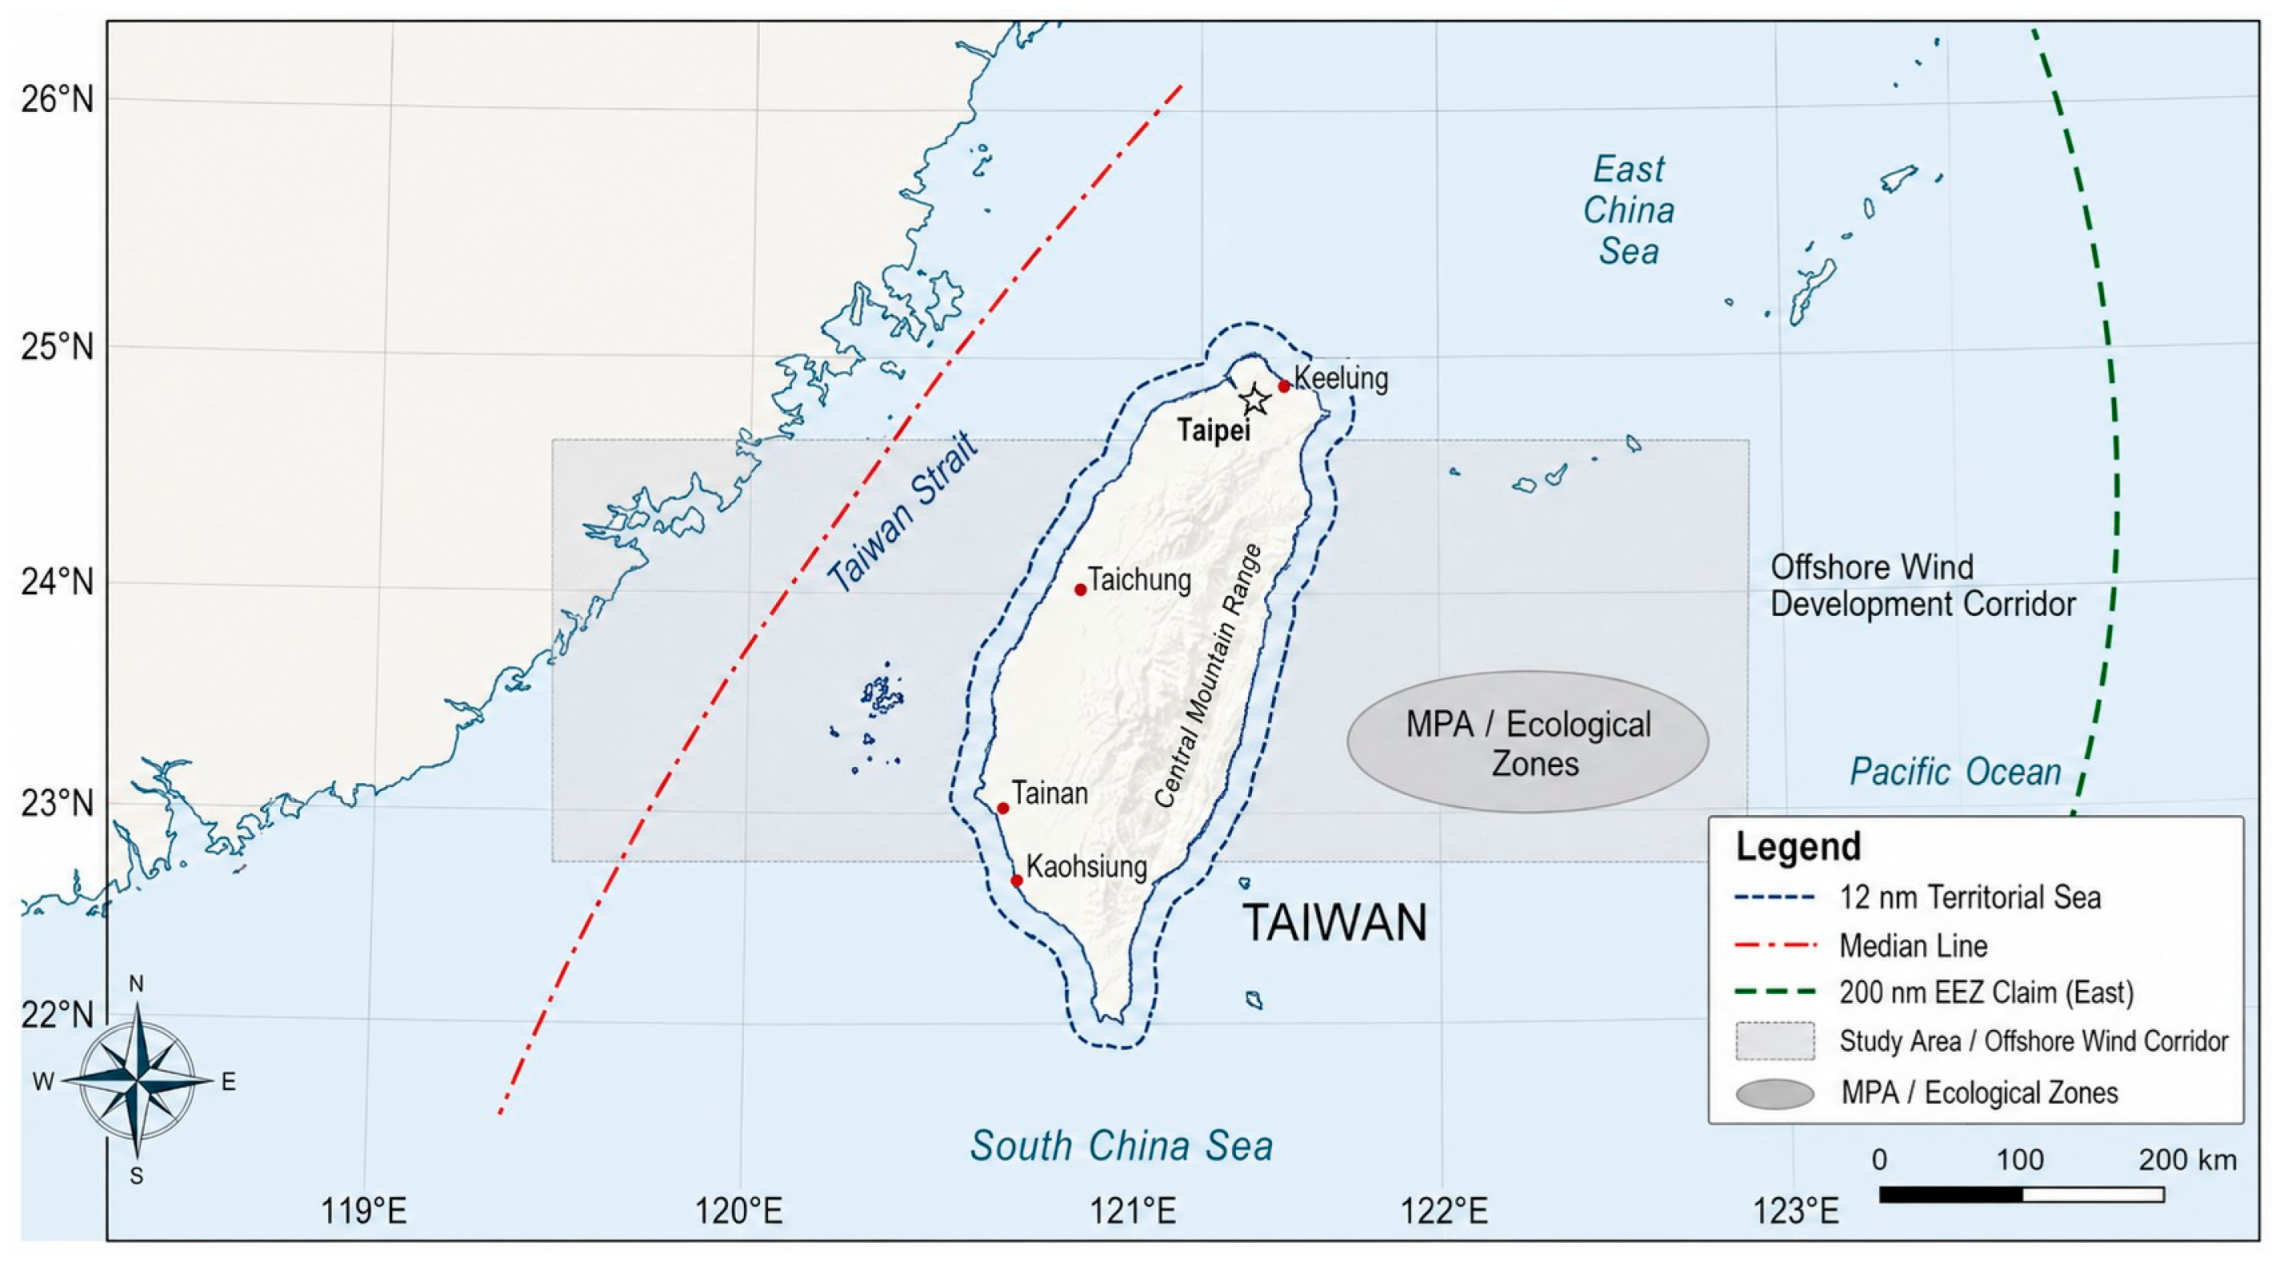
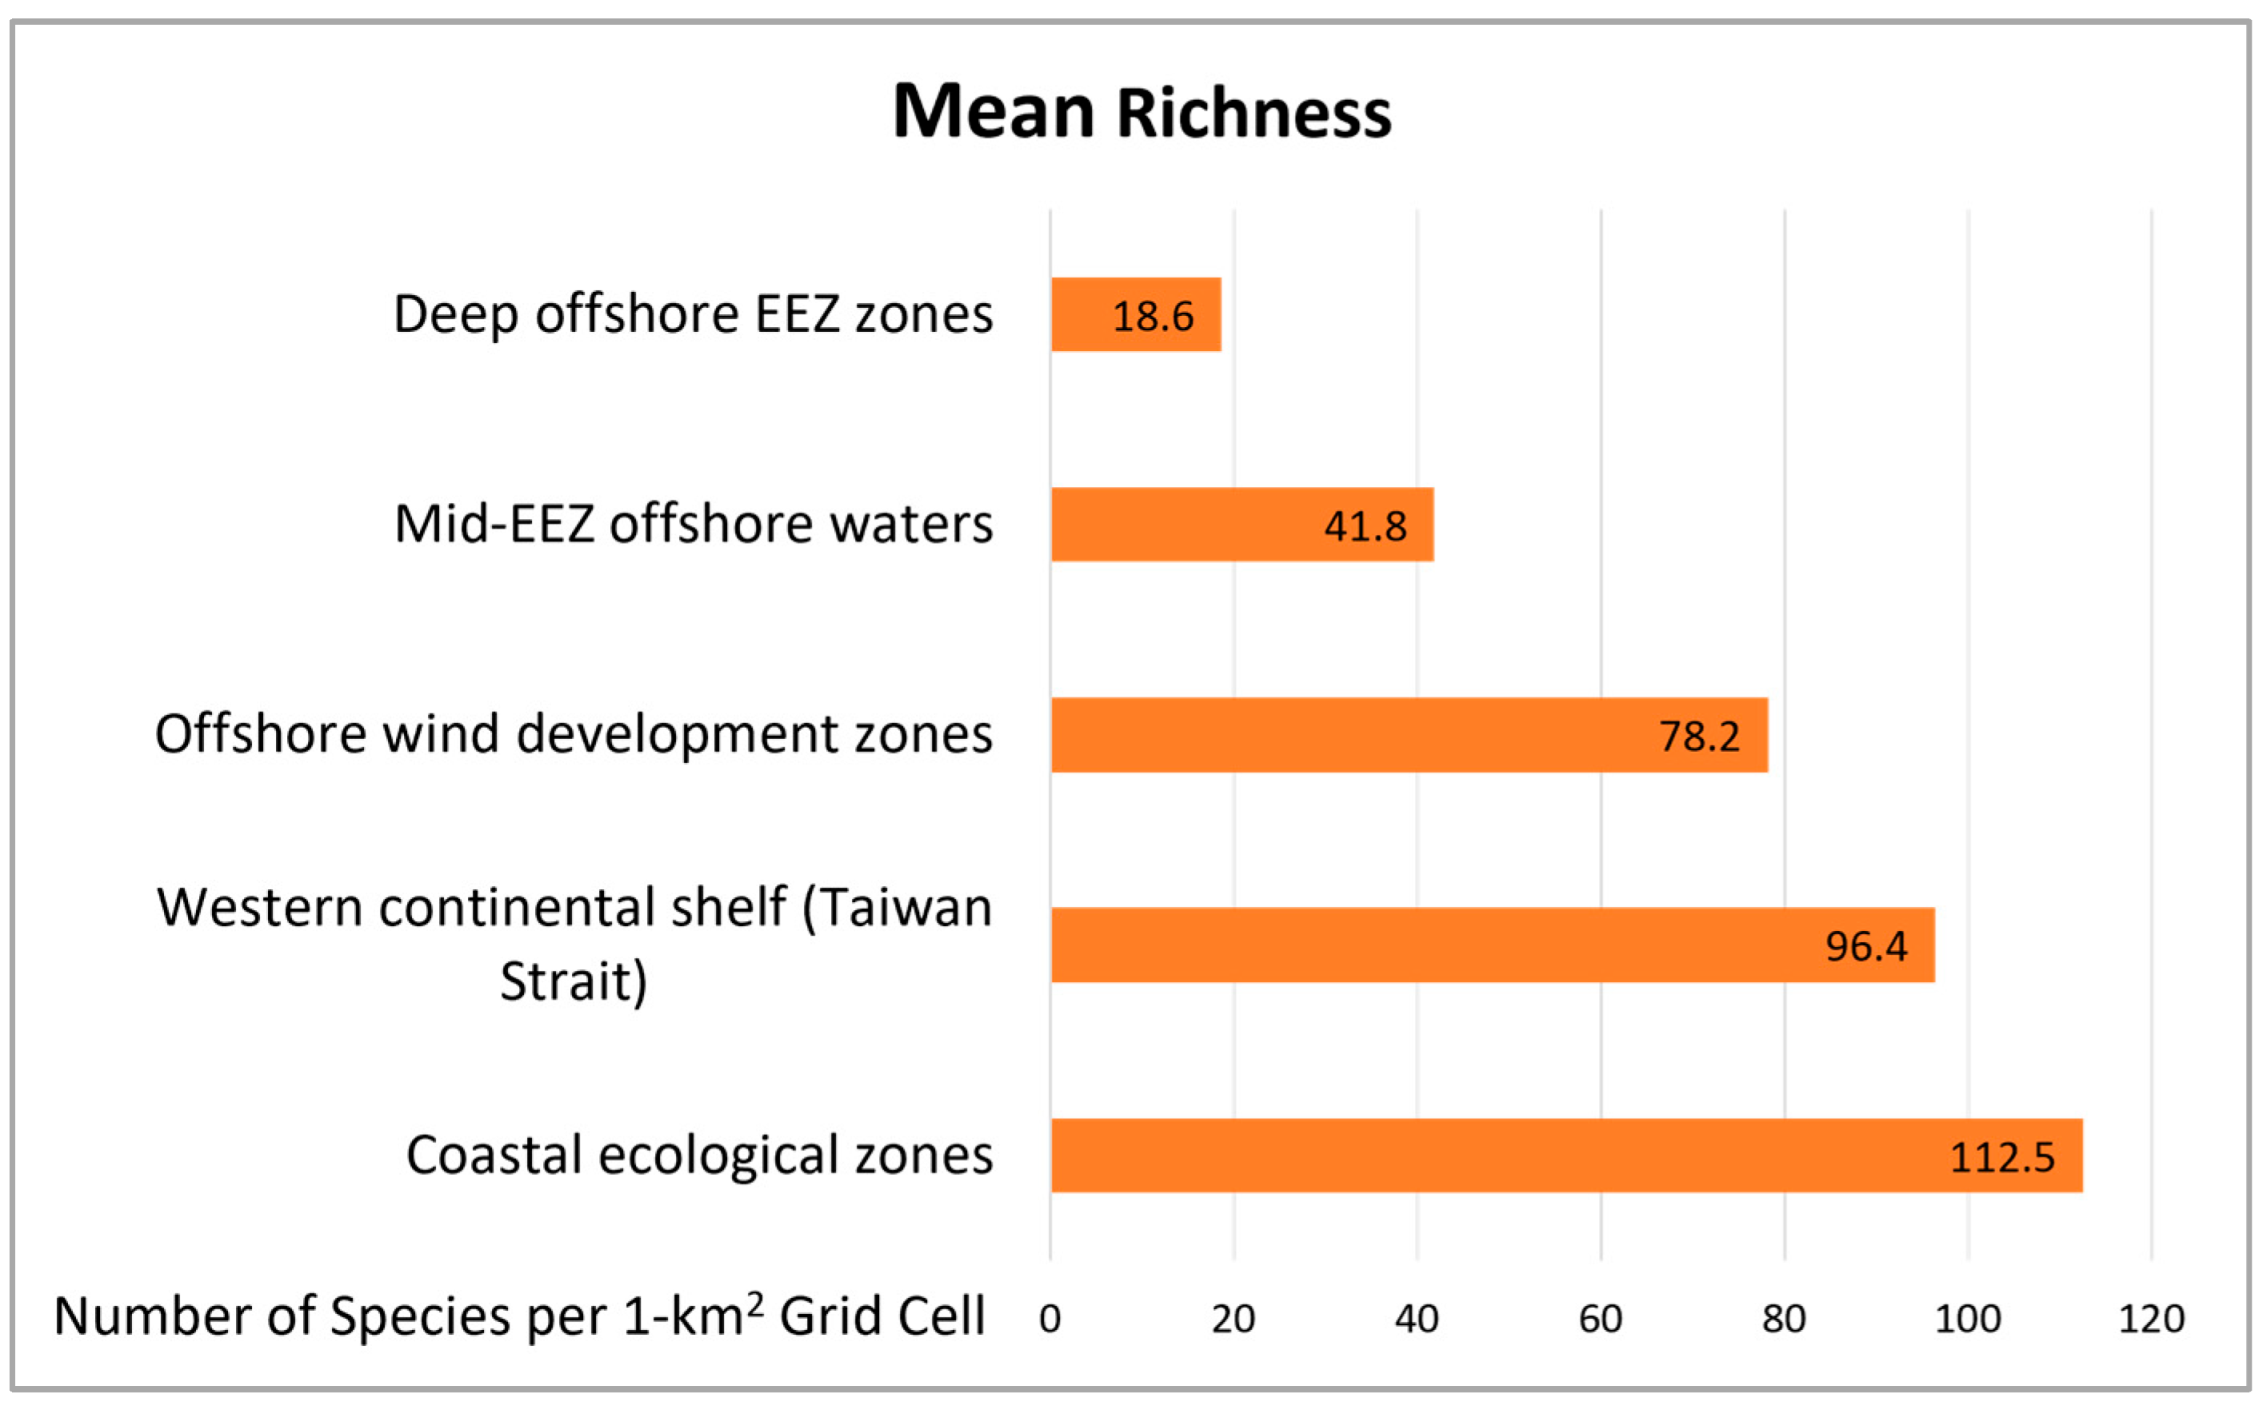
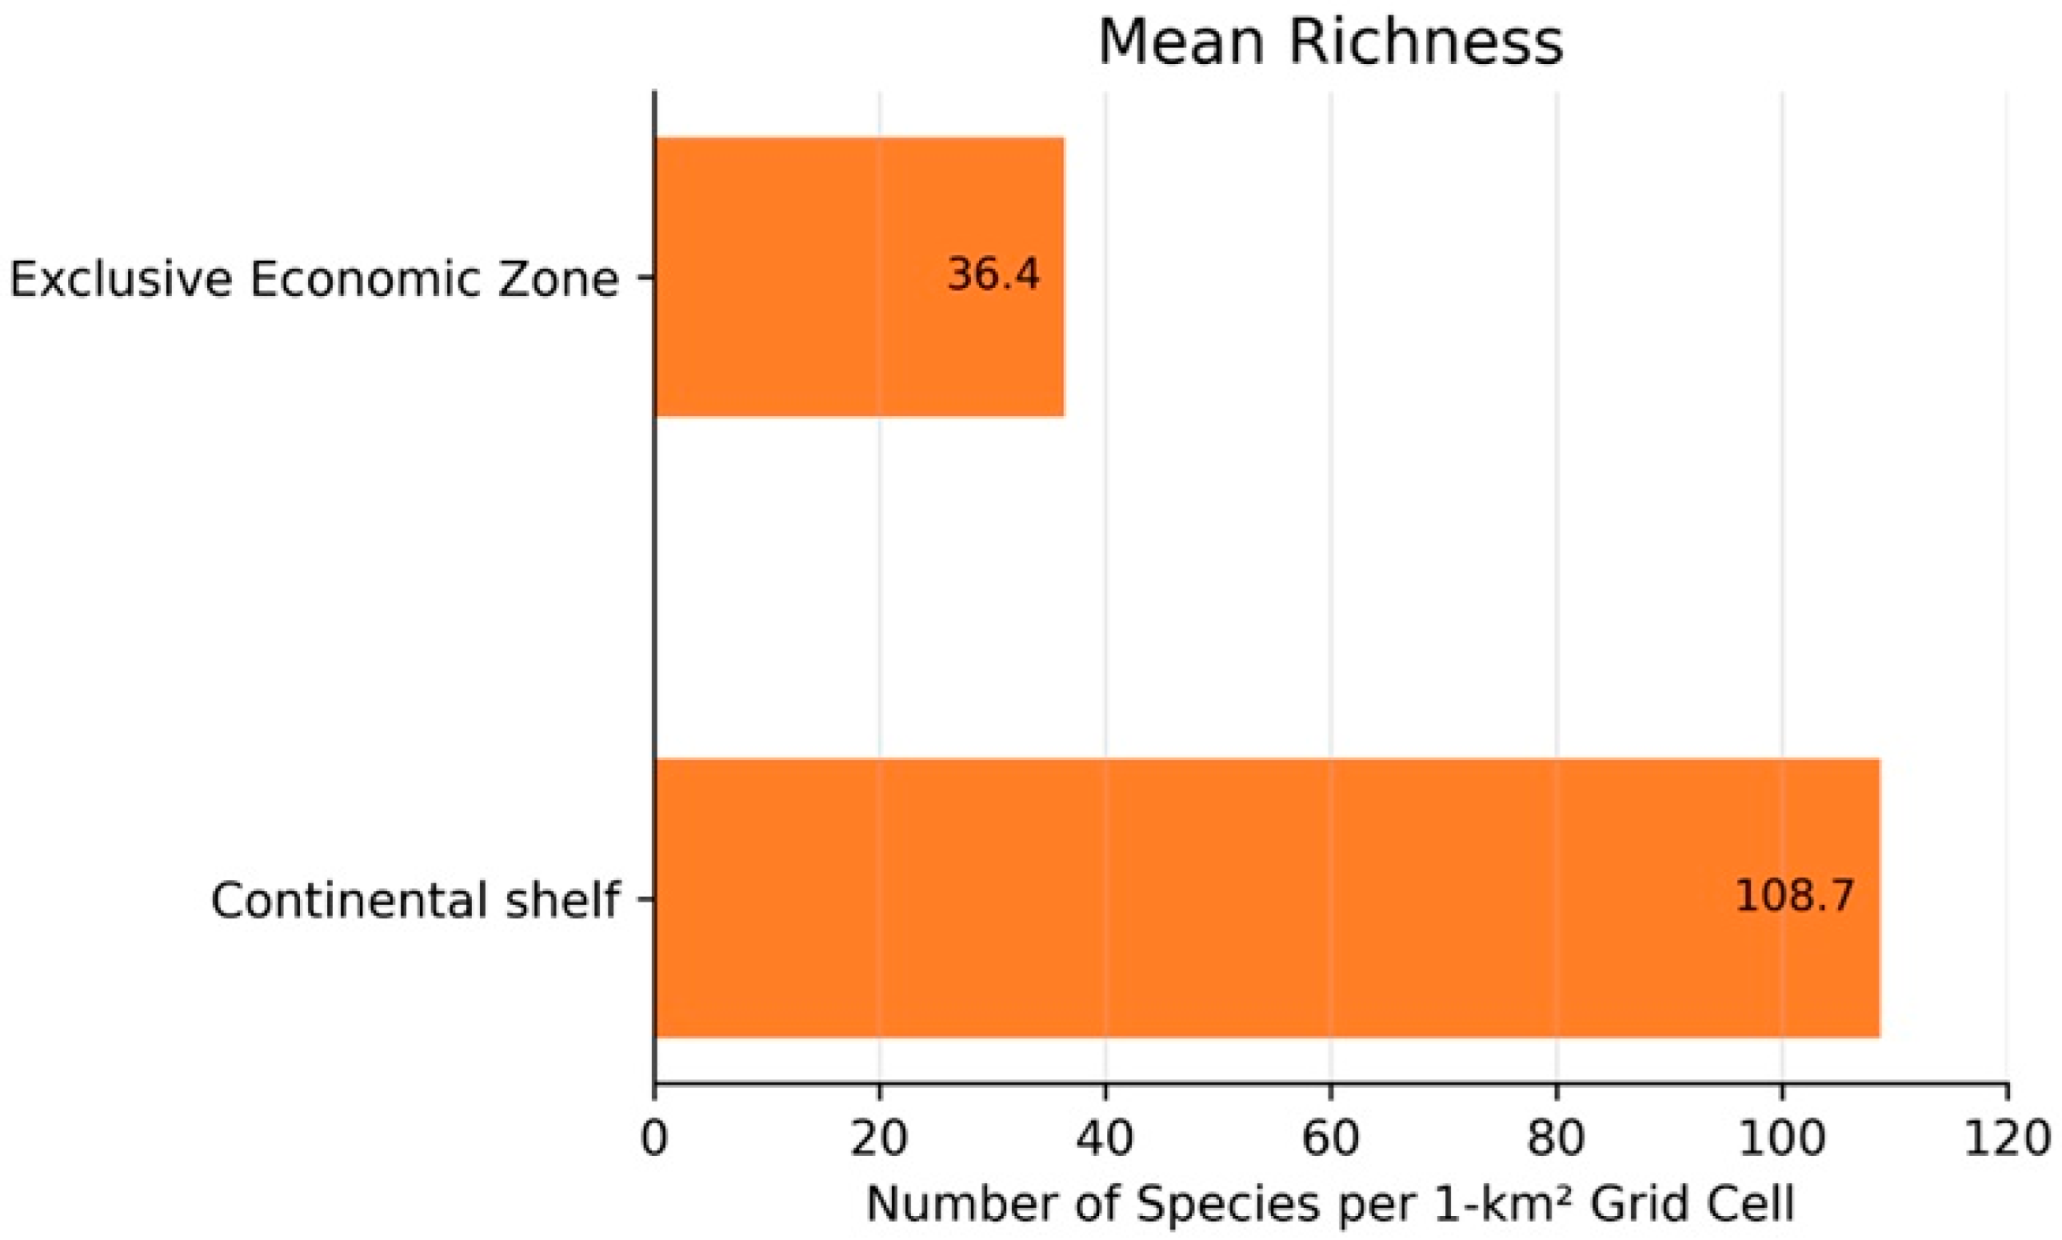
Figure 2 presents the spatial extent of the study area, including Taiwan’s territorial waters, Exclusive Economic Zone (EEZ), offshore wind development corridors, and marine spatial planning (MSP) management zones. The figure provides the geographic framework within which biodiversity vulnerability, infrastructure exposure, and governance effectiveness were assessed. The majority of offshore wind development zones are concentrated along the western continental shelf of the Taiwan Strait, whereas biodiversity-sensitive areas are distributed across both coastal and offshore marine ecosystems. The temporal scope of this study is designed to cover both the ecological baseline conditions and the projected trajectory of offshore renewable energy expansion. Biodiversity baseline data were compiled from 2015 to 2024. The analysis of offshore wind power development is divided into three time phases: operational facilities (2020–2025), approved and planned projects (2025–2030), and long-term projected capacity expansion (2030–2035). The 2020–2025 phase corresponds to the initial large-scale deployment under Taiwan’s zoned development strategy. The 2025–2030 phase reflects the grid connection plans for approved development zones. The 2030–2035 forecast aligns with Taiwan’s long-term goal of achieving a total installed offshore wind capacity exceeding 15 GW.
The datasets used in the analysis fall into four main categories: spatial data on offshore renewable energy, spatial data on marine biodiversity, environmental and oceanographic data, and data on marine spatial planning and governance. Spatial data on offshore renewable energy is primarily used to calculate the area occupied by offshore wind power development within Taiwan’s jurisdictional waters, the density of development, and the trajectory of expansion over time. Key infrastructure datasets include the georeferenced locations of offshore wind turbines, which are represented as “points” and include the precise coordinates of installed or planned turbine foundations. The infrastructure capacity of each wind farm or group of wind turbines is recorded in megawatts (MW) and serves as a quantitative indicator of infrastructure density. Data sources include government energy agencies, the Global Wind Atlas, the World Bank’s offshore wind database, and infrastructure distribution maps derived from satellite imagery.
Spatial data on marine biodiversity covers georeferenced information such as species distribution, habitat sensitivity, ecological connectivity, and conservation priority areas within Taiwan’s jurisdictional waters. This data are used to construct biodiversity vulnerability models and assess ecological risks associated with the expansion of offshore renewable energy. Sources of this data include the Ocean Biodiversity Information System (OBIS), the Global Biodiversity Information Facility (GBIF,
https://www.gbif.org/ (accessed on 9 January 2026)), the Ocean Affairs Council of Taiwan, and datasets obtained from scientific surveys. The environmental and oceanographic data are used to model ecological vulnerability distribution while the marine spatial planning and governance data provide the necessary governance attributes including protection levels, regulatory restriction intensity and enforcement designation.
The collected data are first pre-processed through spatial harmonization to ensure that all ecological, infrastructure, and governance datasets are analytically compatible within a unified geospatial modelling framework. Strict pre-processing techniques are necessary to remove scale distortions, spatial misalignment, resolution-induced bias, and projection inconsistencies due to the integration of several data types (point, polyline, polygon, and raster) from diverse sources. All spatial datasets are first reprojected into a common geographic and projected coordinate framework. The harmonization process follows two steps including the standardization of geographic coordinates by converting all datasets to WGS84 (EPSG:4326) and transformation of projected coordinates for analysis. Datasets derived from OBIS, GBIF, government surveys, satellite imagery, and infrastructure planning are standardized to a common raster grid resolution prior to modelling. Vector layers (i.e., data such as points, lines, and polygons) are first converted into a raster format aligned with the analysis grid. “Point” data, such as turbine locations, is converted into a layer reflecting distribution density using kernel density estimation; whereas “line” data, such as power lines and migration corridors, is first converted into a raster format after establishing buffer zones based on ecologically meaningful impact distances. Polygon data are converted to binary or weighted raster layers indicating presence and intensity.
To prevent spatial misalignment between layers, a master grid template is created covering Taiwan territorial waters (12 nautical miles), Taiwan EEZ (200 nautical miles) and offshore wind priority zones. Sensitivity analyses are conducted to assess the effect of sparse-data regions on risk outcomes. The processed datasets are then cleaned and their quality confirmed. First, duplicate biodiversity records are filtered using species name standardization (taxonomic harmonization), exact coordinate matching (latitude–longitude precision to ≥4 decimal places), and temporal matching (same species, same date, same coordinates). Taxonomic harmonization is performed using standardized nomenclature consistent with the International Union for Conservation of Nature Red List. Statistical outlier detection is conducted using Z-score distance from species centroid distribution, nearest-neighbour distance thresholds, range-based ecological plausibility filters, and records exceeding ecological plausibility thresholds are removed. Each biodiversity layer is assigned a data quality score based on source reliability, spatial resolution, sampling density and temporal recency. Following cleaning and validation, biodiversity indicators are transformed into continuous spatial surfaces compatible with raster-based modelling to generate ecologically meaningful distribution probability layers aligned with the 1 km analytical grid.
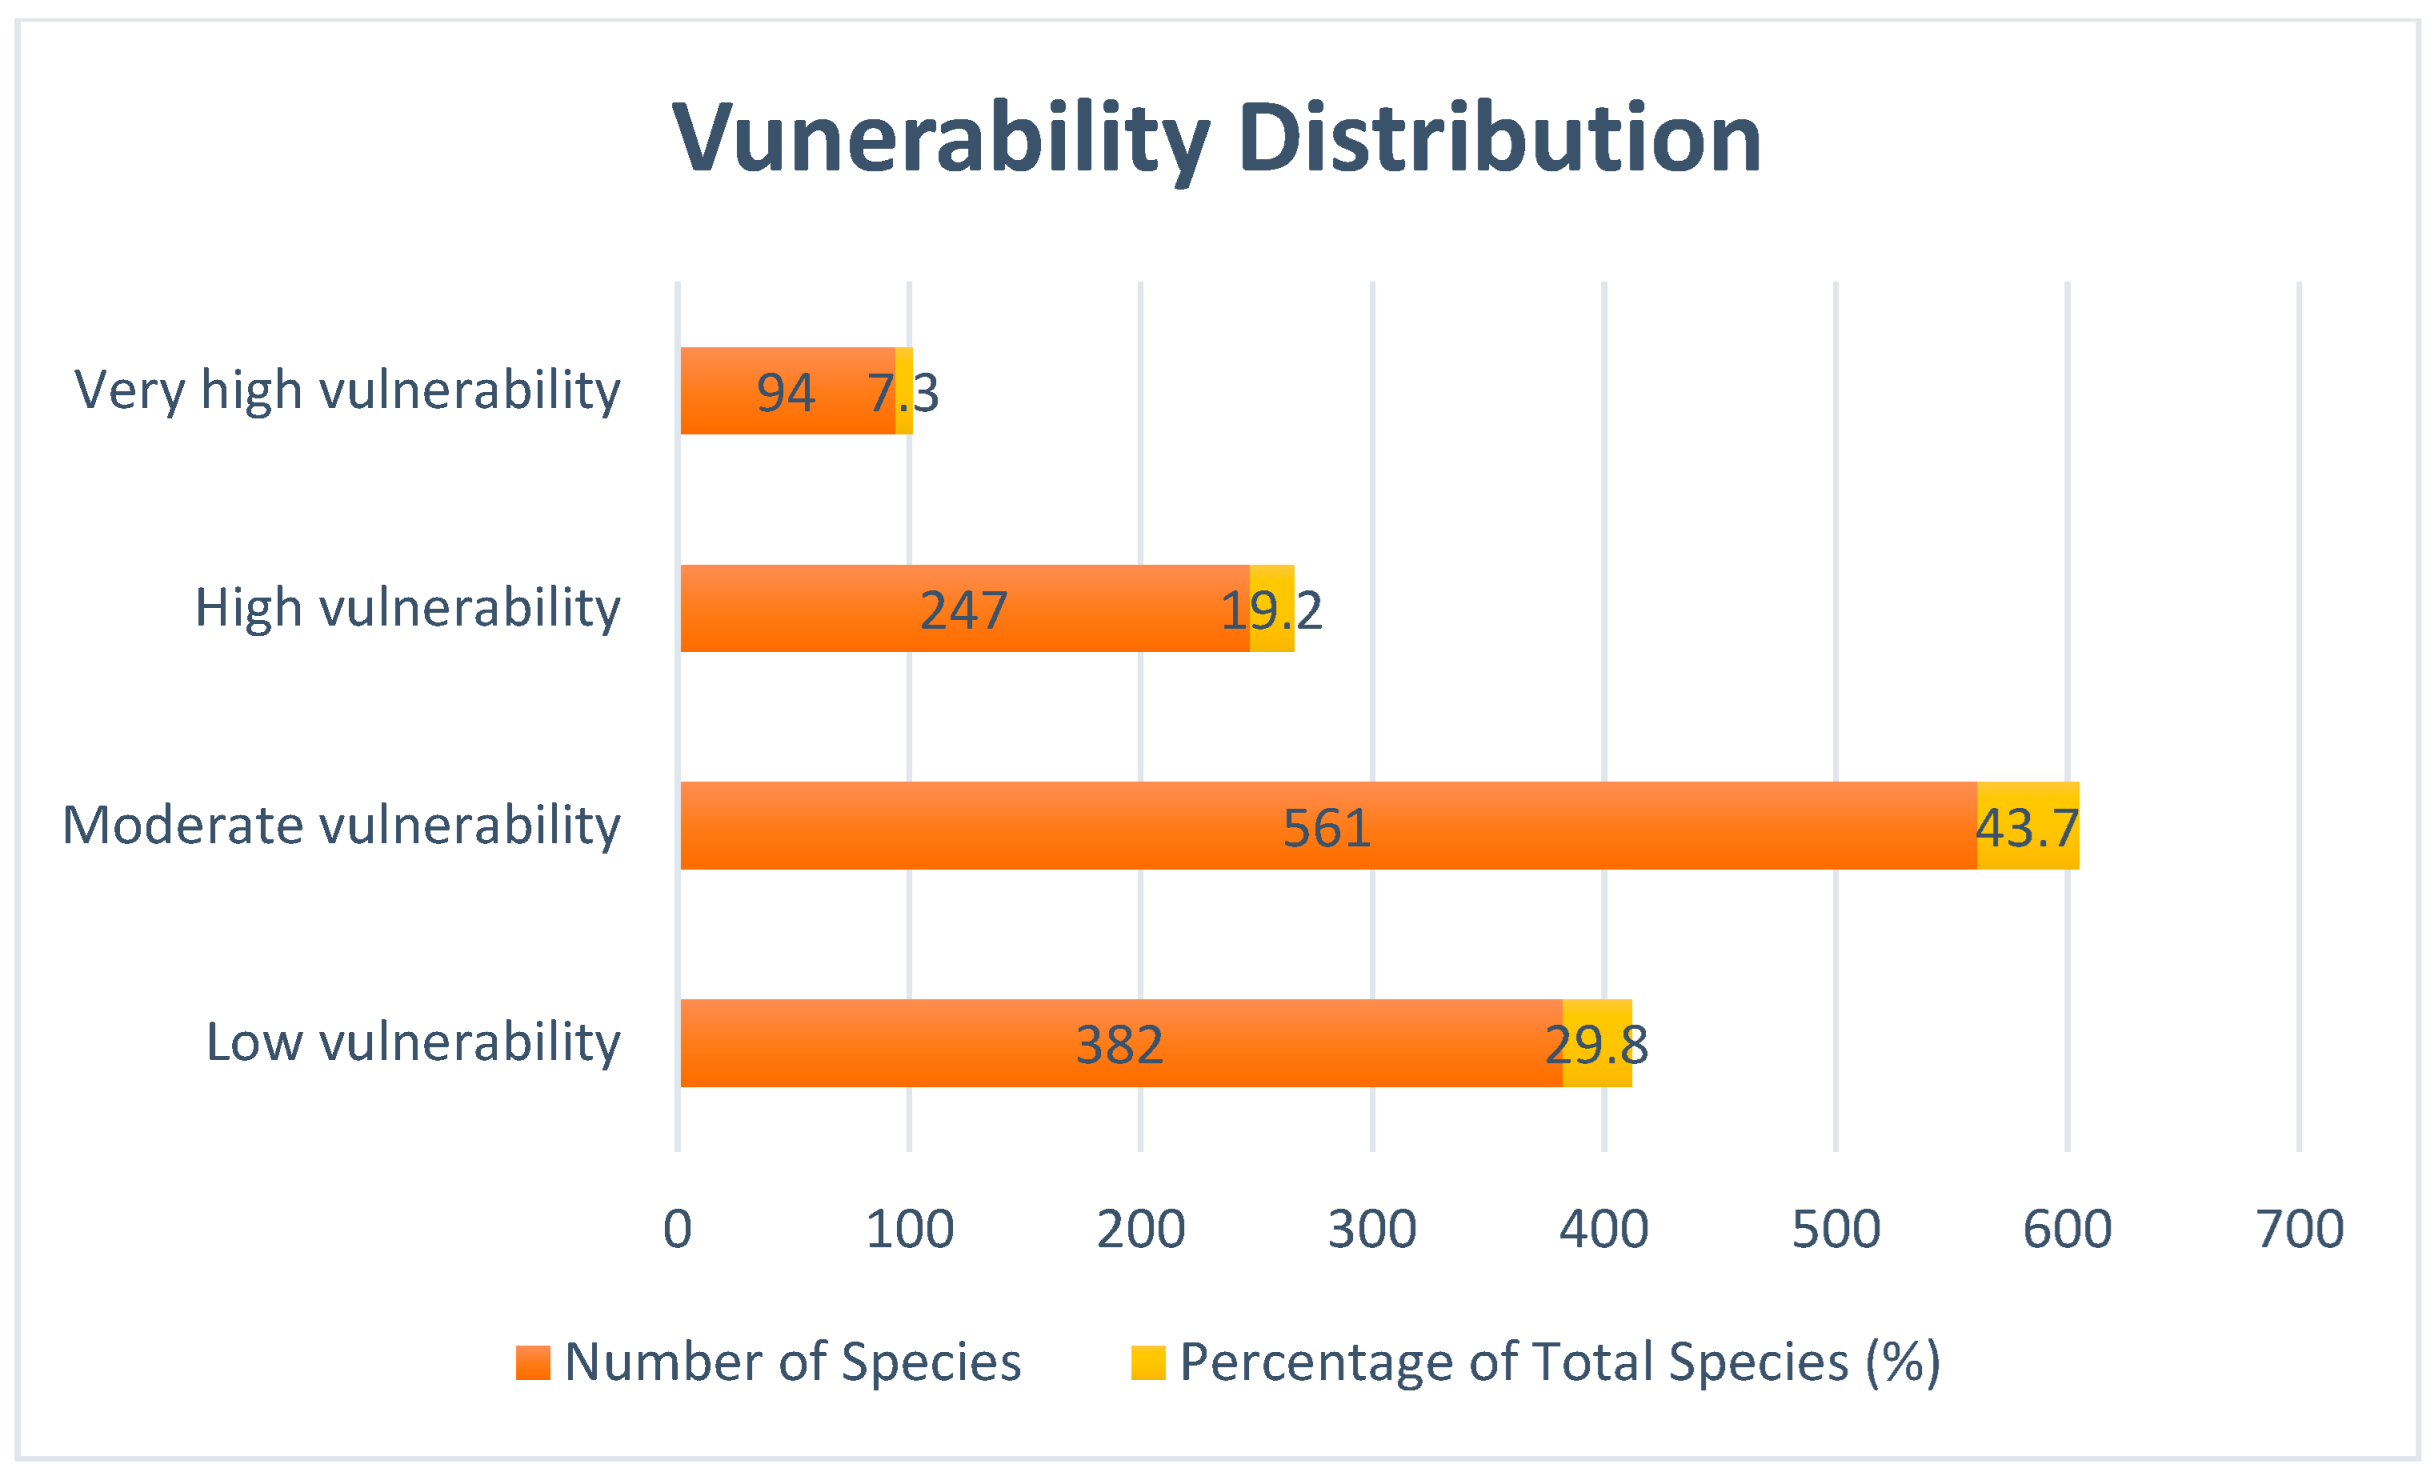
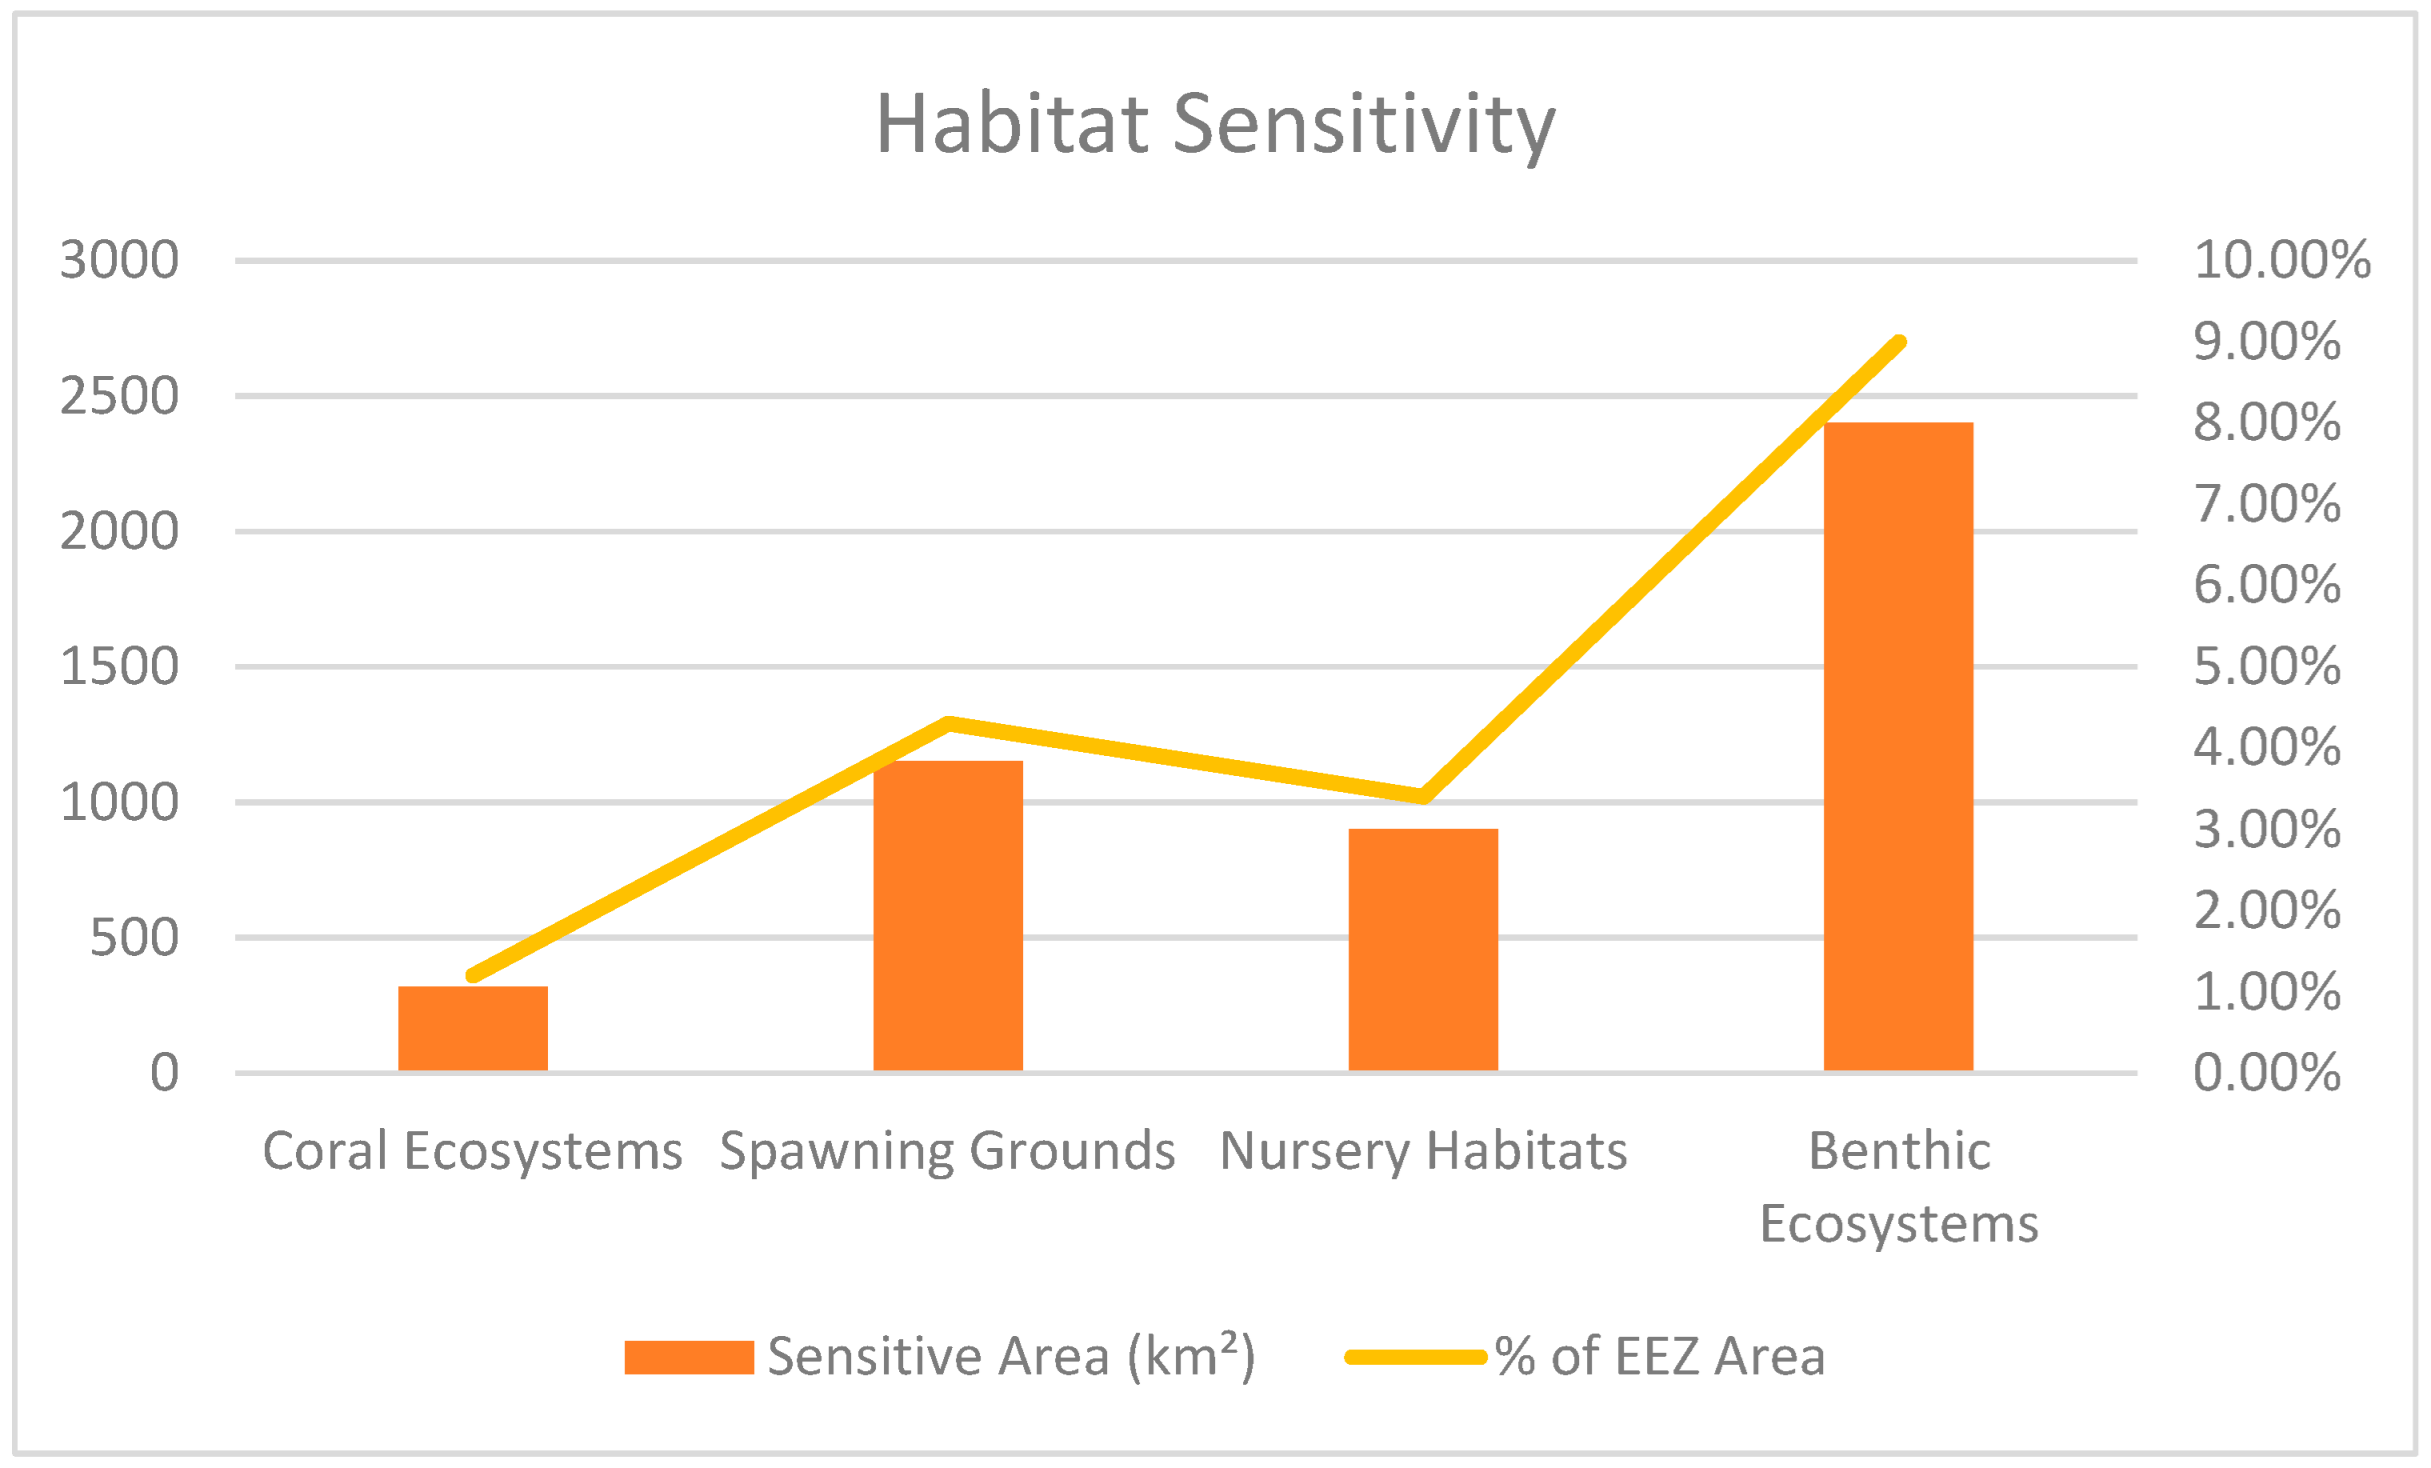
The Biodiversity Vulnerability Index (BVI) was developed to quantify the spatial distribution of ecological sensitivity and conservation priority across Taiwan’s marine environment. The index integrates multiple ecological indicators representing biodiversity composition, conservation importance, and ecological function into a single composite raster surface. The BVI is constructed using a multi-criteria spatial modelling approach involving indicator selection, standardization, weight assignment, and composite index calculation. The core ecological indicators include species richness, species vulnerability, habitat sensitivity, conservation status, and ecological connectivity. Min–max normalization is applied to transform each indicator into a uniform range between 0 and 1, as shown in Equation (2). Habitat sensitivity refers to the ecological importance and disturbance susceptibility of marine habitats. Spatial datasets representing coral reef ecosystems, spawning grounds, nursery habitats, benthic ecosystems, and other ecologically significant habitats were compiled from national marine biodiversity databases and scientific surveys. Habitat sensitivity scores were assigned according to habitat ecological value and expected sensitivity to offshore infrastructure development. Conservation status reflects the legal and ecological protection importance of species and habitats. This indicator was developed using information from IUCN conservation classifications, nationally protected species lists, marine protected area designations, and conservation priority areas identified by government agencies. Areas containing protected species or conservation priority habitats received higher conservation status scores. Ecological connectivity represents the degree to which marine habitats facilitate species movement, migration, dispersal, and ecological interactions. Connectivity was assessed using spatial information on migration corridors, habitat continuity, larval dispersal pathways, and ecological linkage zones. Areas functioning as important ecological corridors or supporting high habitat connectivity received higher connectivity scores due to their greater importance for maintaining ecosystem resilience and biodiversity persistence. (see
Table 2)
Each indicator raster is processed using GIS raster calculator to produce a standardized raster layer, a cell resolution of 1 km and value range of 0–1, as shown in Equation (3);
Equal weighting was applied to the five ecological indicators because no empirical evidence was available to justify differential weighting among biodiversity attributes. Each indicator contributed equally (weight = 0.20) to the Biodiversity Vulnerability Index (BVI). This approach minimizes subjective bias and is commonly applied in composite ecological vulnerability assessments where indicator importance cannot be robustly differentiated. The Biodiversity Vulnerability Index (BVI) is calculated using weighted linear combination of standardized indicators, as shown in Equation (4).
where:
= Biodiversity Vulnerability Index;
= weight of indicator ;
= standardized value of indicator ;
= number of indicators.
Offshore wind infrastructure exposure modelling quantifies the spatial extent and intensity of anthropogenic pressure exerted by offshore renewable energy installations on marine ecosystems. The exposure model integrates infrastructure footprint, infrastructure intensity, and ecological proximity effects within a GIS-based raster modelling framework. The spatial footprint of offshore wind infrastructure represents the geographic extent over which offshore wind installations may directly or indirectly influence marine ecosystems. The infrastructural components incorporated into the spatial exposure model include turbine footprint, ecological Buffer Zones (500 m–5 km Influence Radius), cable routes and wind farm boundaries. All infrastructural components were integrated into a unified raster infrastructure footprint layer to represent the infrastructure presence and influence intensity. Infrastructure intensity represents the magnitude and concentration of offshore wind infrastructure within each spatial unit and is calculated using three primary metrics including turbine density, capacity density and infrastructure proximity index. Turbine density represents the number of turbines within each grid cell or defined spatial radius and is calculated as in Equation (5).
Capacity density represents the installed wind power capacity within each spatial grid cell and is calculated as in Equation (6);
Infrastructure proximity quantifies the distance between each grid cell and the nearest offshore wind infrastructure element and is calculated as in Equation (7);
Infrastructure intensity index combines turbine density, capacity density, and proximity metrics, and is computed as follows;
The Exposure Index quantifies the level of ecological exposure to offshore wind infrastructure based on infrastructure intensity and ecological proximity effects, and is computed as follows;
where Infrastructure Intensity is the composite infrastructure density index and influence function is the distance-based proximity weighting function. Proximity weights were assigned using distance decay functions using the following formula;
where:
Exposure modelling was implemented using ArcGIS Pro 3.5 for spatial processing and Python 3.11.11.
Spatial biodiversity risk modelling integrates ecological vulnerability and offshore wind infrastructure exposure into a unified quantitative framework to identify areas where offshore renewable energy development poses the greatest threat to marine ecosystems. The Biodiversity Risk Index (BRI) was calculated using a multiplicative risk model that integrates the Biodiversity Vulnerability Index (BVI) and Infrastructure Exposure Index (EI).
The risk index was calculated using GIS raster formula as follows
The risk index values were interpreted using the following
Table 3.
Spatial risk mapping was conducted to visualize and quantify biodiversity risk distribution across Taiwan’s offshore wind development regions. Hotspot clusters were identified using spatial clustering analysis and contiguous high-risk grid aggregation. Spatial overlay was performed using GIS intersection and raster overlay tools to produce a spatial dataset linking ecological risk and governance protection status. Spatial alignment effectiveness measures how well MSP zoning avoids high-risk biodiversity areas, and is calculated as below:
The Conflict Index quantifies spatial conflicts between offshore wind development and biodiversity conservation priorities and is computed as follows;
The MSP Governance Effectiveness Index quantifies how effectively Taiwan’s MSP framework minimizes biodiversity risk exposure from offshore wind development and is computed as follows;
The final step of the methodological framework integrates ecological modeling and governance analysis to provide a comprehensive assessment of biodiversity risk distribution, offshore wind ecological exposure, spatial planning effectiveness, and governance performance. The governance assessment is intended to complement biodiversity risk modeling. It examines how Taiwan’s marine spatial planning (MSP) framework manages the expansion of offshore renewable energy while protecting marine biodiversity, with a focus on institutional, regulatory, and enforcement aspects. The study analyzed several key policies and laws, including the Ocean Basic Act, the Marine Spatial Planning Act and related regulations, the Renewable Energy Development Act, the Offshore Wind Power Development Policy Framework, the Marine Conservation Act, and Environmental Impact Assessment (EIA) regulations for offshore wind power. These data were sourced from official authorities, including the Marine Affairs Council, the Ministry of Economic Affairs, and environmental regulatory agencies.
Governance effectiveness was evaluated using a multidimensional assessment framework designed to assess the institutional capacity of Taiwan’s marine spatial planning system to manage biodiversity risks associated with offshore renewable energy development. Three governance dimensions were assessed: (1) Regulatory Clarity and Legal Compliance (RCLC); (2) Integration of Environmental Objectives (IEO); and (3) Adaptive Management Capacity (AMC) (see
Table 4).
Regulatory clarity and legal compliance evaluate the extent to which legal instruments clearly define management responsibilities, planning procedures, and enforcement mechanisms. Integration of environmental objectives assesses the degree to which biodiversity conservation considerations are incorporated into offshore renewable energy planning and decision-making processes.
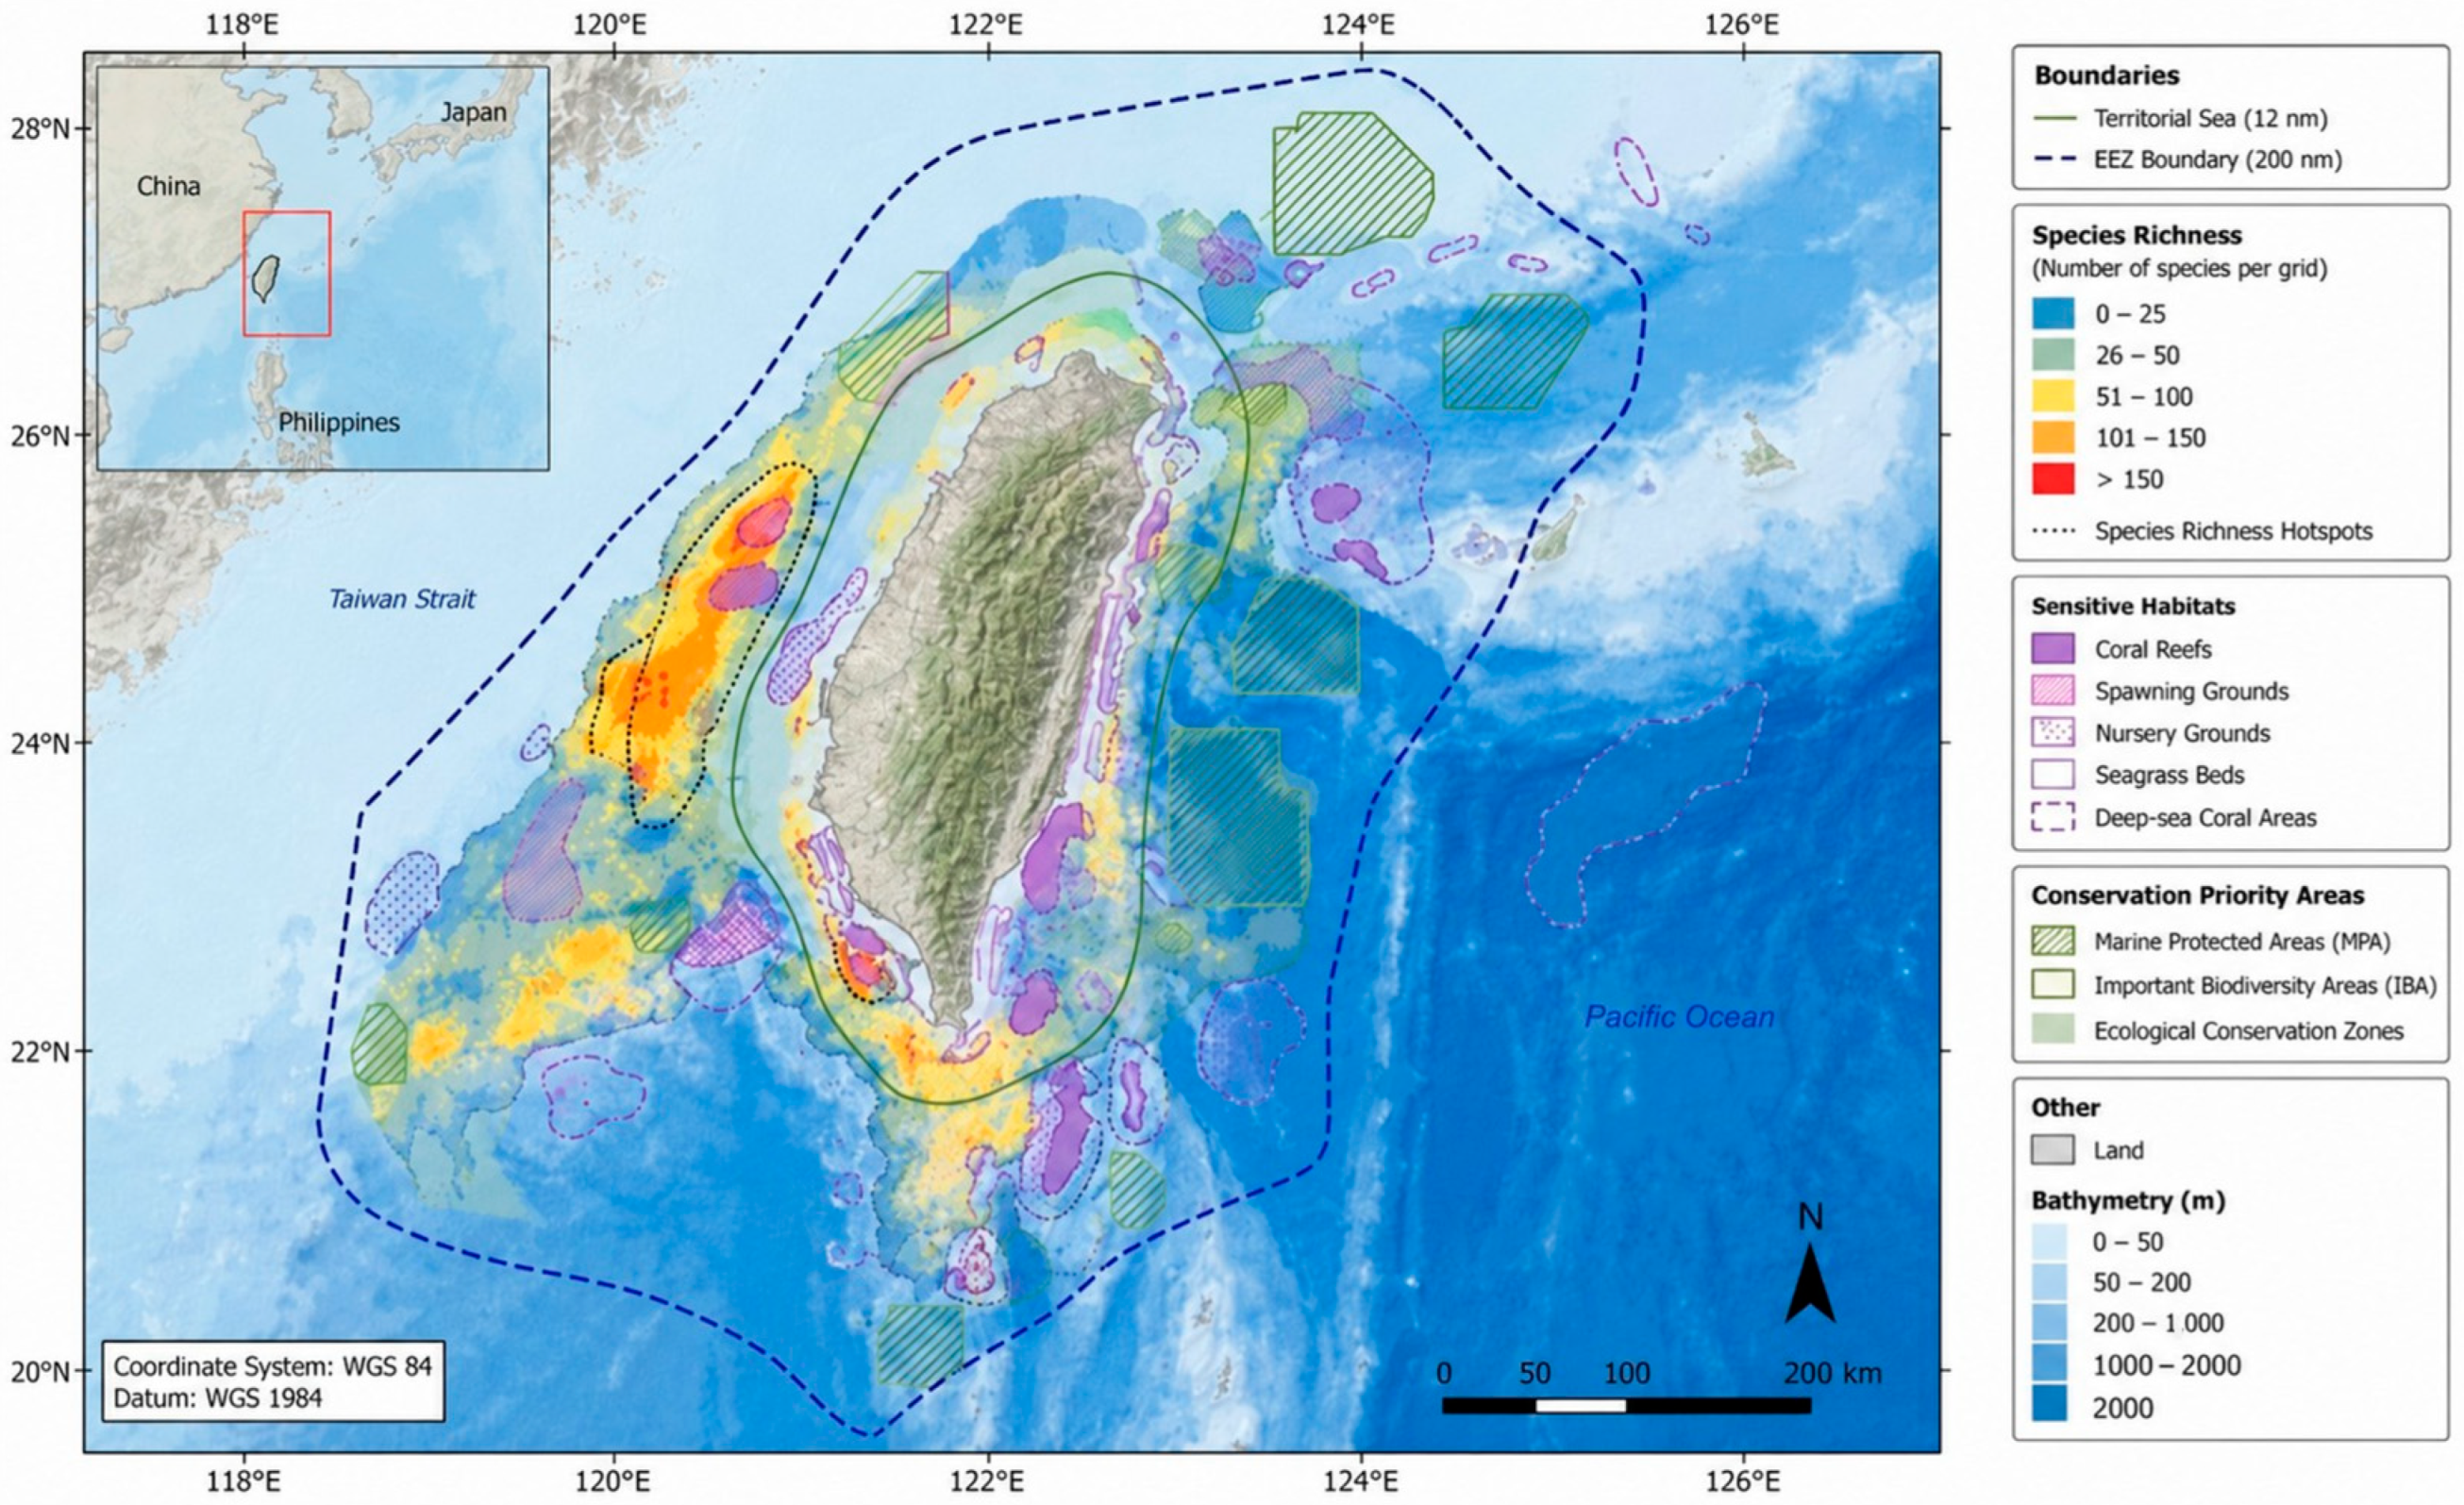
Figure 3. Spatial distribution of biodiversity-related ecological indicators used in Biodiversity Vulnerability Index (BVI) construction, including species richness hotspots, sensitive habitats, conservation priority areas, and ecological connectivity corridors.
Adaptive management capacity refers to the ability of the governance system to incorporate environmental monitoring results, respond to emerging ecological risks, revise management measures when necessary, and facilitate continuous policy learning. The assessment was conducted through a systematic review of policy documents, legislation, marine spatial planning regulations, and expert evaluation. Each governance dimension was scored on a normalized scale ranging from 0 (very weak governance capacity) to 1 (very strong governance capacity).
6. Spatial Biodiversity Risk Model Results
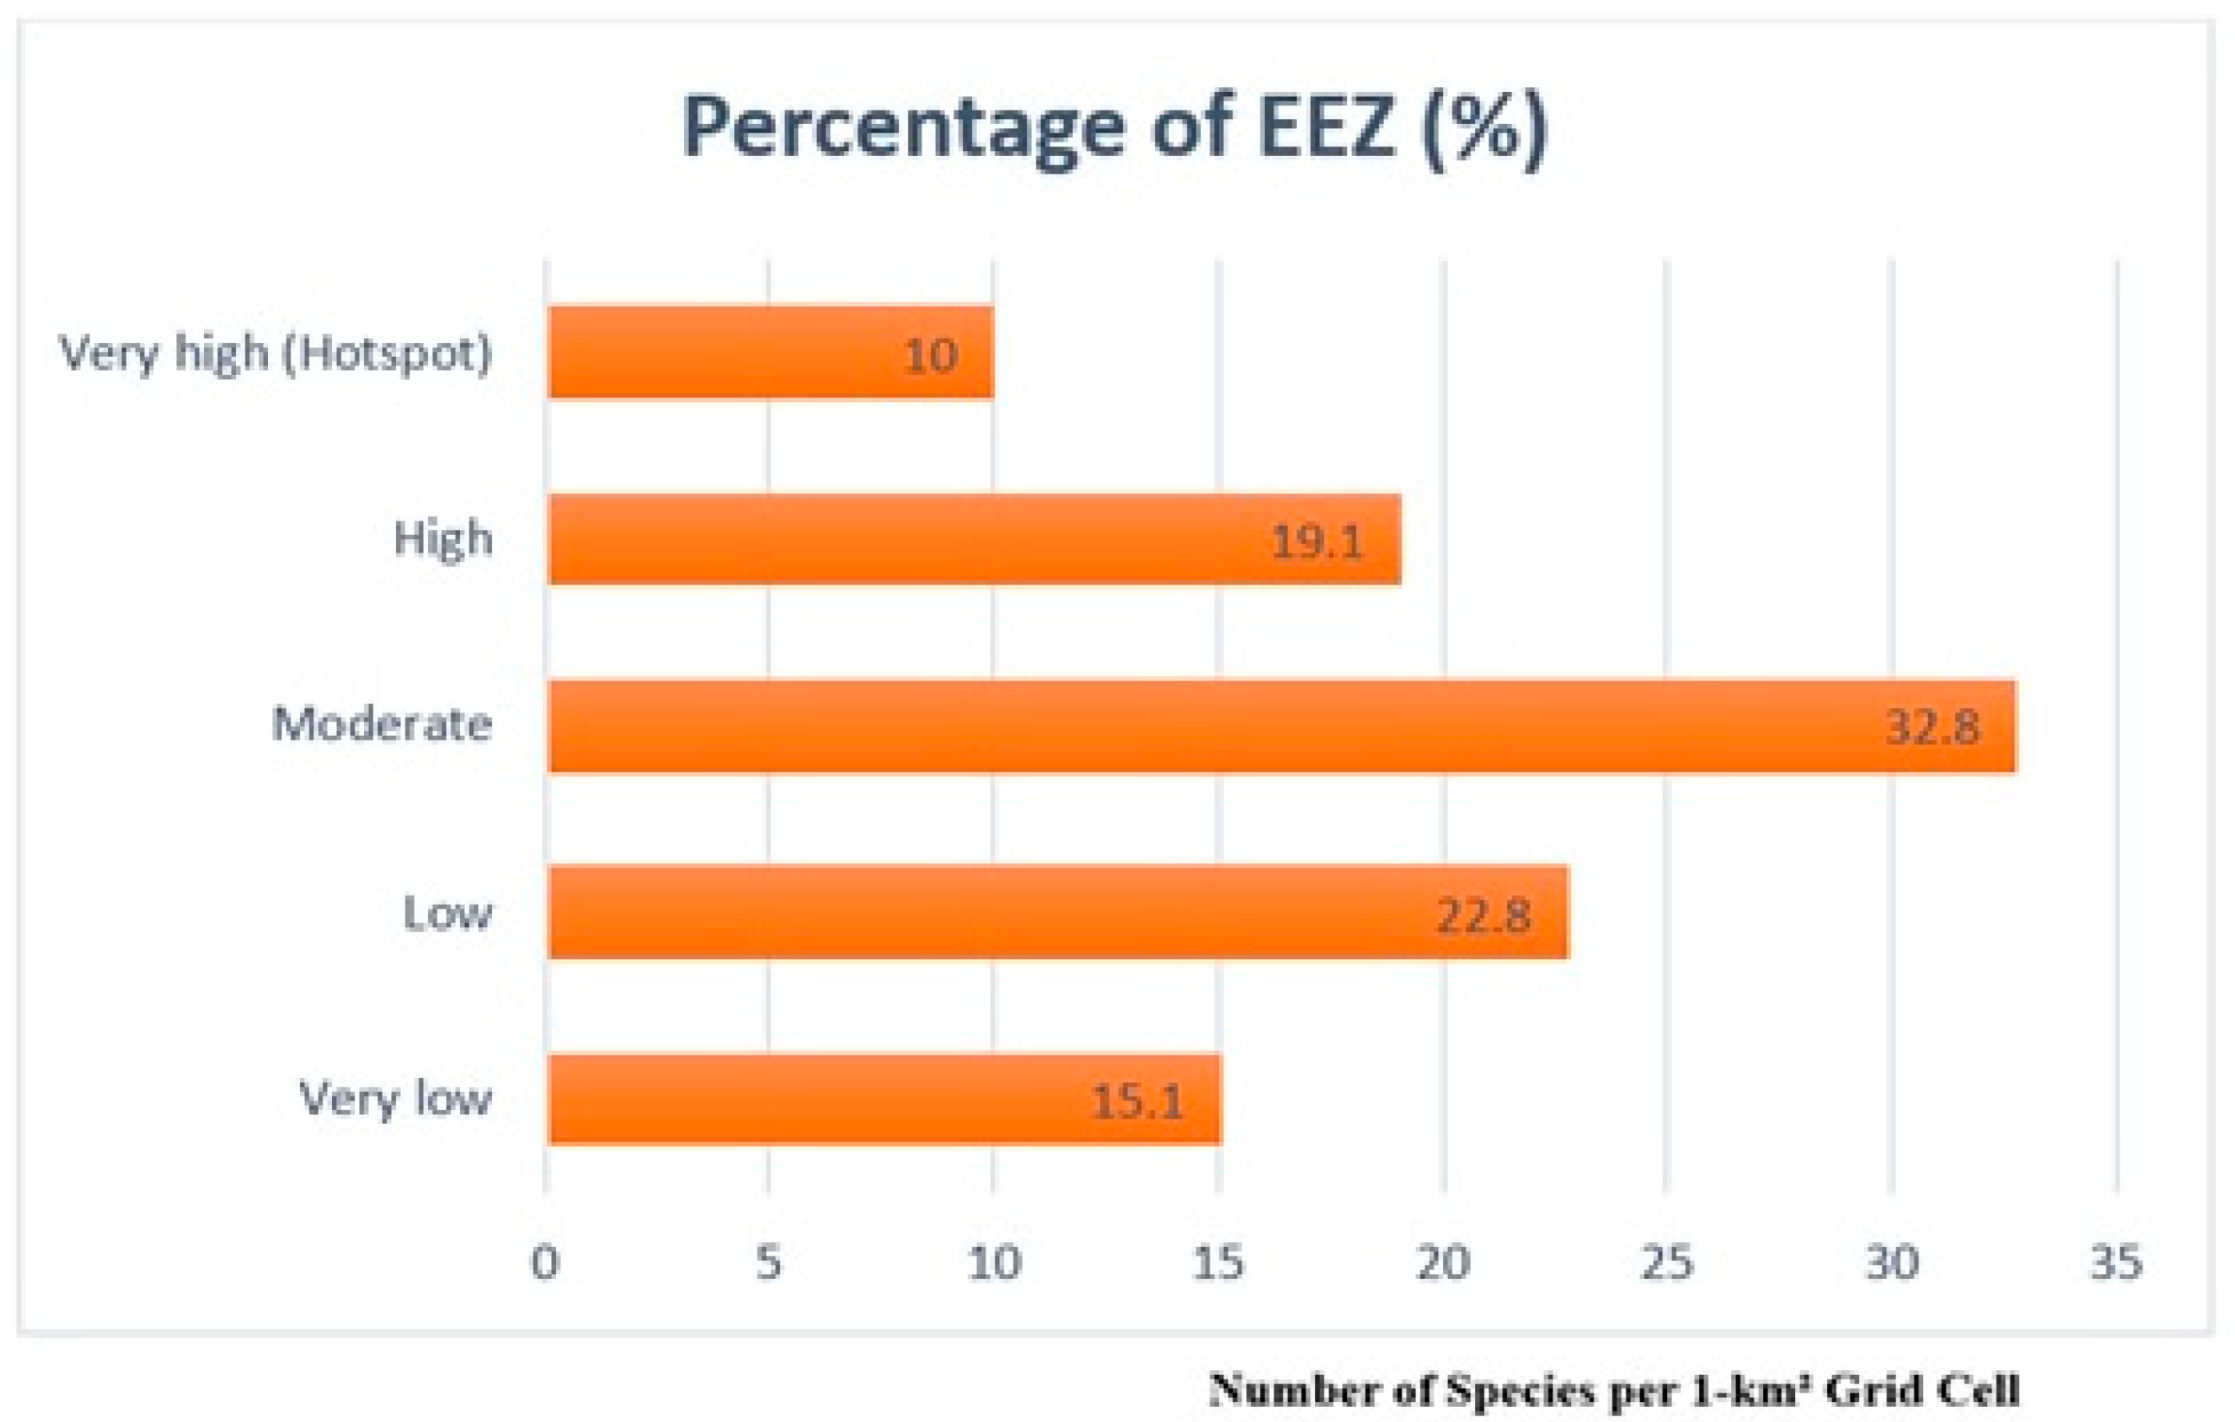
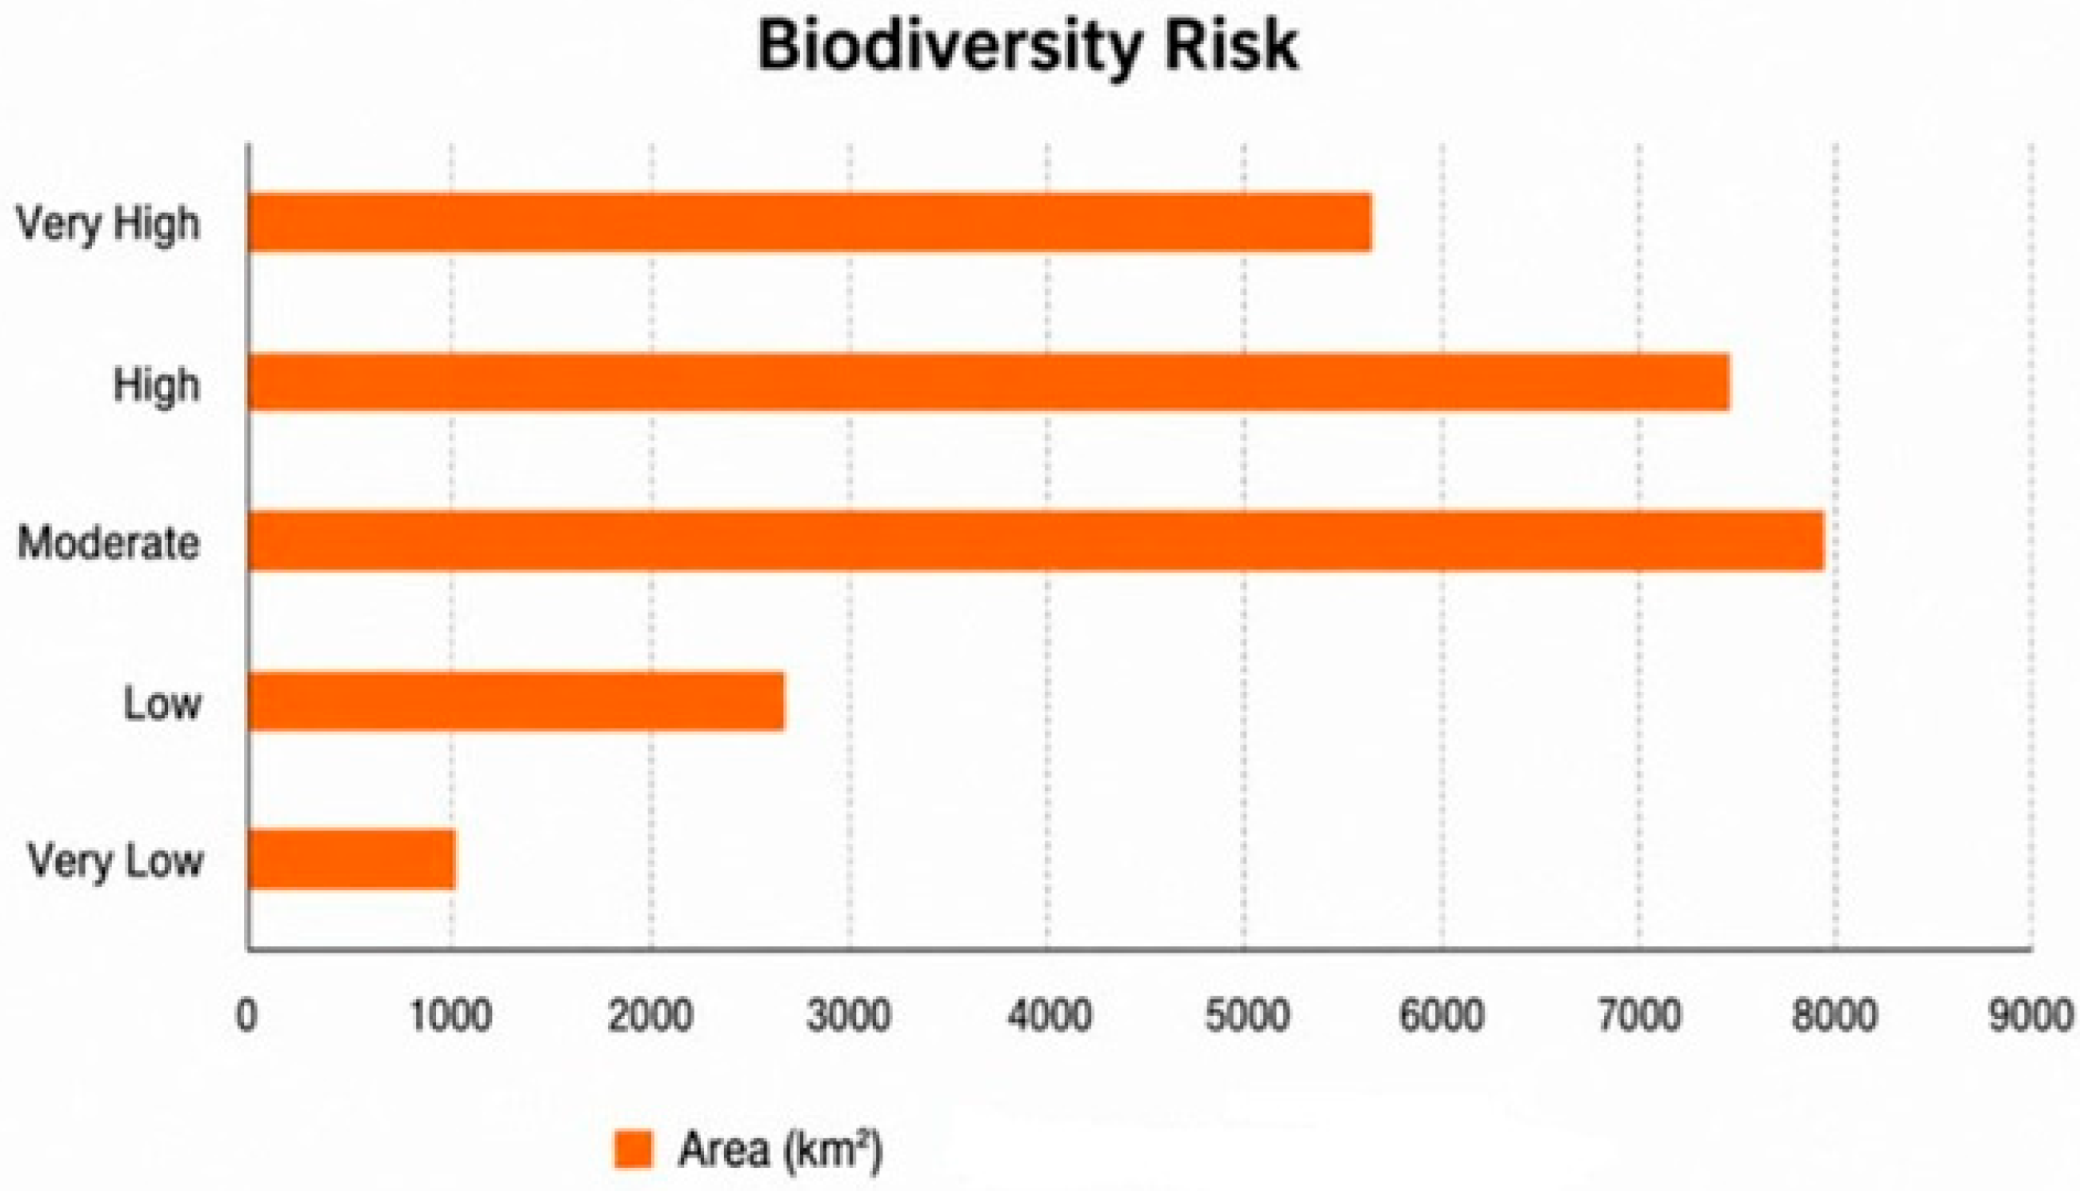
The Biodiversity Risk Index (BRI) across the analyzed offshore areas ranged from 0.10 to 0.89; the mean BRI value was 0.48 (S.D. = 0.22). Classification of the BRI revealed that approximately 3.9% of the analyzed areas fall within the very low-risk category, 10.3% within low-risk, 29.5% within moderate-risk, 28.0% within high-risk, and 21.3% within very high-risk areas, as illustrated in
Figure 13.
The analysis of identified hotspots revealed 14 distinct biodiversity risk clusters, covering a total area of 6400 km
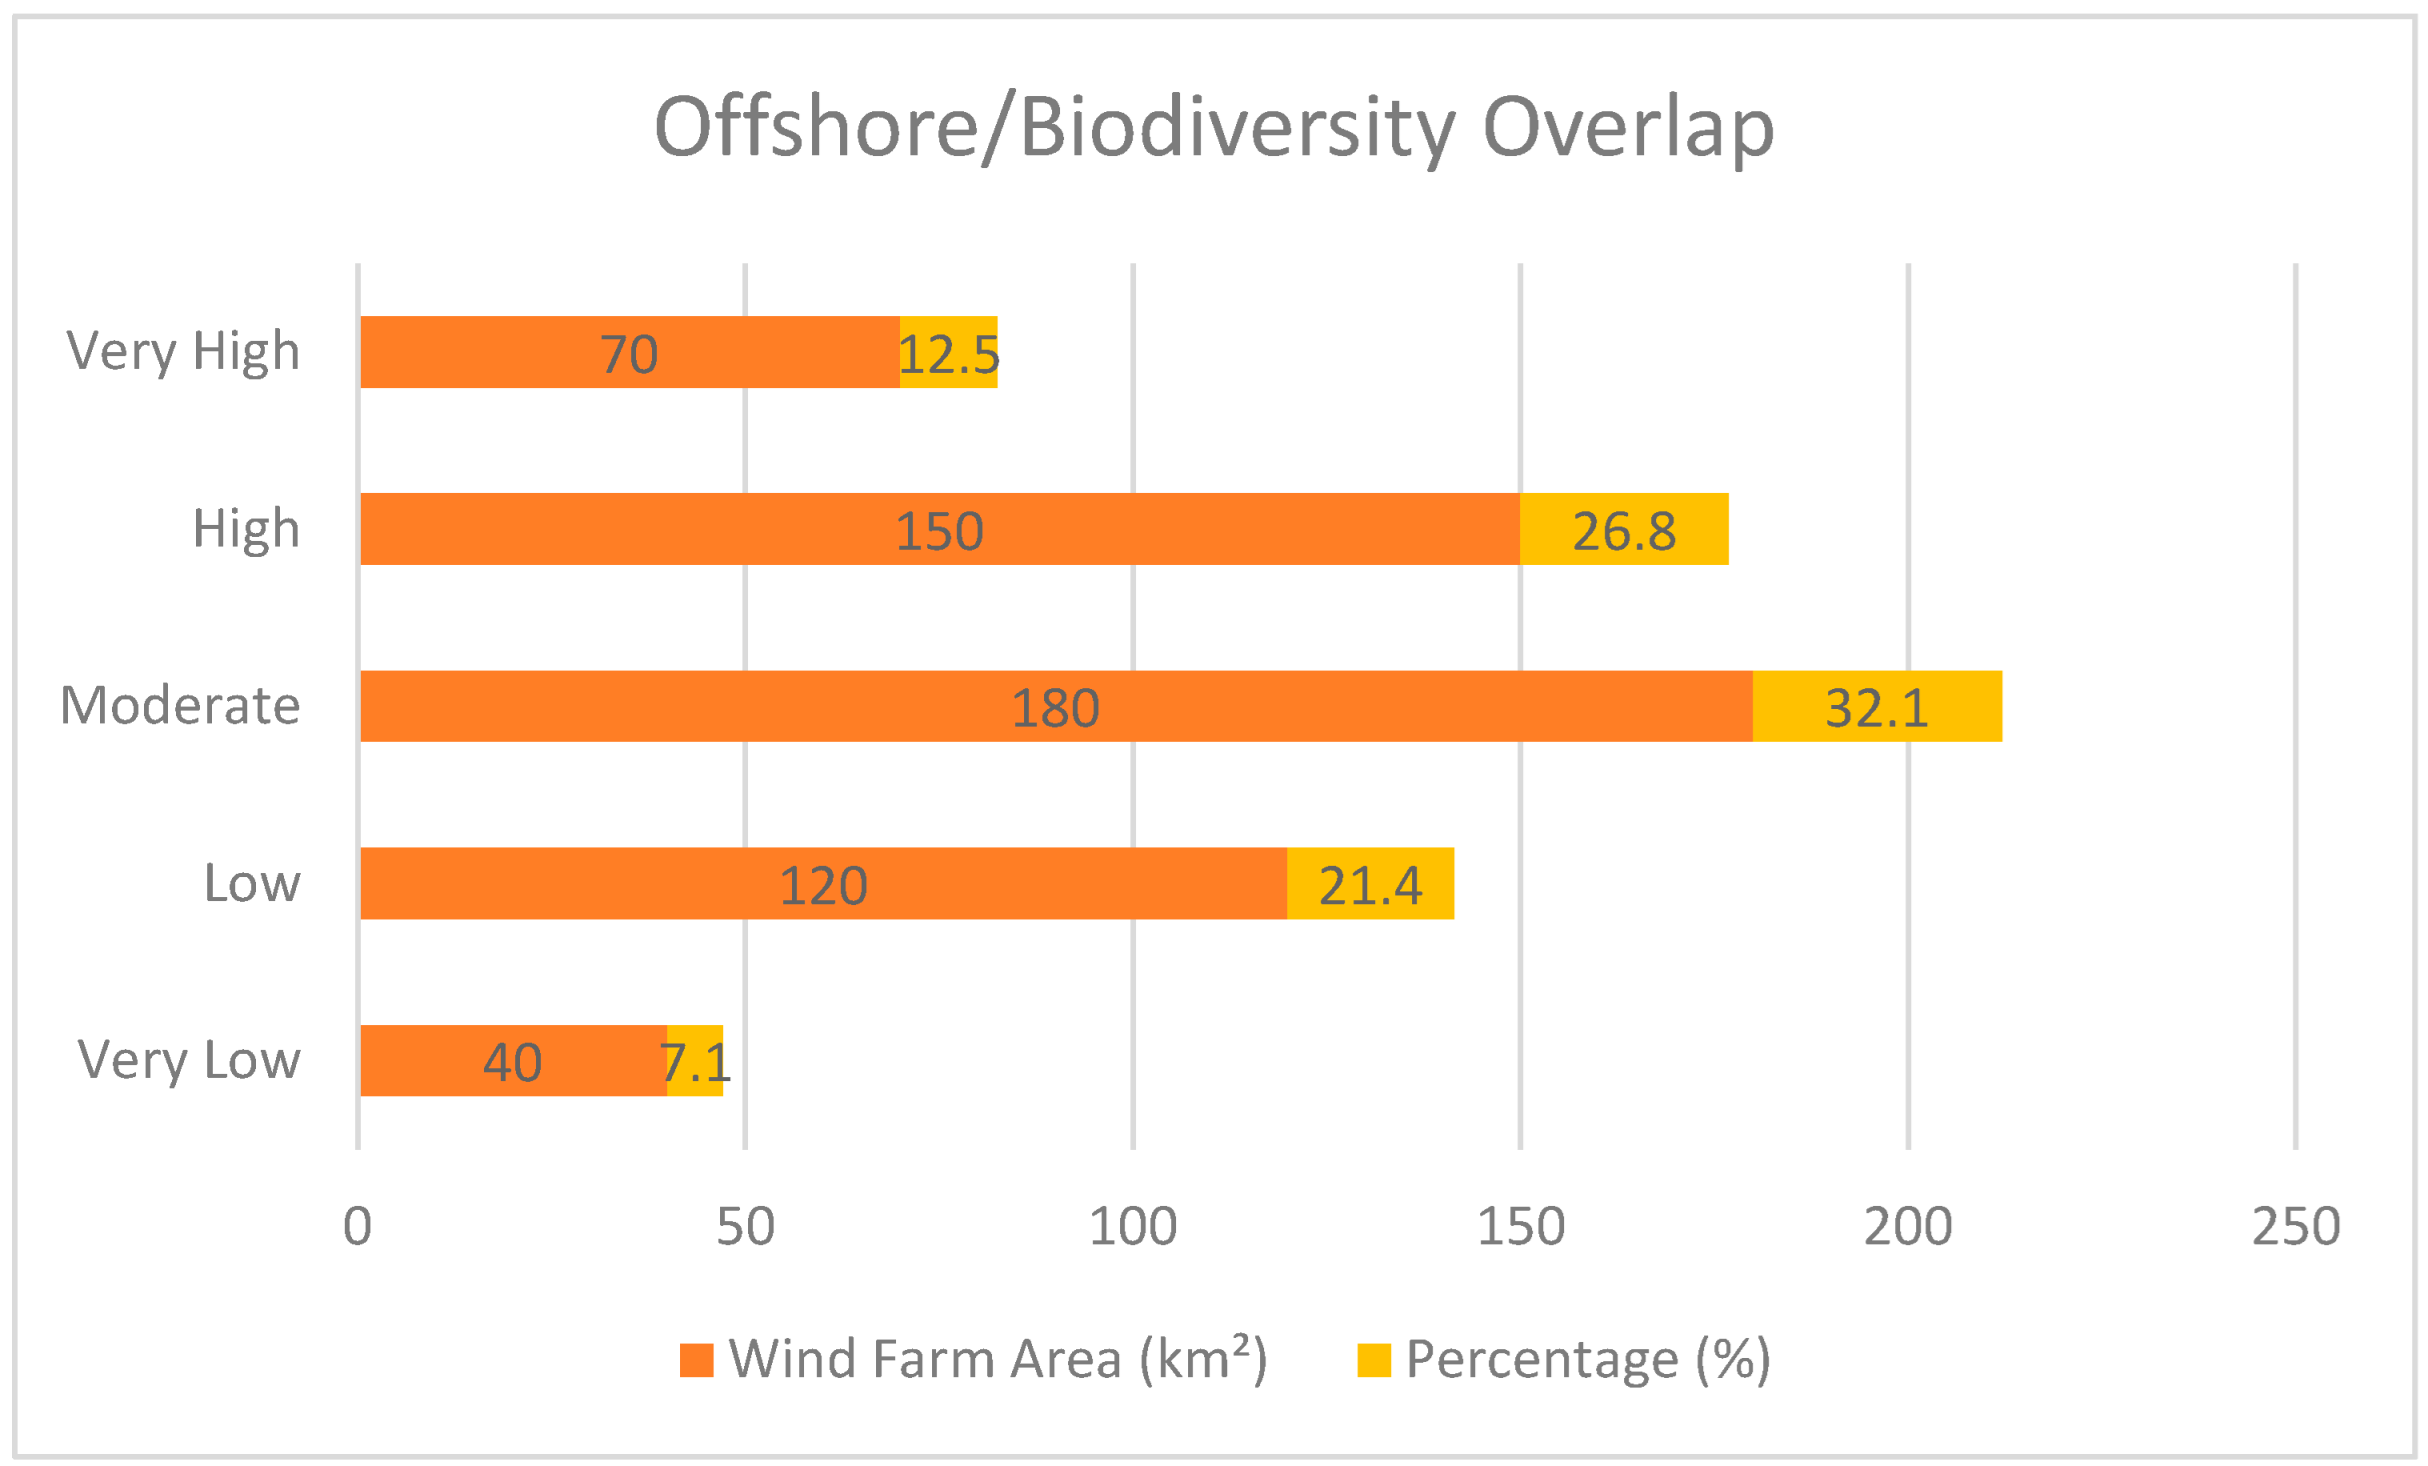
2. The total offshore wind area located within high-risk and very high-risk zones accounted for 38% of the wind farm footprint. Smaller proportions occupy very low and low-risk zones, accounting for 7.1% and 21.4%, respectively, while 32.1% of wind infrastructure is in moderate-risk areas, as illustrated in
Figure 14.
Overlaying MSP boundaries with biodiversity risk zones showed that 62% of high-risk biodiversity areas are encompassed within MSP-designated protection, leaving 38% of high-risk zones unprotected. Some areas within the moderate-risk zones are protected, with a protection rate of approximately 48%; in contrast, the low-risk and very low-risk zones have virtually no formal protection. The conflict index quantifies the degree of spatial overlap between offshore wind power development and biodiversity conservation areas; its values range from 0.05 to 0.87, with an average of 0.38 (standard deviation = 0.19). The Marine Spatial Planning Governance Effectiveness Index integrates protection coverage, biodiversity risk mitigation, and conflict minimization, with an overall effectiveness score of 0.61 (on a 0–1 scale).
Notably, approximately 72% of offshore wind infrastructure is sited outside areas classified as high-risk for biodiversity, while the remaining 28% fell within high-risk areas.
Assessment of Taiwan’s marine spatial planning and offshore renewable energy governance framework revealed moderate-to-high institutional effectiveness across the evaluated governance dimensions. Regulatory clarity and legal compliance achieved the highest score (0.78), reflecting the existence of relatively comprehensive legislation, clearly defined regulatory responsibilities, and established environmental impact assessment procedures governing offshore wind development. The integration of environmental objectives into planning processes received a score of 0.70, indicating that biodiversity conservation considerations are increasingly incorporated into marine spatial planning and offshore renewable energy policies, although opportunities remain for stronger cross-sectoral coordination and ecosystem-based planning.
Adaptive management capacity received the lowest score (0.55). This result reflects limitations in long-term ecological monitoring, policy feedback mechanisms, and institutional flexibility to adjust management measures in response to emerging environmental information. Although monitoring requirements exist within environmental impact assessment procedures, systematic incorporation of monitoring outcomes into adaptive policy revision remains relatively limited. These findings suggest that strengthening adaptive governance mechanisms could improve the long-term effectiveness of biodiversity risk management within Taiwan’s offshore renewable energy sector. The weakest governance dimension was adaptive management capacity (0.55), reflecting limited institutional mechanisms for iterative policy adjustment, biodiversity monitoring integration, and systematic incorporation of emerging ecological information into planning decisions. Implementation effectiveness of MSP was assessed through three key metrics including risk avoidance, protection coverage, and conflict frequency. The risk avoidance score was 0.66, the protection coverage score was 0.61, and the conflict frequency score was 0.42. Based on the integrated assessment of ecological risk and governance, priority conservation zones were identified in regions with very high biodiversity risk that are currently unprotected and priority planning intervention areas were reported where offshore wind development overlaps. Areas of very high biodiversity risk that overlapped with MSP-protected zones were generally well-managed and governance effectiveness scores in unprotected zones were low.
7. Discussion
The findings of this study are generally consistent with previous offshore wind–biodiversity assessments conducted in Europe and North America. As in the North and Baltic Seas, biodiversity hotspots in Taiwan are concentrated in shallow continental shelf environments where ecological productivity and offshore wind suitability overlap. However, unlike many European MSP systems that have undergone multiple planning cycles and adaptive revisions, Taiwan’s MSP framework remains in an early stage of implementation. Consequently, although 62% of high-risk biodiversity areas are currently covered by MSP-designated zones, governance mechanisms for adaptive monitoring and cumulative impact assessment remain underdeveloped. This distinction underscores the importance of strengthening ecosystem-based planning and adaptive governance in Taiwan’s future offshore renewable energy expansion.
The study adopts a conceptual framework that integrates three primary domains including ecosystem-based marine spatial planning, cumulative impact theory, spatial conflict modelling to assess the relationship between offshore renewable energy expansion and marine biodiversity in Taiwan. One of the most significant findings of the present study is the extensive spatial distribution of ecologically sensitive habitats across the analyzed areas, which confirms the complex ecological environment of the Taiwanese offshore waters characterized by the coexistence of critical coral ecosystems, spawning grounds, nursery habitats, and vulnerable benthic communities [
40]. From an ecological risk perspective, the concentration of sensitive habitats increases the potential for localized but severe ecological impacts if development is not carefully managed. Because offshore wind development takes place in places that are already heavily populated, cumulative effects are especially significant in Taiwan’s coastal waters [
23,
41]. In habitats that are already under stress, offshore wind equipment adds more ecological, auditory, and physical problems [
42,
43]. For instance, the acoustic disturbance levels for marine mammals may be increased by the combination of construction-related noise and shipping noise. Third, the spatial conflict modelling domain offers the quantitative framework for assessment of interaction between offshore wind infrastructure and marine biodiversity using geographic information systems (GIS) to quantify spatial overlap between human activities and ecological vulnerability zones. When infrastructure expansion crosses over into environmentally sensitive areas, it can lead to spatial conflict and increase the risk of biodiversity loss and ecological disruption [
44,
45,
46]. The spatial conflict modelling conceptualizes biodiversity risk as a function of spatial co-occurrence between offshore infrastructure represented using spatial data on turbine locations, development zones, and associated infrastructure, and ecological sensitivity represented using spatial indicators such as species distribution, habitat quality, and biodiversity richness. These spatial representations integrate a wide range of indicators that provide a quantitative understanding of biodiversity risk across marine environments. The findings are broadly consistent with previous studies conducted in Europe and North America. Studies from the North Sea and Baltic Sea have reported that offshore wind development frequently overlaps with ecologically sensitive habitats, particularly seabird migration routes, spawning grounds, and marine mammal habitats. Similar patterns were observed in Taiwan, where biodiversity hotspots and offshore wind development zones exhibit partial spatial overlap. However, compared with European MSP systems, Taiwan’s marine spatial planning framework remains relatively young and continues to evolve toward stronger ecosystem-based management and adaptive governance mechanisms.
The overall study conceptual framework integrates the ecological risk with governance capacity, where marine spatial planning serves as a key governance mechanism for management of spatial conflict between offshore renewable energy and marine biodiversity. The complexity of offshore wind development that entails spatial intervention within systems involving the dynamic interaction of ecological processes, economic activities, and governance structures, and, as a result, captures both ecological vulnerability and institutional capacity for management of spatial conflict [
36,
39,
47]. The study findings indicate significant spatial overlap between offshore wind power infrastructure and ecologically sensitive areas, reflecting a structural spatial convergence between optimal wind power development sites and marine environments with high ecological productivity. Offshore wind farms are typically located in shallow continental shelf areas due to favorable wind conditions, high technical feasibility, and lower construction costs; however, these areas also tend to exhibit high biodiversity due to abundant nutrients, suitable seabed substrates, and good ecological connectivity [
37,
38,
48]. Consequently, without effective planning, the cumulative impacts resulting from infrastructure concentration may lead to the degradation of critical habitats, disruption of ecological connectivity, and a weakening of ecosystem resilience [
49]. The findings further indicate that Marine Spatial Planning (MSP) has achieved some success in protecting ecologically sensitive areas; however, its effectiveness remains dependent on the intensity of enforcement, the degree of regulatory integration, and coordination with development planning processes. Governance assessments indicate that policy and institutional effectiveness are at a moderate level, confirming that Taiwan has established a relatively well-functioning governance framework capable of balancing offshore wind power development with biodiversity concerns, though significant limitations remain [
41,
50]. One of the most significant governance constraints identified in this study is the lack of adaptive management capacity, which is crucial for addressing emerging ecological risks, particularly in the rapidly evolving offshore energy sector. Without adaptive mechanisms, the governance system may struggle to respond effectively to new ecological information or unforeseen environmental impacts. The governance assessment framework developed in this study provides an institutional perspective that complements the ecological risk model. By evaluating regulatory clarity, environmental integration, and adaptive management capacity, the framework enables assessment of the extent to which existing MSP mechanisms can respond to biodiversity risks generated by offshore renewable energy expansion. The overall findings highlight the urgent need to strike a complex and nuanced balance between offshore wind power development and marine biodiversity conservation.