Article

Analysis of Wave Climate and Wave Hazard in Fujian Sea Areas Based on TOMAWAC Hindcast Data (1980–2023)

1
Xiamen Road & Bridge Engineering Investment and Development Co., Ltd., Xiamen 361000, China
2
Key Laboratory of Ministry of Education for Coastal Disaster and Protection, Hohai University, Nanjing 210024, China
3
College of Harbour, Coastal and Offshore Engineering, Hohai University, Nanjing 210024, China
4
Fujian Communications Construction Quality and Safety Center, Fuzhou 350300, China
*
Author to whom correspondence should be addressed.
J. Mar. Sci. Eng. 2026, 14(13), 1188; https://doi.org/10.3390/jmse14131188
Submission received: 18 May 2026 / Revised: 25 June 2026 / Accepted: 26 June 2026 / Published: 28 June 2026
(This article belongs to the Section Marine Hazards)

Abstract

Fujian sea areas suffer frequent disastrous wave events in southeast China. Research on wave characteristics are crucial for marine engineering and coastal disaster risk reduction. Based on TOMAWAC hindcast wave data, this study analyzes the spatiotemporal variations in wave parameters in the Fujian sea areas during 1980–2023. Six typical feature points are selected for comparative analysis to clarify wave climate features across different water depths. Results indicate that the maximum significant wave height (SWH) in the Fujian sea area declines from offshore to inshore and from north to south, with a peak of 15 m off Ningde. Seasonally, maximum SWH is induced by tropical cyclones in summer and autumn, generally exceeding 10 m. Under the influence of the East Asian monsoon, the mean SWH reaches its annual maximum of 2.5 m during the winter season. Severe waves show a stepped increasing from inshore to offshore seas, with the longest duration in autumn. The Taiwan Strait is characterized by a widespread high SWH region, where severe wave events persist for more than 15 h. Fujian sea wave variations are governed by water depth-topography effects and seasonal wind-swell regimes.

1. Introduction

Waves serve as a critical carrier of mass and energy transport in the ocean, exerting a remarkable impact on marine hydrodynamic environments. And waves are closely associated with coastal engineering safety as well as disaster prevention and mitigation. As a direct external load on port infrastructures, waves continuously strike coastal structures such as seawalls and revetments, which not only affects their structural stability and service life, but also has significant implications for coastal disaster reduction initiatives [1,2,3]. Furthermore, by regulating hydrodynamic conditions [4,5,6,7], waves can indirectly threaten the operational safety and structural stability of coastal and port facilities. As the primary cause of wave-induced disasters, extreme waves usually occur alongside extreme weather events represented by severe typhoons. Long-term continuous wave action may trigger load overrun, wave overtopping and breaching, and functional failure of coastal infrastructures, thereby posing severe risks to marine engineering safety [8,9,10]. In recent decades, driven by climate change, wave heights have shown an upward trend across global oceans, especially in the Northwest Pacific and Chinese inshore seas [11,12]. Both the frequency and intensity of extreme wave events have increased substantially [13,14], bringing growing threats to coastal protection facilities and marine engineering constructions. These studies collectively indicate that the wave climate in the Northwest Pacific and Chinese coastal seas is undergoing notable changes under global warming, underscoring the need for long-term, high-resolution wave climate assessments to support coastal adaptation and hazard mitigation efforts.
Restricted by the vast marine spatial scale, complex oceanic environmental conditions and limited observation technologies, the approaches to obtaining wave data remain relatively scarce. At present, the mainstream wave observation methods mainly include in situ point measurement represented by wave buoys and wave gauges [15,16], coastal observation facilities such as stereoscopic camera systems [17] and marine radar [18], as well as remote sensing techniques dominated by satellite observation [19]. Nevertheless, each measurement method has inherent limitations. For in situ point observation, wave buoys are restricted to single sampling locations with poor spatial coverage. By contrast, satellite remote sensing suffers from irregular temporal resolution and limited observable wave parameters [20,21]. Although the stereoscopic imaging system of coastal observation stations can compensate for the defects of buoys and satellite monitoring with high temporal resolution and wide spatial coverage [22], it highly relies on camera calibration and parallax calculation. Such equipment performs poorly under complex marine conditions and is susceptible to adverse weather, accompanied by massive computational consumption [23]. Subject to the above constraints, it still poses a great challenge to acquire spatially and temporally continuous marine observation data. To make up for the deficiencies of field observation, numerical simulation has become a critical approach to obtaining long-term, high-resolution wave information, especially in the research on wave propagation characteristics from open sea to inshore seas. In situ measured data are mostly applied for model verification and validation. In recent years, numerous scholars have conducted extensive wave simulation research in various sea areas by adopting diverse numerical models. Among these, the SWAN model has been widely applied in both Chinese coastal waters and other regions worldwide. For instance, Qiu et al. [24] carried out high-resolution refined wave simulation around islands and reefs based on the self-nested SWAN model, and analyzed the fine spatial distribution of significant wave height, wave direction and wave power density in the Xisha Islands. Sholihati et al. [25] adopted the nearshore SWAN model to assess the influence of atmospheric driving factors during flood events in the Java Sea. And Ponce et al. [26] simulated ocean waves in the North Atlantic Ocean using the SWAN model. In addition to SWAN, other numerical models have also been employed for regional wave studies. Lin et al. [27] investigated the wave field of Xisha Bay using the nearshore wave numerical model CGWAVE and obtained reliable design wave parameters. Sun et al. [28] calculated wave parameters in the sea area near the China–Maldives Friendship Bridge via the MIKE 21 SW model to reveal the regional wave distribution features. Zhu et al. [29] conducted numerical simulations to investigate the wave overtopping at seawalls and the optimization of parapet structures under coupled wind–wave effects. Furthermore, Islami et al. [30] combined the BMKG Ina-wave model and NASA Aqua MODIS satellite images to explore the wave characteristics and variations around South Sulawesi. These studies collectively demonstrate the capability of numerical models to provide reliable wave information for diverse coastal and offshore engineering applications, yet most of them focused on limited temporal or spatial scales, leaving a gap in long-term, high-resolution wave climate characterization for the Fujian sea area.
The Fujian sea area is one of the regions with frequent disastrous wave events in China [31]. Among the typhoons landing in China since 1949, over 32% have passed through the Taiwan Strait. Located on the western side of the Taiwan Strait, Fujian features a tortuous coastline as well as complex topographic and hydrodynamic conditions. Under the combined effects of monsoons, typhoons and strait topographic effects, the wave field in the study area exhibits obvious temporal and spatial variations [32]. The Fujian sea area is affected by 5 to 10 typhoons annually on average, usually accompanied by storm surges, huge waves and abnormal ocean currents, which pose great threats to navigation safety and coastal engineering [33,34,35,36]. According to the statistical data from the 2023 China Marine Disaster Bulletin, the economic losses caused by marine disasters in Fujian Province are higher than the national average, among which the direct economic losses induced by storm surges account for as high as 85%. Therefore, it is necessary to conduct an in-depth study on the hydrodynamic environment of the Fujian sea area, especially its wave characteristics. Up to now, abundant achievements have been made in wave research of the Fujian sea area. Xu Xiao et al. [37] conducted statistical analysis on ocean waves in the central Taiwan Strait based on measured buoy wave data and derived the regression relationships between key characteristic wave parameters as well as the wave spectrum form applicable to the central Taiwan Strait. Dong [38] adopted the SWAN model to investigate the long-term variation trends of wind speed and SWH in the Taiwan Strait. Existing studies mainly focus on the overall scope of the strait with insufficient spatial resolution, failing to finely characterize the wave conditions in the Fujian sea area. In terms of the time dimension, a comprehensive long-term analysis of wave climate parameters, such as SWH and wave period, is still lacking. Accordingly, to deepen the understanding of wave disasters in the Fujian sea area and enhance the capacity of disaster prevention and mitigation, it is essential to analyze the temporal and spatial characteristics of wave parameters, including SWH, in the Fujian sea area.
This study adopts the TOMAWAC model to simulate wave parameters in the Fujian sea area over a 44-year period and analyzes the wave characteristics of the study area to clarify the temporal and spatial evolution law of the wave field as well as its main influencing factors. The specific research framework of this study is presented as follows. The second part introduces the TOMAWAC model and compares the simulation results with measured data to verify the model’s simulation accuracy. The third part conducts an in-depth analysis of wave characteristics in the study sea area, including the maximum SWH and MP, mean SWH and MP, and severe wave events. Characteristic points at different sea depths are selected to explore the differences in wave characteristics. The main conclusions are summarized in the fourth part.

2. Methodology

2.1. Governing Equations

As a core module of the Telemac-Mascaret system, TOMAWAC is a numerical wave model based on the principle of dynamic spectral energy balance. The core of the model lies in solving the wave action balance equation that describes the propagation and evolution of ocean waves. This equation can be expressed in the spherical spatial coordinate system as follows:
N t + ( c λ N ) λ + cos 1 ϕ ( c λ N ) ϕ + ( c f r N ) f r + ( c ϕ N ) ϕ = Q t o t f r
Q t o t = Q i n + Q d s + Q n l + Q b f + Q b r + Q t r
where N denotes the wave action density spectrum, ϕ represents the latitude, λ is the longitude, f r represents the radial frequency, θ stands for wave direction, t represents time, and c λ , c ϕ , c f r , and c θ denote the propagation velocities in longitude, latitude, frequency, and directional spaces, respectively. The term Q t o t refers to the source term of energy density. In shallow sea, Q t o t consists of six physical processes as expressed in the second equation. Q i n is wave growth by the wind, Q d s is whitecapping, Q n l is nonlinear resonant quadruplet interactions, Q b f is bottom friction, Q b r is wave breaking induced by bathymetry, and Q t r is nonlinear triad interaction.
The hindcast wave data for the Fujian sea area in this study are derived from the numerical wave simulation results of Chinese seas conducted based on the TOMAWAC model. The driving wind field, bathymetry data and key parameters of this model have been elaborated in detail in the previous study [39]. The principal model settings are summarized in Table 1.

2.2. Model Setup

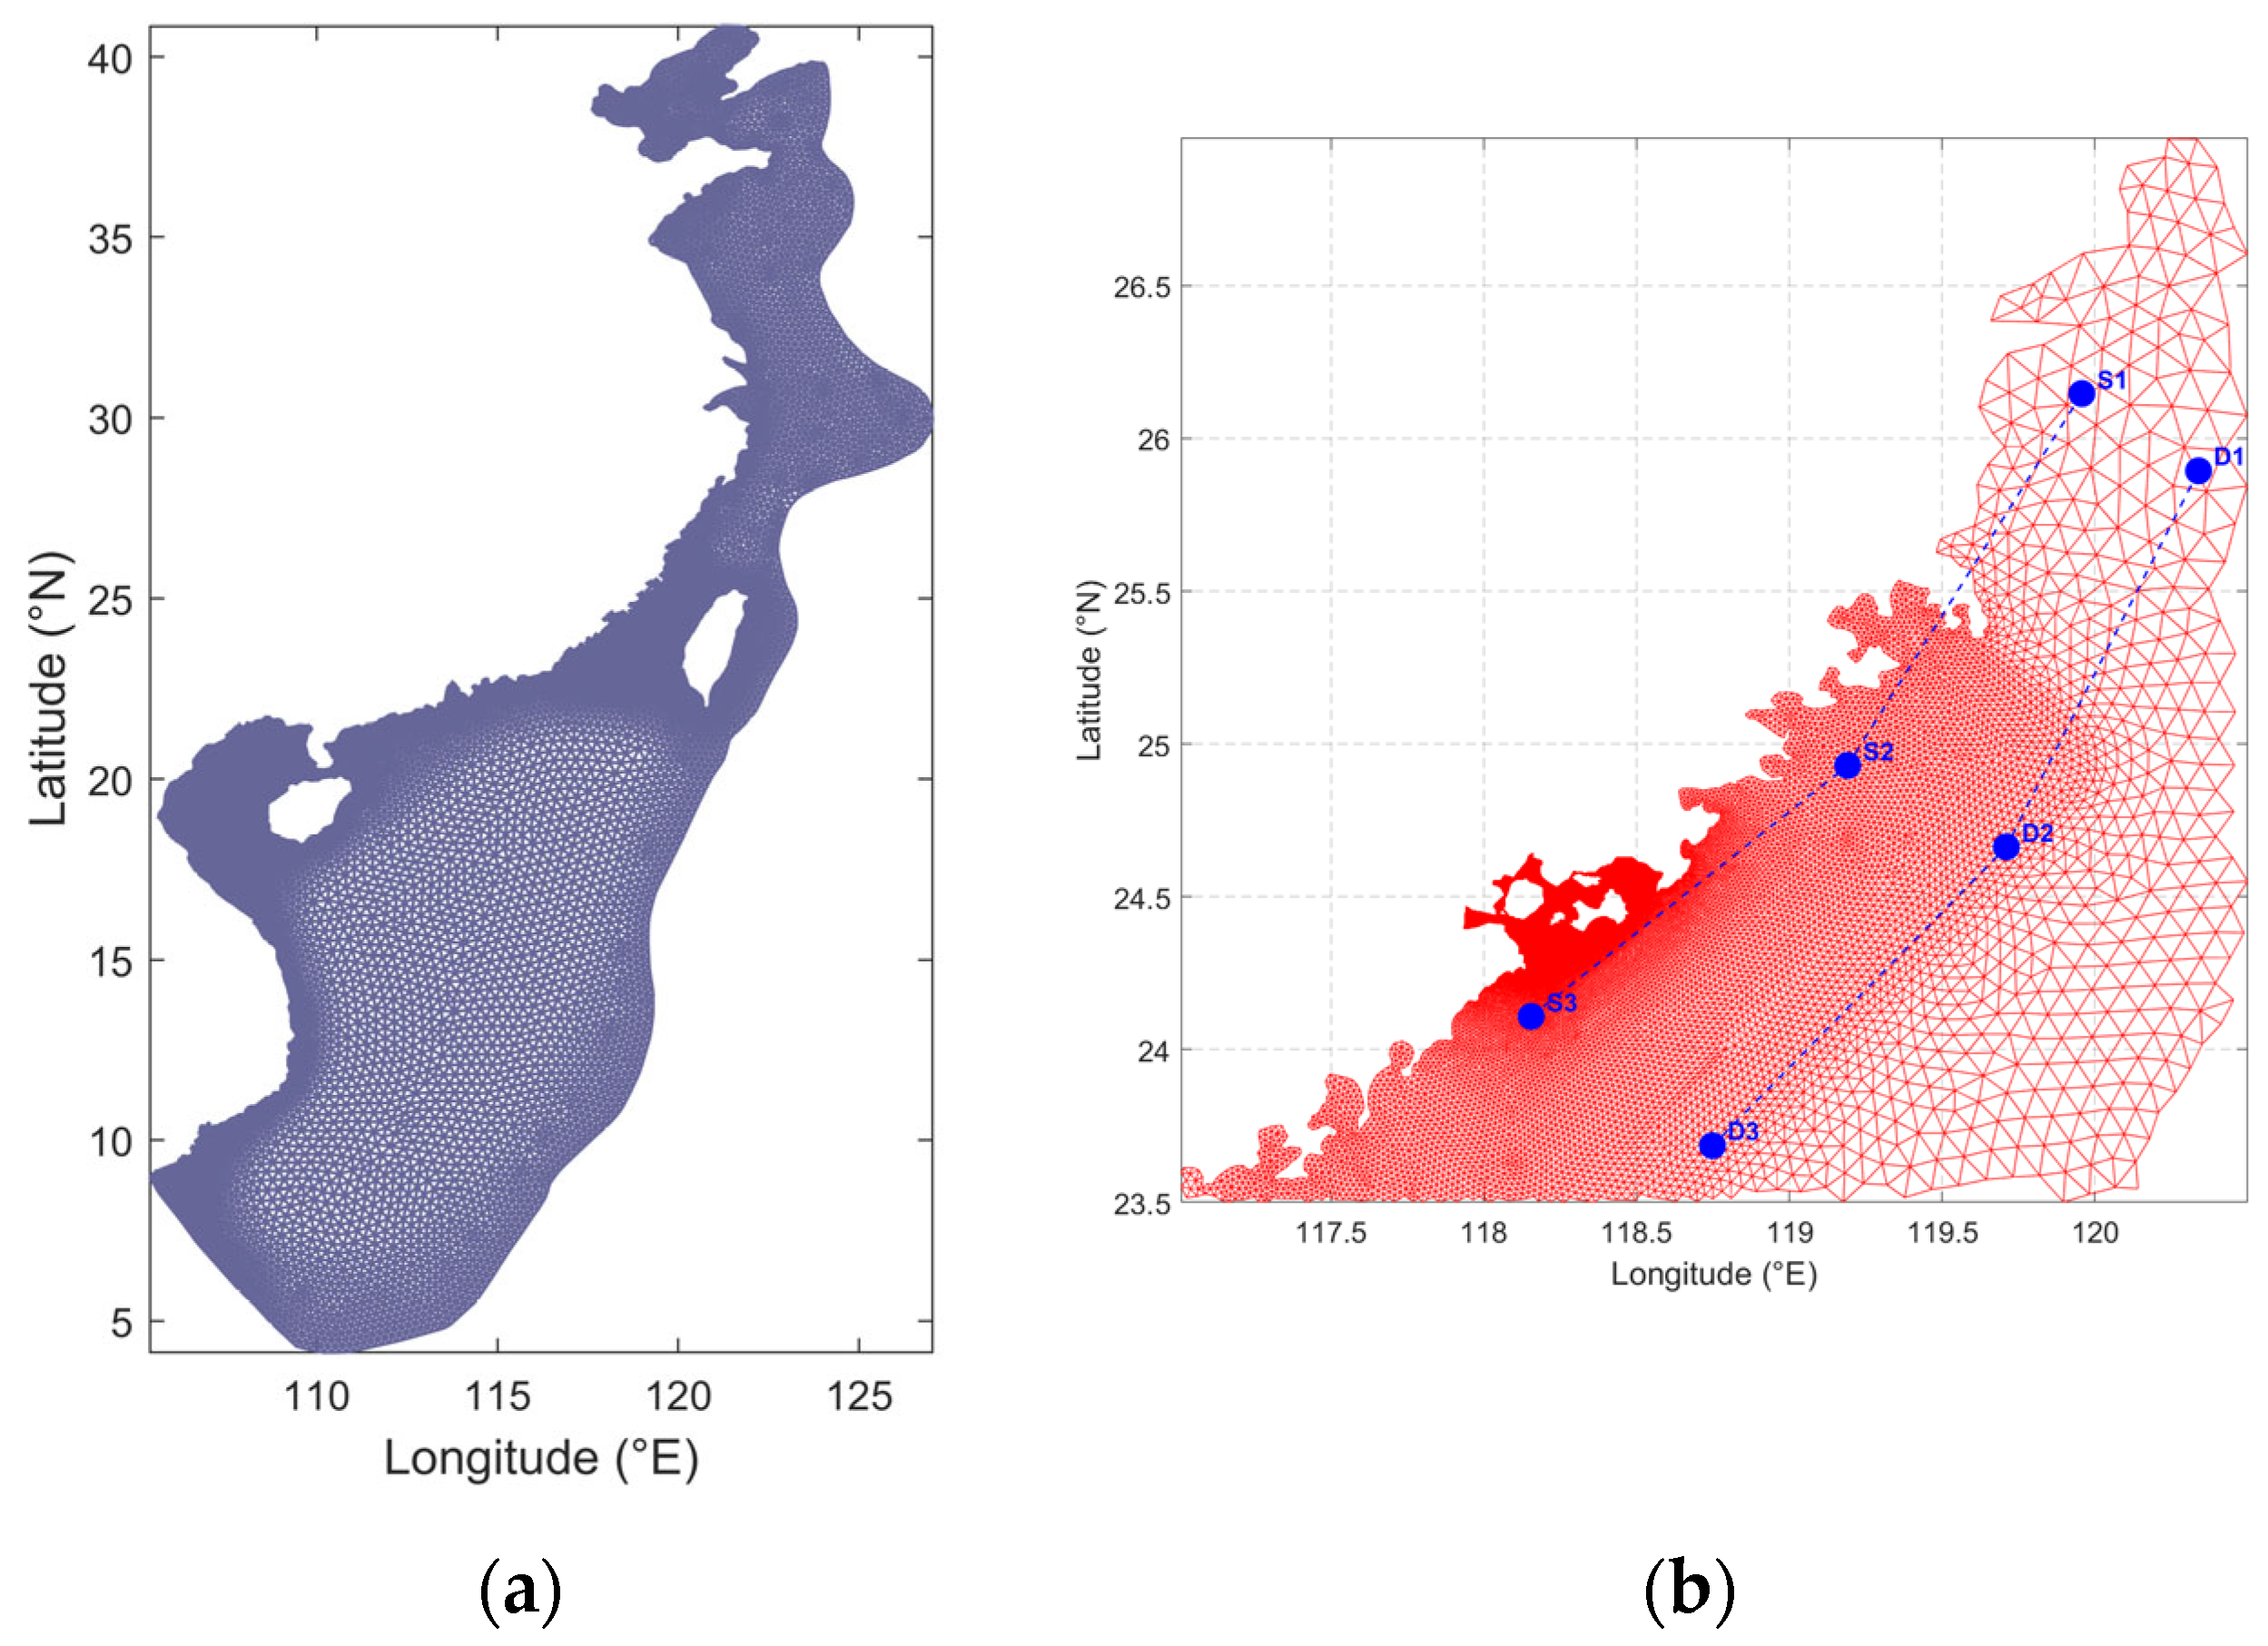
The specific study domain of this study is located within 23.5° N–27° N and 117° E–120.5° E. A nested grid model is adopted in this study to balance computational efficiency and spatial resolution. As shown in Figure 1, the outer model covers the offshore seas of China with a horizontal resolution of approximately 10 km. The inner grid focuses on the Fujian sea area, with the grid resolution gradually refined from the open sea to the nearshore, transitioning from about 1 km to 500 m. The outer grid contains approximately 81,928 nodes and 159,247 elements, while the inner grid consists of around 71,814 nodes and 139,923 elements.

2.3. Model Validation

To quantitatively validate the simulation performance of the TOMAWAC model in the Fujian sea area, three statistical indicators, namely the Mean Absolute Error (MAE), Root Mean Square Error (RMSE), Average Deviation (AD), correlation coefficient (R), scatter index (SI) and Nash–Sutcliffe efficiency (NSE), are adopted in this study to conduct error analysis on the simulated results of SWH and MP. The calculation formulas for the above error indicators are given as follows.
M A E = 1 n i = 1 n | y i y ^ i |
R M S E = 1 n i = 1 n ( y i y ^ i ) 2
A D = 1 n i = 1 n ( y i y ^ i )
R = i = 1 n y ^ i y ^ ¯ y i y ¯ i = 1 n y ^ i y ^ ¯ 2 i = 1 n y i y ¯ 2
S I = R M S E y ¯
N S E = 1 i = 1 n y ^ i y i 2 i = 1 n y i y ¯ 2
where n is the total number of samples, y i represents the observed value, y ^ i denotes the simulated value, y ¯ represents mean of the observed value, and y ^ ¯ represents mean of the simulated value.
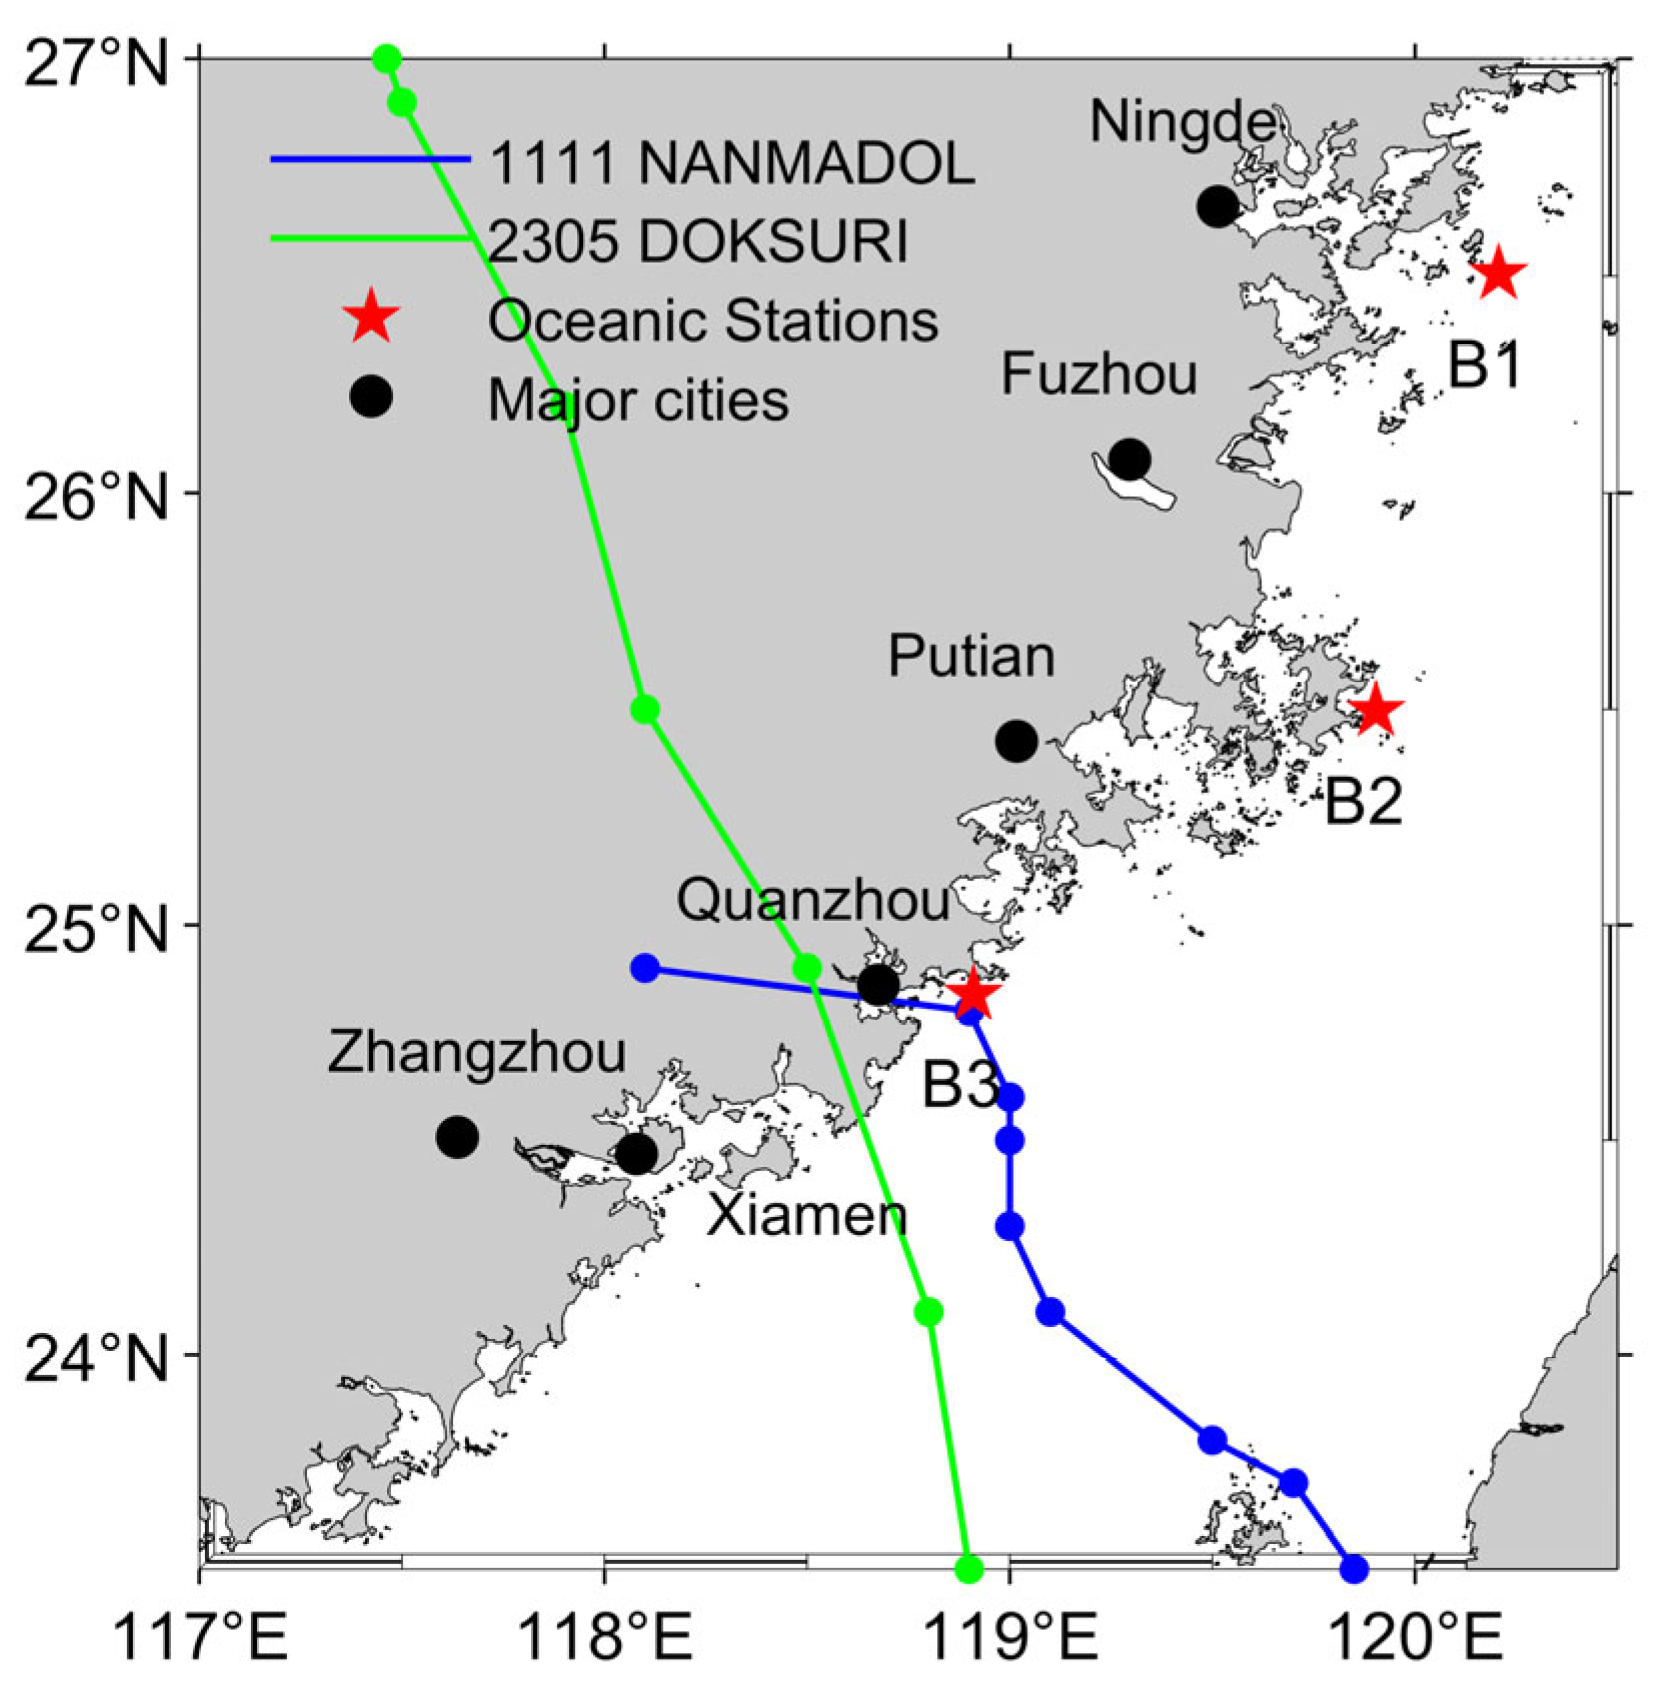
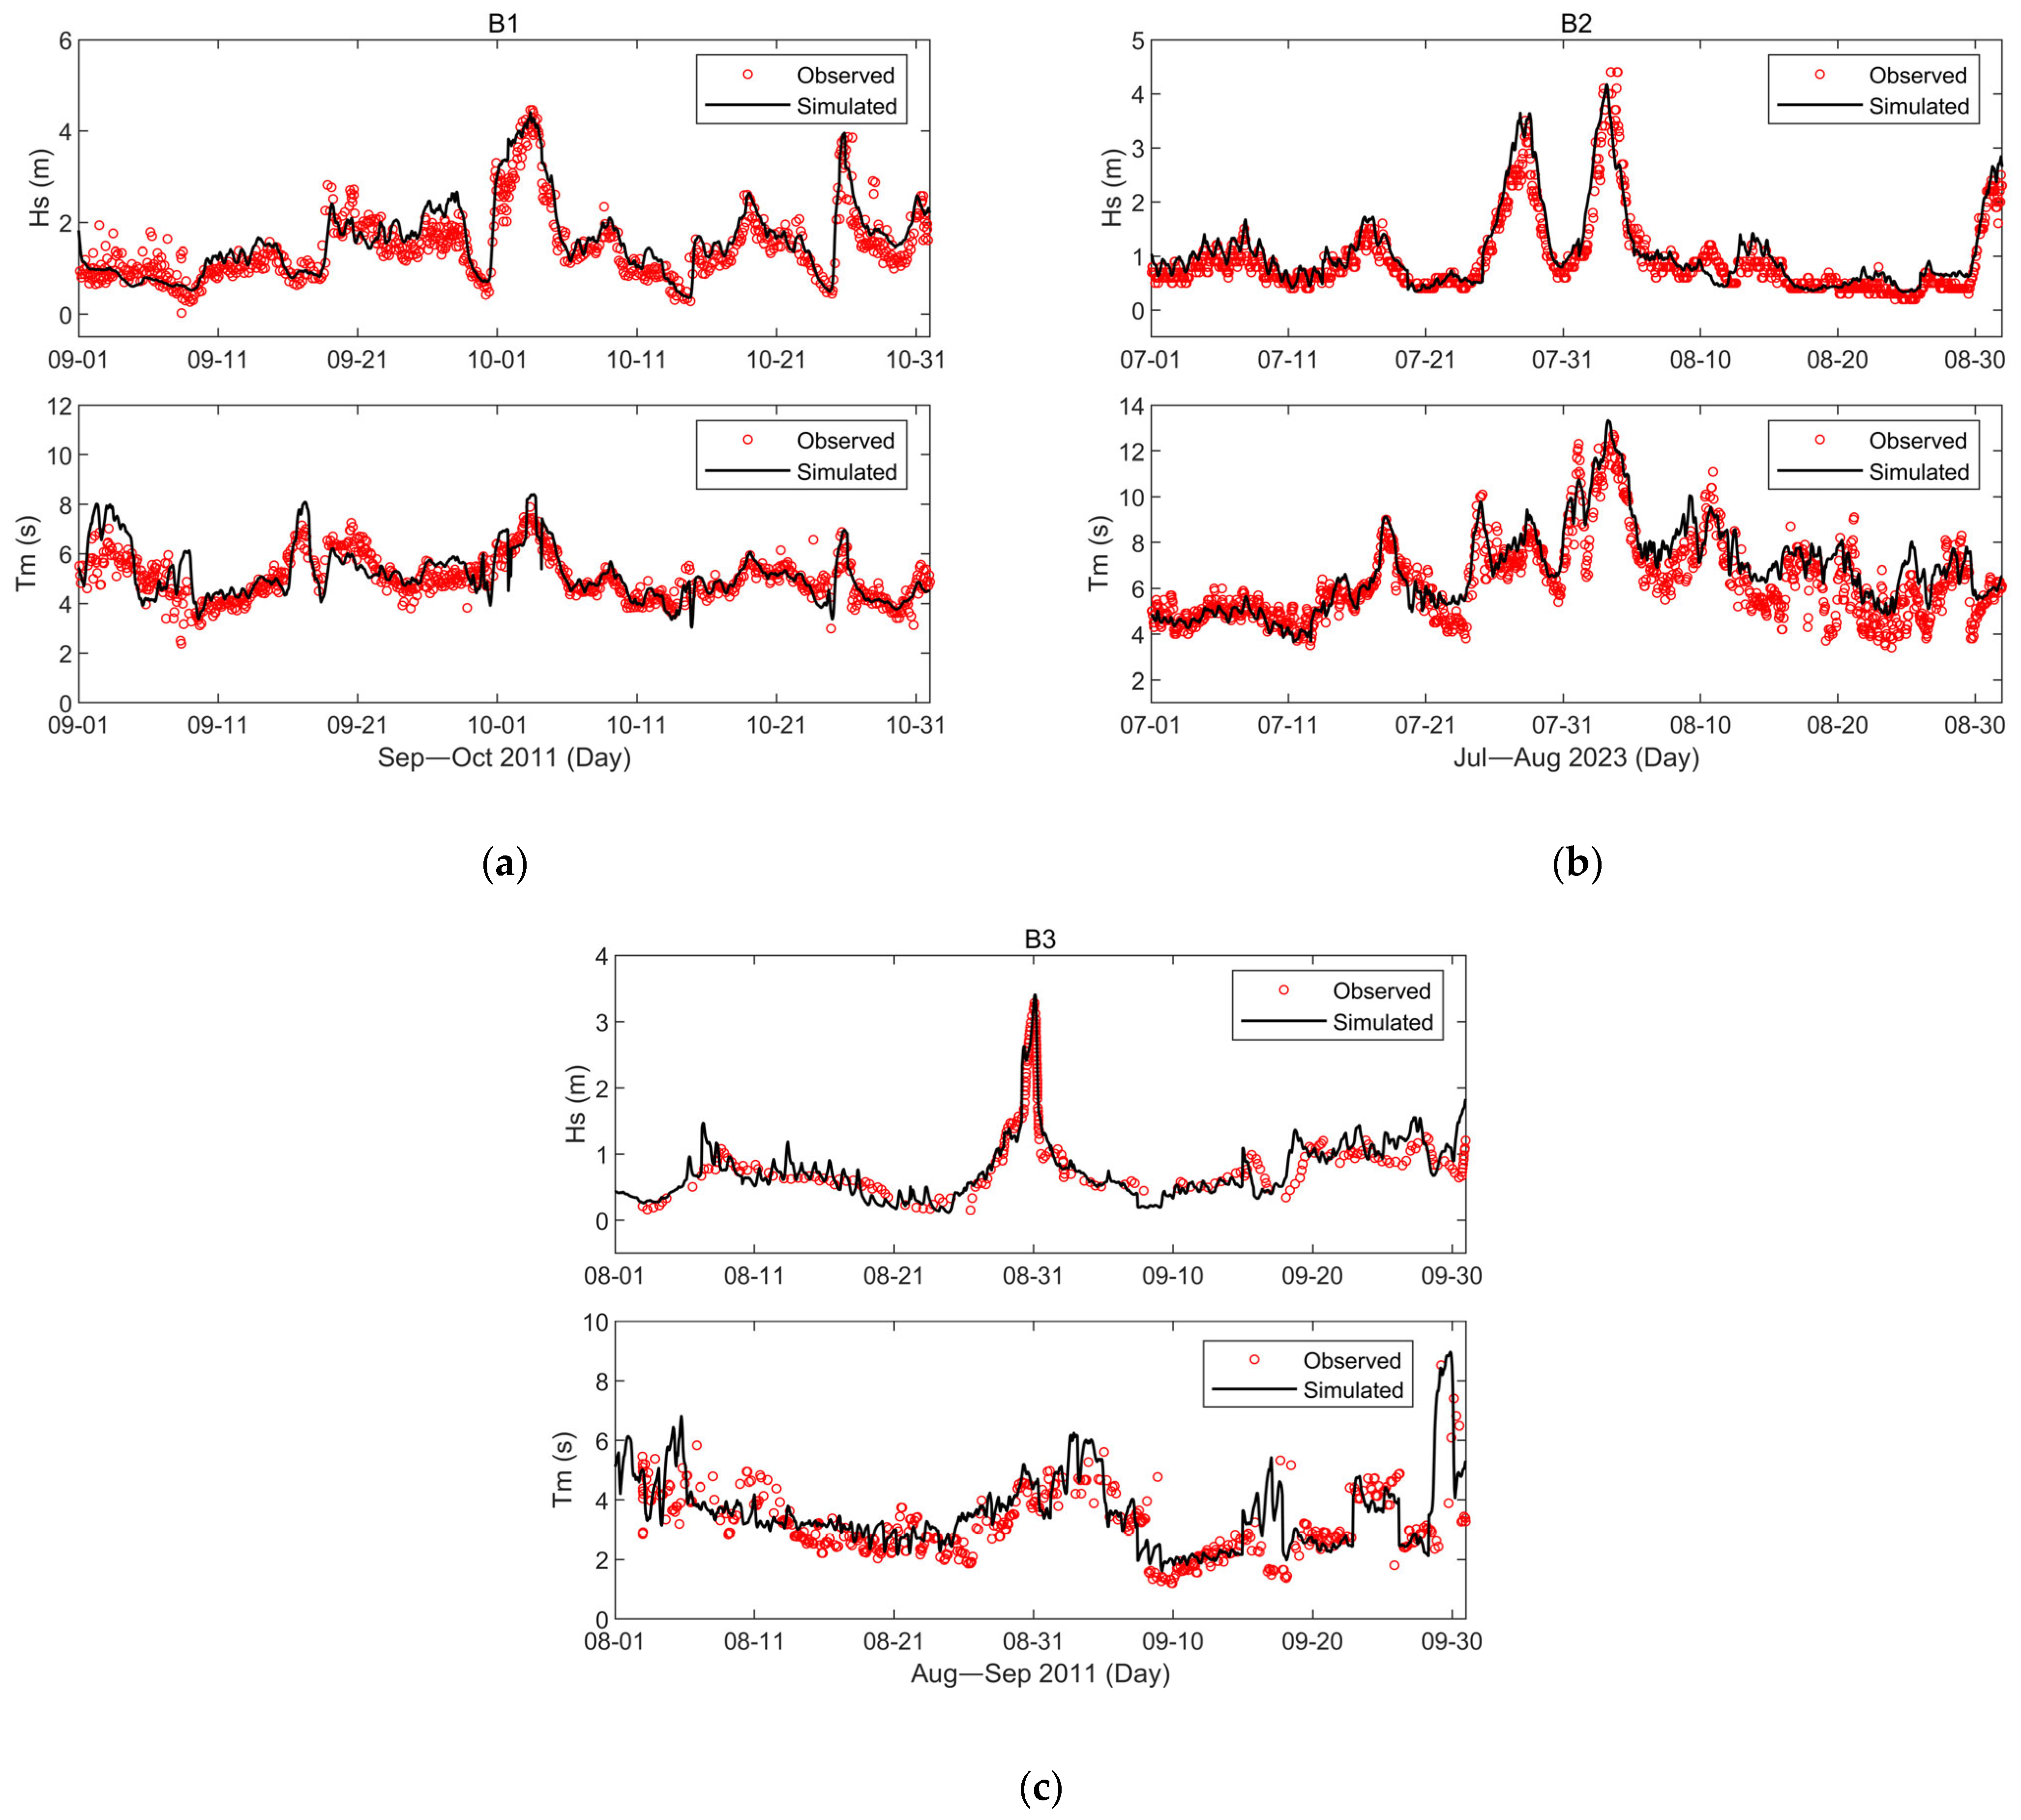
Based on the above methods, three buoy stations located in the Fujian sea area were selected in this study (Figure 2). And the model simulation results were compared with field measured data from the buoys. Figure 3 presents the comparison between simulated results and observed SWH as well as MP at the three stations during the observation period. It can be seen from Figure 3 that the model can accurately reproduce the variations in SWH and MP. Specifically, the model performs well in simulating the peak values of SWH at Station B1, where the simulated wave height curve is highly consistent with the measured data with minor errors. At Station B2, the model reasonably reproduces the continuous increase in wave height from late July to early August, and the overall trend agrees well with the measurements. Station B3 is located in the coastal area, where wave propagation is susceptible to shoaling topography and nonlinear effects. Even so, the model still maintains high simulation accuracy. The simulated curve is almost identical to the observation during the rapid drop of wave height in mid-to-late August. Although slight discrepancies between simulated and measured MP exist at individual time intervals, such errors are within an acceptable range. The peak SWH values at B2 and B3 were induced by two typhoons during the simulation period. The maximum SWH reaches 4.5 m at B2 and 3.5 m at B3. From 2 August to 3 August 2023, slight underestimation is found in the simulation at B2. Overall, the model exhibits good capability in capturing the peak values of SWH. In addition, the simulated MP during typhoon events can satisfactorily reproduce the observed variation characteristics.
The results of statistical error indicators are presented in Table 2. In terms of the simulation errors of SWH, the MAE values of the three stations range from 0.237 m to 0.320 m, and the RMSE values vary between 0.311 m and 0.586 m. The SI values range from 0.269 to 0.272, and the NSE values vary between 0.656 and 0.828. Notably, the NSE values at all three stations are only marginally above the generally acceptable threshold of 0.6, which may be attributed to the challenging conditions during typhoon events. All error values remain at a relatively low level, indicating that the model possesses high simulation accuracy for the wave height field in the Fujian sea area. Among the three stations, Station B2 has the largest RMSE of SWH, which may be attributed to the typhoon events experienced during the observation period. The AD of SWH at Station B2 is only 0.102 m, suggesting no significant overall deviation of the model simulation. Station B3 was also affected by typhoons during the observation period, and large SWH values were generated by typhoon processes; nevertheless, the model still maintains a low error level. The simulation errors of MP at each station are slightly larger than those of SWH. The R for MP range from 0.846 to 0.877, while the SI values range from 0.142 to 0.317 and the NSE values range from 0.662 to 0.726. Station B1 shows the minimum MP error, while Station B2 presents the maximum value. This phenomenon is probably related to the drastic variation in wave spectrum and intense fluctuation of MP at Station B2 under typhoon influence.
Overall, the TOMAWAC model performs satisfactorily in wave simulation for the Fujian sea area, with high simulation accuracy for SWH and reliable performance for MP simulation under normal wave conditions. Under typhoon influence, the model still maintains a good capacity for simulating high SWH values, while the simulation error of MP increases slightly but remains in a reasonable overall trend. Therefore, the wave model can well predict wave parameters in the Fujian sea area under both normal and severe wave conditions.

2.4. Trend Analysis

Linear trends of severe wave event characteristics were calculated using the Mann–Kendall non-parametric trend test combined with Sen’s slope estimator. For each grid point, the annual time series from 1980 to 2023 were analyzed.
The Mann–Kendall test statistic S is computed as:
S = i = 1 n 1 j = i + 1 n sgn ( x j x i )
V a r ( S ) = n ( n 1 ) ( 2 n + 5 ) k t k ( t k 1 ) ( 2 t k + 5 ) 18
Z = S 1 V a r ( S ) S > 0 0 S = 0 S + 1 V a r ( S ) S < 0
β = m e d i a n x j x i j i
where x i and x j are the data values at times i and j , sgn is the sign function, t k is the number of ties for the k-th tied group, and β is Sen’s slope estimator. The two-tailed p-value derived from Z was used to assess statistical significance at the 90% confidence level. The slope β was then multiplied by 10 to obtain the trend per decade. A minimum of five valid data points per grid point was required for trend calculation. Grid points with statistically significant trends are marked with black points in the corresponding figures.

3. Results

3.1. Spatial Distribution of Maximal SWH and MP Values

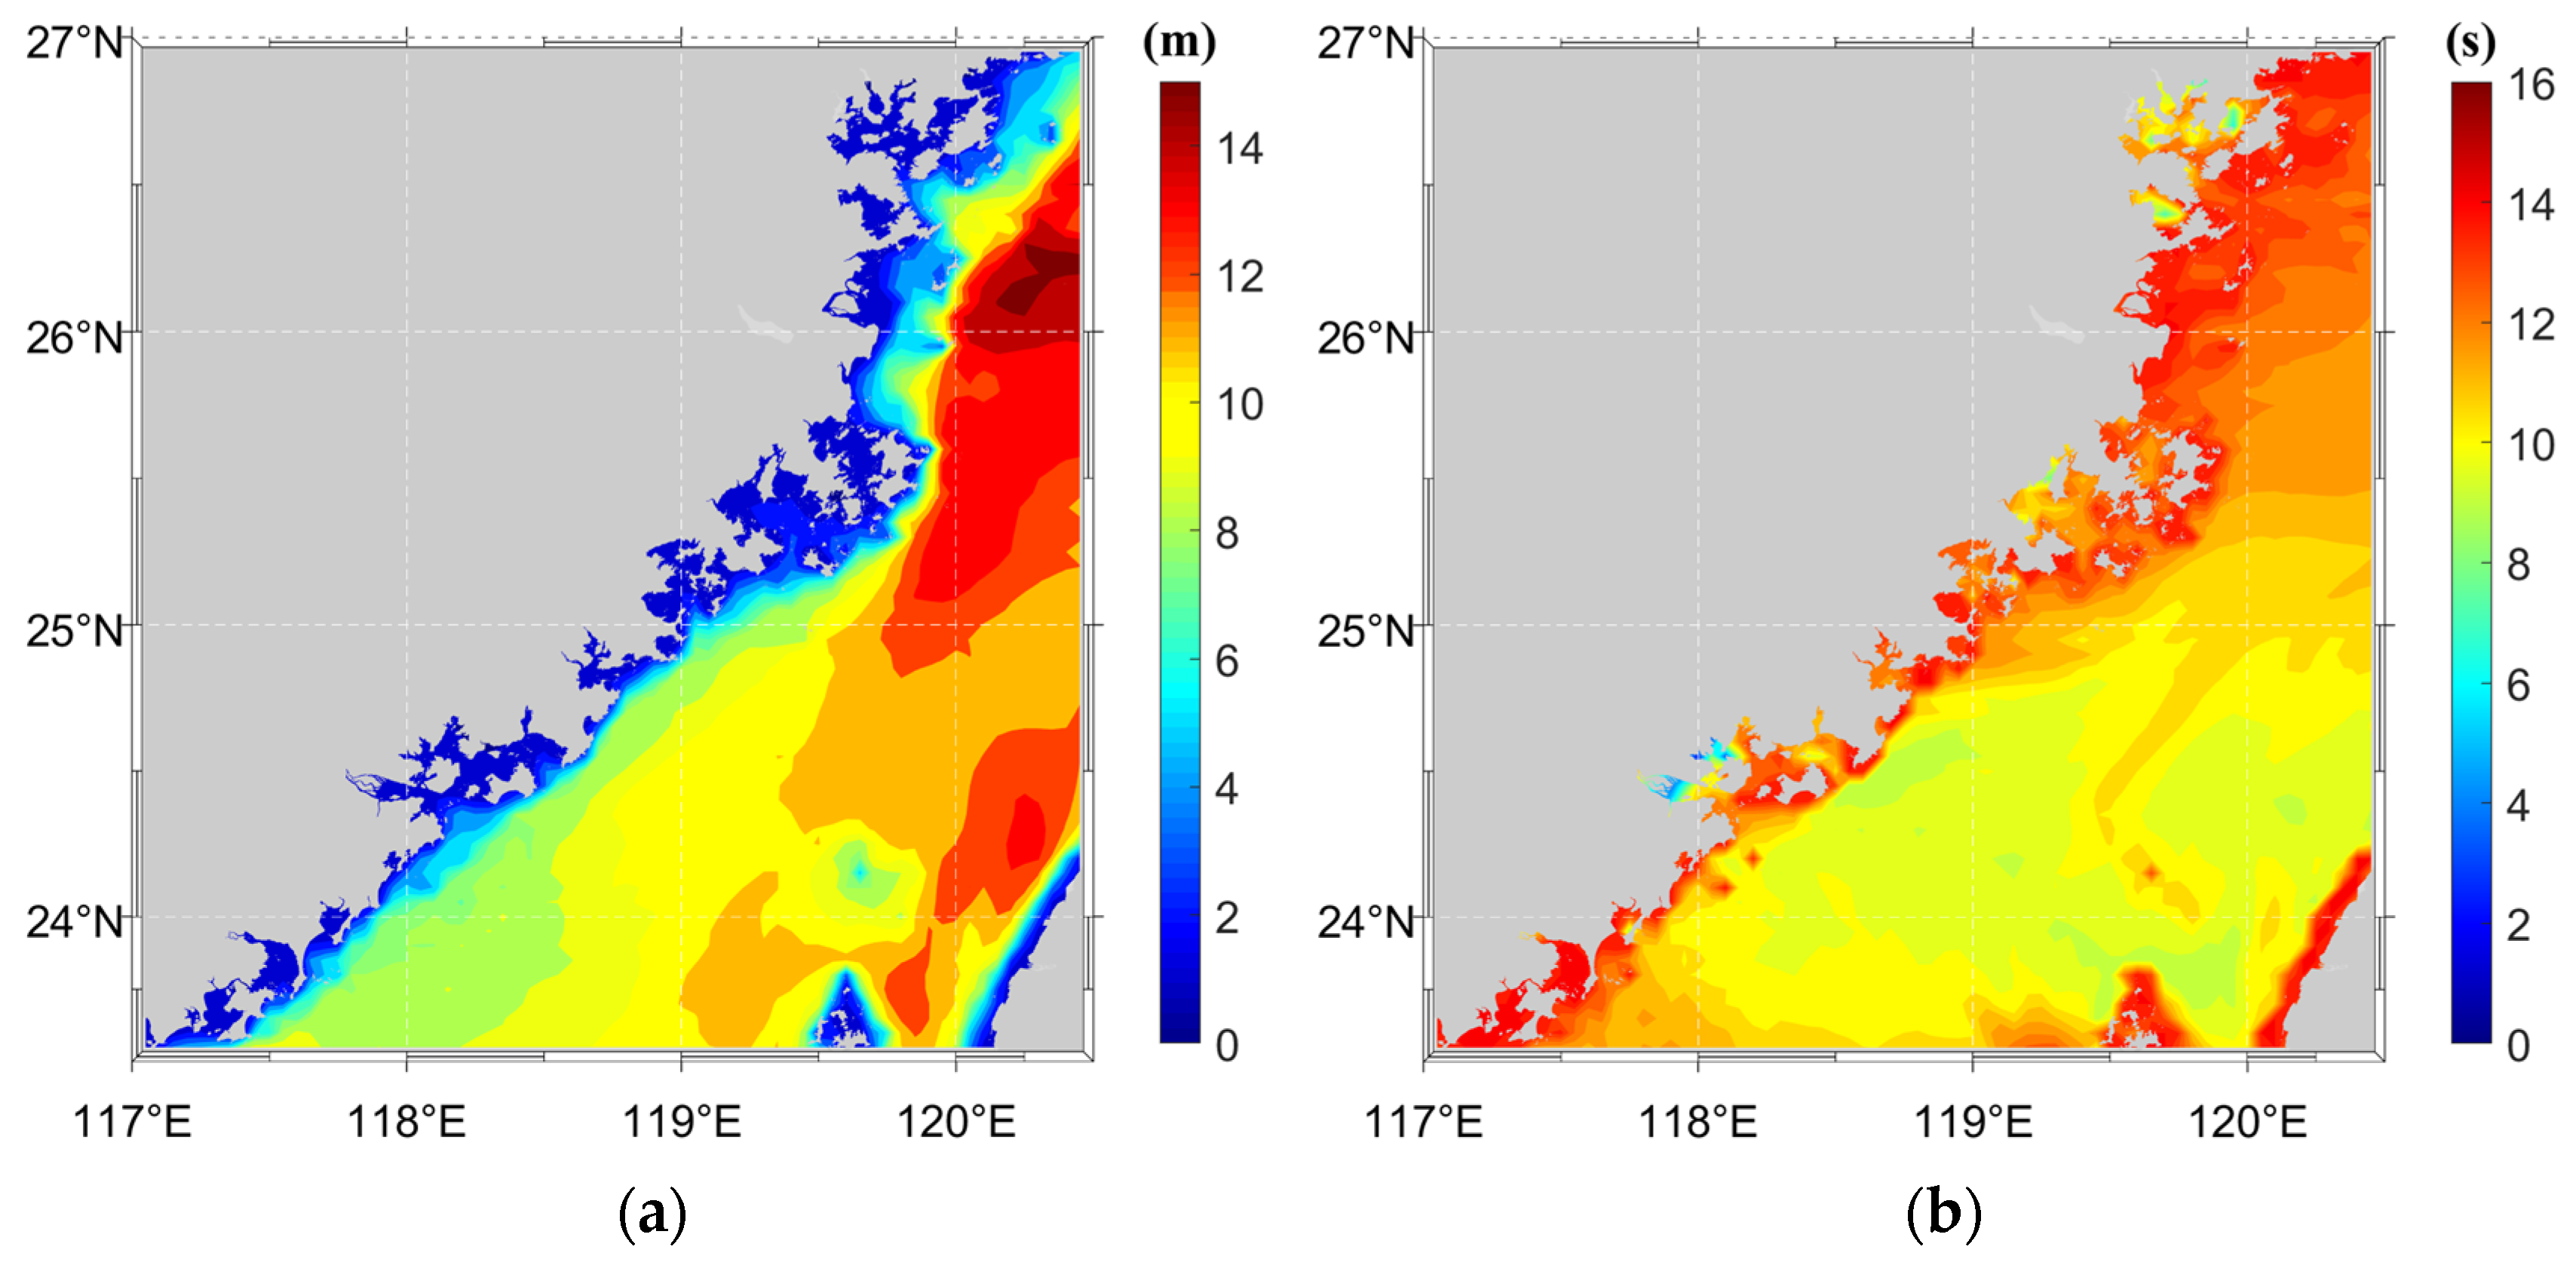
The wave characteristics in the Fujian sea area based on wave hindcast data are analyzed in this section. Figure 4 presents the distribution of the maximum SWH and maximum MP from 1980 to 2023.
Fujian is one of the regions in China most severely affected by typhoons. Overall [40,41], the maximum SWH along the coast of Fujian shows a gradually decreasing trend from the offshore to the inshore and from north to south, which is highly correlated with typhoon tracks. The maximum SWH reaches 15 m, occurring in the offshore sea of Ningde. In terms of regional distribution, the maximum SWH in the sea area near Fuzhou and the Minjiang Estuary is approximately 10–13 m; in the inshore sea from Quanzhou to Xiamen it is mostly between 8 and 10 m; while in the area south of Zhangzhou it ranges from 7 to 9 m. It is also noted that, owing to land topography and coastal sheltering effects, wave intensity in estuaries and harbors is evidently lower than that in the open sea. For instance, restricted by topographic sheltering, the maximum SWH of the Minjiang Estuary, Fuzhou Port and Quanzhou Port is only 4–6 m, much lower than that in the outer open seas.
The distribution of maximum MP presents a certain correlation with that of maximum SWH, with the maximum MP of about 15 s also appearing in the offshore sea near Ningde. Different from the distribution of maximum SWH, high-value MP is mostly distributed in coastal areas rather than deep sea regions. This spatial pattern—higher maximum MP values in nearshore areas rather than in deep sea regions—can be primarily attributed to the following three mechanisms. First, swell generated by distant storms or typhoons propagates toward the coast. As water depth decreases, wave refraction and shoaling occur, during which wave energy becomes more concentrated and the wave period can be preserved or even enhanced relative to offshore conditions. Second, the complex bathymetry and narrowing geometry of the Taiwan Strait can locally amplify wave energy. Third, there exists a differential attenuation between wave height and wave period. Under the influence of bottom friction and wave breaking, wave height attenuation is typically more pronounced than period attenuation. As waves propagate from deep to shallow water, SWH decreases rapidly due to energy dissipation, while MP experiences comparatively less reduction. This differential attenuation results in relatively higher MP values in nearshore areas compared to deeper waters.
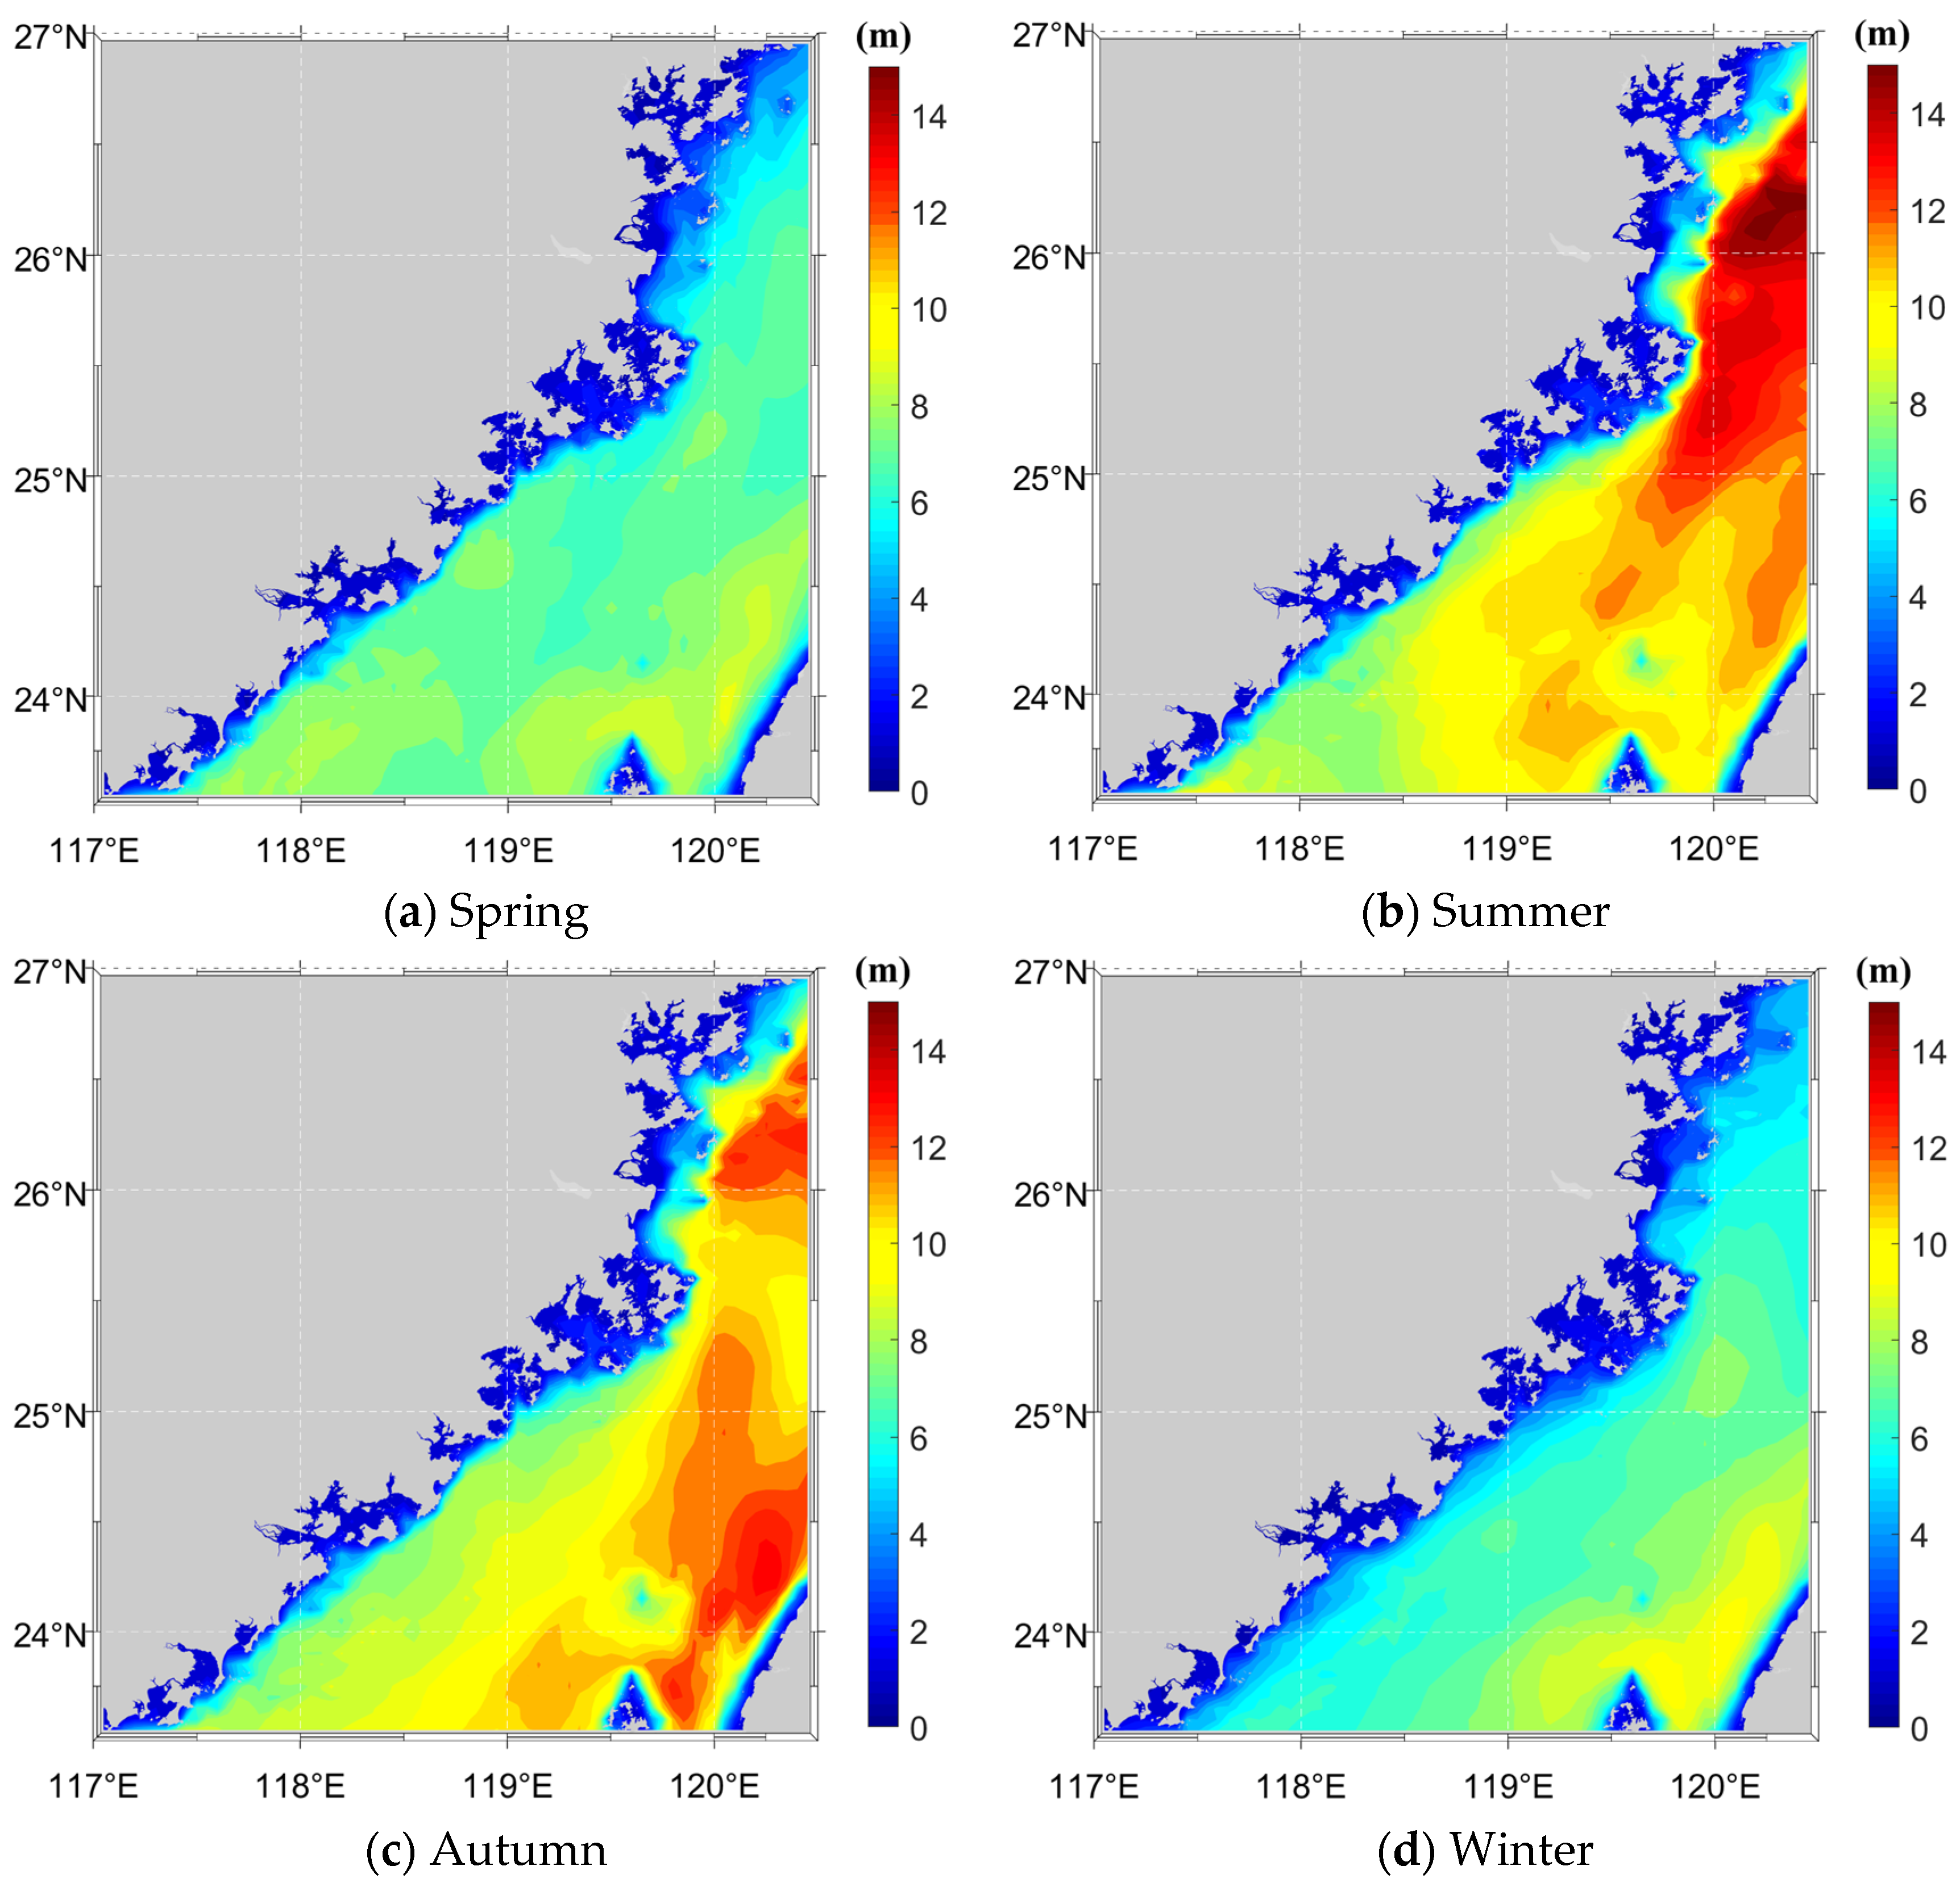
Figure 5 illustrates the spatial distribution of maximum SWH in different seasons, presenting an obvious seasonal periodicity. Affected significantly by typhoons in summer and autumn, the maximum SWH is considerably higher, mostly exceeding 10 m and reaching up to 15 m in some local areas. In spring and winter, the maximum SWH is relatively low, with values below 8 m in most sea areas. Figure 6 shows the spatial distribution of maximum MP across different seasons. Overall, the maximum MP in the Fujian sea area exhibits remarkable seasonal variation characteristics and shares a certain consistency with the distribution of maximum SWH.

3.2. Spatial Distribution of Mean SWH and MP Values

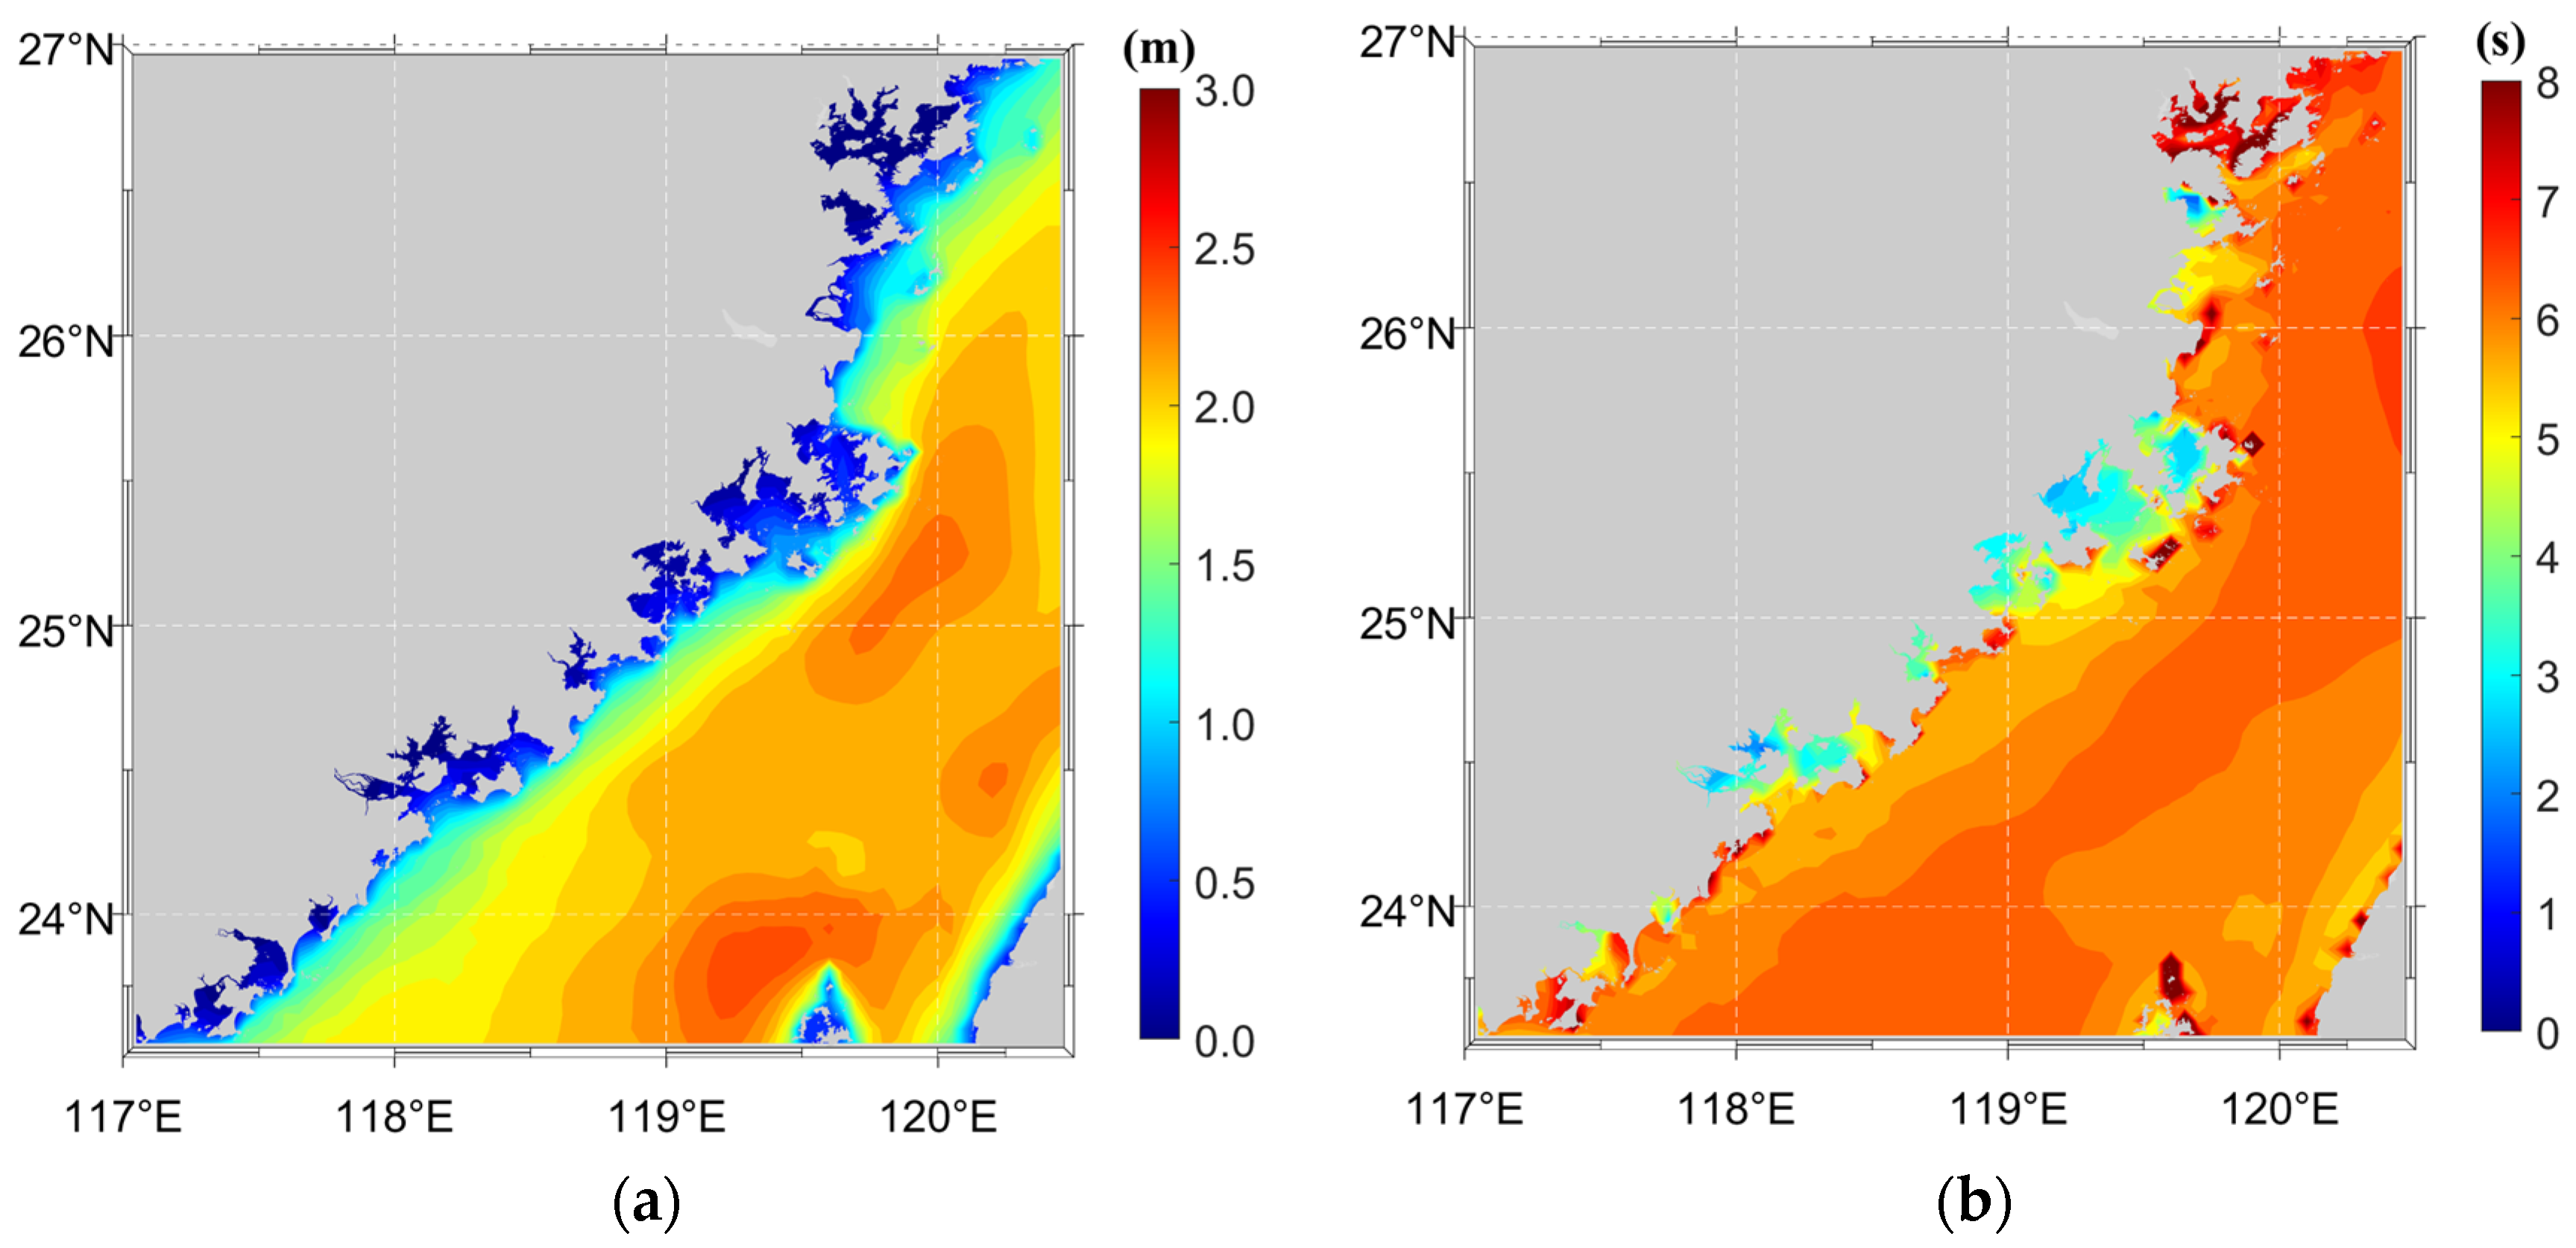
The distributions of mean SWH and mean MP are shown in Figure 7. In total, the spatial distribution of the mean SWH is similar to that of the maximum SWH, showing a characteristic pattern of lower values nearshore and higher values offshore, which reflects the combined effects of sea depth and coastal geomorphology on wave evolution. The mean SWH in the inshore sea from Ningde, Fuzhou to Xiamen is mostly between 1.0 and 2.0 m. In the open sea of the Taiwan Strait, especially in the southeastern part of the study area, the mean SWH generally exceeds 2.0 m. The highest mean SWH reaches approximately 2.5 m near the Penghu Islands. High-value zones of mean MP are mainly concentrated in the southeastern and northeastern open offshore sea of the study area. The spatial distribution of mean MP generally follows that of mean SWH, with both exhibiting a similar stepwise increasing pattern from nearshore areas toward offshore waters, although the gradient of MP is less pronounced than that of SWH.
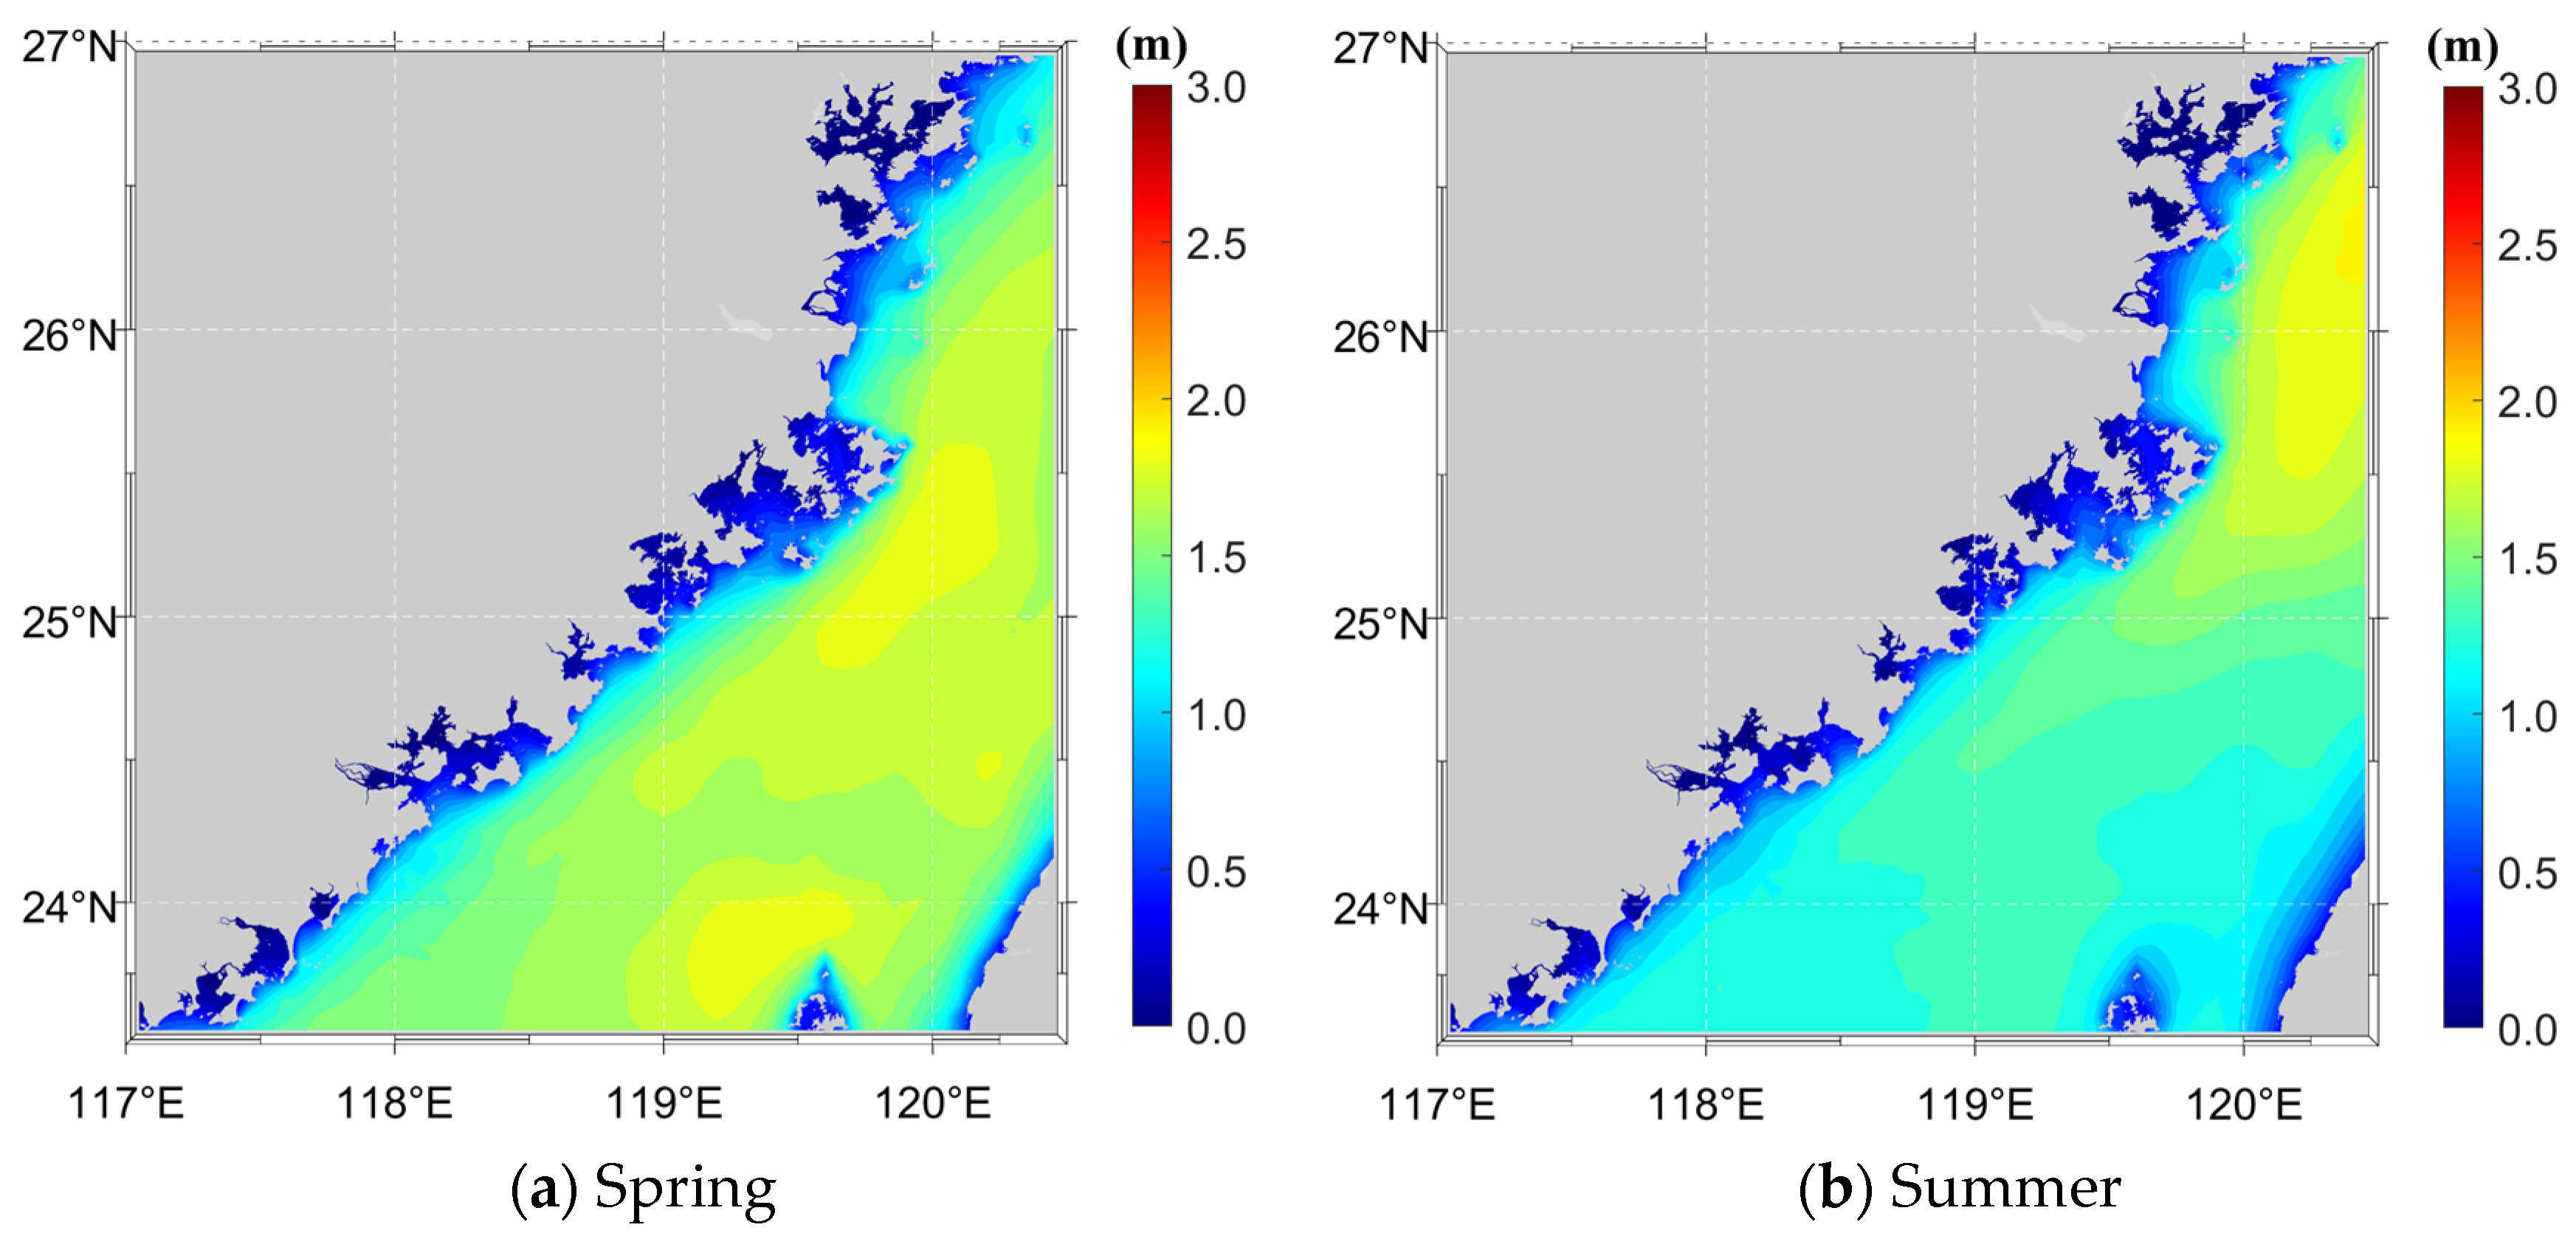
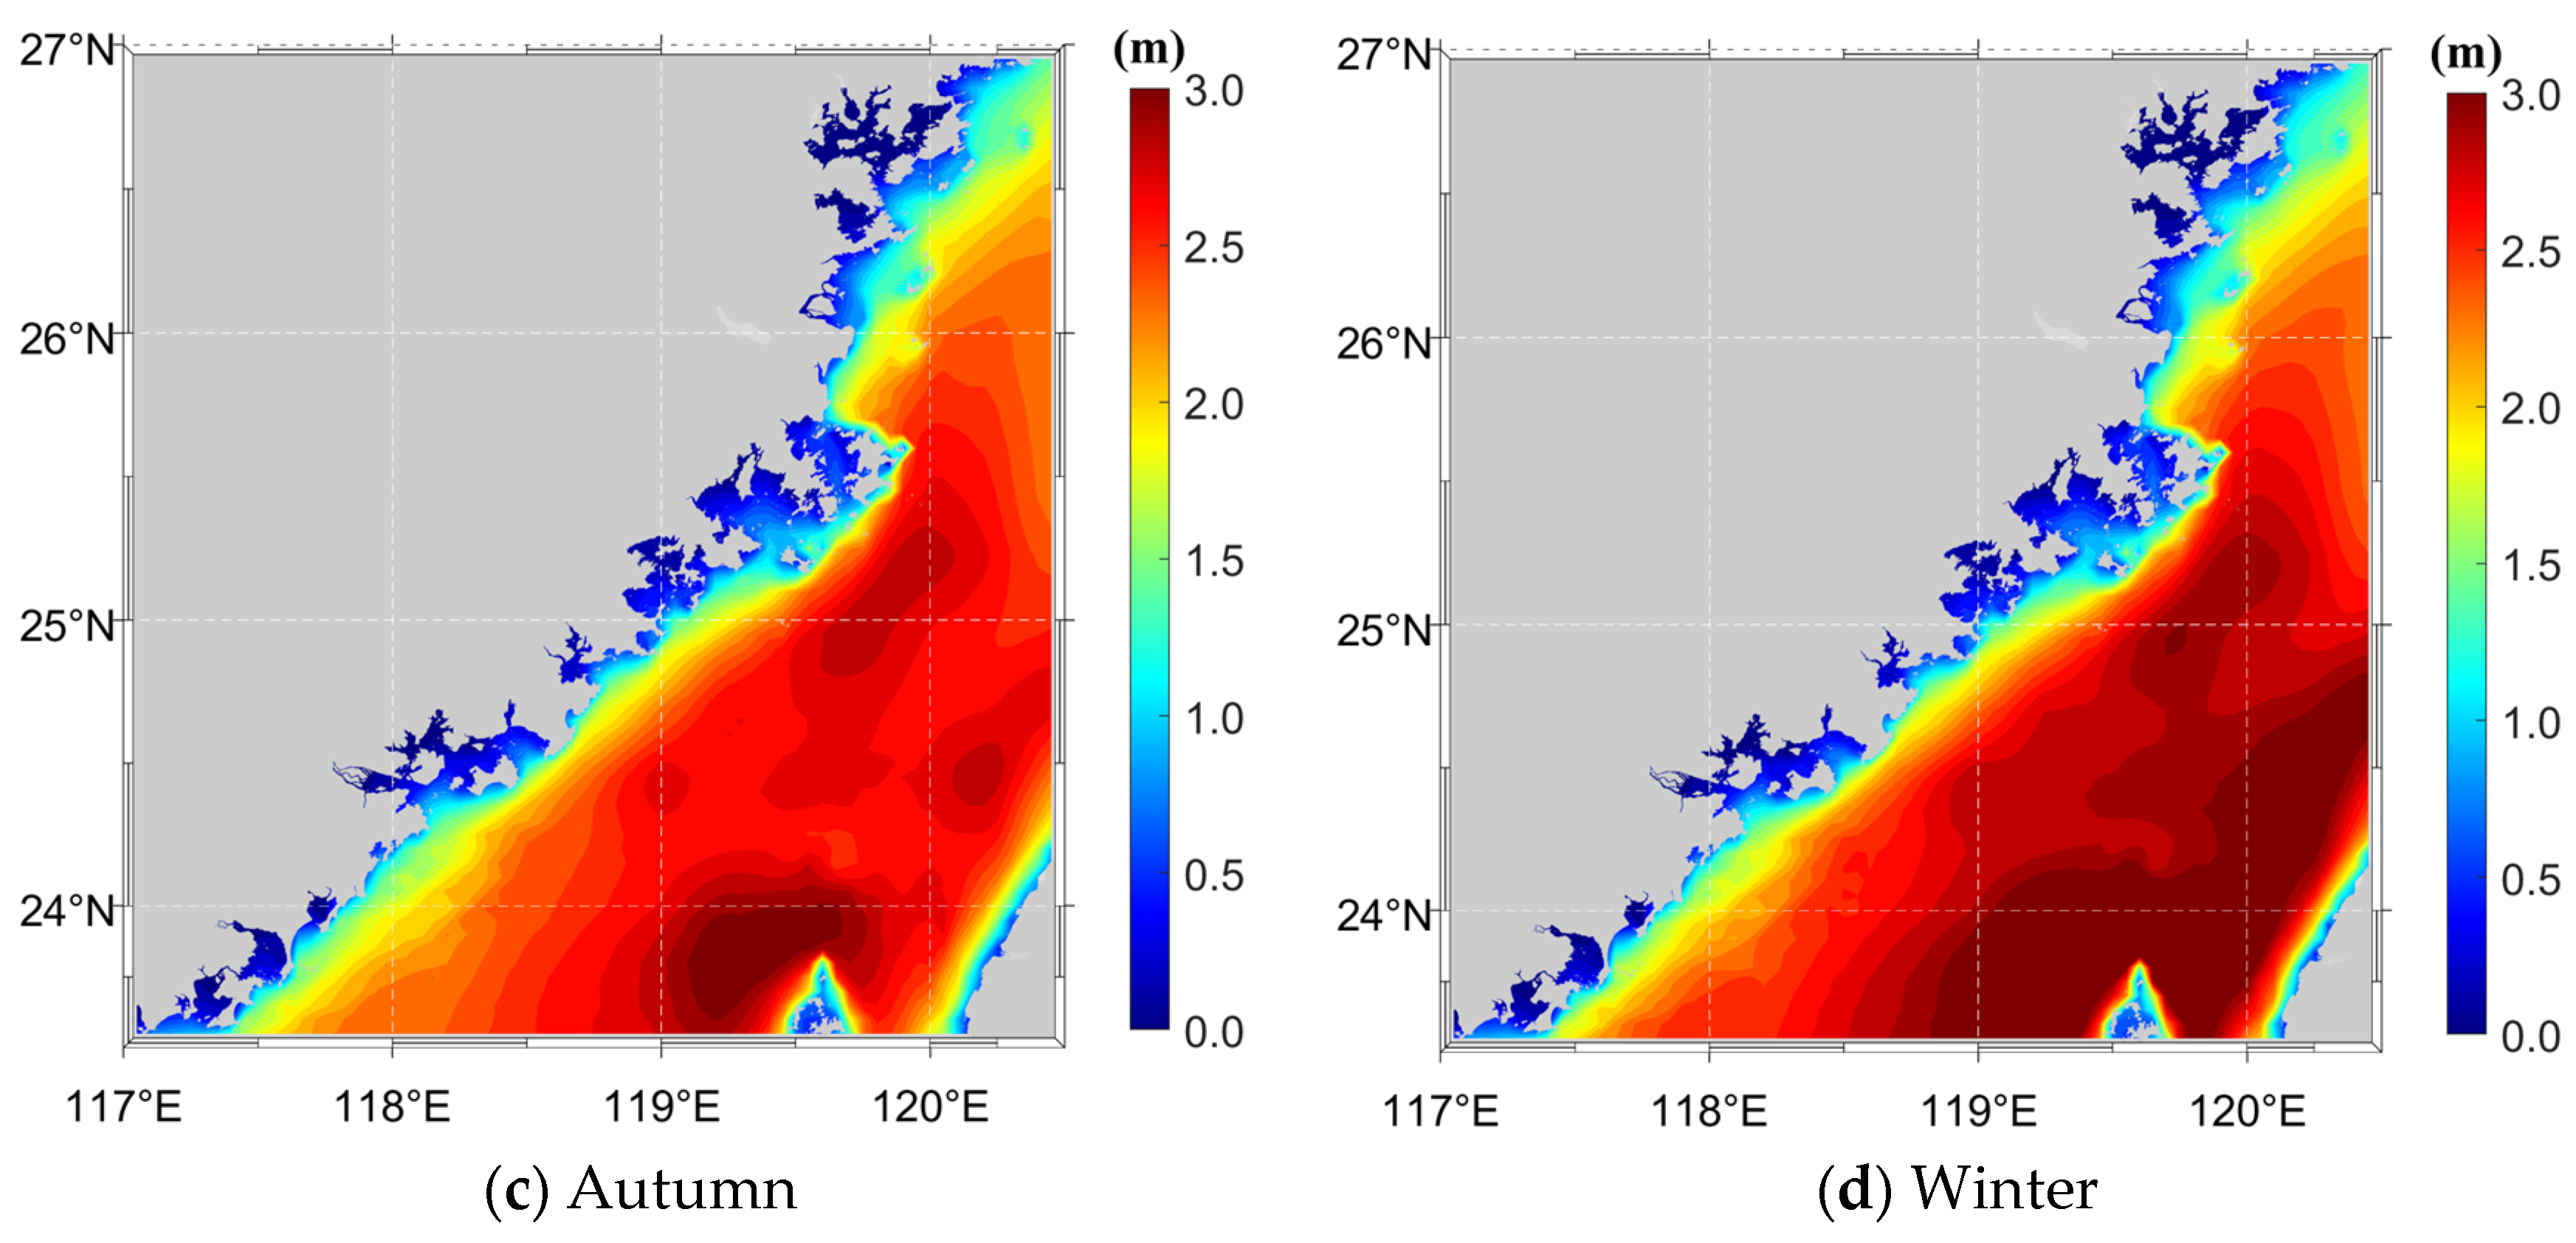
Figure 8 illustrates the spatial distribution of seasonal mean SWH. By comparison with the distribution of seasonal maximum SWH, a notable discrepancy can be identified between the two spatial patterns. The mean SWH generally presents higher values in autumn and winter, with the majority of the sea area exceeding 2.5 m. In contrast, spring and summer witness relatively low mean SWH, and the values in most seas are below 2 m. The highest mean SWH occurs in winter. This phenomenon is primarily attributed to the southward movement of cold air driven by the Siberian High, which generates the East Asian winter monsoon. Over the Taiwan Strait, the East Asian monsoon forms a strong northeasterly wind field, intensifying sea surface fluctuations and pushing the mean SWH to its annual peak. In summer, dominated by the southwest monsoon, the wind speed drops to the lowest level of the year, corresponding to a relatively low mean SWH [42].
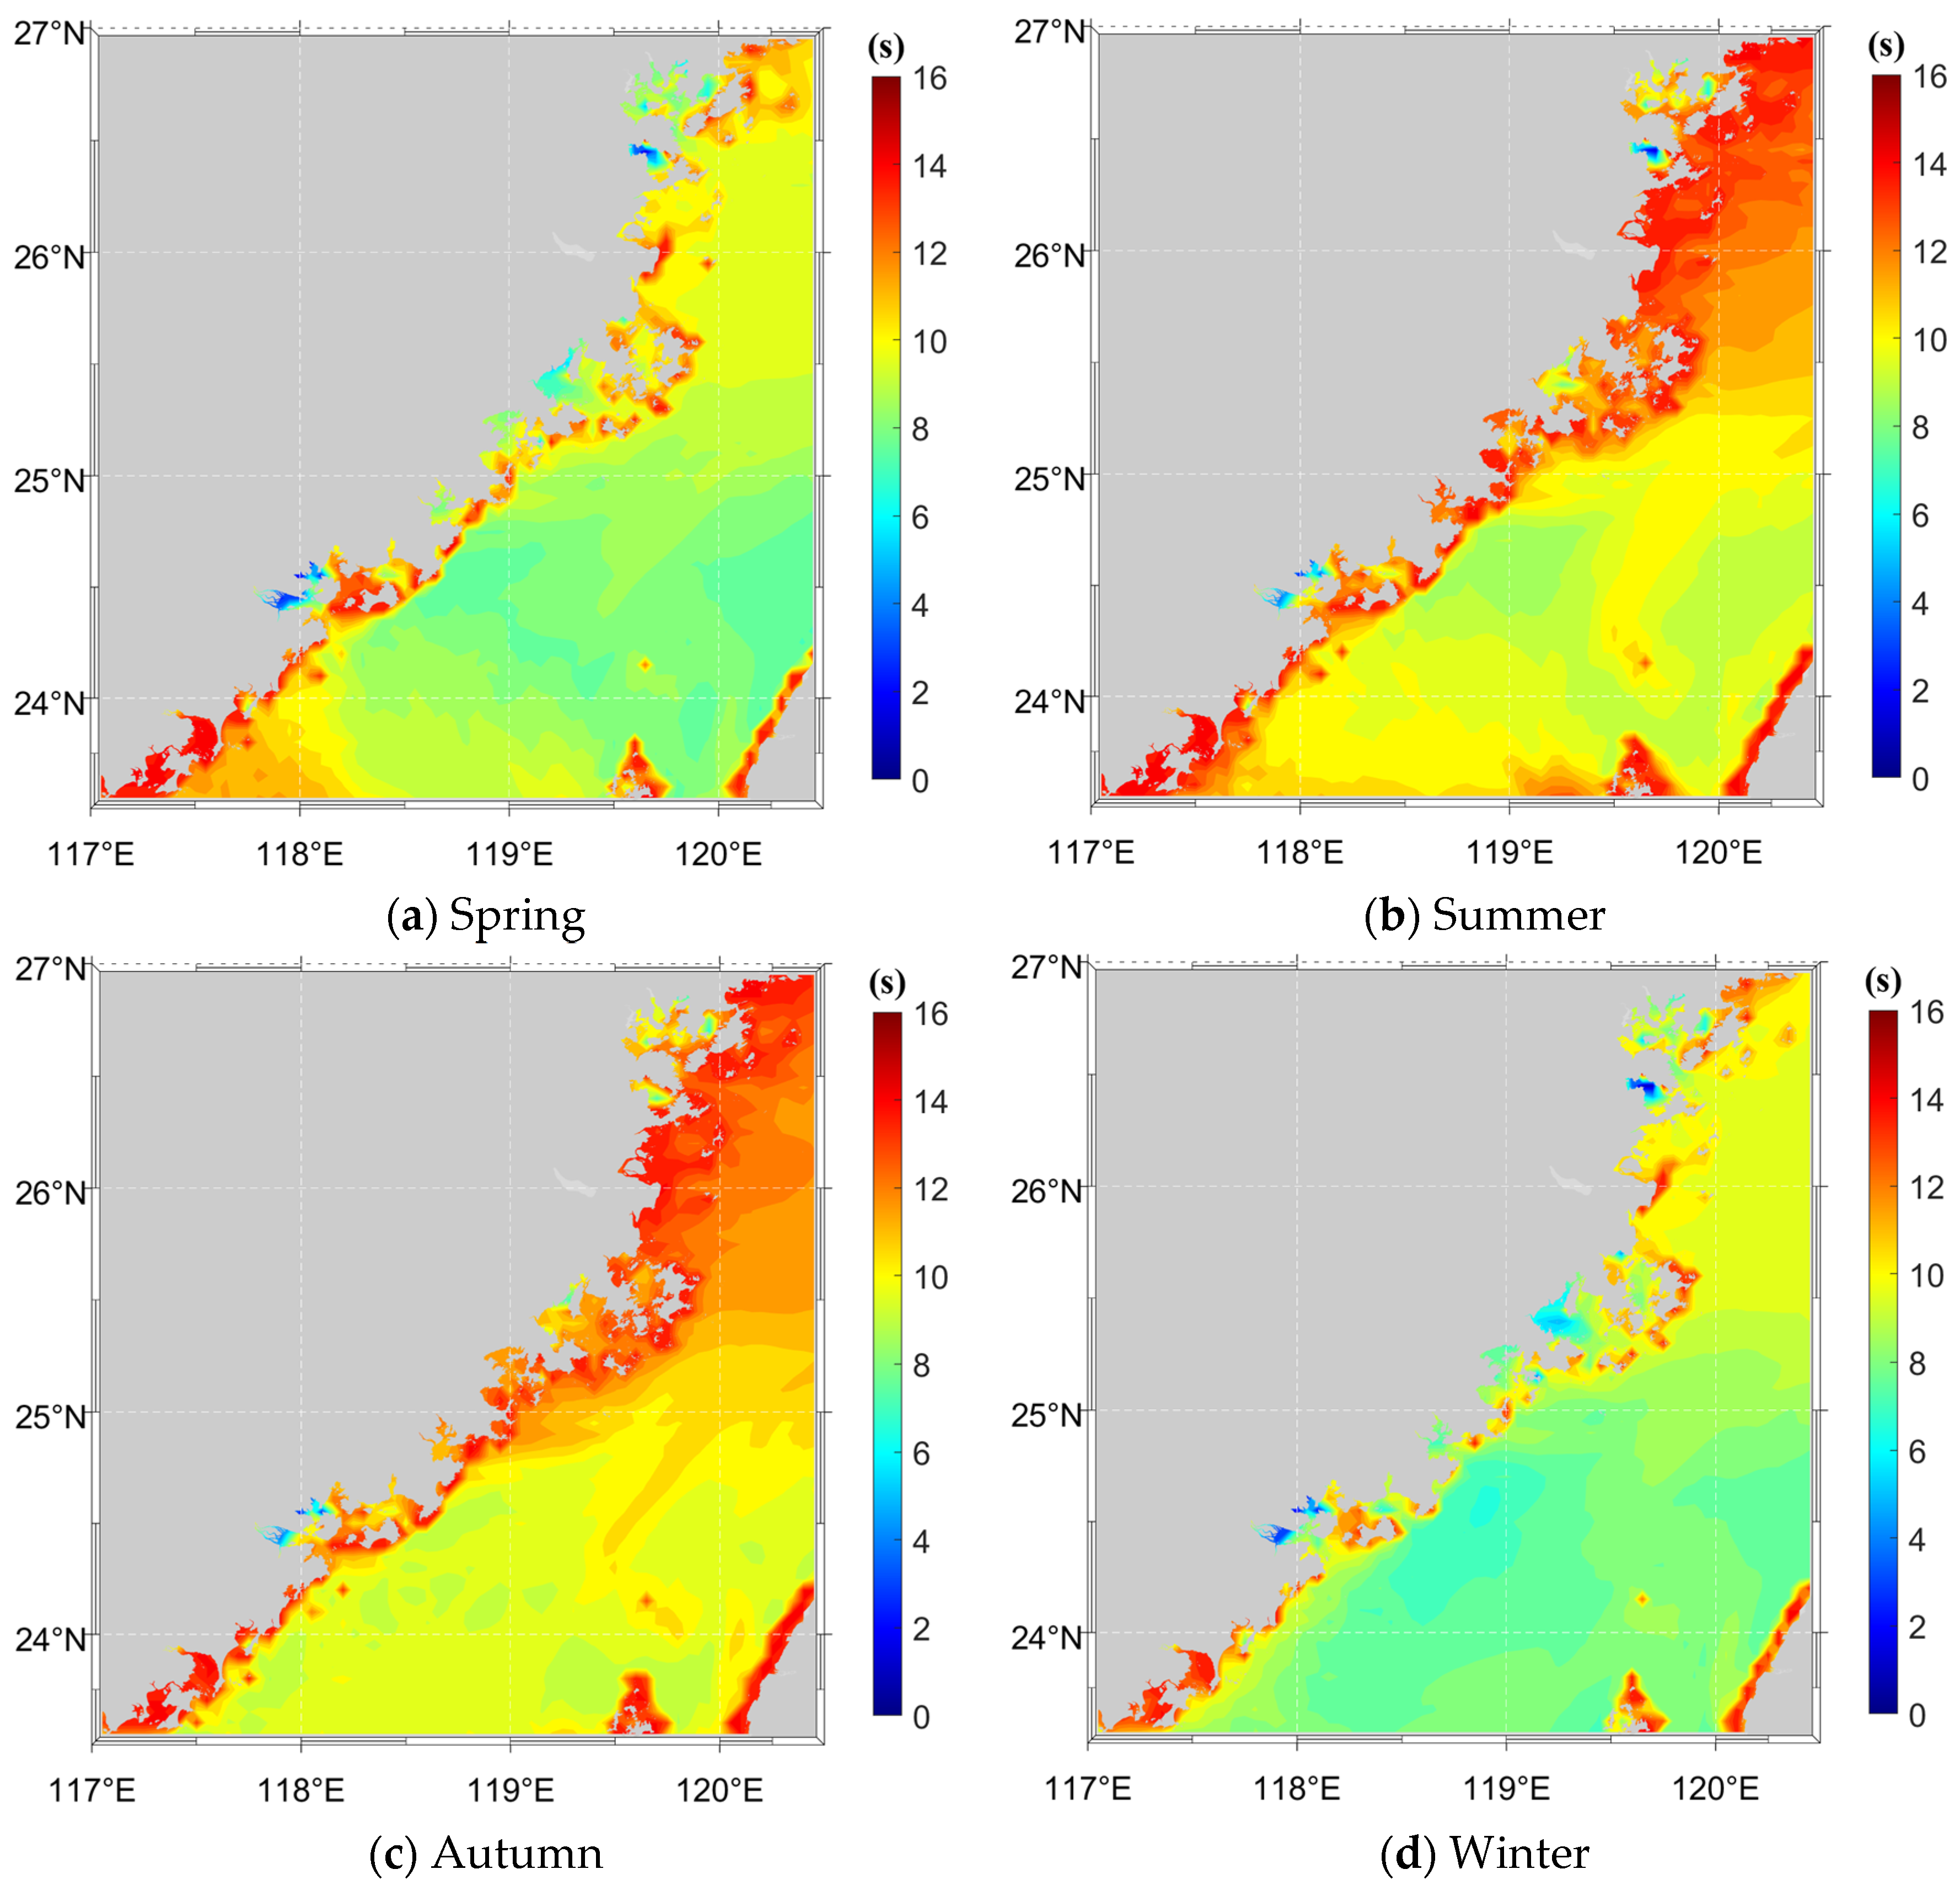
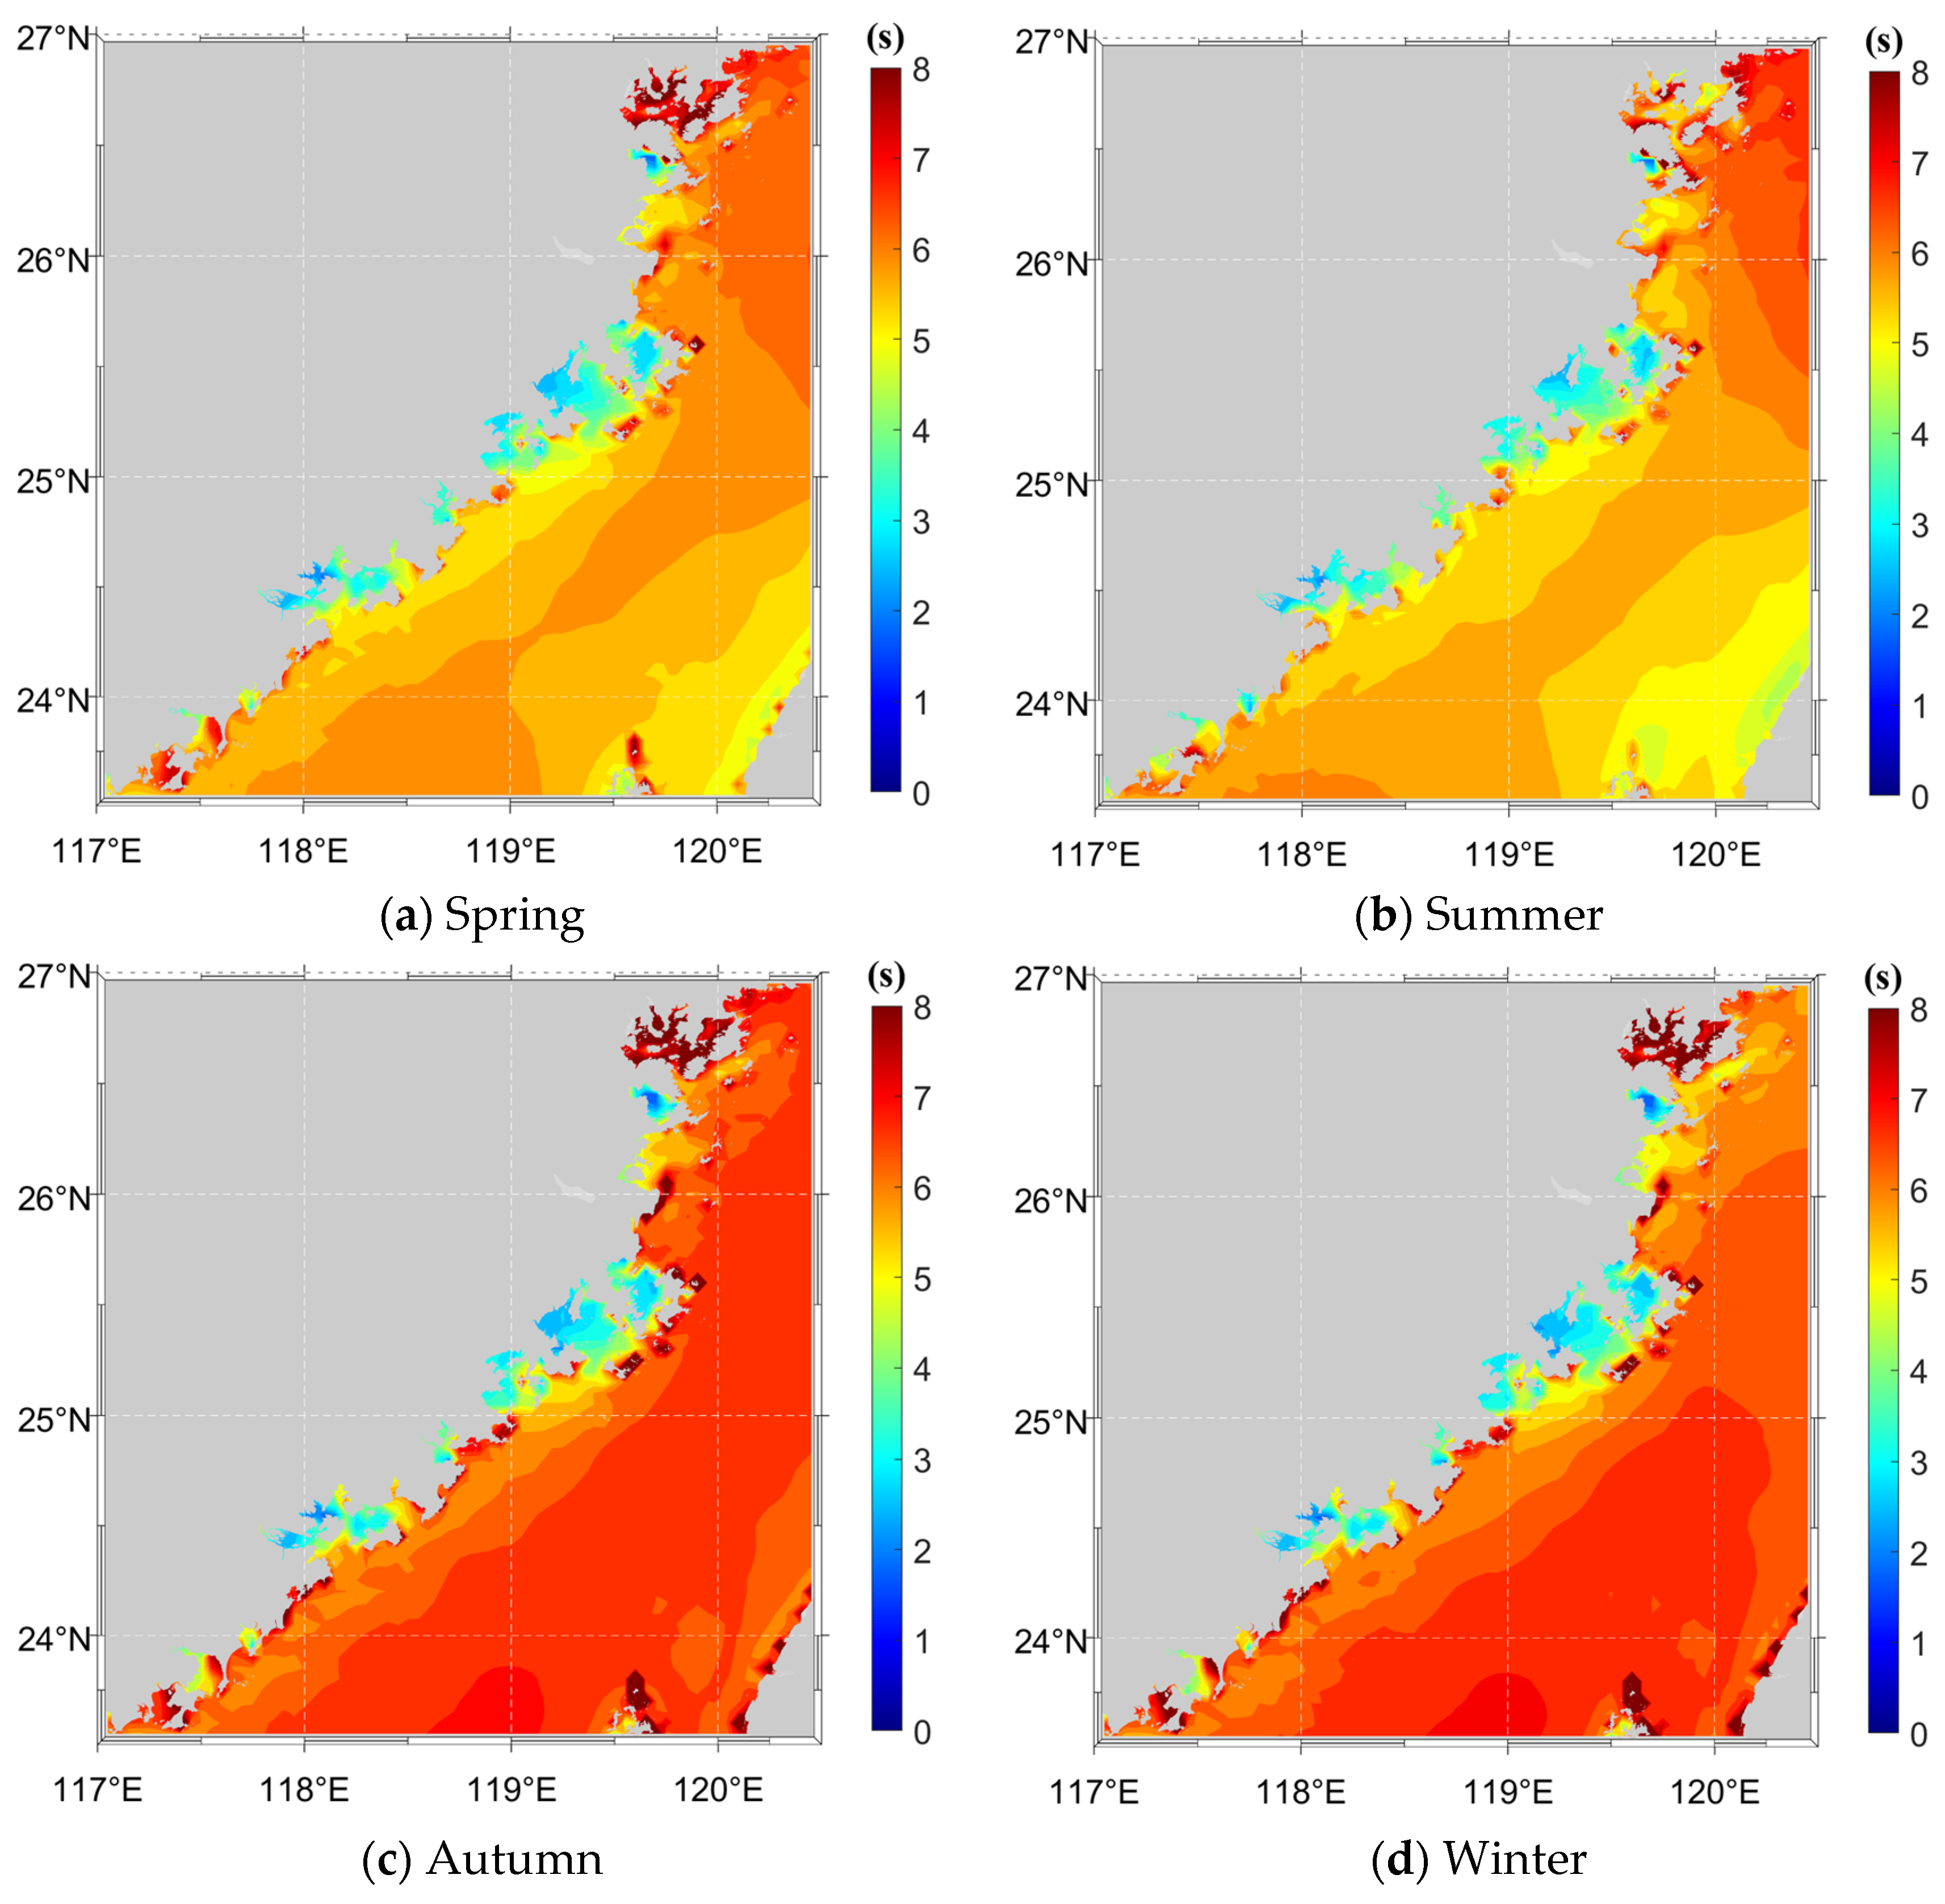
Figure 9 presents the distribution of mean MP in four seasons. The highest mean MP occurs in autumn. The seasonal variation in mean MP in the Fujian sea area is jointly controlled by the monsoon system, coastal topography and swell propagation. Wind waves dominate in spring and winter with relatively small MP values, while the proportion of swell components rises in summer and autumn, leading to an obvious increase in MP.

3.3. Analysis of the Spatiotemporal Characteristics of Severe Waves

The preceding sections have mainly analyzed the maximum and mean values of SWH and MP. These indicators can reflect the basic wave characteristics to a certain extent. However, for refined assessments of coastal engineering safety, route planning, and offshore construction conditions, further investigation into the temporal behavior characteristics of severe waves is required [43]. Under the impacts of climate change and climate-driven variability, severe waves can cause severe damage to critical coastal infrastructure [44]. To this end, this study introduces the severe event threshold (SET) as a criterion [39,45], defined as the 98th percentile of the entire SWH data series. Accordingly, the duration of severe waves is defined as follows:
P ¯ = 1 m i = 1 m j = 1 N j P i , j N j
where m is the number of years in the data series, Nj is the number of severe events per year, and Pi,j denotes the occurrence time of severe events when SWH exceeds the SET threshold.
In this study, a severe event is defined as a continuous period during which the SWH exceeds the local SET. Once the SWH drops below the SET, the event is considered to have ended. A new severe event is counted only when the SWH rises above the SET again after having fallen below it. No minimum duration threshold is imposed, meaning that any continuous exceedance is treated as a single valid severe event. Additionally, events separated by a gap of one or more time steps are treated as distinct events rather than merged events, as the re-exceedance implies a separate episode of severe wave conditions. These event-identification criteria ensure consistency and reproducibility in the calculation of the mean duration of severe wave events.
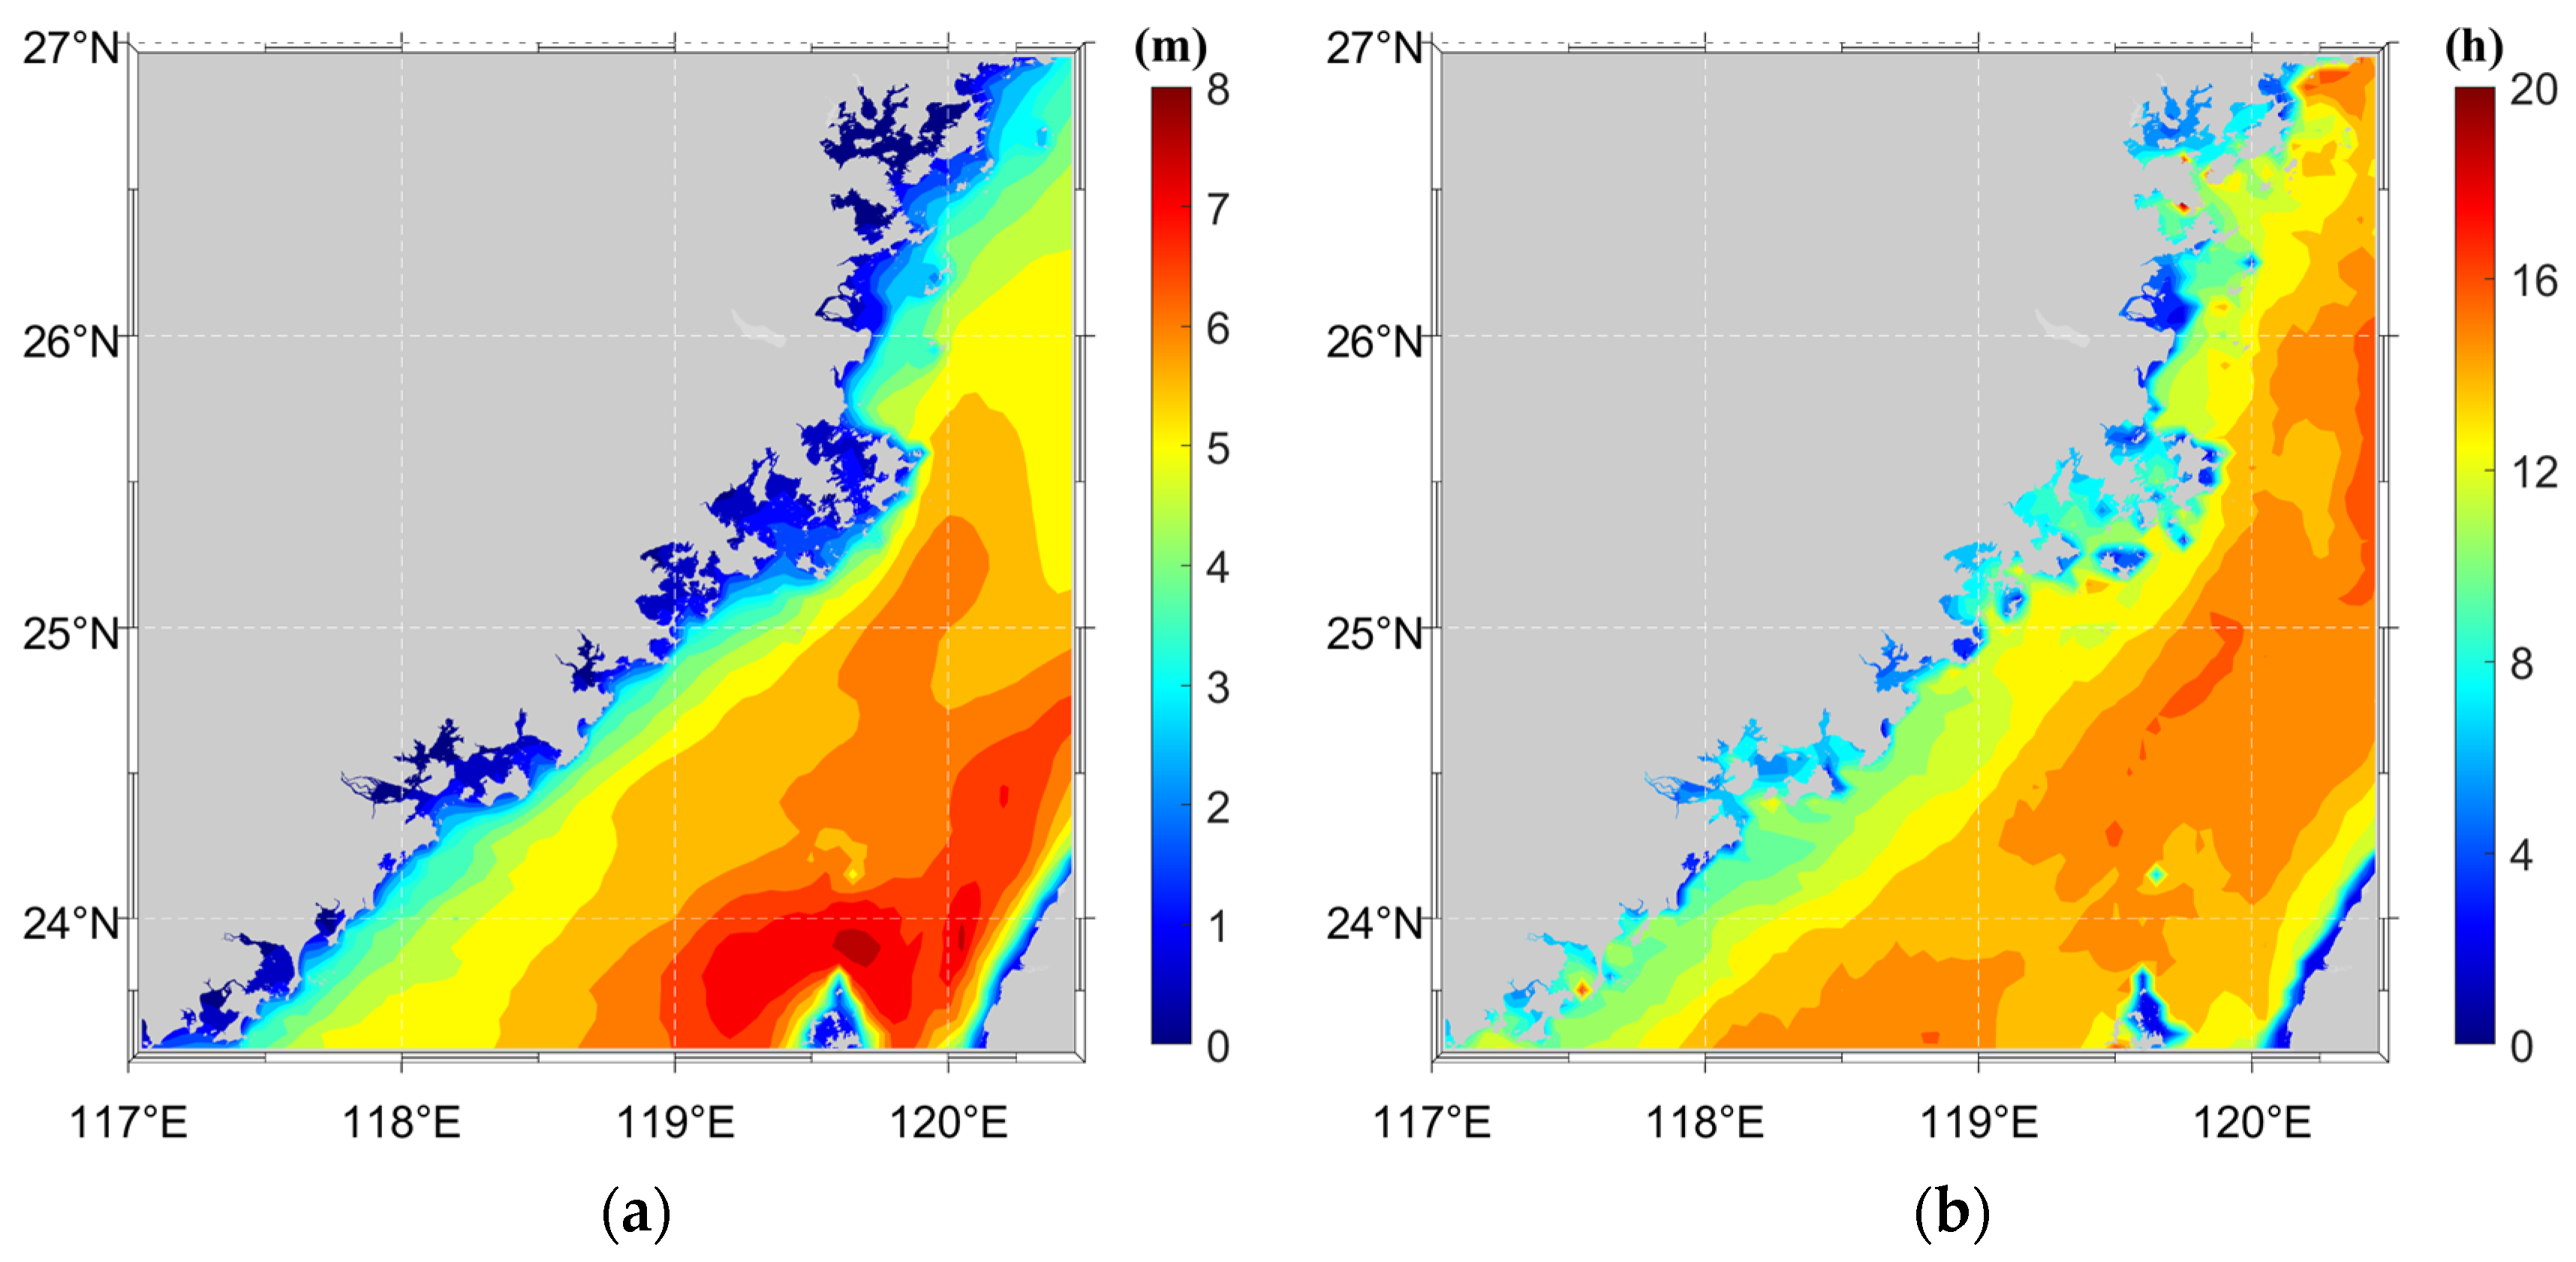
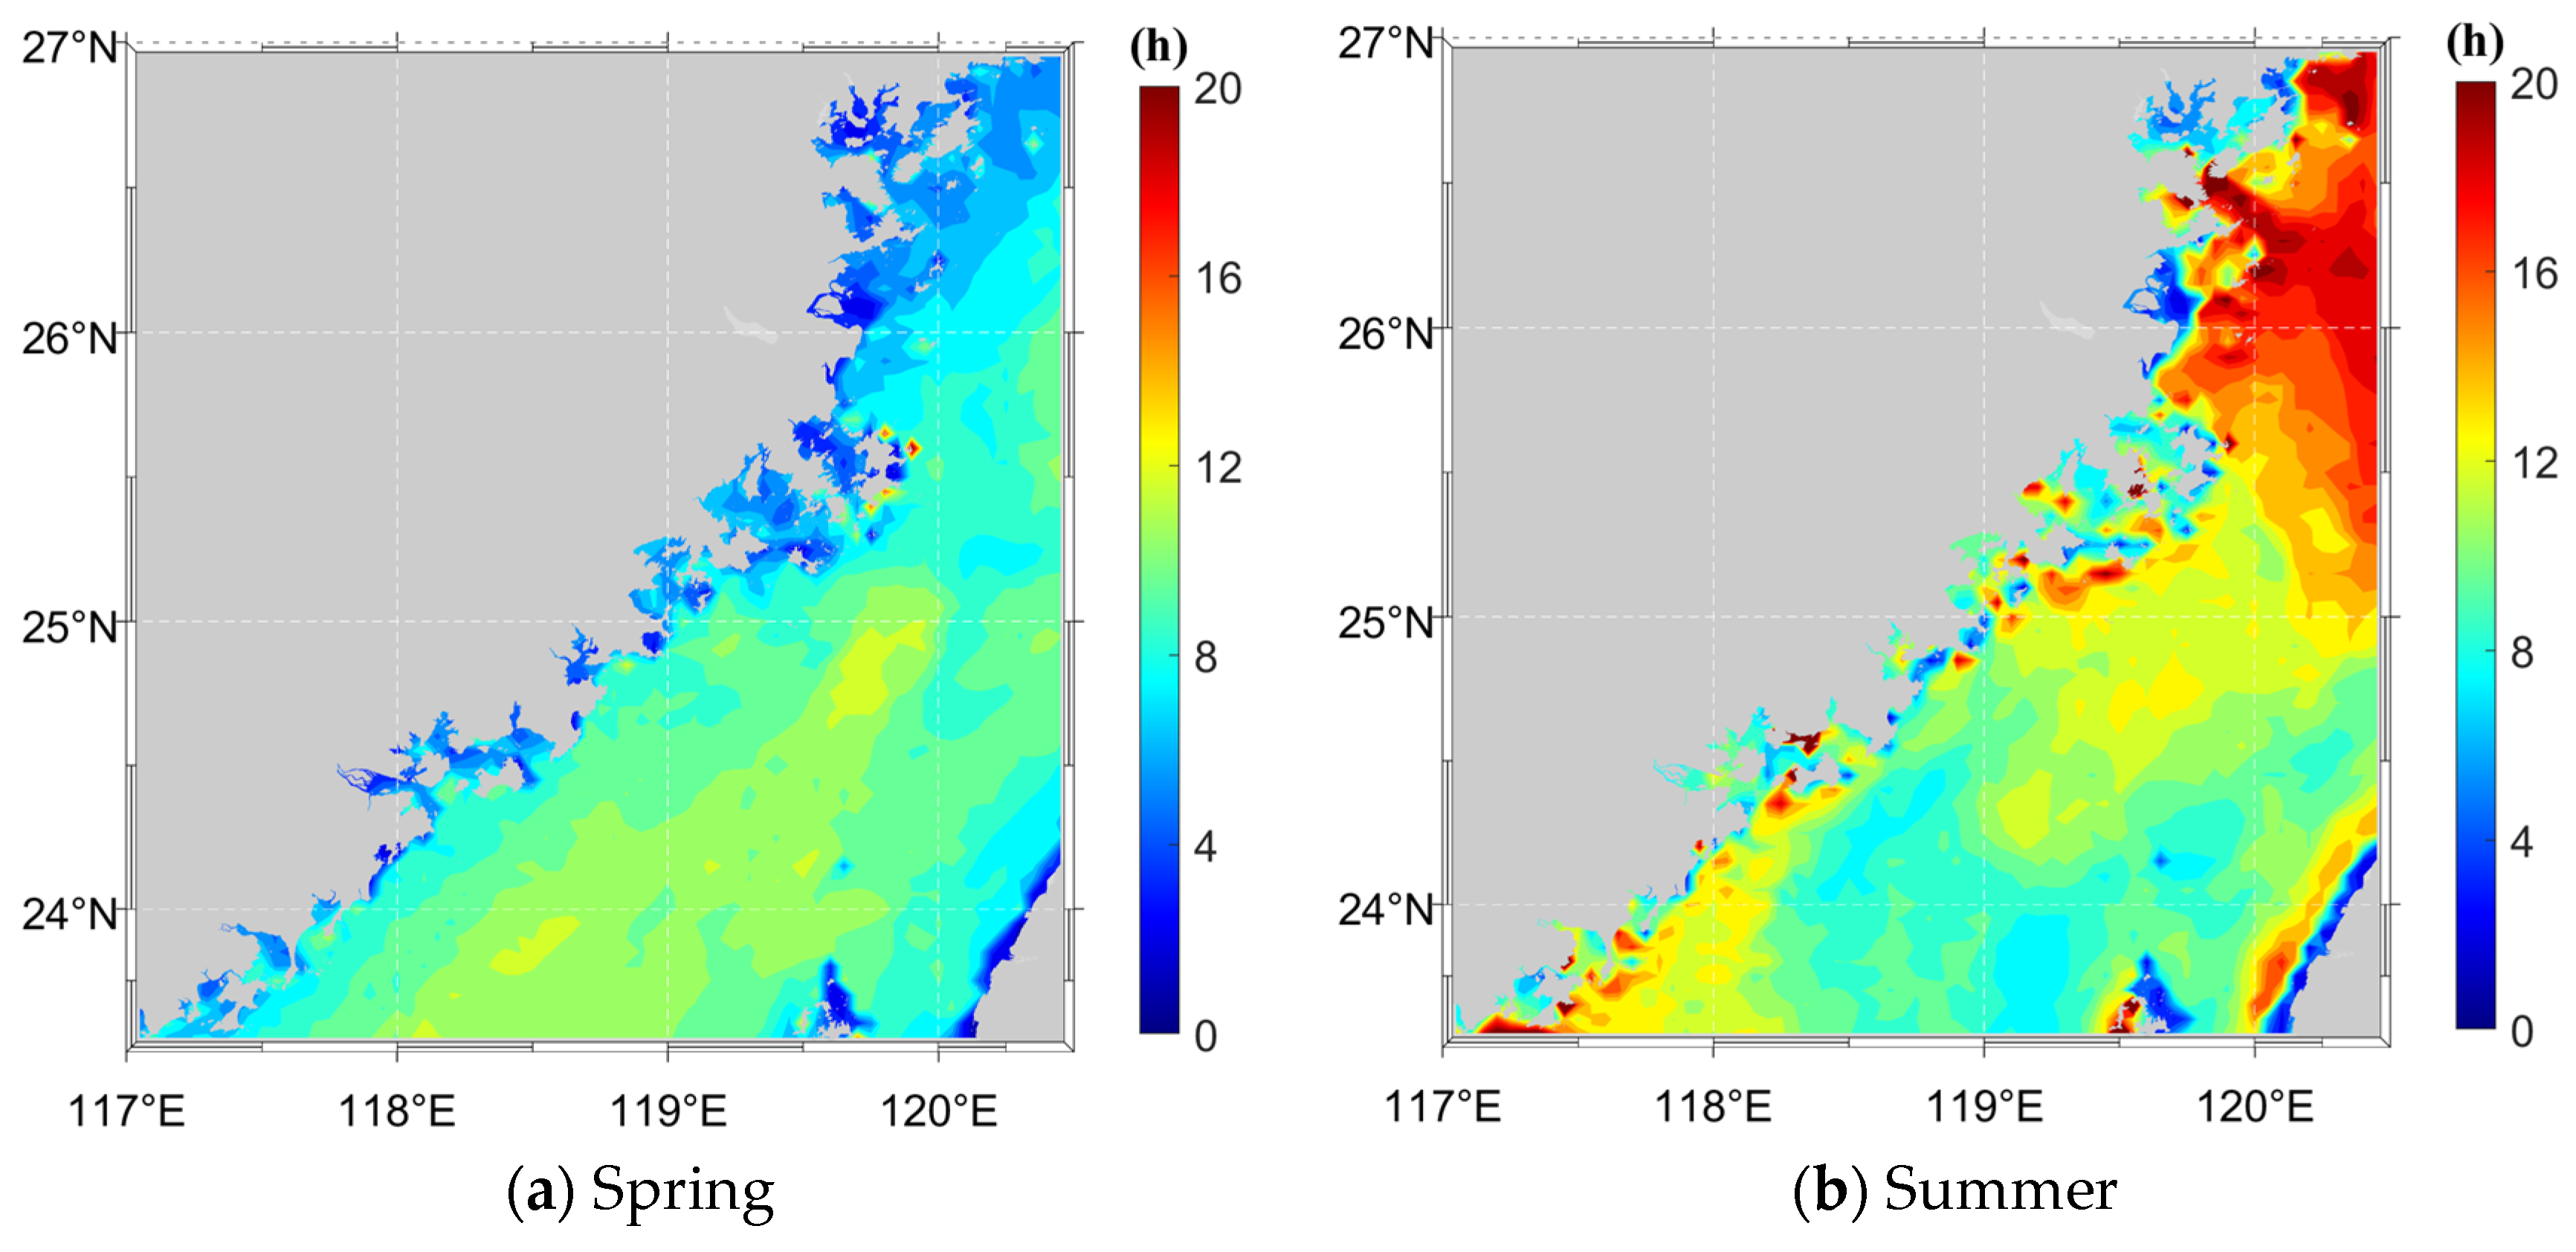
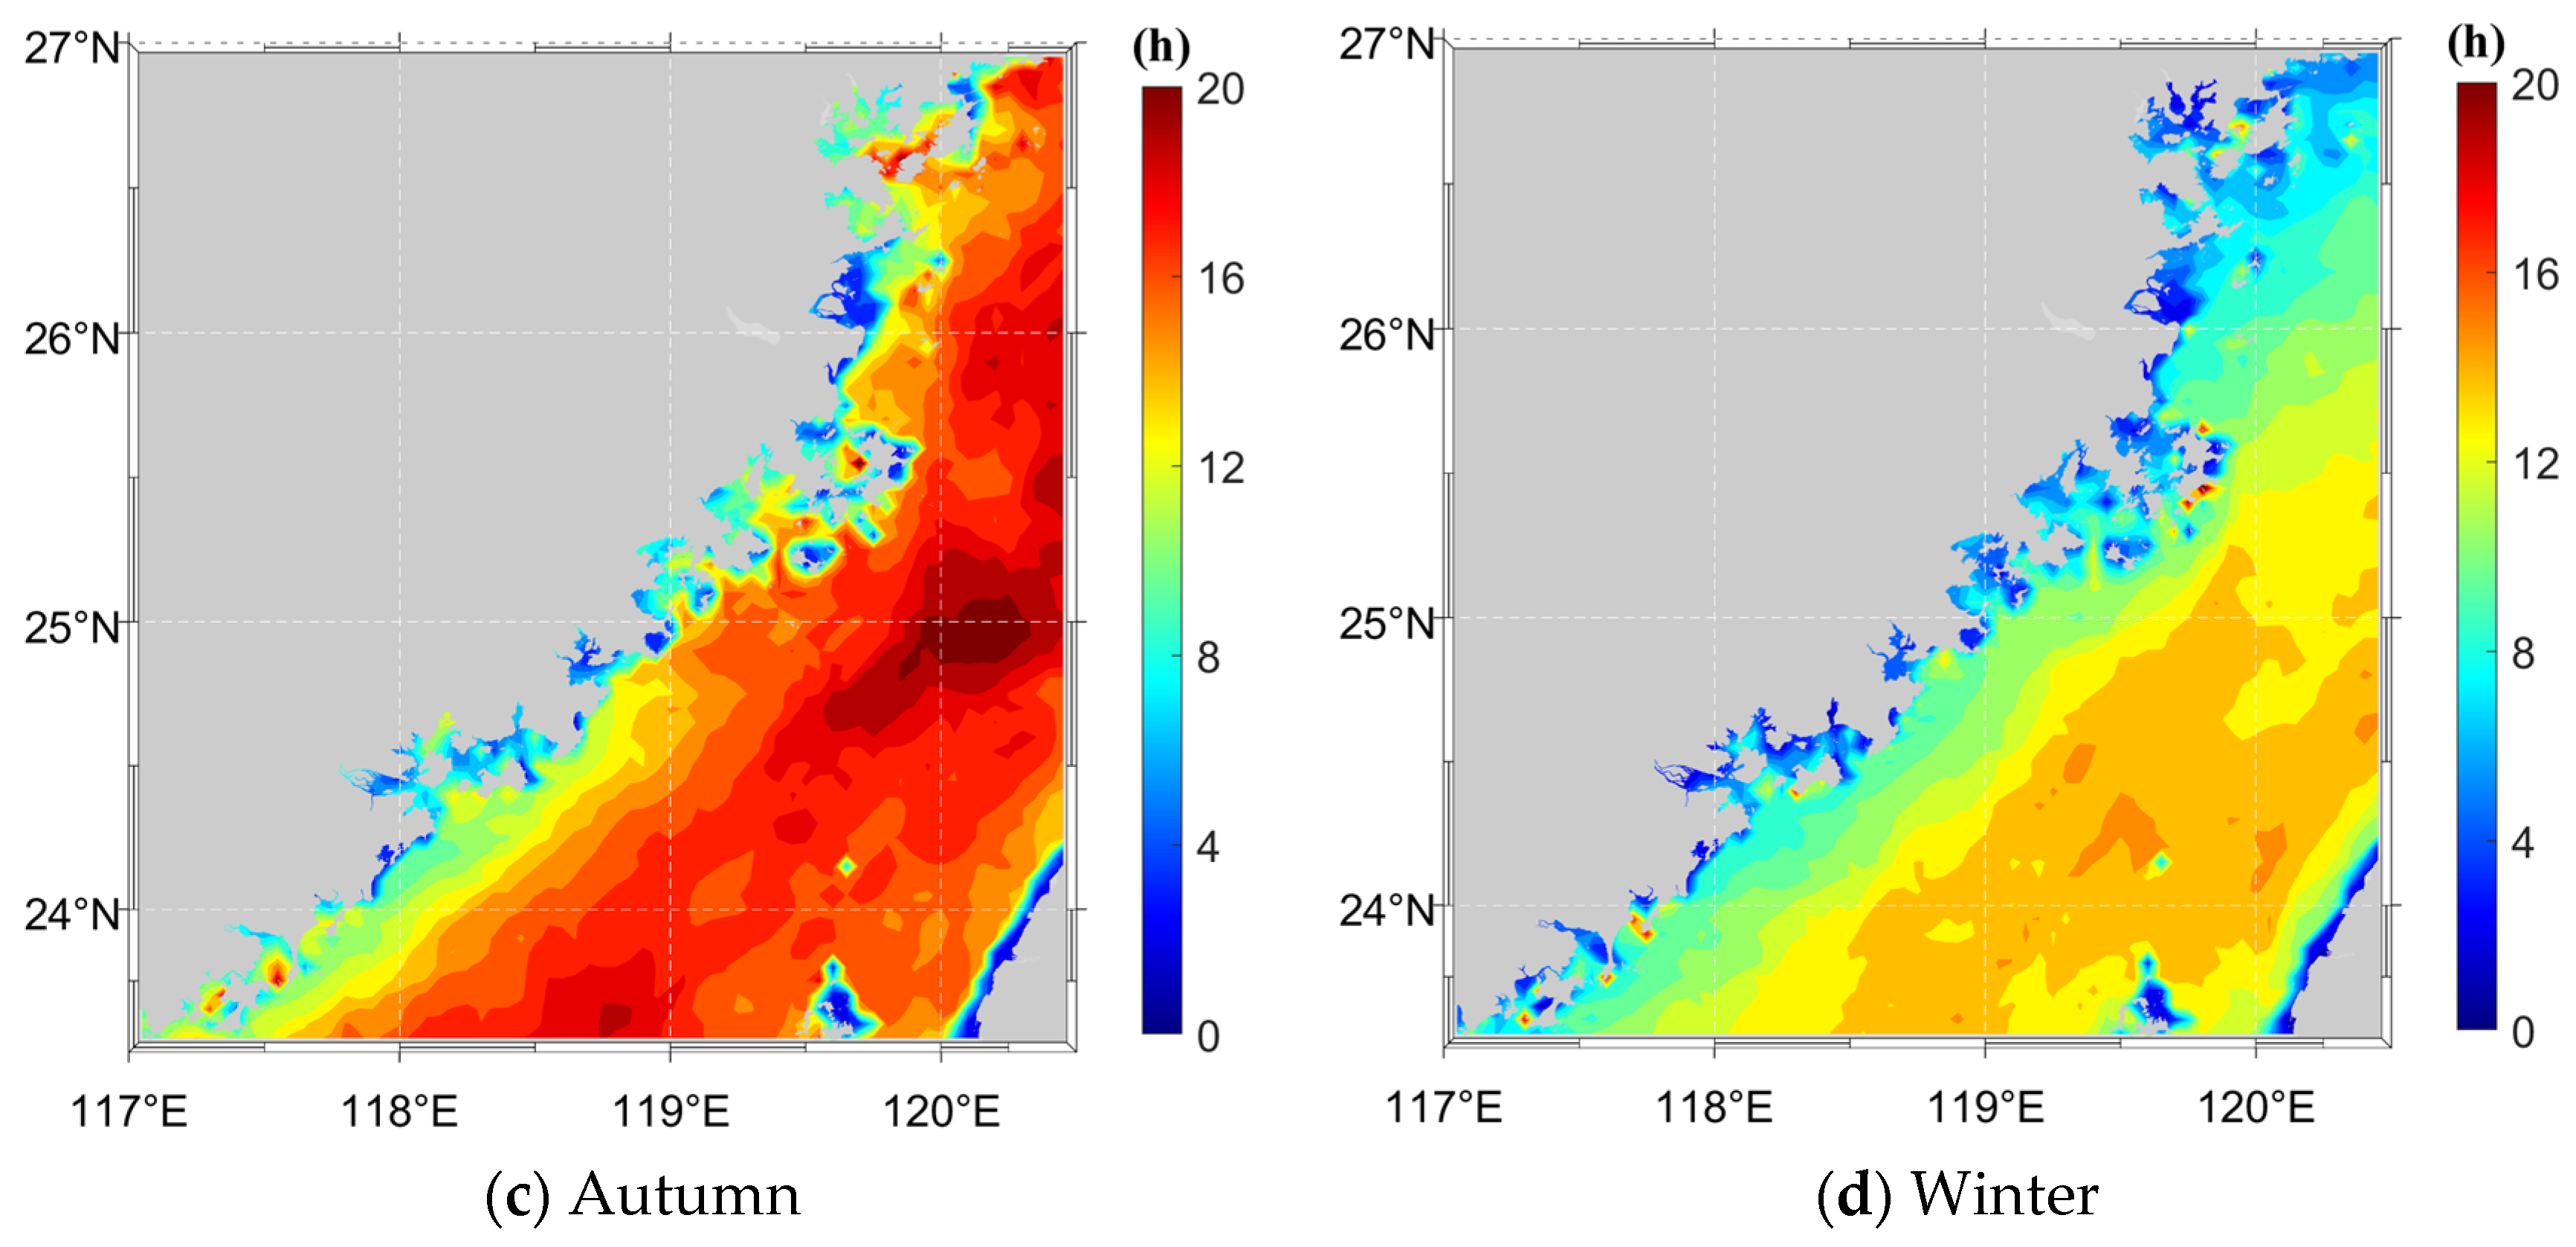
Figure 10 illustrates the spatial distribution characteristics of severe wave events in the Fujian sea area from 1980 to 2023. The distribution of severe wave height presents obvious spatial variability. The SET values are generally low in coastal shallow sea areas, mostly being below 3 m. With the increase in offshore distance, the SET value shows a stepwise increasing trend. This distribution pattern clearly indicates that when influenced by the energy convergence effect during wave propagation, severe wave height events are more likely to occur in offshore deep sea areas. In nearshore regions, wave energy is dissipated by bottom friction and wave breaking, which restricts the extreme wave height. Correspondingly, the spatial distribution of the mean duration of SET-exceeding events is similar to the distribution pattern of SET wave height. The duration in nearshore shallow sea is approximately 0–8 h, while in offshore areas with higher SET values, the duration gradually increases to more than 12 h.
Figure 11 shows the spatial distribution of the mean duration of SET-exceeding events in each season over the Fujian sea area from 1980 to 2023. The seasonal spatial distribution is similar to the annual overall distribution and exhibits distinct seasonal variations. The overall duration is relatively short in spring, with a gentle spatial difference. In summer, the mean duration increases slightly compared with spring, and the high-value area is concentrated in the northern Fujian sea area. Autumn corresponds to the peak period throughout the year. A large-scale high-value zone forms in the Taiwan Strait, where the duration exceeds 15 h. In winter, the coverage of high-value areas shrinks slightly compared with autumn, and the spatial gradient of the distribution becomes more pronounced.
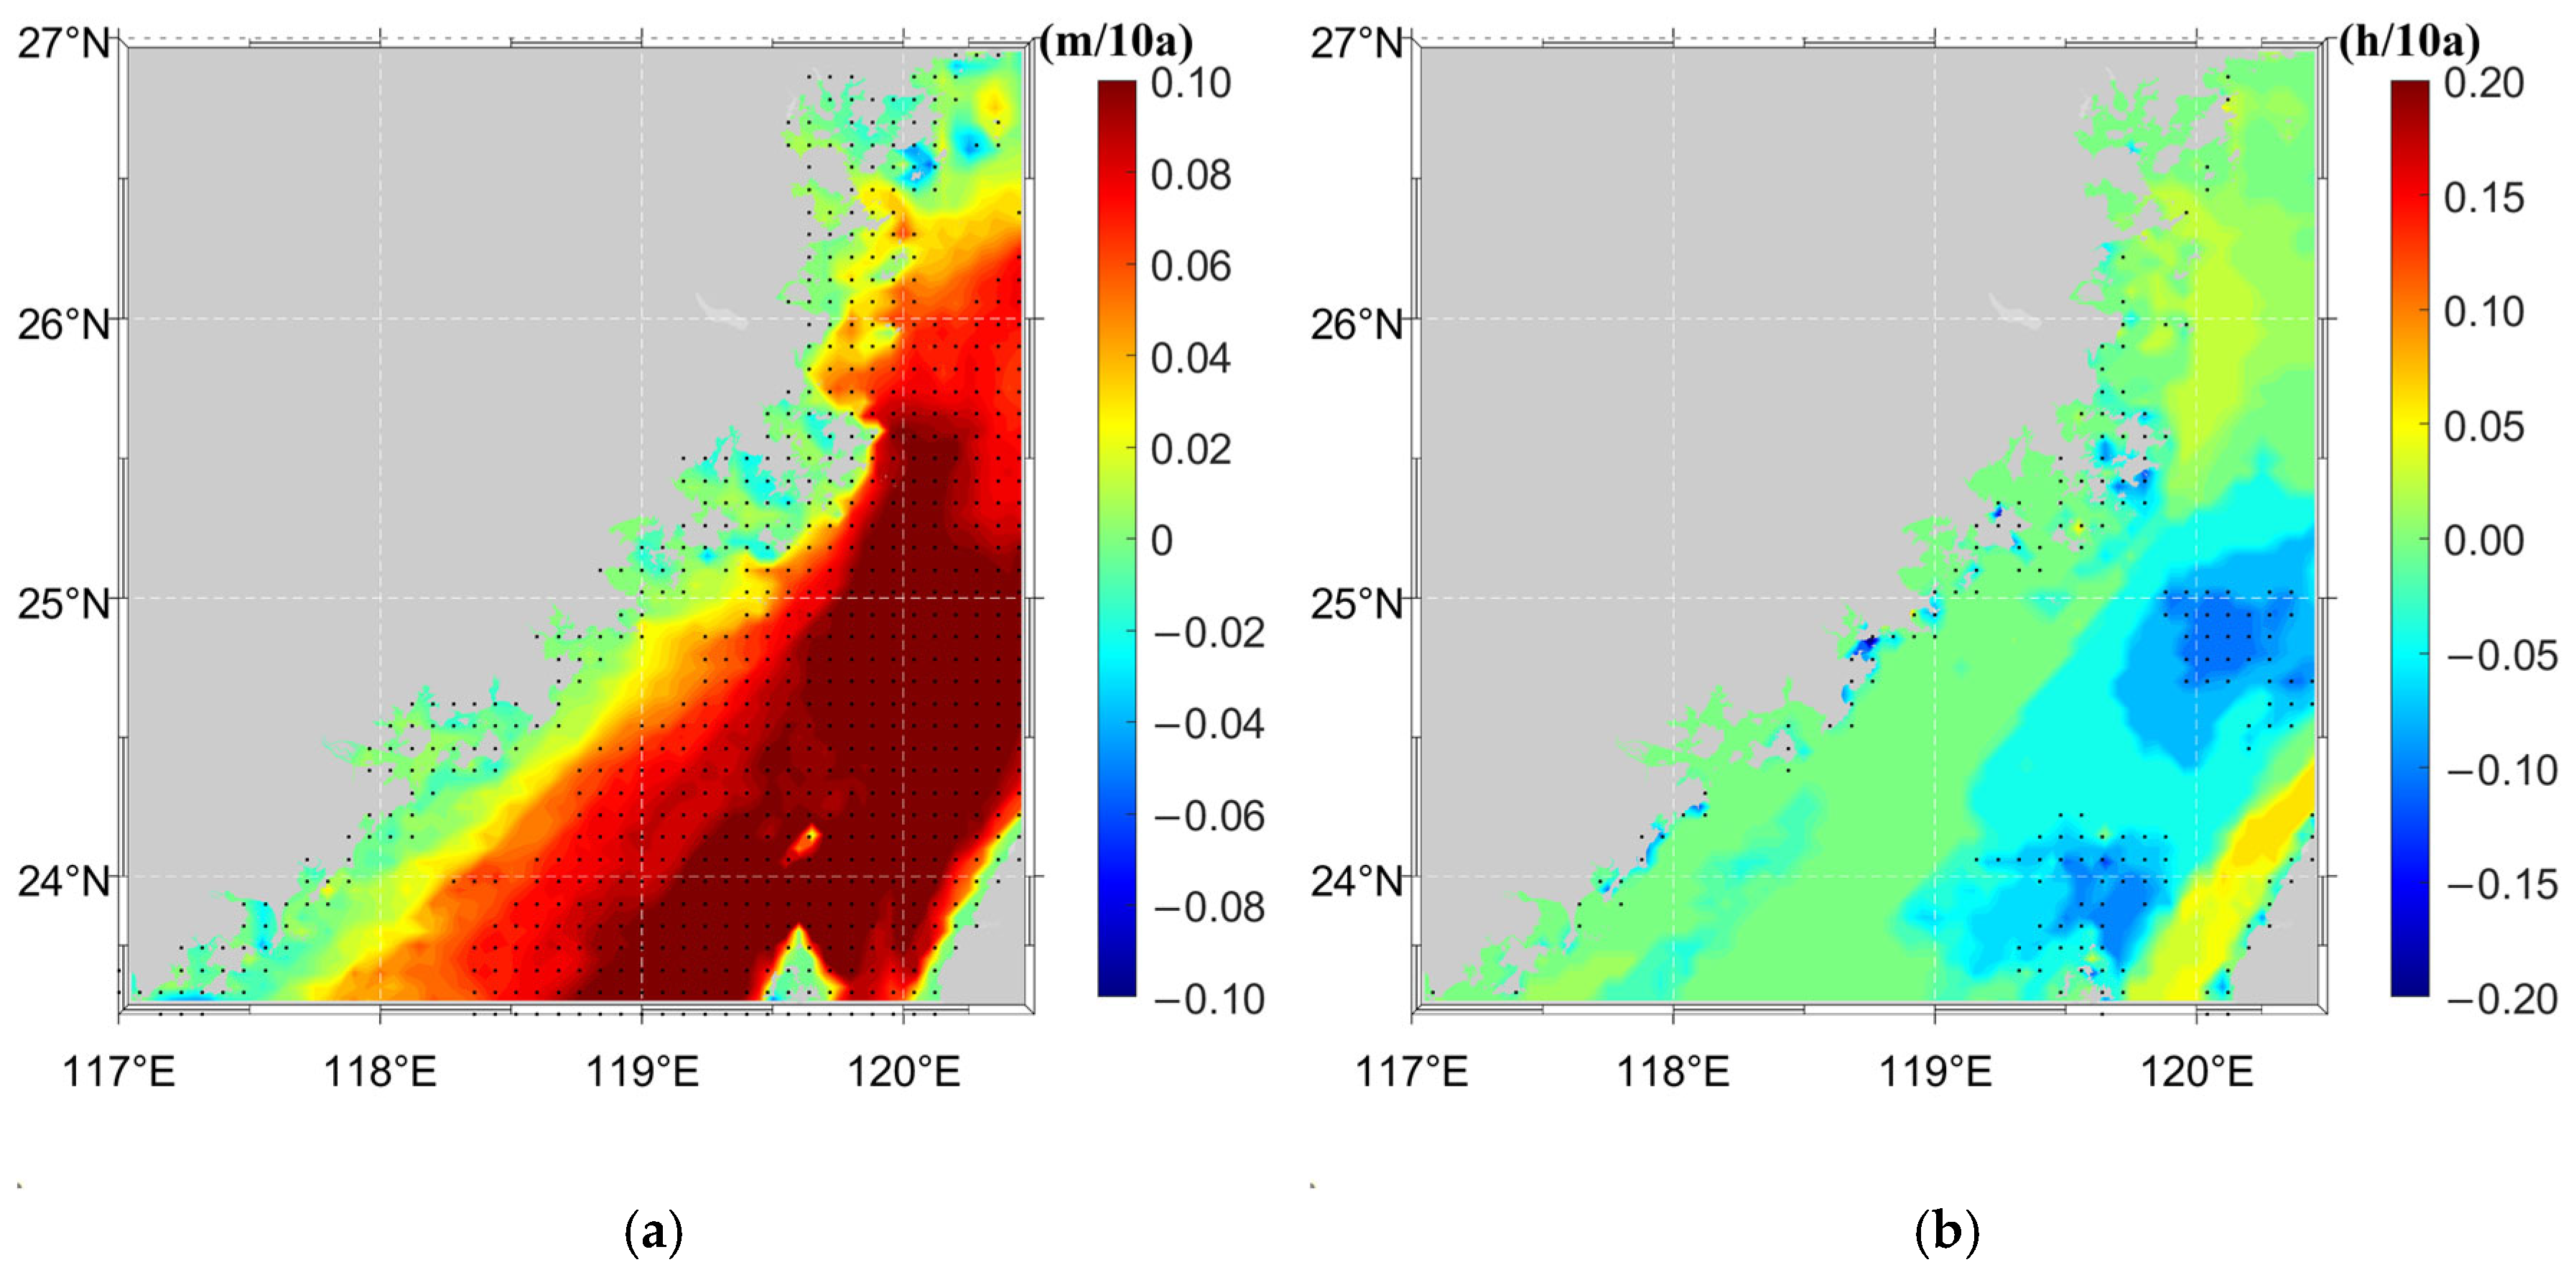
Trend analysis was performed using the method described in Section 2.4. Trend analysis was performed based on the 44-year hindcast dataset to obtain the spatial pattern of decadal variations in significant wave height (SWH) and the duration of waves exceeding the severe event threshold (SET) across the Fujian Sea area, as illustrated in Figure 12. Over the past 44 years, the SWH exceeding the SET generally shows an increasing trend throughout the study region, with the growth rate gradually rising from Fujian’s nearshore waters toward the central Taiwan Strait. The maximum rising rate reaches 0.10 m per decade in the offshore waters of the central–eastern strait, while only slight decreasing trends are detected in partial shallow nearshore zones. The interdecadal intensification of the East Asian winter monsoon and variations in tropical cyclone activities jointly drive the rise in regional significant wave height. In contrast, the evolution of SET-exceeding wave duration presents an obvious spatial discrepancy against the variation in wave height. The nearshore waters along the Fujian mainland witness a mild slow increase in extreme wave duration, whereas extensive areas in the central–eastern strait experience a remarkable reduction, with a maximum decline of 0.20 h per decade. Slightly pronounced increasing trends are only observed in a narrow strip along the northwestern coast of Taiwan and a small offshore zone off Ningde. Such contrasting patterns arise because the persistent mild winter wind waves elevate the average wave height, yet tropical cyclones pass through the strait at higher moving speeds with shorter residence time, shortening the sustained duration of consecutive extreme large waves. The spatial differentiation in long-term trends of the two wave parameters provides quantitative references regarding climate evolution for offshore engineering design and long-term coastal hazard prevention and mitigation.

4. Discussion

4.1. Wave Climate Features Across Different Water Depths

4.1.1. Feature Point Selection

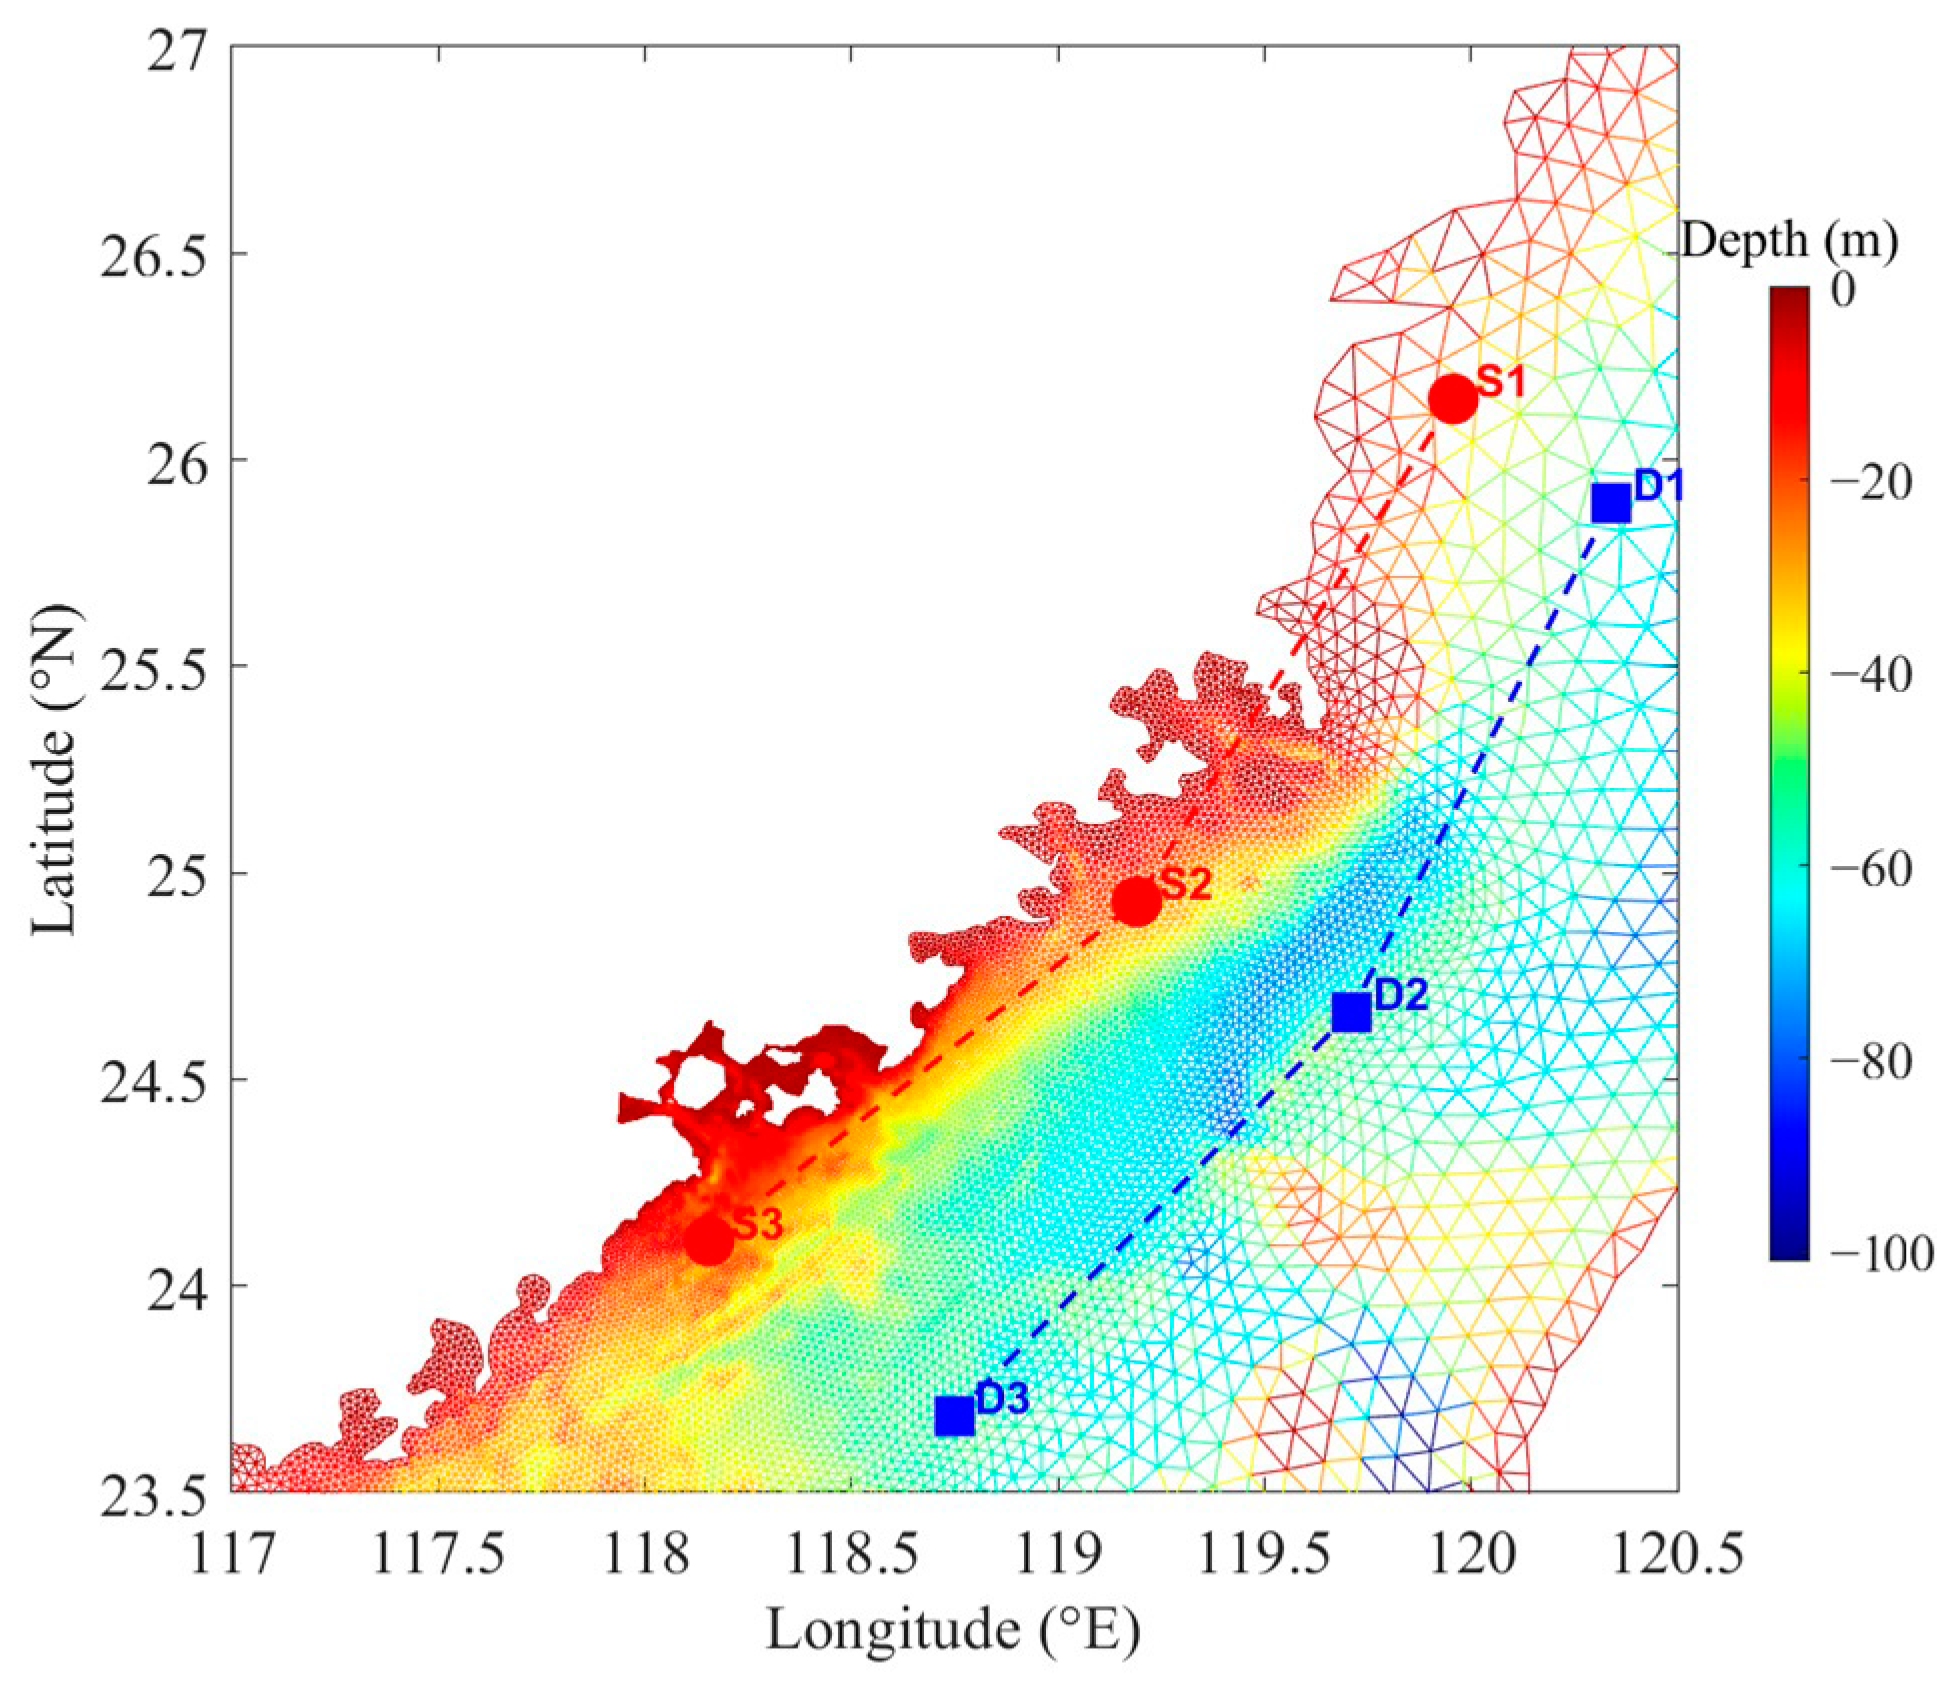
Considering the complex sea depth and topographic conditions in the Fujian sea area [46], sea depth exerts a significant influence on the spatial distributions of SWH and MP. In this study, six feature points are selected from north to south across the Fujian sea area, which are classified into two categories: nearshore shallow sea area (Series S) and deep sea area (Series D).
The specific locations of the sampling points are illustrated in Figure 13. Along the meridian direction, feature points are selected at equal intervals from 23.5° N to 27° N with a latitudinal interval of approximately 1°, which ensures that these points fully cover the main latitudinal range of the Fujian sea area. Meanwhile, water depth is also a critical factor affecting wave characteristics, and differences in water depth may interfere with the analytical results. Therefore, in the selection of feature points, the water depths of points within the same series are kept similar. The S-series points are located in the nearshore shallow sea area, with water depths ranging from 20 to 25 m and a maximum water depth difference of only about 2.45 m, which can accurately represent the wave characteristics of the Fujian nearshore sea area. The D-series points are distributed in the deep sea area, with water depths between 55 and 60 m, and can reflect the wave properties of the offshore deep sea region. The detailed information of the six feature points is summarized in Table 3. There are obvious water depth differences among the three types of sea area, which is conducive to investigating wave characteristics under different water depth conditions.

4.1.2. Analysis of Wave Climate with Different Feature Points

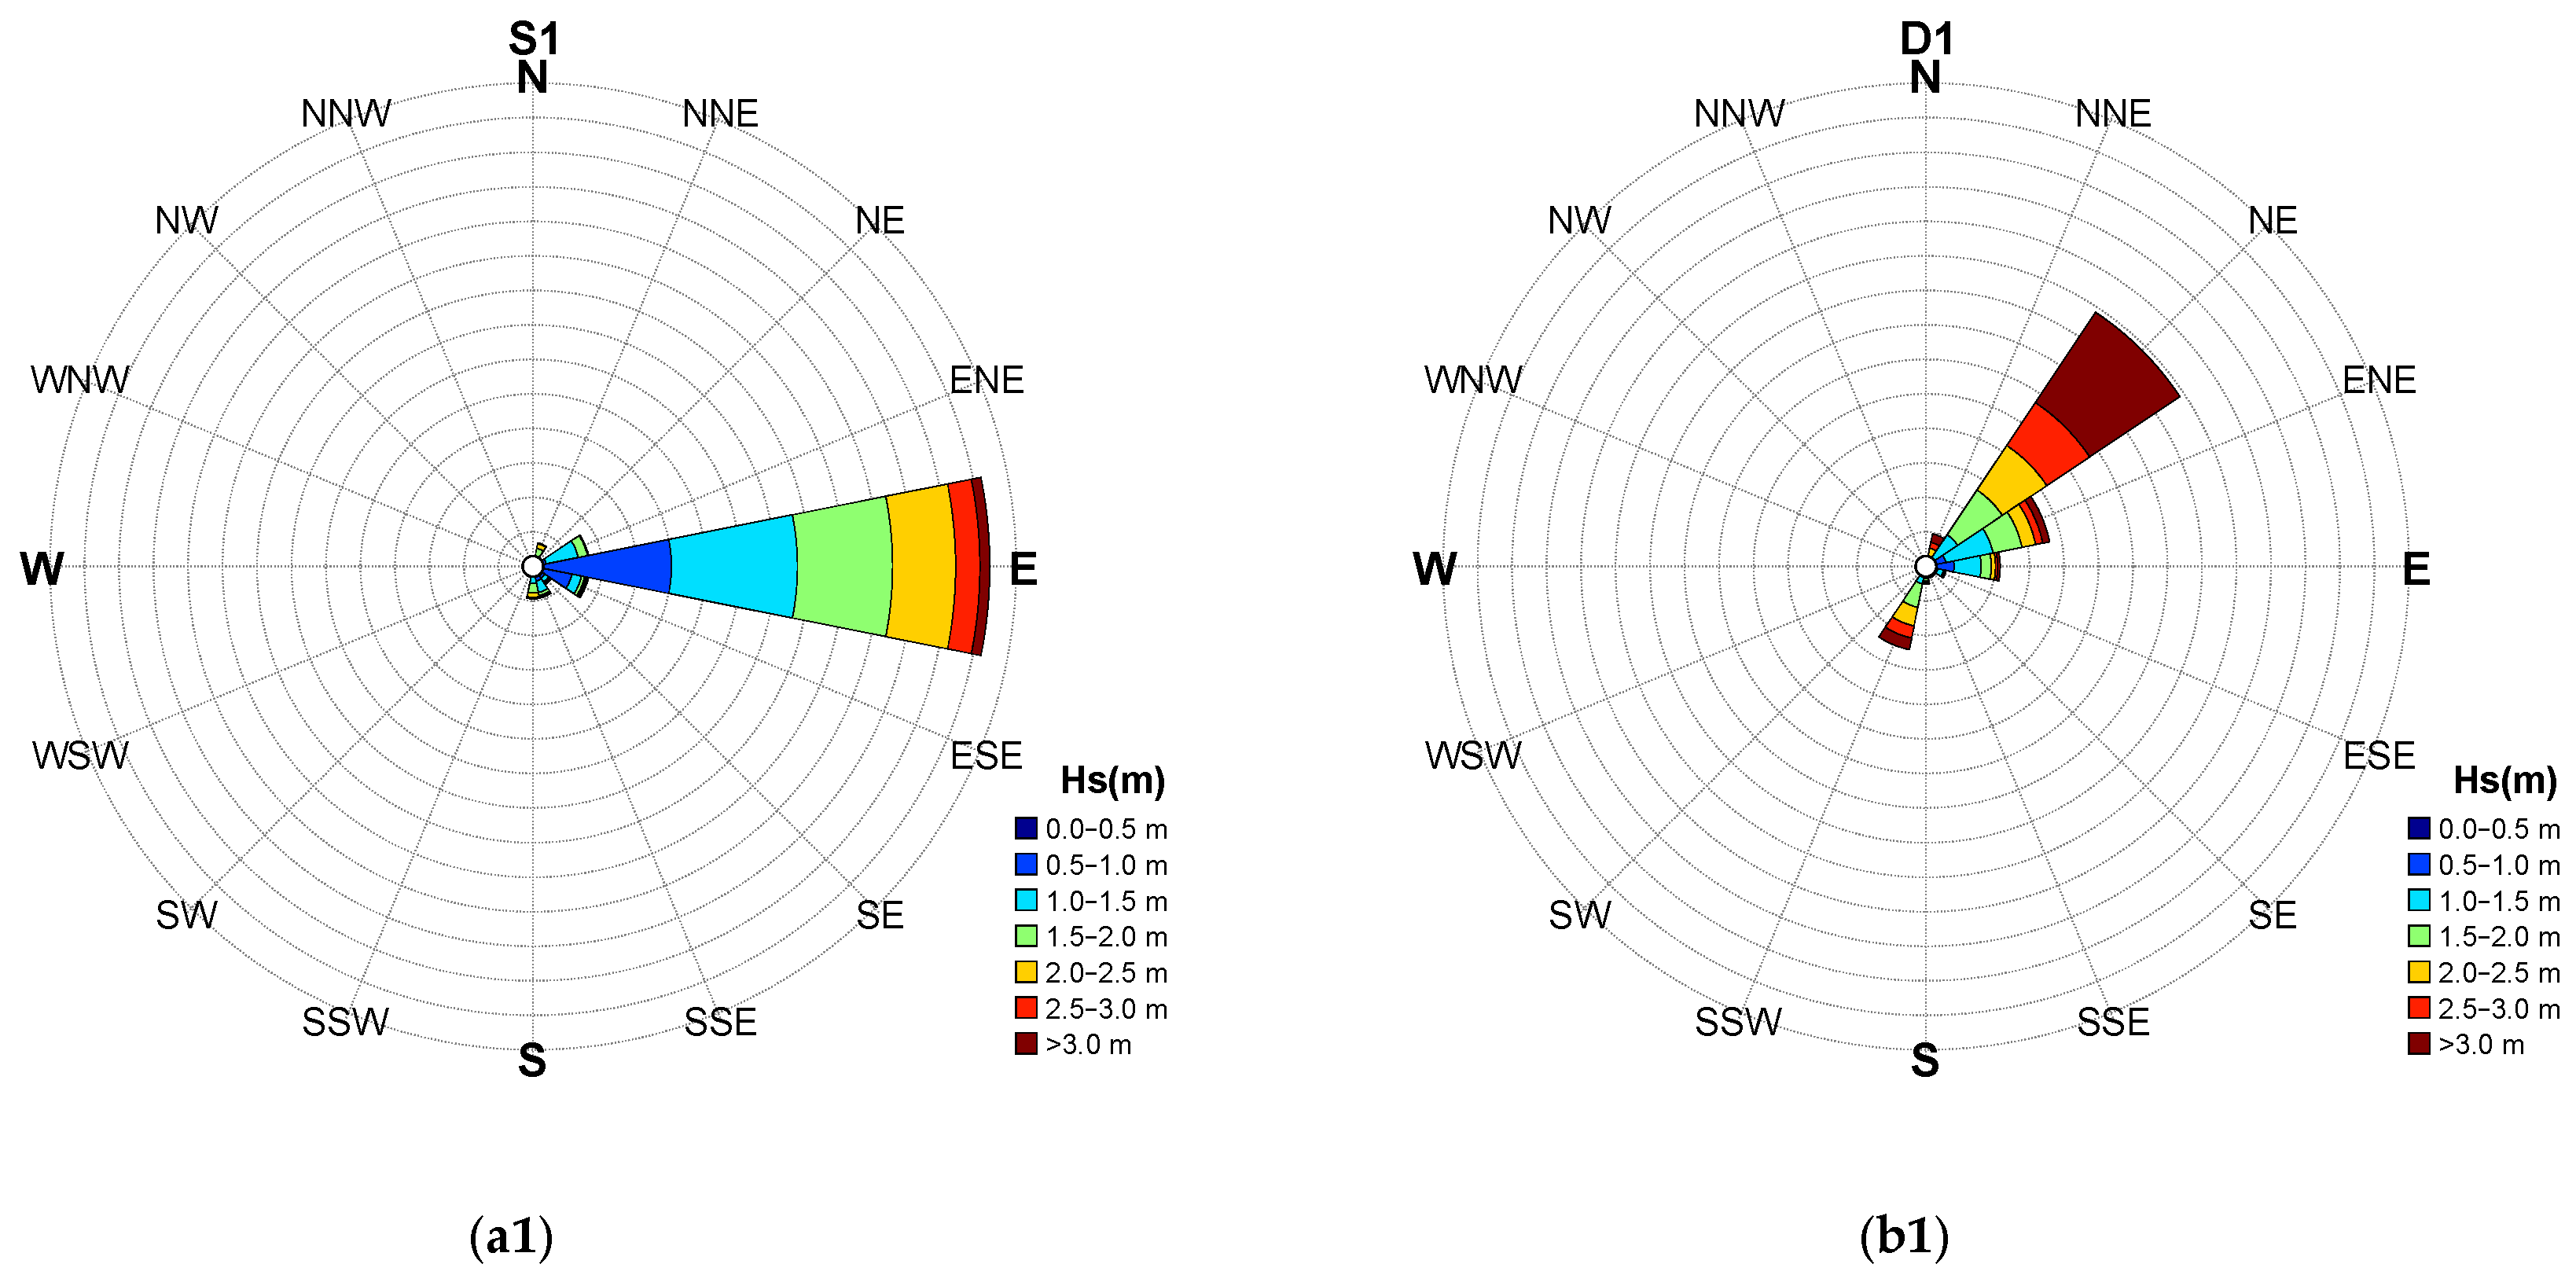
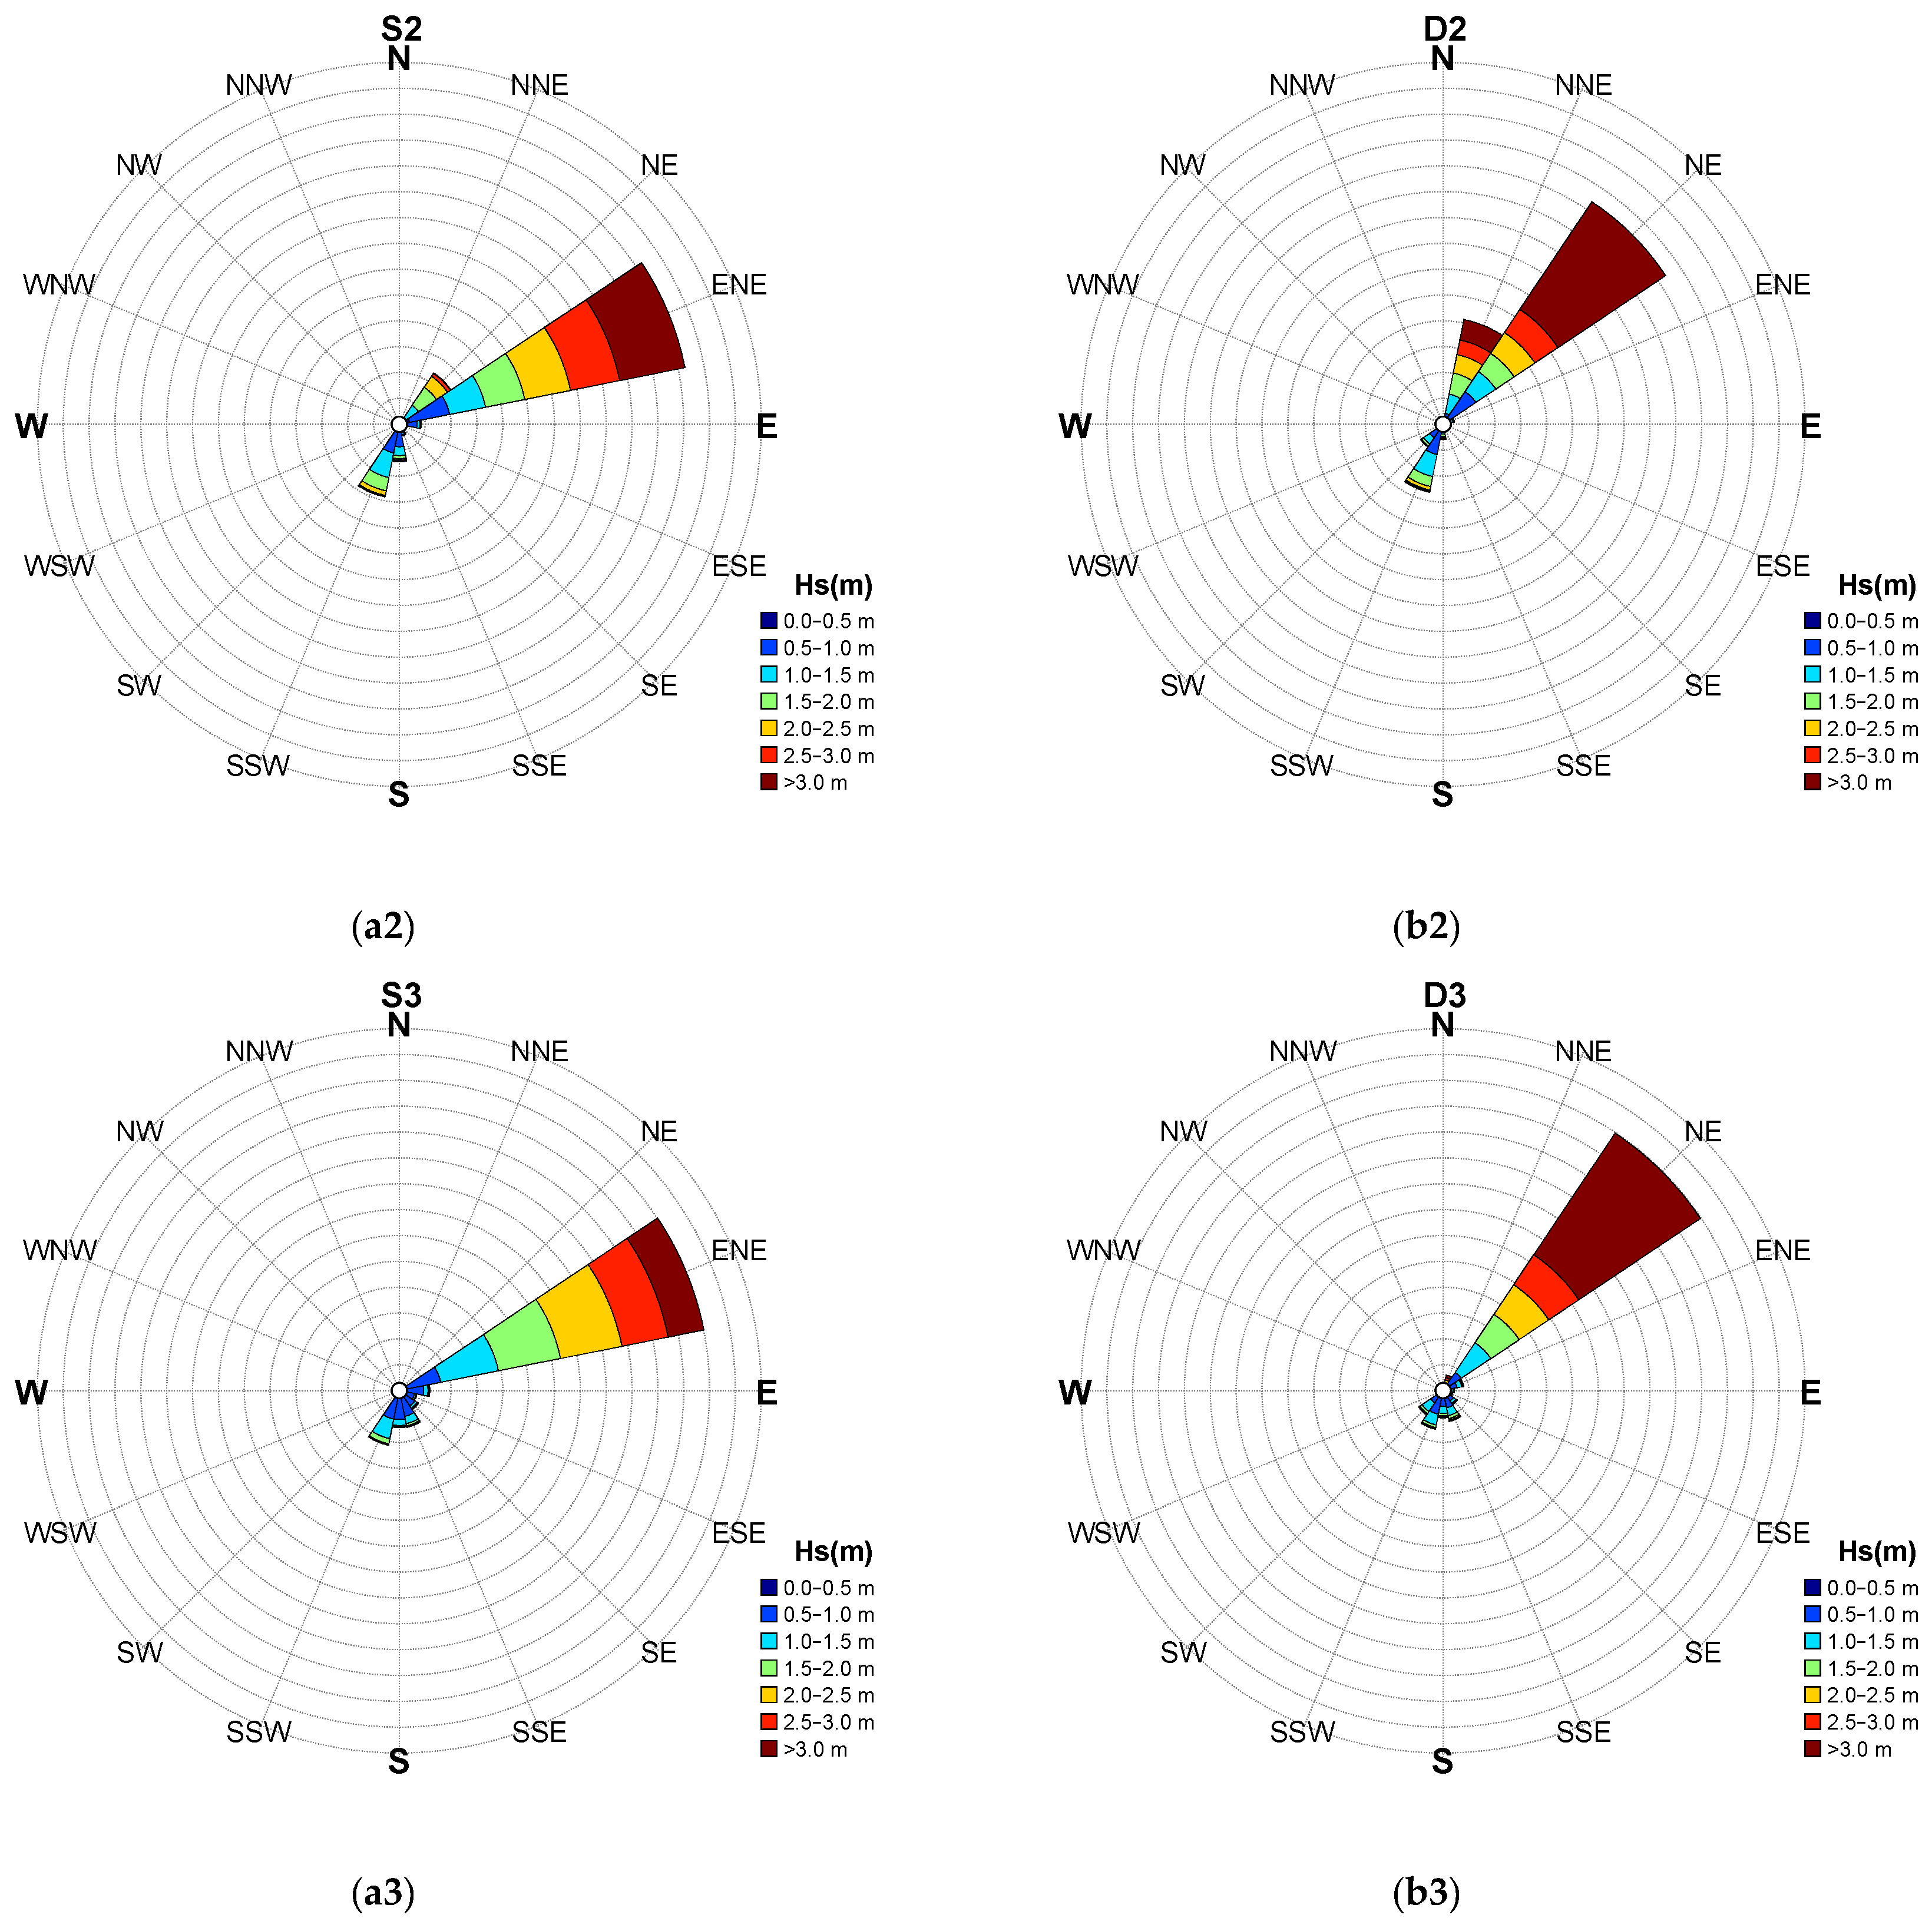
Figure 14 indicates that the wave distribution in the study area presents a prominent directional concentration. And significant differences exist between the nearshore shallow sea area (Series S) and the deep sea area (Series D).
Affected by topographic friction and the seabed boundary layer, the wave energy in shallow sea areas attenuates significantly [47,48], resulting in an overall smaller wave height and a low occurrence frequency of large waves. Among the S-series points, S1 is dominated by the east wave direction, with wave heights mostly concentrated in the range of 0.5–2.0 m, and it has the lowest proportion of large wave heights among the three nearshore shallow sea points. The dominant wave directions of S2 and S3 are mainly northeast by east, with a relatively uniform hierarchical distribution of wave heights, while the proportion of large wave heights remains low, reflecting the obvious weakening effect of nearshore areas on wave energy. In contrast, waves in deep sea areas experience less energy dissipation during propagation, with generally larger wave heights. The proportion of medium and large wave heights is remarkably higher than that at nearshore stations, and all deep sea stations are dominated by the northeast wave direction.
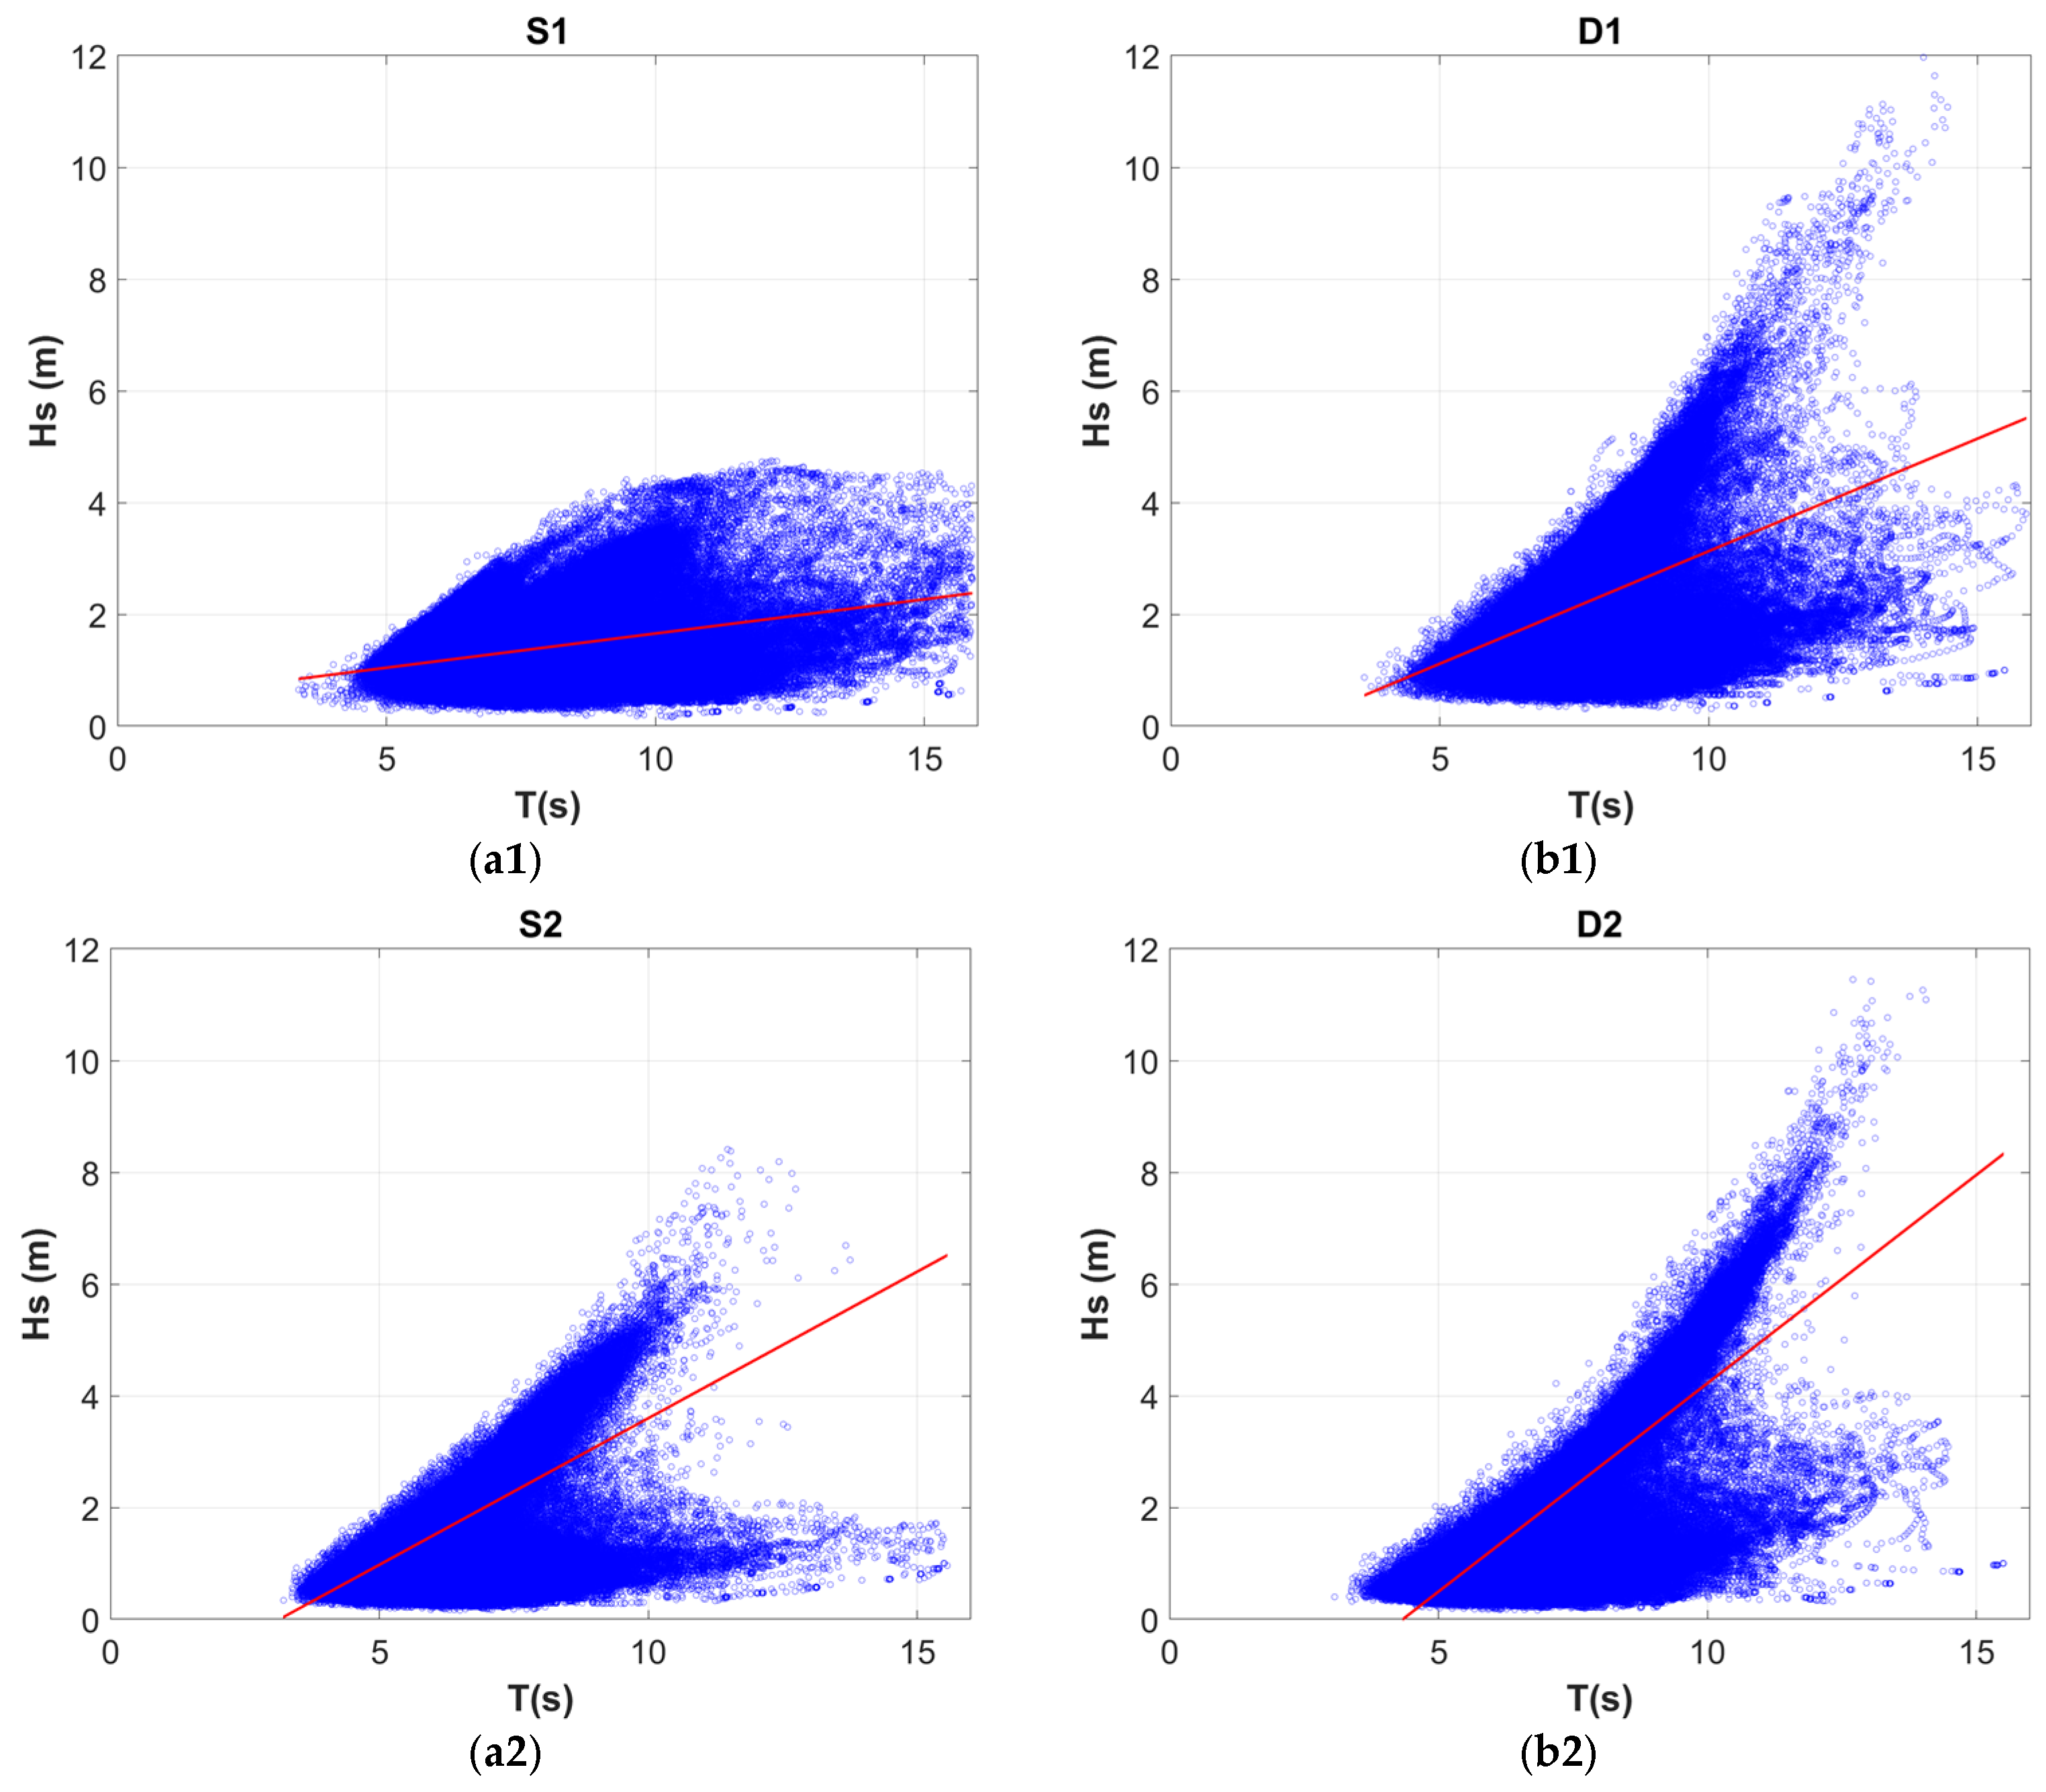
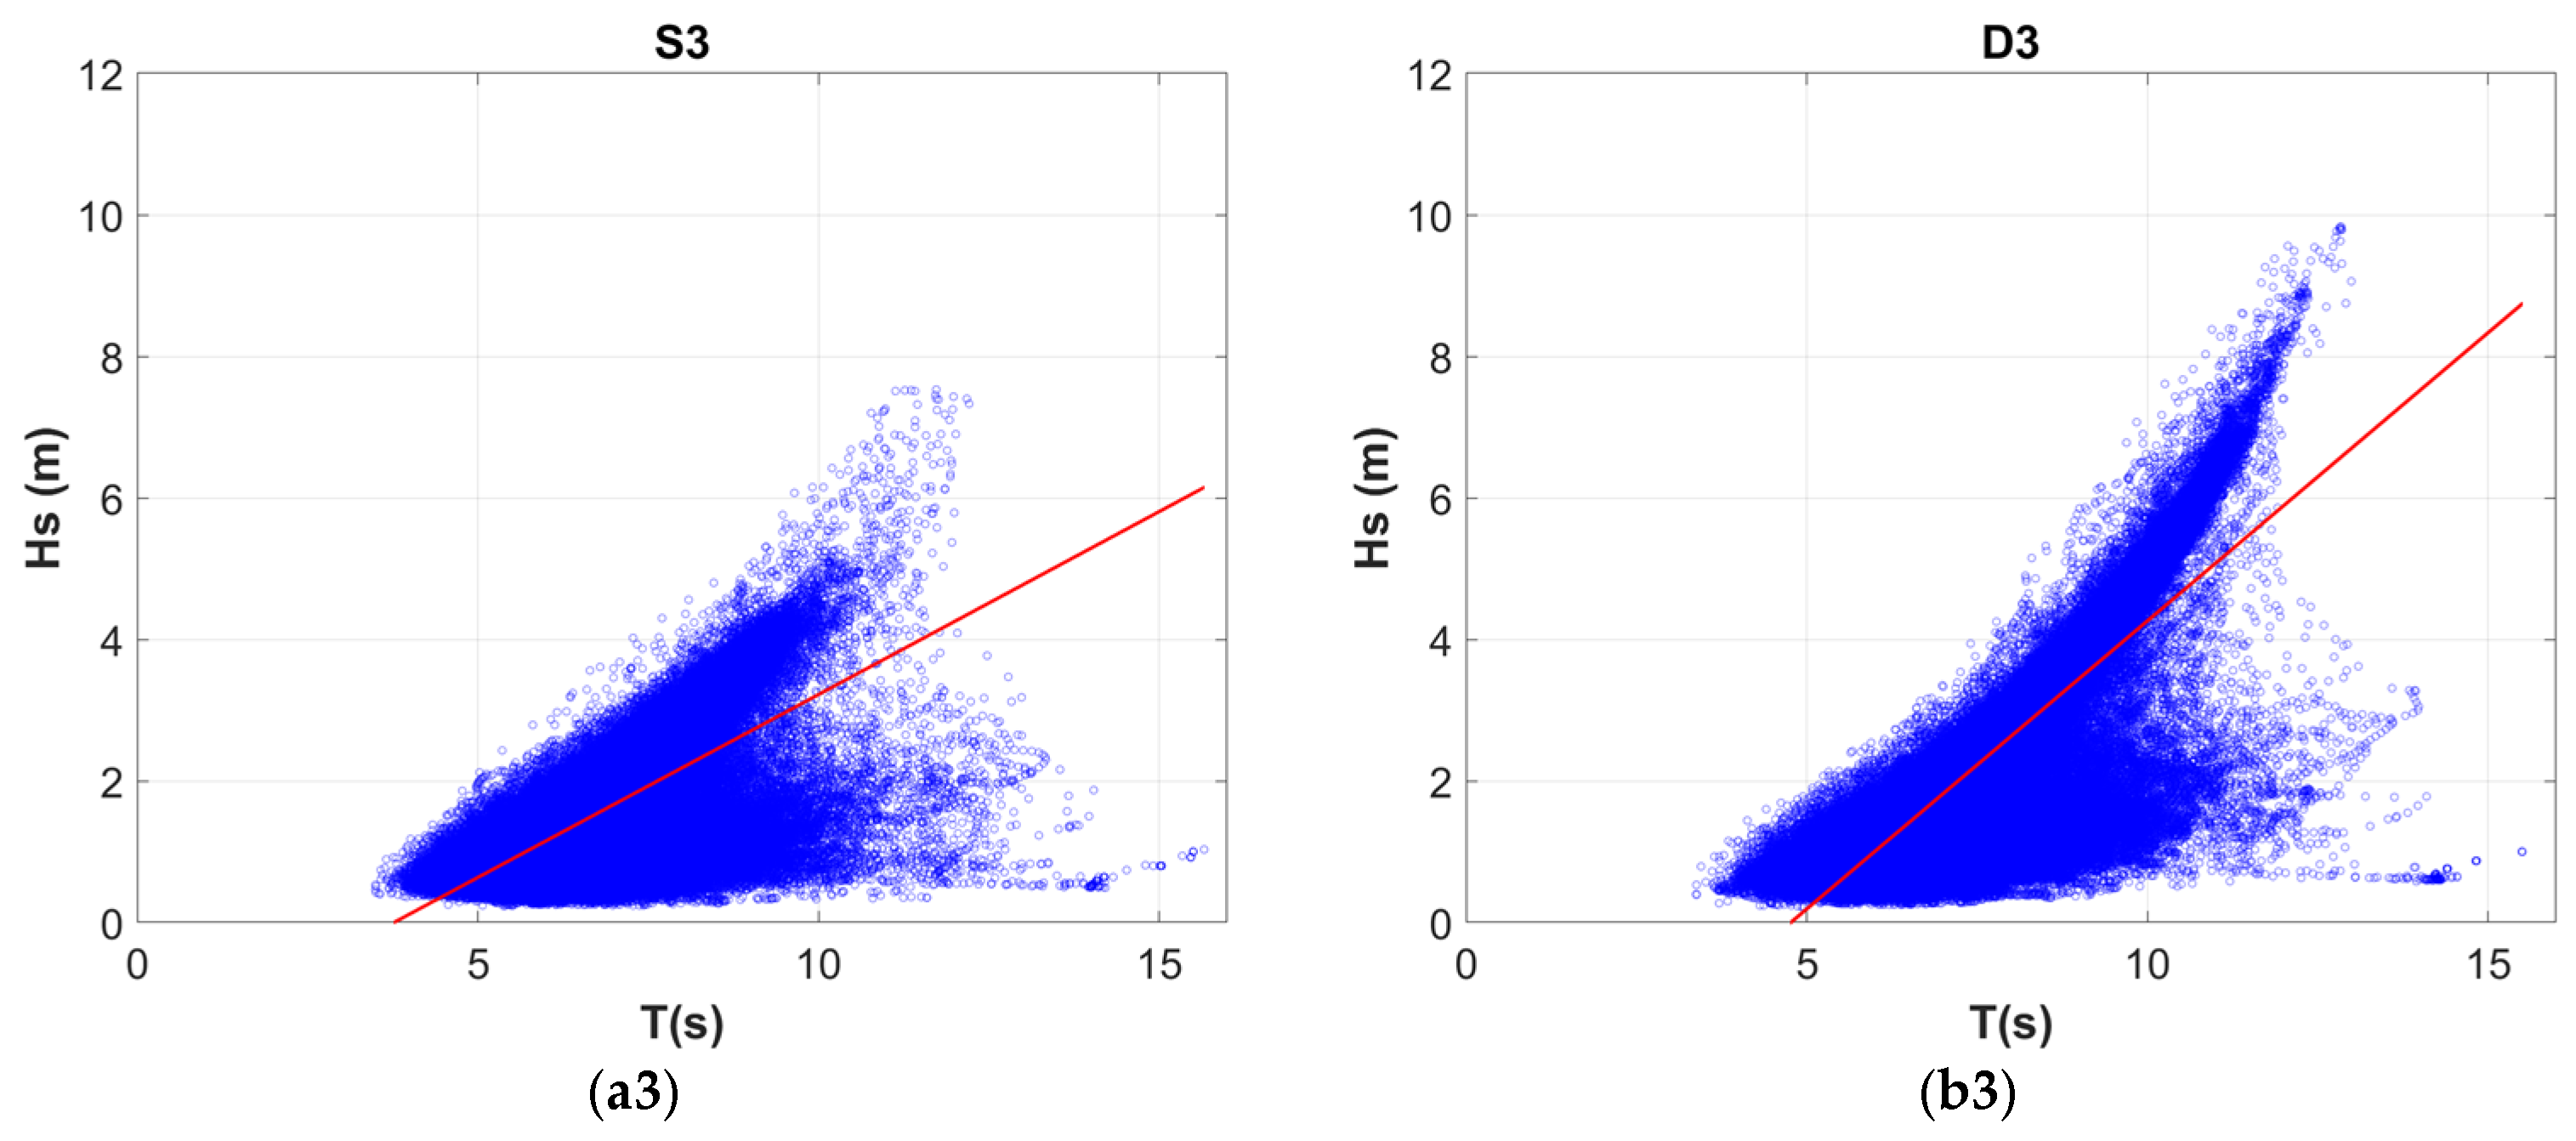
Figure 15 presents the scatter plot of the joint distribution of SWP and SWH at each feature point. In each subplot, hollow blue circles denote individual wave samples, and the solid red line shows the linear fitting trend of SWH versus wave period. The results show that a significant positive correlation exists between SWH and SWP in the study area. Obvious distribution differences can be observed between the S-series nearshore shallow sea points and the D-series deep sea points. Affected by nearshore topographic friction, the S-series points have a relatively low upper limit of wave height. The data points are mainly distributed in the low-to-moderate period ranges (approximately 3–8 s), and the data dispersion increases with the rise in wave period. This indicates that under the influence of shallow sea transformation and wave energy dissipation in inshore sea, the coupling relationship between wave period and wave height becomes more complex. For the D-series deep sea points, SWH exhibits a clearer linear correlation with significant wave period, and their overall upper limit of wave height is notably higher than that of nearshore points. Among them, point D1 has the maximum upper limit of wave height, and high wave heights are mainly concentrated in the medium and long period ranges, which reflects the typical wave characteristics under the combined action of wind waves and swells in the offshore sea area.
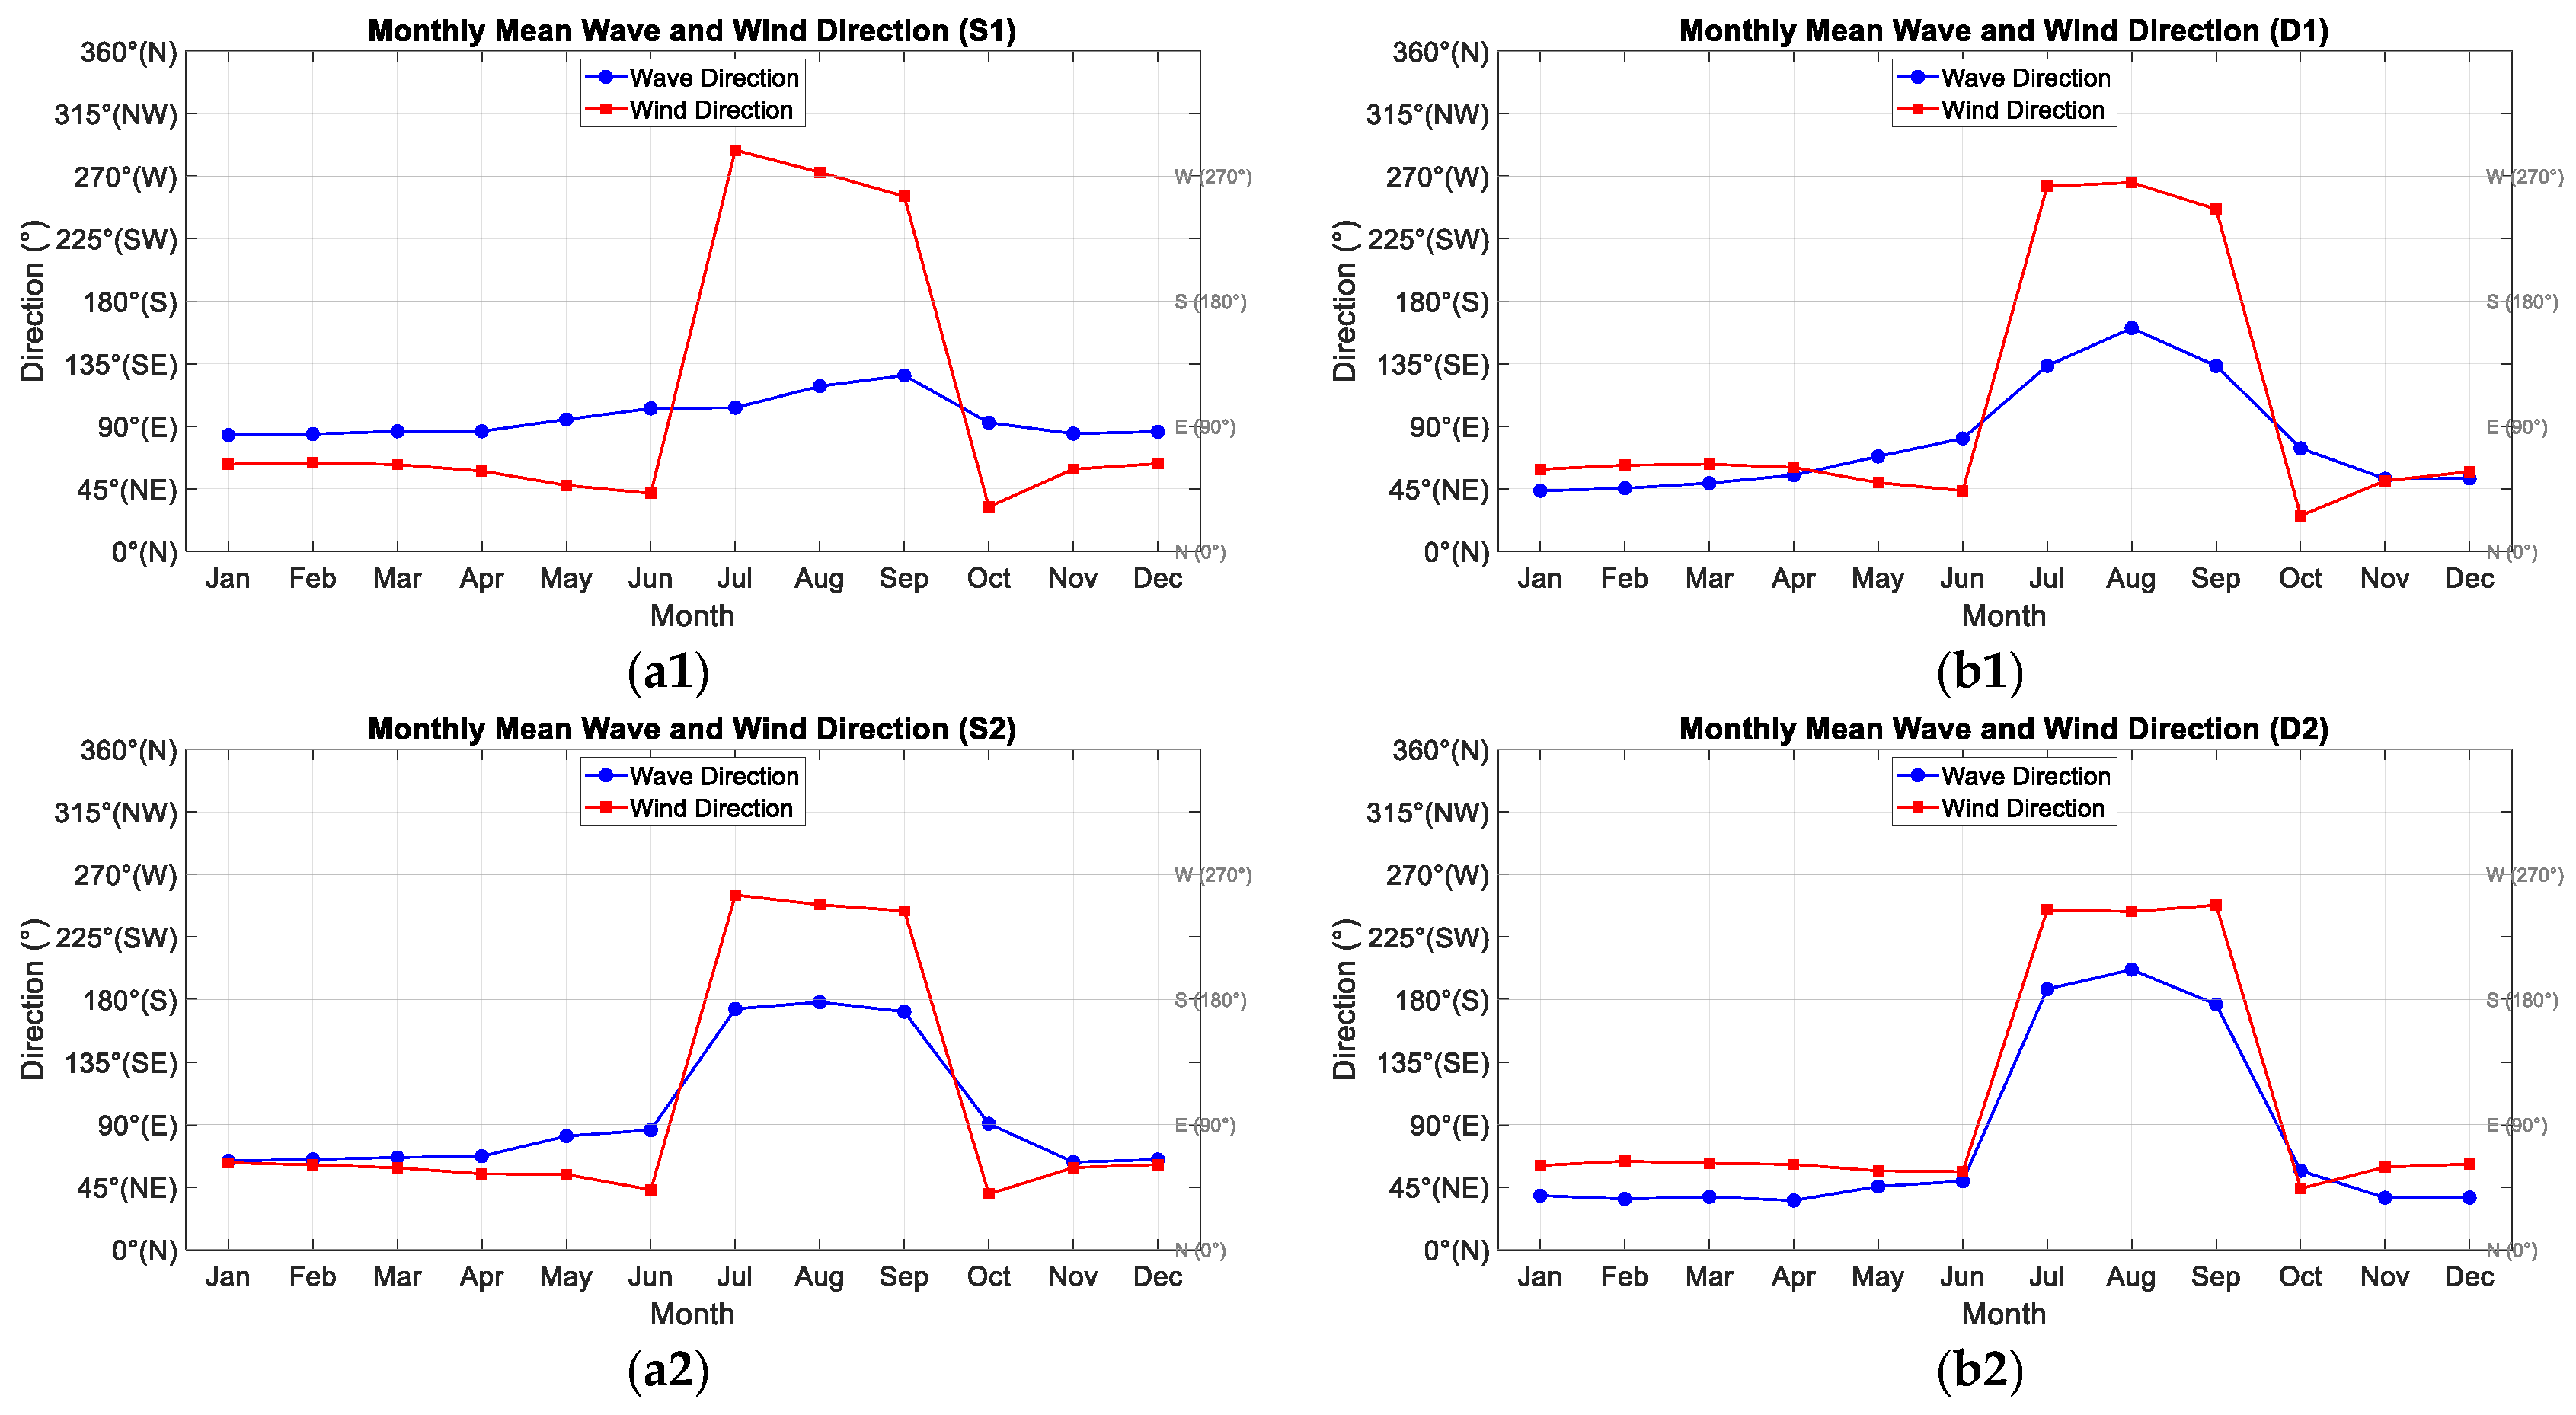
The wind and wave direction analysis in this subsection is based on monthly mean data from 2023. Seven typhoons affected Fujian waters during that year (equal to the climatological mean of seven), among which two made landfall (above the climatological mean of 1.7). Notably, Typhoon Doksuri made landfall on the Jinjiang coast of Fujian as a strong typhoon (45 m/s), ranking as the second strongest typhoon to make landfall in Fujian since 1949, while Typhoon Haikui also caused severe wind and rain impacts. Thus, 2023 serves as a year with active and intense typhoon activity, allowing for a representative examination of directional characteristics under both summer typhoon-dominated and winter monsoon-dominated regimes.
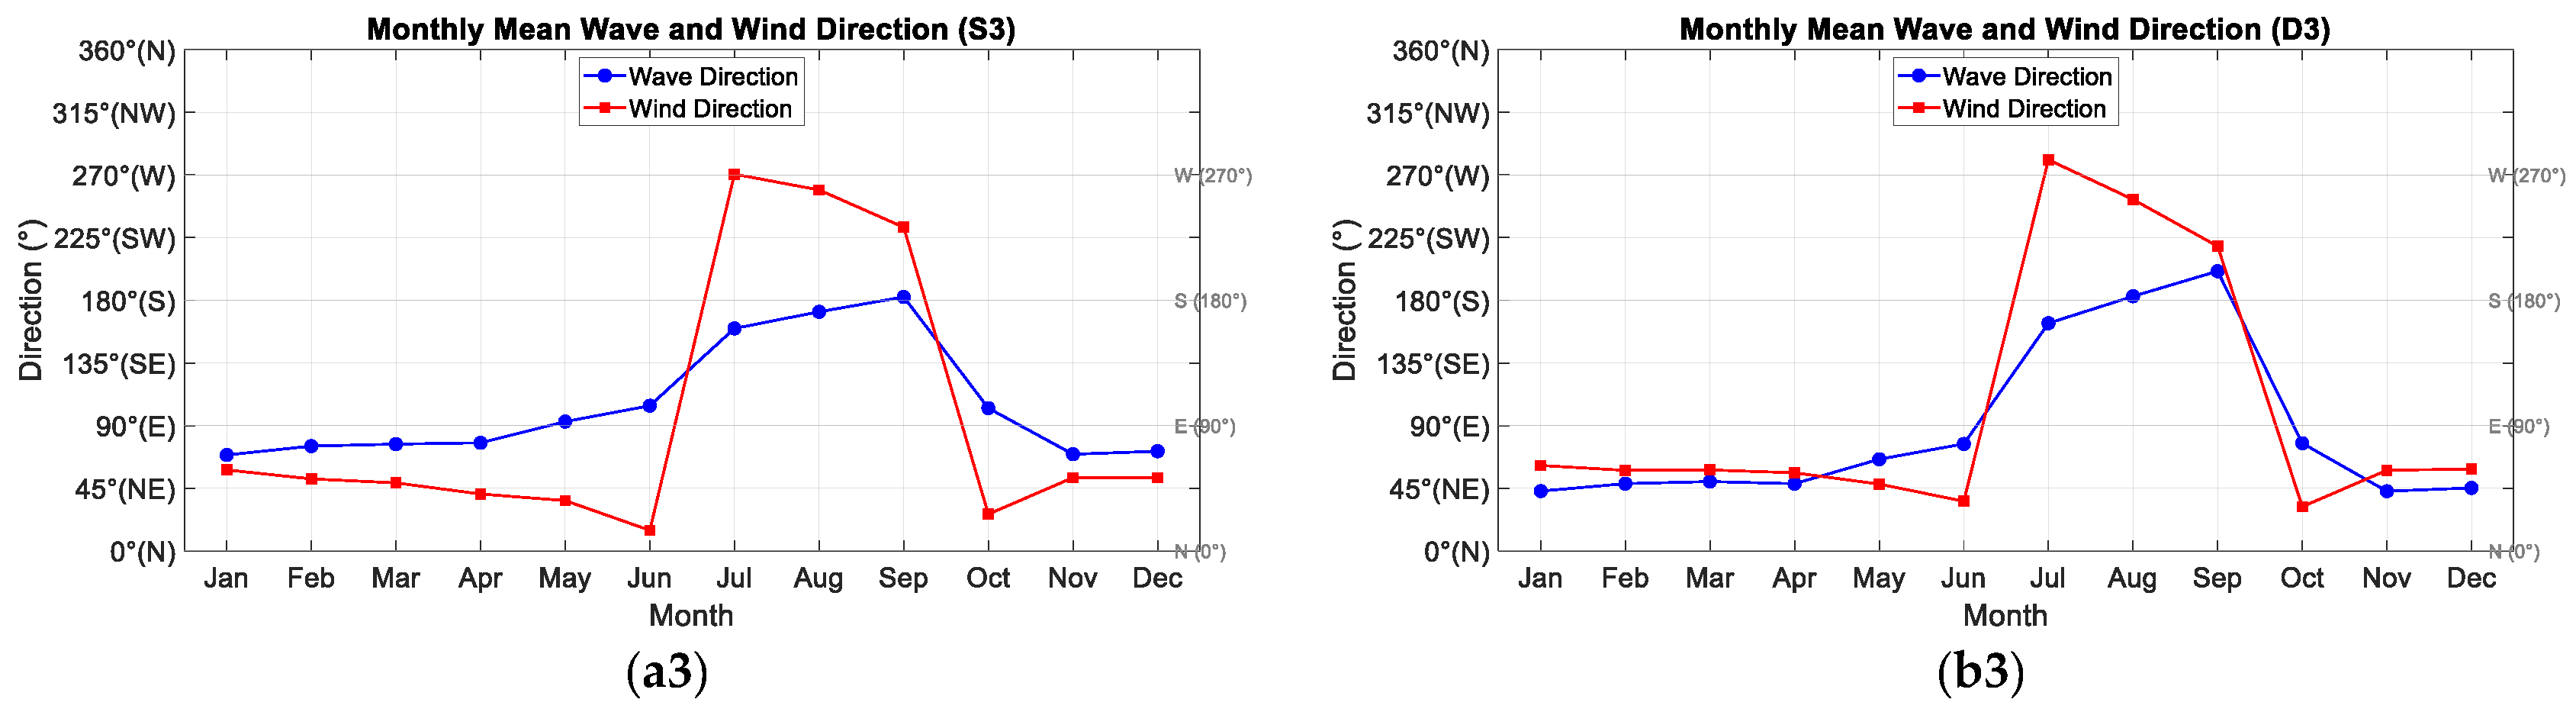
As shown in Figure 16, the monthly mean wind direction and wave direction at each feature point in 2023 exhibit obvious seasonal and spatial differences. In winter, affected by the northeast monsoon, the wind direction remains steadily between 40° and 60°. Meanwhile, the wave direction is highly consistent with the wind direction, indicating that wind waves dominate the wave field. In summer, although the southwest monsoon prevails, the wave direction is still dominated by northeast and east directions. This phenomenon suggests an increase in swell components, which exert an enhanced controlling effect on wave direction, while the contribution of wind waves relatively weakens. From the perspective of spatial distribution, the D-series deep sea points are far offshore with more pronounced variations in wave direction. The discrepancy between wave direction and wind direction is particularly prominent in summer, reflecting the significant influence of offshore swells on the wave field. In contrast, affected by the modulation effect of shallowing water depth on wave propagation, the S-series nearshore shallow sea points show a relatively gentle monthly variation.

4.2. Practical Implications and Comparisons with Previous Research

The findings of this study have several practical implications for coastal engineering and hazard management in the Fujian sea area. The spatial distributions of maximum and mean SWH, together with the SET-based duration analysis, provide valuable references for determining design wave heights, assessing structural fatigue under repeated wave loading, and identifying priority zones for coastal protection. The seasonal and directional characteristics of waves offer operational guidance for navigation safety, port scheduling, and the planning of approach channels and anchorage areas. The marked differences in wave characteristics between nearshore shallow-water and offshore deep-water regions highlight the necessity of depth- and location-specific rather than uniform design criteria along the Fujian coast. Furthermore, the spatial heterogeneity of wave hazard identified in this study can inform the development of regional coastal disaster risk zoning maps and early warning systems.
Comparison with previous studies in the Taiwan Strait, East China Sea, and South China Sea indicates that our 44-year hindcast results are broadly consistent with existing knowledge regarding monsoon-driven seasonal patterns, while our key contributions lie in the finer spatial resolution (500 m–1 km nearshore) and longer temporal coverage, which allow for more detailed characterization of along-coast heterogeneity of wave hazard.

5. Conclusions

Based on the 44-year hindcast wave data from 1980 to 2023 derived from the TOMAWAC model, this study systematically analyzes the temporal and spatial distribution characteristics of wave parameters in the Fujian sea area. The main conclusions are summarized as follows.
In terms of the spatial distribution of SWH and MP, the maximum SWH along the Fujian coast gradually decreases from the offshore area to the nearshore area and from north to south, with a peak value of 15 m occurring off the Ningde coast. The maximum SWH in the sea area near Fuzhou and the Minjiang Estuary is approximately 10–13 m, while the area south of Zhangzhou ranges from 7 to 9 m. The spatial distribution of maximum MP is highly consistent with that of maximum SWH, and the high-value areas are also concentrated in the open seas in the northeastern part of the study area. The maximum MP reaches approximately 15 s, also appearing in the offshore sea near Ningde. The mean SWH presents an overall pattern of low values nearshore and high values offshore, ranging from 1.0 to 2.0 m in the inshore sea and exceeding 2.0 m in the open Taiwan Strait, with a highest mean SWH of approximately 2.5 m near the Penghu Islands. The spatial distribution of MP bears certain similarities to that of SWH, and regions with high wave period generally correspond to high wave height zones.
From the perspective of temporal evolution, wave characteristics in the Fujian sea area exhibit distinct seasonal variations. Affected by typhoons in summer and autumn, the maximum SWH is relatively large, generally exceeding 10 m and reaching up to 15 m in some local areas, while the maximum SWH in spring and winter is below 8 m in most sea areas. The maximum MP shows a remarkable seasonal variation and shares a consistent distribution trend with the maximum SWH. By contrast, the distribution of mean SWH differs obviously from that of the maximum SWH. Affected by the strong northeasterly wind field induced by the East Asian monsoon, the mean SWH reaches its peak of 2.5 m in winter. The maximum mean MP occurs in autumn, which reflects the prominent influence of increased swell components in summer and autumn on wave period.
In addition, severe wave event analysis is conducted based on the severe event threshold. The results indicate that the distribution of severe wave height presents obvious spatial heterogeneity. The SET values are generally low in nearshore shallow sea and increase stepwise with the rise in offshore distance. The SET values range from 2.0 to 3.5 m in nearshore shallow areas to over 6.0 m in the central Taiwan Strait. The average duration of events exceeding the SET ranges from 0 to 8 h in nearshore shallow areas, while the duration increases correspondingly in offshore regions with higher SET values. The duration exhibits prominent seasonality, with the annual peak exceeding 15 h in the Taiwan Strait during autumn.
Considering the complex water depth and topography of the Fujian sea area, six feature characteristic points are selected according to different water depth conditions. Waves in the study area show strong directional concentration. Influenced by topographic friction and energy dissipation, the nearshore shallow sea area has a relatively small overall wave height, with the dominant wave direction leaning toward the east. The deep sea area possesses higher wave energy and larger overall wave height, with the dominant wave direction mainly being northeast. Meanwhile, a significant positive correlation exists between SWH and significant wave period at all feature points, and the linear relationship is more evident for deep sea points. Based on the monthly mean data of 2023, wind waves dominate in winter with wave direction highly consistent with wind direction. In summer, the enhanced control of swell leads to an obvious deviation of wave direction from wind direction. The seasonal variation in wave direction in deep sea is more significant than that in shallow nearshore sea.

Author Contributions

Conceptualization, J.L. and J.S.; methodology, J.L. and B.L.; software, J.L.; validation, S.T., H.S. and Z.W.; formal analysis, J.L. and B.L.; investigation, J.L., B.L., S.T., H.S. and Z.W.; resources, J.S.; data curation, J.L. and S.T.; writing—original draft preparation, J.L.; writing—review and editing, B.L. and J.S.; visualization, J.L.; supervision, J.S.; project administration, J.S. All authors have read and agreed to the published version of the manuscript.

Funding

This work has been supported by the 2024 Annual Fujian Province Transportation Science and Technology Plan Project (Grant No. YB202418).

Data Availability Statement

The original contributions presented in this study are included in the article. Further inquiries can be directed to the corresponding author.

Conflicts of Interest

Authors Baosen Liu and Zheng Wang were employed by the company Xiamen Road & Bridge Engineering Investment and Development Co., Ltd. The remaining authors declare that the research was conducted in the absence of any commercial or financial relationships that could be construed as a potential conflict of interest.

References

  1. Luo, P.; Zhang, J. The Dynamic Impact of Surging Waves on Coastal Structures via a Wave-Structure Coupling Model. Phys. Fluids 2025, 37, 082106. [Google Scholar] [CrossRef]
  2. Hosseinzadeh, N.; Ghiasian, M.; Andiroglu, E.; Lamere, J.; Rhode-Barbarigos, L.; Sobczak, J.; Sealey, K.S.; Suraneni, P. Concrete Seawalls: A Review of Load Considerations, Ecological Performance, Durability, and Recent Innovations. Ecol. Eng. 2022, 178, 106573. [Google Scholar] [CrossRef]
  3. Jiang, D.; Huang, B.; Miao, Q.; Sun, H.; Wang, Z. Extreme Design Wave Parameters Optimization of Typhoon Wave for Ocean Engineering Based on Numerical Simulation and Observation Data in the South China Sea. Ocean. Eng. 2025, 323, 120603. [Google Scholar] [CrossRef]
  4. Roy, S.; Debnath, K.; Das, V.K. Turbulence Characteristics and Energy Cascade in Wave-Current Flow over an Adverse Sloping Bed. Ocean. Eng. 2026, 351, 124427. [Google Scholar] [CrossRef]
  5. Mo, D.; Hu, P.; Li, J.; Hou, Y.; Li, S.; Mo, D.; Hu, P.; Li, J.; Hou, Y.; Li, S. Effect of Wave-Dependent Mechanisms on Storm Surge and Current Simulation during Three Extreme Weather Systems. J. Phys. Ocean. 2024, 54, 1519–1543. [Google Scholar] [CrossRef]
  6. Wang, G.; Liu, Y.; Liu, K.; Xu, C. Dynamic Response and Liquefaction Potential of Porous Seabed Induced by Partial Standing Ocean Waves. Sci. Rep. 2023, 13, 19061. [Google Scholar] [CrossRef] [PubMed]
  7. Li, L.; Zhang, Y.; Li, W.; Hu, P. Simulation and Dynamic Characteristics Analysis of Wave-Current Coupled Sediment Scouring and Silting in High-Pile Wharf Zones: A Case Study of Ningbo Chuanshan Port. Ocean. Eng. 2025, 42, 95–107. [Google Scholar] [CrossRef]
  8. Suh, S.W.; Lee, M.H. Analysis of Typhoon-Induced Wave Overtopping Vulnerability Due to Sea Level Rise Using a Coastal–Seawall–Terrestrial Seamless Grid System. J. Mar. Sci. Eng. 2023, 11, 2114. [Google Scholar] [CrossRef]
  9. Fanti, V.; Ferreira, Ó.; Kümmerer, V.; Loureiro, C. Improved Estimates of Extreme Wave Conditions in Coastal Areas from Calibrated Global Reanalyses. Commun. Earth Environ. 2023, 4, 151. [Google Scholar] [CrossRef]
  10. Tamura, H.; Kawaguchi, K.; Iwamoto, T.; Fujiki, T. Coastal Destruction and Unusual Wave Spectra Induced by Typhoon Faxai in 2019. Coast. Eng. J. 2021, 63, 92–105. [Google Scholar] [CrossRef]
  11. Shi, J.; Feng, X.; Toumi, R.; Zhang, C.; Hodges, K.I.; Tao, A.; Zhang, W.; Zheng, J. Global Increase in Tropical Cyclone Ocean Surface Waves. Nat. Commun. 2024, 15, 174. [Google Scholar] [CrossRef] [PubMed]
  12. Reguero, B.G.; Losada, I.J.; Méndez, F.J. A Recent Increase in Global Wave Power as a Consequence of Oceanic Warming. Nat. Commun. 2019, 10, 205. [Google Scholar] [CrossRef] [PubMed]
  13. Gao, Y.; Li, X.; Chen, X.; Wang, L. Extreme Wave and Storm Surge Characteristics in the Southeastern Coastal and Offshore Regions of China. Sci. Rep. 2025, 15, 26915. [Google Scholar] [CrossRef] [PubMed]
  14. Jullien, S.; Aucan, J.; Kestenare, E.; Lengaigne, M.; Menkes, C. Unveiling the Global Influence of Tropical Cyclones on Extreme Waves Approaching Coastal Areas. Nat. Commun. 2024, 15, 6593. [Google Scholar] [CrossRef] [PubMed]
  15. Peláez-Zapata, D.; Pakrashi, V.; Dias, F.; Peláez-Zapata, D.; Pakrashi, V.; Dias, F. Ocean Wave Directional Distribution from GPS Buoy Observations off the West Coast of Ireland: Assessment of a Wavelet-Based Method. J. Atmos. Ocean. Technol. 2024, 41, 749–765. [Google Scholar] [CrossRef]
  16. Lancaster, O.; Cossu, R.; Boulay, S.; Hunter, S.; Baldock, T.E.; Lancaster, O.; Cossu, R.; Boulay, S.; Hunter, S.; Baldock, T.E. Comparative Wave Measurements at a Wave Energy Site with a Recently Developed Low-Cost Wave Buoy (Spotter), ADCP, and Pressure Loggers. J. Atmos. Ocean. Technol. 2021, 38, 1019–1033. [Google Scholar] [CrossRef]
  17. Leckler, F.; Ardhuin, F.; Peureux, C.; Benetazzo, A.; Bergamasco, F.; Dulov, V.; Leckler, F.; Ardhuin, F.; Peureux, C.; Benetazzo, A.; et al. Analysis and Interpretation of Frequency–Wavenumber Spectra of Young Wind Waves. J. Phys. Oceanogr. 2015, 45, 2484–2496. [Google Scholar] [CrossRef]
  18. Liu, X.; Huang, W.; Gill, E.W. Wave Height Estimation from Shipborne X-Band Nautical Radar Images. J. Sens. 2016, 2016, 1078053. [Google Scholar] [CrossRef]
  19. Hauser, D.; Tourain, C.; Hermozo, L.; Alraddawi, D.; Aouf, L.; Chapron, B.; Dalphinet, A.; Delaye, L.; Dalila, M.; Dormy, E.; et al. New Observations from the SWIM Radar On-Board CFOSAT: Instrument Validation and Ocean Wave Measurement Assessment. IEEE Trans. Geosci. Remote Sens. 2021, 59, 5–26. [Google Scholar] [CrossRef]
  20. Kalra, R.; Deo, M.C.; Kumar, R.; Agarwal, V.K. Artificial Neural Network to Translate Offshore Satellite Wave Data to Coastal Locations. Ocean. Eng. 2005, 32, 1917–1932. [Google Scholar] [CrossRef]
  21. Appendini, C.M.; Torres-Freyermuth, A.; Salles, P.; López-González, J.; Mendoza, E.T.; Appendini, C.M.; Torres-Freyermuth, A.; Salles, P.; López-González, J.; Mendoza, E.T. Wave Climate and Trends for the Gulf of Mexico: A 30-Yr Wave Hindcast. J. Clim. 2014, 27, 1619–1632. [Google Scholar] [CrossRef]
  22. Guimarães, P.V.; Ardhuin, F.; Bergamasco, F.; Leckler, F.; Filipot, J.F.; Shim, J.S.; Dulov, V.; Benetazzo, A. A Data Set of Sea Surface Stereo Images to Resolve Space-Time Wave Fields. Sci. Data 2020, 7, 145. [Google Scholar] [CrossRef] [PubMed]
  23. Zhou, Z.; Liu, J.; Wu, R.; Guo, A. Non-Contact Sensing Methods for Wave Measurement: Current Research and Challenge. Intell. Transp. Infrastruct. 2025, 4, liaf003. [Google Scholar] [CrossRef]
  24. Nishan, Q.; Zuofang, Y.; Xiuling, Z.; Sheng, L.; Nishan, Q.; Zuofang, Y.; Xiuling, Z.; Sheng, L. Numerical Simulation and Spatiotemporal Analysis of Waves at Yongle Atoll, Xisha Islands Based on SWAN Modeling. Prog. Geogr. 2024, 43, 1811–1825. [Google Scholar] [CrossRef]
  25. Sakina, S.L.; Ningsih, N.S.; Prayogi, A. Investigating Wave Characteristics in the Java Sea and Potential Influencing Factors: A Case Study of Coastal Flooding along the Northern Coast of Semarang City, Indonesia (May 23, 2022). Anthr. Coasts 2025, 8, 44. [Google Scholar] [CrossRef]
  26. Ponce de León, S.; Guedes Soares, C. Distribution of Average Extreme Wave Parameters in the North Atlantic from Numerical Simulations. Ocean. Eng. 2022, 253, 110901. [Google Scholar] [CrossRef]
  27. Lin, Y.-H.; Zheng, Y.-F.; Pan, W.R.; Xiao, Z.; Ji, H.-D. Engineering Wave Calculation and Wave Field Numerical Simulation in Xisha Bay. J. Appl. Oceanogr. 2020, 39, 80–86. [Google Scholar] [CrossRef]
  28. Sun, W.J.; Luo, Z.; Lin, H.X. Numerical simulation of wave characteristics in the China-Maldives Friendship Bridge sea area. Mar. Forecast. 2025, 42, 30–38. [Google Scholar] [CrossRef]
  29. Zhu, X.Q.; Jin, Y.R.; Pan, J.N.; Zhu, Y.J.; Jv, L.H. Numerical Simulation of Wave Overtopping at Seawalls and Optimization of Parapet Structures under Coupled Wind–Wave Effects. Hydro-Sci. Eng. 2026, 108–119. [Google Scholar] [CrossRef]
  30. Islami, M.F.; Jasruddin; Sujiono, E.H. The Utilization of Seasonal Variation of Ocean Wave Characteristics Identification in Monitoring the Chlorophyll-a Distribution in South Sulawesi. IOP Conf. Ser. Earth Environ. Sci. 2023, 1251, 012027. [Google Scholar] [CrossRef]
  31. Liu, Y.G.; Xu, R.; Hou, F.; Xing, C.; Li, B.X.; Zhang, X.H.; Fu, W.A.; Wang, H.M.; Liu, X.; Yin, T.N. Hazard assessment of wave disasters in Fujian Province. Mar. Forecast. 2024, 41, 21–30. [Google Scholar] [CrossRef]
  32. Chung, S.W.; Jan, S.; Liu, K.K. Nutrient Fluxes through the Taiwan Strait in Spring and Summer 1999. J. Oceanogr. 2001, 57, 47–53. [Google Scholar] [CrossRef]
  33. Ding, Y.; Dong, D. Study on Comprehensive Risk Assessment of Storm Surges for Fujian Province from the Perspective of Resilience. J. Trop. Oceanogr. 2024, 43, 126–136. [Google Scholar] [CrossRef]
  34. Zhu, M.Z.; Xu, J. Covariation Relationship Between Tropical Cyclone Intensity and Size Change over the Northwest Pacific. J. Appl. Meteorol. Sci. 2023, 34, 463–474. [Google Scholar] [CrossRef]
  35. Han, P.; Guo, G.; Li, X.; Liu, J. Research on Influencing Factors of Typhoon Disasters in Fujian Province Based on Geodetector. Remote Sens. Technol. Appl. 2023, 38, 487–495. [Google Scholar] [CrossRef]
  36. Enda, Z.; Yaqiang, W.; Yan, Z.; Bin, L.; Enda, Z.; Yaqiang, W.; Yan, Z.; Bin, L. Evaluation of Weather Forecasts from AI Big Models over East Asia. J. Appl. Meteorol. Sci. 2024, 35, 641–653. [Google Scholar] [CrossRef]
  37. Xu, X.; Tao, A.; Li, X.; Zheng, X.; Lin, Y. Analysis of Wave Characteristics in the Central Taiwan Strait Based on Measured Data. J. Trop. Oceanogr. 2021, 40, 12–20. [Google Scholar] [CrossRef] [PubMed]
  38. Dong, S.; Gong, Y.; Wang, Z. Long-Term Variations of Wind and Wave Conditions in the Taiwan Strait. Reg. Stud. Mar. Sci. 2020, 36, 101256. [Google Scholar] [CrossRef]
  39. Shi, J.; Zheng, J.; Zhang, C.; Joly, A.; Zhang, W.; Xu, P.; Sui, T.; Chen, T. A 39-Year High Resolution Wave Hindcast for the Chinese Coast: Model Validation and Wave Climate Analysis. Ocean. Eng. 2019, 183, 224–235. [Google Scholar] [CrossRef]
  40. Shao, Y.; Chen, J.; Zhu, Y.; Chen, S.; Jiang, X.; Han, M.; Yang, K. A Theoretical Model of Progressive Services to Reduce the Matthew Effect in Emergency Management and Disaster Mitigation: Taking the Cases of Typhoons Landing in Fujian as Examples. J. Catastrophol. 2026, 40, 77–83. [Google Scholar] [CrossRef]
  41. Xiang, C. Analysis of Temporal and Spatial Changes of Typhoon in Fujian Province. J. Catastrophol. 2007, 22, 66–70. [Google Scholar]
  42. Wang, K.; Yue, X.; Wu, X.; Zhou, H.; Teng, C. Comparative analysis of SWAN model and ERA-Interim data on significant wave height in the Taiwan Strait. Acta Oceanol. Sin. 2021, 43, 15–25. [Google Scholar] [CrossRef]
  43. Lykke Andersen, T.; Frigaard, P.; Damsgaard, M.L.; de Vos, L. Wave Run-up on Slender Piles in Design Conditions—Model Tests and Design Rules for Offshore Wind. Coast. Eng. 2011, 58, 281–289. [Google Scholar] [CrossRef]
  44. Vousdoukas, M.I.; Mentaschi, L.; Mongelli, I.; Ciscar, J.C.; Hinkel, J.; Ward, P.; Gosling, S.; Feyen, L. Adapting to Rising Coastal Flood Risk in the EU Under Climate Change; Publications Office of the European Union: Luxembourg, 2020. [Google Scholar] [CrossRef]
  45. Weisse, R.; Günther, H. Wave Climate and Long-Term Changes for the Southern North Sea Obtained from a High-Resolution Hindcast 1958–2002. Ocean. Dyn. 2007, 57, 161–172. [Google Scholar] [CrossRef]
  46. Zhong, H.; Zhou, J.Q.; Wu, Z.Y.; Zhao, D.N.; Cao, Z.Y.; Zhu, C. Numerical Simulation of Hydrodynamic and Sediment Transport and Analysis of Geomorphic Erosion and Deposition in the Taiwan Strait. Acta Oceanol. Sin. 2024, 46, 90–105. [Google Scholar] [CrossRef]
  47. Wen, C.Q.; Zhu, J.; Cai, F.; Wang, L.H.; Qi, H.S.; Liu, J.H.; Lei, G.; Zhao, S.H. Spatial and Temporal Distribution of Wave Energy on Low Energy Coasts Under the Effect of Beach Restoration Project. Oceanol. Limnol. Sin. 2021, 52, 75–85. [Google Scholar] [CrossRef]
  48. Wang, D.; Hua, F.; Jiang, Z. Application of Coastal Wave Model SWAN to Liaodong Bay. Adv. Mar. Sci. 2010, 28, 285–291. [Google Scholar] [CrossRef]
Figure 1. Numerical domain and finite element meshes use to model the Fujian sea areas: (a) the Chinese offshore seas; (b) the Fujian sea area.
Jmse 14 01188 g001
Figure 2. Study area and distribution of observation station (Points with corresponding colors represent the track points of typhoons).
Jmse 14 01188 g002
Figure 3. Comparison of SWH and MP with observed data: (a) Station B1; (b) Station B2; (c) Station B3.
Jmse 14 01188 g003
Figure 4. Distribution of maximum SWH and MP in Fujian sea area during 1980–2023: (a) distribution of maximum SWH in Fujian sea area during 1980–2023; (b) distribution of maximum MP in Fujian sea area during 1980–2023.
Jmse 14 01188 g004
Figure 5. Distribution of seasonal maximum SWH in Fujian sea area during 1980–2023: (a) spring; (b) summer; (c) autumn; (d) winter.
Jmse 14 01188 g005
Figure 6. Distribution of seasonal maximum MP in Fujian sea area during 1980–2023: (a) spring; (b) summer; (c) autumn; (d) winter.
Jmse 14 01188 g006
Figure 7. Distribution of mean SWH and MP in Fujian sea area during 1980–2023: (a) distribution of mean SWH in Fujian sea area during 1980–2023; (b) distribution of mean MP in Fujian sea area during 1980–2023.
Jmse 14 01188 g007
Figure 8. Distribution of seasonal mean SWH in Fujian sea area during 1980–2023: (a) spring; (b) summer; (c) autumn; (d) winter.
Jmse 14 01188 g008aJmse 14 01188 g008b
Figure 9. Distribution of seasonal mean MP in Fujian sea area during 1980–2023: (a) spring; (b) summer; (c) autumn; (d) winter.
Jmse 14 01188 g009
Figure 10. Distribution of SWH and exceedance time of SET events in Fujian sea area during 1980–2023: (a) distribution of SWH of SET events in Fujian sea area during 1980–2023; (b) distribution of exceedance time of SET events in Fujian sea area during 1980–2023.
Jmse 14 01188 g010
Figure 11. Seasonal duration of SET-exceeding events in Fujian sea area during 1980–2023. (a) Spring; (b) summer; (c) autumn; (d) winter.
Jmse 14 01188 g011aJmse 14 01188 g011b
Figure 12. Long-term trends of severe wave events in the Fujian sea area (1980–2023). (a) SET value; (b) duration of SET-exceeding events (Grid points with statistically significant trends are marked with black dots).
Jmse 14 01188 g012
Figure 13. Sampling point map.
Jmse 14 01188 g013
Figure 14. Wave height rose diagram of feature points. (a) Series S; (b) Series D (Numbers 1, 2 and 3 correspond to three selected points at different water depths.).
Jmse 14 01188 g014aJmse 14 01188 g014b
Figure 15. Joint distribution of SWH and significant wave period (SWP) at different water depths. (a) Series S; (b) Series D (Numbers 1, 2 and 3 correspond to three selected points at different water depths).
Jmse 14 01188 g015aJmse 14 01188 g015b
Figure 16. Monthly mean wind direction and wave direction variation at feature points in 2023. (a) Series S; (b) Series D (Numbers 1, 2 and 3 correspond to three selected points at different water depths).
Jmse 14 01188 g016aJmse 14 01188 g016b
Table 1. Principal settings of the TOMAWAC model.
Model SettingDescription
Wind forceCFSR reanalysis
Wind temporal resolution1 h
BathymetryGEBCO database
Frequency discretization32 bins, 0.0345–0.66 Hz
Directional discretization36 bins
Time step (fine grid)200 s
Model output interval1 h
Table 2. Statistical error analysis.
Buoy StationsWater Depth (m)Statistical IndicatorsMAE
(SWH/m, MP/s)
RMSE
(SWH/m, MP/s)
AD
(SWH/m, MP/s)
RSINSE
B121.582SWH0.3200.4250.1620.8960.2720.734
MP0.5310.7180.1380.8460.1420.662
B228.386SWH0.2930.5860.1020.8720.2690.656
MP0.9261.2480.3840.8770.1630.726
B315.917SWH0.2370.3110.1190.9420.2710.828
MP0.6920.9950.2330.8510.3170.702
Table 3. Information about the feature points.
PointLongitude (° E)Latitude (° N)Water Depth (m)
S1119.9626.1523.57
S2119.1924.9324.96
S3118.1624.1122.51
D1120.3425.8956.71
D2119.7124.6655.78
D3118.7523.6953.74
Disclaimer/Publisher’s Note: The statements, opinions and data contained in all publications are solely those of the individual author(s) and contributor(s) and not of MDPI and/or the editor(s). MDPI and/or the editor(s) disclaim responsibility for any injury to people or property resulting from any ideas, methods, instructions or products referred to in the content.