Article

Experimental Study of Mooring Configuration Effects on the Hydrodynamic Response of a Hexagonal Rigid FPV Platform

1
School of Civil Engineering, Tianjin University, Tianjin 300350, China
2
College of Science and Technology, Hebei Agricultural University, Huanghua 061100, China
3
State Key Laboratory of Hydraulic Engineering Simulation and Safety, Tianjin University, Tianjin 300350, China
4
School of Ocean Energy, Tianjin University of Technology, Tianjin 300384, China
*
Author to whom correspondence should be addressed.
J. Mar. Sci. Eng. 2026, 14(12), 1123; https://doi.org/10.3390/jmse14121123
Submission received: 3 May 2026 / Revised: 31 May 2026 / Accepted: 14 June 2026 / Published: 18 June 2026
(This article belongs to the Section Ocean Engineering)

Abstract

Maintaining structural stability and reliable mooring performance remains a key challenge for offshore floating photovoltaic (FPV) systems. This study investigates the coupled hydrodynamic and mooring behavior of a novel large-scale hexagonal rigid FPV platform through 1:25-scale physical model tests. A near-zero-pre-tension slack mooring arrangement was adopted to isolate the effects of mooring type, including anchor chain (M1), steel cable (M2), and elastic cable (M3). The results show that the influence of mooring configuration is strongly degree-of-freedom dependent. Surge motion is highly sensitive to mooring type, whereas heave and pitch remain largely consistent among the three cases. In regular waves, the maximum surge-acceleration RAO of M2 is 1.82 and 2.27 times those of M1 and M3, respectively. Peak mooring tension shows a strong correlation with maximum surge acceleration in both regular and irregular waves, indicating that surge motion can serve as a useful indicator of extreme mooring loads under similar slack-mooring conditions. Among the three configurations, M1 exhibits the strongest short-term peak-load buffering. Under extreme irregular waves, its peak mooring tension is 82.4% and 24.7% lower than those of M2 and M3, respectively. These results provide experimental guidance for the mooring design of large-scale rigid FPV systems.

1. Introduction

The integration of photovoltaic (PV) systems with marine environments has significant potential to expand sustainable energy generation [1]. Compared with land-based installations, marine deployment can benefit from lower ambient temperatures and enhanced convective heat transfer, thereby reducing PV module temperature and improving energy yield [2,3,4]. Panel-level thermal performance can also be improved through structural design, such as frame perforation for passive air cooling [5]. In areas where bottom-fixed offshore structures are constrained by water depth or seabed conditions, floating photovoltaic (FPV) systems provide a technically feasible alternative [6]. Although most current FPV projects are still deployed in sheltered waters, limitations in available space and environmental regulations have promoted increasing interest in offshore applications [7]. Offshore FPV offers large deployment areas, potential cost reduction through economies of scale [8], localized power supply for coastal regions and offshore facilities [9,10,11], and integration with aquaculture, offshore wind farms, and green hydrogen production [12,13,14].
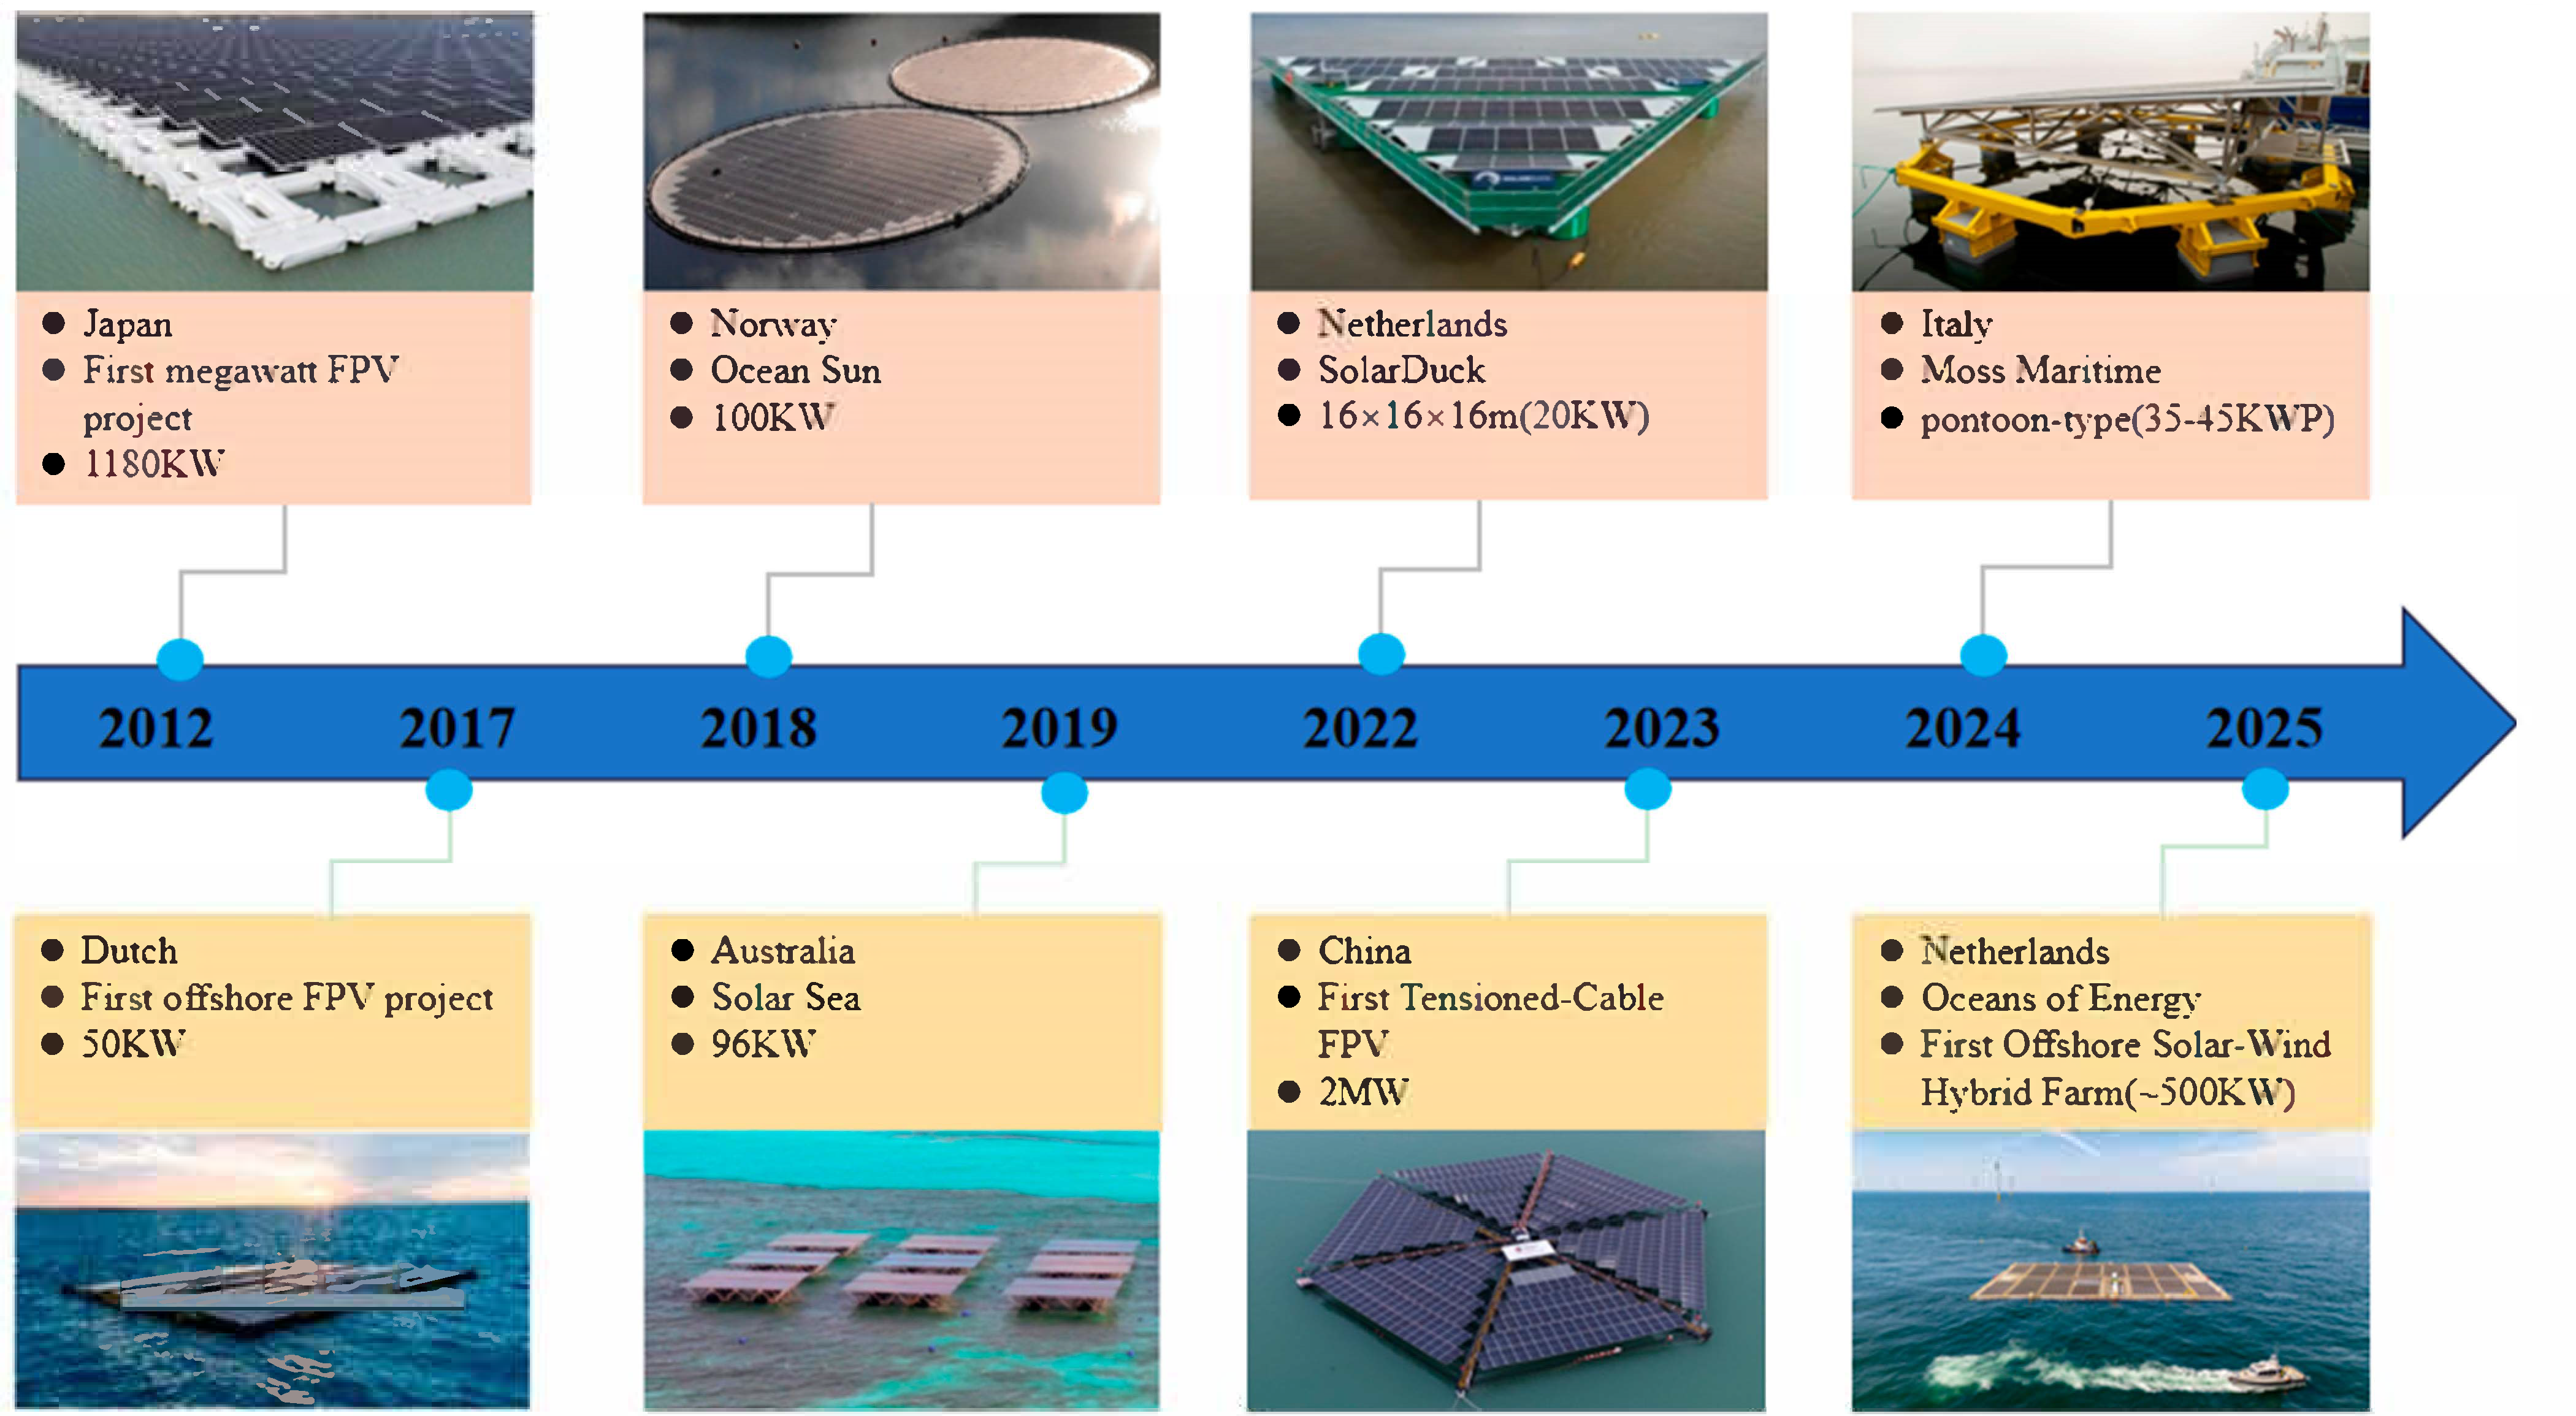
The development trajectory summarized in Figure 1 shows that FPV technology has progressed from sheltered inland water applications toward increasingly offshore and large-scale marine deployments. Early FPV projects were mainly installed in lakes, canals, ponds, irrigation reservoirs, and coal-mining subsidence areas, where the hydrodynamic environment is relatively mild [3,15,16]. More recent offshore-oriented concepts, including membrane-supported systems, modular floating platforms, tensioned-cable floating islands, and integrated offshore wind–solar applications, have demonstrated the feasibility of deploying FPV structures under wind, wave, current, ultraviolet, humidity, and corrosive marine conditions [17,18,19,20,21]. This transition highlights a shift in the governing design problem: for large offshore FPV platforms, the key challenge is no longer only buoyancy support or power generation but also maintaining structural stability, limiting wave-induced motions, and ensuring reliable station keeping under coupled environmental loading.
A mooring system is the primary means of station keeping for an offshore FPV array [22]. It not only maintains the platform position, but also limits excessive motions under extreme sea states and reduces the risk of contact with adjacent structures or passing vessels [23]. Because the failure of a single line can rapidly compromise overall stability, mooring safety is a first-order design requirement. Moreover, previous work has shown that the axial stiffness of mooring lines can markedly influence mooring dynamics as well as the hydrodynamic response of floating structures [24,25]. Therefore, careful selection of mooring materials and configurations is essential for offshore FPV installations.
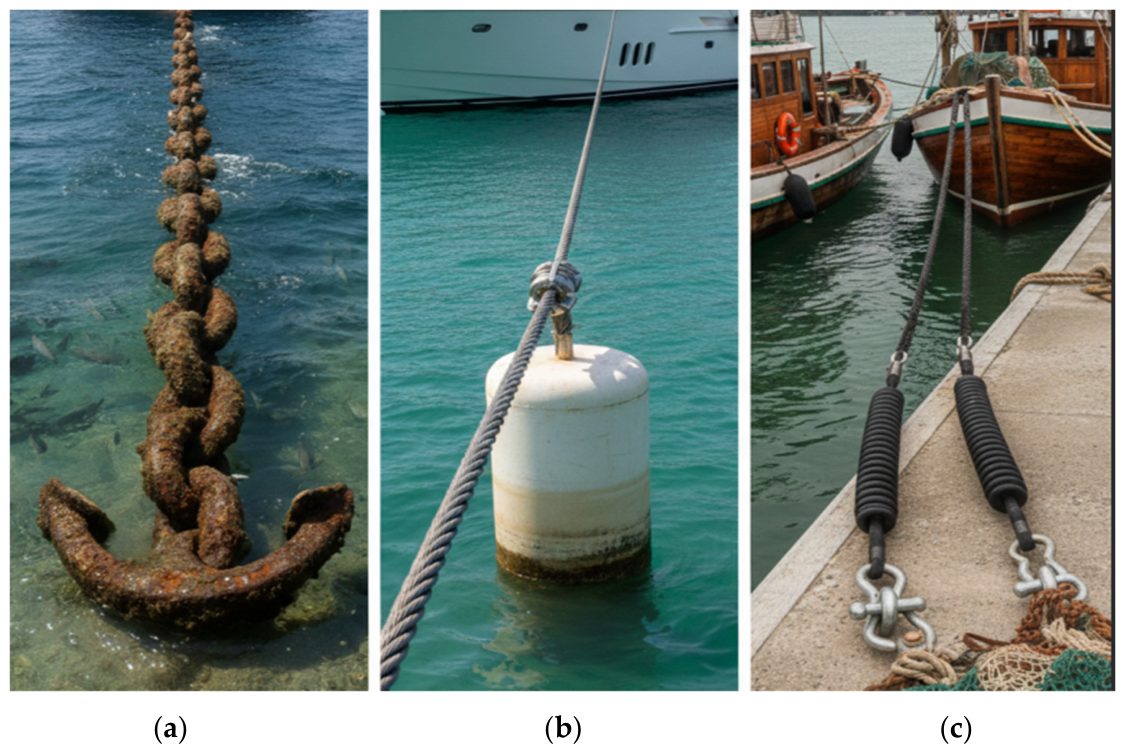
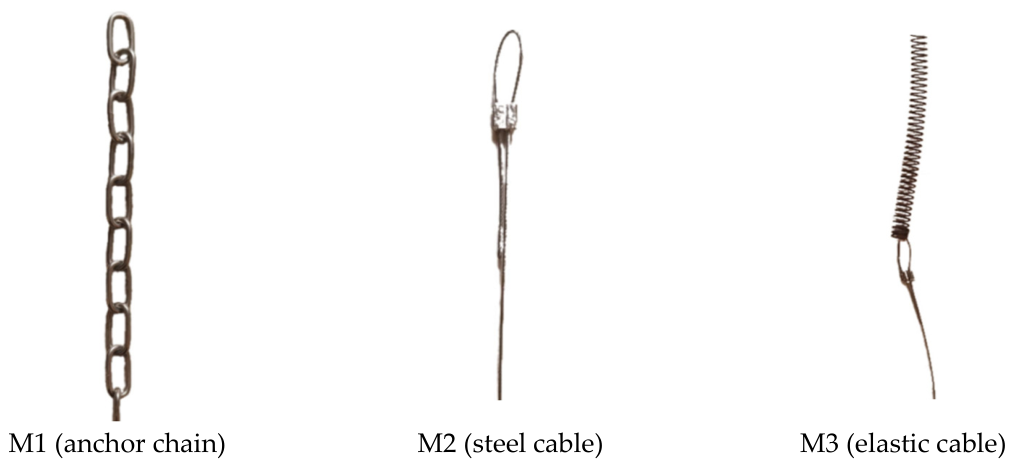
In maritime environments, FPV systems commonly adopt multi-point compliant mooring arrangements to balance station keeping and attitude control [26]. In this setting, mooring geometric nonlinearity and wave nonlinearity (including coupling between low-frequency drift and wave-frequency responses) jointly affect platform motions and mooring loads, making the system response highly sensitive to the mooring layout and the equivalent stiffness/damping characteristics of the mooring system [27,28,29]. Regarding material selection, chain moorings are often preferred in engineering practice: their self-weight forms a catenary profile that provides relatively compliant station keeping, strong restoring capability, and good abrasion resistance and operational robustness. In many shallow-water applications, controlled seabed contact of the chain may also introduce additional effective damping, which typically helps reduce platform motions and dynamic peak tensions; therefore, from a mechanical-response perspective, chain moorings often show strong competitiveness. Nevertheless, in very shallow water or low-tension conditions, chain moorings are more prone to touchdown–lift-off events and complex seabed interaction processes, thereby introducing additional nonlinearity and uncertainty [30]; hence, it is necessary to investigate their mechanical performance through physical experiments. Steel wire ropes, with lower self-weight and a tauter line shape, can improve station-keeping performance and reduce the likelihood of seabed contact. However, their relatively high axial stiffness may amplify dynamic tension variations while limiting platform excursions; therefore, strength and fatigue in marine environments require particular attention. Reported engineering failure cases can be found in the conference literature as supplementary evidence [31]. Synthetic fiber ropes can reduce short-term extreme tensions through recoverable elongation and hysteretic energy dissipation, but their lower equivalent stiffness may increase platform offset under certain mooring conditions. In addition, creep, stiffness evolution, and long-term property degradation in marine environments should be considered in design and lifetime assessment [32]. It should be noted that, in this study, “elastic mooring” refers to a hybrid arrangement in which a steel wire rope is connected in series with an in-line spring element to tailor the effective axial stiffness and damping, rather than relying on the intrinsic elasticity of synthetic fiber rope, as shown in Figure 2.
Therefore, for offshore floating photovoltaic (FPV) platforms moored in shallow waters, it is essential to integrate frequency- and time-domain analyses within the framework of physical model testing. Such an approach enables a systematic quantification of how different mooring materials and configurations induce shifts in response frequency bands, variations in peak tensions, and alterations in fatigue characteristics, ultimately revealing their coupled effects on the platform’s motion responses [33,34]. These findings should also be benchmarked against existing experimental studies of offshore FPV systems under wave loading in order to clarify applicable operating-condition boundaries and provide practical guidance for design parameter selection across different mooring solutions [35,36,37].
As offshore renewable energy moves toward more energetic marine environments, large-scale rigid FPV platforms offer potential advantages in structural stability and power capacity over flexible or small-scale systems. For such platforms, mooring configuration can strongly affect hydrodynamic response and load transfer. Although mooring effects on FPV systems have been investigated, controlled comparisons of typical slack mooring forms for large-scale rigid, low-freeboard, and shallow-draft platforms remain insufficient. This study therefore conducts 1:25-scale wave tank experiments on a large hexagonal rigid FPV platform. Three representative mooring configurations are examined: catenary anchor chain (M1), steel cable (M2), and elastic cable (M3) (Figure 2). By analyzing surge, heave, pitch, and mooring tension under regular and extreme irregular waves, this work clarifies the degree-of-freedom-dependent sensitivity of the coupled response to mooring type and provides experimental evidence for the mooring design of large-scale rigid FPV systems.

2. Proposal of the Buoyancy-Supporting Platform and Mooring System

2.1. Prototype Structure

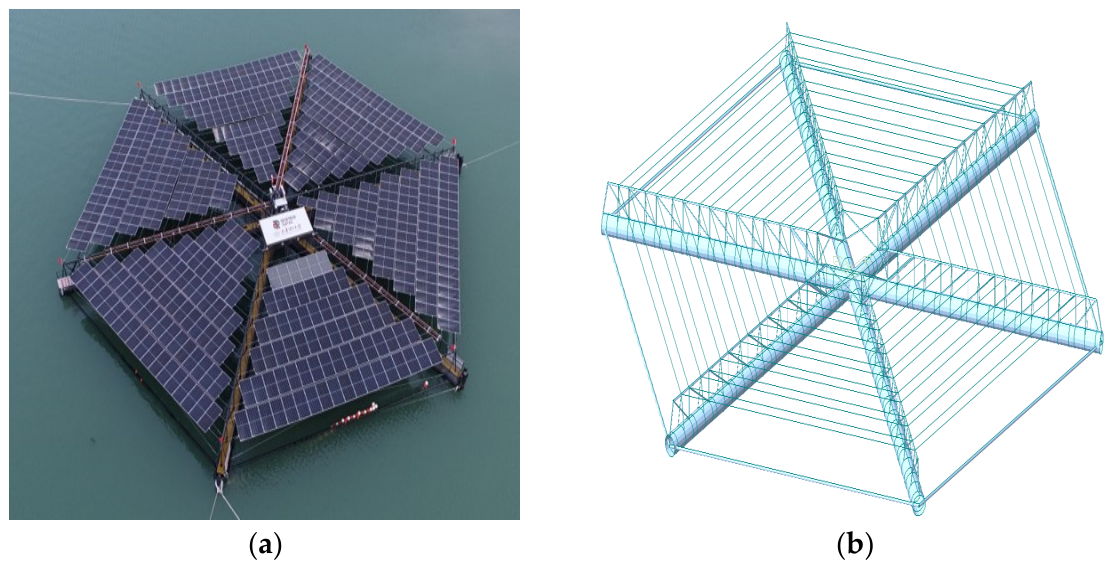
A large-scale hexagonal rigid FPV platform with a total installed capacity of approximately 0.25 MW is proposed in this study. The platform is primarily composed of steel tubular members, trusses, tension cables, and photovoltaic (PV) modules. It adopts a hexagonal layout that allows modular units to be densely arranged with well-matched interfaces, thereby improving space utilization and reducing material waste. The hexagonal support structure has an edge length of 25 m. As shown in Figure 3, three primary steel tubular members are arranged radially along the principal axes of the hexagon, intersecting at the center and being welded to a reinforced central node. These radial members divide the platform into six triangular bays. Within each bay, multiple circumferential tension cables are installed in parallel to support the PV modules and associated loads. The rigid connection between the tension-cable system and the PV modules, together with the proximity of the modules to the water surface, promotes seawater-induced cooling and can improve power-generation efficiency. Along the outer perimeter, smaller-diameter steel tubular members connect the six vertices, enhancing overall structural integrity and improving resistance to ice loads. This configuration increases the capacity of the platform to withstand complex and time-varying marine environmental loads, improves structural safety, and remains economically and technically feasible because it uses readily available materials and a simplified construction scheme. The prototype is shown in Figure 3.

2.2. Experimental Model

In this experiment, the prototype floating structure was simplified in view of its large dimensions, the constraints of the test facility, and the objective of the study. A 1:25-scale model was adopted, with the main floating-tube dimensions, overall geometry, and mass characteristics scaled to represent the global hydrodynamic and mooring responses of the prototype. Because the present study focuses on overall platform motions and mooring tensions rather than local stresses in PV modules, support frames, or joints, secondary structural details were simplified while the main buoyancy-supporting components were retained.
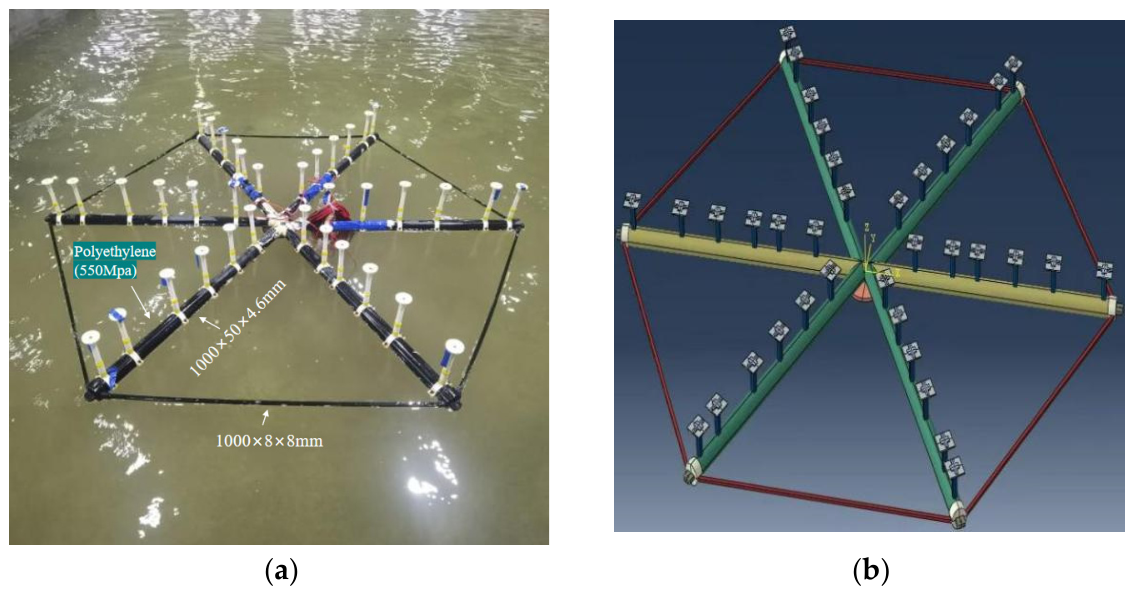
The model was fabricated from polyethylene (PE) with an elastic modulus of 550 MPa. The main tubes were 1000 mm long, with an outer diameter of 50 mm, an inner diameter of 40.8 mm, and a wall thickness of 4.6 mm. The ice-resistant members were made of solid PE tubes with an 8 mm x 8 mm cross-section. Although PE introduces minor compliance compared with steel, the model was designed to behave as a quasi-rigid body under wave excitation. Local bending and higher-mode structural vibrations were not directly measured; therefore, the model is interpreted as a quasi-rigid hydrodynamic and mooring-response model rather than a local hydroelastic model. The test water depth was 0.465 m. To represent the PV-module support system (Figure 4), six uniformly raised trays were installed on each buoyancy tube at prescribed spacing; the tray surfaces were located 160 mm below the upper surface of the tube. Detailed parameters of the floating-body model are presented in Table 1.
To ensure hydrodynamic similarity, the Froude number and Strouhal number were kept consistent between the prototype and the model, thereby maintaining dynamic similarity for the wave-induced fluid-structure interaction. The corresponding relationships are given by Equations (1) and (2):
v p g p L p = v m g m L m
v p T p L p = v m T m L m
where vp denotes the velocity of the model, vm represents the velocity of the prototype, Tp indicates the motion period of the model, Tm signifies the motion period of the prototype, Lm is the characteristic length of the model, Lp is the characteristic length of the prototype, and gp and gm both denote gravitational acceleration.
The model was designed according to Froude similarity, which is appropriate for gravity-dominated wave–body interaction and global mooring response. Reynolds similarity cannot be satisfied simultaneously at this scale; therefore, viscous effects such as hydrodynamic damping and mooring-line drag may be distorted. The results are therefore interpreted mainly as comparative Froude-scaled trends rather than exact full-scale viscous responses.

2.3. Mooring Configurations

As shown in Figure 5, the 1:25-scale FPV model was tested with three representative mooring configurations: anchor chain (M1), steel cable (M2), and high-compliance elastic mooring (M3). The main parameters are summarized in Table 2. A symmetric four-point mooring arrangement was adopted, with two lines on the wave-facing side and two lines on the leeward side. All mooring lines were aligned parallel to the wave-propagation direction, and the initial horizontal distance between each anchor point and the corresponding structural fairlead was 95 cm. Similar simplified spread-mooring arrangements can be found in previous wave-tank tests of floating-body responses [38]. With a line length of 1.36 m and a water depth of 0.465 m, the initial geometry gives an estimated excess line length of approximately 0.30 m and a horizontal excursion allowance of approximately 0.33 m before the line approaches a straight configuration. The line lengths were adjusted to achieve a near-zero-pre-tension state at still-water equilibrium; therefore, the nominal pre-tension values in Table 2 arise mainly from line self-weight and initial sag and are much smaller than the motion-induced peak mooring loads. This setup enables the mooring loads to be governed primarily by wave-induced platform motions, allowing the effects of mooring type to be compared under consistent slack-mooring conditions.
The tensile axial stiffness values in Table 2 represent component-level stiffnesses obtained from manufacturer specifications and geometric/material parameters of the mooring elements. They should not be interpreted as the global horizontal restoring stiffness of the slack mooring system, which also depends on line self-weight, catenary-geometry variation, and slack–taut transition behavior. In particular, M3 should be interpreted as a simplified spring-steel-wire configuration representing a lower-equivalent-stiffness elastic mooring for comparison rather than a strictly scaled synthetic rope.

3. Experimental Setup

3.1. Experimental Site

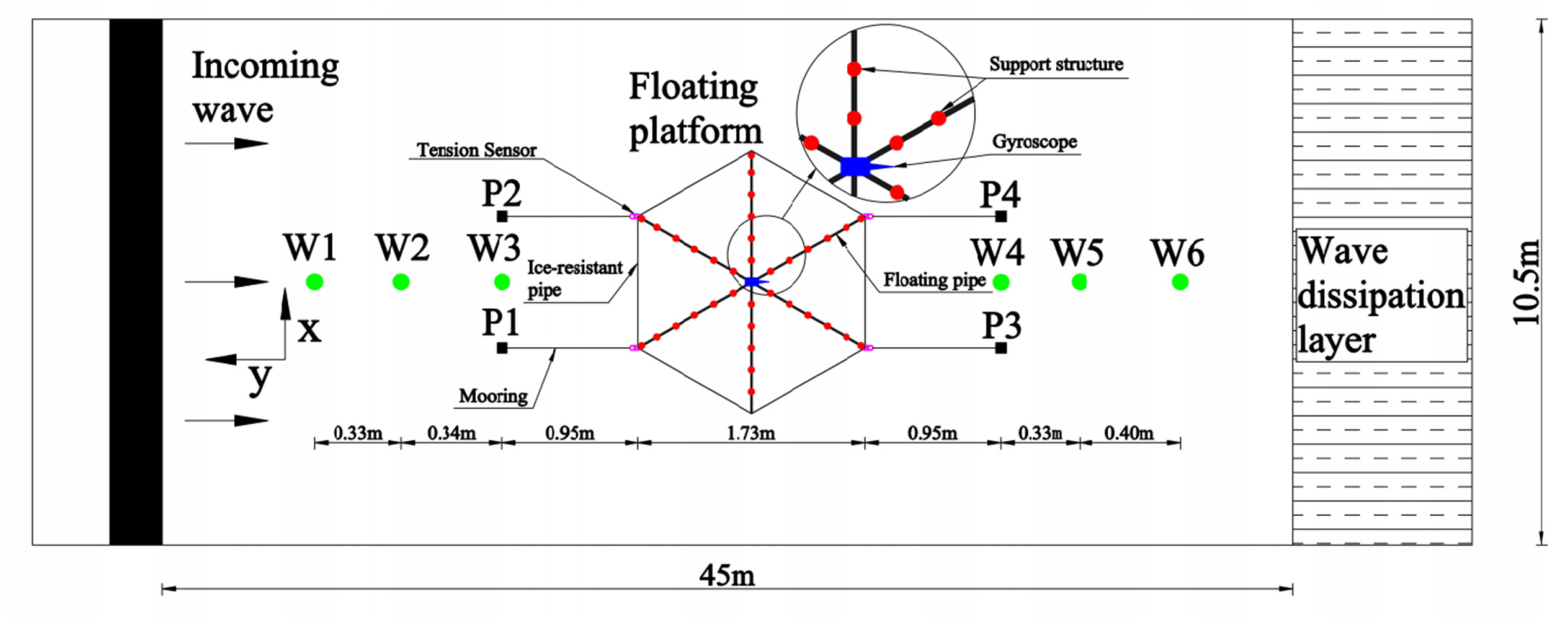
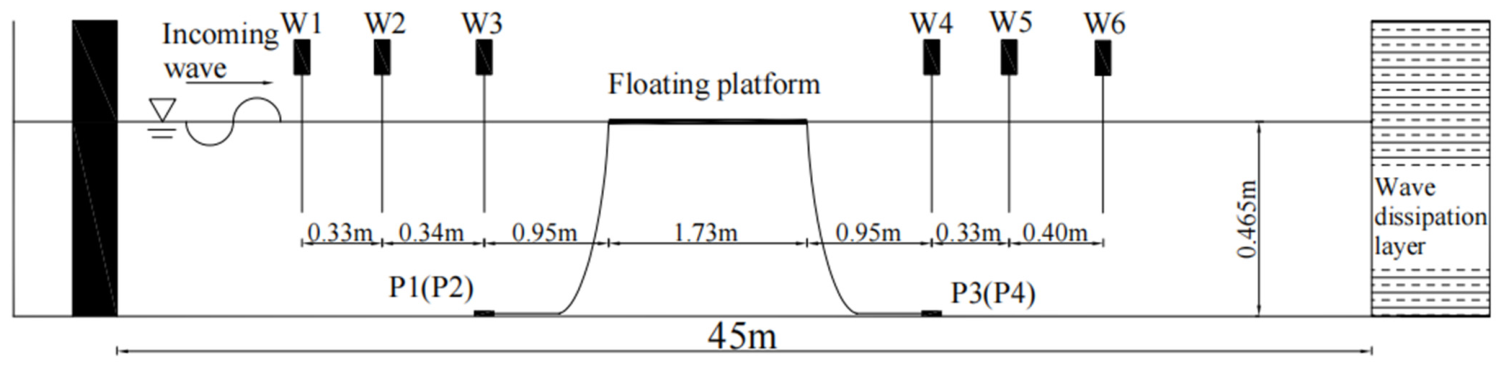
A series of hydrodynamic model tests was conducted in the wave tank at Tianjin University (Figure 6). The tank is 45 m long and 10.5 m wide, with a maximum operating water depth of 1.0 m and a test water depth of 0.465 m. Waves were generated by a low-inertia, AC servo-driven piston-type wavemaker (Tianjin University, Tianjin, China), which produces stable and repeatable wave conditions, including irregular waves based on the JONSWAP spectrum. The system operates over a period range of 0.5–5 s and has a maximum wave height of 0.5 m. To minimize wave reflections, a wave-absorbing beach was positioned at the downstream end of the tank.
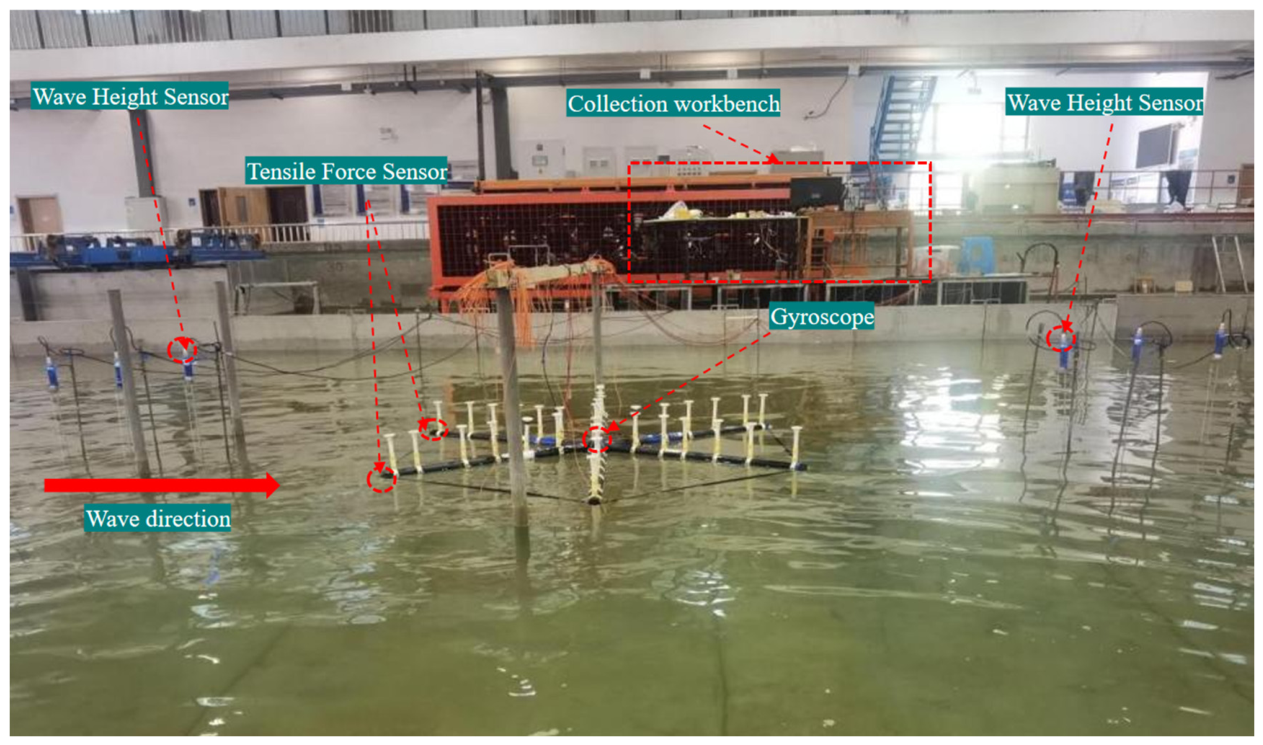
The experimental setup and instrumentation are illustrated In Figure 6. Six wave gauges were deployed along the tank centerline to measure free-surface elevations. To measure the dynamic responses of the floating platform, tensile force sensors were attang lines to record tension, and an inertial measurement unit (IMU) was mounted on the model to record motions. All experimental data were integrated and processed through the data-acquisition system at the collection workbench.

3.2. Model Arrangement

The model was placed at the center of the wave tank, as shown in Figure 7 and Figure 8, with its centroid aligned with the X-axis. It was positioned 15 m from the piston-type wavemaker, a distance sufficient to allow the incident-wave trains to develop while reducing near-field evanescent wave effects from the wavemaker paddle. The mooring system was attached at two adjacent sharp corners; anchor points P1 and P2 were connected to the two front (wave-facing) mooring lines. All mooring lines were initially slack during setup.
Figure 7. Sectional view (W1–W6 denote wave gauges; P1–P4 denote anchor points).
Jmse 14 01123 g007
Figure 8. Plan view (W1–W6 denote wave gauges; P1–P4 denote anchor points).
Jmse 14 01123 g008

3.3. Experimental Measurements

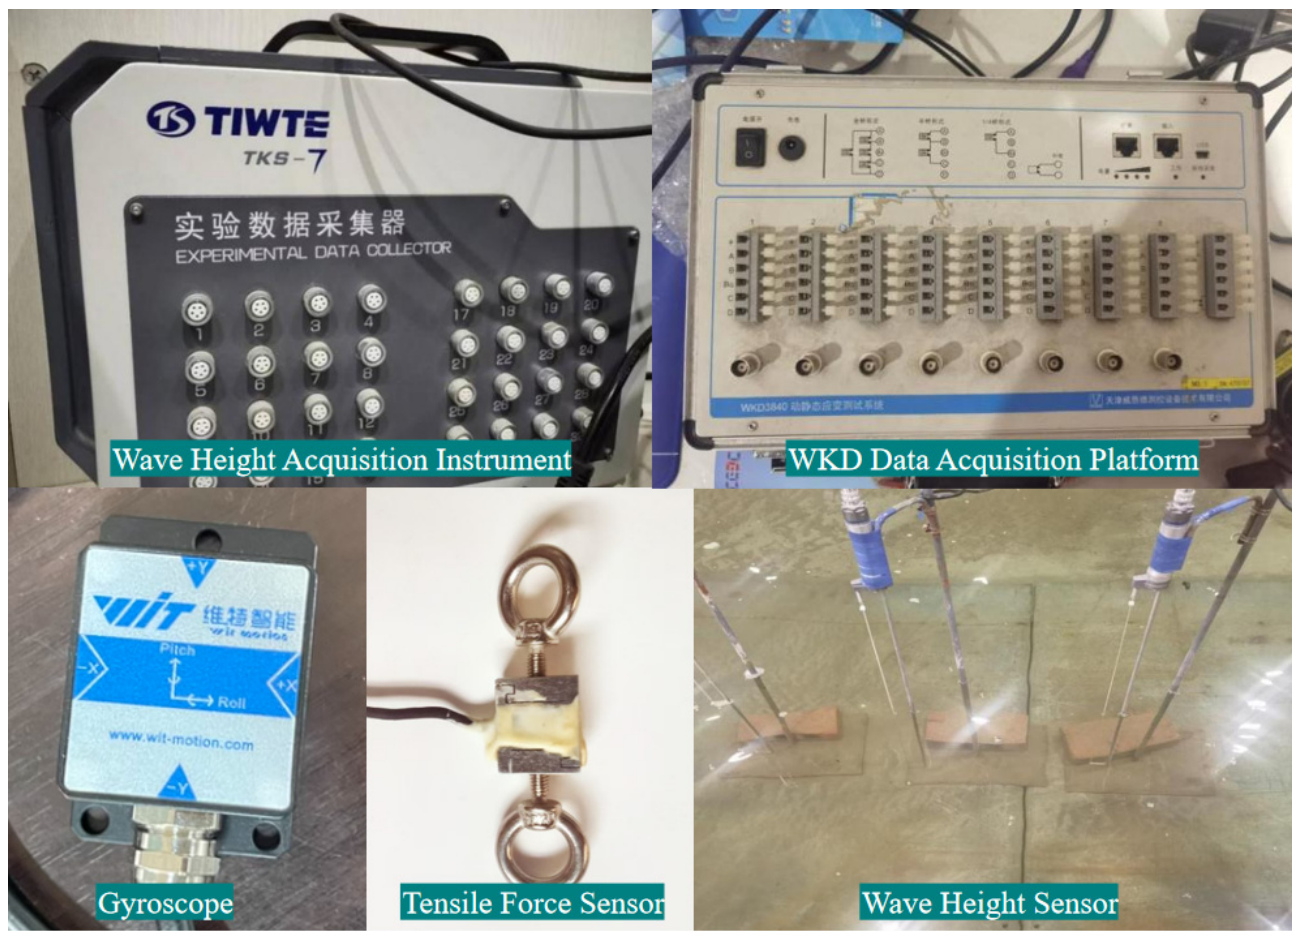
Free-surface elevations were measured using the TKS-7 wave gauge system (Tianjin Research Institute for Water Transport Engineering, Tianjin, China). The acquisition unit integrates an analog-to-digital (A/D) converter and samples all channels sequentially at 50 Hz (0.02 s per channel). It provides 64 channels, enabling synchronous measurements of wave elevations at multiple locations. All wave gauges were calibrated before testing, and the calibration linearity was required to be at least 0.999. Each gauge has a measurement range of 40 cm and an accuracy of 0.2 mm.
A WIT Smart SINDT-type miniature triaxial IMU (WitMotion Shenzhen Co., Ltd., Shenzhen, China) (labeled as “Gyroscope” in the instrumentation layout) was used to measure the angular motions and accelerations of the floating structure. The measurement ranges are +/−16 g for acceleration, +/−180 deg about the X- and Z-axes, and +/−90 deg about the Y-axis. The corresponding accuracies are 0.01 g/LSB for acceleration and 0.1 deg for angular displacement. The IMU was installed at the central convergence node of the hexagonal structure, and the data were transmitted to the host computer in real time via a wired connection at 50 Hz.
Mooring tensions were measured using Dayang Sensing S-type load cells (Bengbu Dayang Sensing System Engineering Co., Ltd., Bengbu, China) (labeled as “Tensile Force Sensor” in the instrumentation layout). Each sensor has a 0–50 N range, an accuracy of 0.005 N, and an IP68 waterproof rating. The load cell was mounted at the structural end, connecting the mooring line to the hexagonal frame. Tension signals were sampled at 20 Hz and recorded using a WKD3840 dynamic/static strain measurement system (Tianjin Weikende Technology Co., Ltd., Tianjin, China) configured with eight channels. The overall instrumentation layout is shown in Figure 9.

3.4. Wave Operating Conditions

3.4.1. Regular-Wave Tests

The experiments mainly adopted small-amplitude regular waves. However, under wave conditions WR5, WR15, WR19, and WR20, the wave steepness (H/L) exceeded 1/20, indicating finite-amplitude effects. Given the relatively shallow water depth and comparatively steep waves in the target marine environment, the 2nd-order Stokes wave theory was adopted to generate the incident regular waves. The free-surface elevation is expressed as Equation (3), together with the dispersion relationship in Equation (4), where ω is the angular frequency, d is water depth, φ is velocity potential, H is wave height, x is horizontal coordinate and k is the wave number.
φ = H 2 cos k x ω t + π H 2 4 L 1 + 3 2 sinh 2 k d coth k d cos 2 k x ω t
ω 2 = g k tanh ( k d )
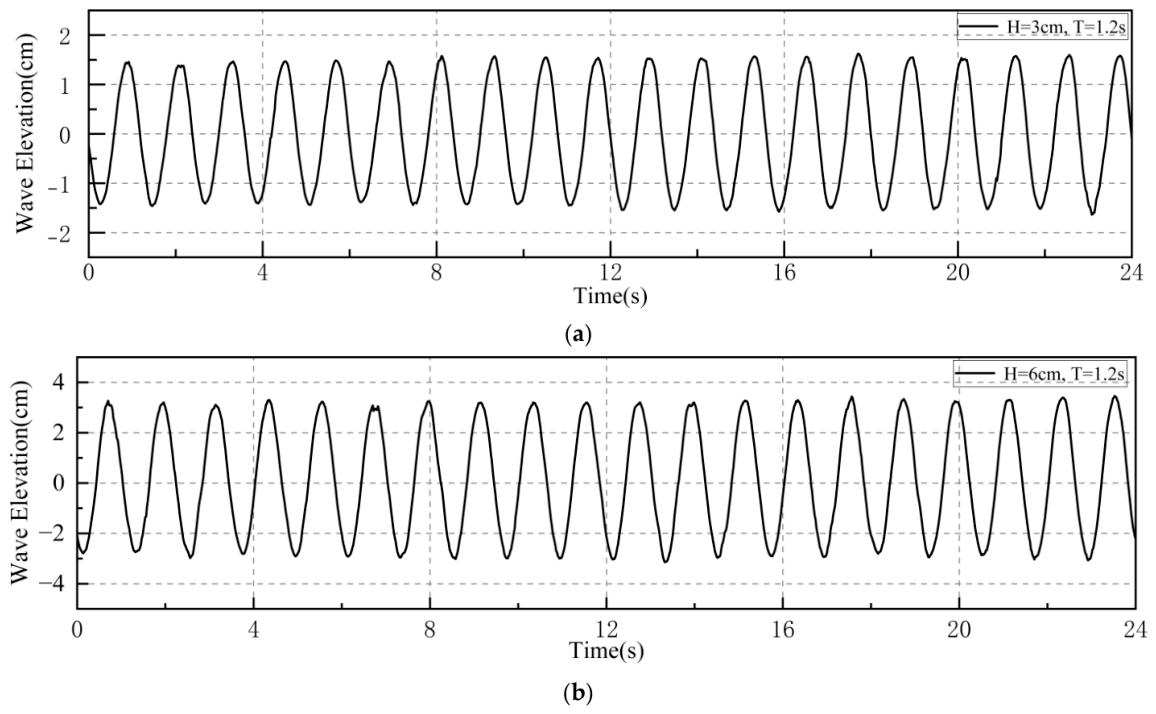
Before the model tests, the free-surface elevation in the empty tank was recorded at a sampling frequency of 50 Hz. The record length covered at least 20 wave periods. The measured wave height and period were controlled within +/−5% of the target values. The regular-wave cases are listed in Table 3. Taking WR2 and WR9 as examples, the measured time histories of free-surface elevation are presented in Figure 10. The generated regular waves were stable, exhibited approximately sinusoidal profiles, and showed good agreement between the measured and prescribed wave heights and periods.

3.4.2. Irregular-Wave Tests

In the formula, S ( f ) is the spectral density function (m2·s); f is the wave frequency (Hz); α is the spectral normalization coefficient; Hs is the significant wave height (m); fp is the spectral peak frequency (Hz); Tp is the spectral peak period (s); γ is the spectral peak elevation factor with a value of 2.1; σ is such that when f f p , σ = 0.09 ; when f < f p , σ = 0.07 .
S f = α H S 2 T P 4 f 5 exp 1.25 T p f 4 γ exp T p f 1 2 2 σ 2
Ocean waves are commonly modeled as stationary random processes. In laboratory studies, irregular waves are typically represented by a stationary Gaussian process and generated by specifying a target wave spectrum. Following relevant experimental guidelines, the JONSWAP spectrum was selected as the target spectrum for wind-generated waves. The spectral density function and associated parameters are given as follows:
α = 0.06238 0.230 + 0.336 γ 0.185 / ( 1.0 + γ )
In the experiments, the wavemaker input signals for irregular waves were generated using linear wave superposition. Under the assumption that irregular waves behave as a stationary random process, an irregular-wave train can be synthesized by superposing a theoretically infinite set of small-amplitude wave components with different frequencies and amplitudes. The corresponding free-surface elevation is expressed as
η = i = 1 N A i cos k i x ω i t + ε 1
In the formula, A is the wave amplitude, and ε is the phase.
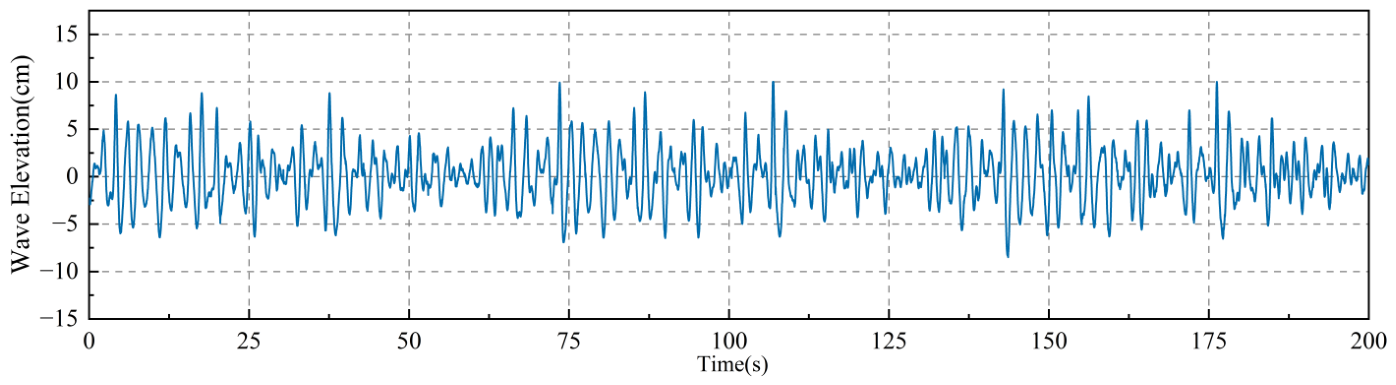
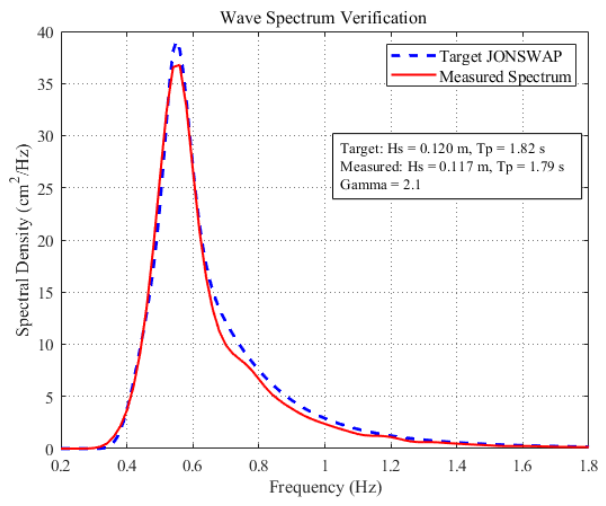
Before the model experiments, the free-surface elevation in the empty tank was recorded at a sampling frequency of 50 Hz over at least 100 wave periods. The measured spectrum was compared with the target JONSWAP spectrum, and the wavemaker parameters were adjusted until satisfactory agreement was achieved. The irregular-wave condition was derived from the wave and water-depth conditions of the Bohai Sea demonstration site. Under the 1:25 Froude scaling, the model-scale target condition (Hs = 0.12 m, Tp = 1.82 s) corresponds to a prototype sea state with Hs = 3.0 m, Tp = 9.1 s, and a water depth of approximately 11.625 m. For the adopted JONSWAP spectrum with gamma = 2.1, the zero-crossing period Tz is estimated as approximately 1.37 s at model scale and 6.86 s at prototype scale. The measured significant wave height was 0.117 m, and the measured peak period was 1.79 s, with relative deviations from the target values controlled within +/−5%, as shown in Figure 11 and Figure 12. The irregular-wave test conditions are listed in Table 4.

3.5. Data Statistics and Analysis Methods

3.5.1. RAO and Normalized Tension

The response amplitude operator (RAO) is defined based on the assumption of a linear relationship between wave excitation and the system dynamic response. Under monochromatic regular-wave conditions, the RAO is the ratio of the response amplitude to the incident-wave amplitude. For the proposed floating-island structure, this study focuses on the motion RAOs of the floater, calculated using Equation (8). In addition, F* denotes the normalized tension magnitude used to characterize the dynamic mooring response, as defined in Equation (9). This normalization enables consistent comparison across test conditions and provides a scale-independent interpretation of peak mooring load.
R A O x = f ( T ) = x T H T
In the formula x T is the amplitude of the dynamic response (acceleration and angle) of the system, H T is the wave height, and T is the period of the incident wave.
F * = F G
where F represents the mooring tension force, and G is the weight of the floating body.

3.5.2. Time- and Frequency-Domain Analysis of Hydrodynamic Response

To characterize the hydrodynamic response of the novel hexagonal offshore FPV structure under realistic sea conditions, stochastic wave simulations were used to reproduce oceanic wave properties. Accordingly, the hydrodynamic response also exhibits stochastic characteristics. Statistical analyses of the experimental data were conducted in both the time and frequency domains. In the time domain, parameters such as maximum, minimum, mean, and standard deviation were calculated. For mooring tension, the analysis focuses primarily on maximum values, whereas for acceleration and inclination angle, maximum, mean, and variance values are emphasized. The mean value and standard deviation are defined as follows:
x ¯ = 1 T i = 1 N x t i
σ = 1 T i = 1 N x t i x ¯ 2
Here, x ( t i ) denotes the physical quantity measured in the test, and (N) is the total number of samples, which is determined by the sampling frequency of the data-acquisition system. In this study, the sampling frequency for motion responses is 50 Hz, whereas that for force responses is 20 Hz.

3.5.3. Noise Filtering

To ensure data accuracy and reliability, noise filtering was implemented in the WKD3840 dynamic acquisition software. The system operated at a sampling frequency of 20 Hz with a low-pass filter configured as follows: lower cutoff frequency = 0 Hz, upper cutoff frequency = 10 Hz, filter order = 3, and transition-band attenuation = 1.0 dB/octave. This configuration suppressed high-frequency noise while preserving the low-frequency signal components required for subsequent ocean engineering analyses.

4. Results Under Regular Waves

4.1. Natural Periods of Oscillation

To reduce the influence of variations in surge restoring stiffness among the mooring configurations on the low-frequency response, M1, M2, and M3 were all set to a highly slack state, and free-decay tests were conducted in still water. By applying the same small initial displacement in each case, the natural periods of the floater in surge, heave, and pitch were identified, as summarized in Table 5. The heave and pitch natural periods are nearly identical across the three configurations, indicating that the mooring differences have negligible effects on these two degrees of freedom. In contrast, the surge response is more sensitive to the mooring arrangement. For M1, a distinct free-decay oscillation in surge was observed, yielding a natural period of approximately 7.5 s. For M2 and M3, however, the horizontal restoring forces were too weak under the highly slack condition to produce stable periodic surge oscillations; their low-frequency surge natural periods are therefore conservatively estimated to be no less than 7.5 s. In the subsequent wave tests, the incident-wave periods ranged from approximately 0.8 to 2.0 s, which are well separated from the low-frequency surge natural period and do not overlap with the heave or pitch natural periods. Consequently, this study focuses primarily on the influence of mooring line type on tension responses within the wave-frequency range.

4.2. Regular-Wave Motion Response

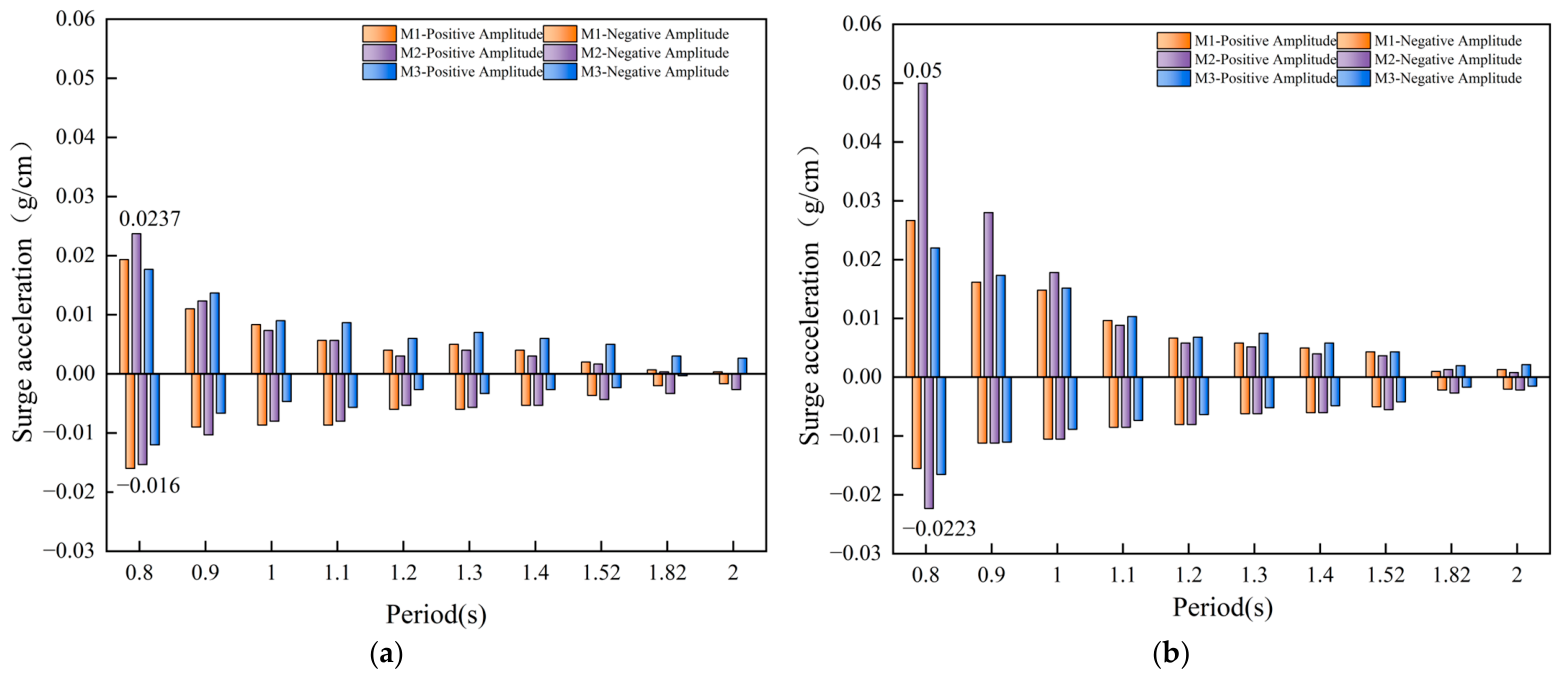
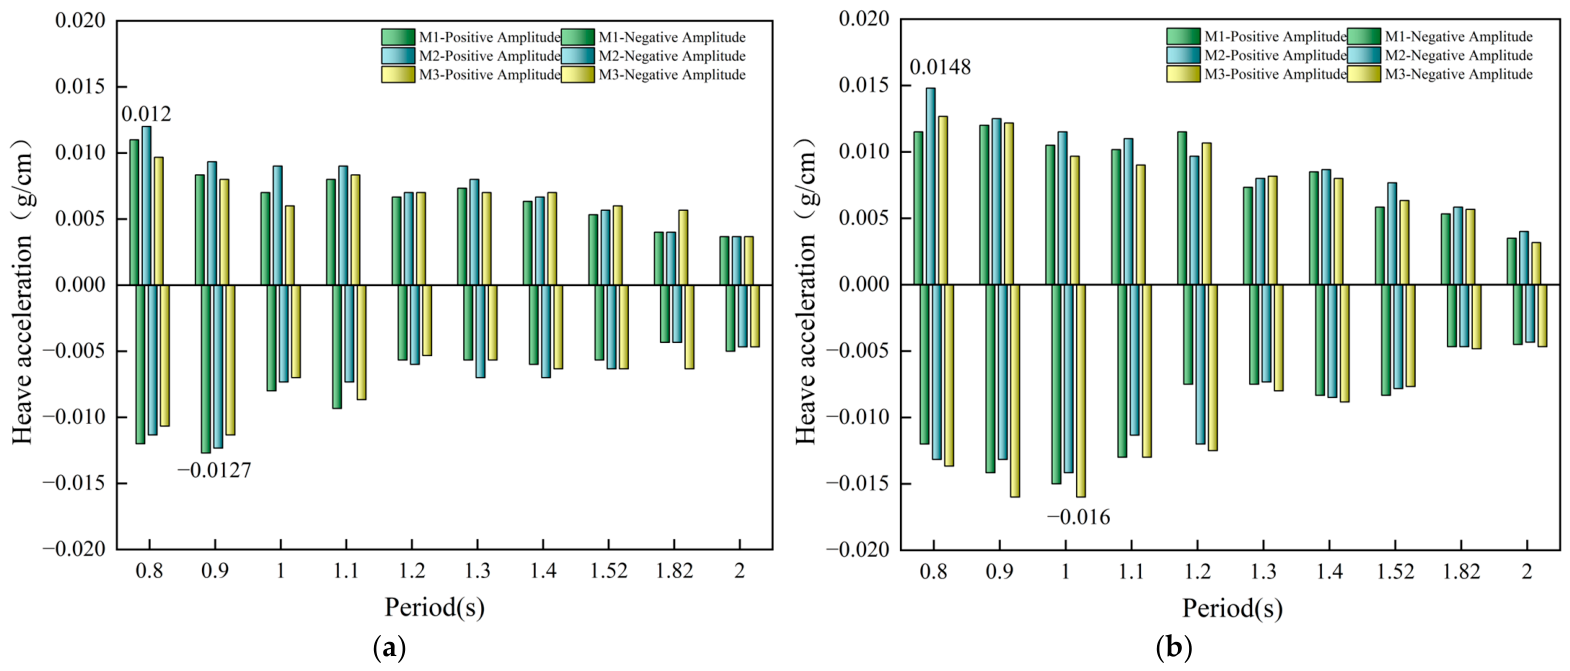
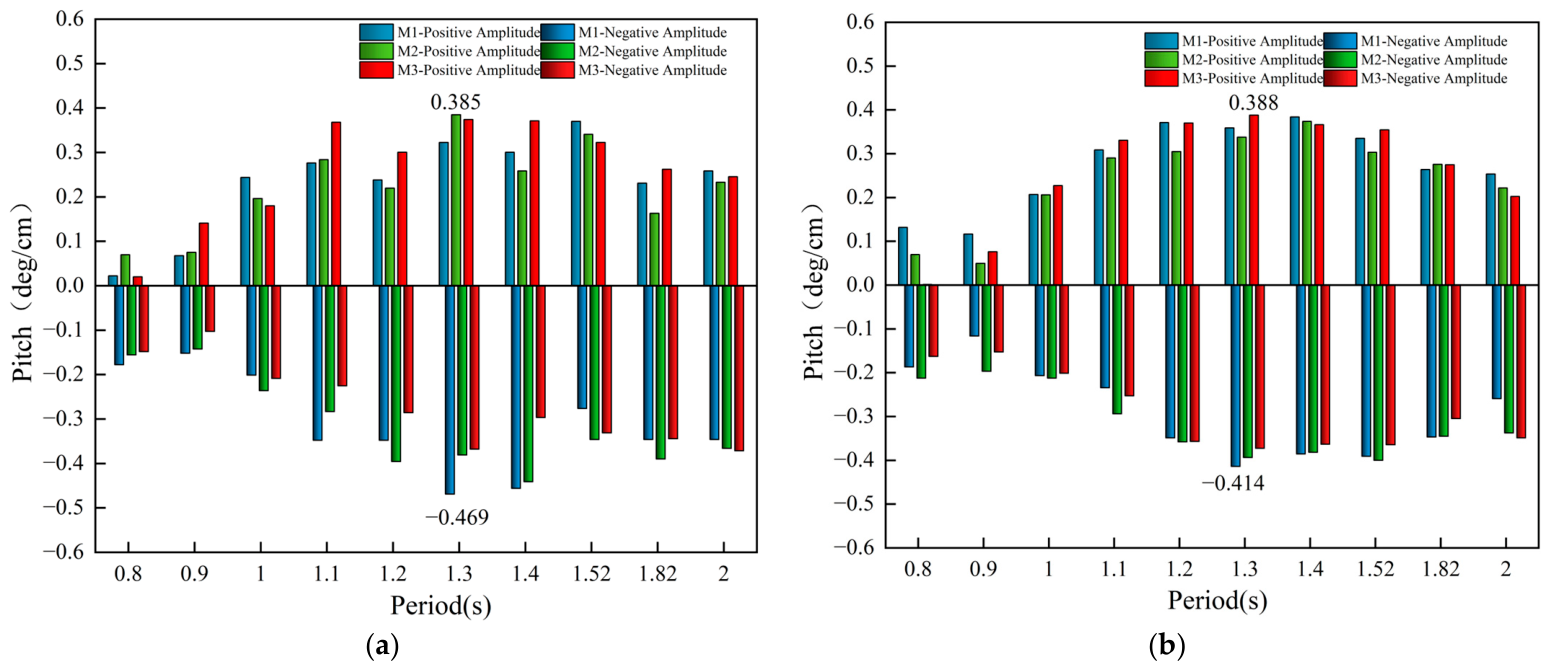
Motion responses are important indicators for assessing the dynamic stability and design performance of the floating platform. Regular-wave tests were conducted at wave heights of 3 cm and 6 cm, with wave periods ranging from 0.8 to 2.0 s. Because the incident waves were unidirectional, the measured motion components include surge acceleration, heave acceleration, and pitch angle. The corresponding RAOs were obtained by normalizing the measured responses by the incident-wave height. Figure 13, Figure 14 and Figure 15 present the motion RAOs of the three mooring configurations, namely anchor chain (M1), steel cable (M2), and elastic cable (M3).
For the 3 cm wave height, the surge-acceleration RAO generally decreases with increasing wave period (Figure 13a). In the high-frequency range (T < 1.2 s), the positive and negative branches show clear asymmetry and steep gradients, whereas they become more consistent and gradually decay toward zero at longer periods. The positive peak occurs at T = 0.8 s for all mooring cases, with M2 giving the largest value of 0.0237 g/cm, followed by M1 at 0.0193 g/cm and M3 at 0.0177 g/cm. The corresponding negative peaks are −0.0160, −0.0153, and −0.0120 g/cm for M1, M2, and M3, respectively. For the 6 cm wave height, the surge-acceleration RAO follows a similar decreasing trend but with larger amplitudes (Figure 13b). The wave-height effect is more pronounced for T < 1.3 s, whereas the responses tend to converge at longer periods. For example, under M2 at T = 0.8 s, the surge-acceleration RAO reaches 0.050 g/cm, more than twice the value obtained under the 3 cm wave height.
The heave-acceleration RAO also decreases with increasing wave period (Figure 14). For the 3 cm wave height, the positive peak occurs at T = 0.8 s, with M2 giving the largest value of 0.0120 g/cm, while the negative peak occurs at T = 0.9 s, with M1 showing the largest magnitude of −0.0127 g/cm. For the 6 cm wave height, the positive peak remains at T = 0.8 s, with M2 reaching 0.0128 g/cm, whereas the negative peak occurs at T = 0.9 s, with M3 reaching −0.0160 g/cm. At T = 2.0 s, the heave RAOs of all cases approach approximately 0.004 g/cm, indicating that the heave response is much less sensitive to mooring type than the surge response. This weak sensitivity is expected for the present shallow-draft platform because the heave response is governed mainly by hydrostatic restoring, added mass, and radiation damping, whereas the slack mooring lines contribute only weakly to vertical restoring.
The pitch RAO first increases and then decreases with Increasing wave period (Figure 15). For both wave heights, the positive pitch peak occurs at T = 1.3 s, with peak values of 0.385 and 0.388 deg/cm, respectively, indicating minor differences between the three mooring configurations. The stronger mooring effect on surge is mainly associated with the directional nature of the mooring restoring force. Under the present slack condition, the lines are mobilized primarily by horizontal platform excursion. Once engaged, the steel cable in M2 develops horizontal restoring force rapidly because of its high axial stiffness, leading to larger surge acceleration. By contrast, M1 buffers horizontal motion mainly through chain self-weight and catenary-geometry variation, with possible drag-related damping as a secondary contribution, while M3 reduces the effective axial stiffness through the spring element. Therefore, mooring properties directly affect surge response and mooring tension but have comparatively modest effects on heave and pitch, which are dominated by hydrostatic and hydrodynamic restoring mechanisms.

4.3. Regular-Wave Mooring Tension

The floating structure and mooring system adopt a centrosymmetric layout, with the mooring lines arranged parallel to the wave-propagation direction. In this study, the tensions in the two wave-facing lines (N1 and N2) are used as representative measurements. The sum of these two line tensions is defined as the total mooring force (TMF) acting on the wave-facing side, and their mean value is defined as the single mooring-line force (SMF).
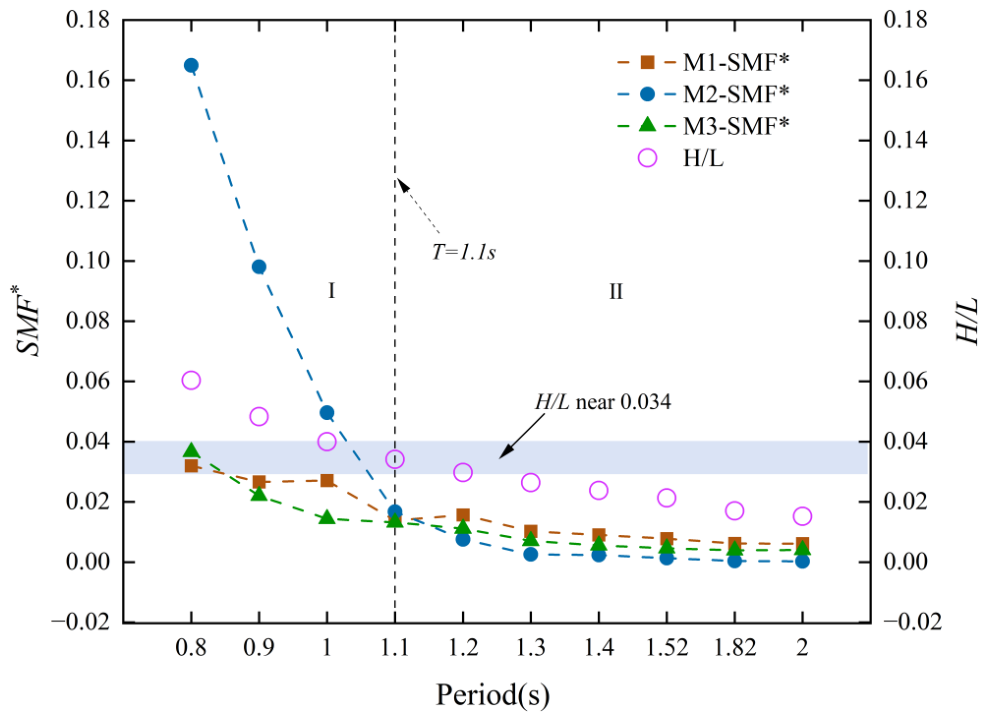
Because peak mooring load is a key design quantity for the mooring and anchoring system, the following discussion focuses on the maximum mooring force on the wave-facing side. Figure 16 compares the dimensionless maximum single-line mooring force (SMF*) of M1-M3 under the H = 6 cm regular-wave condition. Overall, SMF* decreases with increasing wave period, with a transition around T = 1.1 s. For shorter waves (T < 1.1 s, H/L ≥ 0.034), SMF* decreases rapidly with increasing period, and M2 produces markedly larger peak mooring forces than M1 and M3. Near T = 1.1 s, the three configurations approach similar SMF* levels. For longer waves (T > 1.1 s, H/L < 0.034), the reduction becomes more gradual and the differences between configurations are relatively small, with the magnitudes generally following M1 > M3 > M2.
For the same H = 6 cm regular-wave condition, the variation of SMF* with wave period in Figure 16 agrees more closely with the surge-acceleration RAO in Figure 13b than with the heave-acceleration and pitch RAOs in Figure 14b and Figure 15b. To quantify this relationship, linear regressions were performed between peak SMF* and the corresponding peak surge-acceleration RAO for each mooring configuration. The coefficient of determination, R2, which measures the goodness of fit of the linear regression, was 0.913, 0.991, and 0.985 for M1, M2, and M3, respectively. These values confirm a strong correlation between surge-dominated motion and peak mooring load. The different regression slopes further indicate that the load-transfer characteristics depend on mooring type; therefore, under the present slack-mooring condition, heave and pitch play secondary roles in determining peak mooring load.

5. Results in Irregular Waves

5.1. Irregular-Wave Motion Response

5.1.1. Surge

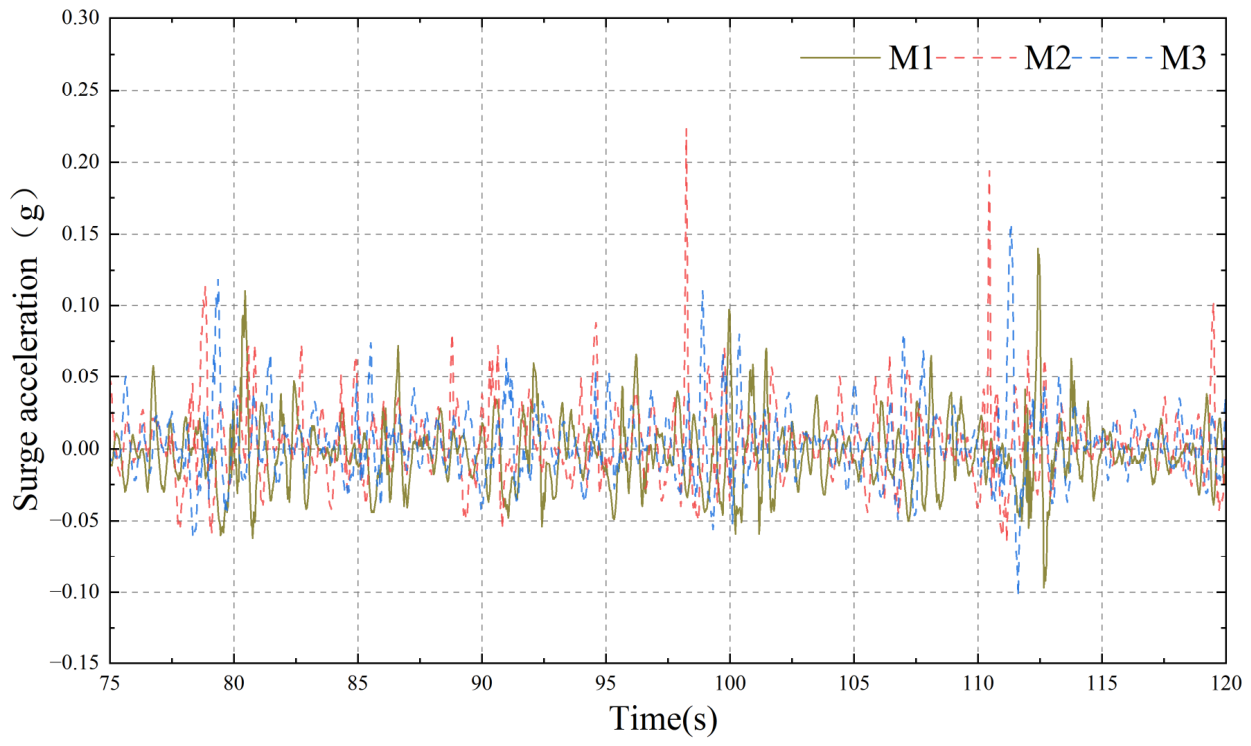
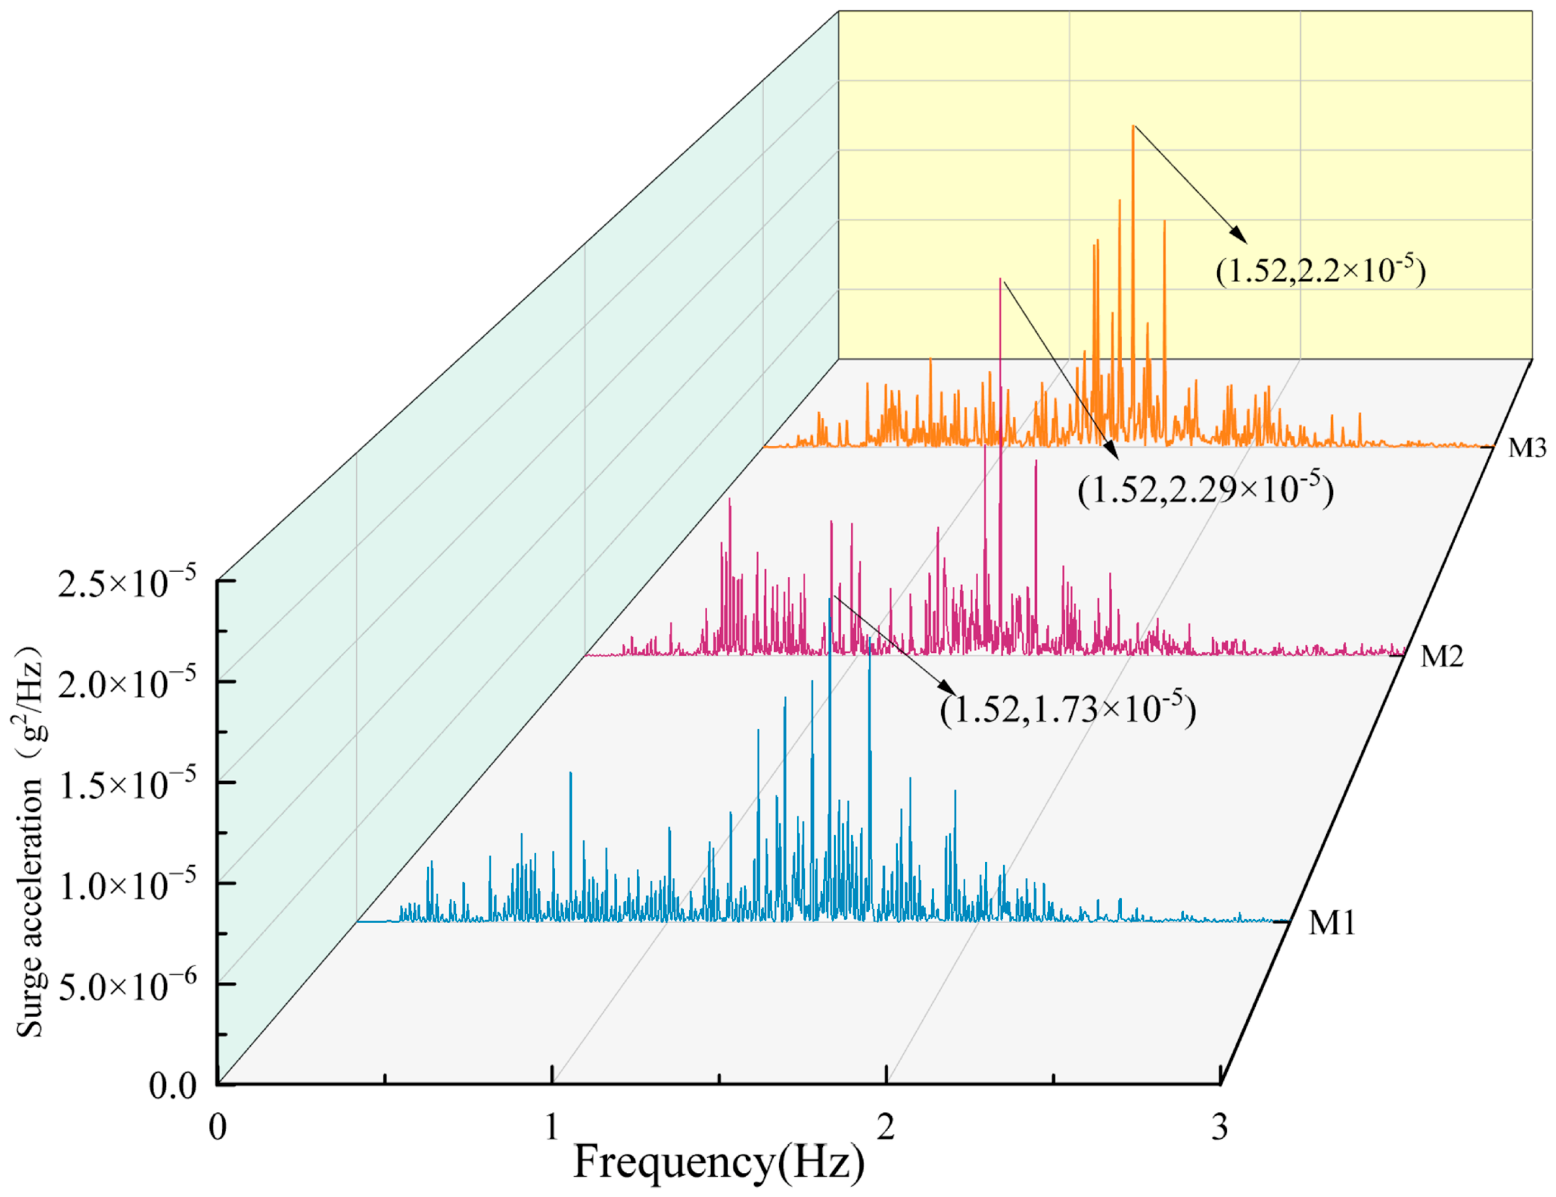
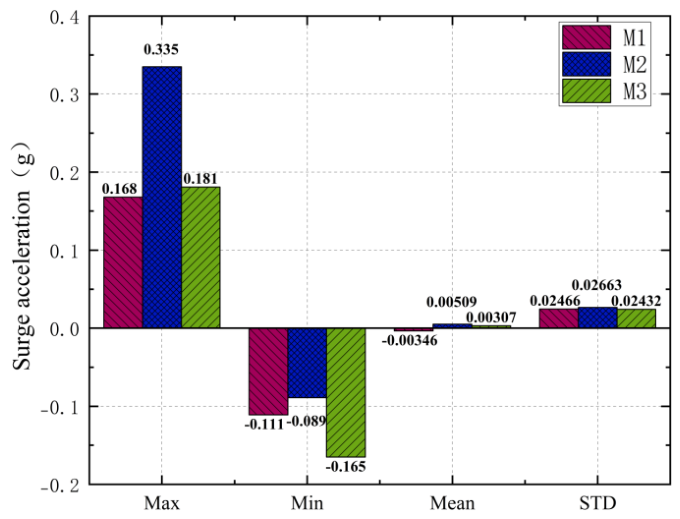
The motion responses of the floating structure under irregular-wave loading were investigated using surge acceleration, heave acceleration, and pitch angle as the key response metrics. Figure 17, Figure 18 and Figure 19 compare the time-domain response histories, frequency-domain power spectral density (PSD) distributions, and corresponding statistical indicators for cases M1–M3.
M2 exhibits the largest peak surge acceleration (0.335 g), which is substantially higher than those of M1 (0.168 g) and M3 (0.181 g). This amplified response is mainly attributed to the high axial stiffness and low extensibility of the steel-cable mooring. Under the present slack-mooring condition, wave-induced surge motion can cause rapid slack–taut transitions in M2; once the line is engaged, tension builds up over a short elongation interval, producing impulsive load-transfer characteristics. This snap-load-like behavior helps explain the higher transient surge-acceleration peaks of M2 and is consistent with its larger mooring-tension response.
Compared with M1, M3 shows a modest increase in peak surge acceleration (+7.7%). Because all cases are un-pre-tensioned and M3 consists of a spring-wire assembly, this increase is more plausibly explained by differences in the dynamic coupling between the platform and the mooring system. M3 provides less geometric compliance and less mass-related damping than the heavy catenary chain in M1; therefore, surge transients induced by wave groups are less effectively buffered. As a result, slightly higher instantaneous surge-acceleration peaks can occur in M3 (Figure 17 and Figure 19).
In the frequency domain, Figure 18 shows a dominant peak near 1.52 Hz for all three cases. The corresponding PSD maxima are 1.73 × 10⁻⁵, 2.29 × 10⁻⁵, and 2.19 × 10⁻⁵ g2/Hz for M1, M2, and M3, respectively, indicating that the response energy is concentrated in the primary frequency band. In the low-frequency range of 0.53–0.69 Hz, M2 exhibits higher energy density than M1 and M3 by 32.4% and 29.7%, respectively. This comparison indicates that the anchor-chain mooring (M1) suppresses low-frequency surge energy more effectively, mainly because of chain self-weight, catenary reconfiguration, and possible drag-related damping as a secondary contribution. These mechanisms provide a more gradual load-transfer process and reduce surge-energy accumulation. Overall, the anchor-chain configuration is the most effective of the three in limiting surge-energy accumulation in the frequency domain.

5.1.2. Heave

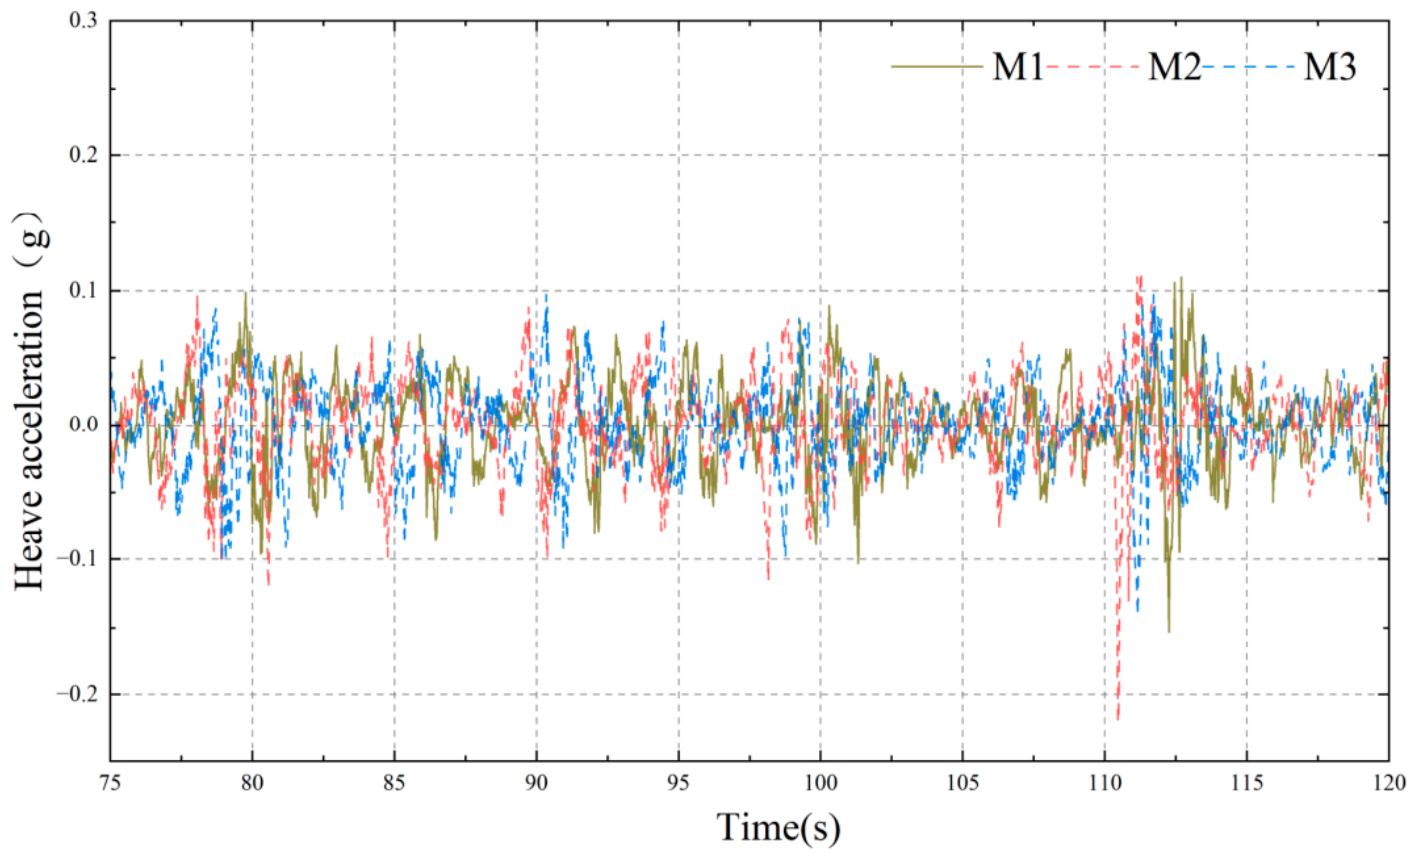
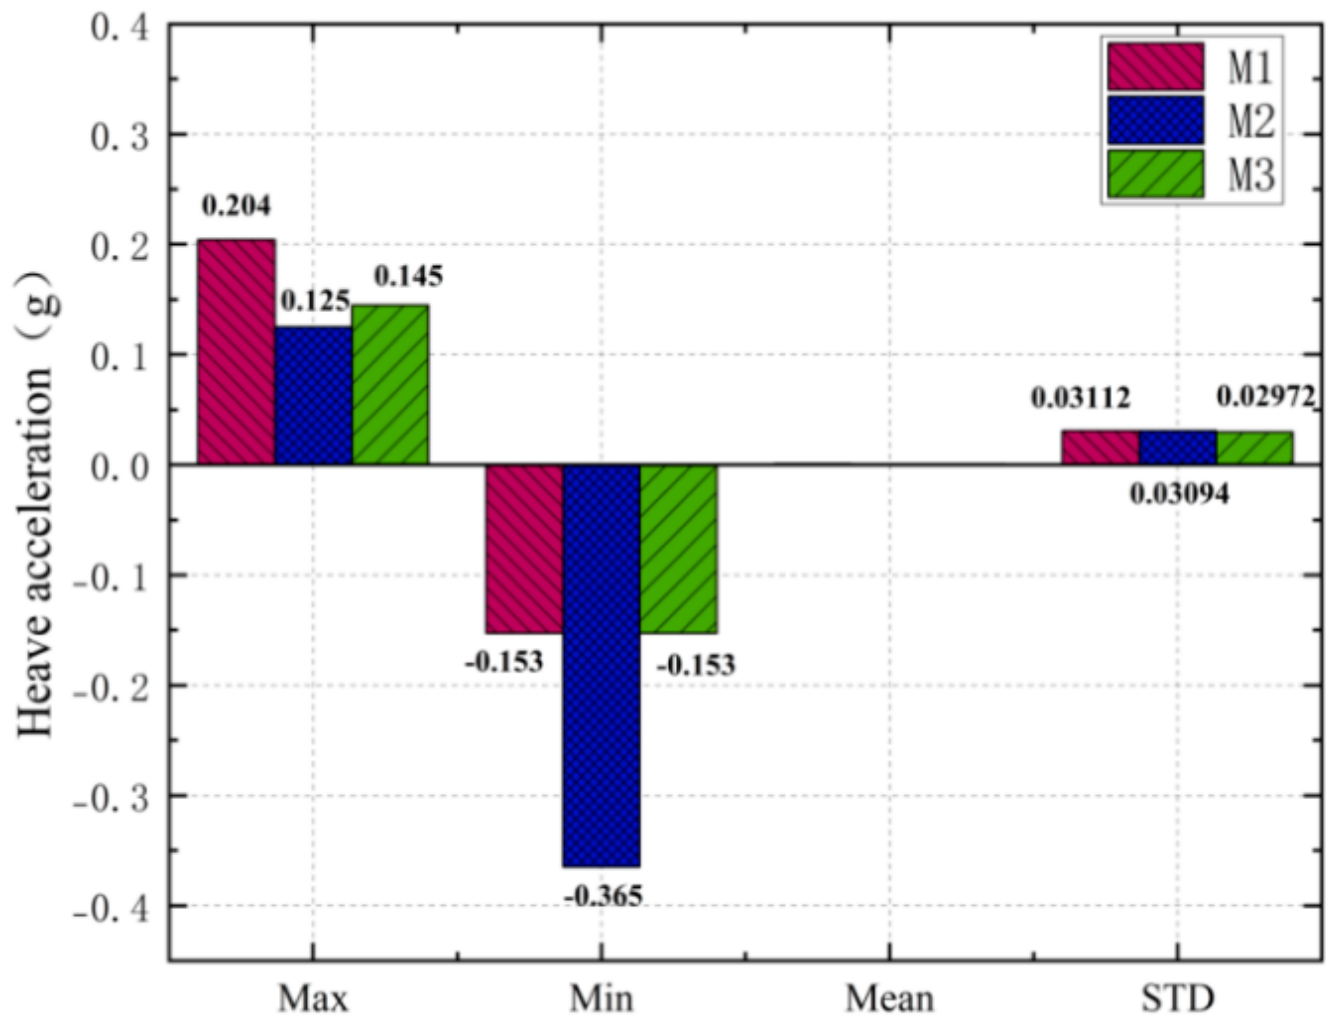
The heave-acceleration responses exhibit different instantaneous peak characteristics among the three mooring configurations (Figure 20). M1 reaches the largest positive peak of 0.204 g, whereas M2 shows a pronounced negative extreme of −0.365 g. M3 presents a more balanced response, with positive and negative peaks of 0.145 g and −0.153 g, respectively. However, the large negative peak of M2 does not correspond to a sustained increase in heave-response intensity because the standard deviations remain close for all cases, with values of approximately 0.03 g (Figure 21). This suggests that the M2 negative extreme is more likely a transient event, potentially associated with rapid tension build-up of the high-stiffness steel cable during a surge-dominated slack–taut transition, in which the vertical force component may induce a short-duration downward acceleration.
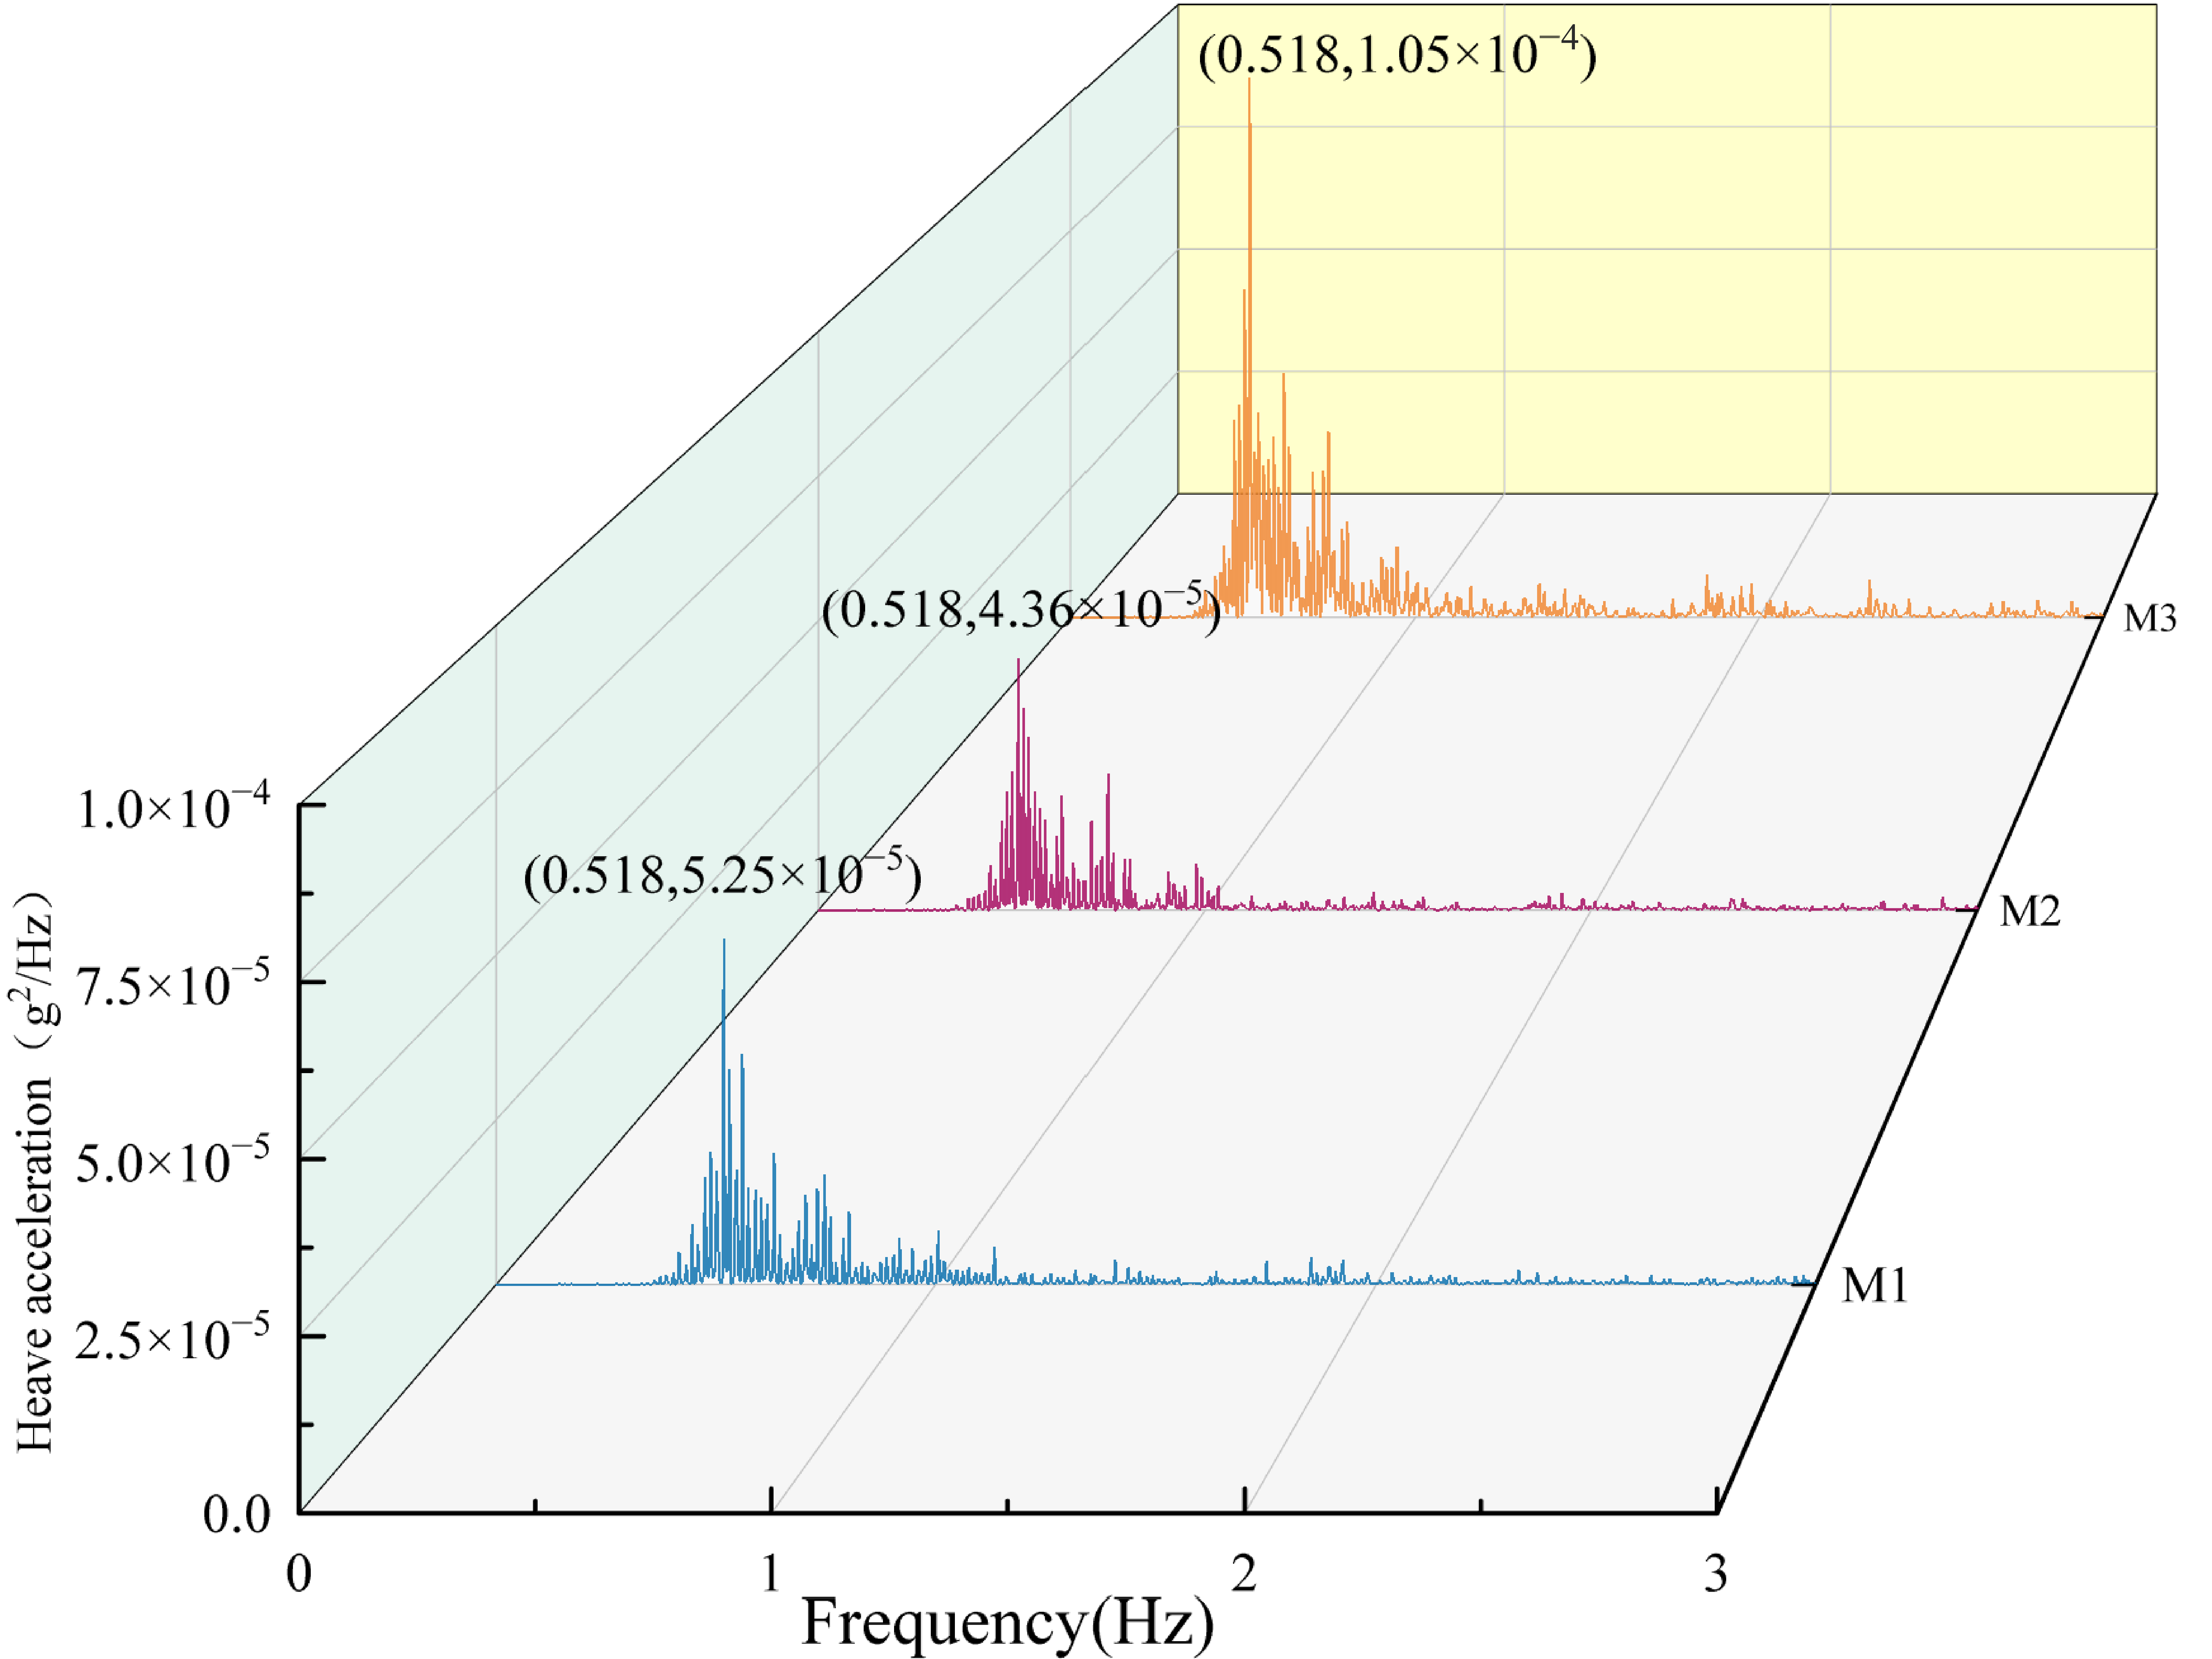
In the frequency domain, all three PSD spectra show a dominant peak at 0.518 Hz, corresponding to the spectral peak period of 1.82 s in the model-scale irregular-wave test (Figure 22). The spectral energy densities at this frequency are 5.25 × 10⁻⁵, 4.36 × 10⁻⁵, and 5.24 × 10⁻⁵ g2/Hz for M1, M2, and M3, respectively. The close dominant frequency and similar standard deviations indicate that the overall heave response is governed primarily by the incident-wave excitation and hydrostatic–hydrodynamic restoring characteristics, whereas the mooring configuration mainly affects isolated transient peaks rather than the global heave-response level.

5.1.3. Pitch

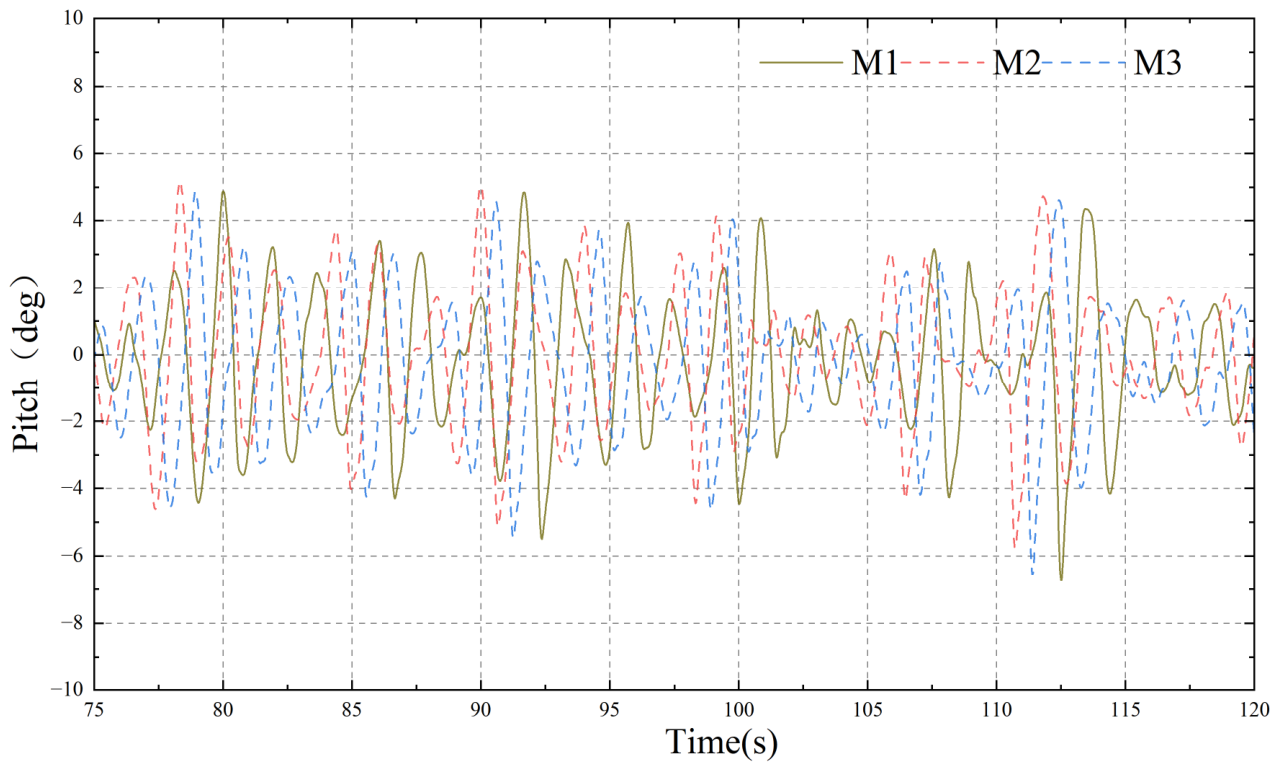
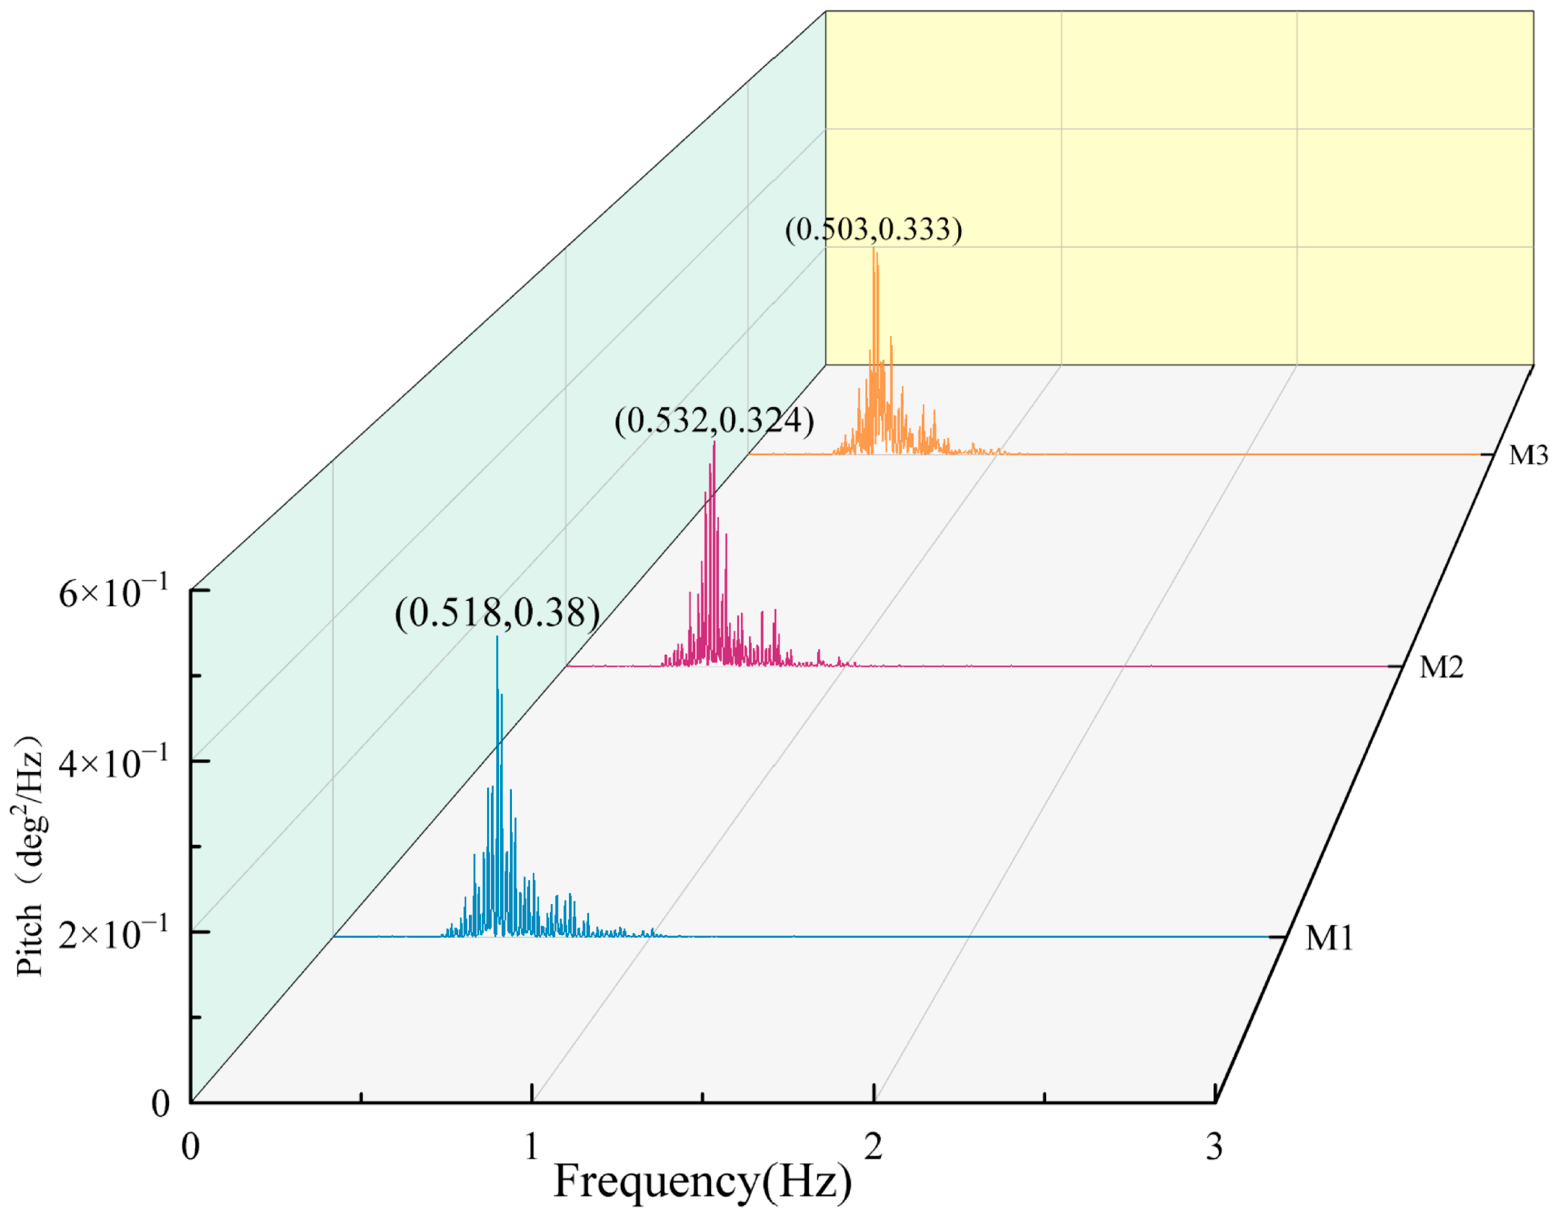
The pitch-response histories (Figure 23) show that M1, M2, and M3 oscillate at comparable dominant frequencies, while M1 exhibits the largest instantaneous amplitudes under the tested extreme irregular-wave condition. Consistently, the spectra in Figure 24 show that the dominant energy of all cases is concentrated near the incident-wave peak frequency, with peak frequencies of 0.518, 0.532, and 0.503 Hz for M1, M2, and M3, respectively. The corresponding PSD maxima are 0.38, 0.32, and 0.33 deg2/Hz, indicating that the mooring configuration mainly affects the response energy level, whereas the dominant pitch frequency remains governed by the incident-wave spectrum.
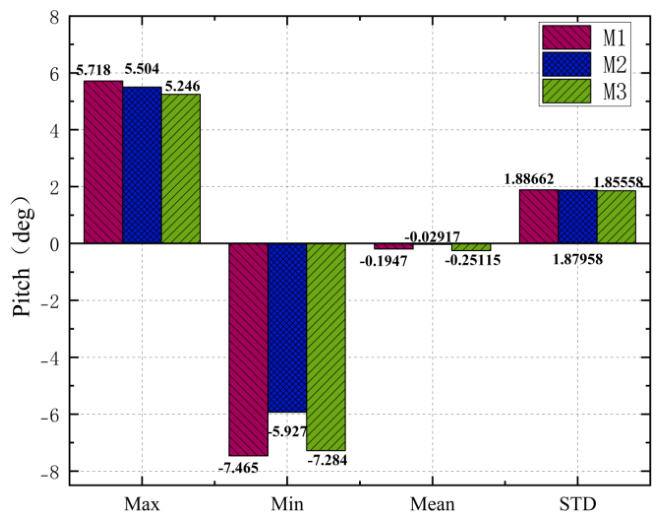
The statistical results in Figure 25 further show clear asymmetry in the pitch response, with negative extremes exceeding positive ones. M1 gives the largest response range, with a positive peak of 5.718 deg and a negative extreme of −7.465 deg. This asymmetric behavior may be partly influenced by irregular-wave asymmetry, but the differences among mooring configurations indicate that direction-dependent engagement of the slack mooring system also plays an important role. Under wave excitation, the wave-facing lines are more readily tensioned and can introduce a downward vertical component at the front part of the platform, whereas the leeward lines remain weakly tensioned for a larger portion of the response cycle. This asymmetric constraint is more pronounced for M1 because the chain self-weight leads to a more vertical local line geometry after engagement, thereby increasing the mooring-induced pitching moment.
From a design perspective, signed pitch extremes should be considered when checking the local freeboard, possible water contact at the platform edges, PV-support connections, and flexible electrical connectors rather than relying only on RMS or absolute pitch values. For geometrically similar slack-mooring systems, a similar asymmetric tendency may occur at prototype scale, although its magnitude may be affected by line–seabed interaction, viscous damping, wind loading, and structural flexibility.

5.2. Irregular-Wave Mooring Tension

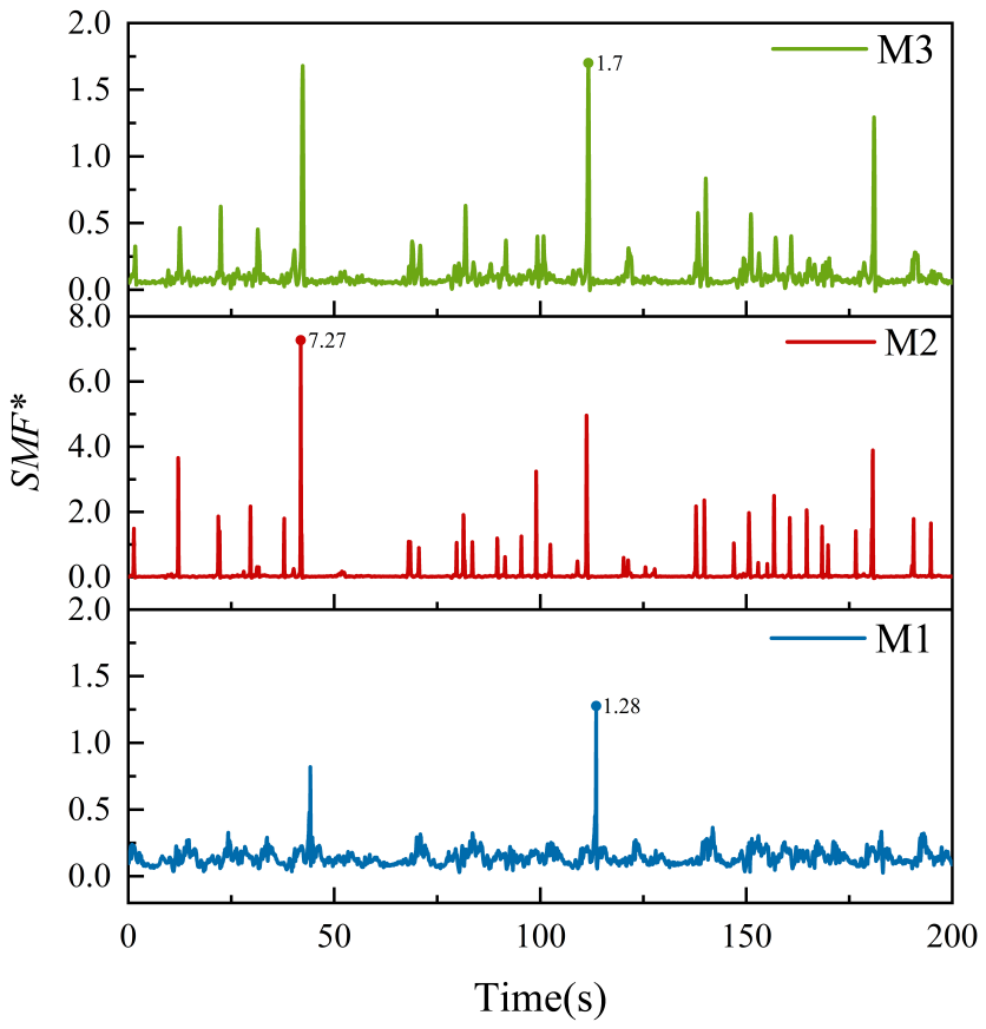
In this section, the extreme irregular sea state is characterized by a spectral peak period of Tp = 1.82 s and a significant wave height of Hs = 12 cm. The mooring-tension responses of the three configurations are analyzed using the dimensionless single-line mooring force, SMF*.
Figure 26 shows the time histories of SMF* under the extreme irregular-wave condition. For M1, the peak SMF* is 1.28, and the extreme events occur intermittently, reflecting the stochastic nature of irregular-wave excitation. M2 exhibits the largest peak SMF* of 7.27, indicating severe tension concentration. This is consistent with the high axial stiffness and low extensibility of the steel cable, which allow surge-dominated platform motions to be transferred rapidly into tension peaks during slack–taut transitions.
Among the three configurations, M1 gives the lowest peak SMF* under the present slack-mooring condition. This behavior is mainly attributed to the chain self-weight and catenary-geometry variation. During platform excursion, part of the motion is accommodated by progressive chain lifting and adjustment of the suspended line shape rather than by rapid axial stretching. The chain may also introduce additional drag-related damping during relative motion, as commonly considered in mooring-line damping models [39], although this contribution was not separately quantified here. The larger mass and submerged surface area of the chain may also provide additional drag-related damping during relative motion; however, this contribution was not measured separately and is therefore regarded as a secondary qualitative mechanism. These effects lead to a more gradual load build-up and reduce transient peak tensions.
In comparison, the peak SMF* of M3 reaches 1.70, which is 32.81% higher than that of M1 but still much lower than that of M2. The elastic mooring can alleviate abrupt load transfer through spring deformation; however, once the initial slack is reduced, its response becomes increasingly governed by the equivalent axial stiffness of the spring-steel-wire assembly. Under broadband irregular-wave excitation, repeated stretching and recoil of the elastic element may superpose dynamic tension components during large surge excursions, resulting in higher transient peaks than those of M1. Therefore, M3 provides effective load mitigation relative to M2, whereas M1 shows stronger peak-load buffering under the present slack-mooring condition.
The peak SMF* events are closely associated with extreme surge acceleration, consistent with the regular-wave observations. This indicates that extreme mooring loads in irregular seas are controlled primarily by surge-dominated transient dynamics, whereas heave and pitch play secondary roles in the peak-tension response. This transient-load mechanism is also consistent with safety assessment under fluctuating environmental excitation [40].
To facilitate direct comparison between the three mooring configurations, representative response metrics under typical regular-wave and extreme irregular-wave conditions are summarized in Table 6. For regular waves, peak RAO values are reported for surge and heave, while signed peak ranges are reported for pitch. For the extreme irregular-wave case, standard deviations, signed pitch extremes, and peak dimensionless mooring tension are listed to summarize the main stochastic response characteristics.

6. Conclusions

This study conducted 1:25-scale physical model tests to evaluate the coupled hydrodynamic and mooring behavior of a novel large-scale hexagonal rigid FPV platform. A near-zero-pre-tension slack mooring arrangement was adopted to isolate the effects of mooring type, ensuring that the observed differences could be attributed primarily to line characteristics rather than initial pre-tension. Based on the evaluation of three mooring configurations—catenary anchor chain (M1), steel cable (M2), and elastic cable (M3)—the main findings are summarized as follows.
  • The results reveal a strong degree-of-freedom dependence on the influence of mooring configuration. Owing to the shallow draft and small waterplane area of the hexagonal platform, surge motion is strongly affected by horizontal restoring stiffness and is therefore sensitive to mooring axial properties. In regular waves, the maximum surge-acceleration RAO of M2 is 1.82 times that of M1 and 2.27 times that of M3, whereas the heave and pitch responses remain largely consistent across the three mooring configurations. This indicates that mooring-line optimization can effectively influence in-plane surge response while having only limited effects on vertical and pitching responses relevant to PV system stability.
  • The tests also demonstrate that mooring load transfer is dominated by surge-related platform motion, as shown by the strong linear correlation between peak mooring tension and maximum surge acceleration in both regular and irregular waves. This indicates that extreme mooring loads are governed primarily by surge-dominated dynamics rather than by direct wave forcing on the lines. Under similar slack-mooring conditions, surge acceleration can therefore serve as a useful preliminary indicator of critical mooring-load events, although direct tension analysis remains necessary for final mooring and anchoring design.
  • The comparative results show that the anchor-chain mooring (M1) provides the most effective peak-tension mitigation under the present slack-mooring conditions. This behavior is mainly attributed to chain self-weight, catenary reconfiguration, progressive load mobilization, and possible drag-related damping as a secondary contribution, which together slow tension build-up during slack–taut transitions. Under extreme irregular waves, the peak tension of M1 was 82.4% and 24.7% lower than those of M2 and M3, respectively. This finding should be interpreted as short-term peak-tension mitigation rather than universal superiority; practical mooring selection should also consider fatigue, allowable excursion, seabed interaction, durability, and installation/maintenance cost.
The present findings are most applicable to large-scale, low-freeboard, shallow-draft FPV platforms with similar slack-mooring layouts. For geometrically similar platforms or arrays, the observed trends provide useful qualitative guidance for mooring-configuration selection and response assessment. Future work should further incorporate wind and current effects, multi-body array interactions, and coupled experimental-numerical fatigue evaluation.

Author Contributions

H.L.: Methodology, validation, formal analysis, investigation, data curation, writing—original draft, and writing-review and editing. J.L.: Conceptualization, methodology, validation, investigation, supervision, funding acquisition, and project administration. D.L.: Writing—review and editing, validation, and supervision. Z.C.: Investigation and data curation. Y.L.: Investigation and data curation. All authors have read and agreed to the published version of the manuscript.

Funding

This work was supported by the National Key R&D Program of China (No. 2022YFB4200700), the National Natural Science Foundation of China (No. U21A201200), and the National Natural Science Foundation of China (No. 12572279).

Data Availability Statement

The data presented in this study are available from the first author or corresponding author upon reasonable request.

Conflicts of Interest

The authors declare no conflicts of interest.

References

  1. Djalab, A.; Djalab, Z.; El Hammoumi, A.; Marco Tina, G.; Motahhir, S.; Laouid, A.A. A comprehensive Review of Floating Photovoltaic Systems: Tech Advances, Marine Environmental Influences on Offshore PV Systems, and Economic Feasibility Analysis. Sol. Energy 2024, 277, 112711. [Google Scholar] [CrossRef]
  2. Kjeldstad, T.; Lindholm, D.; Marstein, E.; Selj, J. Cooling of floating photovoltaics and the importance of water temperature. Sol. Energy 2021, 218, 544–551. [Google Scholar] [CrossRef]
  3. Redon Santafe, M.; Torregrosa Soler, J.B.; Sanchez Romero, F.J.; Ferrer Gisbert, P.S.; Ferran Gozalvez, J.J.; Ferrer Gisbert, C.M. Theoretical and experimental analysis of a floating photovoltaic cover for water irrigation reservoirs. Energy 2014, 67, 246–255. [Google Scholar] [CrossRef]
  4. Minoofar, A.; Zandi, A.; Gholami, A. Precise prediction models for floating and land-based Photovoltaics: Comparative analysis for advancing sustainable energy and water management solutions. Renew. Energy 2025, 255, 123781. [Google Scholar] [CrossRef]
  5. Wang, G.; Ji, X.; Zou, T.; Chen, Z. Effect evaluation of frame perforation on reducing photovoltaic panel temperature with passive air cooling. Case Stud. Therm. Eng. 2025, 76, 107296. [Google Scholar] [CrossRef]
  6. Shi, W.; Yan, C.; Ren, Z.; Yuan, Z.; Liu, Y.; Zheng, S.; Li, X.; Han, X. Review on the development of marine floating photovoltaic systems. Ocean Eng. 2023, 286, 115560. [Google Scholar] [CrossRef]
  7. Cai, W.; Li, X.; Maleki, A.; Pourfayaz, F.; Rosen, M.A.; Nazari, M.A.; Dieu Tien, B. Optimal sizing and location based on economic parameters for an off-grid application of a hybrid system with photovoltaic, battery and diesel technology. Energy 2020, 201, 117480. [Google Scholar] [CrossRef]
  8. Yi, S.; Abbasi, K.R.; Hussain, K.; Albaker, A.; Alvarado, R. Environmental concerns in the United States: Can renewable energy, fossil fuel energy, and natural resources depletion help? Gondwana Res. 2023, 117, 41–55. [Google Scholar] [CrossRef]
  9. Oliveira-Pinto, S.; Rosa-Santos, P.; Taveira-Pinto, F. Assessment of the potential of combining wave and solar energy resources to power supply worldwide offshore oil and gas platforms. Energy Convers. Manag. 2020, 223, 113299. [Google Scholar] [CrossRef]
  10. Wang, Z.; Carriveau, R.; Ting, D.S.K.; Xiong, W.; Wang, Z. A review of marine renewable energy storage. Int. J. Energy Res. 2019, 43, 6108–6150. [Google Scholar] [CrossRef]
  11. Raimundo, D.R.; Nakao Cavaliero, C.K.; Pereira da Cunha, M. Contribution of floating photovoltaic systems in hydropower plants for the expansion of Brazilian electricity sector. Renew. Energy 2025, 254, 123754. [Google Scholar] [CrossRef]
  12. Golroodbari, S.Z.M.; Vaartjes, D.F.; Meit, J.B.L.; van Hoeken, A.P.; Eberveld, M.; Jonker, H.; van Sark, W.G.J.H.M. Pooling the cable: A techno-economic feasibility study of integrating offshore floating photovoltaic solar technology within an offshore wind park. Sol. Energy 2021, 219, 65–74. [Google Scholar] [CrossRef]
  13. Güllü, E.; Doğru Mert, B.; Nazligul, H.; Demirdelen, T.; Gurdal, Y. Experimental and theoretical study: Design and implementation of a floating photovoltaic system for hydrogen production. Int. J. Energy Res. 2022, 46, 5083–5098. [Google Scholar] [CrossRef]
  14. Nookuea, W.; Campana, P.E.; Yan, J. Evaluation of Solar PV and Wind Alternatives for Self Renewable Energy Supply: Case Study of Shrimp Cultivation. Energy Procedia 2016, 88, 462–469. [Google Scholar] [CrossRef]
  15. Dubey, S.; Sarvaiya, J.N.; Seshadri, B. Temperature Dependent Photovoltaic (PV) Efficiency and Its Effect on PV Production in the World—A Review. Energy Procedia 2013, 33, 311–321. [Google Scholar] [CrossRef]
  16. Ferrer-Gisbert, C.; Ferran-Gozalvez, J.J.; Redon-Santafe, M.; Ferrer-Gisbert, P.; Sanchez-Romero, F.J.; Bautista Torregrosa-Soler, J. A new photovoltaic floating cover system for water reservoirs. Renew. Energy 2013, 60, 63–70. [Google Scholar] [CrossRef]
  17. Ikhennicheu, M.; Danglade, B.; Pascal, R.; Arramounet, V.; Trébaol, Q.; Gorintin, F. Analytical method for loads determination on floating solar farms in three typical environments. Sol. Energy 2021, 219, 34–41. [Google Scholar] [CrossRef]
  18. Wang, J.; Lund, P.D. Review of Recent Offshore Photovoltaics Development. Energies 2022, 15, 7462. [Google Scholar] [CrossRef]
  19. Lian, J.; Cao, Z.; Lu, W.; Li, P.; Liu, D.; Yao, Y.; Shao, N.; Li, H. Experimental investigation on the dynamic characteristics of connector and mooring force for a novel pontoon-type offshore floating photovoltaic array. Sol. Energy 2025, 301, 113912. [Google Scholar] [CrossRef]
  20. Moss Maritime. Offshore Floating Solar Power. Available online: https://www.mossww.com/offshore-floating-solar-power/ (accessed on 10 June 2025).
  21. Oceans of Energy. The First Large-Scale Offshore Solar Farm Within an Offshore Wind Farm. Available online: https://oceansofenergy.blue/ (accessed on 6 July 2025).
  22. Xu, W.; Sun, Y.; He, Z. Hydrodynamic performance study of floating photovoltaic arrays with multiple floating bodies. Appl. Ocean Res. 2024, 153, 104286. [Google Scholar] [CrossRef]
  23. Sokukcu, M.; Sakar, C. Risk analysis of collision accidents during underway STS berthing maneuver through integrating fault tree analysis (FTA) into Bayesian network (BN). Appl. Ocean Res. 2022, 126, 103290. [Google Scholar] [CrossRef]
  24. Xu, S.; Soares, C.G. Parametric study on the short-term extreme mooring tension of nylon rope for a point absorber. Ocean. Eng. 2023, 267, 113248. [Google Scholar] [CrossRef]
  25. Xu, H.; Rui, S.; Shen, K.; Guo, Z. Investigations on the mooring safety considering the coupling effect of the mooring line snap tension and anchor out-of-plane loading. Appl. Ocean Res. 2023, 141, 103753. [Google Scholar] [CrossRef]
  26. Yang, Y.; Mi, C.; Ou, B.; Wong, A.; Duffy, J.G.; Wood, T.; Utama, I.; Chen, W.; Huang, L. A comparative experimental study on the hydrodynamic performance of two floating solar structures with a breakwater in waves. Sol. Energy 2024, 284, 113029. [Google Scholar] [CrossRef]
  27. Chang, A.; Wang, S.; Du, J.; Li, H. Second-order frequency-domain coupled analysis for moored offshore structure dynamics. Ocean Eng. 2019, 174, 201–215. [Google Scholar] [CrossRef]
  28. Li, L.; Cheng, Z.; Yuan, Z.; Gao, Y. Short-term extreme response and fatigue damage of an integrated offshore renewable energy system. Renew. Energy 2018, 126, 617–629. [Google Scholar] [CrossRef]
  29. Rijnsdorp, D.P.; Wolgamot, H.; Zijlema, M. Non-hydrostatic modelling of the wave-induced response of moored floating structures in coastal waters. Coast. Eng. 2022, 177, 104195. [Google Scholar] [CrossRef]
  30. Gao, Y.; Qu, L.; Wang, L.; Guo, Z. Experimental study on the sandy seabed trench development of the catenary mooring chain at touchdown zone. Ocean Eng. 2022, 264, 112470. [Google Scholar] [CrossRef]
  31. Byron, F. Failure Analysis of Steel Mooring Wire Rope in the Marine Environment. In Proceedings of the CORROSION 2021, Virtual, 19–30 April 2021; pp. 1–11. [Google Scholar] [CrossRef]
  32. Weller, S.D.; Johanning, L.; Davies, P.; Banfield, S.J. Synthetic mooring ropes for marine renewable energy applications. Renew. Energy 2015, 83, 1268–1278. [Google Scholar] [CrossRef]
  33. Claus, R.; Lopes, M. A methodology to assess the dynamic response and the structural performance of floating photovoltaic systems. Sol. Energy 2023, 262, 111826. [Google Scholar] [CrossRef]
  34. Hou, H.-M.; Liu, Y. An accurate and efficient method to analyze the short-term extreme tension distribution of mooring line under irregular waves. Ocean Eng. 2024, 304, 117891. [Google Scholar] [CrossRef]
  35. Ji, C.; Hao, Y.; Xu, S. Experimental and numerical study on the hydrodynamic responses of a novel offshore floating photovoltaic system. Ocean Eng. 2025, 315, 119797. [Google Scholar] [CrossRef]
  36. Jiang, Z.; Dai, J.; Saettone, S.; Tørå, G.; He, Z.; Bashir, M.; Souto-Iglesias, A. Design and model test of a soft-connected lattice-structured floating solar photovoltaic concept for harsh offshore conditions. Mar. Struct. 2023, 90, 103426. [Google Scholar] [CrossRef]
  37. Spröer, F.; Koyama, L.; Windt, C.; Schürenkamp, D.; Goseberg, N. Experimental investigation of the hydrodynamic response of single and multi-floats for floating photovoltaic applications. Appl. Ocean Res. 2026, 170, 105009. [Google Scholar] [CrossRef]
  38. Martinelli, L.; Zanuttigh, B. Effects of Mooring Compliancy on the Mooring Forces, Power Production, and Dynamics of a Floating Wave Activated Body Energy Converter. Energies 2018, 11, 3535. [Google Scholar] [CrossRef]
  39. Lie, H.; Gao, Z.; Moan, T. Mooring line damping estimation by a simplified dynamic model. In Proceedings of the 26th International Conference on Offshore Mechanics and Arctic Engineering, San Diego, CA, USA, 10–15 June 2007; Volume 1, pp. 197–204. [Google Scholar]
  40. Chen, Z.W.; Wang, F.; Zhang, H.B.; Chen, Z.G.; He, Q.L. Performance and safety evaluation of rack vehicle in mountainous regions under pulsating wind loads. Mech. Based Des. Struct. Mach. 2026, 54, 2553887. [Google Scholar] [CrossRef]
Figure 1. Timeline of photovoltaic development.
Jmse 14 01123 g001
Figure 2. Three mooring line types: (a) the anchor chain, (b) the steel cable and (c) the elastic cable.
Jmse 14 01123 g002
Figure 3. (a) Prototype floating structure, (b) structural truss model.
Jmse 14 01123 g003
Figure 4. Details of the experimental model: (a) physical model in the test basin; (b) 3D geometric design.
Jmse 14 01123 g004
Figure 5. Selection of mooring forms.
Jmse 14 01123 g005
Figure 6. Model layout.
Jmse 14 01123 g006
Figure 9. Measurement instruments (the non-English labels indicate the experimental data acquisition equipment).
Jmse 14 01123 g009
Figure 10. Diagram of wave elevation for regular waves: (a) WR2, (b) WR9.
Jmse 14 01123 g010
Figure 11. Experimental values of wave elevation for extreme irregular waves (JONSWAP).
Jmse 14 01123 g011
Figure 12. Experimental spectrum diagram of wave elevation for extreme irregular waves (JONSWAP).
Jmse 14 01123 g012
Figure 13. Surge acceleration RAO under regular waves: (a) 3 cm wave height, (b) 6 cm wave height.
Jmse 14 01123 g013
Figure 14. Heave acceleration RAO under regular waves: (a) 3 cm wave height, (b) 6 cm wave height.
Jmse 14 01123 g014
Figure 15. Pitch RAO under regular waves: (a) 3 cm wave height, (b) 6 cm wave height.
Jmse 14 01123 g015
Figure 16. Wave steepness and normalized mooring tension (SMF*) under different wave periods at a wave height of 6 cm; I and II denote short- and long-period ranges, respectively.
Jmse 14 01123 g016
Figure 17. Time-domain diagrams of Surge acceleration for M1, M2 and M3 under extreme irregular-wave conditions.
Jmse 14 01123 g017
Figure 18. Frequency-domain spectra of surge acceleration for M1, M2, M3 under extreme irregular-wave conditions.
Jmse 14 01123 g018
Figure 19. Statistical values of surge acceleration for M1, M2, M3 under extreme irregular-wave conditions.
Jmse 14 01123 g019
Figure 20. Time-domain diagrams of heave acceleration for M1, M2, and M3 under extreme irregular-wave conditions.
Jmse 14 01123 g020
Figure 21. Statistical values of heave acceleration for M1, M2, M3 under extreme irregular wave conditions.
Jmse 14 01123 g021
Figure 22. Frequency-domain spectra of heave acceleration for M1, M2, M3 under extreme irregular-wave conditions.
Jmse 14 01123 g022
Figure 23. Time-domain diagrams of pitch motion for M1, M2, and M3 under extreme irregular-wave conditions.
Jmse 14 01123 g023
Figure 24. Frequency-domain spectra of pitch motion for M1, M2, and M3 under extreme irregular-wave conditions.
Jmse 14 01123 g024
Figure 25. Statistical values of pitch motion for M1, M2, M3 under extreme irregular-wave conditions.
Jmse 14 01123 g025
Figure 26. Time-domain diagrams of mooring tensions for M1, M2, and M3 under extreme irregular-wave conditions.
Jmse 14 01123 g026
Table 1. Dimensions and properties of the test model.
StructureMaterialLengthOuter DiameterWall ThicknessMassDensity
Floating
tube
Polyethylene961.54 mm50 mm4.6 mm3.534 kg0.92 g/cm3
Support structurePolypropylene160 mm20 mm2 mm0.72 kg0.90 g/cm3
Table 2. Main parameters of the mooring lines.
Serial-NumberType of Mooring CableLengthSpecificationTensile Axial StiffnessIn-Air MassPre-Tension
M1Anchor chain136 cm2 × 8.7 × 17.2 mm4.76 × 105 N/m71.5 g/m22.68 g
M2Steel cable136 cmD = 1.0 mm7.42 × 104 N/m4.7 g/m1.2 g
M3Elastic cableSpring
40 cm
1 × 12 × 400 mm84.8 N/m40.5 g/m14.5 g
Steel Cables
96 cm
D = 1.0 mm1.08 × 105 N/m4.7 g/m
Table 3. Parameters of the regular-wave tests.
Serial NumberPrototype Wave ConditionsExperimental Wave Conditions
Wave Height (m)Period (s)Wave Height (m)Period (s)
WR1–WR40.755.0, 6.0, 7.6, 9.10.031.00, 1.20, 1.52, 1.82
WR5–WR141.54.0, 4.5, 5.0, 5.5, 6.0, 6.5,7.0, 7.6, 9.1, 10.00.060.80, 0.90, 1.00, 1.10, 1.20, 1.30, 1.40, 1.52, 1.82, 2.00
Table 4. Parameters of the irregular-wave test.
Serial NumberActual Sea Area ConditionsTest Conditions
Significant Wave Height (m)Spectral Peak Period (s)Significant Wave Height (m)Spectral Peak Period (s)
WIRR23.09.10.121.82
Table 5. Natural periods of M1, M2, and M3.
Natural PeriodSurgeHeavePitch
M1/M2/M3≥7.5 s0.40 s0.41 s
Table 6. Summary of representative response metrics.
Wave ConditionResponseMetricM1M2M3
Regular,
H = 3 cm
Surge RAOMax |RAO|, g/cm0.01930.02370.0177
Regular,
H = 6 cm
Surge RAOMax |RAO|, g/cm0.02670.05000.0220
Regular,
H = 6 cm
Heave RAOMax |RAO|, g/cm0.01200.01480.0127
Regular,
H = 6 cm
Pitch RAOPeak,
deg/cm
(−0.414, 0.358)(−0.394, 0.338)(−0.373, 0.388)
Irregular extremeSurge accelerationSTD, g0.024660.026630.02432
Irregular extremeHeave accelerationSTD, g0.03110.03090.0297
Irregular extremePitch angleExtreme range, deg−7.465 to 5.718−5.927 to 5.504−7.284 to 5.246
Irregular extremeMooring tensionPeak SMF*1.287.271.70
Note: Only representative metrics are listed. For pitch RAO, signed minimum–maximum values are reported.
Disclaimer/Publisher’s Note: The statements, opinions and data contained in all publications are solely those of the individual author(s) and contributor(s) and not of MDPI and/or the editor(s). MDPI and/or the editor(s) disclaim responsibility for any injury to people or property resulting from any ideas, methods, instructions or products referred to in the content.