Article

Sea Bottom Line Tracking in Side-Scan Sonar Images Using WTMM-Based Edge Detection

1
First Institute of Oceanography, Ministry of Natural Resources, Qingdao 266061, China
2
Qingdao Institute of Marine Engineering Survey and Design Co., Ltd., Qingdao 266061, China
3
Shanghai Waterway Engineering Design and Consulting Co., Ltd., Shanghai 200120, China
*
Author to whom correspondence should be addressed.
J. Mar. Sci. Eng. 2026, 14(11), 1002; https://doi.org/10.3390/jmse14111002
Submission received: 28 April 2026 / Revised: 23 May 2026 / Accepted: 26 May 2026 / Published: 28 May 2026
(This article belongs to the Section Physical Oceanography)

Abstract

The topographic features of the seafloor can be observed clearly via high-resolution side-scan sonar imagery. However, the faithful interpretation of a sonar image depends strongly on the accuracy with which the location of the sea bottom line can be tracked within the image, and current tracking methods function poorly under high sonar signal noise or suffer from high complexity. The present work addresses this issue by applying the characteristics of simple sonar waterfall maps in conjunction with robust edge detection and multi-scale analysis based on wavelet transform modulus maxima. The proposed tracking method is demonstrated to provide superior effectiveness and accuracy in comparison with existing baseline methods based on the results of experiments conducted with a representative side-scan sonar image with and without applied speckle noise. This superiority can be attributed to the good localization characteristics and multi-scale detection features of wavelet transform analysis, which can suppress the impact of noise in the sonar image on the accurate extraction of edge information.

1. Introduction

Side-scan sonar imaging technology is capable of acquiring high-resolution images of seafloor topography and geomorphology and is therefore frequently used in marine exploration and engineering fields, such as underwater target and obstacle detection, classification of seabed substrates, and topographical inversion [1,2,3,4,5]. Moreover, high-resolution side-scan sonar imaging has been demonstrated to be a crucial capability for the full development of marine resources. However, the faithful processing and interpretation of a side-scan sonar image is strongly dependent on an accurate representation of the sea bottom line in the image because this representation is used as a reference line for conducting geometric correction and radiation correction in image pre-processing, and also serves as the baseline for obtaining accurate positioning of all targets in the image. Therefore, accurately locating the sea bottom line in side-scan sonar images is crucial for supporting this technology.
A number of different methods have been developed for tracking the sea bottom line. Existing commercial side-scan sonar image processing software, such as Sonar Web and Triton, currently applies a threshold control method for tracking the sea bottom line [6]. This conventional method manually adjusts the amplitude threshold parameters, continuity parameters, height thresholds, and ping averages in accordance with the real-time seabed environment and sonar image quality. However, this is a relatively complex process that is subject to numerous human factors contributing to error. This disadvantage was addressed in the work of Zhang et al. [7] by proposing a method for tracking the sea bottom line based on the characteristics of sonar waterfall maps and the application of the log operator for image edge detection. While this approach was generally accurate and relatively simple to implement, the tracking effect was highly dependent on the quality of the raw sonar images, and the presence of noise in the image signal was found to be strongly detrimental. The impact of noise was addressed in the work of Zhao et al. [8] by combining Kalman filtering and the last peak method to propose an adaptive sea bottom line tracking approach for sonar images. However, the core principle of the approach was based on a non-universal assumption that the first seabed echo returns later than all other interference echoes. Furthermore, this approach lacks generality under other irregular conditions, such as when the intensity of the interference echoes is greater than that of the seabed echoes. Another research group developed a novel tracking method capable of tracking the sea bottom line in complex water environments by combining point density clustering and chain search based on the spatial distribution characteristics of the sea bottom line [9,10]. However, discrete points assumed to lie on the sea bottom line must be selected manually, and the algorithm is relatively complicated to implement. This issue was addressed in the work of Yin et al. [11] by proposing an automatic method for accurately extracting seabed lines using a UNet deep learning approach based on the symmetry principle of seabed lines. However, this method requires a large number of annotated image samples for network training, which are often not available.
The complexity of recent approaches developed for tracking the sea bottom line could potentially be addressed by applying the characteristics of sonar waterfall maps in conjunction with a more robust image edge detection method. A wide range of methods has been developed for detecting edges within digital images, such as differential operators, morphological methods, surface fitting methods, wavelet transform methods, neural network analysis methods, and genetic algorithms [12,13,14,15,16]. However, all edge detection algorithms are subject to a countervailing trade-off between noise suppression and edge localization [17]. Firstly, the presence of noise in an image detracts from the accuracy of edge detection. Secondly, suppressing noise requires smoothing the image, but smoothing the image induces a loss of information regarding the true location of edges within an image, which causes the accuracy of edge localization to deteriorate. Accordingly, robust edge detection requires a compromise between noise suppression and edge localization. This can be addressed potentially via wavelet analysis, where the points in an image at which the modulus of the wavelet transform attains maximum values represent singularities that can be used to detect edges. Moreover, this edge detection method benefits from the good time-frequency characteristics of wavelet analysis, which allows for multi-scale analysis of the edge information in sonar images, and the process can retain image details more completely while suppressing the influence of noise. However, while wavelet transform-based edge detection has been widely used in standard image applications, its use in sonar image processing has been infrequent, and its use is particularly underdeveloped for tracking the sea bottom line in side-scan sonar images, which is further hampered by a dearth of pertinent experimental data [18].
The present work addresses this issue by applying the characteristics of sonar waterfall maps in conjunction with robust edge detection based on wavelet transform modulus maxima (WTMM) for tracking the bottom line in side-scan sonar images. The proposed method is demonstrated to offer superior sea bottom tracking performance compared to standard baseline methods, including the commercial threshold method and the log-operator-based edge detection method, based on the results of experiments conducted in conjunction with a representative side-scan sonar image with and without applied speckle noise. This superiority can be attributed to the good localization characteristics and multi-scale detection features of wavelet transform analysis, which suppress the impact of noise in the sonar image on the accurate extraction of edge information.
The main contributions of this work are summarized as follows:
1. 
The WTMM-based edge detection method is introduced for sea bottom line tracking in side-scan sonar images.
2. 
A robust multi-scale analysis framework is developed to improve edge localization under speckle noise conditions.
3. 
Comparative experiments with threshold and log-operator methods demonstrate improved accuracy and robustness.
The remainder of this paper is organized as follows. Section 2 describes the methodology of the proposed WTMM-based approach. Section 3 presents the experimental setup and results. Section 4 discusses the performance evaluation and limitations. Finally, Section 5 concludes the paper.

2. Methodology

The three primary components in a side-scan sonar imaging system include the underwater towfish, the connecting cable, and the deck unit. The specific imaging principle is illustrated in Figure 1 [19]. During navigation, the transducer base array on the towfish releases brief sonic pulses at a specific angle relative to the seafloor that propagate outward in the form of a spherical wave pattern. The acoustic pulse encounters targets on the seafloor or in the water that induce the return of backscattered echoes to the transducer along the raw propagation path, and these signals are transmitted through the cable to the deck unit [20,21]. The sonar data processing unit applies a grayscale to display the image pixels in accordance with the intensity of the backscattered echoes and thereby represents the topography and characteristics of the target region [22]. The sonar transducer base array continuously transmits and receives acoustic pulses to and from the seafloor in accordance with the movement of the towfish, and the processor unit arranges the image information according to the time sequence. This process yields a two-dimensional (2D) side-scan sonar waterfall map composed of multiple mosaic cells.
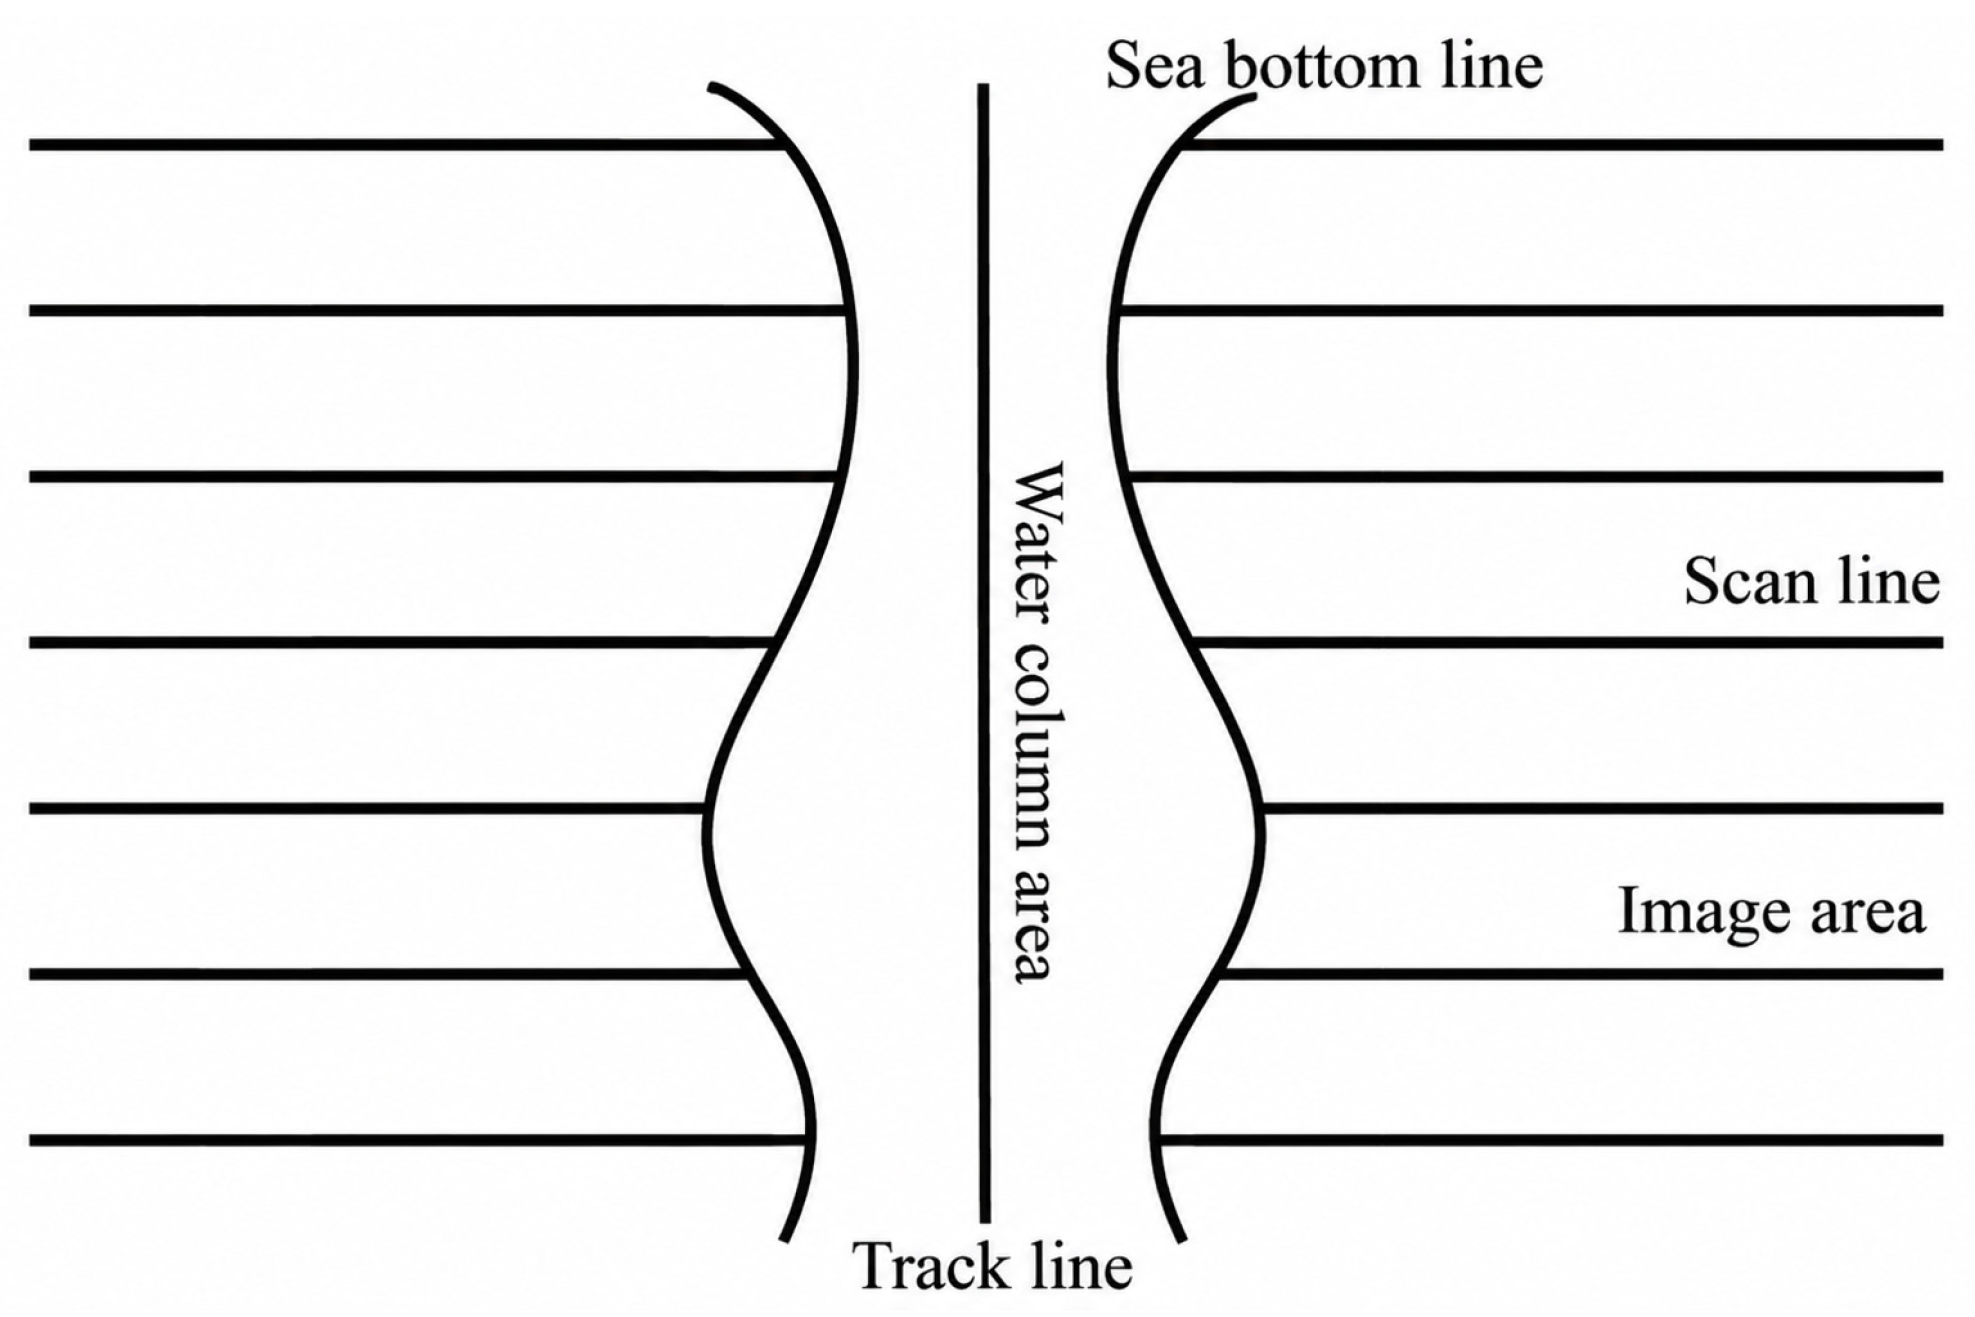
The basic composition of an unprocessed side-scan sonar image is illustrated by the sonar waterfall map presented in Figure 2. As can be seen, the map consists of three main components, including the track line, the sea bottom line, and the periodic scan lines formed from each sonic pulse emitted from the towfish as it moves forward underwater. The track line represents the actual trajectory of the towfish and serves as the starting point for calculating the distance between the towfish and the underwater imaging objective. The height of the towfish directly above the undulating topography of the seafloor along the track line serves as the sea bottom line. The region of the waterfall map between the track line and the sea bottom line is denoted as the water column area, which is displayed uniformly as black pixels with a grayscale value of 0 in the sonar image because sonic pulses from the towfish are unable to propagate to the seafloor in this area. Meanwhile, the pixels in the image outside of the water column area are generally not zero because the towfish receives backscattered echoes from this area. Hence, the sea bottom line represents a stark transition in grayscale from 0 to non-zero values that can be located within the image using an edge detection algorithm. The proposed method exploits seabed transition characteristics via the WTMM algorithm, which facilitates precise edge detection amidst the side-scan sonar images. Its multi-scale analysis capability ensures accurate localization of sea bottom grayscale mutations while maintaining high noise immunity.

2.1. Edge Detection Principles

The WTMM edge detection technique was first proposed by Mallat and Hwang [23]. This technique follows from the basic principles of the wavelet transform, where the modulus of the wavelet transform is proportional to the modulus of the gradient vector of the image, and the angle between the gradient vector and the horizontal direction of the image represents the direction of the edge points in the image. Therefore, the edge detection process only needs to find the maximum point of the wavelet transform modulus along the gradient direction because this maximum point is the edge point in the image [24,25]. The basic process of the WTMM edge detection algorithm is specified as follows.
For a 2D image function f x , y , choose a suitable 2D smoothing function θ x , y that has good localization properties meeting the following conditions.
θ x , y 0 + θ x , y d x d y = 1 lim x 2 + y 2 θ x , y = 0
The raw image is smoothed by introducing the scale parameter S = 2 j as follows:
f θ s x , y = R R f x u , y v θ s u , v d u d v ,
where θ s x , y = 1 S 2 θ ( x s , y s ) . The horizontal and vertical wavelet functions are defined at scale S as follows.
ψ S x = θ s x , y x ψ S y = θ s x , y y
Then, the 2D wavelet transform of image f x , y at scale S can be expressed as follows.
W S x f x , y W S y f x , y = f ψ 2 j x x , y f ψ 2 j y x , y = 2 j f θ 2 j x , y x f θ 2 j x , y y = 2 j f θ 2 j x , y
The gradient vector of ( f θ 2 j ) ( x , y ) can be defined as f θ 2 j x , y = W 2 j f ( x , y ) , which is related to the modulus of the wavelet transform according to the following expression.
M W 2 j f x , y = W 2 j x f x , y 2 + W 2 j y f x , y 2
The phase angle of the wavelet transform is then defined as follows, according to the angle between the direction of the gradient and the horizontal direction.
A W 2 j f x , y = arctan W 2 j y f x , y W 2 j x f x , y
According to the principle of the WTMM algorithm discussed above, it follows that computing the maxima in the modulus of this smooth function along the gradient direction is equivalent to computing the maxima in the modulus of the wavelet transform. Defining the direction of the wavelet transform as the unit vector n ¯ j x , y = ( c o s A ( W 2 j f x , y ) , s i n   A ( W 2 j f x , y ) ) yields a vector that is parallel to the gradient vector f θ 2 j x , y . Therefore, the point x , y is an edge point of the smoothed image function at scale S if the modulus M ( W 2 j f x , y ) at that point achieves a local maximum along a direction perpendicular to A ( W 2 j f x , y ) [26]. Accordingly, the full collection of edge points in the image can be located by detecting the maxima in the modulus of the 2D wavelet transform.

2.2. Sea Bottom Line Tracking

The steps of the proposed edge detection algorithm based on the WTMM are given as follows.
  • Input a side-scan sonar image parsed from an eXtended Triton Format (XTF) file that has a suitable size for detecting the sea bottom line.
  • Set the scale parameter S of the wavelet, define the filter length and the amplitude value, apply a Gaussian smoothing function to find the derivatives of the pixel values in the x and y directions of the image, and conduct the energy normalization process. Then, apply convolution to the ranks of the smoothed image, and find the wavelet coefficients.
  • Traverse the smoothed raw image, and locate the gradient direction and the phase angle of the wavelet transform for each pixel point.
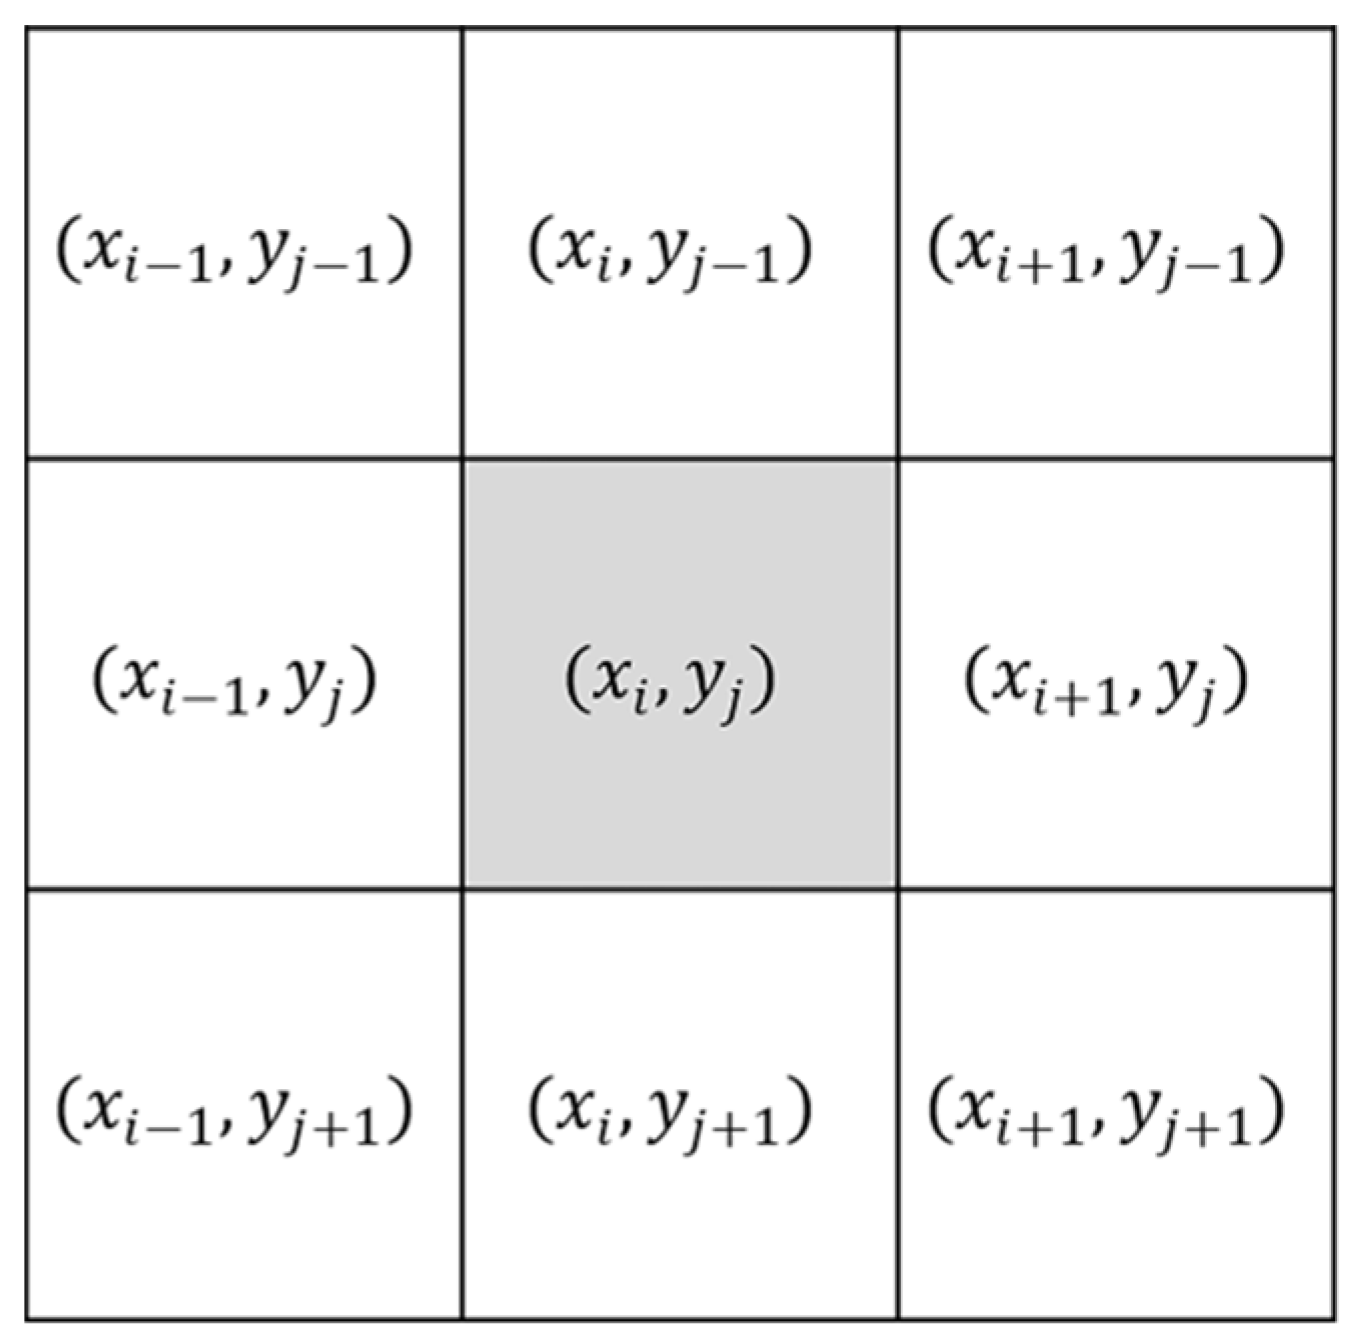
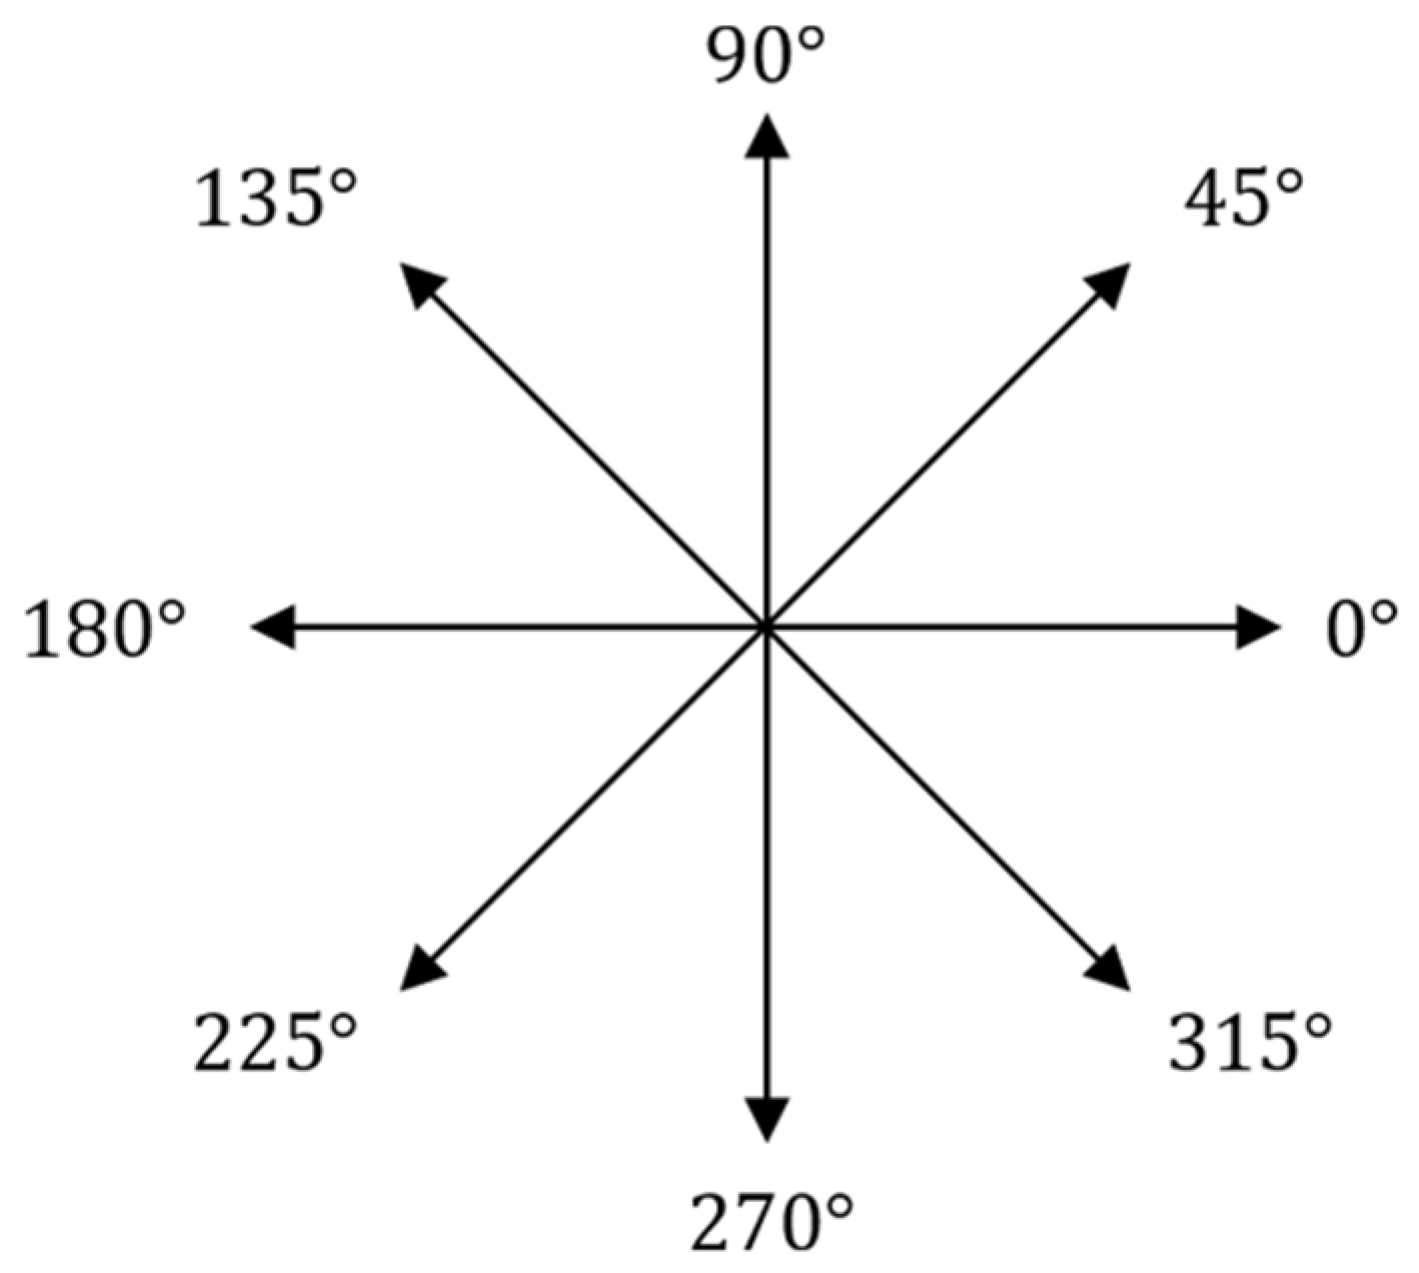
  • The gradient direction at pixel ( x i , y j ) is defined according to the eight domain points illustrated in Figure 3, and the phase angle is divided according to the scheme illustrated in Figure 4. The local modulus maxima in the image along the respective phase angle directions are extracted, and a gradient value is recorded if it is a maximum and reassigned a value of zero if it is not.
  • Find the maximum value of the gradient for all points with a maximum wavelet transform modulus, and use the maximum gradient value as the normalized reference value.
  • Set a suitable threshold value to remove false edges caused by noise. Retain edges greater than the threshold value, and delete all others. Obtain the edge information of the image by linking all edge points, and apply this information to locate the position of the sea bottom line in the side-scan sonar image.

3. Experimental Results

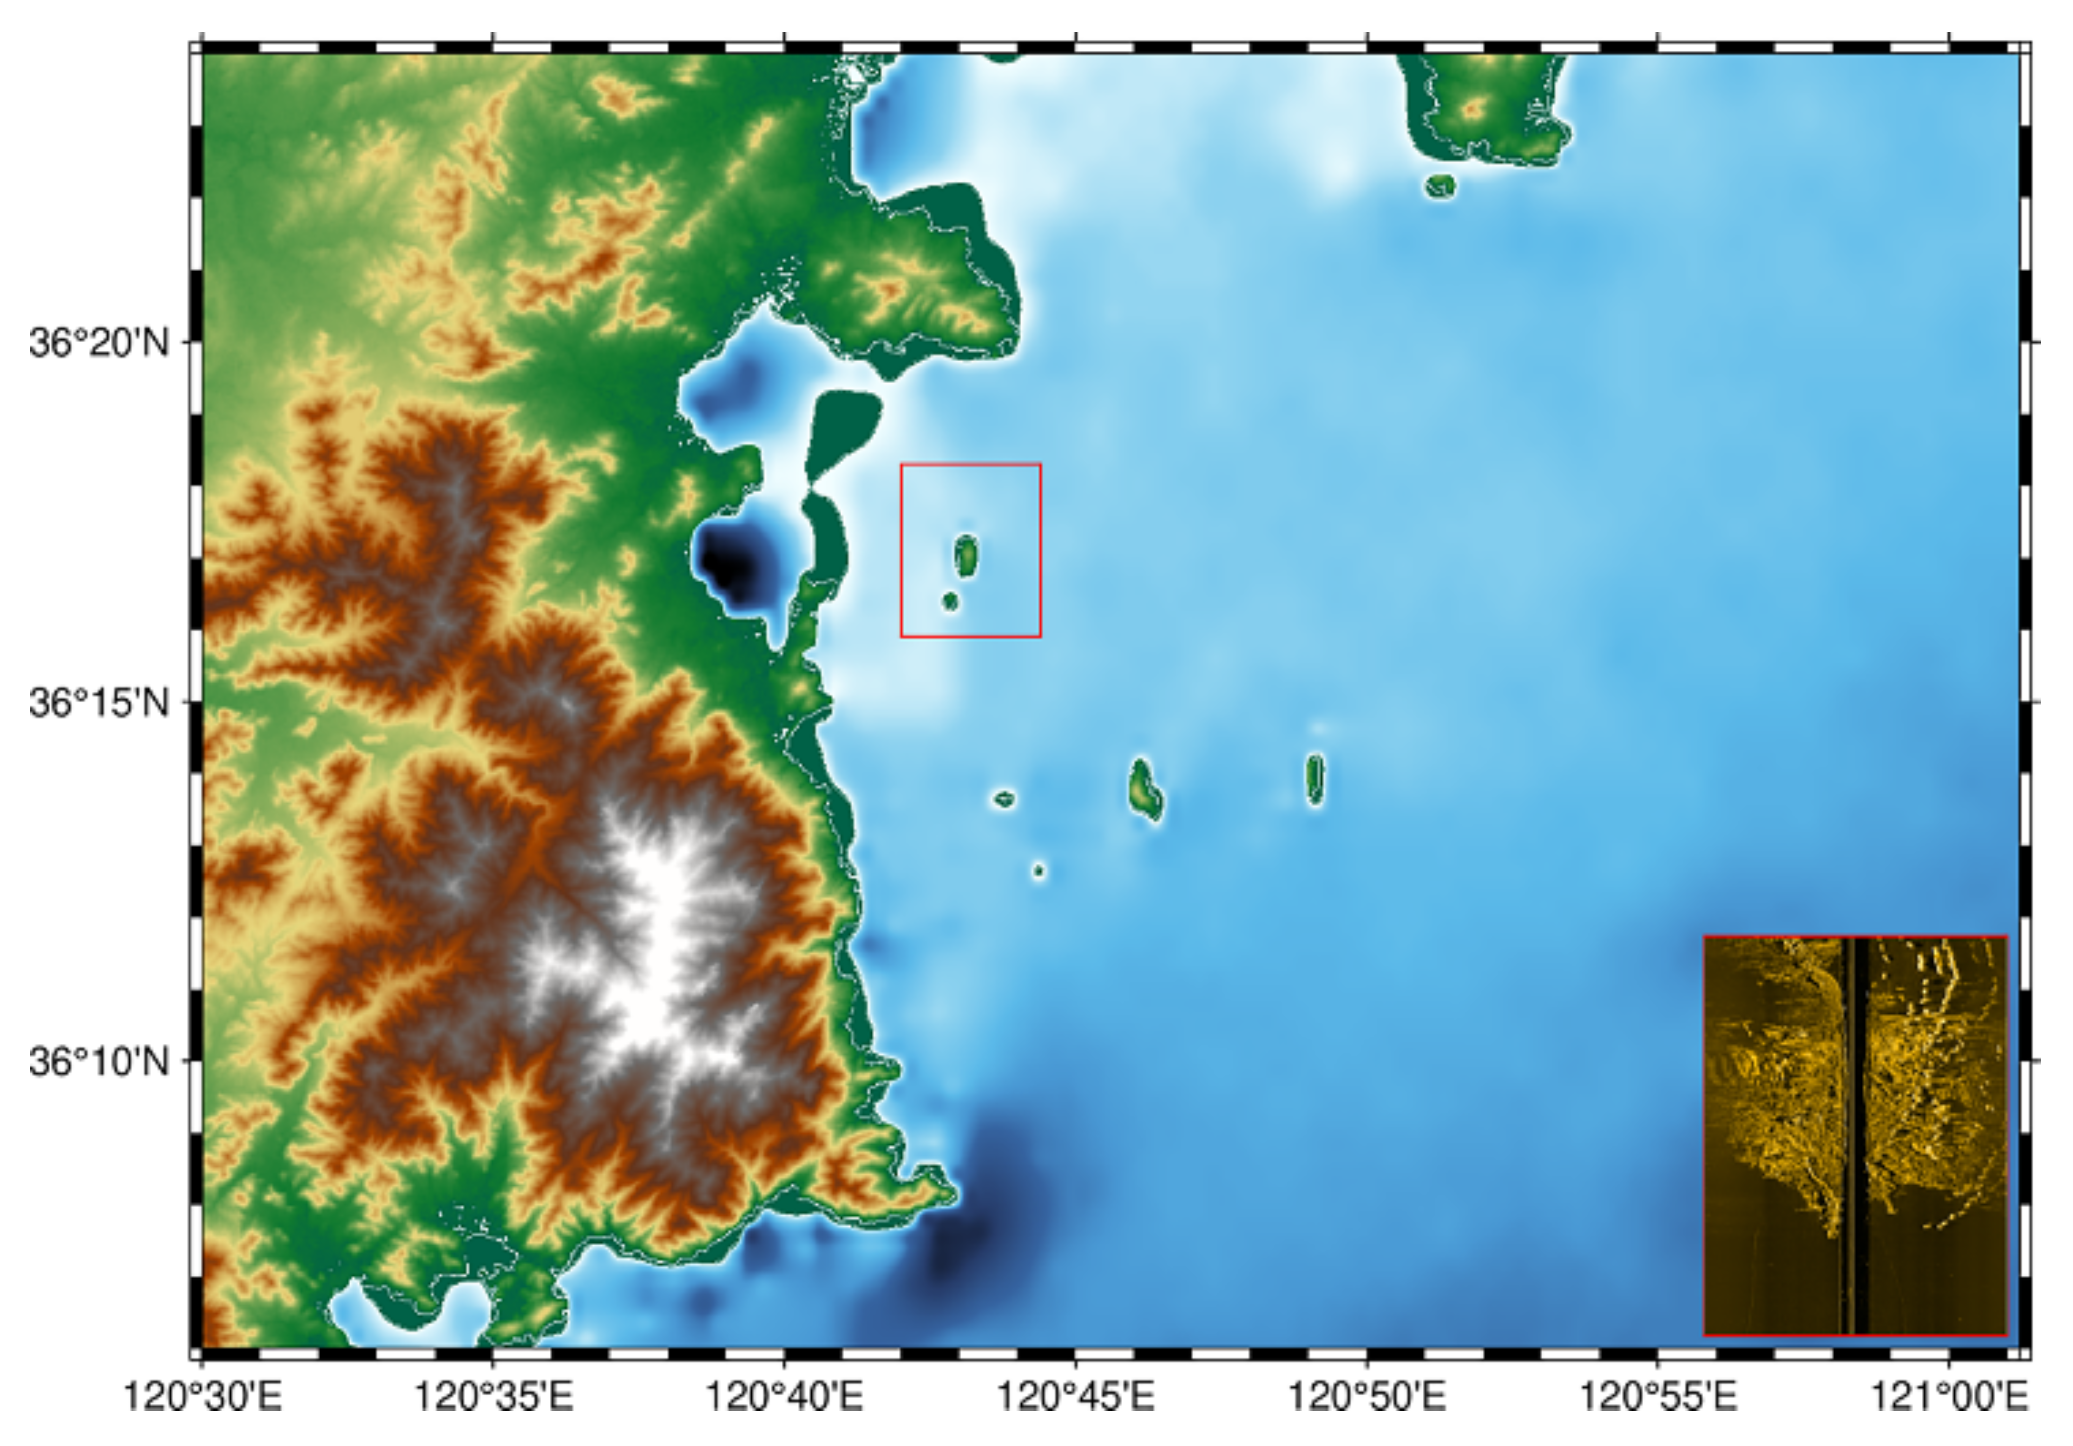
The viability of applying the proposed WTMM-based edge detection algorithm for tracking the sea bottom line in side-scan sonar images was evaluated based on experiments conducted in Matlab (R2024a) for 3DSS-DX sonar sea floor data captured at the southern part of the small tube island located within the small red box presented in Figure 5. The side-scan sonar image was generated under a maximum bathymetric range of 150 m, a sonar emission pulse length of 22 μs to 444 μs, and an emission beam vertical width of up to 125°. The seabed image was captured on one of the survey lines, which consisted of 500 sonar pings, and the experiments were restricted to the starboard image of the side-scan sonar. The results of the proposed method were compared with those obtained by standard baseline methods, including the commercial threshold method and the log-operator-based edge detection method. Generally, the threshold K applied within the threshold method was set to 0.5. All performance comparisons were based on two quantitative metrics, including the maximum error and the root mean square (RMS) error. Here, the maximum error represents the maximum difference between the detection result and the actual value observed for the seabed line generated over all 500 sonar pings. Hence, the detection performance increases with decreasing maximum error. The RMS error represents the square root of the squared deviation between the detection result and the actual value. Hence, the detection performance increases with decreasing RMS error. In addition, to further evaluate the robustness and stability of the compared methods under noisy conditions, multiple repeated experiments were conducted under independent random noise realizations, and the RMS errors were statistically analyzed and reported in the form of mean ± standard deviation (std). Furthermore, the computational runtime of each method was also recorded to evaluate the computational efficiency of the proposed algorithm. It is well known that 3DSS-DX sonar can accurately record bathymetry data in real time while sweeping the seafloor bottom. Therefore, the bathymetry data of the swept experimental area was employed as the actual bathymetry value during error analysis. In addition, all experiments were conducted with the raw sonar image and the same image after additive Gaussian noise had been added.

3.1. Raw Sonar Image

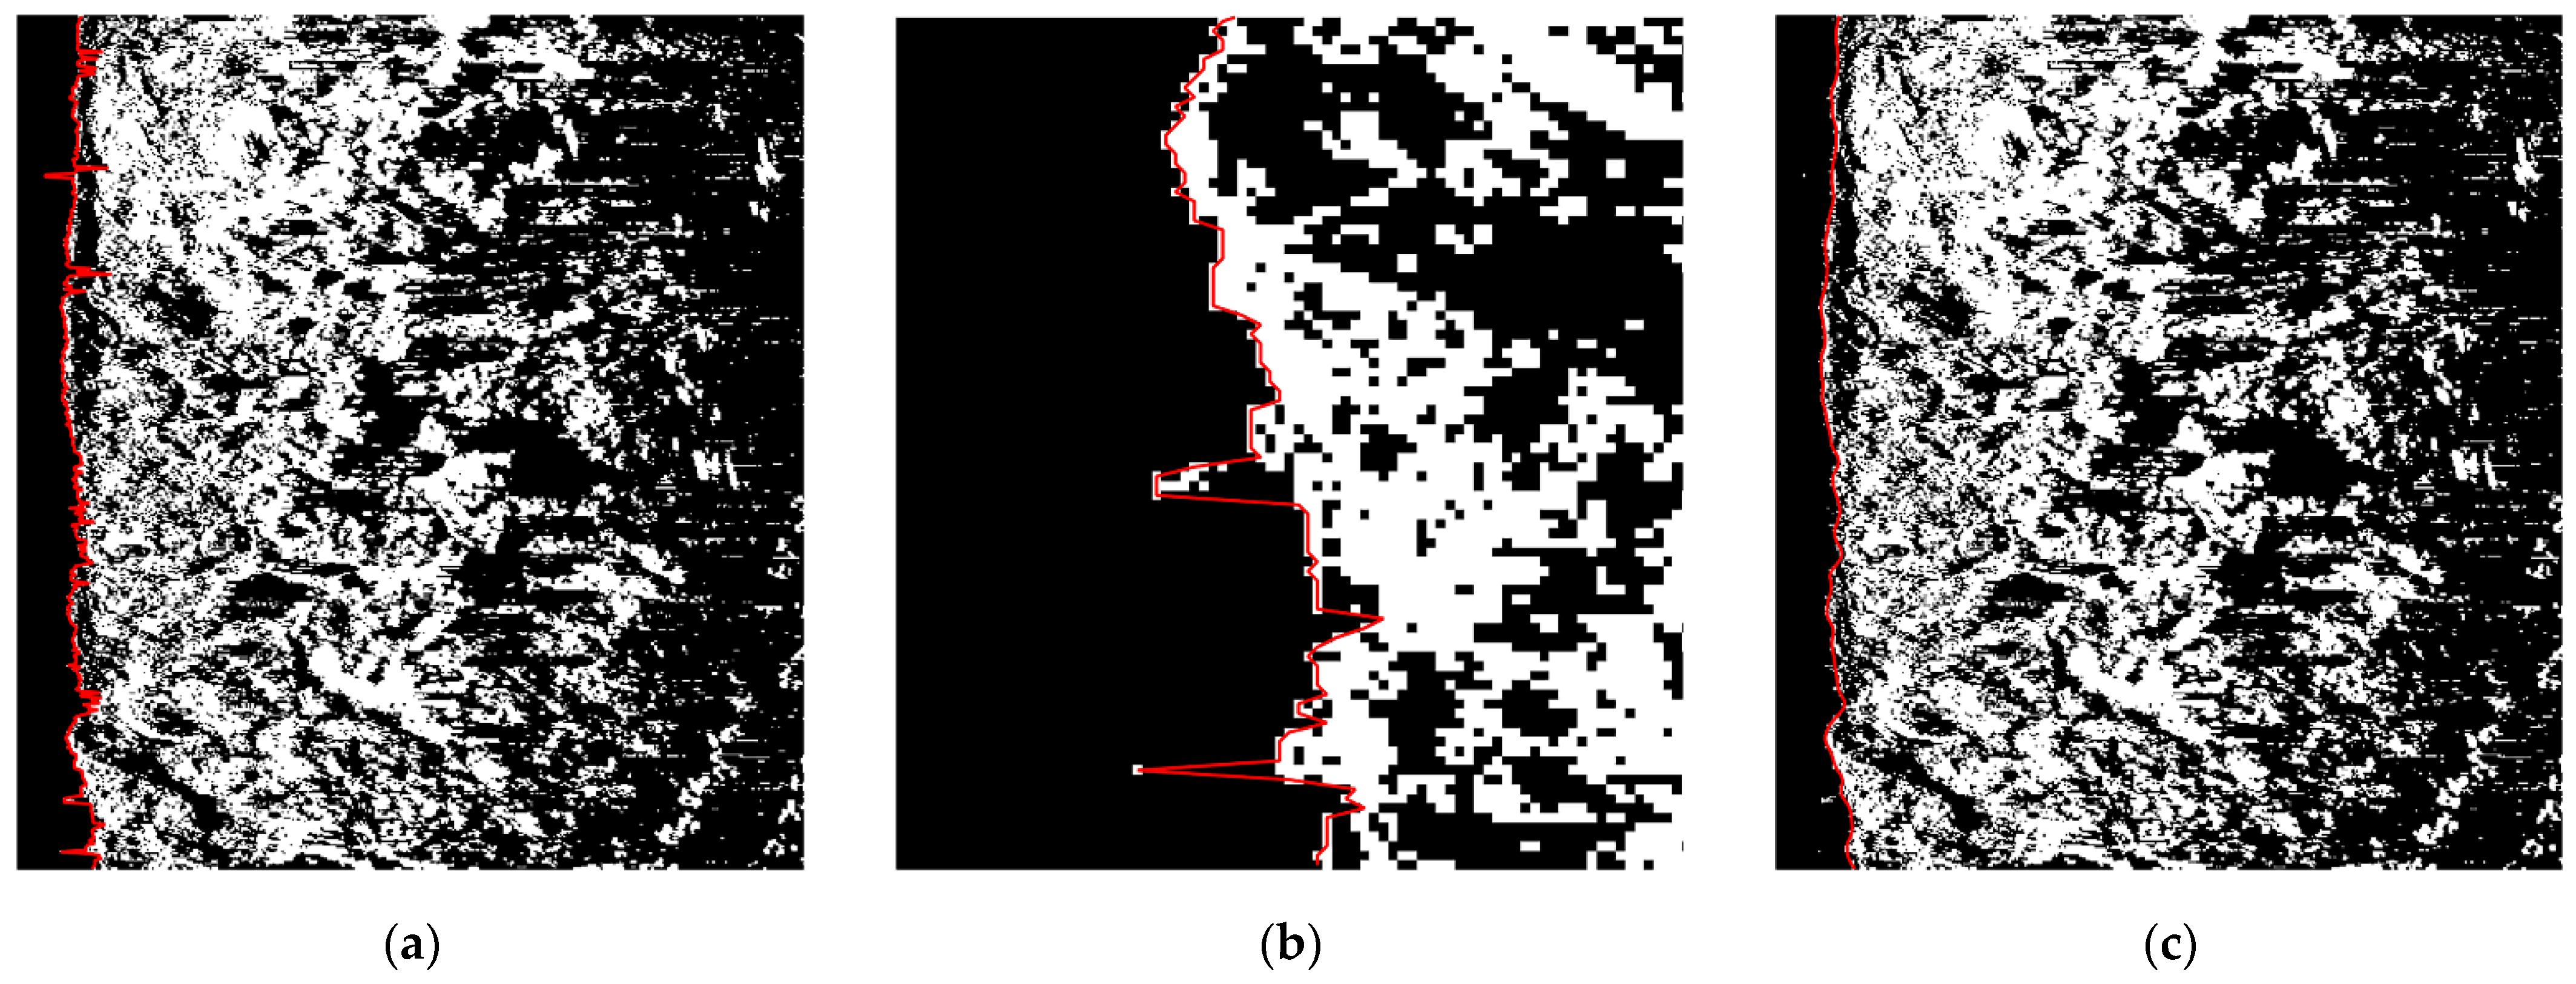
The results of sea bottom line tracking based on the threshold method (K = 0.5) obtained for the raw sonar image are presented in Figure 6a. The threshold parameter K is selected based on preliminary experiments, where different candidate values were tested, and the optimal values were chosen according to tracking performance. As can be seen, the tracking results are mostly satisfactory. However, a number of factors, such as suspended air bubbles on the seabed, generate noise in the water column area, and the tracking process can mistake these noisy points for the sea bottom line. Some of these errors are illustrated in the enlarged view presented in Figure 6b and the lower left corner of Figure 6a. Accordingly, the generated seabed line must be filtered and smoothed to eliminate the influence of these noise factors. As can be seen from Figure 6c, the final tracking results obtained after processing are considerably smoother than the original line in Figure 6a.
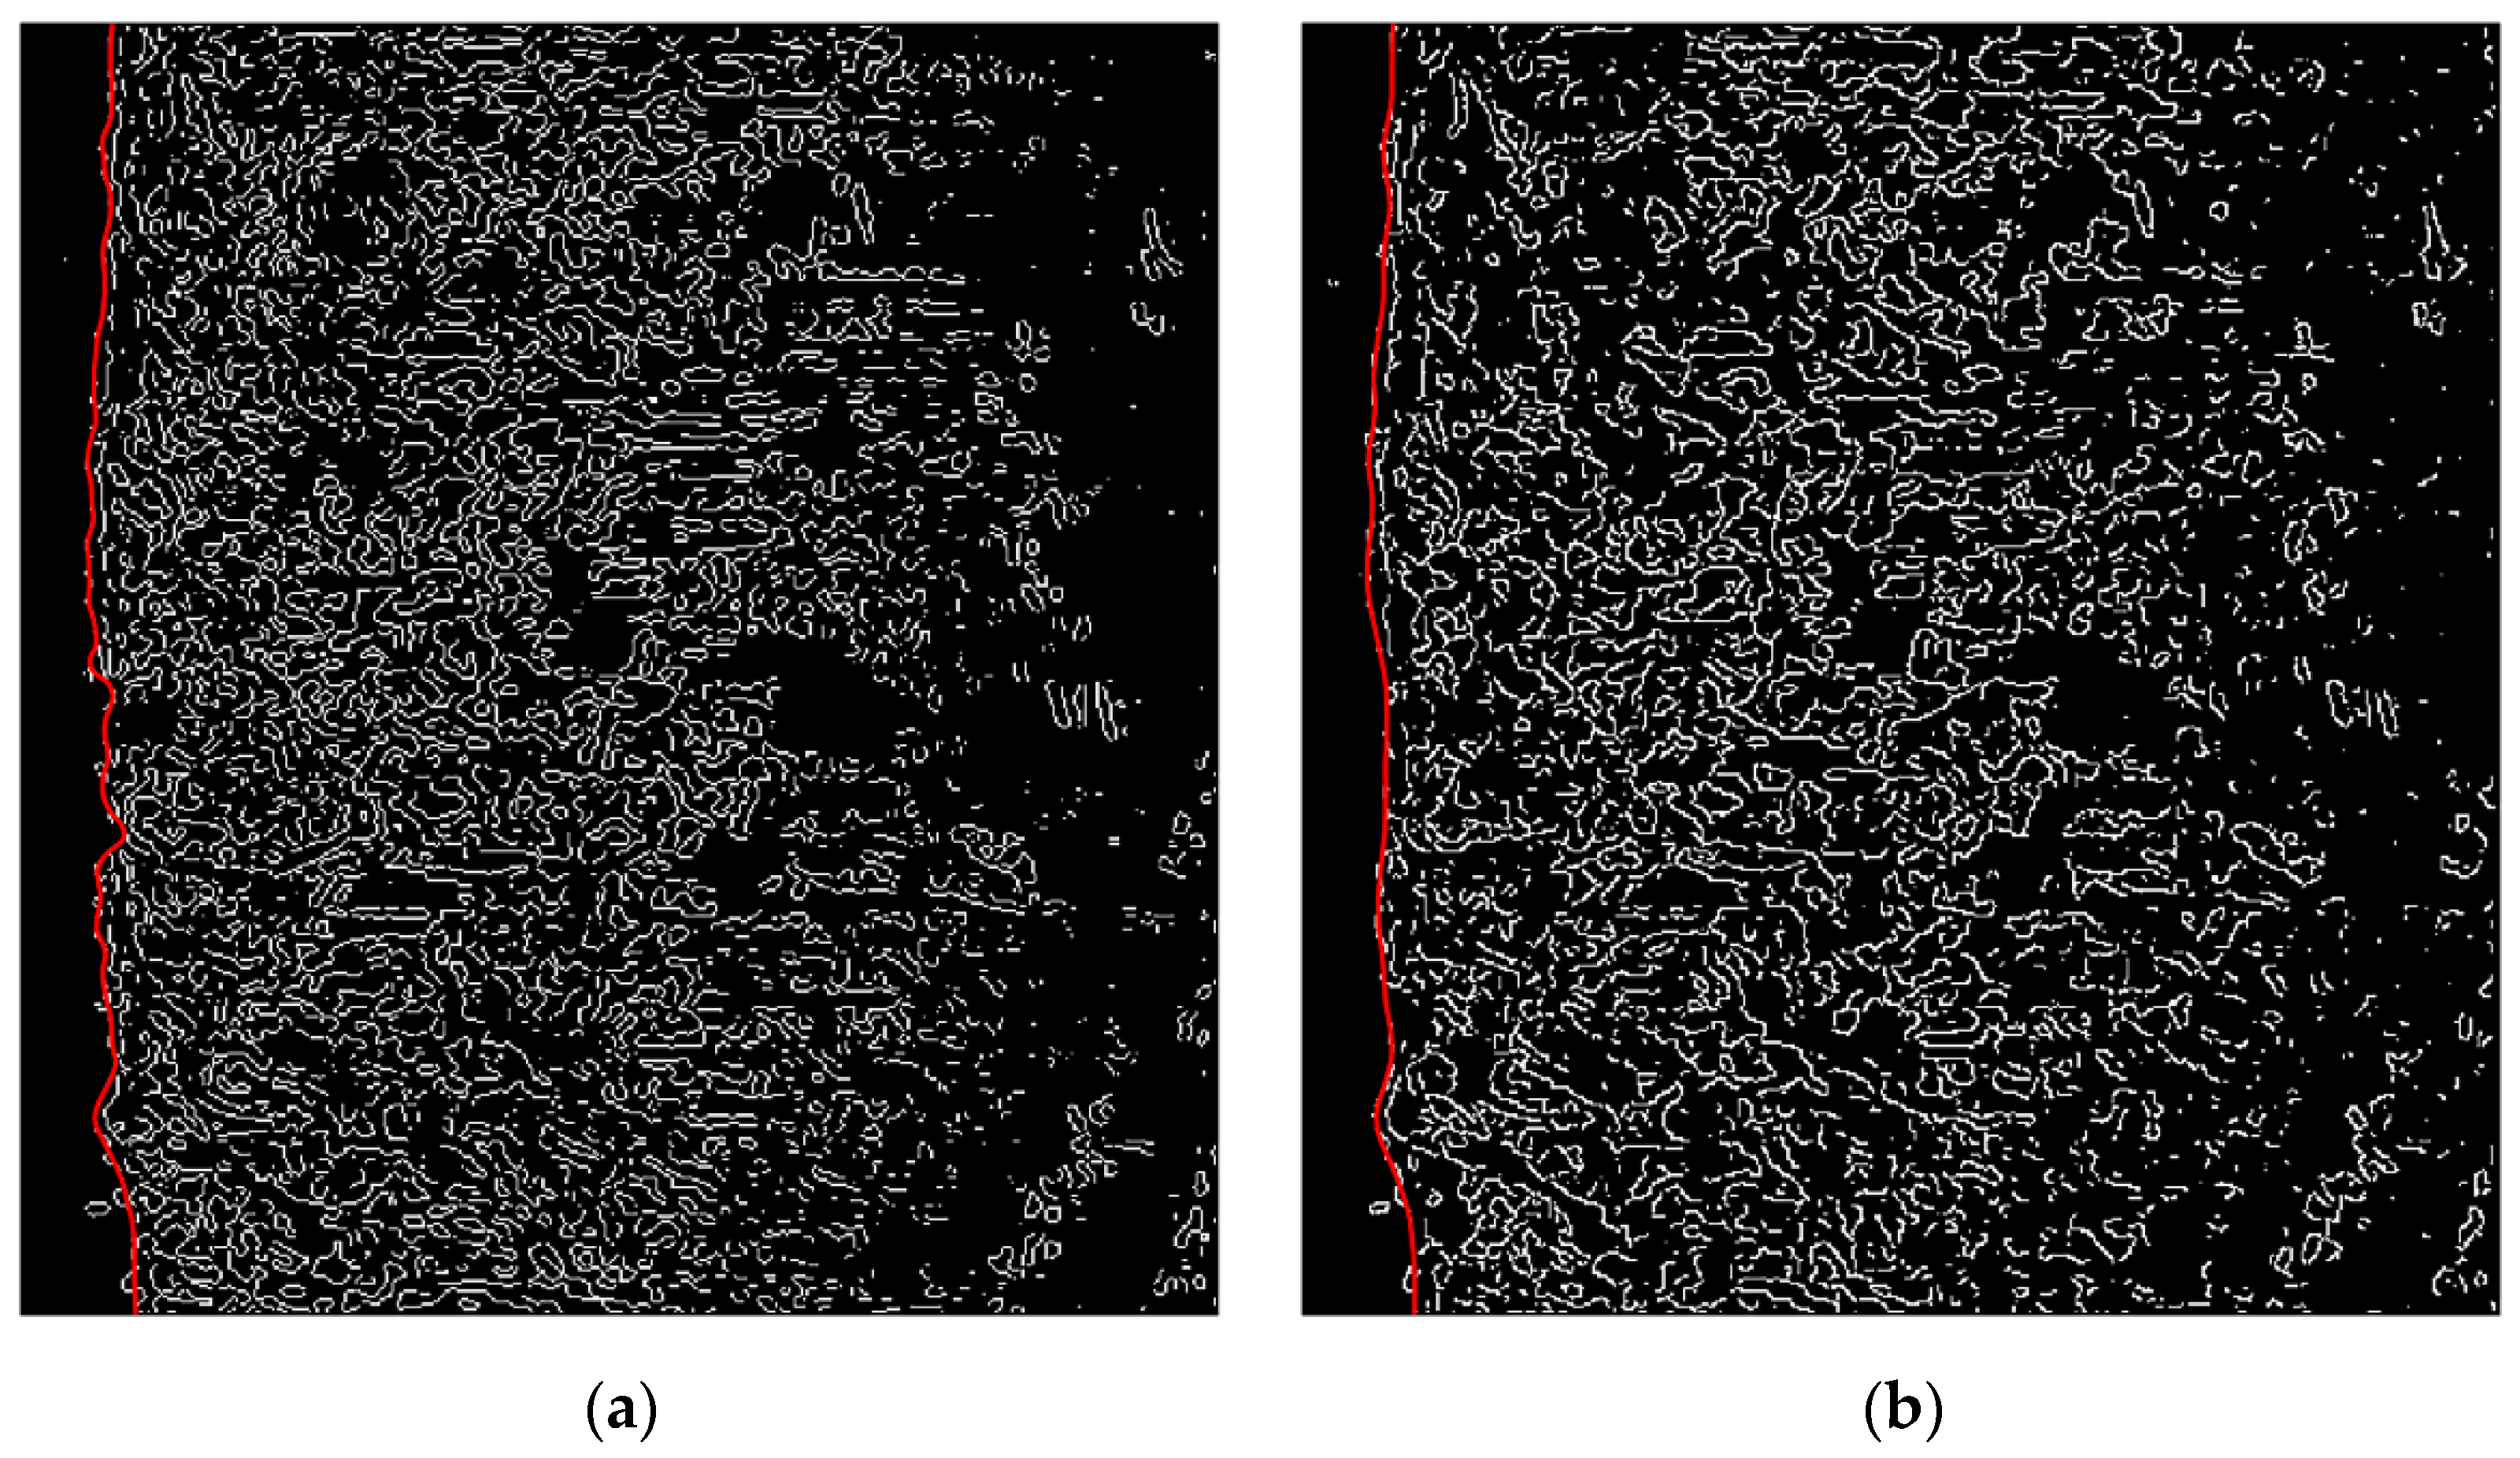
The results of sea bottom line tracking based on the log-operator and proposed WTMM-based edge detection methods are compared in Figure 7a and Figure 7b, respectively. As can be seen, the generated seabed lines do not generally differ significantly from a qualitative perspective. Nonetheless, the two sea bottom lines are not equivalent.
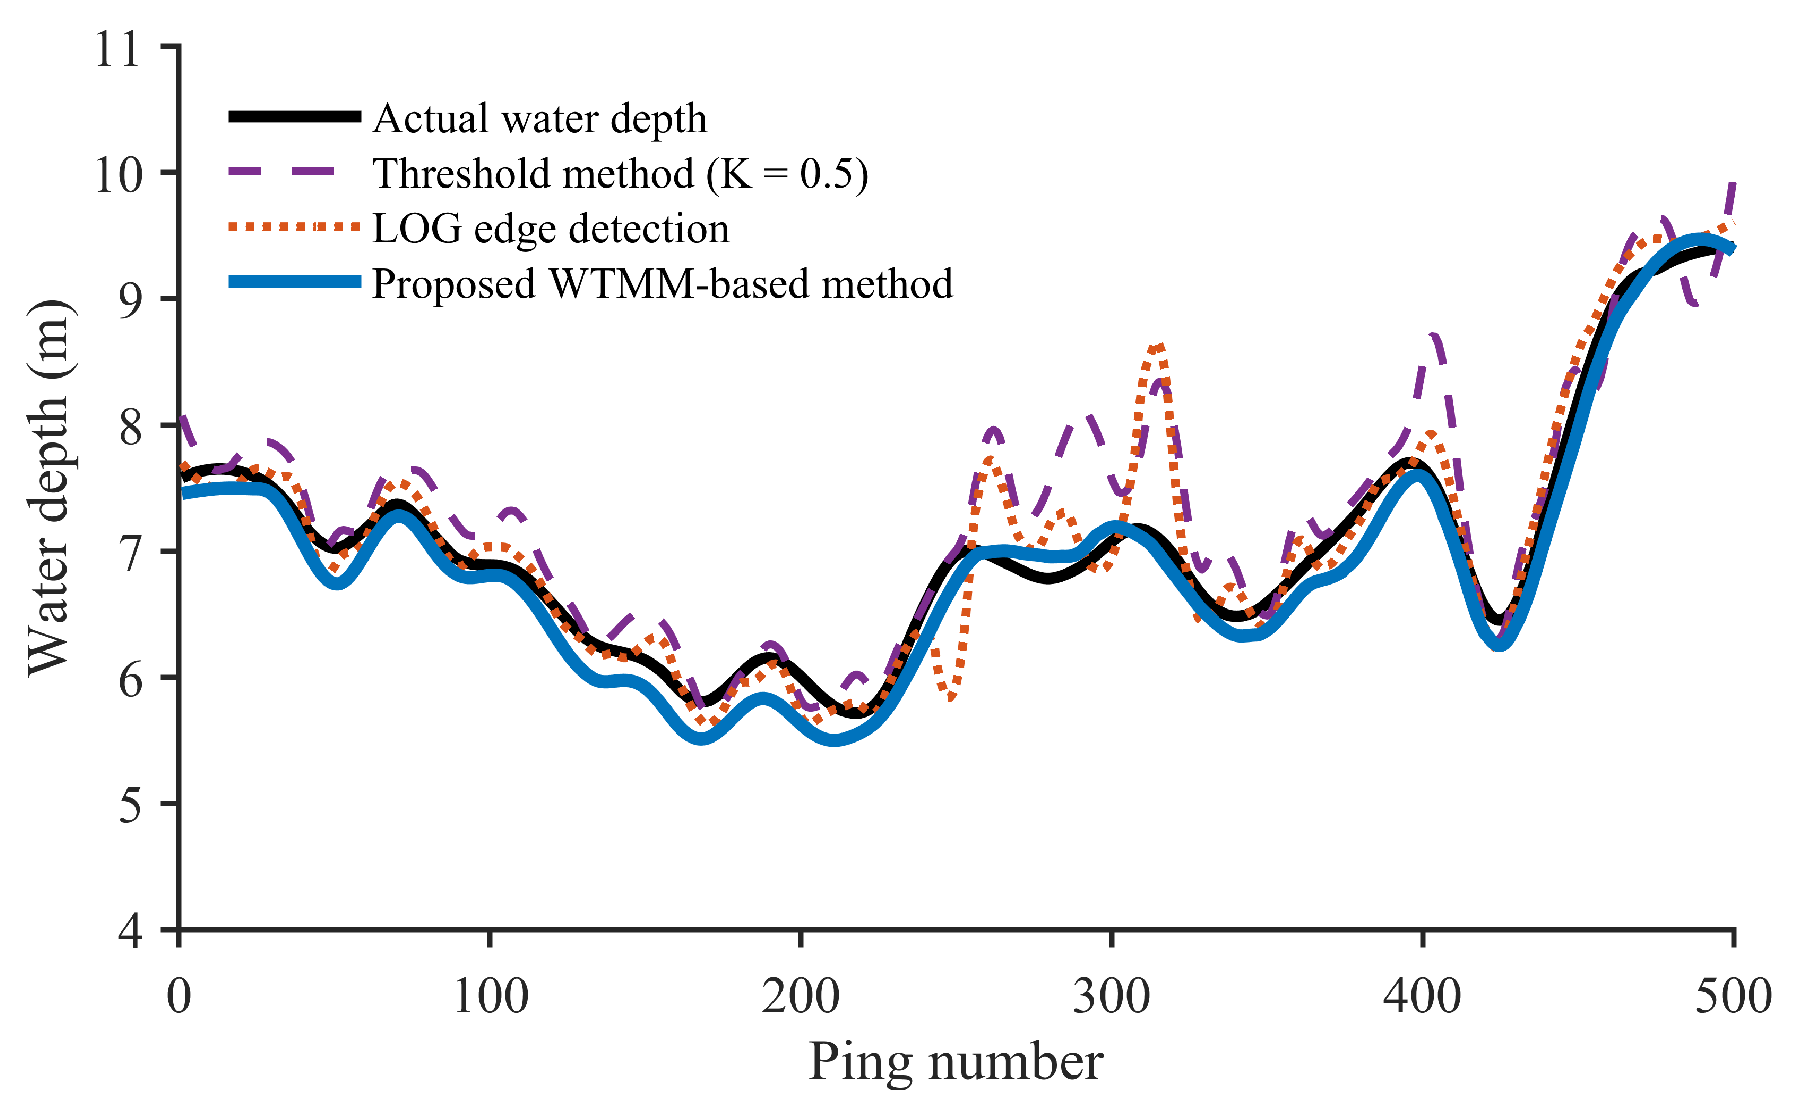
The differences between the sea bottom lines generated by the general threshold with filtering and smoothing, log-operator-based, and WTMM-based methods for the raw sonar image can be evaluated more intuitively based on the plots of actual water depths and the depths detected based on the different tracking methods presented in Figure 8 with respect to the corresponding sequence of sonar pings. As can be seen, the tracking error of the threshold method is particularly great at pings 250–325 and 400, while the tracking error based on the log-operator method is the largest at ping 325. The maximum and average RMS tracking errors obtained by the three different methods over all 500 pings are listed in Table 1. In addition, the average computational runtime of each method under identical experimental conditions is also presented for computational efficiency comparison. As can be seen, both baseline methods generated a maximum tracking error of greater than 1 m. Meanwhile, the proposed WTMM-based method generated greatly reduced maximum and average RMS errors. Accordingly, the proposed method provides a seabed location that is considerably more accurate than the baseline methods considered, and the detailed processing of the junction of the image area and the water column area is also more precise. Although the proposed WTMM-based method required a slightly longer runtime than the conventional threshold and LOG operator methods because of the additional multi-scale wavelet convolution and gradient analysis procedures, the overall computational cost remained within an acceptable range for practical side-scan sonar image processing applications. The experimental results demonstrate that the proposed method achieves a favorable balance between tracking accuracy, robustness, and computational efficiency.

3.2. Noisy Sonar Image

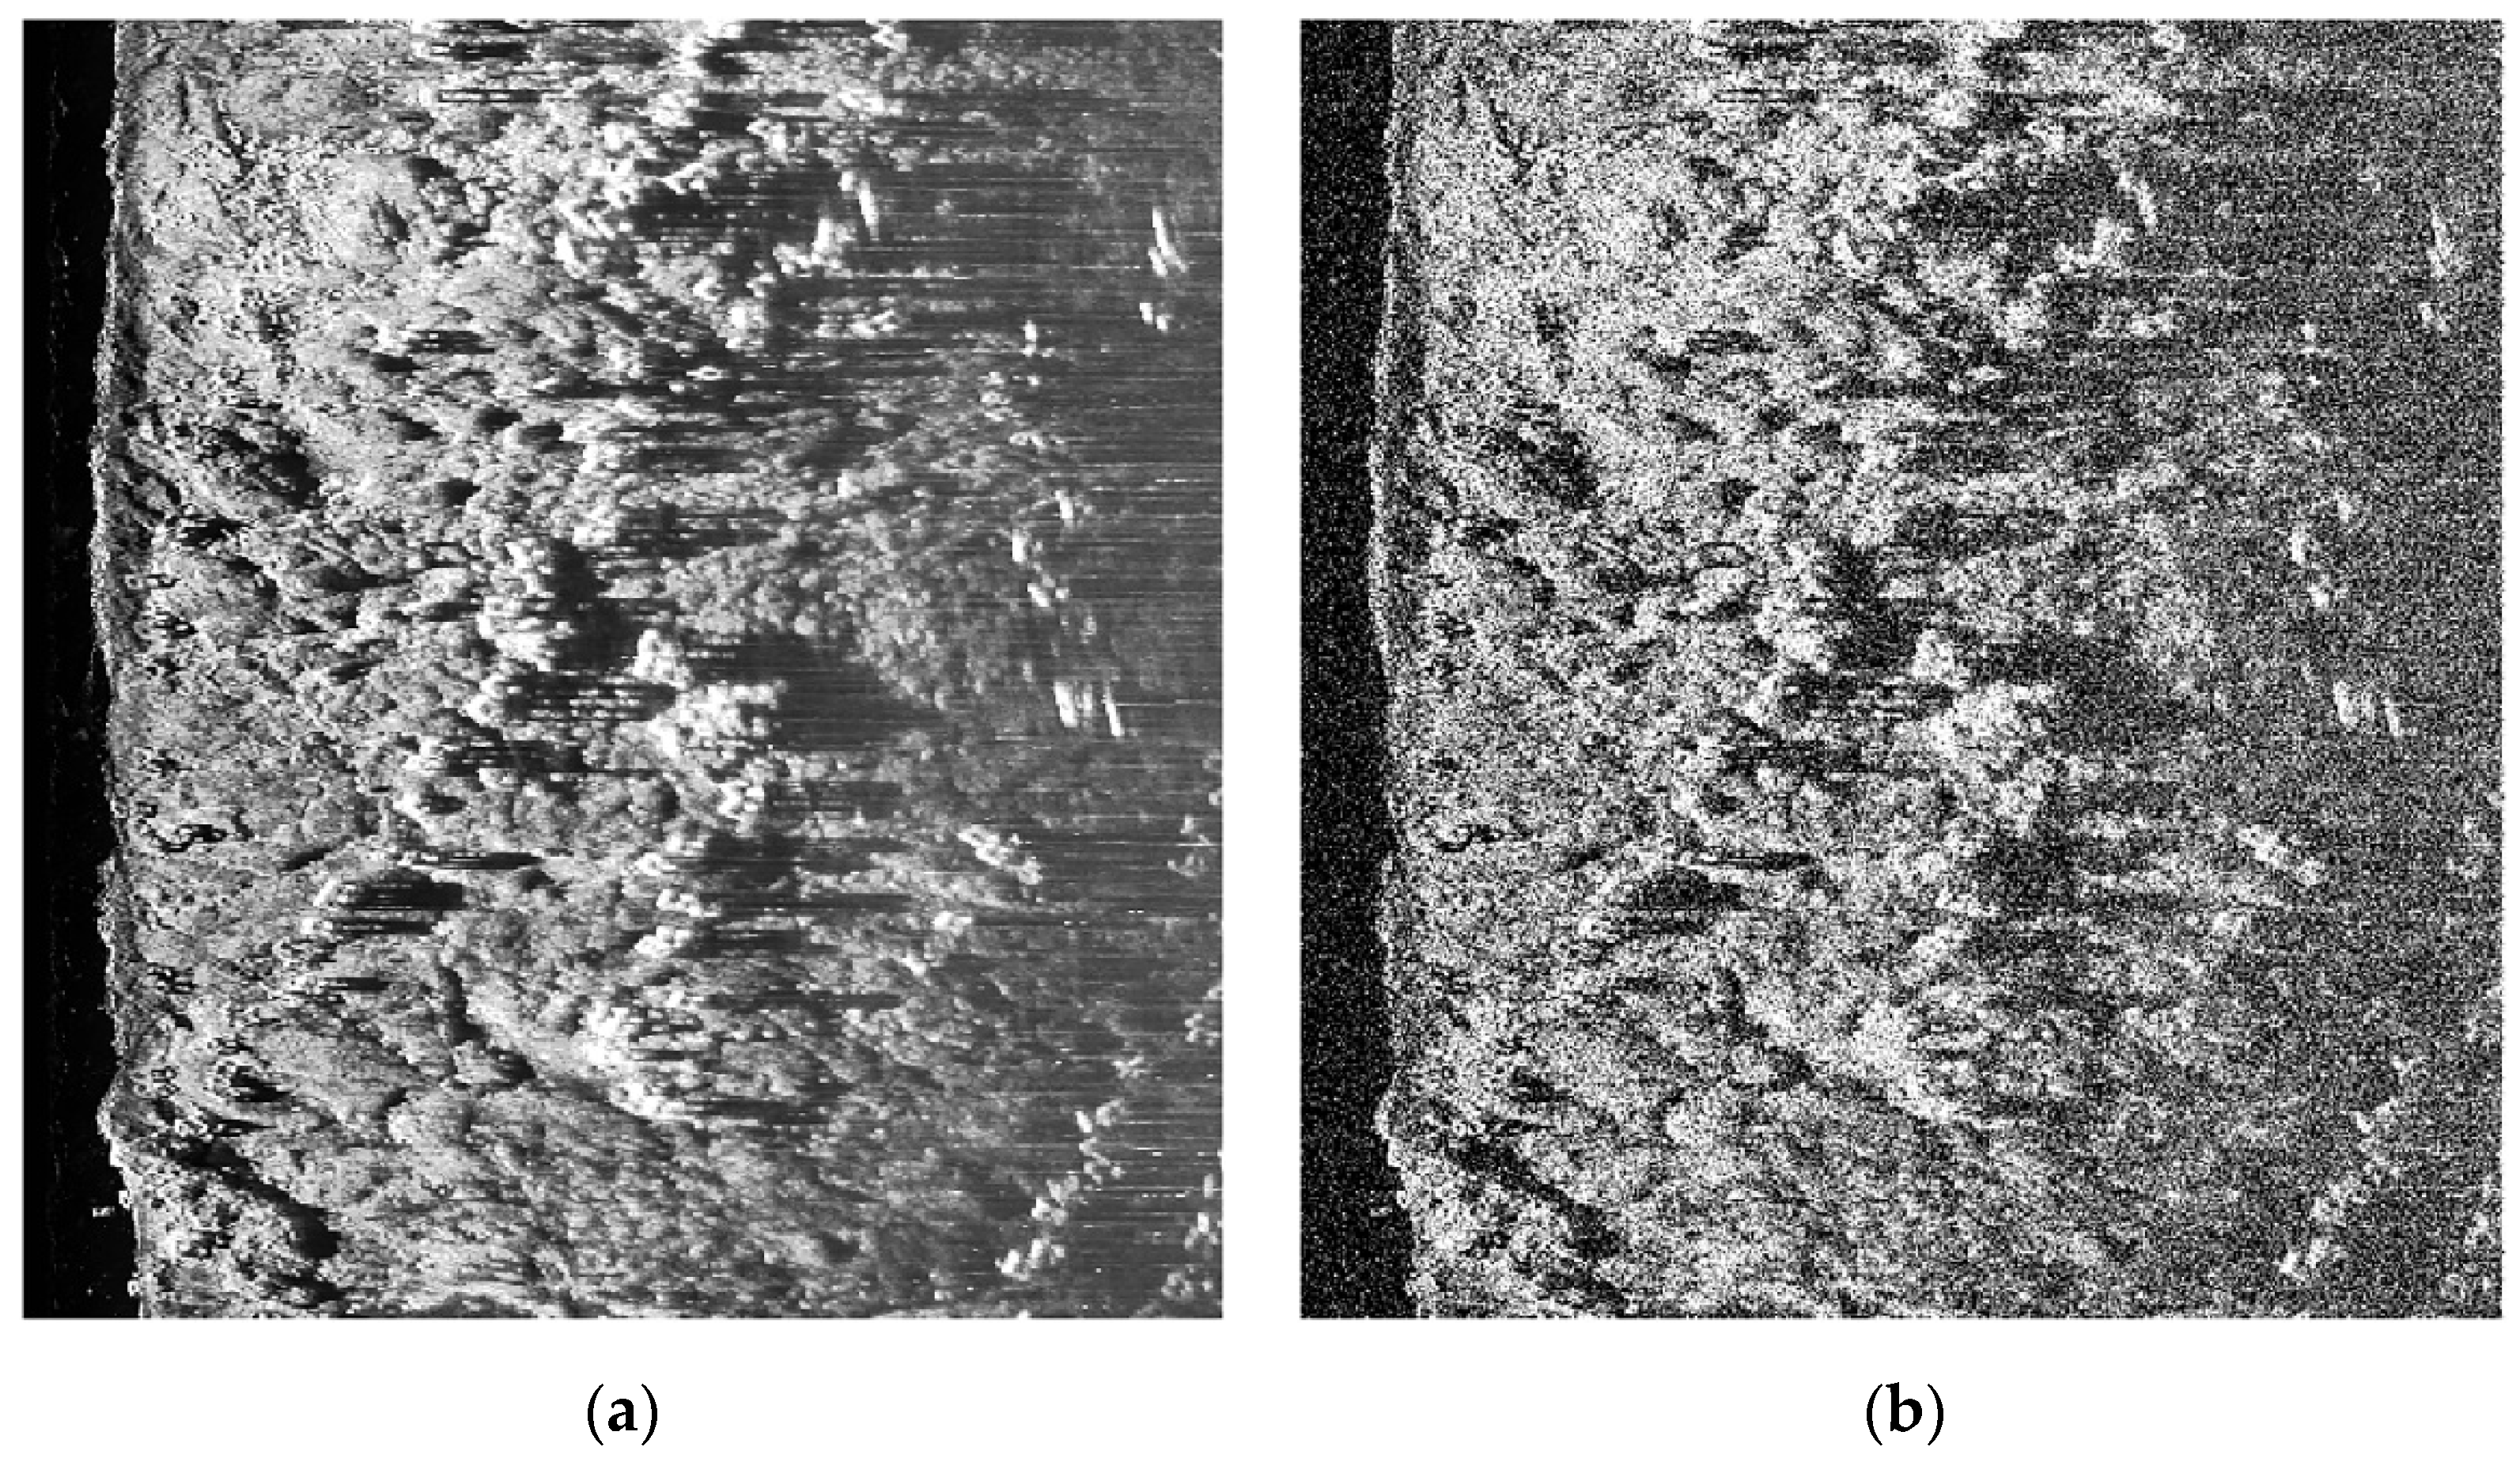
The entire process by which side-scan sonar applies hydroacoustic echoes to obtain images of the topography of the seafloor is conducted underwater. Therefore, changes in the underwater environment depending on the weather, location, and time will impact the quality of the final image. Moreover, the navigation of the operating vessel and towfish will generate underwater wakes or even bubble flow. All of these scattering interactions can impact the noise level, texture, and edge information in a side-scan sonar image [27,28]. Under these conditions, the principal factor affecting the quality of side-scan sonar images is multiplicative speckle noise that arises from the reverberant signal formed at the receiving end due to the superimposed echo signals generated from these scattering interactions [29,30,31]. These environmental variations have also been widely investigated in recent IoUT and underwater optical wireless communication studies, where water turbidity, turbulence, and channel conditions significantly affect signal propagation and sensing performance [32,33]. Therefore, the present work investigated the impact of speckle noise on the sea bottom line tracking capabilities of the general threshold, log-operator-based, and WTMM-based methods by adding additive Gaussian noise (mean = 0, standard deviation = 0.06) to the raw side-scan sonar image. The raw and noisy images are presented in Figure 9a and Figure 9b, respectively. Qualitatively, we note that the addition of noise clearly detracts from the resolution of the side-scan sonar image. In addition, the boundary between the image area and the water column area blurs, and the overall topography in the image becomes less distinct and discernible.
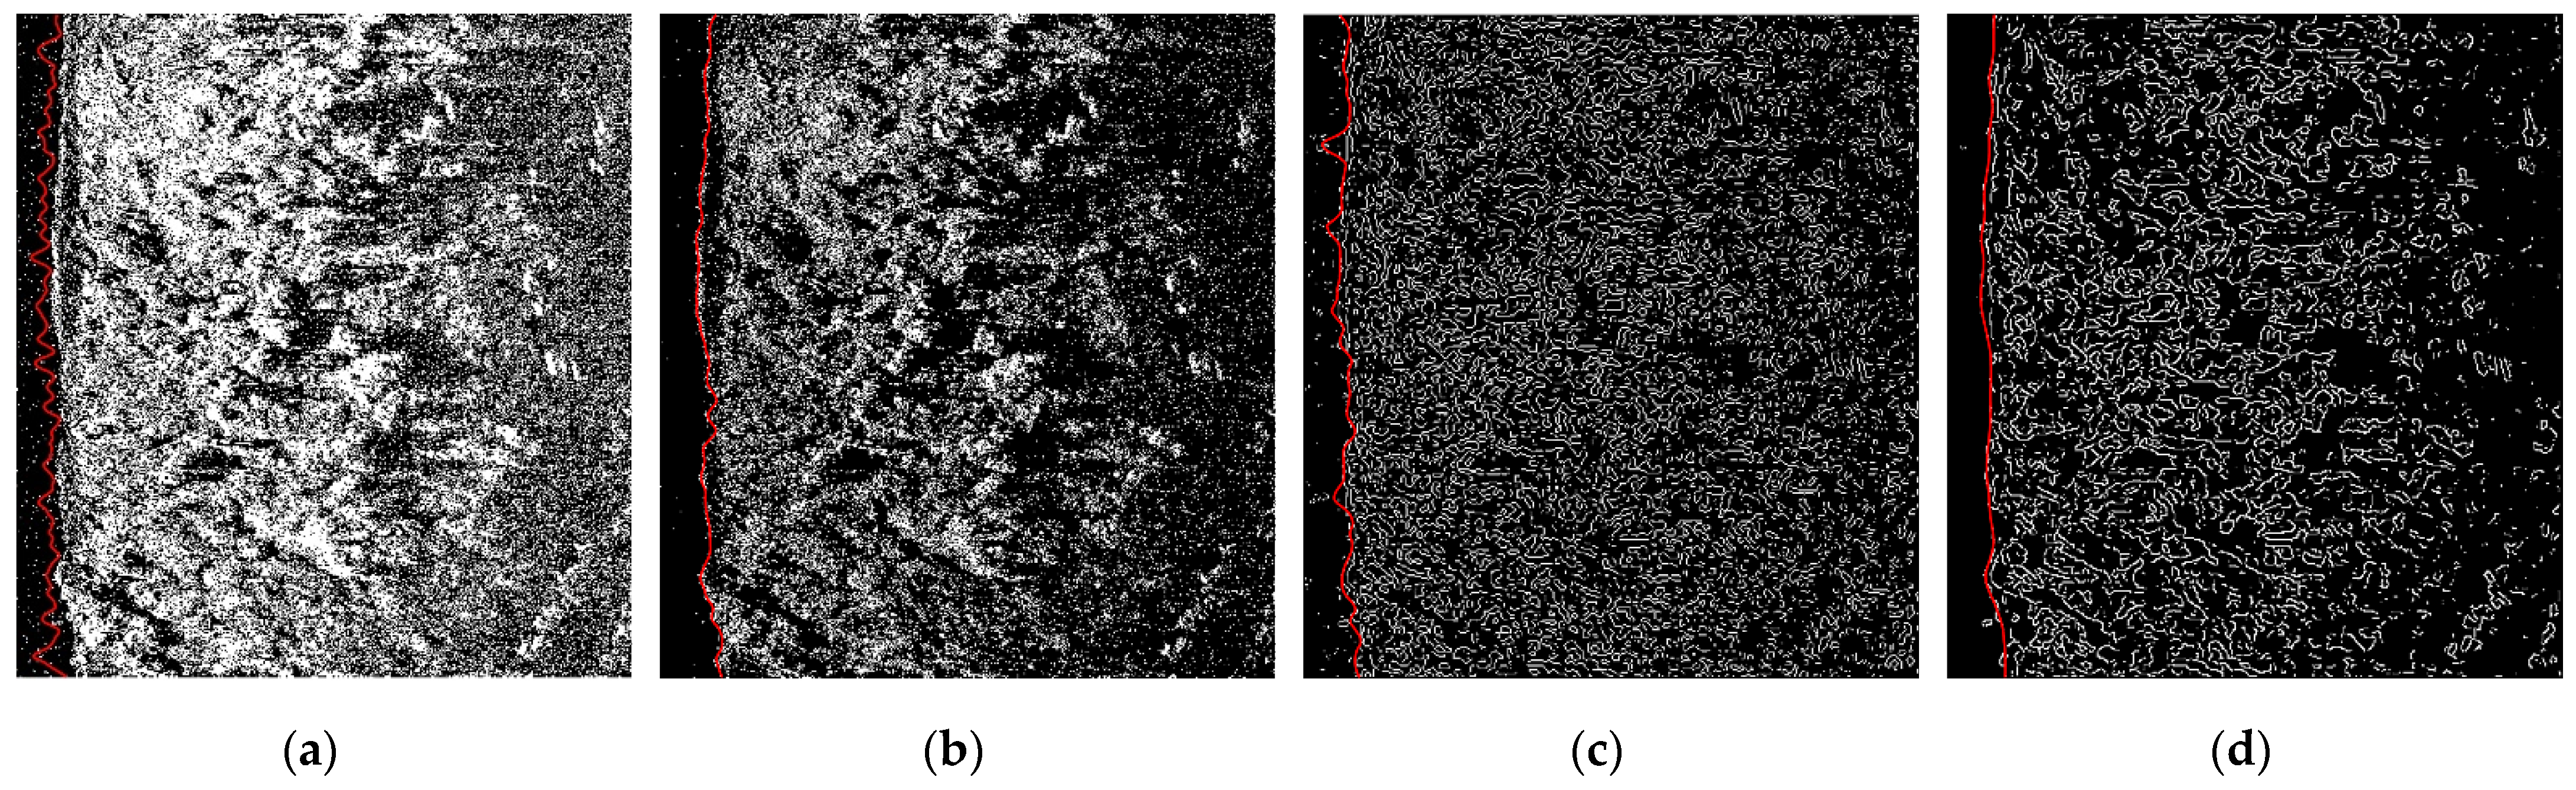
The results of sea bottom line tracking in the noisy sonar image (Figure 9b) based on the threshold method with K = 0.5 and K = 0.76 and the log-operator and proposed WTMM-based edge detection methods are compared in Figure 10a–d, respectively. The results presented in Figure 10a,b were obtained after filtering and smoothing. Qualitatively, we note that the tracking results obtained using the threshold method appear to be considerably more accurate with the larger threshold of K = 0.76. We further note that the seabed lines generated by the two edge detection methods in Figure 10c,d now differ much more greatly when applied to the noisy sonar image than those observed when applied to the raw images in Figure 7a,b.
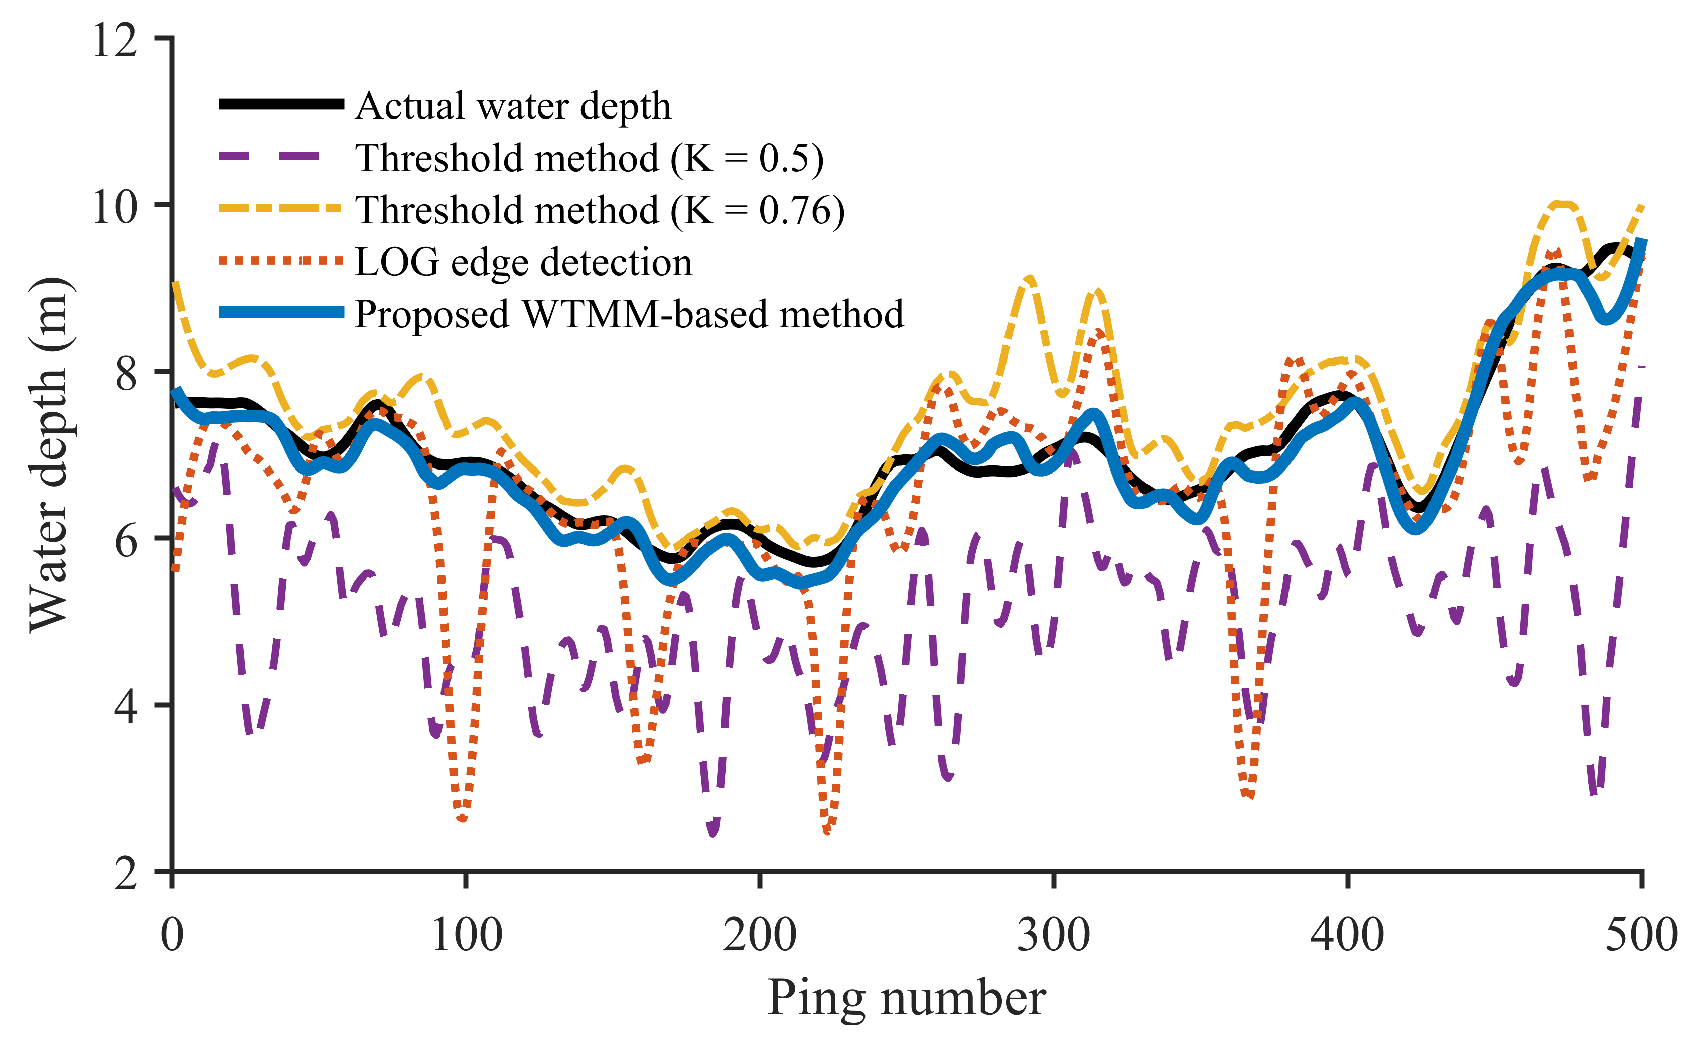
The differences between the sea bottom lines generated by the general threshold with filtering and smoothing, log-operator-based, and WTMM-based methods can be evaluated more intuitively based on the plots of actual water depths and the depths detected based on the different tracking methods presented in Figure 11 with respect to the corresponding sequence of sonar pings. As can be seen, applying the larger threshold of K = 0.76 yields a detected water depth that is much closer to the actual water depth than the results obtained with the standard threshold of K = 0.5. This improved performance under noisy conditions follows because the threshold method converts the grayscale sonar image into a binary image by resetting its pixel values to either 0 or the maximum value of 255 according to the established threshold value. Therefore, the threshold value must be increased to eliminate the noisy pixels in the water column area and achieve an accurate location for the sea bottom line. In fact, we note from Figure 11 that the water depths detected under the larger threshold of K = 0.76 are often much closer to the actual water depth under added speckle noise than the results obtained with the log-operator-based edge detection method. These qualitative observations are further supported by the quantitative results reported in Table 2, where the maximum tracking error, RMS error (mean ± standard deviation), and runtime are jointly evaluated for each method. These results can be combined with the maximum and average RMS tracking errors obtained by the different methods over all 500 pings listed in Table 2. As can be seen, applying the larger threshold of K = 0.76 under noisy image conditions yields quantitative performance metric values that are substantially superior to those of the log-operator-based edge detection method. This is because the localization accuracy of the log-operator method decreases under noisy conditions, and this increases the occurrence of false edge detection. Specifically, the log-operator edge detection approach applies a simple quasi-Gaussian function as a smoothing operation and then locates the derivative maximum in the image with a first-order differential in the direction of the local gradient with the maximum amplitude [34]. However, the first-order differential operator induces a conflict between mitigating the effect of noise and achieving accurate edge localization in practical applications. Accordingly, this type of method is very sensitive to noise. In addition, the runtime comparison reported in Table 2 demonstrates that the proposed WTMM-based method maintains comparable computational efficiency while achieving significantly improved robustness, indicating a favorable trade-off between accuracy and computational cost. The standard deviation of RMS errors further indicates that WTMM exhibits lower variability and higher stability under repeated noisy realizations. In contrast, the WTMM-based sea bottom line detection method proposed in this paper generated greatly reduced maximum and average RMS errors under noisy conditions compared with the performances of the other methods considered. Moreover, comparing the results listed in Table 1 and Table 2 indicates that the proposed method achieved sea bottom line detection results under noisy conditions that were highly consistent with those detected for the original raw sonar image. Accordingly, the added speckle noise had no detrimental impact on the ability of the WTMM-based method to detect the sea bottom line in the side-scan sonar image. This can be attributed to the good localization characteristics and multi-scale detection features of wavelet transform analysis, which can suppress the impact of noise in the sonar image on the accurate extraction of edge information [35].
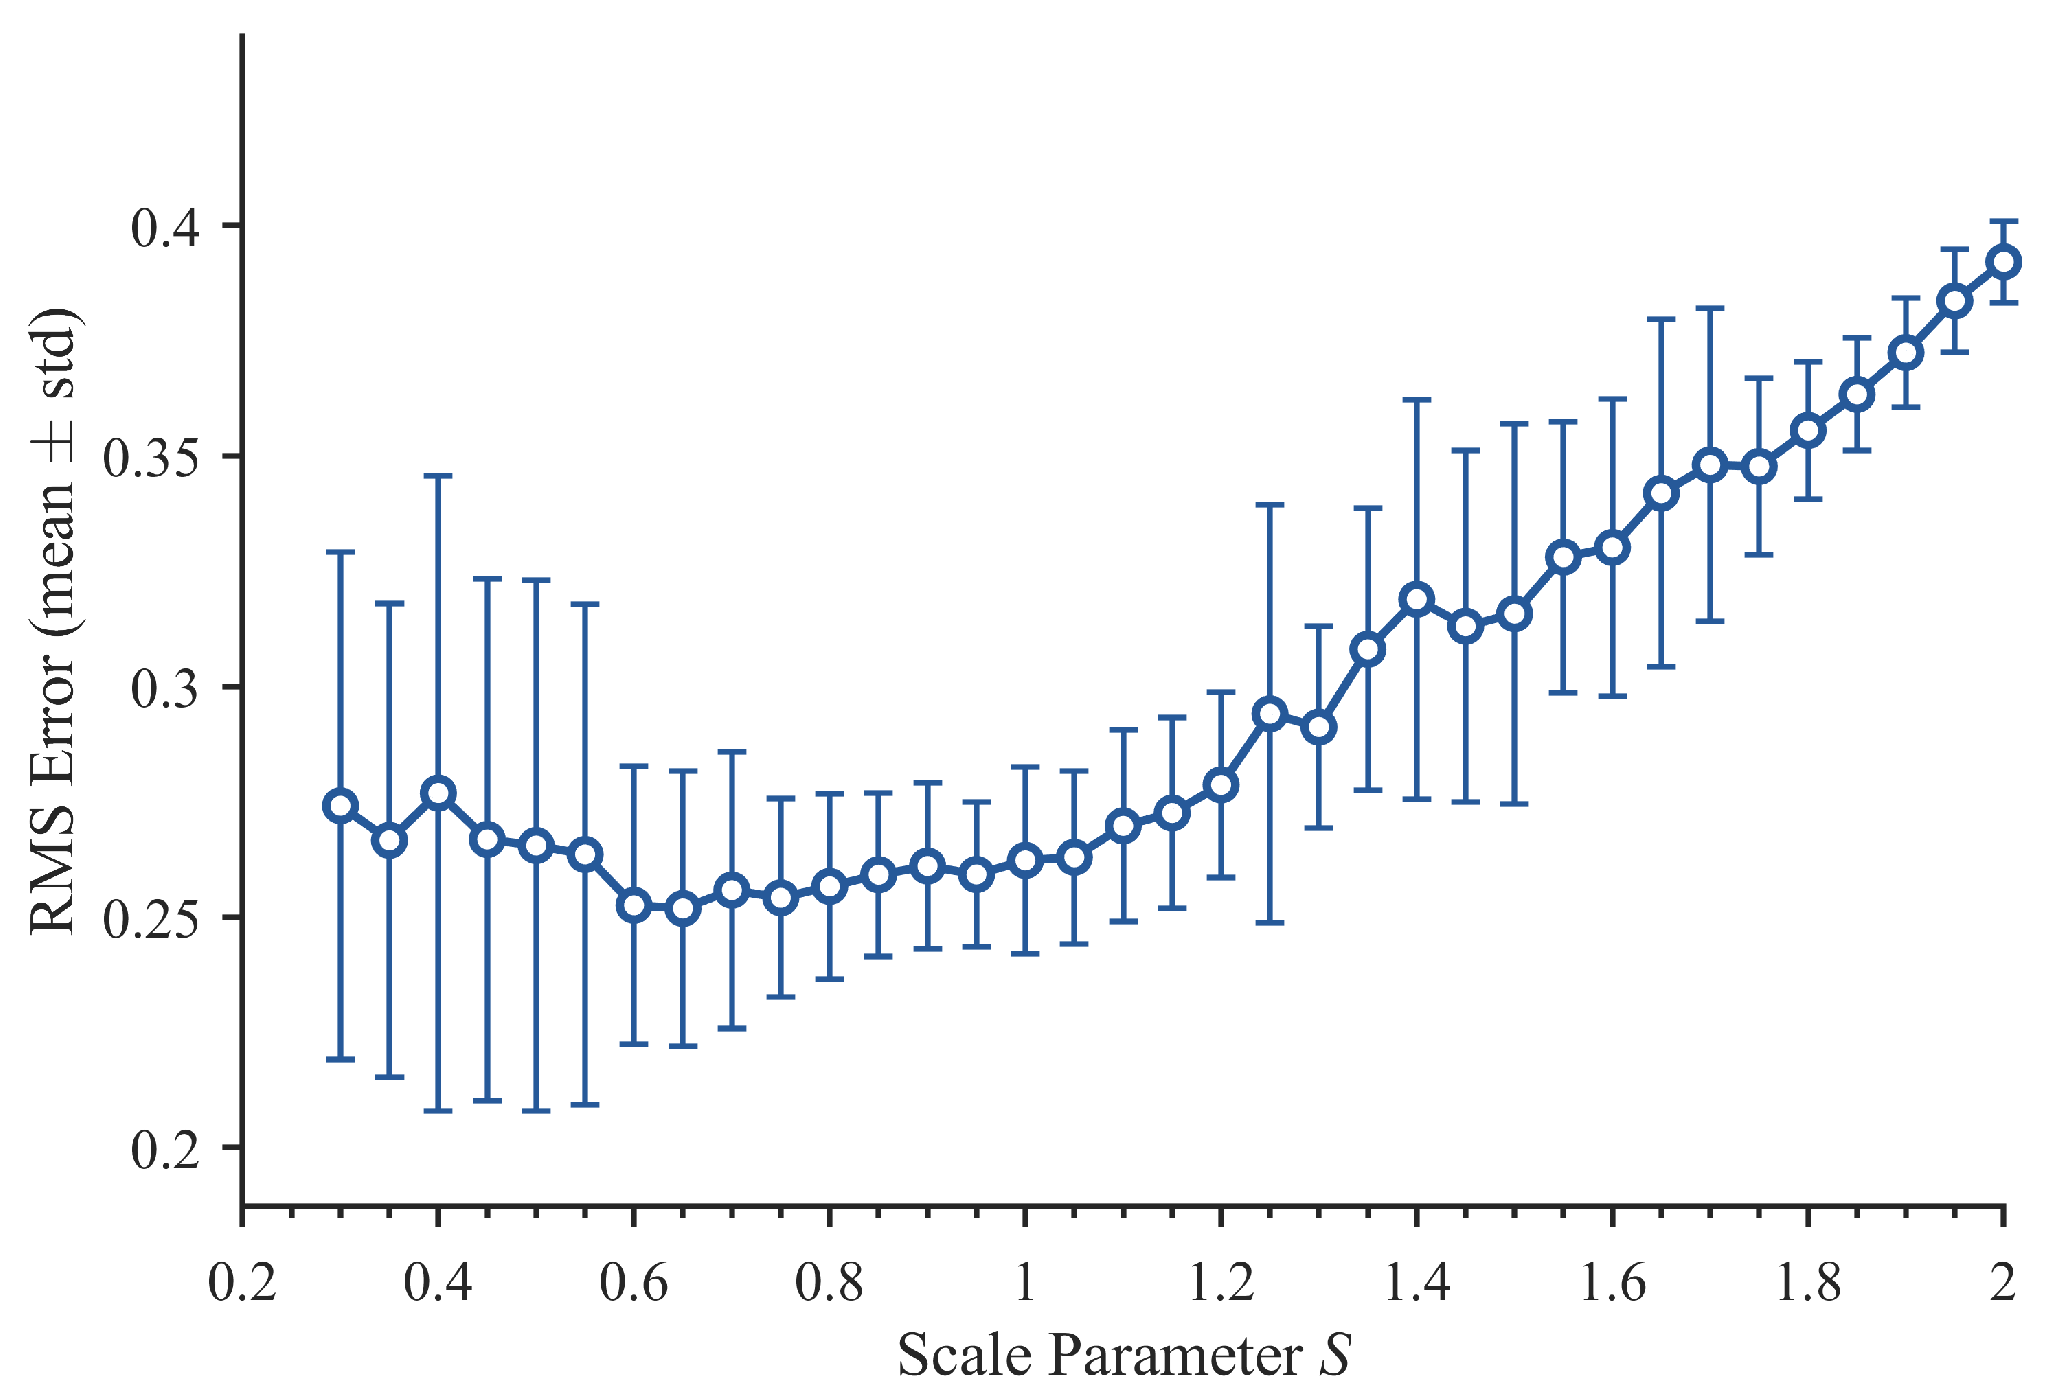
To evaluate the sensitivity of the scale parameter S in the proposed WTMM-based framework, a robustness analysis was conducted using noisy sonar images. Twenty independent experiments were performed for each S value, and the corresponding RMS tracking errors are presented in Figure 12. The experimental results reveal a clear U-shaped relationship between the tracking performance and the parameter S . In the lower parameter range ( S < 0.6 ) , the framework exhibits relatively high RMS errors and larger fluctuations, mainly due to the inadequate suppression of noise-induced spurious edges. As S increases, the tracking accuracy improves significantly and gradually reaches a stable region within the interval of [ 0.6 ,   1.2 ] , where both the mean RMS error and its standard deviation remain consistently low. However, excessively large values of S (S > 1.2) introduce an over-smoothing effect that weakens critical seabed boundary details, thereby leading to a noticeable degradation in tracking accuracy. Overall, the proposed method demonstrates satisfactory robustness and stability over a relatively broad range of S , providing a practical and reliable guideline for parameter selection in complex noisy environments.

4. Discussion and Limitations

Although the proposed WTMM-based sea bottom line tracking method achieved satisfactory experimental results, several limitations still remain in the current study.
To quantitatively evaluate the tracking accuracy, the experiments were mainly conducted using side-scan sonar images acquired from the 3DSS-DX sonar system, which simultaneously provides corresponding water-depth information. However, datasets containing reliable synchronous bathymetric measurements are relatively limited, resulting in a comparatively small experimental data scale. Therefore, the current study mainly focused on comparisons with conventional sea bottom line tracking methods, while comparisons with deep learning-based or other data-driven approaches were not extensively investigated in the current study. This is primarily because deep learning methods generally require relatively large-scale labeled datasets to ensure reliable model training, parameter optimization, and fair performance evaluation. Consequently, the generalization capability of the proposed method under different sonar systems, seabed environments, and survey conditions still requires further validation using larger multi-source datasets. Therefore, the current study should be regarded as a preliminary validation under limited datasets rather than a comprehensive benchmark study.
In addition, to further evaluate the robustness and stability of the proposed method, repeated experiments under randomly generated noise conditions were conducted in this study, and the tracking errors were statistically analyzed using RMS (mean ± std). The experimental results demonstrate that the proposed method maintains relatively stable tracking performance under different noise disturbances. Nevertheless, the robustness analysis was mainly performed by artificially adding noise to sonar images to simulate noisy underwater environments. Although this approach can effectively reflect the influence of random disturbances on tracking performance, the actual underwater acoustic environment is considerably more complex and may involve multiplicative speckle noise, multipath propagation, turbulence effects, and biological interference. Therefore, the current noise simulation still has certain limitations in accurately representing real underwater acoustic environments.
Furthermore, several parameters used in the proposed algorithm were determined empirically based on repeated experimental observations. Although these parameter settings achieved satisfactory tracking accuracy for the current datasets, their applicability under different sonar imaging conditions may still be limited. Future work will therefore focus on adaptive parameter optimization strategies by comprehensively considering multiple sonar imaging characteristics, including seabed sediment conditions, sonar image quality assessment, contrast characteristics between the water-column region and side-scan image region, and operating frequencies of different sonar systems. In addition, future studies will further investigate real-time implementation and validation under larger-scale multi-platform sonar datasets to improve the automation capability, robustness, and practical applicability of the proposed method.

5. Conclusions

The present work addressed the limitations of existing seabed tracking methods applied for tracking the sea bottom line in side-scan sonar images under high signal noise conditions by applying robust edge detection and multi-scale analysis based on WTMM. The proposed method was demonstrated to offer superior sea bottom tracking performance compared to that of the commercial threshold method and the log-operator-based edge detection method based on the results of experiments conducted in Matlab for a representative 3DSS-DX side-scan sonar image with and without added speckle noise. The superiority of the proposed WTMM-based method was confirmed for both the raw and noisy images. Moreover, the proposed method achieved a sea bottom line detection accuracy under noisy conditions that was essentially identical to the accuracy obtained for the original raw sonar image. Accordingly, the added speckle noise showed limited influence on the tracking accuracy of the ability of the proposed method to detect the sea bottom line in the side-scan sonar image, whereas the performances of the baseline methods were strongly impacted by the added noise. The robust performance of the proposed WTMM-based method can be attributed to the good localization characteristics and multi-scale detection features of wavelet transform analysis, which clearly suppress the impact of noise in the sonar image on the accurate extraction of edge information. Future research can be extended in several directions to make the detection process simpler and more convenient and enhance the accuracy of detection results. Firstly, the scale parameters in the proposed WTMM algorithm can be appropriately adjusted to ensure efficient noise suppression and effective information retention during seabed line detection. Secondly, the noise threshold can be adjusted adaptively via the statistical analysis of noise information based on histograms of sonar image pixels. Third, future work will focus on integrating the proposed method into a complete side-scan sonar image processing pipeline, incorporating environmental information during field measurements to enable real-time application and extend its applicability to different survey areas.

Author Contributions

Conceptualization, J.D. and F.J.; methodology, F.J.; validation, F.J. and F.W.; investigation, F.J., F.W. and L.Y.; writing—original draft preparation, F.J. and J.D.; writing—review and editing, J.D., F.W. and L.Y.; supervision, J.D.; funding acquisition, J.D. All authors have read and agreed to the published version of the manuscript.

Funding

This research was funded by the Shandong Provincial Natural Science Foundation of China (No. ZR2023MD119).

Data Availability Statement

The data presented in this study are available upon reasonable request from the corresponding author.

Conflicts of Interest

Authors Jisheng Ding and Fangqi Wang were employed by Qingdao Institute of Marine Engineering Survey and Design Co., Ltd. Author Fengbiao Jiang was employed by Shanghai Waterway Engineering Design and Consulting Co., Ltd. The remaining authors declare that the research was conducted in the absence of any commercial or financial relationships that could be construed as a potential conflict of interest.

References

  1. Collier, J.S.; Humber, S.R. Time-lapse side-scan sonar imaging of bleached coral reefs: A case study from the Seychelles. Remote Sens. Environ. 2007, 108, 339–356. [Google Scholar] [CrossRef]
  2. Hogan, K.A.; Dowdeswell, J.A.; Mienert, J. New insights into slide processes and seafloor geology revealed by side-scan imagery of the massive Hinlopen Slide, Arctic Ocean margin. Geo-Mar. Lett. 2013, 33, 325–343. [Google Scholar] [CrossRef]
  3. Lafferty, B.; Quinn, R.; Breen, C. A side-scan sonar and high-resolution Chirp sub-bottom profile study of the natural and anthropogenic sedimentary record of Lower Lough Erne, northwestern Ireland. J. Archaeol. Sci. 2006, 33, 756–766. [Google Scholar] [CrossRef]
  4. Van Overmeeren, R.; Craeymeersch, J.; Van Dalfsen, J.; Fey, F.; Van Heteren, S.; Meesters, E. Acoustic habitat and shellfish mapping and monitoring in shallow coastal water—Sidescan sonar experiences in The Netherlands. Estuar. Coast. Shelf Sci. 2009, 85, 437–448. [Google Scholar] [CrossRef]
  5. Zerr, B.; Stage, B. Three-dimensional reconstruction of underwater objects from a sequence of sonar images. In Proceedings of the 3rd IEEE International Conference on Image Processing, Lausanne, Switzerland, 19 September 1996; Volume 3, pp. 927–930. [Google Scholar]
  6. Blondel, P. The Handbook of Sidescan Sonar; Springer: Berlin/Heidelberg, Germany, 2009; ISBN 978-3-540-42641-7. [Google Scholar]
  7. Zhang, J.B.; Pan, G.F.; Ding, W.F. Bottom track method in side-scan sonar data processing based on LOG operator. Mar. Sci. Bull. 2010, 29, 324–328. [Google Scholar] [CrossRef]
  8. Zhao, J.; Wang, X.; Zhang, H.; Wang, A. A comprehensive bottom-tracking method for sidescan sonar image influenced by complicated measuring environment. IEEE J. Ocean. Eng. 2017, 42, 619–631. [Google Scholar] [CrossRef]
  9. Wang, A.; Church, I.; Gou, J.; Zhao, J. Sea bottom line tracking in side-scan sonar image through the combination of points density clustering and chains seeking. J. Mar. Sci. Technol. 2020, 25, 849–865. [Google Scholar] [CrossRef]
  10. Wang, A.X.; Jin, S.H.; Liu, T.Y.; Cha, W.F.; Liu, C. Automatic tracking sea bottom line on side-scan sonar image by direction adaptive DBSCAN. Geomat. Inf. Sci. Wuhan Univ. 2025, 50, 674–683+698. [Google Scholar] [CrossRef]
  11. Yin, H.; Wang, L.; Mao, Y.; Jin, L. Research on automatic extraction method of seafloor line from side-scan sonar based on symmetry principle. Express Water Resour. Hydropower Inf. 2025, 46, 26–31+60. [Google Scholar] [CrossRef]
  12. Canny, J. A computational approach to edge detection. IEEE Trans. Pattern Anal. Mach. Intell. 1986, 8, 679–698. [Google Scholar] [CrossRef] [PubMed]
  13. Hou, Z.J.; Wei, G.W. A new approach to edge detection. Pattern Recognit. 2002, 35, 1559–1570. [Google Scholar] [CrossRef]
  14. Melin, P.; Gonzalez, C.I.; Castro, J.R.; Mendoza, O.; Castillo, O. Edge-detection method for image processing based on generalized type-2 fuzzy logic. IEEE Trans. Fuzzy Syst. 2014, 22, 1515–1525. [Google Scholar] [CrossRef]
  15. You, N.; Han, L.; Zhu, D.; Song, W. Research on Image Denoising in Edge Detection Based on Wavelet Transform. Appl. Sci. 2023, 13, 1837. [Google Scholar] [CrossRef]
  16. Huang, Q.; Huang, J. Comprehensive review of edge and contour detection: From traditional methods to recent advances. Neural Comput. Appl. 2025, 37, 2175–2209. [Google Scholar] [CrossRef]
  17. Bao, P.; Zhang, L.; Wu, X. Canny edge detection enhancement by scale multiplication. IEEE Trans. Pattern Anal. Mach. Intell. 2005, 27, 1485–1490. [Google Scholar] [CrossRef] [PubMed]
  18. Shih, C.-C.; Horng, M.-F.; Tseng, Y.-R.; Su, C.-F.; Chen, C.-Y. An adaptive bottom tracking algorithm for side-scan sonar seabed mapping. In Proceedings of the 2019 IEEE Underwater Technology (UT), Kaohsiung, Taiwan, 16–19 April 2019; pp. 1–7. [Google Scholar]
  19. Reed, S.; Ruiz, I.T.; Capus, C.; Petillot, Y. The fusion of large scale classified side-scan sonar image mosaics. IEEE Trans. Image Process. 2006, 15, 2049–2060. [Google Scholar] [CrossRef]
  20. Li, S.; Zhao, J.; Yu, Y.; Wu, Y.; Bian, S.; Zhai, G. Anisotropic total variation regularized low-rank approximation for SSS images radiometric distortion correction. IEEE Trans. Geosci. Remote Sens. 2022, 60, 5925412. [Google Scholar] [CrossRef]
  21. Ye, X.; Yang, H.; Li, C.; Jia, Y.; Li, P. A gray scale correction method for side-scan sonar images based on retinex. Remote Sens. 2019, 11, 1281. [Google Scholar] [CrossRef]
  22. Celik, T.; Tjahjadi, T. A novel method for sidescan sonar image segmentation. IEEE J. Ocean. Eng. 2011, 36, 186–194. [Google Scholar] [CrossRef]
  23. Mallat, S.; Hwang, W.L. Singularity detection and processing with wavelets. IEEE Trans. Inf. Theory 1992, 38, 617–643. [Google Scholar] [CrossRef]
  24. Heric, D.; Zazula, D. Combined edge detection using wavelet transform and signal registration. Image Vis. Comput. 2007, 25, 652–662. [Google Scholar] [CrossRef]
  25. Zhang, H.; Luo, L.; Yang, K.; Wang, L.; Gao, X. Improved multi-scale wavelet in pantograph slide edge detection. Optik 2014, 125, 5681–5683. [Google Scholar] [CrossRef]
  26. Wu, Y.; He, Y.; Cai, H. Optimal threshold selection algorithm in edge detection based on wavelet transform. Image Vis. Comput. 2005, 23, 1159–1169. [Google Scholar] [CrossRef]
  27. Alexandrou, D.; De Moustier, C.; Haralabus, G. Evaluation and verification of bottom acoustic reverberation statistics predicted by the point scattering model. J. Acoust. Soc. Am. 1992, 91, 1403–1413. [Google Scholar] [CrossRef]
  28. Hefner, B.T. Characterization of seafloor roughness to support modeling of midfrequency reverberation. IEEE J. Ocean. Eng. 2017, 42, 1110–1124. [Google Scholar] [CrossRef]
  29. Cervenka, P.; De Moustier, C. Sidescan sonar image processing techniques. IEEE J. Ocean. Eng. 1993, 18, 108–122. [Google Scholar] [CrossRef]
  30. Hellequin, L.; Boucher, J.-M.; Lurton, X. Processing of high-frequency multibeam echo sounder data for seafloor characterization. IEEE J. Ocean. Eng. 2003, 28, 78–89. [Google Scholar] [CrossRef]
  31. Nguyen, H.-G.; Fablet, R.; Ehrhold, A.; Boucher, J.-M. Keypoint-based analysis of sonar images: Application to seabed recognition. IEEE Trans. Geosci. Remote Sens. 2012, 50, 1171–1184. [Google Scholar] [CrossRef]
  32. Zayed, M.M.; Shokair, M. Modeling and simulation of optical wireless communication channels in IoUT considering water types turbulence and transmitter selection. Sci. Rep. 2025, 15, 28381. [Google Scholar] [CrossRef]
  33. Zayed, M.M.; Shokair, M. Performance analysis and optimization of modulation techniques for underwater optical wireless communication in varied aquatic environments. Sci. Rep. 2025, 15, 32570. [Google Scholar] [CrossRef] [PubMed]
  34. Cheng, X. An edge detection new algorithm based on Laplacian Operator. In Proceedings of the 2011 IEEE 3rd International Conference on Communication Software and Networks, Xi’an, China, 27–29 May 2011; pp. 202–206. [Google Scholar]
  35. Ingle, M.A.; Talmale, G.R. Respiratory mask selection and leakage detection system based on canny edge detection operator. Procedia Comput. Sci. 2016, 78, 323–329. [Google Scholar] [CrossRef]
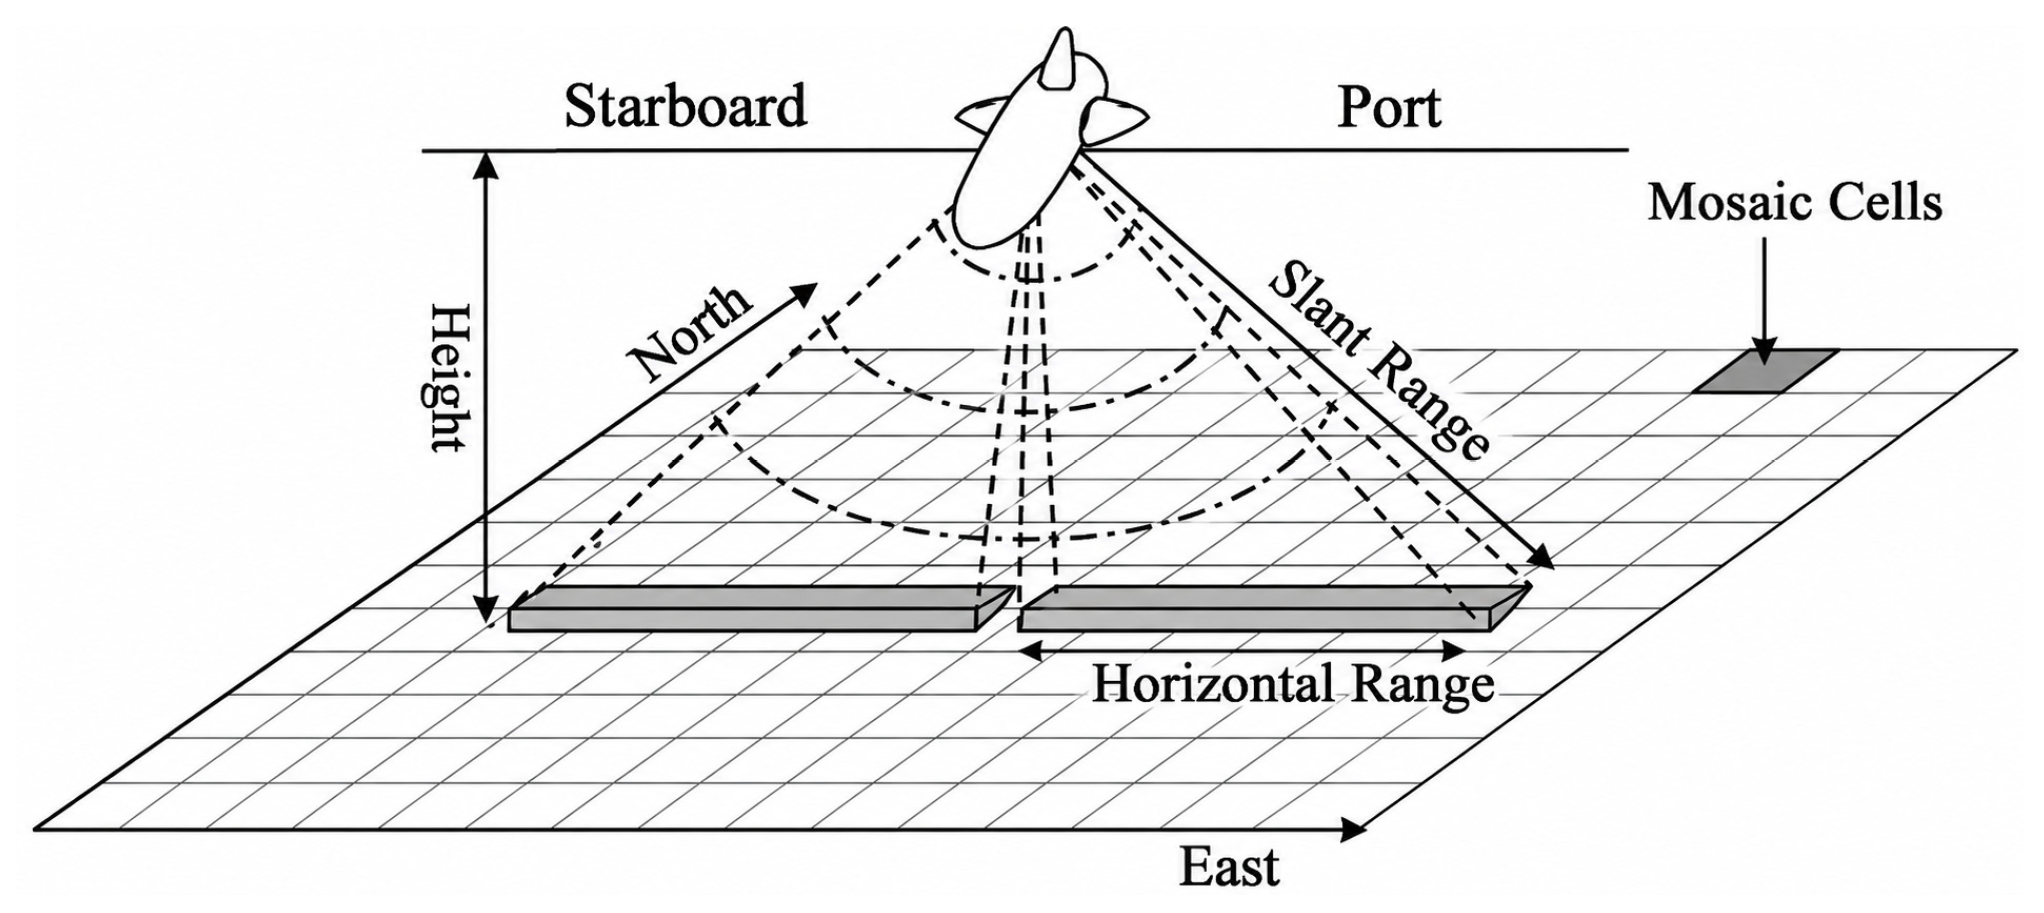
Figure 1. Schematic illustrating the working principle of side-scan sonar imaging.
Jmse 14 01002 g001
Figure 2. Schematic illustrating the composition of a side-scan sonar image.
Jmse 14 01002 g002
Figure 3. Eight domain points of pixel ( x i , y j ) .
Jmse 14 01002 g003
Figure 4. Eight angles corresponding to domain points in Figure 3 for defining the phase angle direction.
Jmse 14 01002 g004
Figure 5. Experimental area and local sonar image region.
Jmse 14 01002 g005
Figure 6. Results of sea bottom line tracking (K = 0.5) based on the threshold method: (a) raw sonar image; (b) enlarged lower left corner of (a); (c) after applying filtering and smoothing to the generated seabed line.
Jmse 14 01002 g006
Figure 7. Results of sea bottom line tracking based on different edge detection methods: (a) log-operator-based edge detection; (b) proposed WTMM-based method.
Jmse 14 01002 g007
Figure 8. Comparison of actual water depths and those detected based on different sea bottom line tracking methods applied to the raw sonar image.
Jmse 14 01002 g008
Figure 9. Impact of adding speckle noise: (a) raw sonar image; (b) sonar image after noise addition.
Jmse 14 01002 g009
Figure 10. Results of sea bottom line tracking in the image with added speckle noise: (a) threshold method (K = 0.5); (b) threshold method (K = 0.76); (c) log operator edge detection; (d) proposed WTMM edge detection.
Jmse 14 01002 g010
Figure 11. Comparison of actual water depths and those detected based on different sea bottom line tracking methods applied to the noisy sonar image.
Jmse 14 01002 g011
Figure 12. Sensitivity analysis of the scale parameter S regarding the RMS tracking error under noisy sonar image conditions.
Jmse 14 01002 g012
Table 1. Sea bottom line tracking errors based on each method applied to the raw sonar image.
Tracking MethodMaximum Error (m)RMS Error (m)Runtime (s)
Threshold method (K = 0.5)1.310.420.3910
Log operator edge detection1.490.300.3946
WTMM edge detection0.410.210.4101
Note: Bold values indicate the best performance in each column.
Table 2. Sea bottom line tracking errors based on each method applied to the noisy sonar image.
Tracking MethodMaximum Error (m)RMS (Mean ± Std) (m)Runtime (s)
Threshold method (K = 0.5)6.552.19 ± 0.13180.3859
Threshold method (K = 0.76)2.240.63 ± 0.11470.4135
Log operator edge detection3.770.81 ± 0.29810.4188
WTMM edge detection0.400.18 ± 0.03270.4369
Note: Bold values indicate the best performance in each column.
Disclaimer/Publisher’s Note: The statements, opinions and data contained in all publications are solely those of the individual author(s) and contributor(s) and not of MDPI and/or the editor(s). MDPI and/or the editor(s) disclaim responsibility for any injury to people or property resulting from any ideas, methods, instructions or products referred to in the content.