Article

Semi-Analytical Analysis of Depletion-Induced Geomechanical Behaviors in Deepwater Shallow Gas-Bearing Sediments
1
CNOOC Research Institute Ltd., Beijing 100028, China
2
College of Petroleum Engineering, China University of Petroleum (Beijing), Beijing 102249, China
*
Author to whom correspondence should be addressed.
J. Mar. Sci. Eng. 2026, 14(10), 937; https://doi.org/10.3390/jmse14100937
Submission received: 1 April 2026 / Revised: 28 April 2026 / Accepted: 12 May 2026 / Published: 18 May 2026
(This article belongs to the Section Geological Oceanography)

Abstract

Deepwater shallow gas sediments and the weakly consolidated overburden are sensitive to depletion-induced effective stress redistribution. Since deepwater shallow gas has only recently begun to be treated as a commercially available natural gas resource, it lacks models to quantify the coupled flow and geomechanical behaviors in such environments. In this study, we propose a semi-analytical model for a shallow gas layer and its overburden sediments, where pore pressure evolution is described by vertical transient diffusion and the stress response is represented by an OCR-dependent (overconsolidation ratio-dependent) in situ stress field with depletion-induced effective stress increments. Pre-yield compressibility is characterized by a stress-dependent nonlinear elastic law, and post-yield deformation is approximated by a Mohr–Coulomb-based yield-controlled plastic correction for engineering purposes. The formulation is used in the base case and during a parametric sensitivity analysis. In the base case, the final settlement is 0.597 m, of which 45.3% is elastic and 54.7% is plastic. The sediments begin to yield after approximately 115 d of production, and the final yielded-thickness fraction reaches 0.268. The sensitivity analysis shows that friction angle, maximum drawdown, gas-layer thickness, and OCR magnitudes predominantly affect the final settlement and yielded-thickness response, while gas-layer permeability has an insignificant effect. Furthermore, the comparison reveals that the depletion timescale governs the stress evolution rate, while depletion pressure drawdown magnitude dictates deviatoric stress evolution and long-term settlement. Considering the engineering condition for the development of typical deepwater shallow sediments, the feasible production parameters should be in the low-to-moderate drawdown and slow depletion range. A practical operating window is approximately 3.6~4.0 MPa maximum drawdown with a depletion timescale of about 340~400 d. This study can provide quantitative insights into the potential commercial production of gas layers in deepwater shallow sediments.

1. Introduction

Natural gas resources are usually developed in deeply buried onshore and offshore gas reservoirs, while natural gas located in the shallow sediments in deepwater locations is often regarded as hazardous, posing a significant obstacle for deepwater drilling operations. However, as the demand for natural gas continues to increase at a global scale, deepwater shallow gas has become a potential commercial gas production resource in areas such as the South China Sea [1,2]. Deepwater shallow gas-bearing layers are often found in weakly consolidated sediments with very low effective stresses, where depletion not only decreases pore pressure in the producing interval but also alters the effective stress evolution path, stiffness, and potential yielding behavior of both the gas-bearing layer and the overburden sediments [3]. In such environments, the geomechanical response is often governed by the joint influence of stress diffusion, nonlinear compressibility, and strength alteration. Reservoir-scale phenomena such as salt precipitation and phase equilibrium changes can also affect gas well productivity and introduce additional engineering challenges in mature gas field development [4]. Thus, linear elastic methods (which are widely applied to hard, brittle rocks in conventional reservoirs) become less applicable and efficient, while physically reliable methods become increasingly relevant to the optimization of engineering parameters during shallow gas development in such environments [5,6,7,8,9,10,11]. Historical case histories outside the South China Sea have demonstrated that the depletion of stress-sensitive hydrocarbon reservoirs may produce significant compaction and subsidence, with direct engineering consequences such as reduced platform air gap and considerable subsidence [12,13].
The basic derivations for poromechanics problems provide the theoretical foundation for depletion-induced deformation and coupled flow and geomechanics modeling [14]. Biot established the widely used consolidation and porous elasticity theory [5,6], then Rice and Cleary clarified basic stress evolution solutions in fully saturated porous media [7]. Meanwhile, Geertsma indicated that reservoir compaction and surface subsidence can be quantified based on simplified analytical equations that are highly valuable for engineering interpretation [15]. The following studies provide further evidence that field subsidence and compaction responses have delaying effects, nonlinear constitutive behavior, and strong dependence on pressure drainage and depletion history [9,10,16]. These developments suggest that a physically representative model can be efficient and useful if it preserves the dominant stress evolution and deformation mechanisms [17]. In addition, the development of soil mechanical methods shows that weak sediments do not generally have a constant modulus. Nonlinear stress-dependent stiffness has been recognized as a suitable improvement over linear elasticity in geomaterials [18,19]. For marine and hydrate-bearing sediments, the need to consider stress sensitivity is even more relevant because stiffness, strength, and deformation patterns vary significantly with effective stress, soil mechanical properties, hydrate saturation, sediment components, and drainage condition [20,21,22,23,24,25,26,27]. Thus, adopting a stress-dependent modulus and elastoplastic correction is a practical calculation strategy for soft shallow sediments bearing natural gas resources.
Both analytical and semi-analytical methods have proved very useful in marine geotechnics and porous seabed response research. Analytical solutions for porous seabeds under wave and current loading have been developed to clarify the roles of permeability, drainage, and boundary loading [28,29], and recent marine engineering studies continue to use such models to interpret key controlling mechanisms and validate sophisticated numerical calculations [30,31,32,33]. These application cases substantiate that compact analytical and semi-analytical models can still be meaningful in engineering scenarios, since they efficiently provide relevant physical insight. Recently, the potential of commercial gas production in deepwater shallow sediments in the Qiongdongnan Basin in the South China Sea has made the development and derivation of such models even more important. Recent work has emphasized the engineering complexity associated with shallow unconsolidated sand, shallow gas distribution, and related near-seabed geohazards [1,34,35,36]. Previous modeling studies of pressure evolution-induced system responses in gas hydrate and shallow marine reservoirs in the South China Sea have shown that pressure disturbance and deformation can extend beyond the producing interval and affect the surrounding sediments, especially when the mechanical properties are weak and stress-dependent [21,37].
Previous research has emphasized the importance of considering stress evolution, deformation, and subsidence of weakly consolidated sediments when depletion and production occur. In this study, the term weakly consolidated is used to describe shallow sediments with a low degree of consolidation, weak cementation, and relatively low stiffness and strength. Since deepwater shallow gas resources were not treated as commercially available until recently, the modeling of depletion-induced coupled flow and geomechanical behaviors in such sediments has not yet been widely studied. Therefore, it is meaningful to develop a model that can efficiently calculate such behaviors and to provide engineering parameter optimizations in the field. In this work, we describe a semi-analytical model that considers stress-dependent tangent moduli in sediments and plasticity through Mohr–Coulomb yield correction. Then, we perform a base case analysis and several engineering-oriented sensitivity analyses. An operating window optimization is also provided. Thus, this work aims to provide a rapid, physically reliable, and engineering-meaningful model for efficient and rapid evaluation of depletion-induced deformation in deepwater shallow gas-bearing sediments.

2. Materials and Methods

2.1. Model Derivation

In the derivations, the following assumptions are adopted: (1) The problem is vertically one-dimensional, so lateral stress redistribution is represented by an effective stress-transfer coefficient. (2) Small strain and deformation conditions are assumed. (3) The fluid flow has a single phase and is governed by Darcy’s law with equivalent mass storage. (4) The lower boundary of the gas layer is subject to a prescribed depletion evolution, while the seabed is treated as a no-flow boundary. (5) The elastic mechanical response follows a stress-dependent nonlinear elastic law. (6) The post-yield deformation is represented by a Mohr–Coulomb-based plastic correction. (7) Monotonic depletion in the gas-bearing layer and the overburden layer is considered, so the dominant stress path is oriented toward increasing compressive effective stress. These assumptions are used to maintain the analytical transparency of the model while preserving the pressure evolution, stress alteration, settlement accumulation, and plastic-zone growth. It should be emphasized that the Mohr–Coulomb method is not intended to serve as a complete constitutive description of cohesive marine sediment. Instead, it is introduced as a transparent yield criterion to indicate the onset and progressive growth tendency of plastic deformation within a semi-analytical engineering approach.
The one-dimensional vertical formulation is used because the investigated system is conceptualized as a laterally extensive shallow gas layer overlain by vertically stacked weakly consolidated sediments, and the principal engineering responses of interest are pressure transmission across the gas-layer/overburden sequence, seabed settlement, and yielding within the vertical column. Accordingly, the model is intended for settings in which the dominant hydraulic and deformation gradients are vertical, while lateral effects are represented in an averaged sense through the effective stress transfer coefficient. The small-strain assumption is appropriate because the computed base case settlement is much smaller than the total modeled thickness, so the dominant compaction trends can be captured without geometric nonlinearity. The monotonic depletion assumption is adopted because the imposed boundary condition is a gradual production drawdown, and the present workflow is intended for depletion-dominated production processes in which the effective stress path primarily progresses toward increasing compression. These assumptions are not expected to be sufficient for strongly faulted or laterally heterogeneous domains, for large-strain deformation, or for cyclic loading and pressure recovery scenarios; such cases should be assessed using higher-dimensional and more advanced coupled models.
The system is treated as a one-dimensional vertical column extending from the seabed to the base of a shallow gas layer. The total thickness is
H = H over + H gas
where H over is the overburden thickness and H gas is the gas-layer thickness. Unlike typical reservoir compaction models, this formulation allows both the gas-bearing interval and the overburden sediments to experience pressure disturbance and deformation. The hydraulic and geomechanical properties are piecewise constant within each layer but differ between the overburden and the gas layer.
Let y denote depth measured downward from the seabed, with y = 0 at the seabed and y = H at the base of the gas layer. Let Δ p y , t denote the depletion magnitude, which is the pore pressure drop relative to the initial state.
The local continuity equation for slightly compressible diffusion in one dimension is written as
ζ t + v y = 0
where ζ represents the increase in fluid content per unit bulk volume and v is the Darcy flow flux.
Using an equivalent storage relation,
ζ = S s y Δ p
and Darcy’s law,
v = k y μ Δ p y
the formula becomes
S s y Δ p t = y k y μ Δ p y
Here, k y is the intrinsic permeability, μ is the dynamic viscosity of the pore fluid, and S s y is equivalent specific storage. In the present formulation,
k y = k over , 0 y < H over , k gas , H over y H ,
and
S s y = S over , 0 y < H over , S gas , H over y H .
The initial condition is
Δ p y , 0 = 0
At the seabed, a no-flow boundary is imposed:
Δ p y y = 0 = 0 .
Meanwhile, at the base of the gas layer, a prescribed depletion boundary is used:
Δ p H , t = Δ p b t .
To characterize gradual production drawdown, the boundary history is written as
Δ p b t = Δ p m a x 1 exp t τ dep
where Δ p m a x is the asymptotic maximum drawdown and τ dep is the depletion timescale.
The initial vertical effective stress is expressed as follows:
σ v 0 y = σ v , offset + 0 y γ s d s ,
where γ y is the effective unit weight and σ v , offset is a small increment to avoid unrealistically small near-seabed stress. With piecewise constant γ ,
γ y = γ over , 0 y < H over , γ gas , H over y H .
The initial horizontal effective stress is related to the initial vertical effective stress through an OCR-dependent at-rest coefficient:
σ h 0 = K 0 , OC σ v 0
with
K 0 , OC = 1 sin ϕ OCR sin ϕ
where ϕ is the friction angle and OCR is the overconsolidation ratio. This derivation is used because OCR affects not only the settlement magnitude but also the initial distance from failure, which improves the accuracy of the stress-path analysis. In the present screening-oriented formulation, OCR is prescribed as a representative initial state parameter rather than being directly determined from site-specific oedometer testing. Accordingly, the initial overconsolidation pressure is represented implicitly through OCR.
For a depletion problem in which the total overburden stress remains approximately unchanged during the gas development, the increase in effective stress is related to the pore pressure drop through the Biot coefficient. The vertical effective stress increment is written as follows:
Δ σ v = α y Δ p
where
α y = α over , 0 y < H over , α gas , H over y H .
The horizontal effective stress increment is approximated as follows:
Δ σ h = ξ y , t α y Δ p
where ξ is an effective lateral stress-transfer coefficient. Instead of keeping ξ constant, the present formulation allows it to vary mildly with stress through an effective Poisson ratio:
ξ = ν eff 1 ν eff
ν eff = ν 0 y + a ν y l n m a x p , p ref p ref
In this expression, ν 0 is the reference Poisson ratio; a ν controls the mild stress sensitivity; and p ref is a stress reference.
The total effective stresses are therefore
σ v = σ v 0 + Δ σ v
σ h = σ h 0 + Δ σ h
The mean effective stress and deviatoric stress are then defined as follows:
p = σ v + 2 σ h 3
q = σ v σ h
These variables are used to calculate the stress path and evaluate the proximity to the Mohr–Coulomb yielding criterion.
A constant modulus assumption is not suitable for the weakly consolidated marine sediments considered in this study. Therefore, the pre-yield elastic response is described by a stress-dependent tangent constrained modulus:
M t y , t = M ref y m a x p , p ref p ref m y
where M ref is the reference for the constrained modulus and m is the modulus exponent. It quantifies the stress-dependent soil stiffness.
The incremental elastic vertical strain is written as follows:
d ε z e = d p M t p
Substituting the power-law modulus leads to
d ε z e = d p M ref p p ref m = p ref m M ref p m d p
Integrating from p 0 to p yields, for m 1 ,
ε z e p ε z e p 0 = p ref m M ref 1 m p 1 m p 0 1 m
To calculate plasticity after yielding, a Mohr–Coulomb yield function is adopted as a local failure indicator:
F MC = q M ϕ p d
where
M ϕ = 6 s i n ϕ 3 s i n ϕ
and
d = 6 c c o s ϕ 3 s i n ϕ
Here, c represents cohesion and ϕ is the friction angle. When F MC 0 , the response remains in the nonlinear elastic regime. When F MC > 0 , yielding is triggered and irreversible plastic deformation is initiated and accumulated.
To characterize the geomechanical behaviors after entering the plastic zone, the present model uses a yield-controlled plastic correction based on the peak historical yield exceedance:
F pk y , t = m a x 0 τ t F MC y , τ
The accumulated plastic vertical strain is then written as follows:
ε z p = β p F pk p ref n p
where x = m a x x , 0 denotes the Macaulay bracket; β p is the plastic strain coefficient; and n p is the plastic nonlinearity exponent. This expression shows that plastic deformation is activated after the yield function becomes positive, and the plastic accumulation monotonically increases due to depletion.
The total vertical strain is therefore
ε z = ε z e + ε z p
Because both the gas layer and the overburden are considered in the model, the final settlement is obtained by integrating strain over the entire column:
s t = 0 H ε z y , t d y
To improve the meaning of the calculation results, the total settlement is partitioned into elastic and plastic components:
s e t = 0 H ε z e y , t d y
s p t = 0 H ε z p y , t d y
s t = s e t + s p t
This makes it easier to determine whether the induced deformation is elastic or plastic and helps to assess whether the engineering disturbance in sediments causes irreversible damage to the solid structure. This can provide a quantitative understanding of the ways in which shallow gas production harms the mechanical integrity of the shallow sediments.
To quantify how much of the investigated domain has entered the yielded state during depletion, a yielded-thickness fraction is defined as shown below:
η y t = 1 H 0 H I F MC > 0 d y
where I is an indicator function. This delineation of elastic and plastic deformation fractions in shallow and unconsolidated sediments during deepwater gas production provides a quantifiable geomechanical metric that can inform well integrity and conductor design. As pore pressure depletion increases effective stresses, the development of a plastic zone of a certain thickness signals the transition from formation-dominated load support to steel-dominated load transfer; when this zone propagates upward to the level of the conductor or wellhead, it elevates the risk of casing overloading, fatigue, and progressive settlement. Quantifying this thickness therefore enables the specification of a maximum allowable drawdown that confines yielding to depths where the conductor remains within safe strain limits. The same metric offers a rational basis for optimizing conductor setting depth when the plastic zone is limited and standard designs are sufficient. When there is a thicker zone, the result justifies deeper or more robust structural casing. By translating a complex elastoplastic sediment analysis into tangible engineering parameters such as drawdown limits and conductor penetration requirements, this metric reduces geotechnical uncertainty and supports the safe and cost-effective execution of deepwater field developments.
The one-dimensional assumption should be interpreted in the context of the present study objective, namely, rapid mechanism analysis and operating-parameter screening for a vertically stacked shallow gas/overburden system. For laterally extensive formations away from major faults or strong stratigraphic discontinuities, the first-order pressure and compaction response is expected to be predominantly vertical, which motivates the simplified formulation adopted here. The use of a single effective coefficient cannot resolve local lateral drainage, fault proximity, or complex geomechanical interaction with laterally heterogeneous boundaries. Therefore, the present model is most suitable for regional screening and trend analysis, whereas detailed site-specific design near faults or strong heterogeneity should be further assessed using higher-dimensional numerical models.
From an engineering viewpoint, the present mathematical formulation is not only used to generate theoretical stress and deformation curves, but also to convert depletion-induced responses into operationally meaningful indicators. The pore-pressure diffusion solution determines how rapidly the pressure disturbance propagates upward from the gas-bearing interval into the overburden, which directly affects the amount of time available for safe pressure control. The effective and deviatoric stress expressions define the stress-path migration, and therefore indicate when and where the sediments approach yielding during production. The settlement integral quantifies the cumulative seabed subsidence caused by depletion, while the partition between elastic and plastic settlement distinguishes recoverable compression from irreversible structural damage. In addition, the yielded-thickness fraction provides a practical index for evaluating how far the plastic zone expands toward the upper part of the sediment column, which is directly relevant to engineering-related characteristics such as conductor setting depth, wellhead stability, casing load transfer, and allowable drawdown design. According to this interpretation, the mathematical equations serve as a link between depletion history and engineering decisions, rather than as purely abstract constitutive relations.
Although the formulation is derivation-based, the model is solved numerically and a semi-analytical model is constructed. In the solution strategy, the pressure diffusion equation is discretized in depth using an implicit finite-difference scheme. At each time step, the pressure field Δ p y , t is updated and the effective stress state is then computed locally from the updated depletion. The stress-dependent elastic modulus, Mohr–Coulomb yield function, plastic correction, settlement, and yielded-thickness fraction are updated accordingly.

2.2. Model Validation

To provide independent support for the confined-compression representation adopted for the fine-grained overburden, a constitutive model validation is carried out using a published oedometer dataset of South China Sea deep-sea sediment. Jiang et al. [38] performed basic material and oedometer analyses on deep-sea sediment from the South China Sea, and their results are used to validate our model. Figure 1 compares the present one-dimensional confined-compression formulation and the published oedometer response of South China Sea deep-sea sediment. The comparison is shown in e l o g σ v space and is used as a constitutive validation for the fine-grained overburden idealization. In particular, the model captures the relatively mild compression behavior before the published yield stress, as well as the steeper post-yield compression trend after entering the plastic-dominated regime. The fitted curve follows the experimental data closely over the full investigated stress range, indicating that the adopted constitutive formulation can reasonably describe the one-dimensional compression characteristics of representative South China Sea fine-grained marine sediment.

3. Results

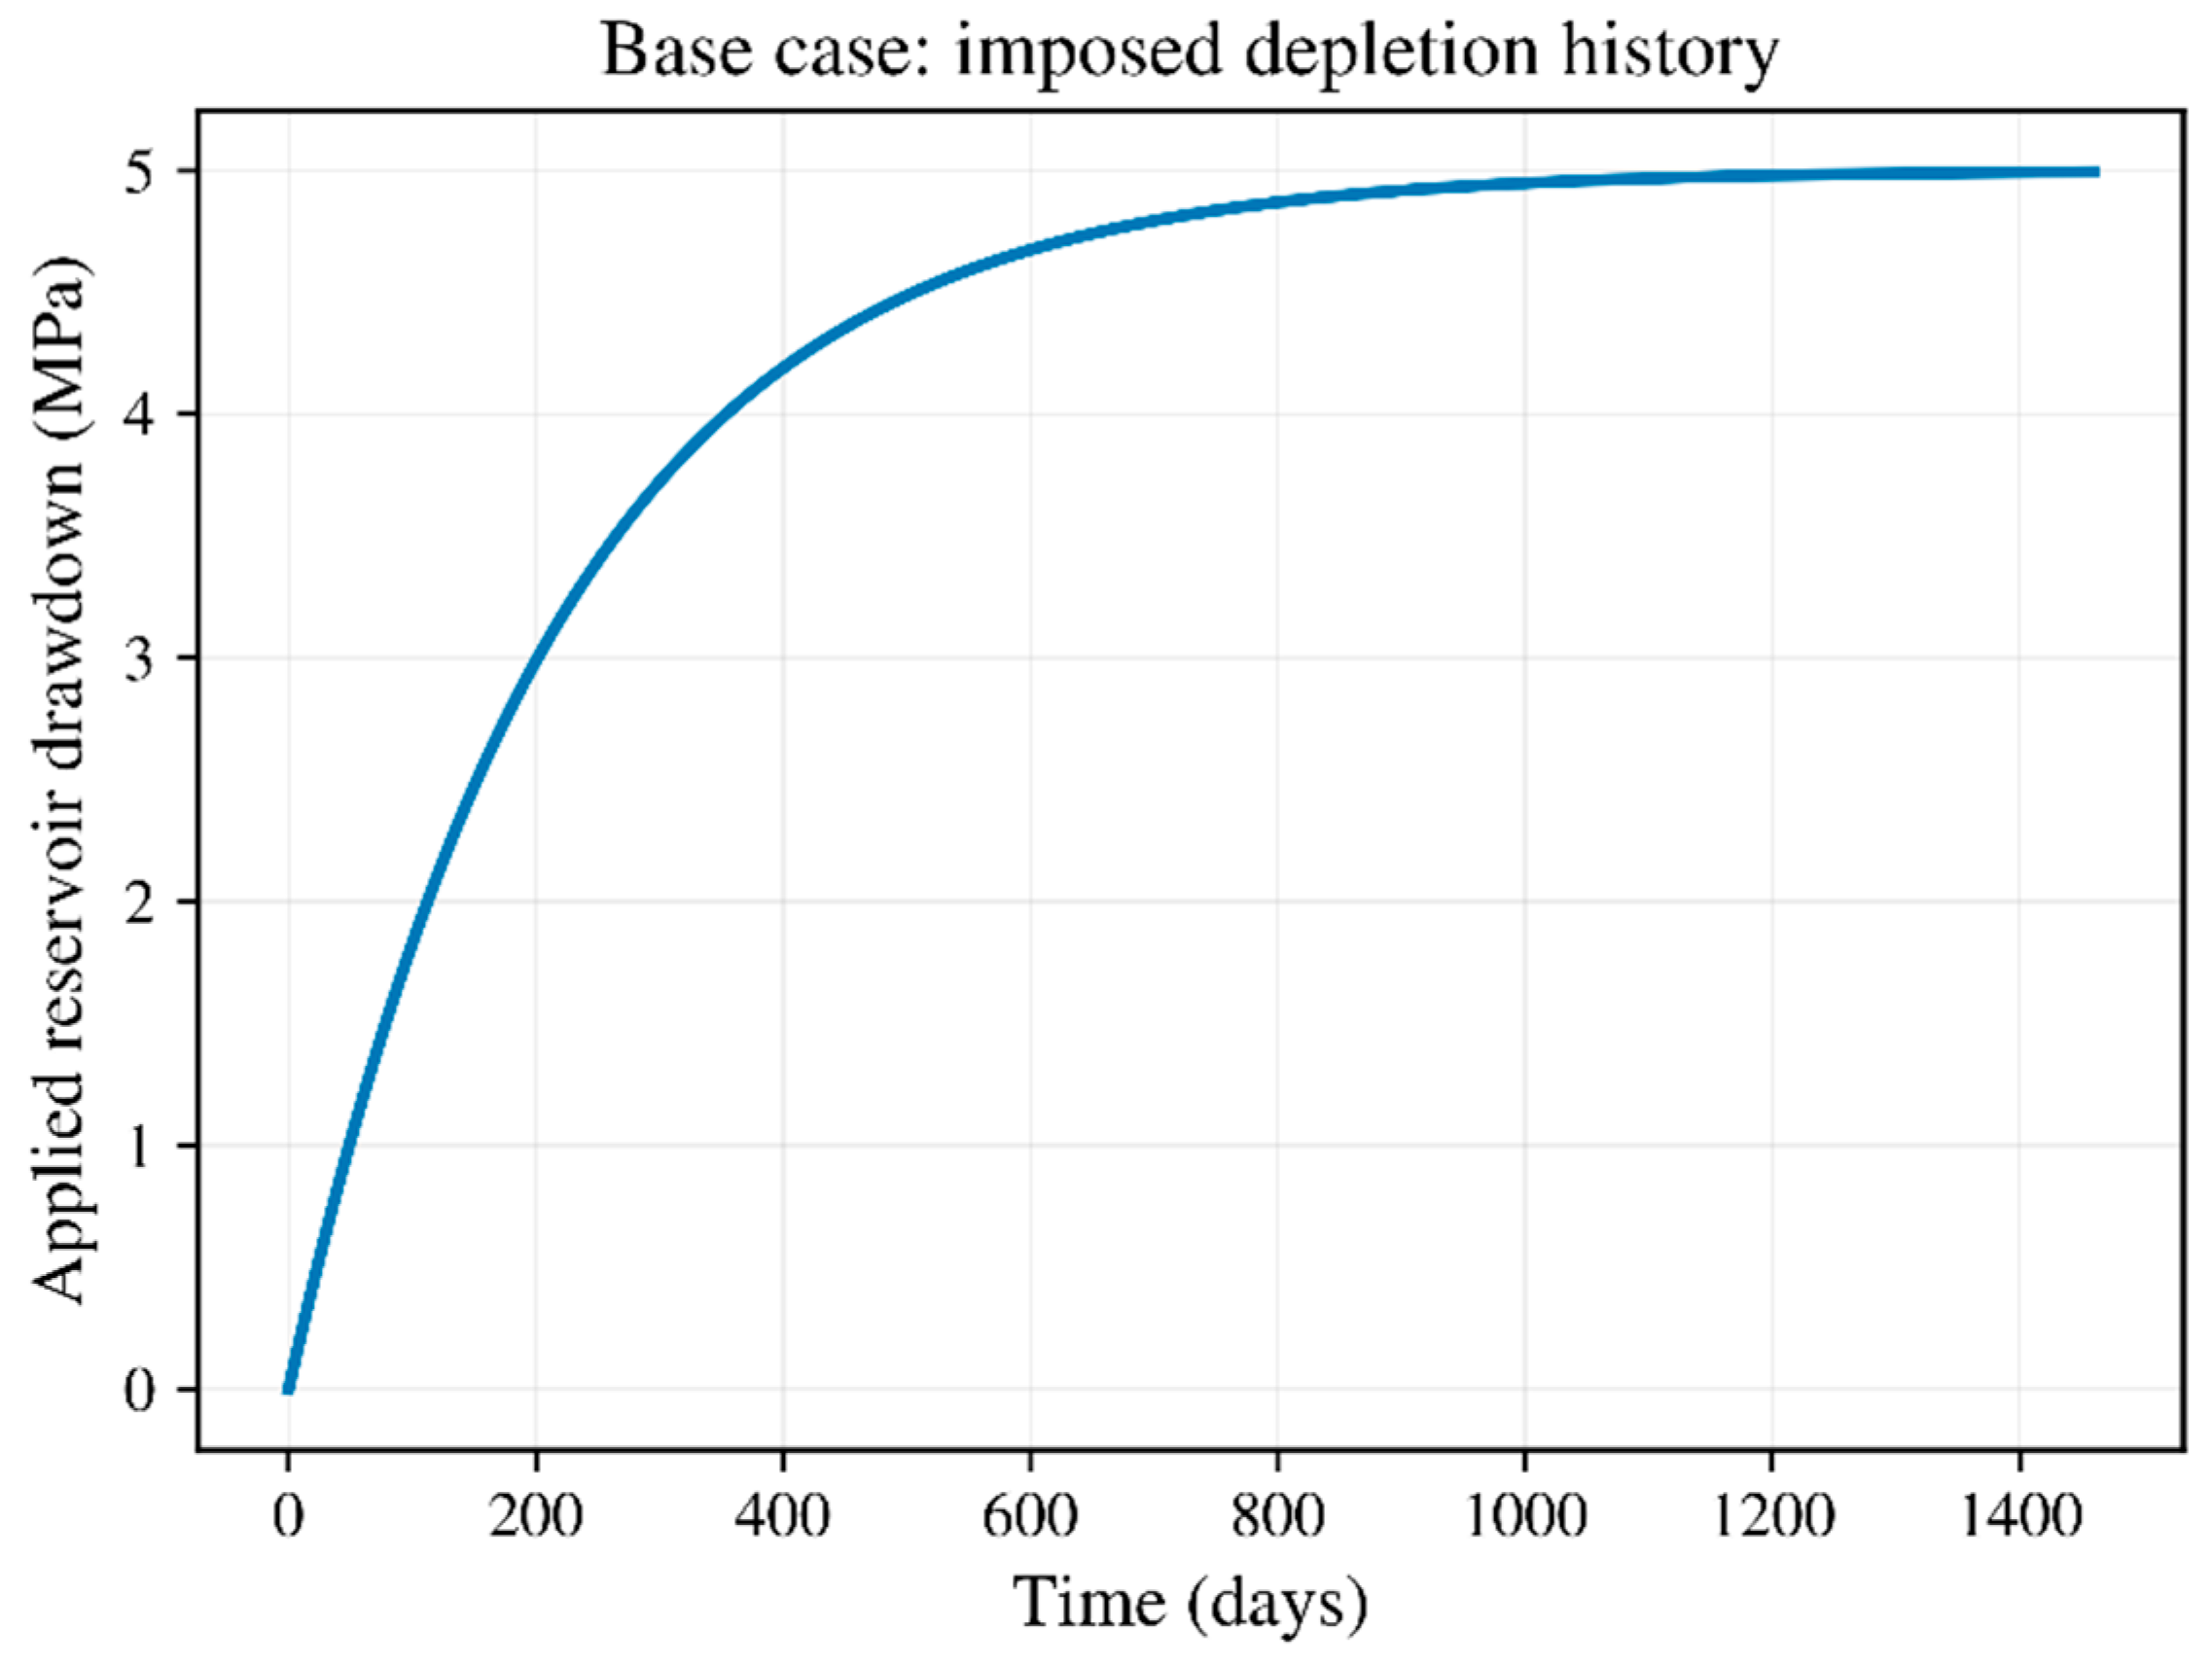
We conducted a base case study based on the typical properties of deepwater shallow sediments. The base case corresponds to a 200 m overburden overlying a 25 m gas-bearing interval, with a maximum imposed drawdown of 5 MPa and a depletion timescale of 220 d.
Table 1 shows the fundamental modeling parameters, including the properties in the gas-bearing and overburden layers.
The physical and mechanical properties of typical deepwater shallow sediments are shown in Table 2. The operating condition of the base case is also documented.
The parameters listed in Table 1 and Table 2 are representative modeling values rather than a complete laboratory identification dataset of a single recovered specimen. In the present two-layer idealization, the gas-bearing interval is treated as a shallow unconsolidated sandy sediment, whereas the overburden is represented as a fine-grained deepwater marine sediment. For the latter, published geotechnical studies on South China Sea deep-water soils have reported grain-size distribution and Atterberg-limit testing based on ASTM procedures. Such sediments commonly exhibit high water content, a high void ratio, and high Atterberg limits, and can be classified as high-plasticity clay or clay-dominated deepwater fine-grained soil. Therefore, the present parameter selection is intended to represent a typical shallow-gas/fine-grained overburden system in the study region, rather than a reproduction of a single fully classified laboratory sample [39].
Figure 2 shows the prescribed depletion history in the gas-bearing layer. It serves as the driving factor that induces a pore pressure decrease and effective stress increase. The resulting elastic and plastic deformation and seabed settlement are also calculated based on this depletion history. This gradually increasing drawdown represents the typical operating conditions used in gas well production in the field.
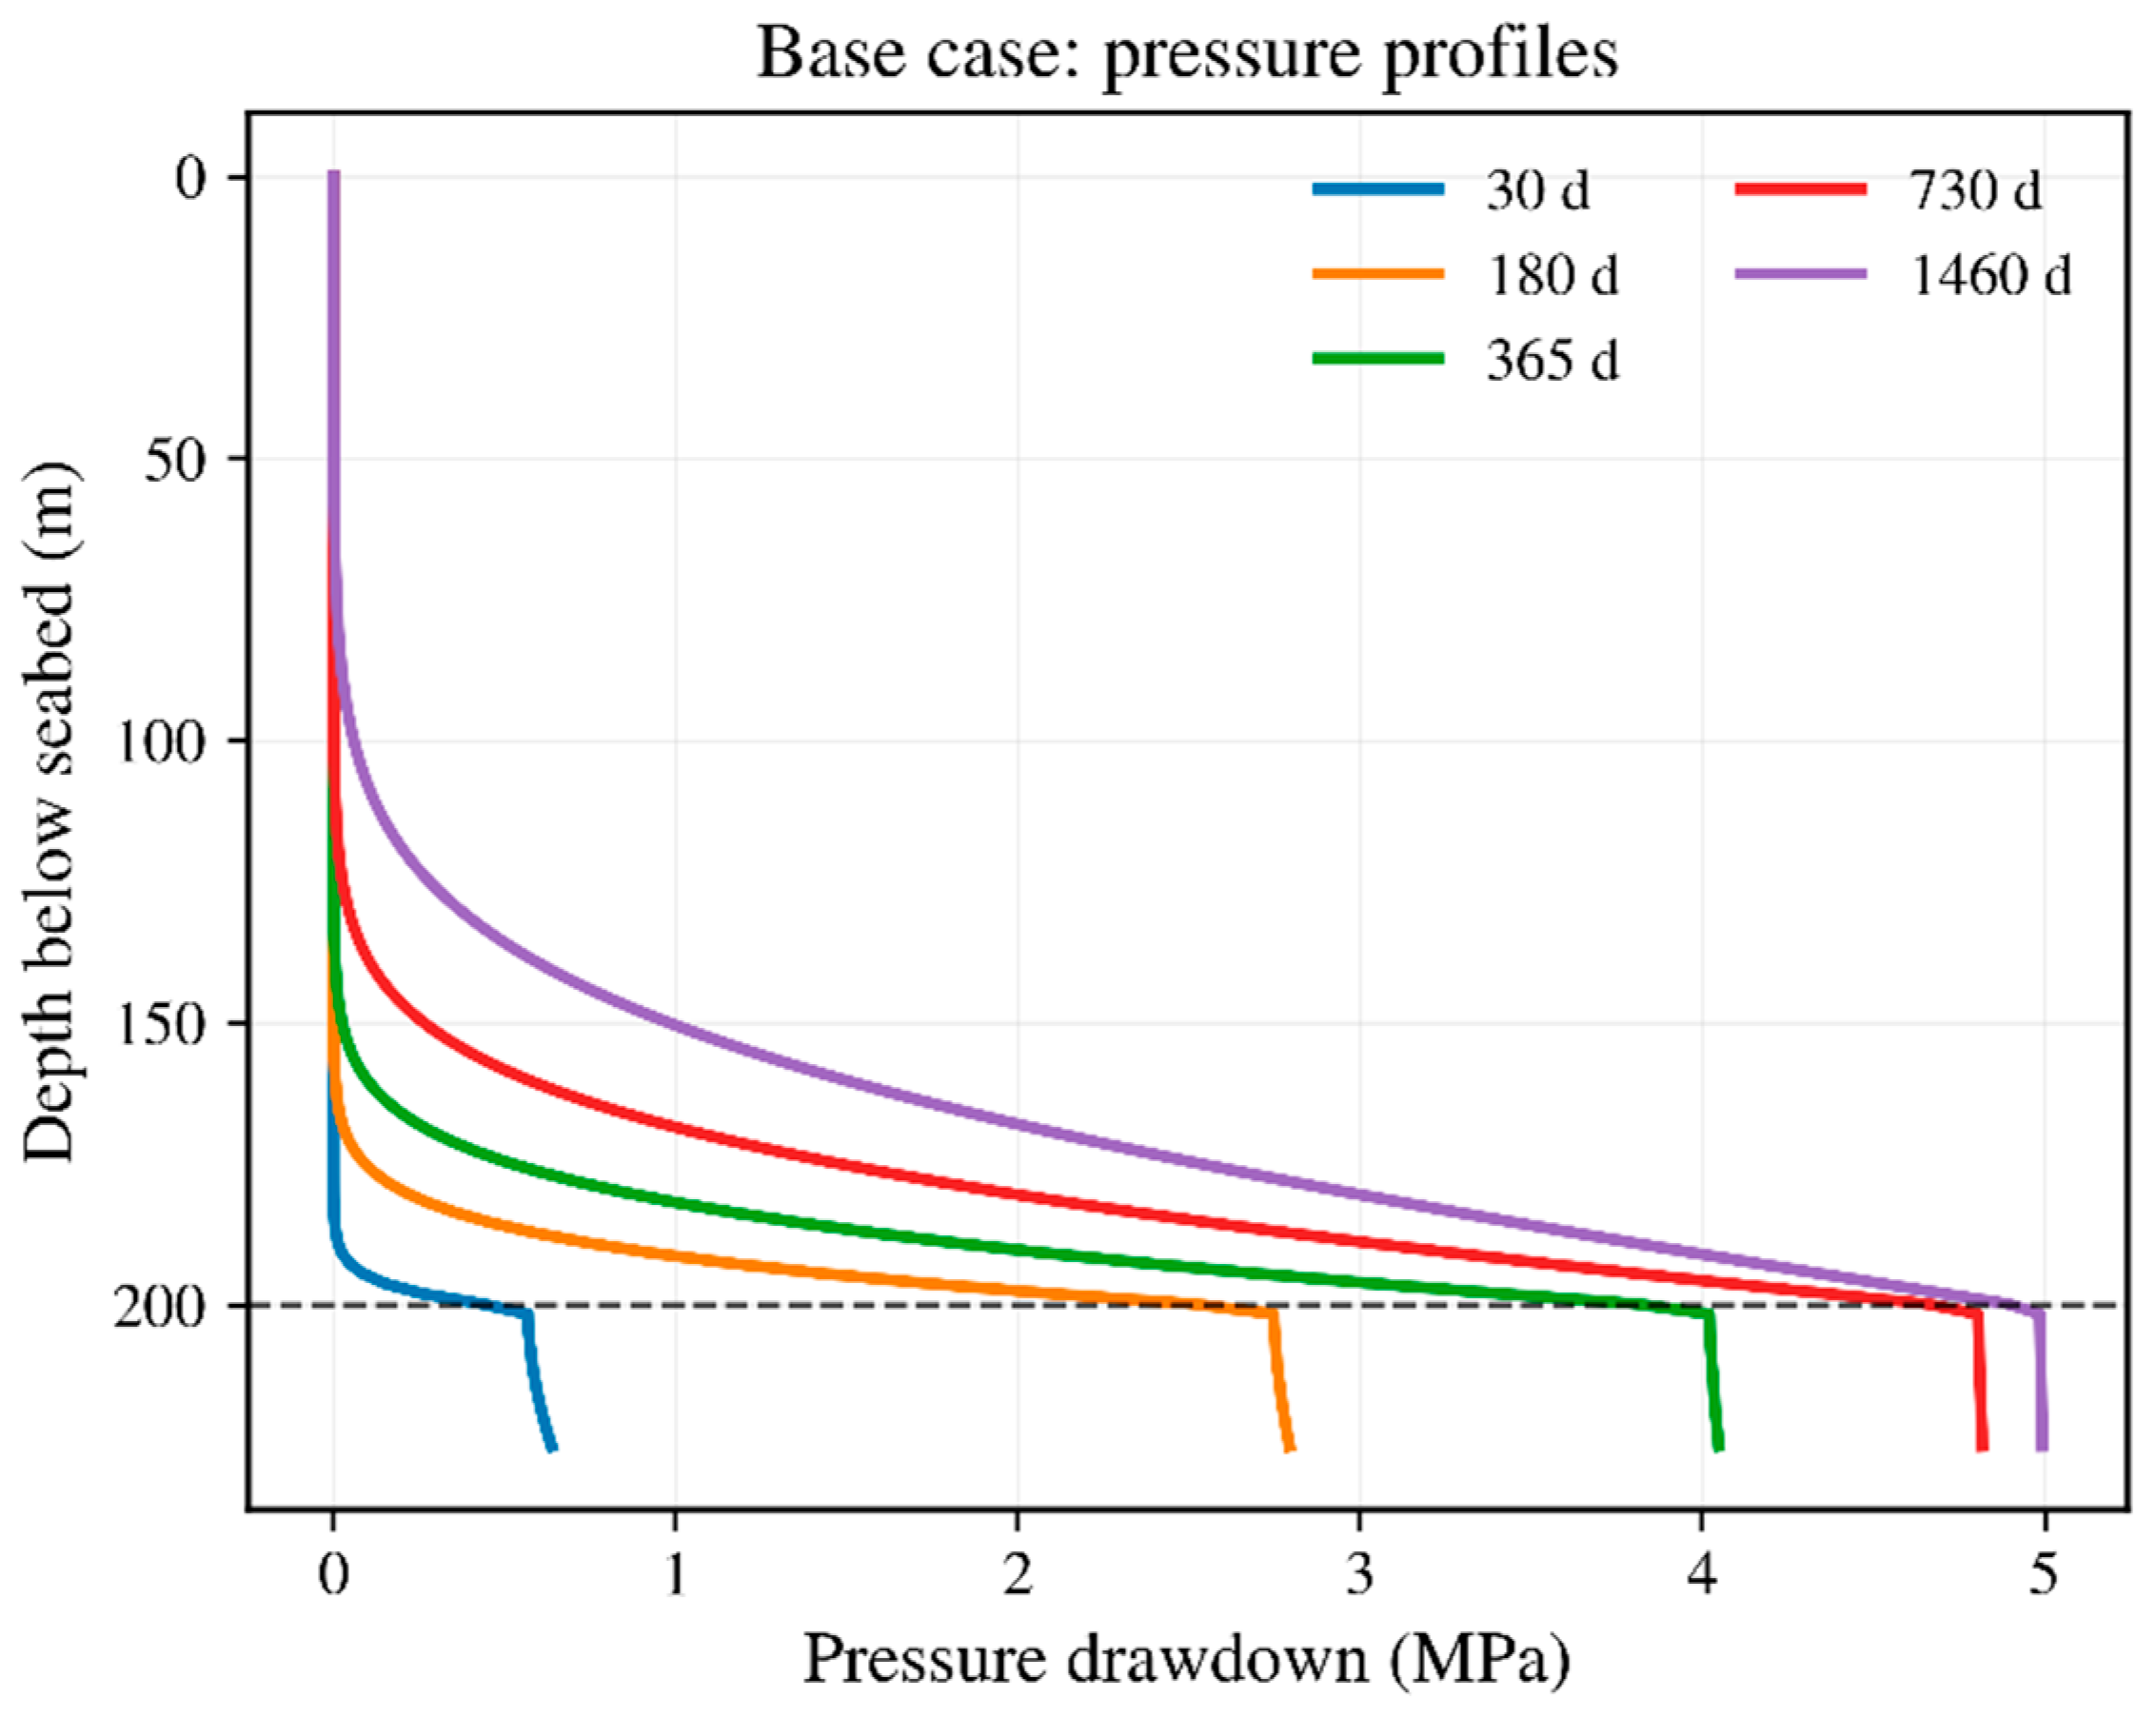
Figure 3 shows the pressure distribution at different production time steps. The strongest drawdown is located in the gas layer and the immediately adjacent lower overburden during the early stage of gas-layer production, while the upper overburden exhibits a more gradual, delayed response due to its lower permeability. This behavior is consistent with the contrast of fluid flow diffusivity between the two layers. The gas layer is relatively transmissive, and its pore pressure depletes more rapidly; the overburden acts as a much tighter medium (serving as the cap layer) that delays upward propagation of the pressure disturbance. Accordingly, the model reproduces a physically reasonable pattern in which pressure gradients are strongest around the layer interface at early times and then smooth out as time increases.
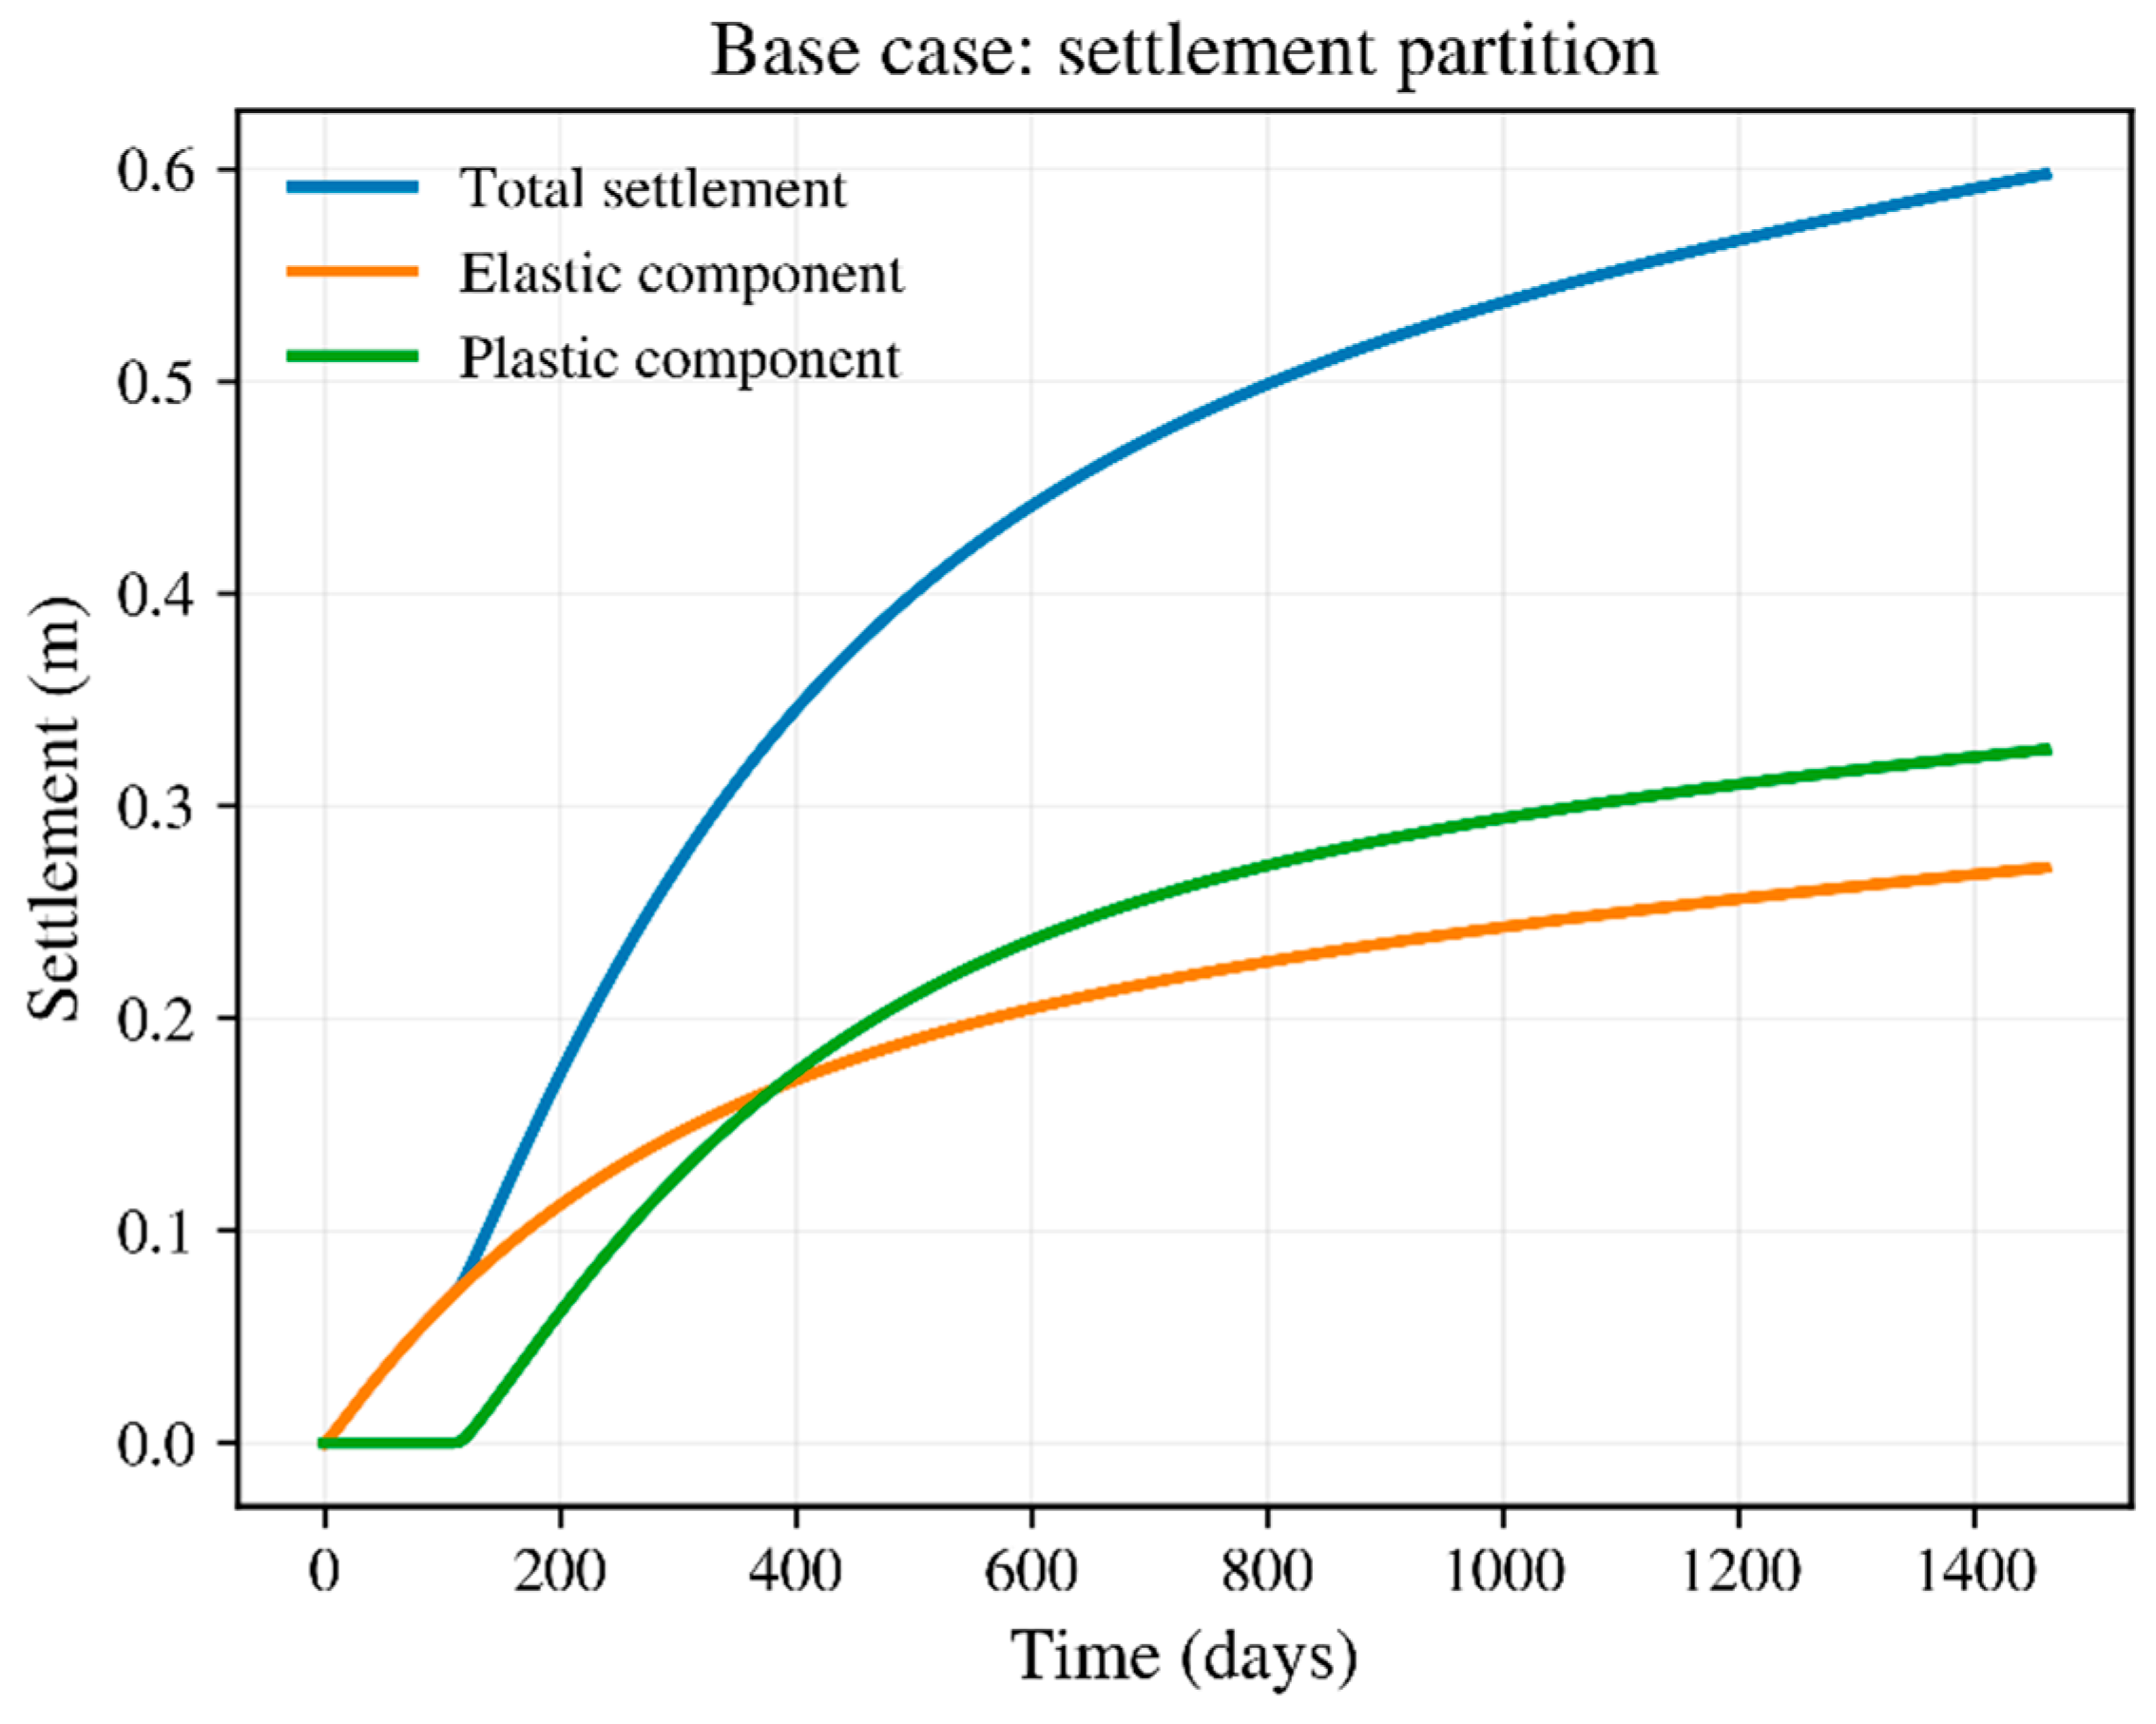
Figure 4 shows the seabed settlement caused by shallow gas production. The final settlement, according to the computational calculations, is 0.597 m. The settlement evolution is initially slow, then accelerates as depletion propagates upward and the lower part of the formation begins to approach the yield condition. The elastic part of the final settlement is 0.271 m (45.3% of the overall settlement), whereas the plastic part is 0.327 m (54.7% of the overall settlement). This partition indicates that the base case is not a typical stiff elastic compaction problem. Instead, plasticity contributes slightly more than half of the final settlement, which provides a quantitative understanding of the nature of the reservoir compaction and seabed subsidence. Based on poromechanical theories, this means that depletion-induced stress change is not uniform with depth. The gas layer experiences both a strong pressure drop and comparatively soft stiffness, making it a primary contributor to early compaction. However, the overburden effect is also non-negligible because the settlement integral extends over the full depth profile and the lower overburden progressively joins the deformation process as the drawdown front advances.
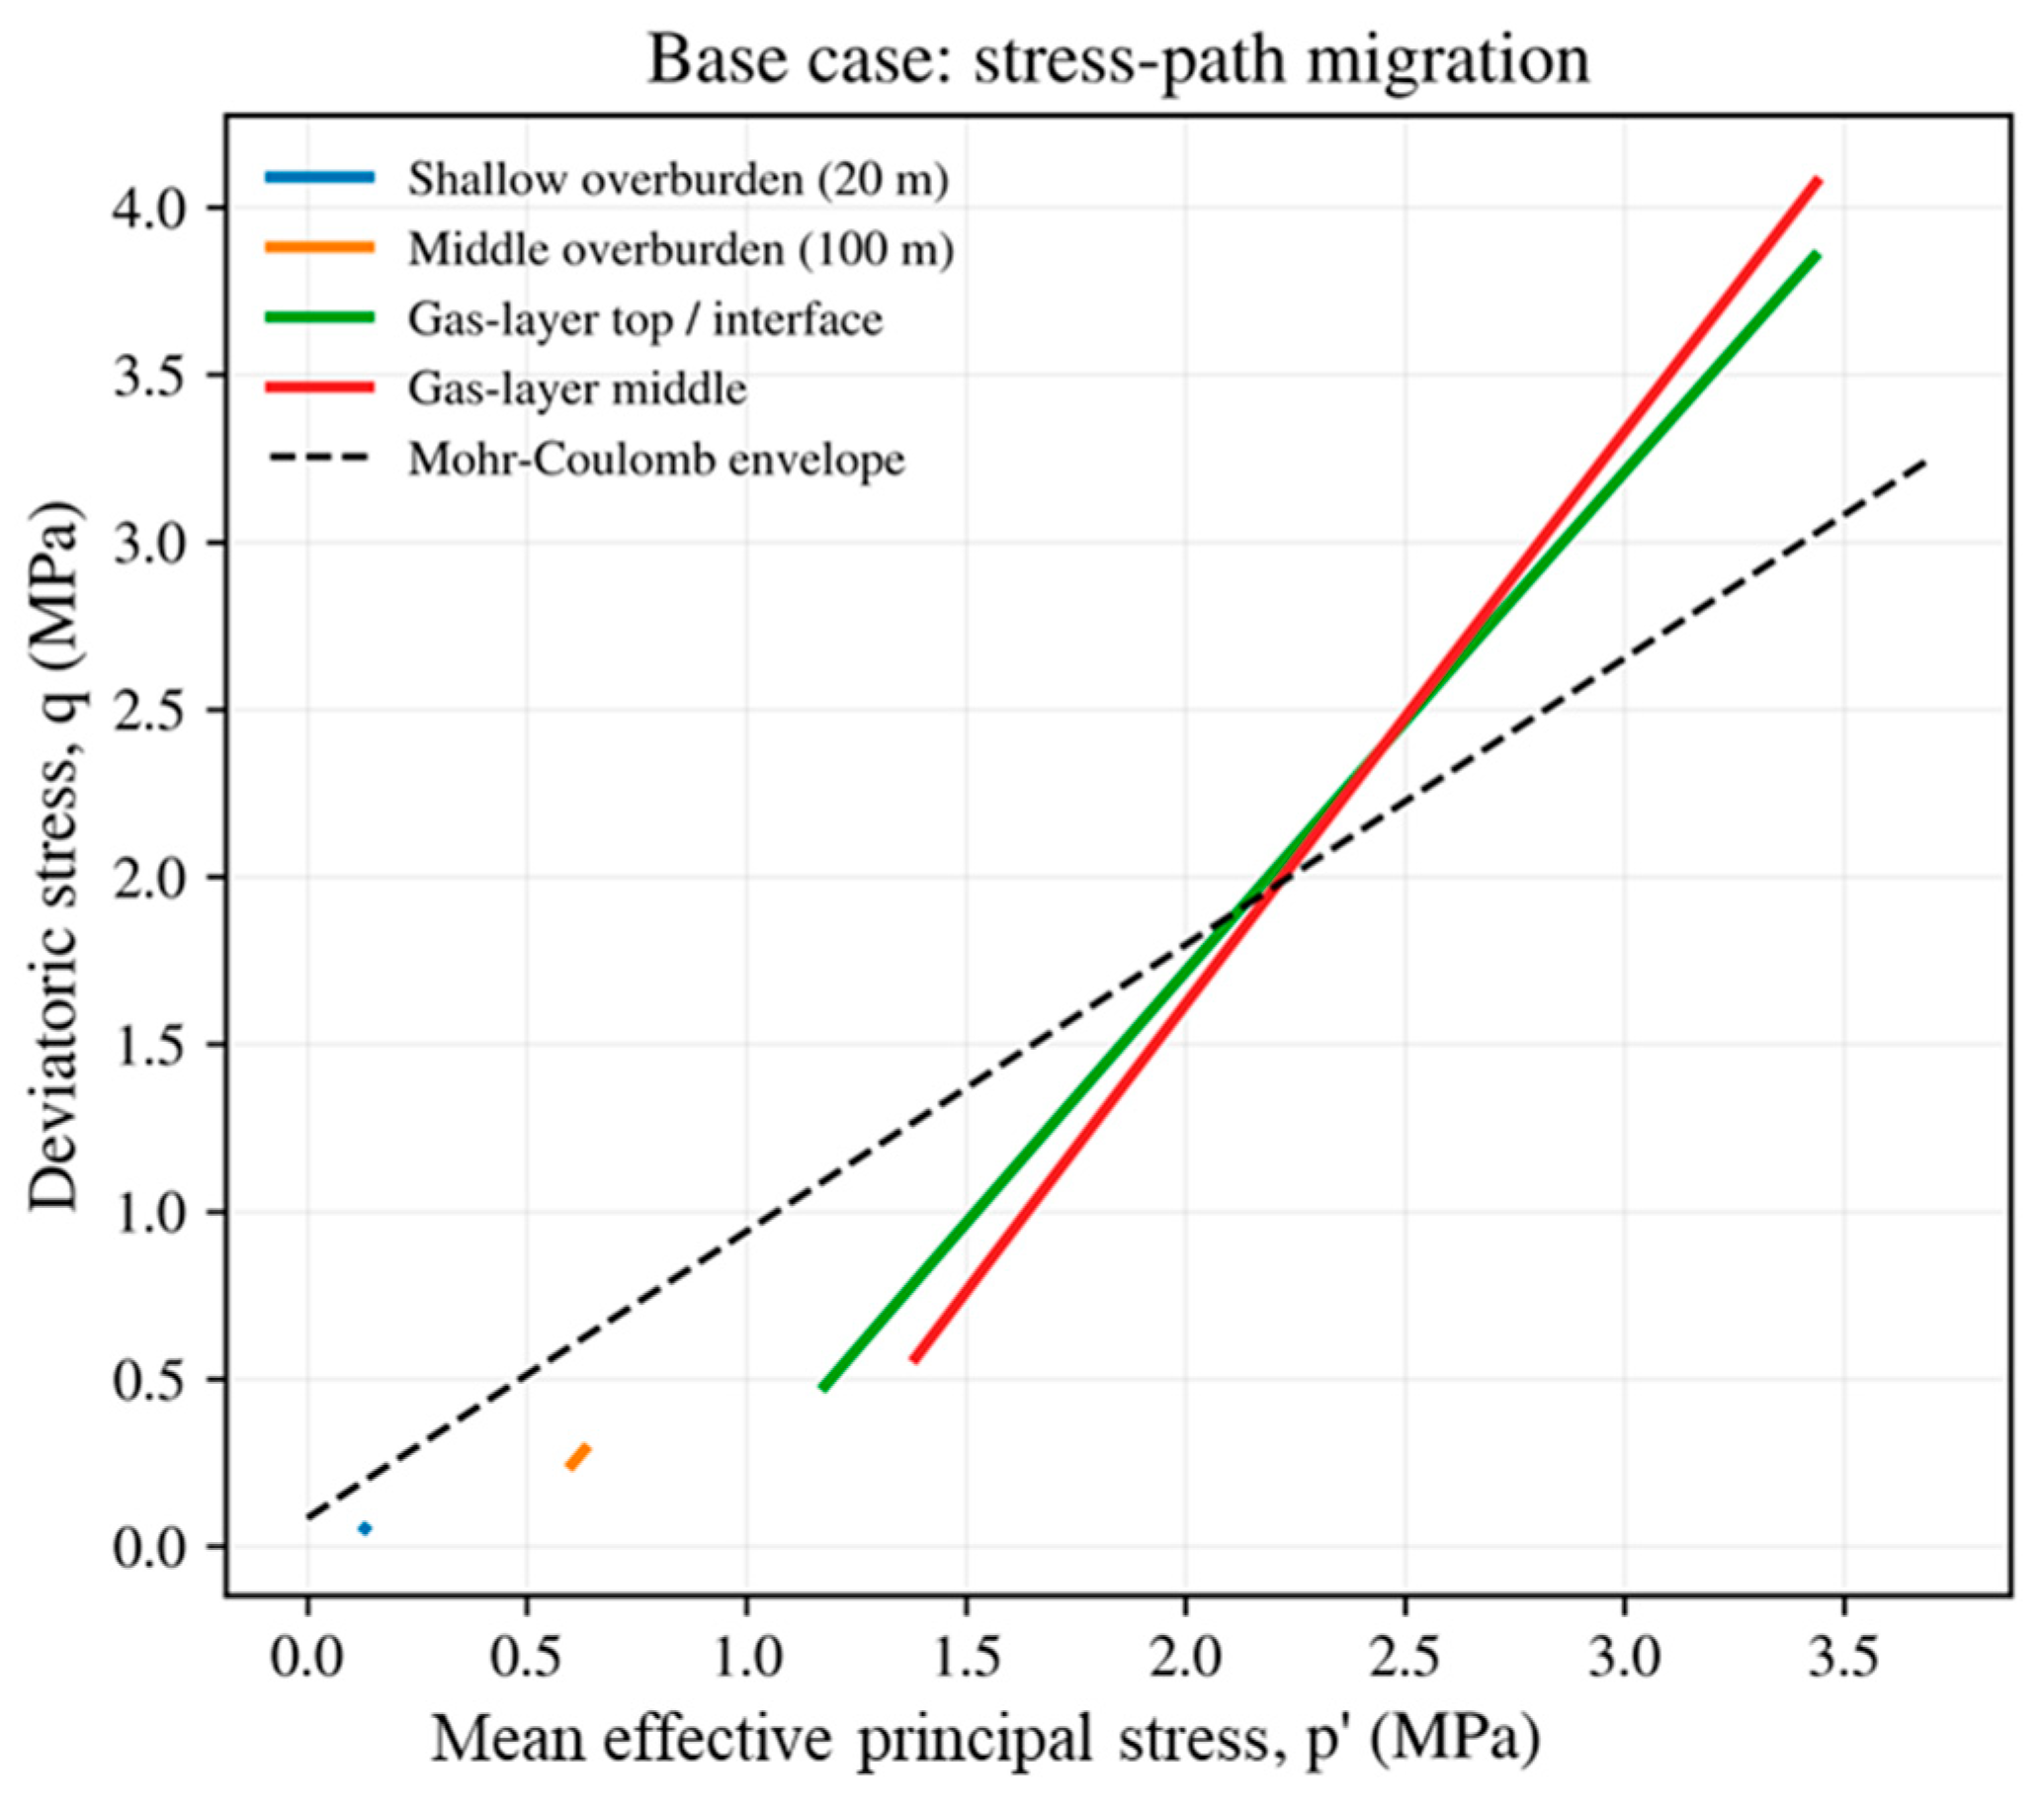
Figure 5 shows the stress path evolution and its relative relationship with the Mohr–Coulomb yielding envelope. Four monitoring locations for the stress path evolution are plotted 20 m below seabed in the overburden and 100 m below seabed in the overburden, the top of the gas layer, and the middle of the gas layer. The stress-path trajectories demonstrate that depletion drives the stress state toward higher p and higher q , with the steepest migration occurring in the gas layer and in the lower overburden. In this modeling study, this occurs because the vertical effective stress increases directly with depletion, while the horizontal stress also increases but at a smaller rate governed by the effective lateral stress-transfer coefficient. The result is a nontrivial increase in deviatoric stress. Yielding does not occur immediately at the start of production. Instead, the yield function grows gradually until the first local yield is reached at approximately 115 d (based on the results presented in Figure 4). This delay is important from an engineering perspective because it implies that a pressure-controlled operation can temporarily remain in a predominantly nonlinear elastic regime before more rapid plastic accumulation occurs. In other words, operational risk is influenced not only by the final drawdown but also by how quickly that drawdown is imposed.
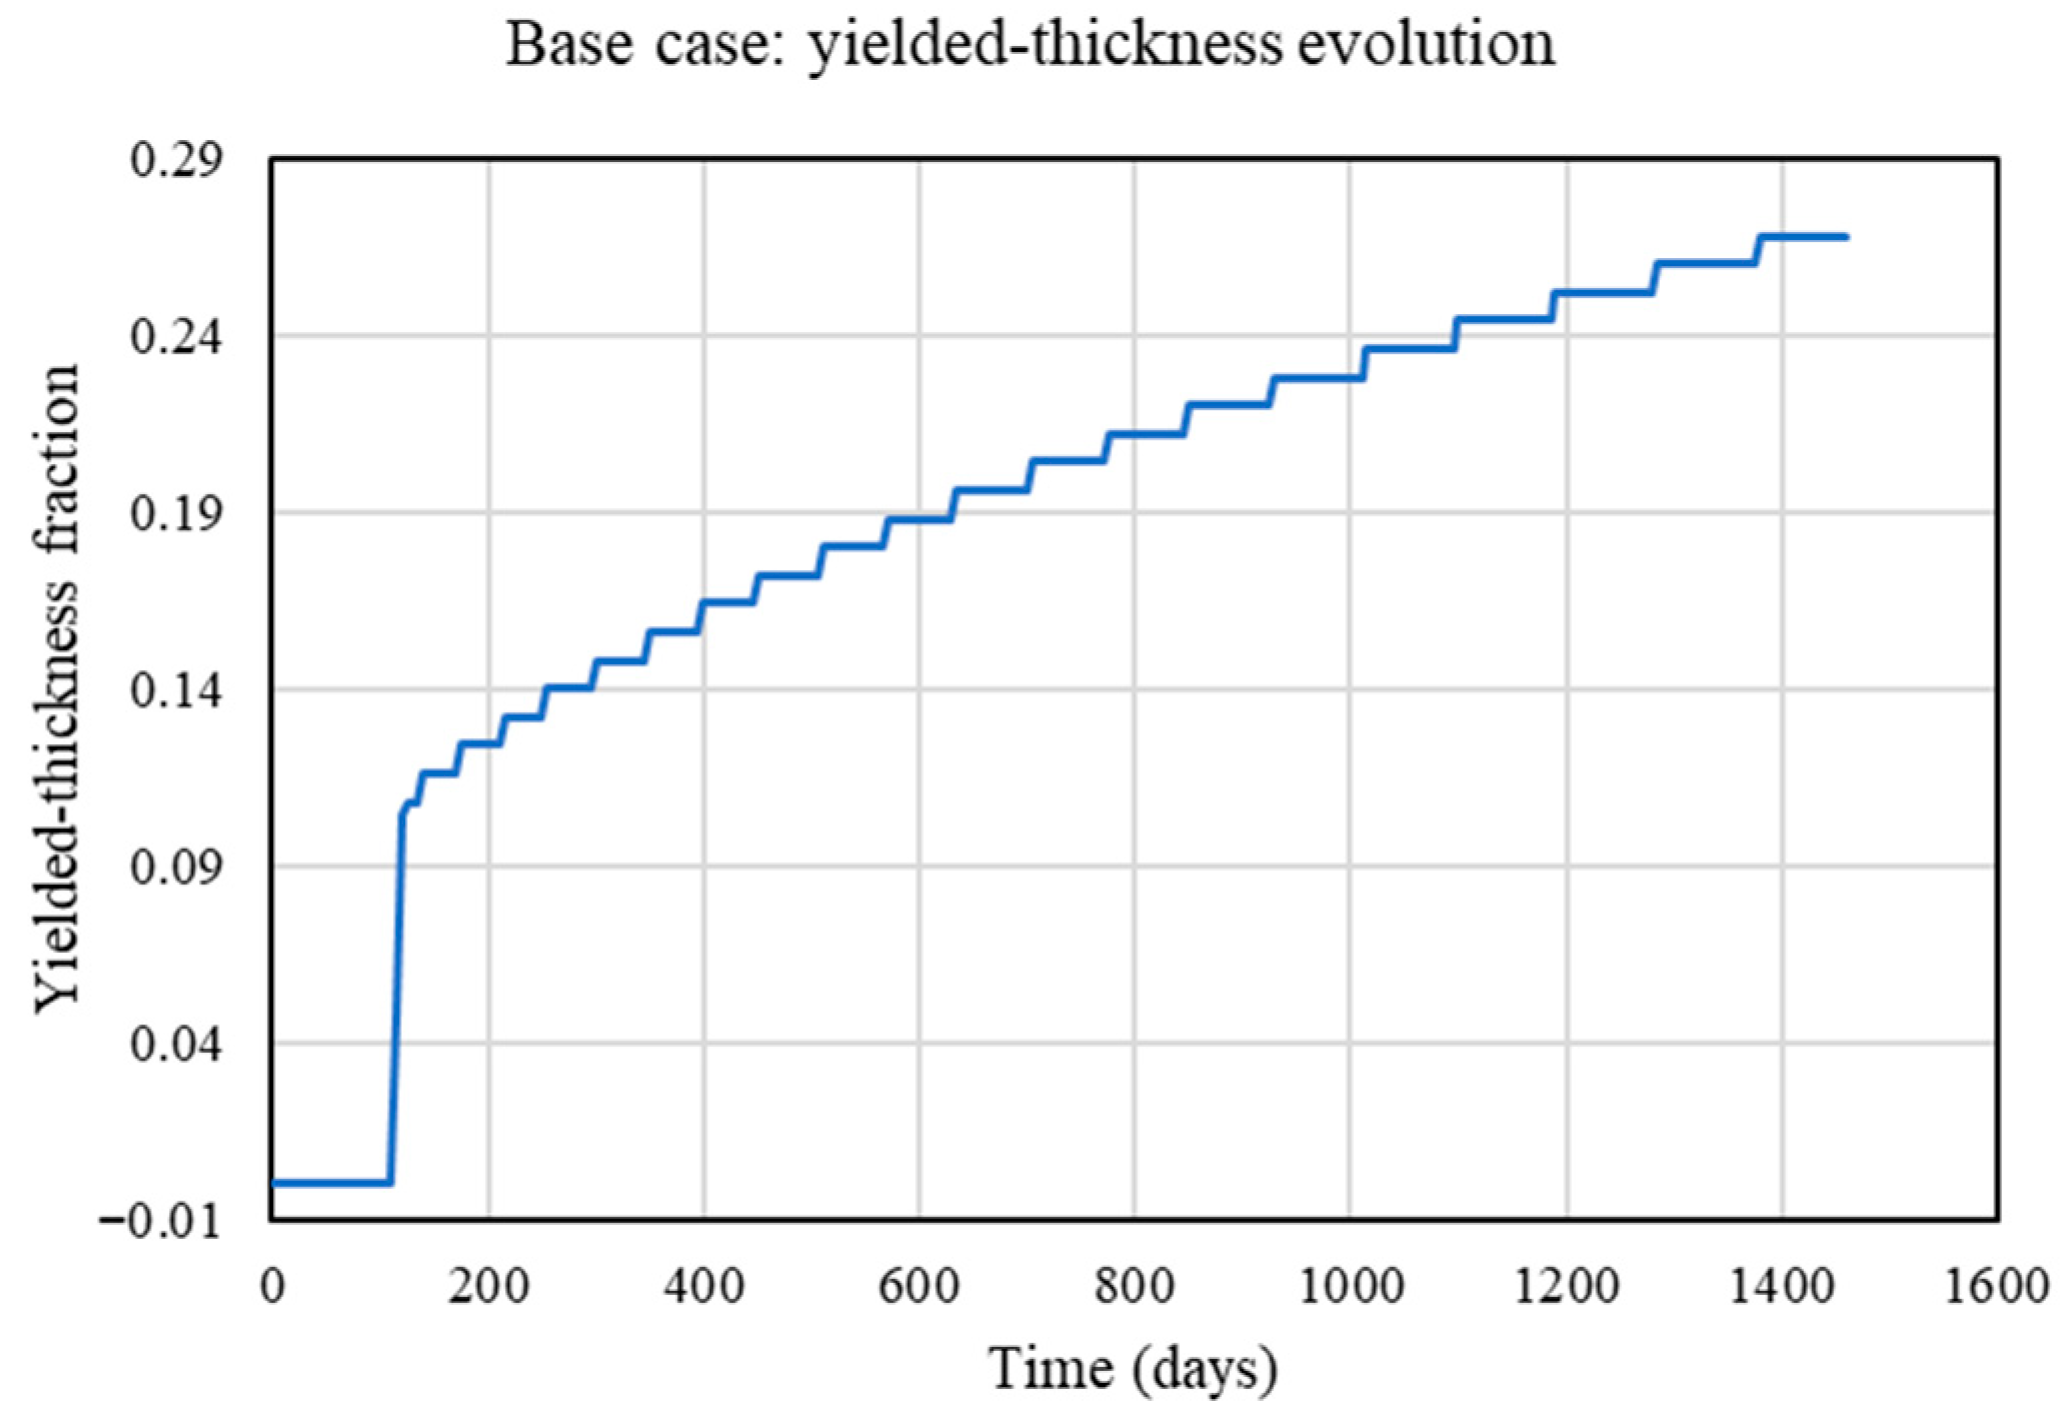
Figure 6 shows the evolution of the fraction of yielded thickness compared to the entire sediment column, starting from the seabed to the shallow gas layer. Meanwhile, Figure 5 reveals that the yielded-thickness fraction increased from 0 to 0.268 by the end of the simulation. The yielded interval was located primarily around the gas layer and the lower part of the overburden, where the combined effects of stronger drawdown, lower modulus, and smaller strength margin were the most explicit. This is a mechanically reasonable outcome: the uppermost overburden remains relatively lightly perturbed, while the lower sequence carries the largest change in effective stress. The peak deviatoric stress in the base case reached 4.109 MPa, confirming that significant shear amplification occurs during the depletion of the shallow gas layer.
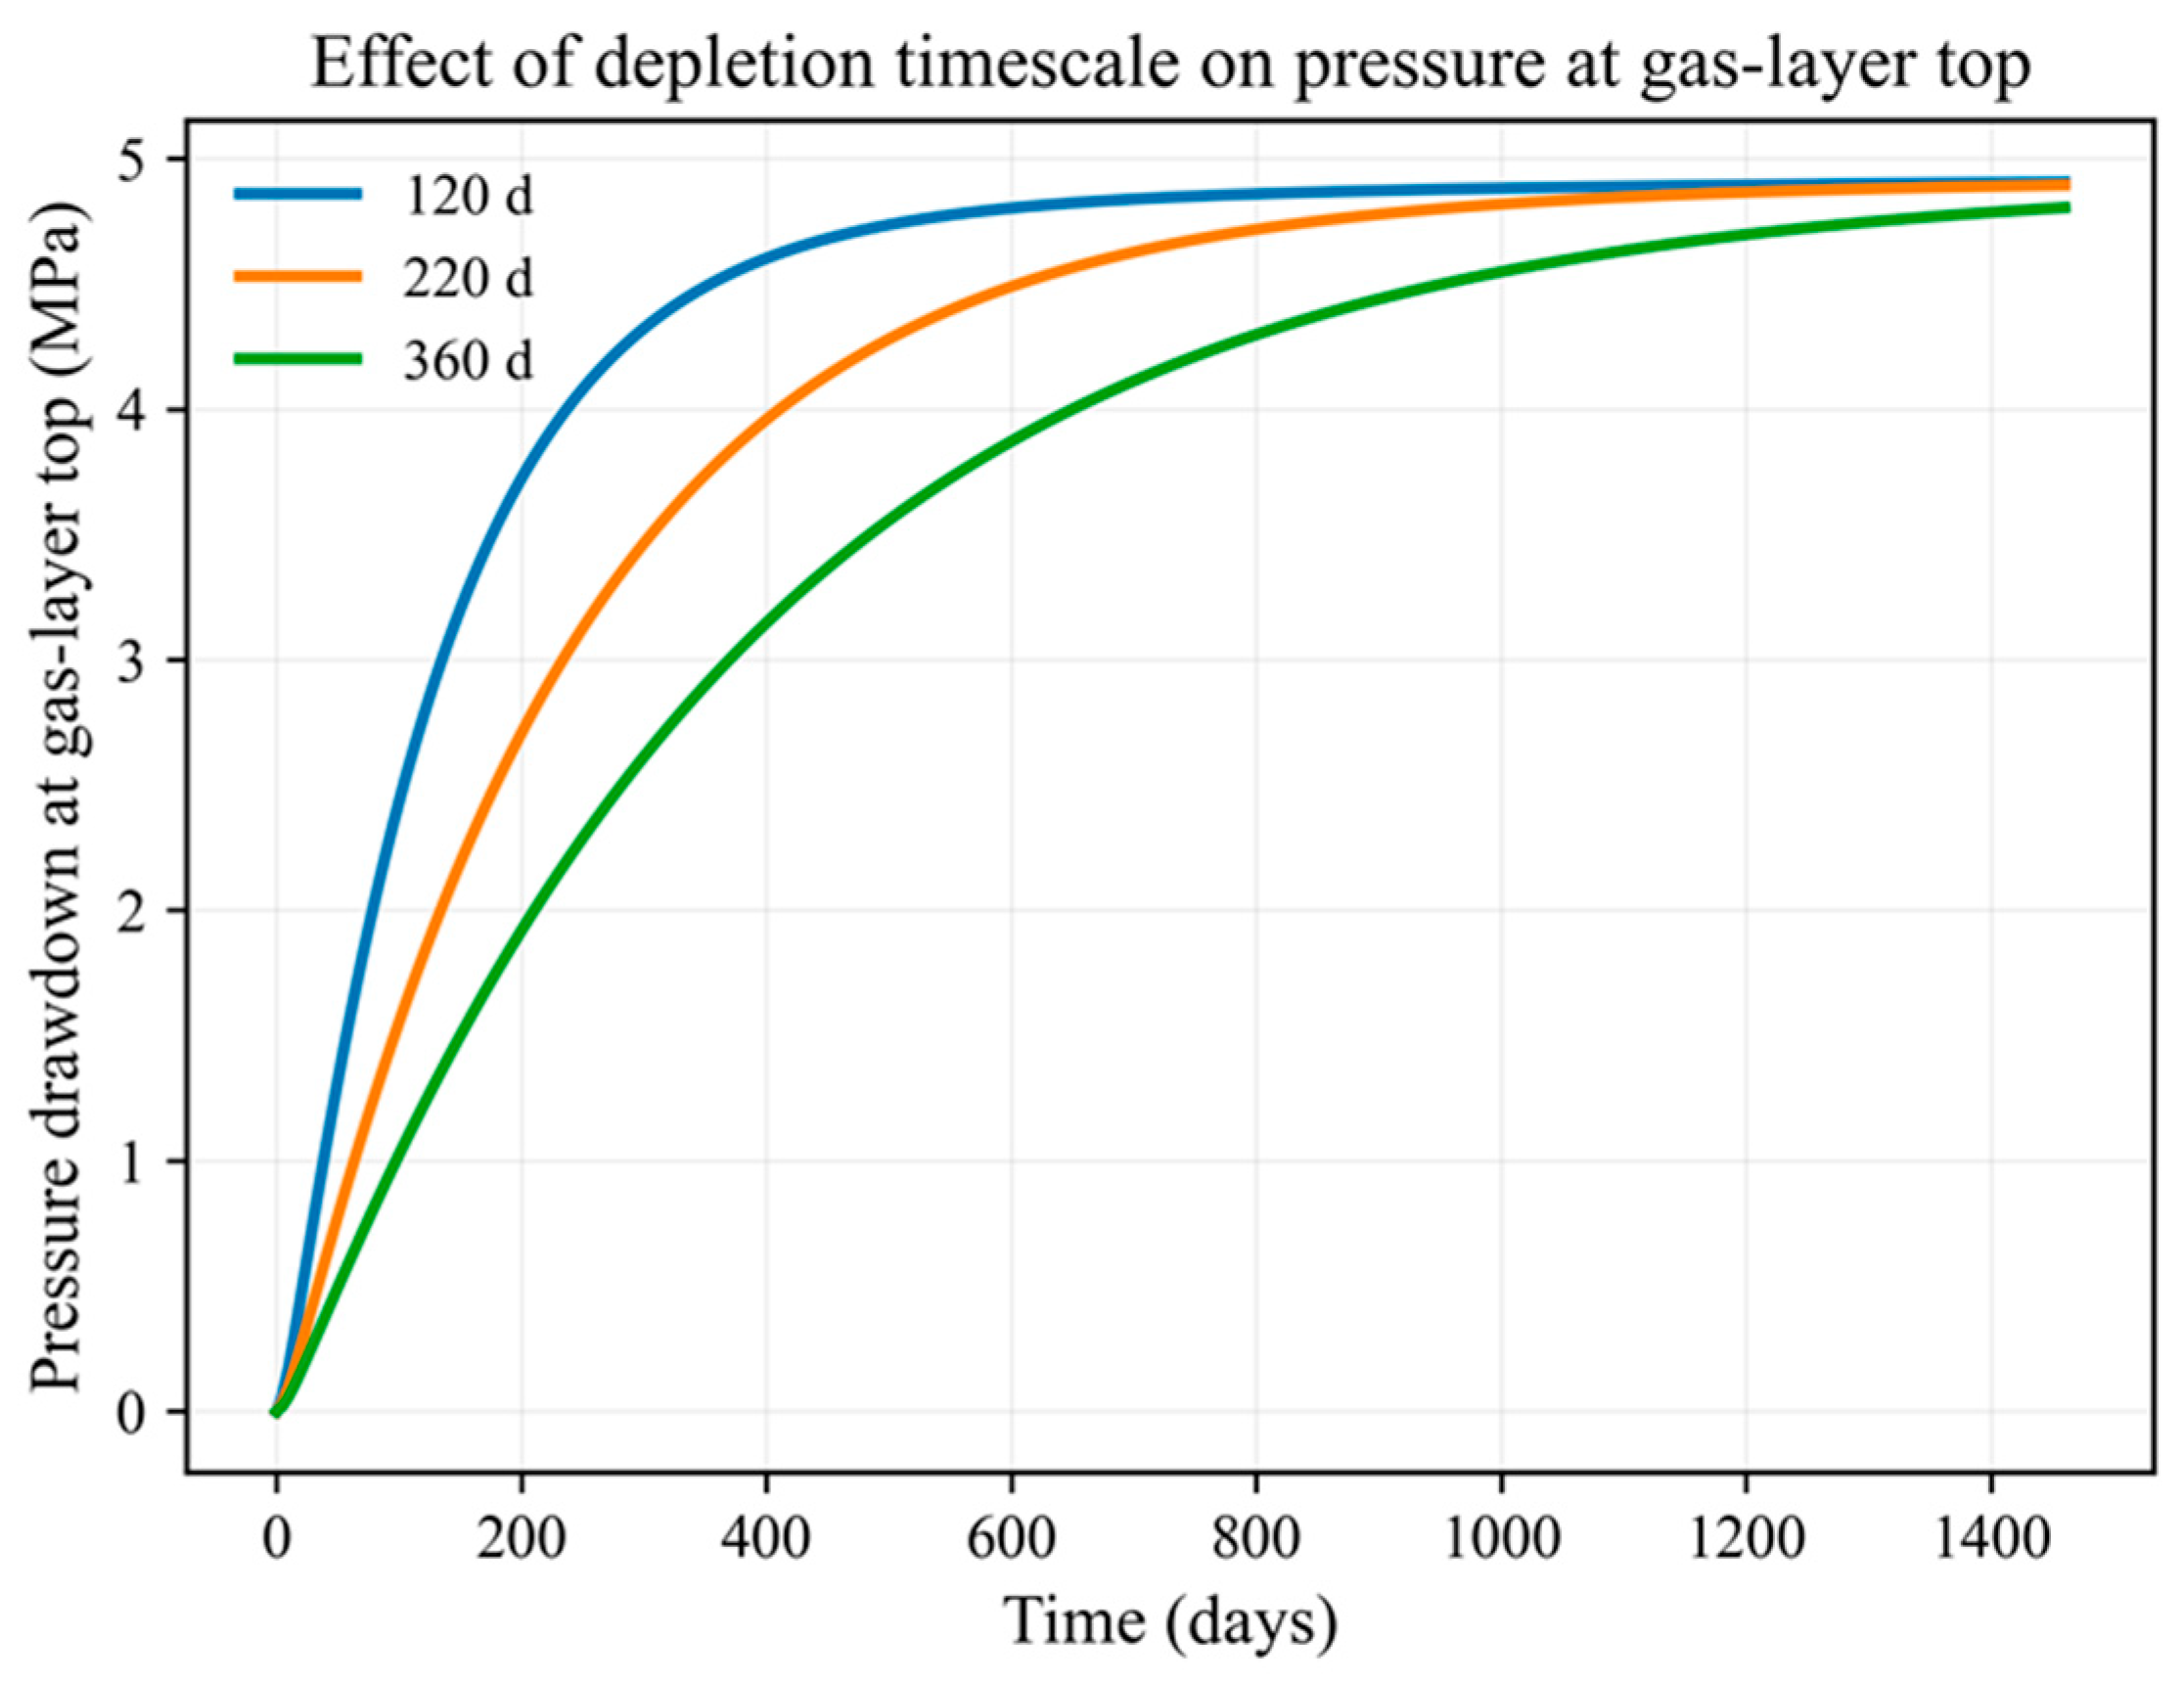
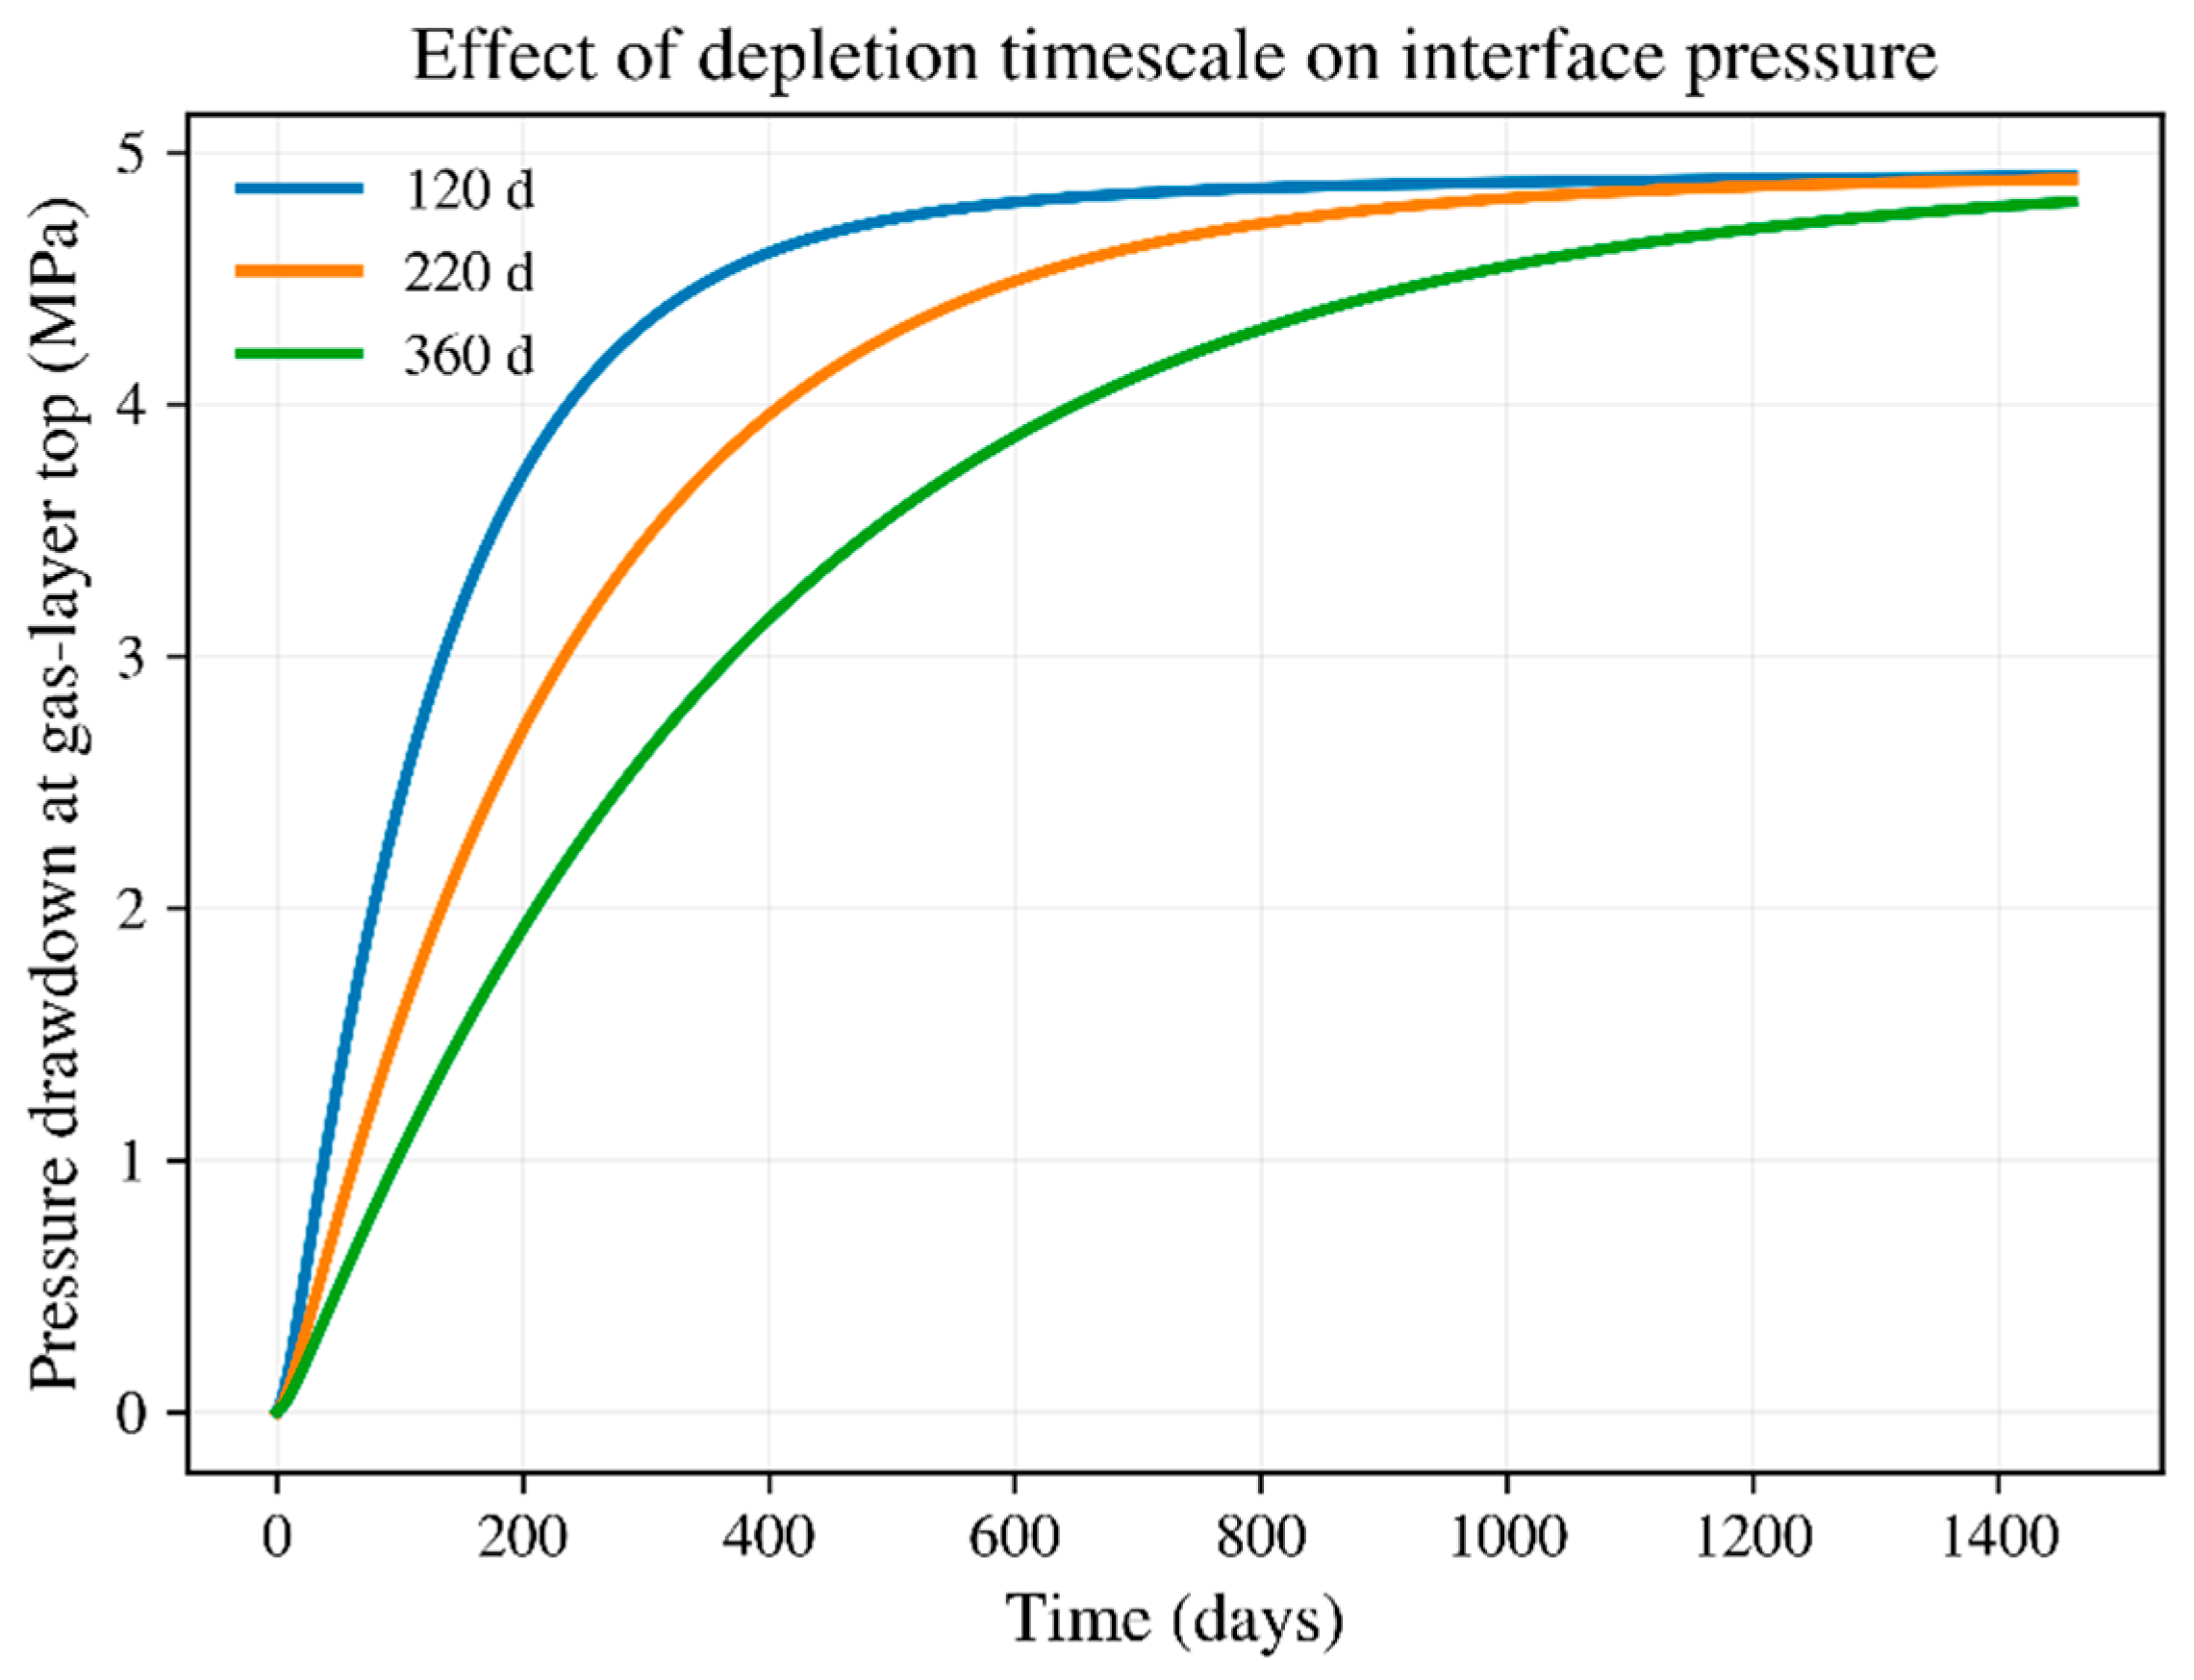
Figure 7 compares the depletion timescale and pressure at the top of the gas layer. The curves indicate that the depletion timescale acts primarily as a control on the evolution of the pressure response. A shorter depletion timescale causes a much more rapid decline in pressure in the top gas layer during the early and intermediate stages, whereas a longer depletion timescale produces a slower and more gradual pressure decrease. However, as time increases, the difference among the cases reduces progressively as all scenarios approach the same asymptotic drawdown target. This means that the depletion timescale mainly governs how quickly the stress disturbance is transmitted into the surrounding sediments rather than the final magnitude of depletion itself. From an engineering viewpoint, this is important because faster depletion can accelerate stress-path migration and advance the onset of plasticity, even when the ultimate drawdown remains unchanged. Therefore, bottomhole pressure control and depletion scheduling should be regarded as practical tools for moderating the short- to medium-term geomechanical risk during shallow gas production.
Based on the analysis of the base case, several distinct phenomena have been observed for the coupled flow and geomechanical behaviors induced by shallow gas production. Early gas-layer depletion mostly induces elastic compression. Diffusion-driven load transfer moves gradually into the lower overburden. The initiation of yielding is located near the mechanically weaker lower intervals. Continued accumulation of plastic settlement is captured as the yielded zone expands.

4. Sensitivity Analysis

4.1. Parametric Study

In the base case analysis, key characteristics of the depletion-induced pressure and stress responses are captured and quantified. In addition, it is useful to carry out a set of sensitivity analyses to investigate the effects of key engineering operation- and sediment-related parameters on the pressure, deformation, and yielding of the shallow sediments. This can provide quantitative results for the optimization of design parameters during the production of deepwater shallow gas resources.
The sensitivity analysis is organized around mechanisms and response metrics. Two global tornado plots are summarized to rank the effects on final settlement and final yielded-thickness fraction, and five comparisons are plotted to visualize how selected engineering parameters alter the time evolution and depth distribution of key responses. The global tornado analysis varies eight parameters around the base case: maximum drawdown, depletion timescale, gas-layer thickness, gas-layer permeability, gas-layer reference modulus, cohesion, friction angle, and OCR.
The local comparison curves then focus on the most engineering-relevant scenarios: (1) drawdown amplitude: 4, 5, and 6 MPa; (2) depletion timescale: 120, 220, and 360 d; (3) cohesion: 25, 40, and 60 kPa; (4) friction angle: 18°, 22°, and 26°.
Figure 8 compares the pressure-drop history at the gas-layer top for depletion timescales of 120, 220, and 360 d. The curves show that a shorter depletion timescale causes much more rapid early-stage pressure diffusion. As an example, around 360 d, the pressure drop at the interface is about 4.51 MPa for 120 d, 3.79 MPa for 220 d, and 2.95 MPa for 360 d. Even though the long-term pressure drop differences later become insignificant, the early stress evolution rate is strongly affected by the depletion timescale. This matters because the timing of yield initiation is coupled with the growth rate of both p and q . Therefore, a fast depletion schedule promotes earlier yielding even when the final drawdown target is the same. In practical terms, the depletion timescale is a kinetic control, whereas the maximum drawdown is more of a final-state amplitude control. This observation can be used to optimize the bottomhole pressure control and the bottomhole production rate control in the field.
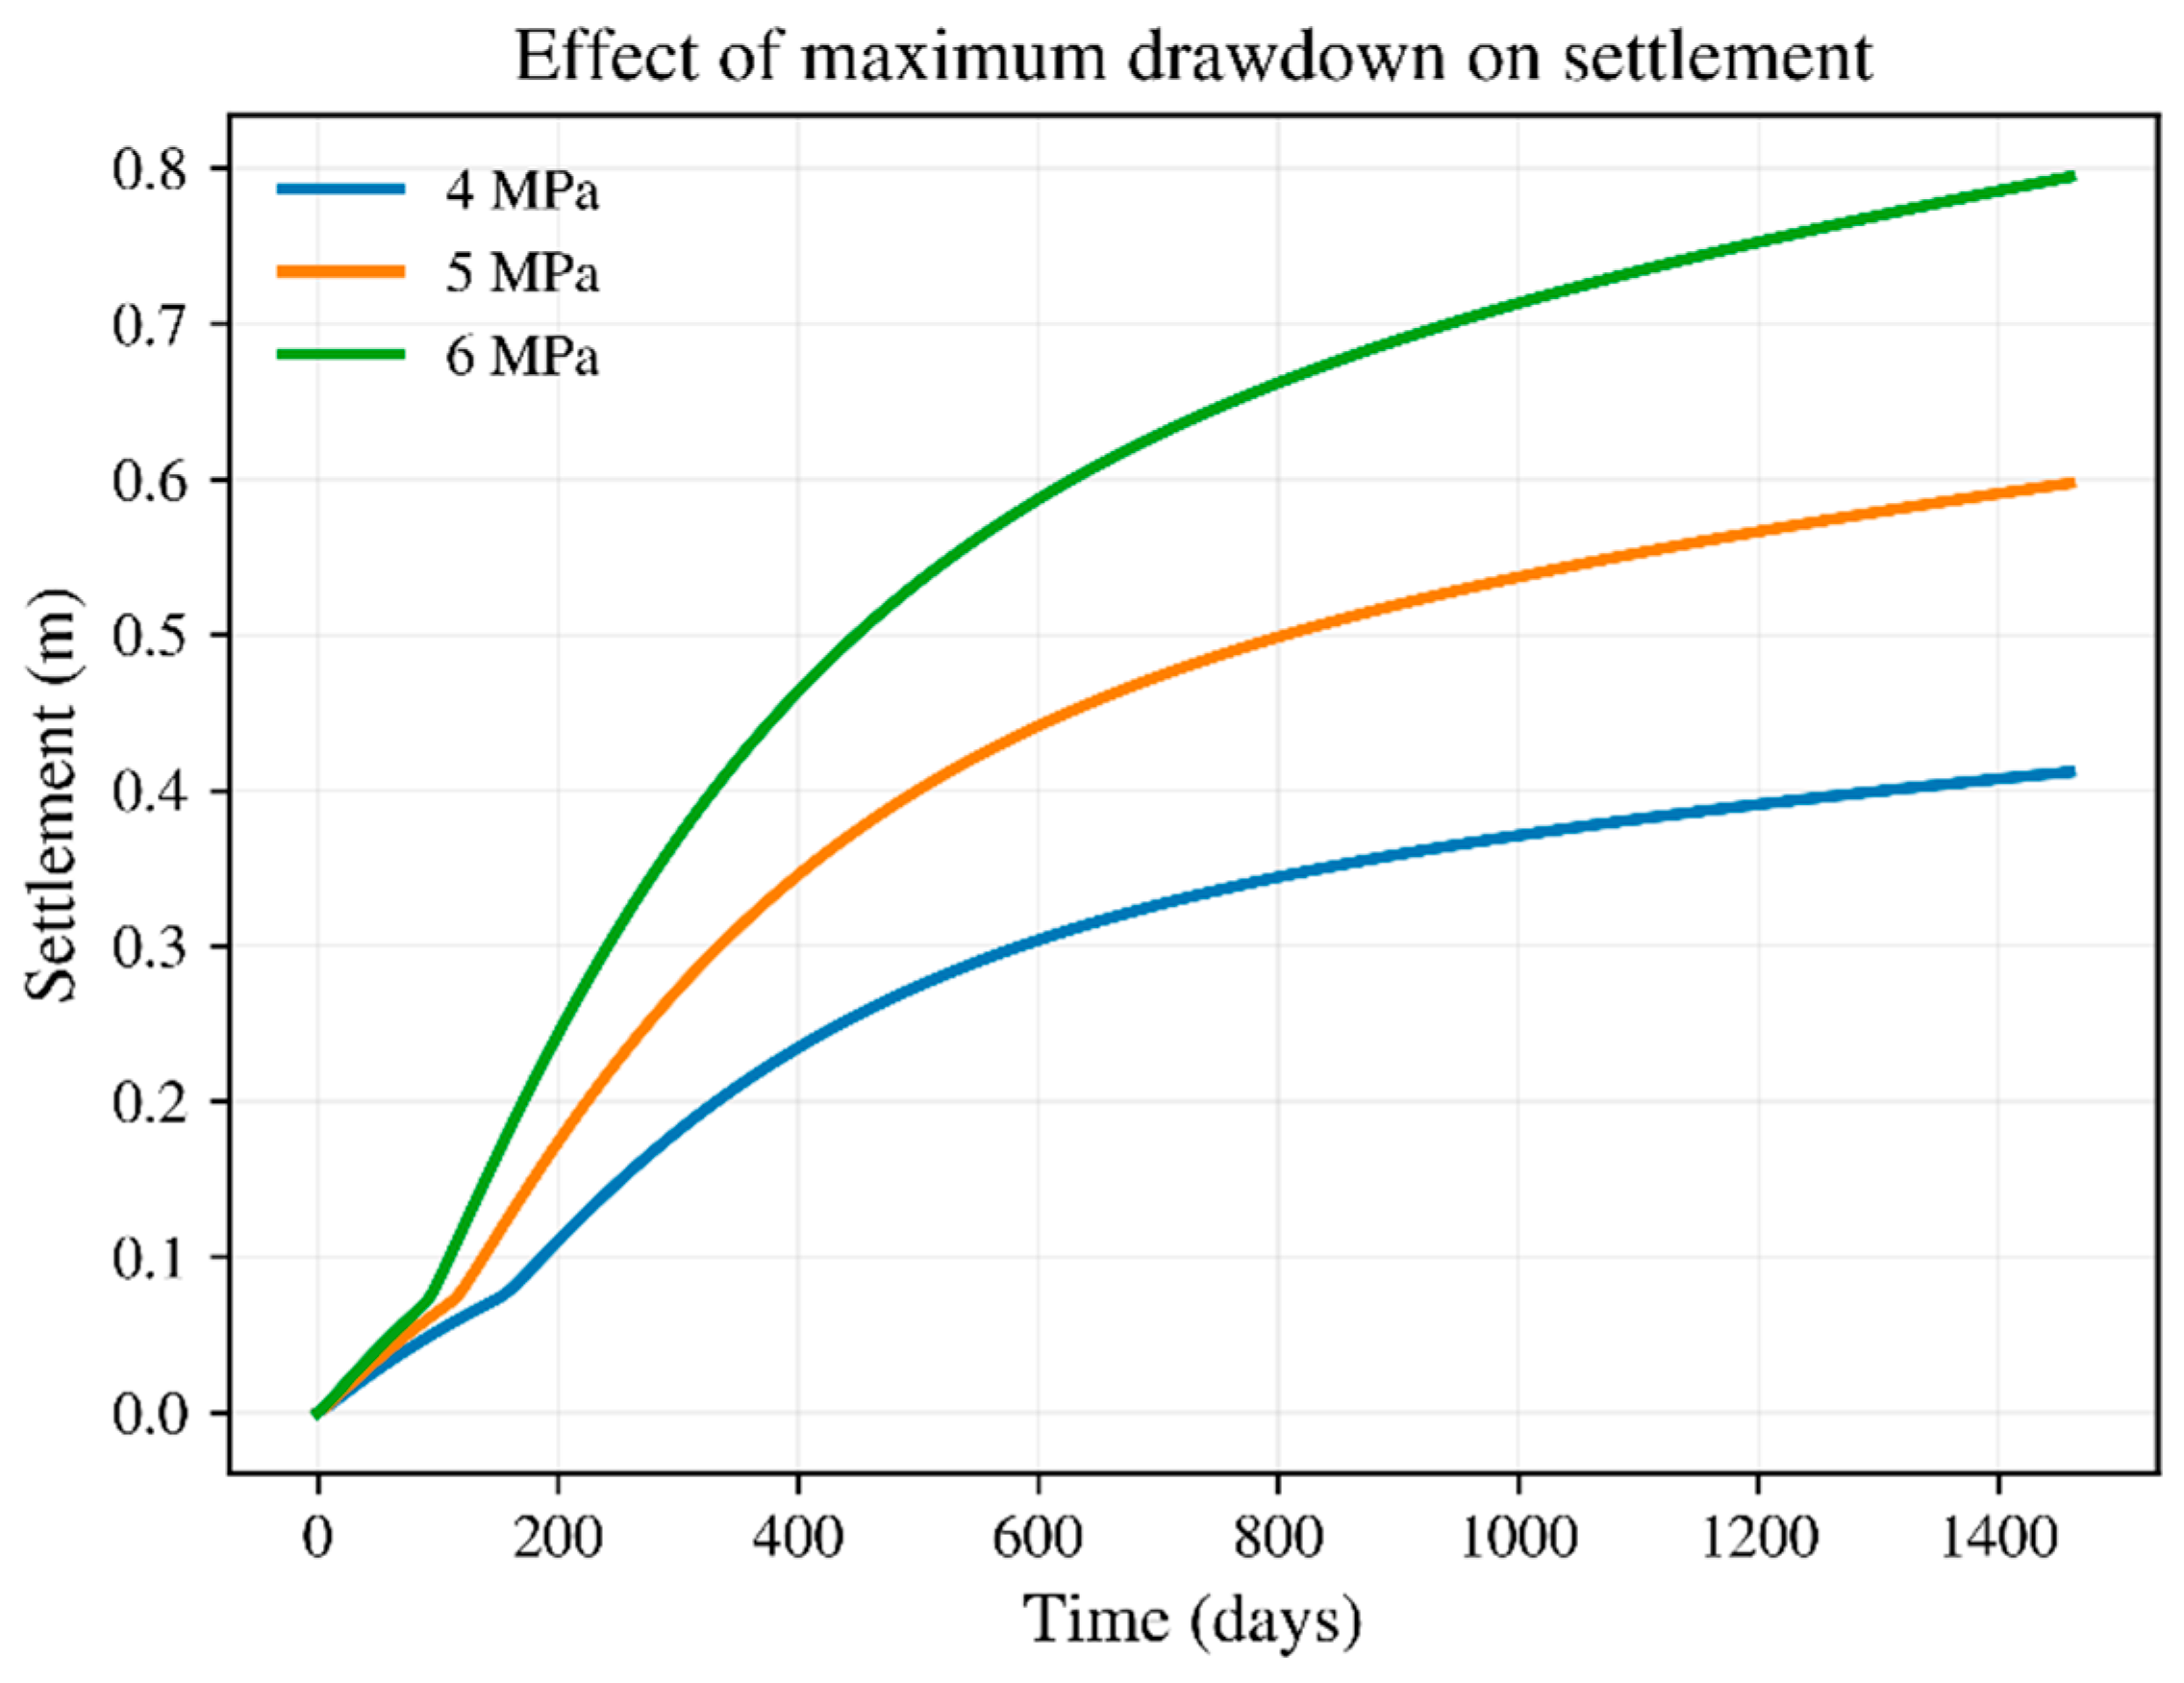
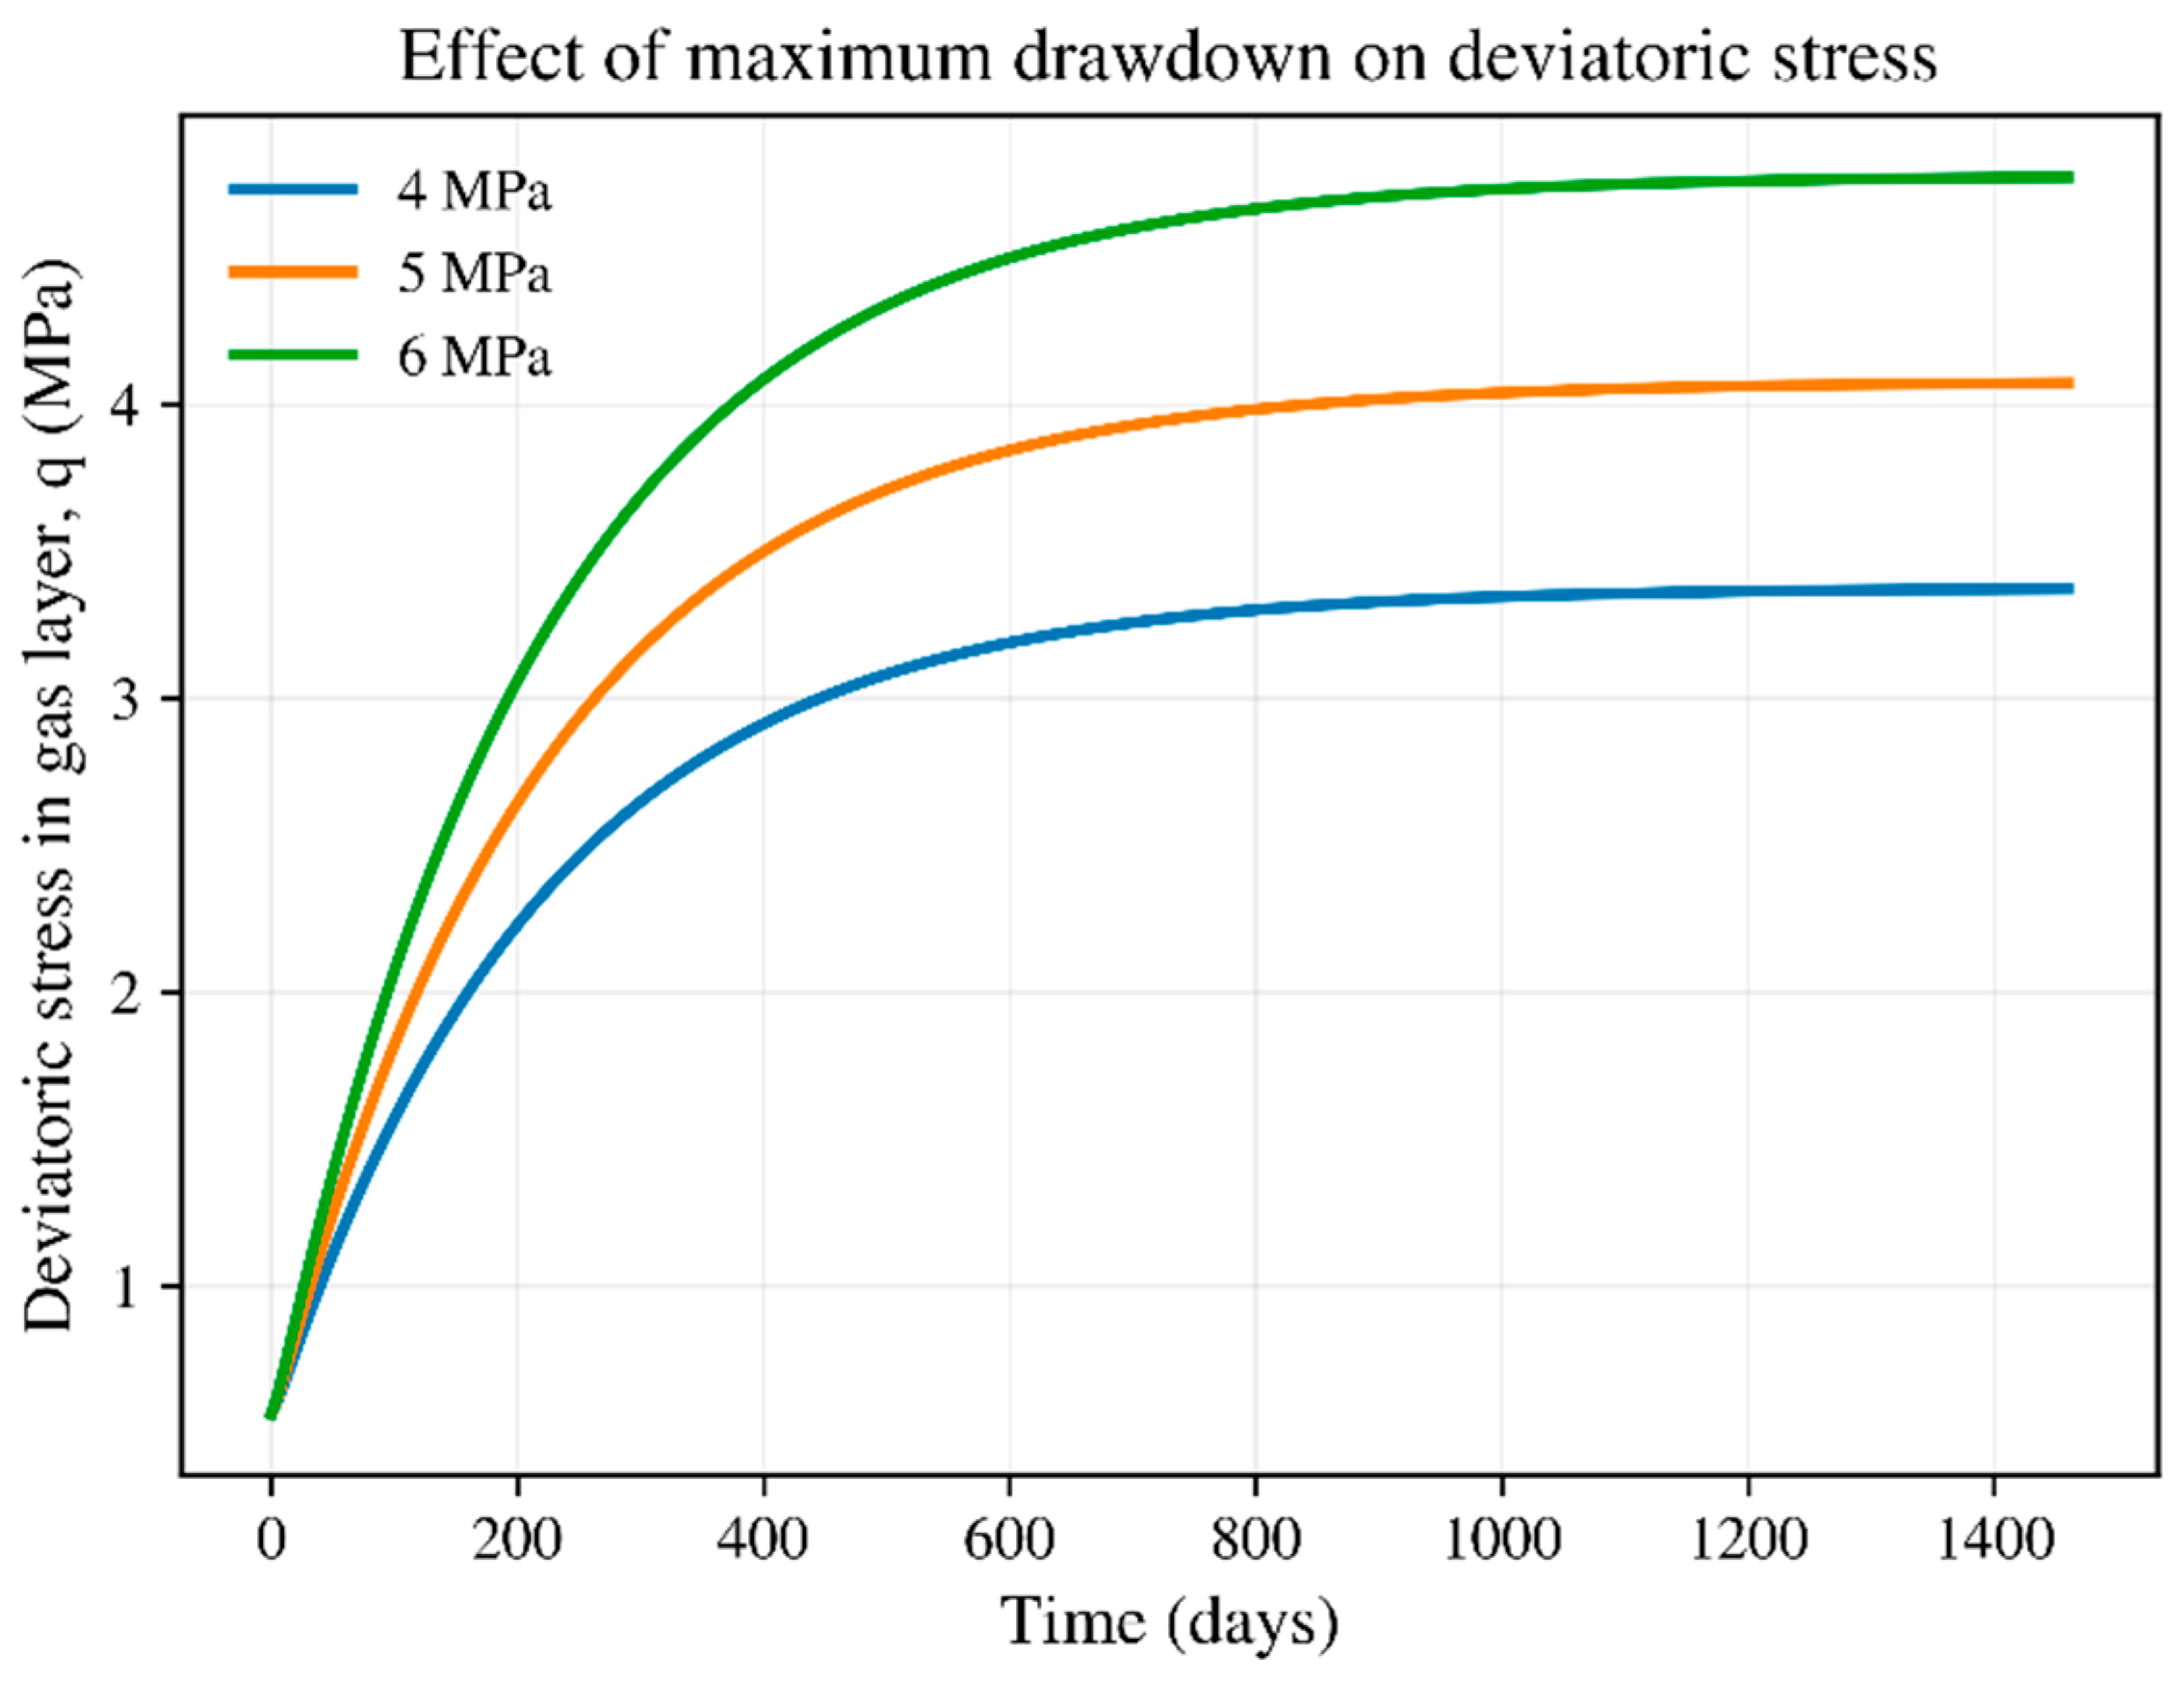
Figure 9 and Figure 10 show a clear and monotonic amplification of long-term settlement as the maximum drawdown increases from 4 to 6 MPa. At the end of the simulation, the settlement reaches approximately 0.412 m, 0.597 m, and 0.794 m for 4, 5, and 6 MPa, respectively. This near-monotonic amplification is expected because higher drawdown increases the effective stress increment throughout both layers, strengthening both the nonlinear elastic compression and the plastic correction. The corresponding deviatoric-stress comparison at the gas-layer midpoint shows a very consistent trend. The final deviatoric stress is approximately 3.373 MPa, 4.074 MPa, and 4.775 MPa for 4, 5, and 6 MPa, respectively. These results indicate that drawdown magnitude serves mainly as a stress-amplitude control, directly pushing the stress path toward the Mohr–Coulomb envelope. Therefore, from an engineering perspective, drawdown magnitude control is the most immediate and useful tool for limiting excessive plasticity and settlement during shallow gas production.
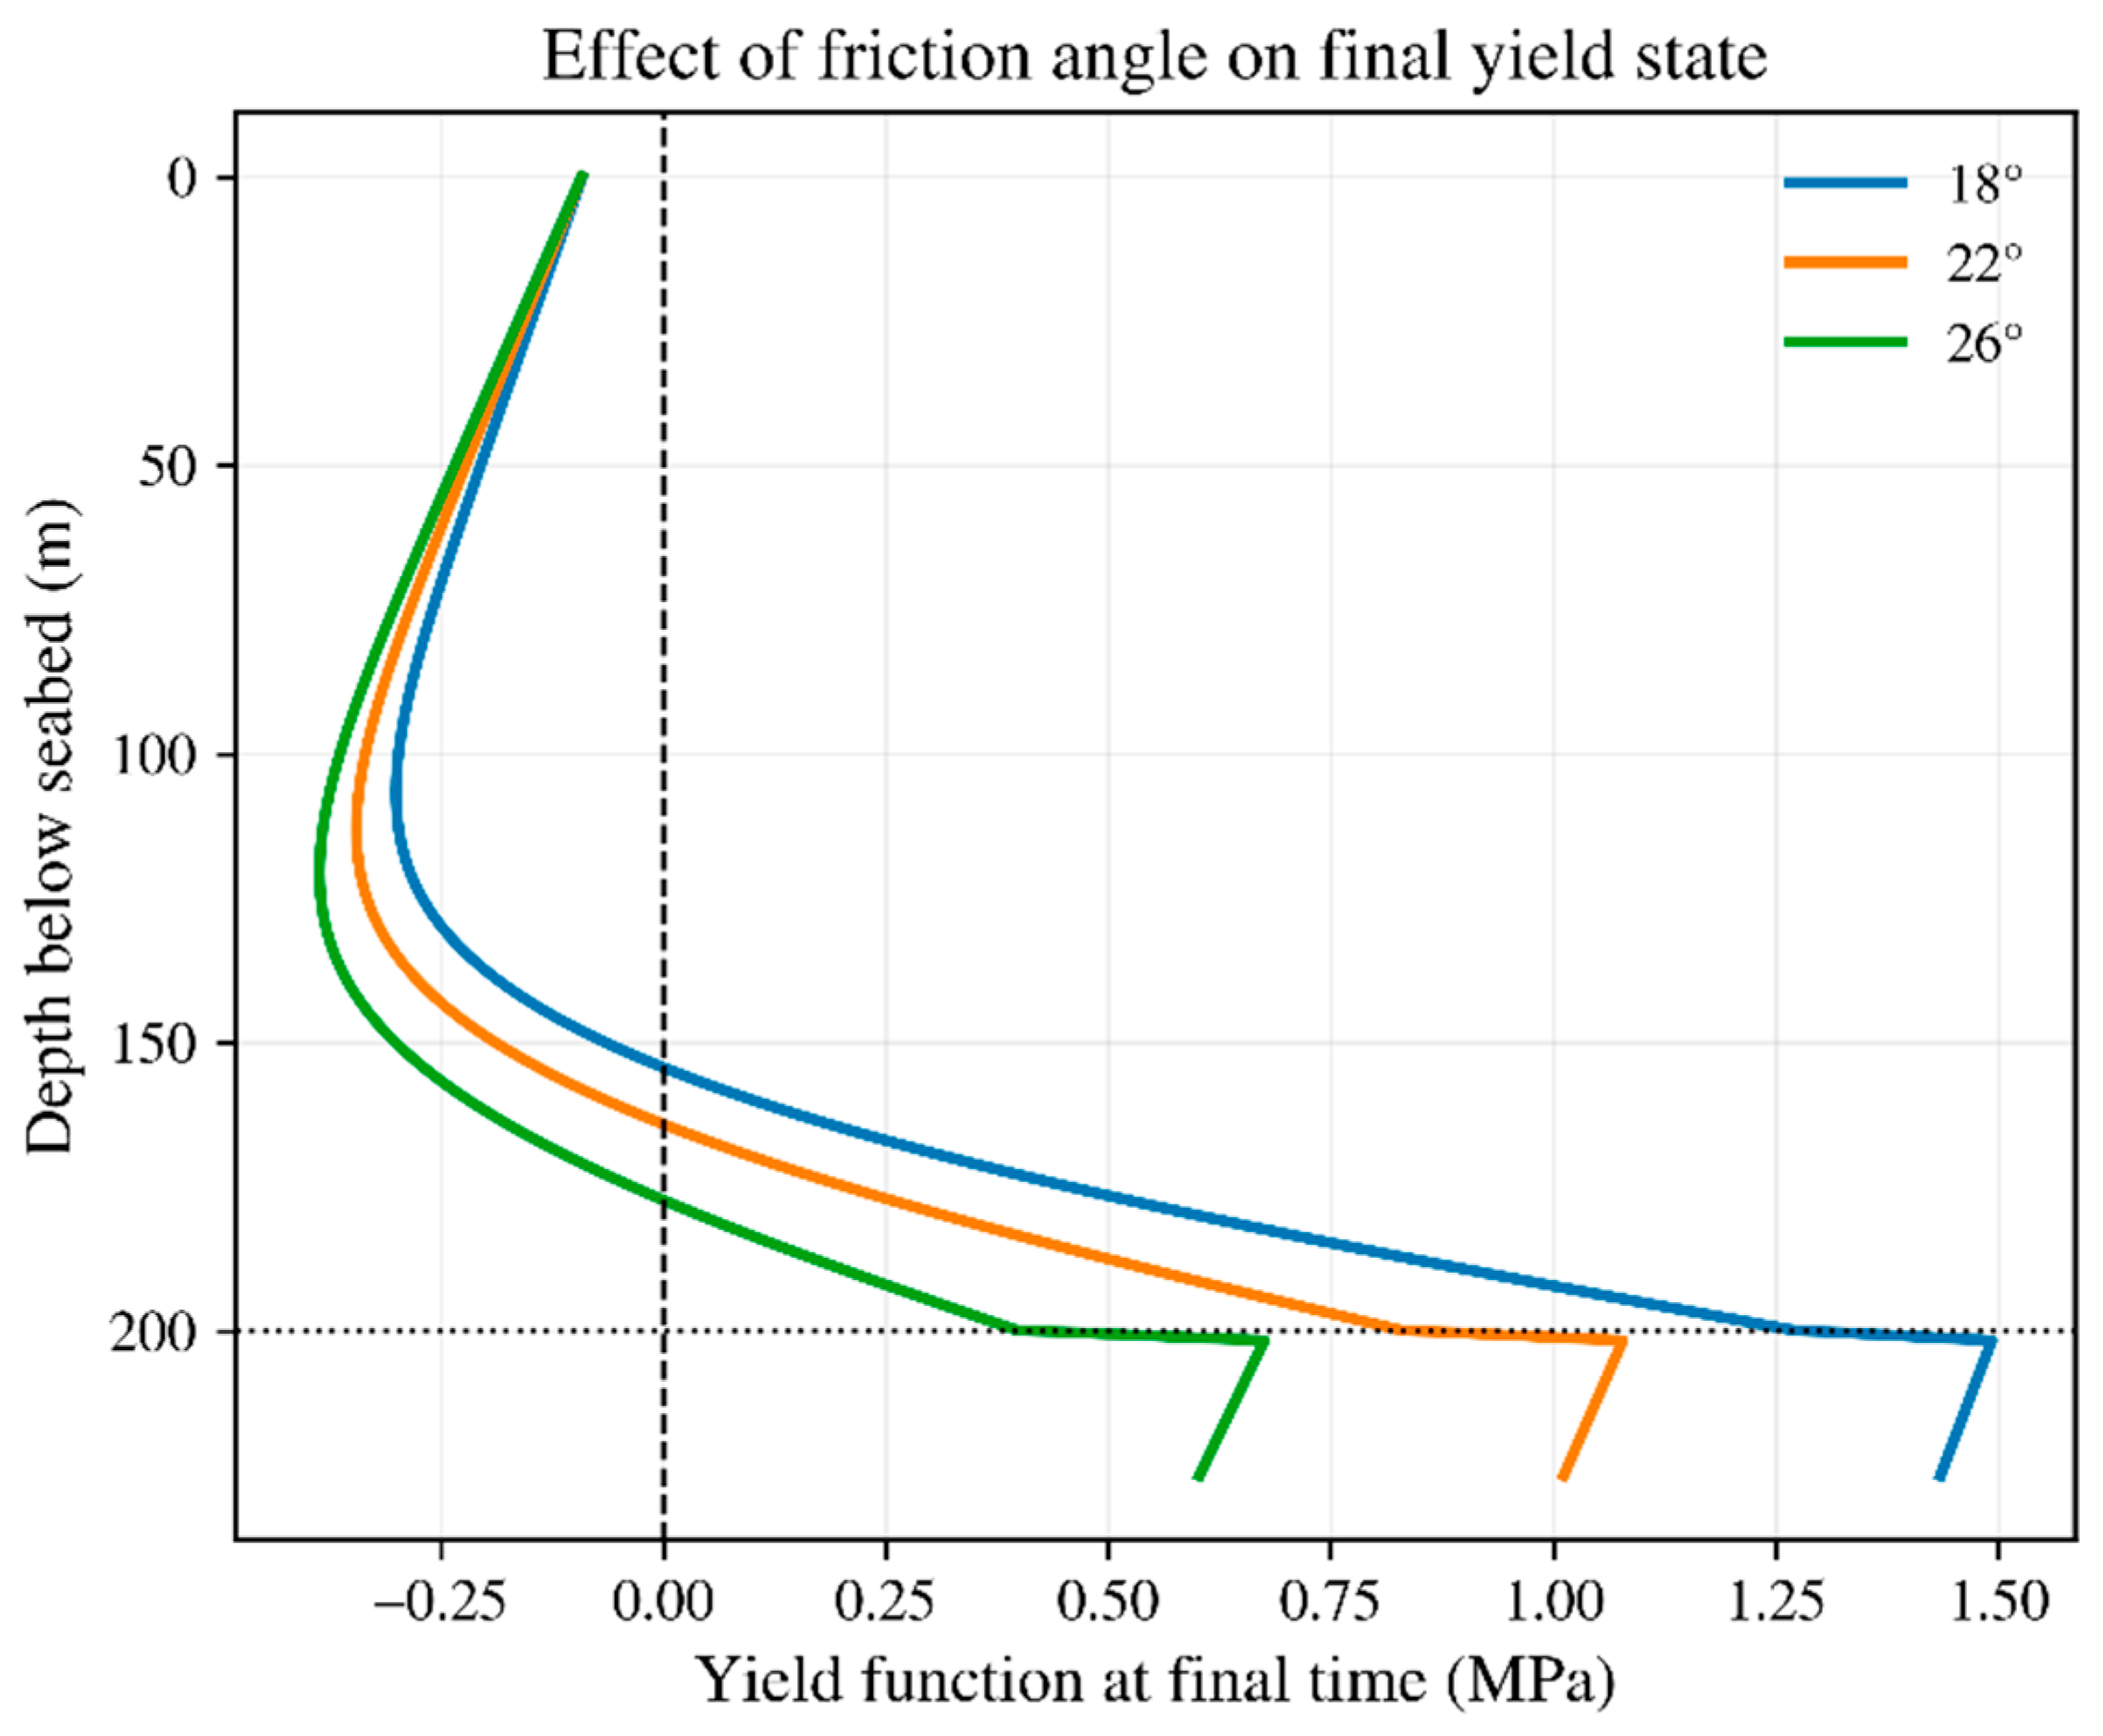
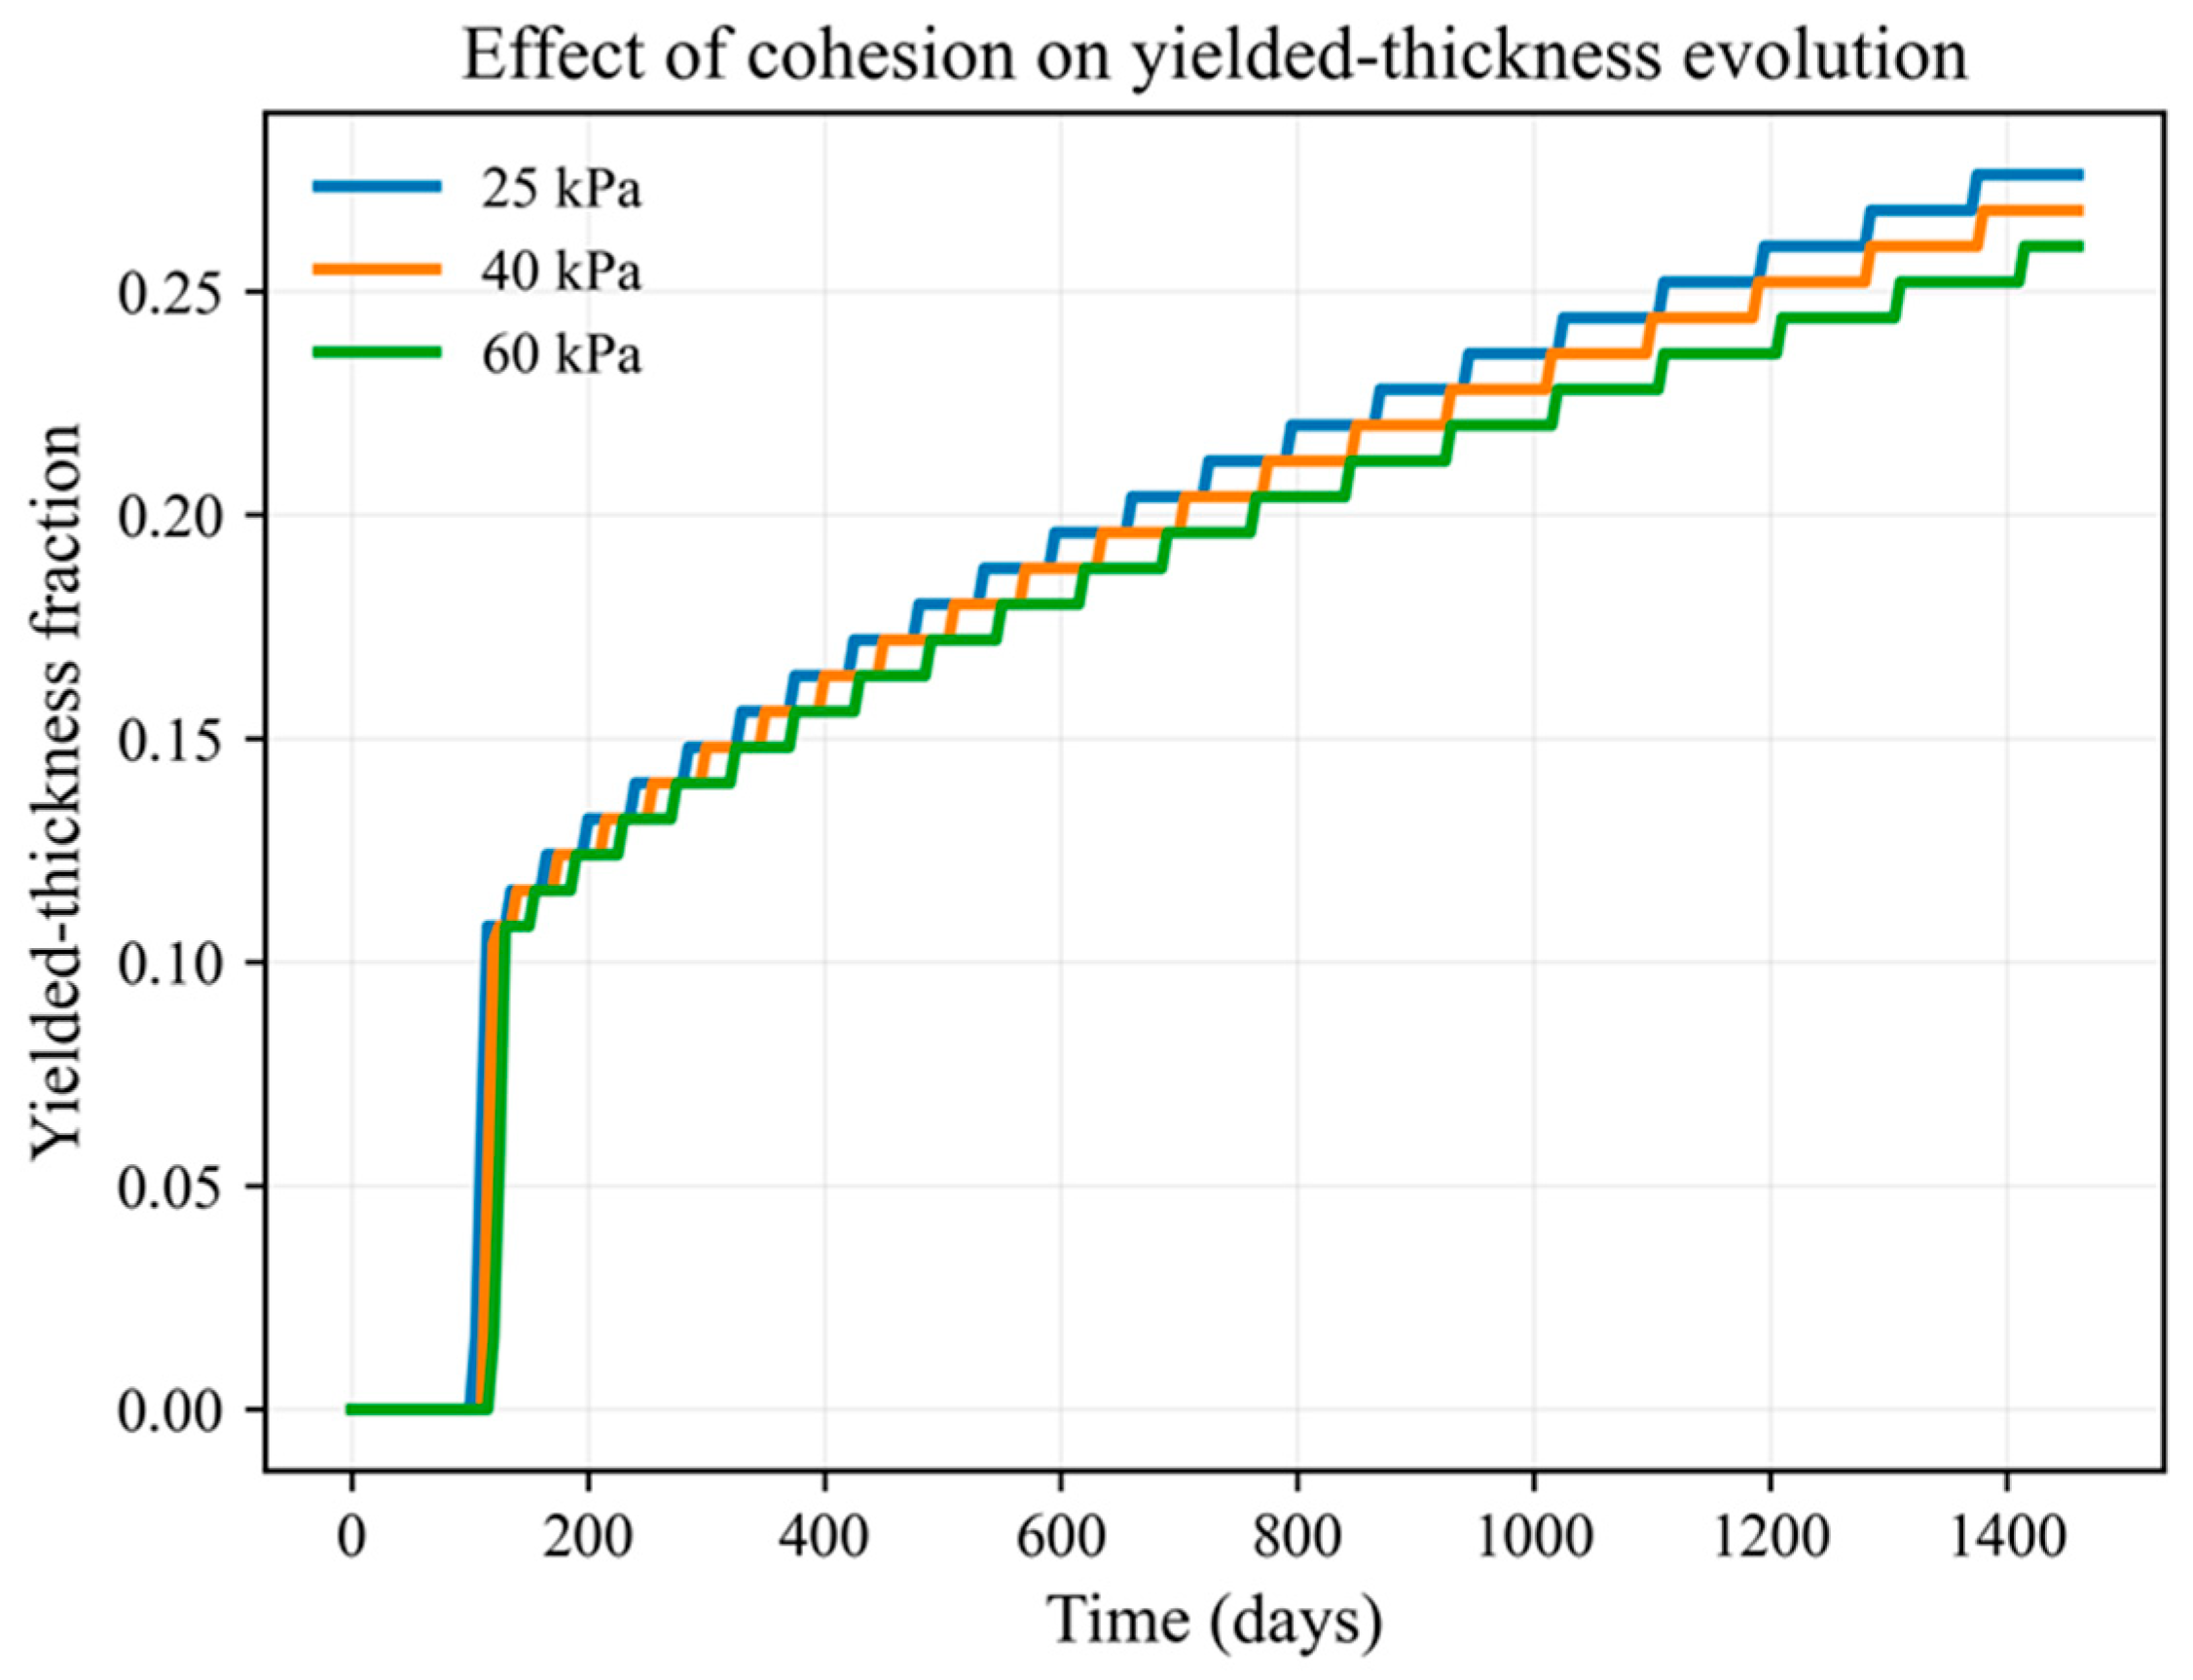
Figure 11 and Figure 12 show the effects of the strength parameters of the sediments on the yielding induced by shallow gas production. The cohesion comparison demonstrates that increasing cohesion from 25 to 60 kPa reduces the final yielded-thickness fraction from approximately 0.276 to 0.260, with the base case at 0.268. The trend is consistent but slightly modest, suggesting that cohesion alters the yield threshold but does not fundamentally change the overall response pattern within the selected range investigated in this parametric study. By contrast, the final yield-function profiles show that the friction angle has a much greater influence on the spatial extent of yielding. Based on the final profiles, the fraction of the total thickness with positive yield function is about 0.317 for 18°, 0.270 for 22°, and 0.214 for 26°. Therefore, the friction angle is a much more influential control with regard to where and how far the yielding zone grows. This explains why the friction angle is the most influential of the parameters studied in the sensitivity analyses. Since the friction angle is an inherent property of the sediments and cannot be changed through engineering operations, it is important to select shallow gas-bearing sediments with a proper friction angle to achieve better formation stability and lower subsidence risks.
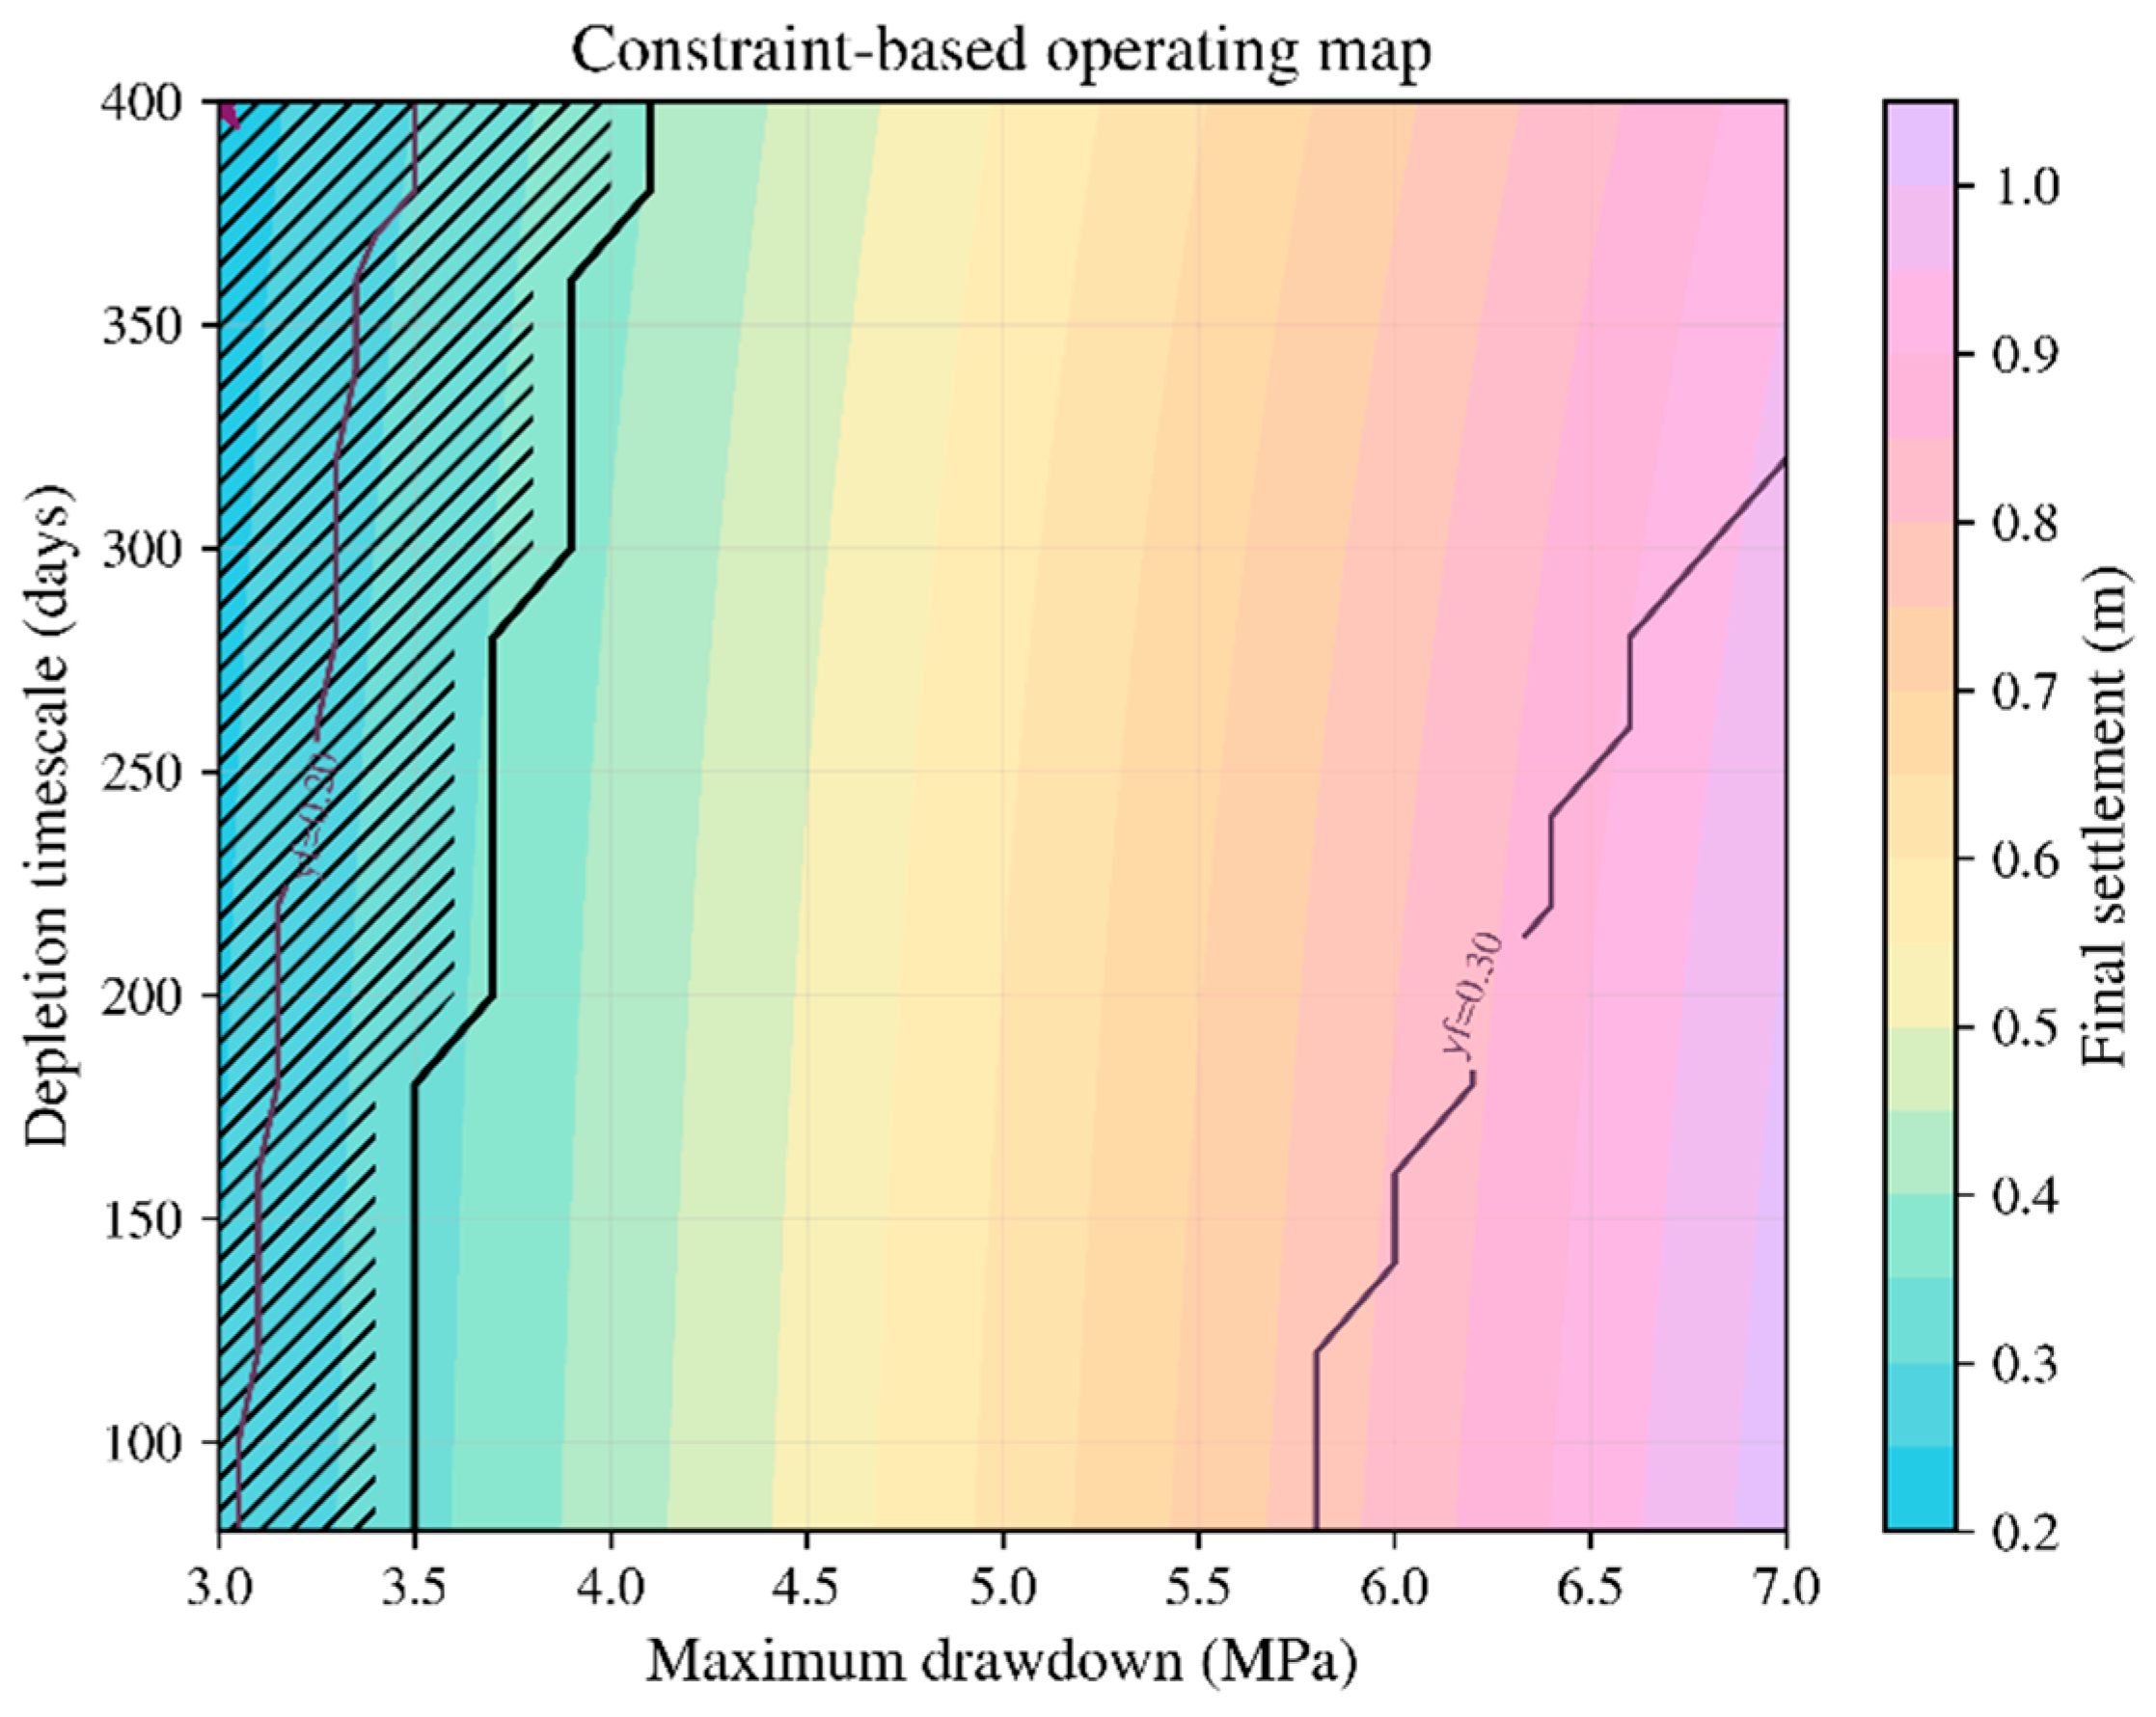
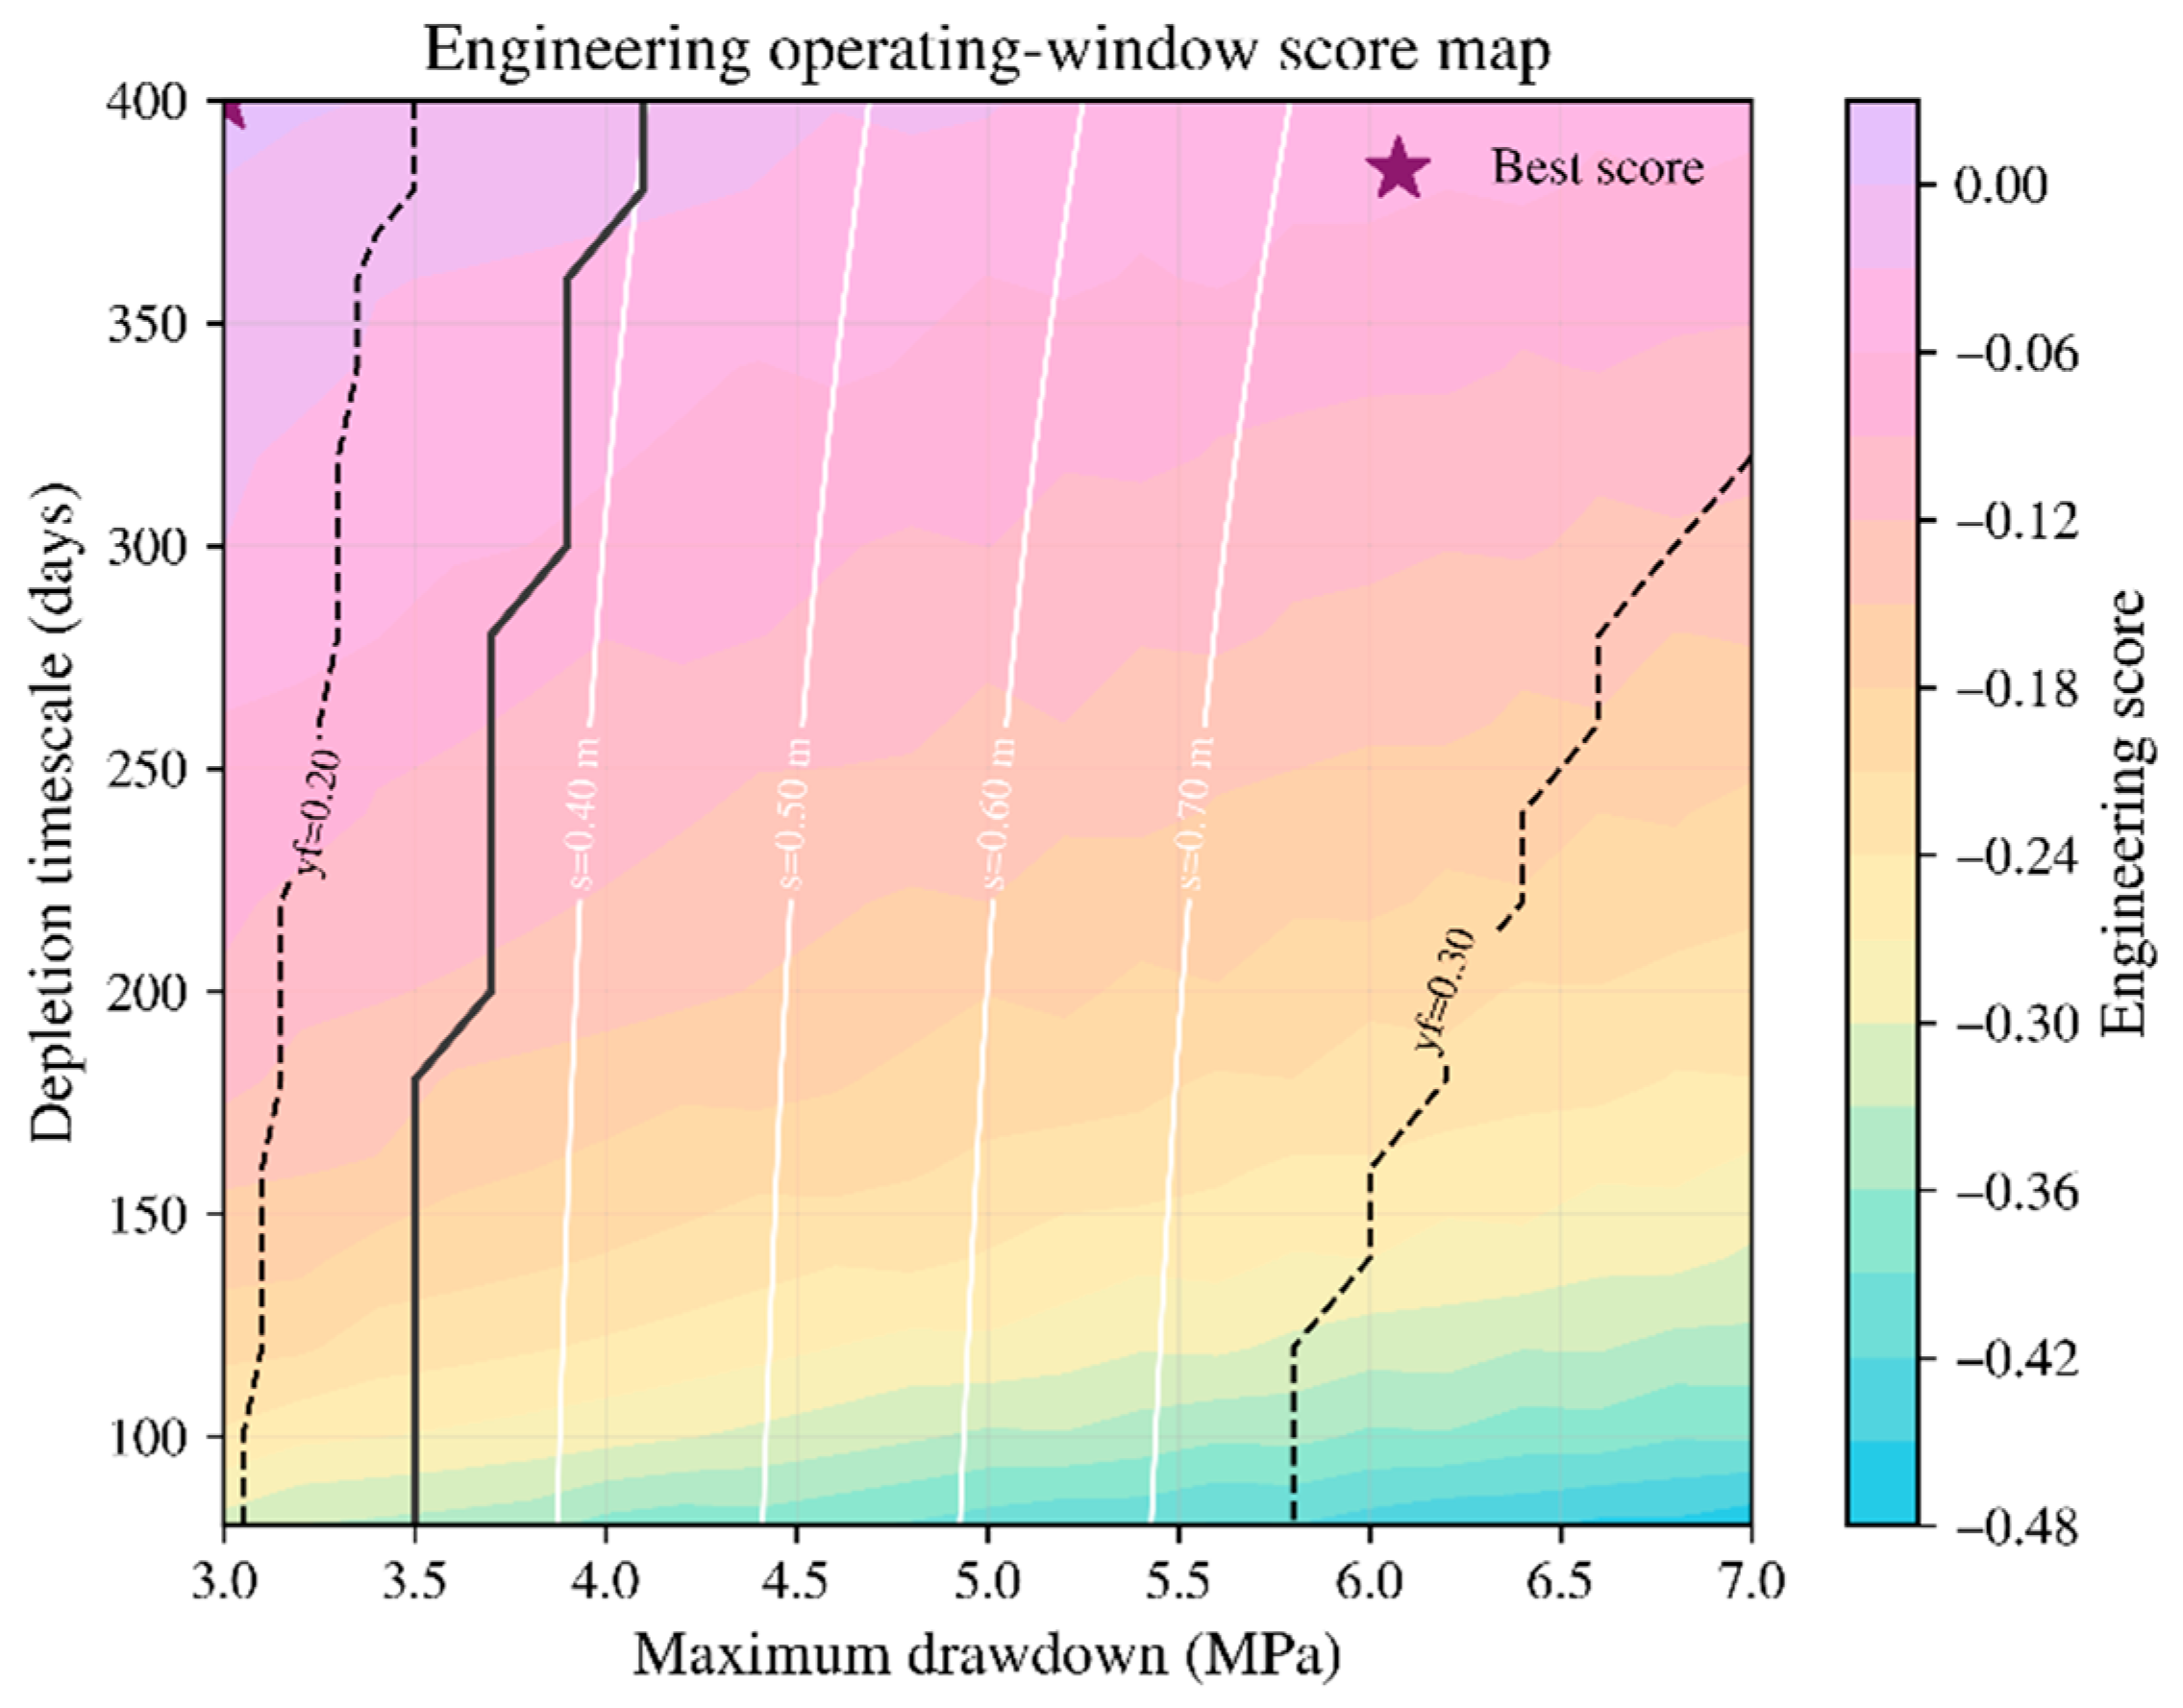
Following a comparison of the effects of all of the investigated parameters, a practical and engineering-related screening parameter is proposed to score the selection of operating parameters. Based on this, the optimum operating parameters are quantified and proposed. The proposed composite score is defined as follows:
J = 1.00 Δ p m a x 5 MPa 0.55 s f 0.6 m 0.45 η y , f 0.25 0.12 220 d τ dep
where s f is the final settlement and η y , f is the final yielded-thickness fraction. In addition, a feasibility screen is imposed:
s f 0.55 m
η y , f 0.22
These thresholds are screening limits that we chose to illustrate how the method can be used for operational decision support. The scoring results are shown in Figure 13 and Figure 14.
The optimization results show that the highest score lies at the conservative corner of the admissible domain, close to 3.0 MPa maximum drawdown and 400 d depletion timescale, because the geomechanical risks presented by deformation become increasingly severe as the operation becomes more aggressive. However, from a more balanced engineering viewpoint, the feasible region with the best compromise between productivity performance and geomechanical risk is concentrated around 3.6–4.0 MPa maximum drawdown and 340–400 d depletion timescale. Under the current screening criteria, 4.0 MPa is the highest feasible drawdown, and only when the depletion timescale is sufficiently long. This result indicates that an operator can still retain moderate depletion efficiency if the depletion schedule is slowed enough to delay stress transfer and suppress plastic-zone growth.
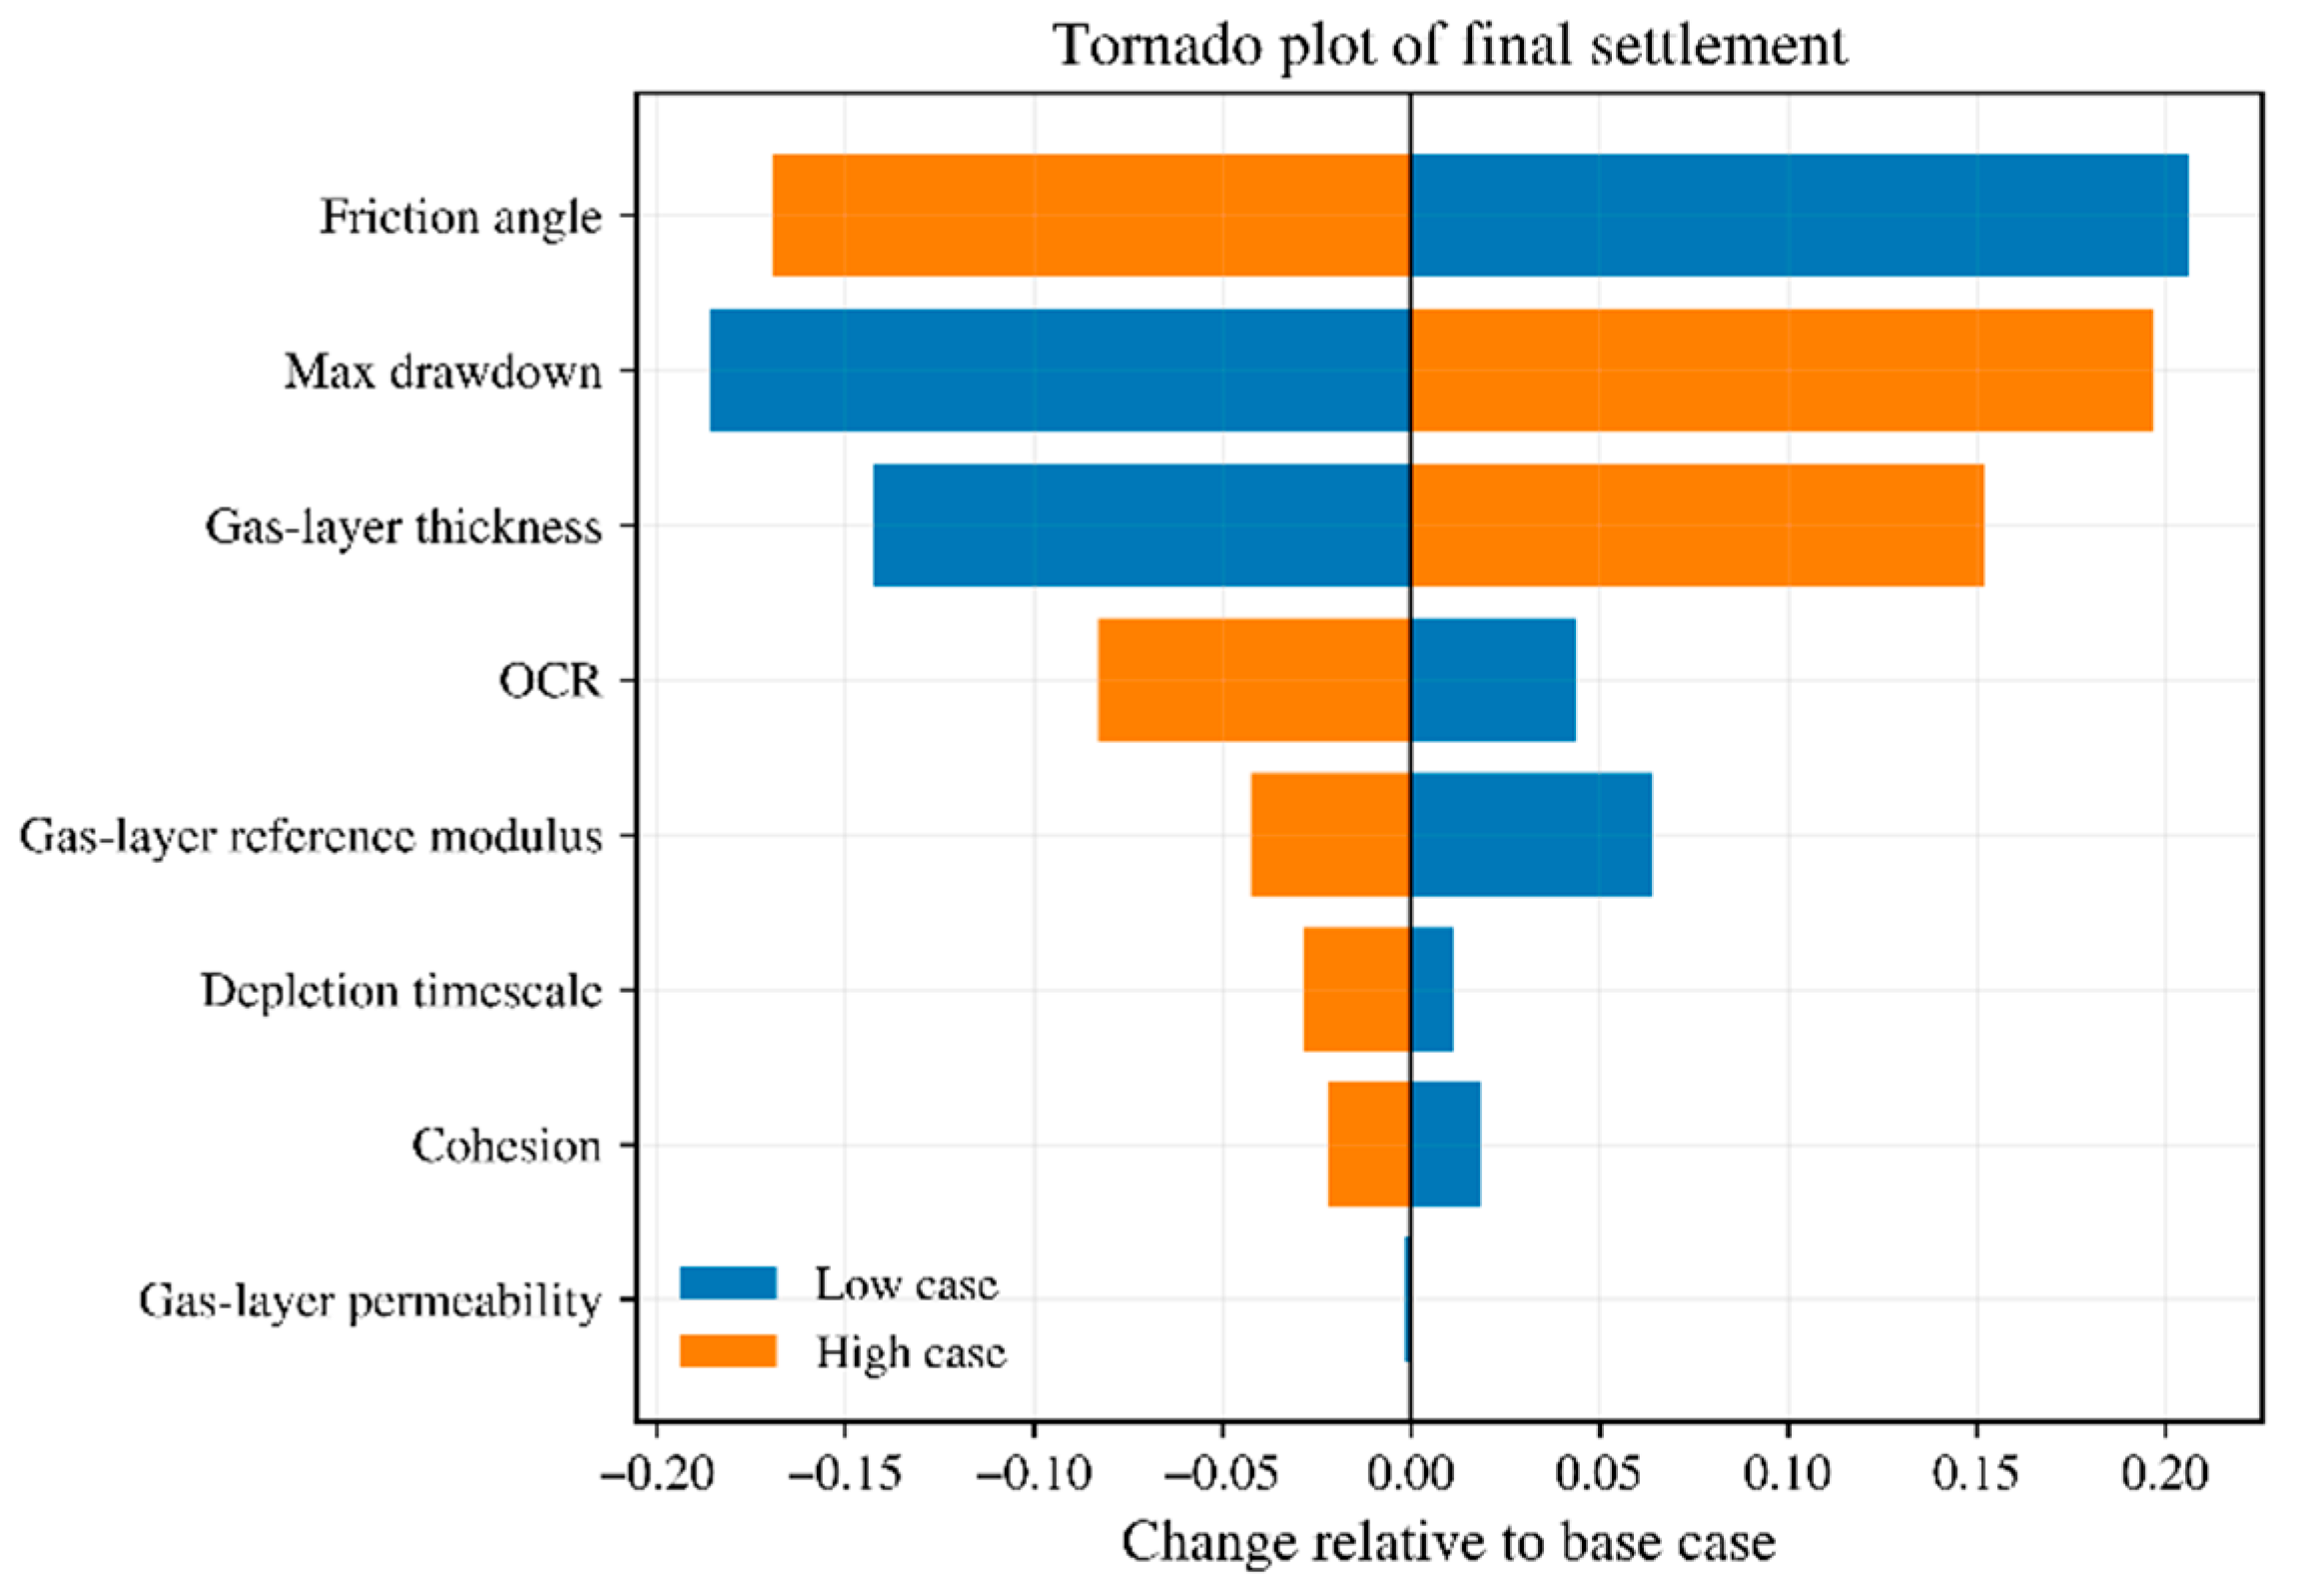
As shown in Figure 15, the most significant effect on the final settlement is attributed to friction angle, followed by maximum drawdown, gas-layer thickness, and OCR. In the present parameter range, the friction angle changes the final settlement by up to about 34.5%; maximum drawdown alters it by about 33.0%; gas-layer thickness changes it by around 25.4%; and OCR results in a change of approximately 13.9%. By contrast, gas-layer permeability has very little impact. This indicates that, once the depletion history has been imposed at the reservoir boundary, the long-term total settlement is governed more by stress redistribution and mechanical resistance than by further changes in gas-layer transmissibility.
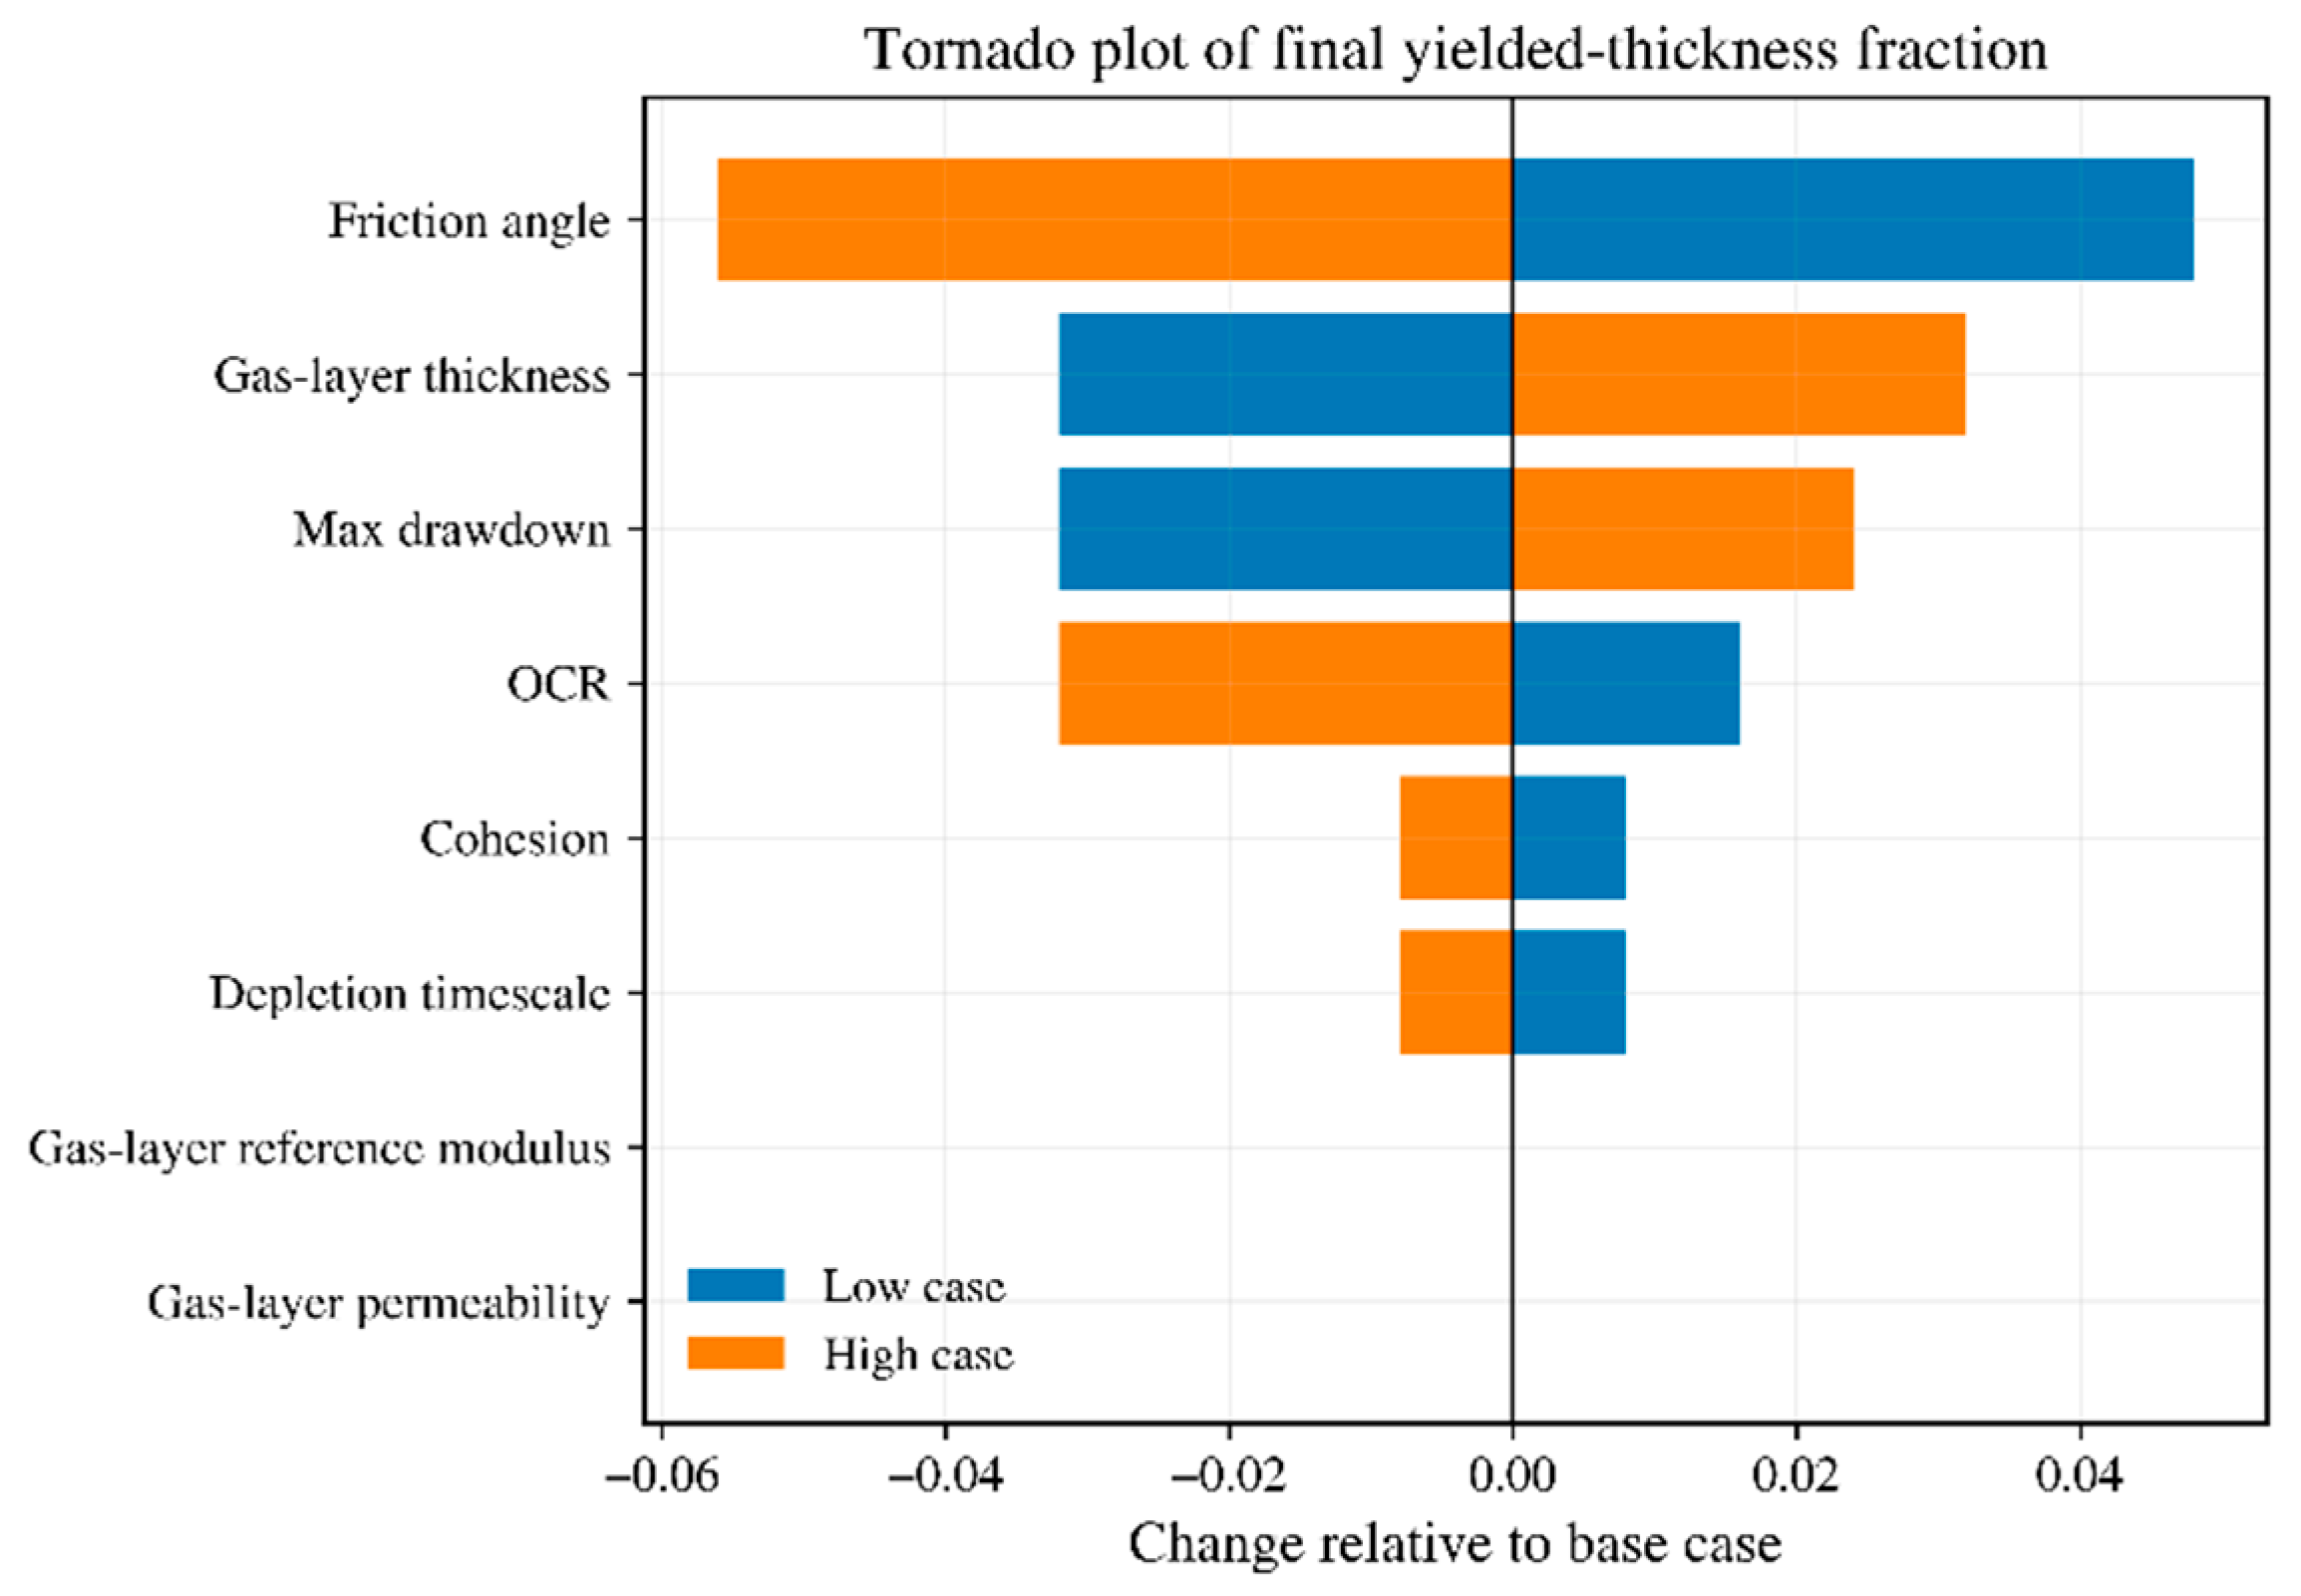
Figure 16 reveals a similar ranking pattern with certain discrepancies for the sensitivity analysis of the final yielded-thickness fraction in the entire sediment column. The friction angle is the dominant parameter, followed by gas-layer thickness, maximum drawdown, and OCR. Cohesion and the depletion timescale have secondary effects, and the effects of gas-layer permeability and gas-layer reference modulus are nearly negligible in terms of the final yielded-thickness fraction. This difference between settlement sensitivity and yield-fraction sensitivity is important. A parameter may change the total deformation without changing the extent of the yielding, and vice versa.
Based on the sensitivity analyses, several practical observations for deepwater shallow gas development can be summarized. Not all key parameters act in the same way. Drawdown amplitude primarily controls the magnitude of stress amplification, while the depletion timescale controls how quickly the system approaches critical conditions. Strength-related parameters, especially the friction angle and OCR, strongly affect whether yielding remains localized or expands to a broader interval. Operating-window optimization should be constraint-based rather than maximizing the drawdown pressure, as a production schedule based on progressive depletion can quickly become unacceptable once rapid settlement and yielded thickness have been triggered.
It should be emphasized that the present composite score is not intended as a universal criterion, but as a case-specific decision-support index for the deepwater shallow gas-bearing sediment system considered here. In the present study, the score is constructed based on the two dominant geomechanical response metrics, namely the final settlement and final yielded-thickness fraction, because these two quantities are directly relevant to seabed deformation risk and structural integrity concerns in shallow, weakly consolidated sediments. The selected feasibility thresholds are likewise illustrative and project-dependent. For practical field application, the same screening framework can be retained, but the selected response metrics, their relative weighting, and the admissible thresholds should be recalibrated according to site-specific geological conditions, production objectives, allowable wellhead and conductor deformation, and other engineering constraints.

4.2. Quantified Discussion

To provide compact mathematical quantification of the plotted responses, the numerical results may also be interpreted by several reduced-order proxy expressions consistent with the present one-dimensional semi-analytical framework.
First, the imposed depletion at the reservoir base may be written as follows:
Δ p b t = Δ p m a x 1 e t / τ d e p ,
where Δ p m a x is the maximum drawdown and τ d e p is the depletion timescale. The hydraulic diffusivities of the overburden and gas layer are
c o v e r = k o v e r μ S o v e r , c g a s = k g a s μ S g a s .
Accordingly, the vertical pore-pressure profile at time t may be approximated in piecewise form as
Δ p z , t Δ p t t e r f c 0 z H o v e r , Δ p t t + Δ p b t Δ p t t z H o v e r H g a s , H o v e r < z H o v e r + H g a s ,
where z is the depth measured downward from the seabed, H o v e r is the overburden thickness, H g a s is the gas-layer thickness, and Δ p t t is the pressure drawdown at the top of the gas layer. This expression captures the main features observed in the calculated profiles, namely the strong early depletion in the gas layer and lower overburden, together with the delayed upward propagation and progressive smoothing of the pressure disturbance within the tighter overburden.
The effect of depletion timescale on pressure at the top of the gas layer can be described by a first-order lag relation,
τ g d Δ p t d t + Δ p t = Δ p b t ,
where the characteristic transfer timescale of the gas layer may be approximated by
τ g H g a s 2 π 2 c g a s .
Substituting the exponential depletion boundary into the above equation gives the following closed-form approximation:
Δ p t t ; τ d e p Δ p m a x 1 τ d e p e t / τ d e p τ g e t / τ g τ d e p τ g .
This relation shows directly that τ d e p mainly controls the rate at which the interface pressure approaches its long-term drawdown state. A shorter depletion timescale produces a faster early increase in pressure drawdown at the gas-layer top, whereas the long-term limit remains governed by the same final drawdown magnitude. Therefore, the depletion timescale primarily acts as a kinetic control on hydraulic disturbance transfer and the associated stress evolution.
The temporal evolution of the yielded-thickness fraction under different cohesion values can be expressed directly from the present Mohr–Coulomb-based formulation as
η y t ; c = 1 H 0 H I q z , t M ϕ p z , t d c > 0 d z ,
where H = H o v e r + H g a s is the total thickness, I is the indicator function, and
M ϕ = 6 s i n ϕ 3 s i n ϕ , d c = 6 c c o s ϕ 3 s i n ϕ .
This expression indicates that cohesion affects the yielded-thickness fraction only through the Mohr–Coulomb intercept term d c , while the hydraulic diffusion field remains unchanged. Therefore, cohesion mainly shifts the yielding threshold rather than the pressure evolution itself. For further interpretation, if the stress driving term is approximated by an exponentially decaying depth function with monotonic temporal buildup,
q z , t M ϕ p z , t A 0 t e x p H z l y
with
A 0 t = A 1 e t / τ y ,
then the yielded-thickness fraction may be approximated as
η y t ; c l y H l n A 1 e t / τ y d c + ,
where x + = m a x x , 0 . This proxy expression explains why increasing cohesion results in only a moderate reduction in the yielded-thickness fraction in the present results. Since cohesion enters through the denominator inside a logarithmic form, its influence on plastic-zone growth is expected to be systematic but not dramatic, which is consistent with the relatively small separation among the cohesion-comparison curves.

5. Conclusions

In this study, we developed a semi-analytical two-layer and coupled flow-geomechanical model for deepwater shallow gas-bearing sediments and their overburden. The model combines transient pore pressure diffusion, stress-dependent nonlinear elastic compression, and a Mohr–Coulomb yield plastic correction. Within the scope of the present assumptions and representative parameter settings, it provides a practical engineering strategy for rapid mechanism analysis and engineering screening of depletion-induced deformation in deepwater shallow gas-bearing sediments.
Our main conclusions are as follows:
(1)
The proposed framework captures the coupled response of both the gas layer and the overburden. In the base case, the final settlement is 0.597 m, the first yield occurs at about 115 d, and the final yielded-thickness fraction is 0.268, indicating that depletion-induced deformation is controlled by both nonlinear compression and plastic accumulation.
(2)
The sensitivity analysis shows that the dominant controls affecting settlement and yielding are friction angle, maximum drawdown, gas-layer thickness, and OCR. Drawdown amplitude primarily affects stress magnitude and long-term settlement, while the depletion timescale mainly controls early stress evolution kinetics and the timing of yield initiation.
(3)
The engineering operating maps indicate that the feasible region is concentrated in the low-to-moderate drawdown and slow depletion range. Under the current screening constraints, a practical operating window has about 3.6–4.0 MPa maximum drawdown with a depletion timescale of 340–400 d. More aggressive schedules can substantially increase settlement and yielded-thickness growth risks even if the final depletion target appears to be satisfactory from a production perspective.
(4)
The sensitivity analysis indicates that not all parameters influence the model outputs in the same manner. The depletion timescale mainly governs the rate at which pressure disturbance and stress redistribution propagate and therefore strongly affects the timing of yield initiation and short- to medium-term geomechanical risk. By contrast, maximum drawdown mainly governs the magnitude of long-term stress change and settlement. Cohesion affects the yielded-thickness fraction through the yield threshold, but its influence is comparatively moderate within the investigated range. Gas-layer permeability has only a limited effect on the final deformation metrics in the present formulation because the depletion history is imposed at the production boundary; under this condition, the long-term response is controlled more strongly by stress evolution and geomechanical resistance than by additional variation in gas-layer transmissibility.
(5)
From an engineering perspective, the present model can be used in a stepwise screening manner. Representative hydraulic, mechanical, and operating parameters are assigned for the gas layer and overburden, including the thickness, permeability, storage coefficient, Biot coefficient, modulus parameters, strength parameters, OCR, maximum drawdown, and depletion timescale. The model is used to calculate vertical pore-pressure profiles, interface pressure evolution, settlement partition, stress-path migration, and yielded-thickness fraction. These outputs can be compared across scenarios to rank controlling factors, identify conservative operating conditions, and screen whether a planned drawdown schedule is likely to induce excessive settlement or plastic-zone growth. Therefore, the proposed reduced-order expressions and the semi-analytical framework are most useful for rapid scenario comparison, preliminary operating-window assessment, and sensitivity ranking before more detailed site-specific numerical simulations are conducted.
(6)
The current operating-window results should be interpreted cautiously as case-specific screening outcomes rather than universal field-design recommendations. The model is best suited for preliminary analysis of laterally extensive, vertically dominated, depletion-controlled shallow gas systems. More rigorous field application would require site-specific laboratory calibration, improved geological characterization, and benchmarking against higher-dimensional coupled numerical models, especially for situations in which lateral heterogeneity, fault proximity, non-monotonic pressure histories, or large deformation may become important.
The present model is intended to be used as an efficient engineering-related screening strategy, and several refinements remain necessary prior to its broader application. Future studies should incorporate site-specific oedometer and triaxial calibration, adopt more advanced constitutive formulations for cohesive marine sediments, and extend the current one-dimensional two-layer model to more realistic multilayer and multidimensional conditions. In addition, the proposed screening framework should be coupled with field monitoring, well integrity limits, and production targets, allowing the method to be generalized from mechanism analysis to practical engineering optimization.

Author Contributions

Conceptualization, X.G. and G.T.; methodology, X.G.; investigation, G.T., G.X.; writing—original draft preparation, G.T., X.G.; writing—review and editing, X.G., S.S., Z.Y.; visualization, Y.L., G.X.; supervision, Z.Y.; project administration, Z.Y., Y.L.; funding acquisition, Z.Y. All authors have read and agreed to the published version of the manuscript.

Funding

This research was funded by the National Key R&D Program of China (Grant No. 2024YFC3014002), the National Natural Science Foundation of China (Grant No. 52574018, Grant No. U25B20163), and the Frontier Interdisciplinary Exploration Research Program of China University of Petroleum, Beijing (Grant No. 2462024XKQY003) and The APC was funded by National Key R&D Program of China.

Data Availability Statement

The data used in this study can be made available upon request.

Conflicts of Interest

Authors Gang Tong, Zhiming Yin, and Guoxian Xu were employed by the company CNOOC Research Institute Ltd. The remaining authors declare that the research was conducted in the absence of any commercial or financial relationships that could be construed as a potential conflict of interest.

References

  1. Xu, C.; Wu, K.; Pei, J.; Hu, L. Enrichment mechanisms and accumulation model of ultra-deep water and ultra-shallow gas: A case study of Lingshui 36-1 gas field in Qiongdongnan Basin, South China Sea. Pet. Explor. Dev. 2025, 52, 50–63. [Google Scholar] [CrossRef]
  2. Lu, H.; Lu, C.; Huang, L.; Tan, C.; Qiao, M. Testing system and experimental study on pressure parameters of natural gas hydrate core samples. Pet. Sci. Bull. 2025, 10, 156–168. [Google Scholar] [CrossRef]
  3. Guo, X.; Kim, J.; Killough, J.E. Hybrid MPI–OpenMP scalable parallelization for coupled non-isothermal fluid–heat flow and elastoplastic geomechanics. In Proceedings of the SPE Reservoir Simulation Conference, Montgomery, TX, USA, 20–22 February 2017; p. D011S003R008. [Google Scholar]
  4. Dumitrache, L.; Nistor, I.; Suditu, S.; Badea, A.M. Simulating salt precipitation in dry gas reservoirs using ECLIPSE thermal CO2STORE. Rev. Chim. 2018, 69, 251–254. [Google Scholar] [CrossRef]
  5. Biot, M.A. General theory of three-dimensional consolidation. J. Appl. Phys. 1941, 12, 155–164. [Google Scholar] [CrossRef]
  6. Biot, M.A. General solutions of the equations of elasticity and consolidation for a porous material. J. Appl. Mech. 1956, 23, 91–96. [Google Scholar] [CrossRef]
  7. Rice, J.R.; Cleary, M.P. Some basic stress diffusion solutions for fluid-saturated elastic porous media with compressible constituents. Rev. Geophys. 1976, 14, 227–241. [Google Scholar] [CrossRef]
  8. Rutqvist, J. Status of the TOUGH-FLAC simulator and recent applications related to coupled fluid flow, geomechanics and thermal processes. Comput. Geosci. 2011, 37, 739–750. [Google Scholar] [CrossRef]
  9. Musso, G.; Volonté, G.; Gemelli, F.; Corradi, A.; Nguyen, S.; Lancellotta, R.; Brignoli, M.; Mantica, S. Evaluating the subsidence above gas reservoirs with an elasto-viscoplastic constitutive law: Laboratory evidences and case histories. Geomech. Energy Environ. 2021, 28, 100246. [Google Scholar] [CrossRef]
  10. Wouters, M.C.; Govers, R.; Hanssen, R.F. Development of an efficient model to calculate subsidence above the Groningen gas field. Neth. J. Geosci. 2025, 104. [Google Scholar] [CrossRef]
  11. Wu, T.; Chen, J.; Zhang, Q.; Zhao, X.; Guo, M.; Cheng, F. Tomography method of cemented sand based on constant gradient coded 1D T2 spectrum. Well Log. Technol. 2024, 48, 190–197. [Google Scholar]
  12. Nagel, N.B. Compaction and subsidence issues within the petroleum industry: From Wilmington to Ekofisk and beyond. Phys. Chem. Earth A 2001, 26, 3–14. [Google Scholar] [CrossRef]
  13. Van Thienen-Visser, K.; Fokker, P.A. The future of subsidence modelling: Compaction and subsidence due to gas depletion of the Groningen gas field in the Netherlands. Neth. J. Geosci. 2018, 96, 105–116. [Google Scholar] [CrossRef]
  14. Feng, G.; Zhu, C.; Wang, X.; Tang, S. Thermal effects on prediction accuracy of dense granite mechanical behaviors using modified maximum tangential stress criterion. J. Rock Mech. Geotech. Eng. 2023, 15, 1734–1748. [Google Scholar] [CrossRef]
  15. Geertsma, J. Land subsidence above compacting oil and gas reservoirs. J. Pet. Technol. 1973, 25, 734–744. [Google Scholar] [CrossRef]
  16. Hettema, M.; Papamichos, E.; Schutjens, P.M.T.M. Subsidence delay: Field observations and analysis. Oil Gas Sci. Technol. 2002, 57, 443–458. [Google Scholar] [CrossRef]
  17. Huang, L.; Jiang, P.; Zhao, X.; Yang, L.; Lin, J.; Guo, X. A modeling study of the productivity of horizontal wells in hydrocarbon-bearing reservoirs: Effects of fracturing interference. Geofluids 2021, 2021, 2168622. [Google Scholar] [CrossRef]
  18. Duncan, J.M.; Chang, C.Y. Nonlinear analysis of stress and strain in soils. J. Soil Mech. Found. Div. 1970, 96, 1629–1653. [Google Scholar] [CrossRef]
  19. Jardine, R.J.; Symes, M.J.; Burland, J.B. The measurement of soil stiffness in the triaxial apparatus. Géotechnique 1984, 34, 323–340. [Google Scholar] [CrossRef]
  20. Waite, W.F.; Santamarina, J.C.; Cortes, D.D.; Dugan, B.; Espinoza, D.N.; Germaine, J.; Jang, J.; Jung, J.W.; Kneafsey, T.J.; Shin, H.; et al. Physical properties of hydrate-bearing sediments. Rev. Geophys. 2009, 47, RG4003. [Google Scholar] [CrossRef]
  21. Wei, J.; Yang, L.; Liang, Q.; Liang, J.; Lu, J.; Zhang, W.; Zhang, X.; Lu, X. Geomechanical properties of gas hydrate-bearing sediments in Shenhu area of the South China Sea. Energy Rep. 2021, 7, 6779. [Google Scholar] [CrossRef]
  22. Hyodo, M.; Yoneda, J.; Yoshimoto, N.; Nakata, Y. Mechanical and dissociation properties of methane hydrate-bearing sand in deep seabed. Soils Found. 2013, 53, 299–314. [Google Scholar] [CrossRef]
  23. Hyodo, M.; Li, Y.; Yoneda, J.; Nakata, Y.; Yoshimoto, N.; Nishimura, A.; Song, Y. Mechanical behavior of gas-saturated methane hydrate-bearing sediments. J. Geophys. Res. Solid Earth 2013, 118, 5185–5194. [Google Scholar] [CrossRef]
  24. Kajiyama, S.; Hyodo, M.; Nakata, Y.; Yoshimoto, N.; Wu, Y.; Kato, A. Shear behaviour of methane hydrate bearing sand with various particle characteristics and fines. Soils Found. 2017, 57, 672–684. [Google Scholar] [CrossRef]
  25. Priest, J.A.; Hayley, J.L. Strength of laboratory synthesized hydrate-bearing sands and their relationship to natural hydrate-bearing sediments. J. Geophys. Res. Solid Earth 2019, 124, 12556–12576. [Google Scholar] [CrossRef]
  26. Chen, M.; Li, Y.; Merey, Ş.; Wu, N.; Hu, Q.; Zhang, Y.; Dong, L.; Yu, G.; Jiang, H. Review on the test methods and devices for mechanical properties of hydrate-bearing sediments. Sustainability 2022, 14, 6239. [Google Scholar] [CrossRef]
  27. Zhao, Y.; Hu, G.; Liu, L.; Liu, C.; Wan, Y.; Bu, Q.; Ji, Y.; Zhang, Z.; Kong, L. Mechanical properties of gas hydrate-bearing sediments: Research progress, challenges and perspectives. Earth-Sci. Rev. 2025, 262, 105058. [Google Scholar] [CrossRef]
  28. Zhang, Y.; Jeng, D.S.; Gao, F.P.; Zhang, J.-S. An analytical solution for response of a porous seabed to combined wave and current loading. Ocean Eng. 2013, 57, 240–247. [Google Scholar] [CrossRef]
  29. Liao, C.C.; Jeng, D.S.; Zhang, L.L. An analytical approximation for dynamic soil response of a porous seabed due to combined wave and current loading. J. Coast. Res. 2015, 315, 1120–1128. [Google Scholar] [CrossRef]
  30. Foo, C.S.X.; Liao, C.; Chen, J. Two-dimensional numerical study of seabed response around a buried pipeline under wave and current loading. J. Mar. Sci. Eng. 2019, 7, 66. [Google Scholar] [CrossRef]
  31. Luo, F.; Zhong, L.; Wang, Z.; Li, Z.; Zhu, B.; Zhao, X.; Guo, X.; Lin, J. An efficient numerical model for the evaluation of productivity considering depletion-induced plastic behaviors in weakly consolidated reservoirs. Energies 2025, 18, 892. [Google Scholar] [CrossRef]
  32. He, Y.; Jeng, D.S. Wave-induced seabed stability in an infinite porous seabed: Effects of phase-lags. J. Mar. Sci. Eng. 2025, 13, 1397. [Google Scholar] [CrossRef]
  33. Guo, X.; Jin, Y.; Miu, T.; Wei, S.; Xia, Y.; Tang, J. Investigation of the time-dependent and dynamic geomechanical behaviors induced by depressurization in natural gas hydrate-bearing sediments based on a poro-elasto-viscoplastic-dynamic model. Int. J. Rock Mech. Min. Sci. 2026, 197, 106357. [Google Scholar] [CrossRef]
  34. Xing, X.; Yuan, J.; Li, Z.; Sun, C.; Zhao, Y. Determination of formation fracture pressure under high temperature and high pressure in deep water of the South China Sea. Pet. Drill. Tech. 2023, 51, 18–24. [Google Scholar]
  35. Chen, J.; Xie, Y.; Wang, T.; Zhou, H.; Zhang, Z.; Li, Y.; Zhang, S.; Deng, W. Seismic prediction of shallow unconsolidated sand in deepwater areas. J. Mar. Sci. Eng. 2025, 13, 1044. [Google Scholar] [CrossRef]
  36. Yang, T.; Li, X.; Jin, J.; Chen, J.; Gong, Z.; Zhao, L.; Wang, W.; Liu, B.; Hu, J.; Wang, W.; et al. Shallow gas distribution influenced by the interface of sedimentary facies in the southwest of the Qiongdongnan Basin. J. Mar. Sci. Eng. 2025, 13, 301. [Google Scholar] [CrossRef]
  37. Sun, J.; Ning, F.; Liu, T.; Liu, C.; Chen, Q.; Li, Y.; Cao, X.; Mao, P.; Zhang, L.; Jiang, G. Gas production from a silty hydrate reservoir in the South China Sea using hydraulic fracturing: A numerical simulation. Energy Sci. Eng. 2019, 7, 2452–2472. [Google Scholar] [CrossRef]
  38. Jiang, M.J.; Liu, A.S.; Li, G.S. Macro- and micro-characteristics and mechanical properties of deep-sea sediment from South China Sea. Chin. J. Geotech. Eng. 2023, 45, 618–626. [Google Scholar]
  39. Wang, Y.; Zhang, S.; Ren, Y.; Qi, Z.; Yang, Q. Characterization of engineering properties of deep-water soils in the South China Sea. Eng. Geol. 2023, 320, 107138. [Google Scholar] [CrossRef]
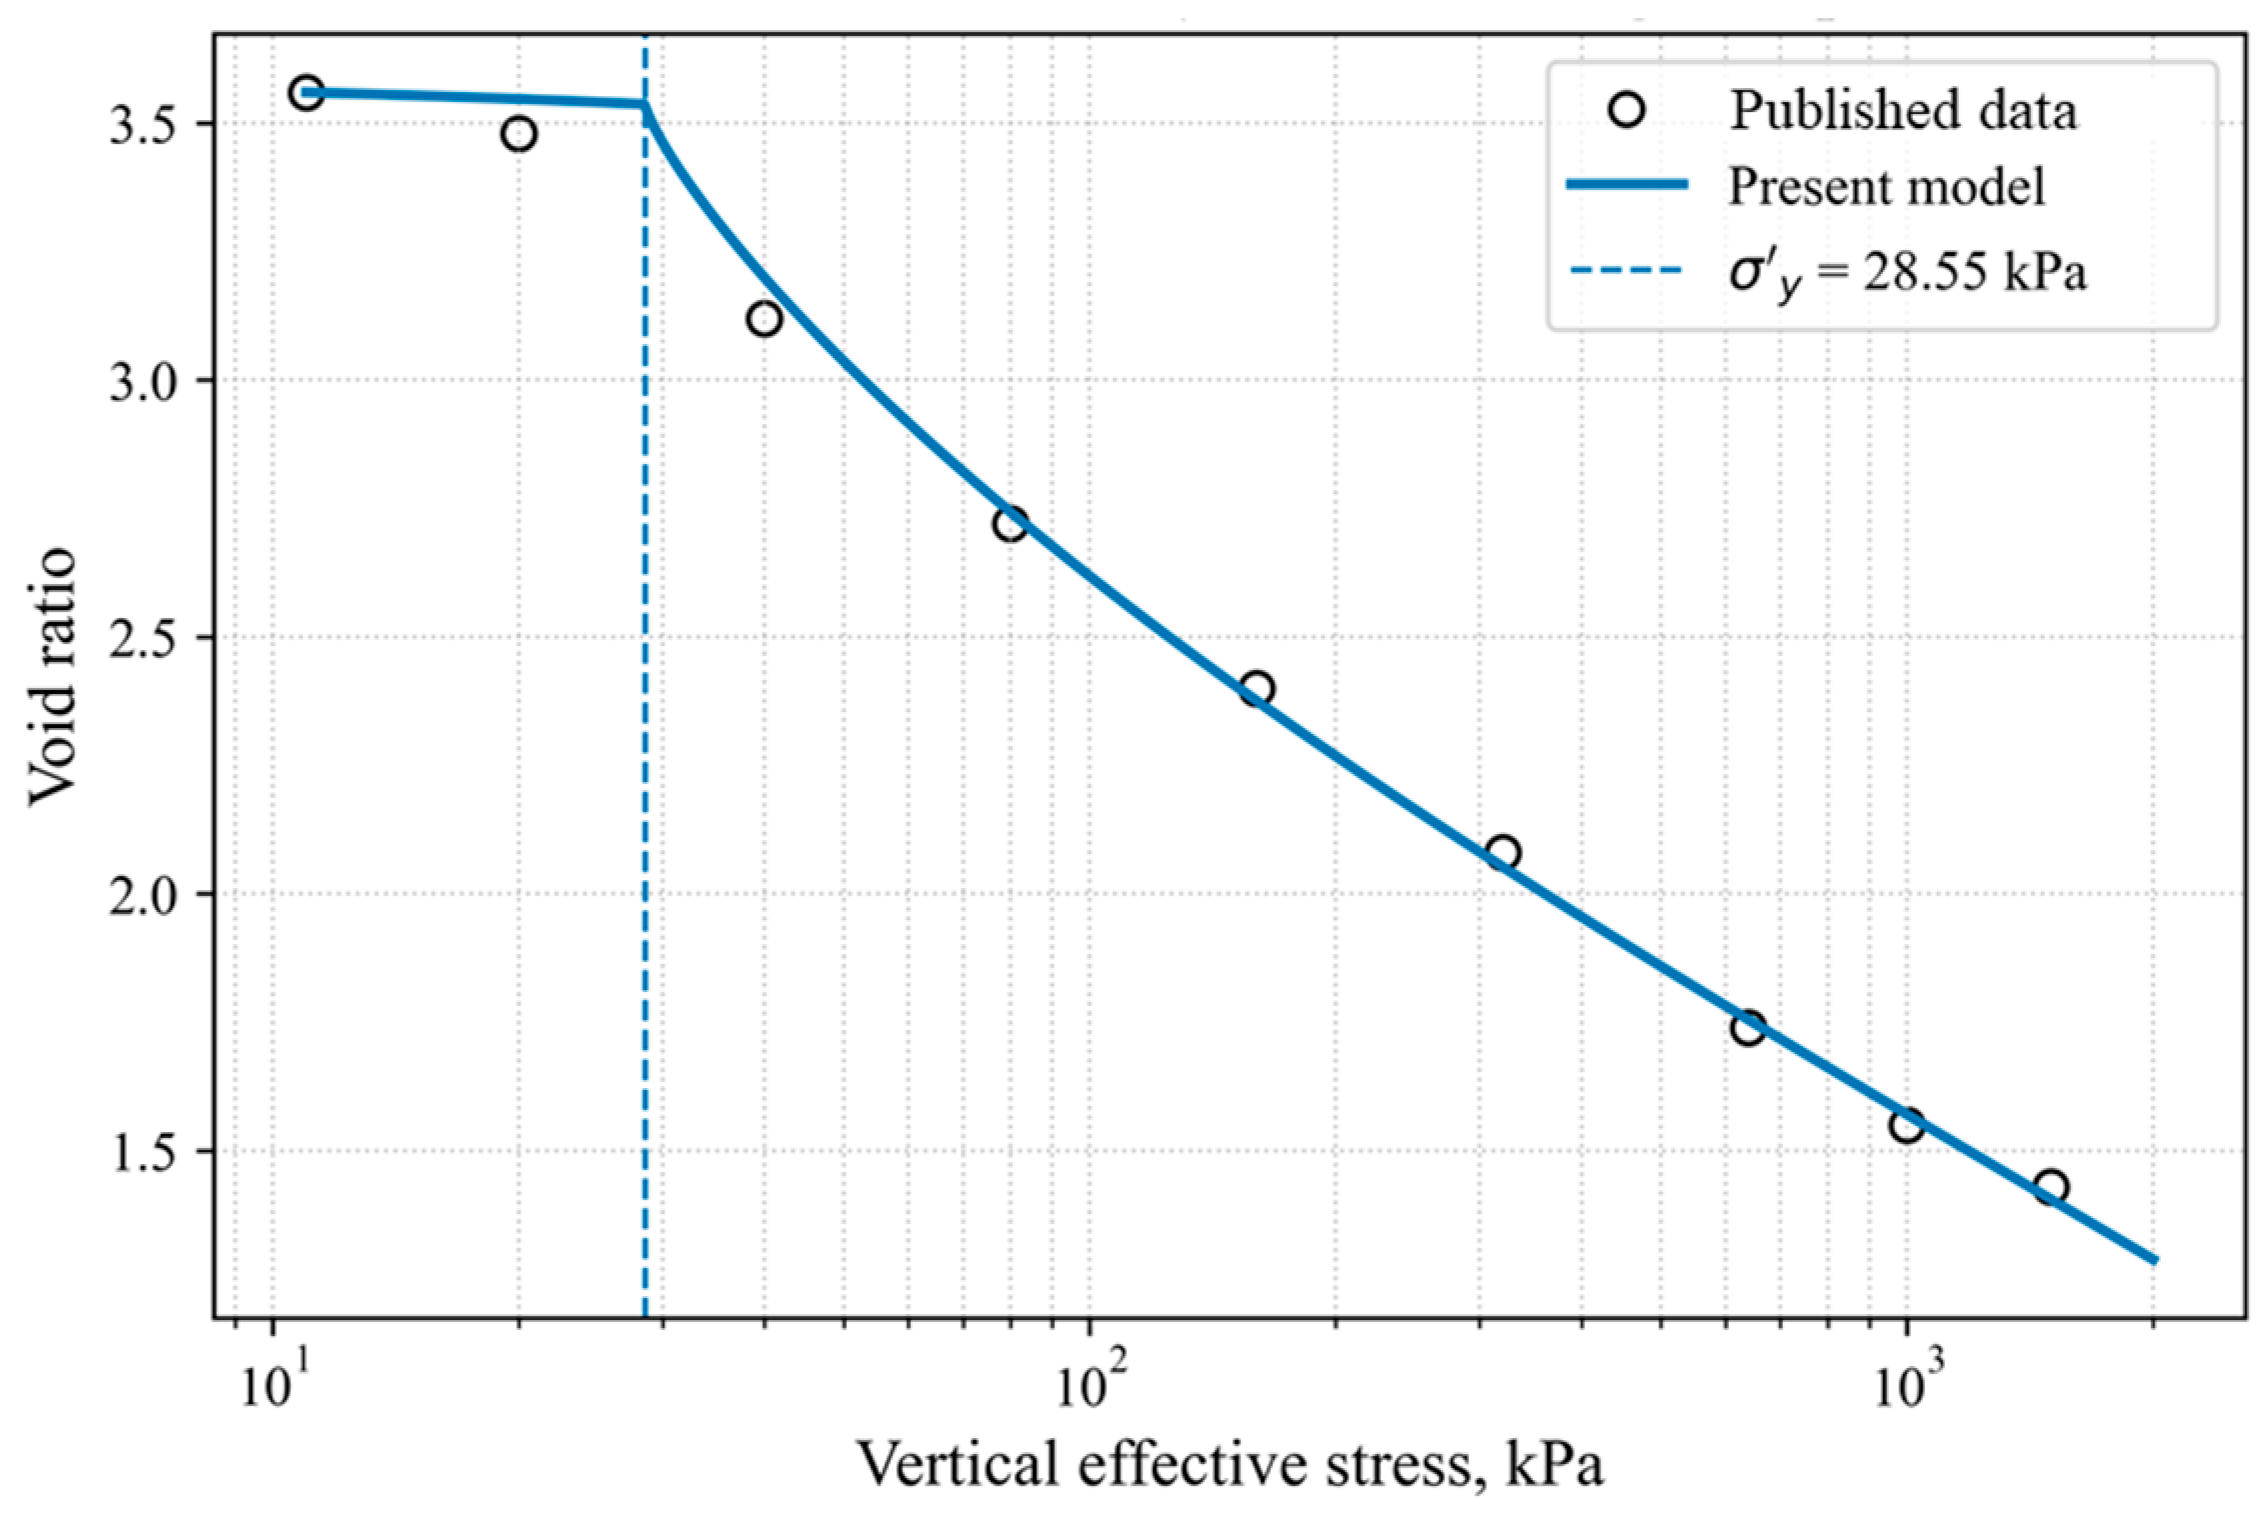
Figure 1. Model validation against a published dataset.
Jmse 14 00937 g001
Figure 2. The prescribed depletion history for gas production in the shallow gas-bearing layer.
Jmse 14 00937 g002
Figure 3. The vertical pore pressure profiles (including pressure drawdown) at different production time steps.
Jmse 14 00937 g003
Figure 4. The temporal evolution of seabed settlement and its elastic and plastic fractions.
Jmse 14 00937 g004
Figure 5. The stress paths at different monitoring locations.
Jmse 14 00937 g005
Figure 6. The temporal evolution of yielded thickness in terms of fraction.
Jmse 14 00937 g006
Figure 7. The effect of depletion timescale on pressure at the top of the gas layer in the base case.
Jmse 14 00937 g007
Figure 8. The effect of the depletion timescale on pressure at the top of the gas layer.
Jmse 14 00937 g008
Figure 9. The effect of maximum drawdown on deviatoric stress in the gas layer.
Jmse 14 00937 g009
Figure 10. The effect of maximum drawdown on seabed settlement.
Jmse 14 00937 g010
Figure 11. The effect of sediment friction angle on the final yield state distribution.
Jmse 14 00937 g011
Figure 12. The effect of cohesion on the temporal evolution of yielded-thickness fraction.
Jmse 14 00937 g012
Figure 13. The operating parameter map considering the depletion timescale and maximum drawdown for the final seabed settlement.
Jmse 14 00937 g013
Figure 14. The score map and best recommendation for depletion timescale and drawdown pressure combinations.
Jmse 14 00937 g014
Figure 15. The tornado plot for the sensitivity analysis for final settlement.
Jmse 14 00937 g015
Figure 16. The tornado plot for the sensitivity analysis for the yielded-thickness fraction.
Jmse 14 00937 g016
Table 1. Typical modeling parameters for the overburden and gas layers.
ParameterSymbolOverburdenGas LayerUnit
Thickness H 20025m
Permeability k 4.0 × 10 16 1.5 × 10 13 m2
Specific storage S s 5.0 × 10 8 1.2 × 10 7 Pa−1
Biot coefficient α 0.920.88
Effective unit weight γ 7.48.2kN/m3
Reference constrained modulus M ref 320190MPa
Modulus exponent m 0.220.18
Reference Poisson ratio ν 0 0.190.16
Poisson ratio sensitivity a ν 0.0030.002
Table 2. The typical physical and mechanical properties of deepwater shallow sediments used for modeling.
ParameterSymbolValueUnit
Initial pore pressure p 0 9.0MPa
Maximum drawdown Δ p m a x 5.0MPa
Depletion timescale τ dep 220d
Fluid viscosity μ 1.1 × 10 3 Pa·s
Friction angle ϕ 22degree
Cohesion c 40kPa
Plastic coefficient β p 6.0 × 10 4
Plastic exponent n p 1.15
Overconsolidation ratioOCR1.25
Vertical effective-stress offset σ v , offset 20kPa
Disclaimer/Publisher’s Note: The statements, opinions and data contained in all publications are solely those of the individual author(s) and contributor(s) and not of MDPI and/or the editor(s). MDPI and/or the editor(s) disclaim responsibility for any injury to people or property resulting from any ideas, methods, instructions or products referred to in the content.