1. Introduction
With the continuous increase in offshore oil and gas field extraction depths in recent years, Floating Production Storage and Offloading (FPSO) units have garnered significant attention in the offshore oil and gas extraction sector [
1]. Compared to other offshore oil and gas platforms, cylindrical FPSO units offer advantages in deep-sea environments, including rapid construction speed, large oil storage capacity, and strong resistance to wind and waves [
2]. Therefore, to ensure operational safety and functional integrity under complex environmental loads, a robust mooring system is indispensable. Its primary objective is to confine the vessel within a specific equilibrium position to meet the requirements of risers and other subsea facilities [
3]. Unlike bottom-supported structures in shallow water, whose stability is primarily governed by seabed bearing capacity and complex soil-structure interactions, the operational safety of deep-water FPSOs is fundamentally dependent on the positioning performance of their mooring systems [
4,
5]. Therefore, as water depths increase, intensified environmental loads impose higher demands on positioning capability [
6,
7].
Design requirements and safety criteria for mooring systems are specified in industry standards [
8,
9,
10]. However, these regulations primarily ensure safety compliance through deterministic factors. Traditional design methods based on these standards often fail to effectively address the trade-off between cost and performance in a multi-variable design space. The application of global optimization algorithms, such as Genetic Algorithms (GA), Particle Swarm Optimization (PSO), and Differential Evolution, can overcome the constraints of conventional empirical approaches and local optimization traps [
11,
12,
13]. Therefore, the application of optimization algorithms to the design of cylindrical FPSO mooring systems is essential [
14]. Ja’e et al. [
15] established the MooOpT4FPSO mooring optimization framework by integrating an improved PSO algorithm with OrcaFlex. The tool is designed to minimize the total material cost of mooring lines while satisfying safety and geometric constraints. Combining NSGA-II with a vessel-mooring coupled model, Liang et al. [
16] established a multi-objective optimization framework for a shallow-water semi-submersible VLFS module. This allowed for computationally expensive time-domain dynamic responses to serve as objective functions. Gabardo et al. [
17] proposed an island-model distributed genetic algorithm that integrates time-domain coupled analysis into the optimization loop, achieving a super-linear speedup on a 528-core computing cluster to overcome the severe computational cost bottleneck. West et al. [
18] optimized the component costs and seabed footprint of a 6-MW floating wind turbine by prioritizing the elimination of infeasible solutions to avoid expensive time-domain simulations. Lim et al. [
19] employed a Bayesian optimization algorithm with an iteratively updated probabilistic objective function, coupling it with high-fidelity time-domain analysis for mooring system design optimization, thereby similarly achieving a substantial reduction in computational time.
The coupled motion of a cylindrical FPSO under complex environmental loads is a sophisticated rigid-flexible coupled dynamics problem, characterized by significant large-deformation and low-frequency vibrations [
20]. Consequently, accurately capturing such strongly nonlinear dynamic responses requires computationally expensive numerical calculations. Although researchers have mitigated computational expenses by screening feasible solutions or leveraging high-performance hardware, the optimization process remains fundamentally constrained by computational efficiency. Surrogate modeling provides an effective technique to approximate complex system responses or outputs using simpler, highly efficient mathematical models. Integrating these surrogate models into optimization algorithms to replace exhaustive dynamic simulations substantially improves design efficiency [
21,
22]. Yan et al. [
23] developed an efficient reliability-based design optimization (RBDO) framework integrating stepwise constraint screening with Kriging surrogate-based subset simulation (KSS). Considering random uncertainties, they optimized the mooring system of a 15-MW semi-submersible floating wind turbine. Different from the traditional deterministic optimization relying on safety factors, this reliability-based design optimization method avoids overly conservative designs, and the obtained optimal mooring configuration strictly meets the reliability constraints. Wen et al. [
24] also combined the Kriging surrogate model with the genetic algorithm and proposed a multi-step reduction strategy. By gradually reducing the design variables and narrowing the search space, this method significantly improves the accuracy and computational efficiency of the surrogate model.
While traditional surrogate models like Kriging provide a solid foundation, capturing the highly nonlinear effects inherent in complex structures—particularly cylindrical FPSOs—has increasingly driven researchers to explore advanced machine learning and neural network architectures. Li et al. [
25] proposed a LightGBM surrogate model integrated with a TSE strategy to address the weight optimization of a 17-MW ultra-large floating wind turbine. This approach effectively overcomes the staircase effect inherent in traditional tree-based models during time-domain peak prediction. Jiang et al. [
26] integrated a BPNN with a genetic algorithm (GA) to minimize costs for a 10-MW floating wind turbine operating at a 130 m water depth, achieving a 17.79% reduction in the total weight of the mooring system. Yan et al. [
27] similarly employed an optimization framework coupling a Back-Propagation Neural Network (BPNN) with the NSGA-III algorithm for the mooring system of the “Shenhai-1” semi-submersible platform operating at a 1400 m water depth. By leveraging the nonlinear fitting capability of the BPNN to substitute computationally expensive time-domain dynamic simulations, this framework achieves an optimal design that balances the competing objectives of mitigating mooring tension and minimizing costs. Jung et al. [
28] addressed the neglect of environmental load multi-directionality in conventional mooring optimization by proposing a multi-objective framework that couples a deep neural network (DNN) accounting for multi-directional environmental features with the NSGA-II algorithm. This approach avoids the risk of constraint violations under alternative directions inherent in unidirectional optimization.
The dynamic response of cylindrical FPSOs exhibits highly complex and strongly nonlinear characteristics under the coupled effects of complex environmental loads and mooring restoring forces. Standard surrogate-based mooring optimization frameworks have been widely adopted. These methods include Kriging, BPNN, and DNN. However, these frameworks are generally regarded as ‘black-box’ models. They often face challenges in balancing fitting smoothness with high-dimensional generalization capabilities. This study proposes an innovative optimization framework for cylindrical FPSO mooring systems. The framework integrates the Kolmogorov–Arnold Network (KAN) with the NSGA-III algorithm. The KAN model employs a unique architecture by deploying learnable B-spline functions on the network edges [
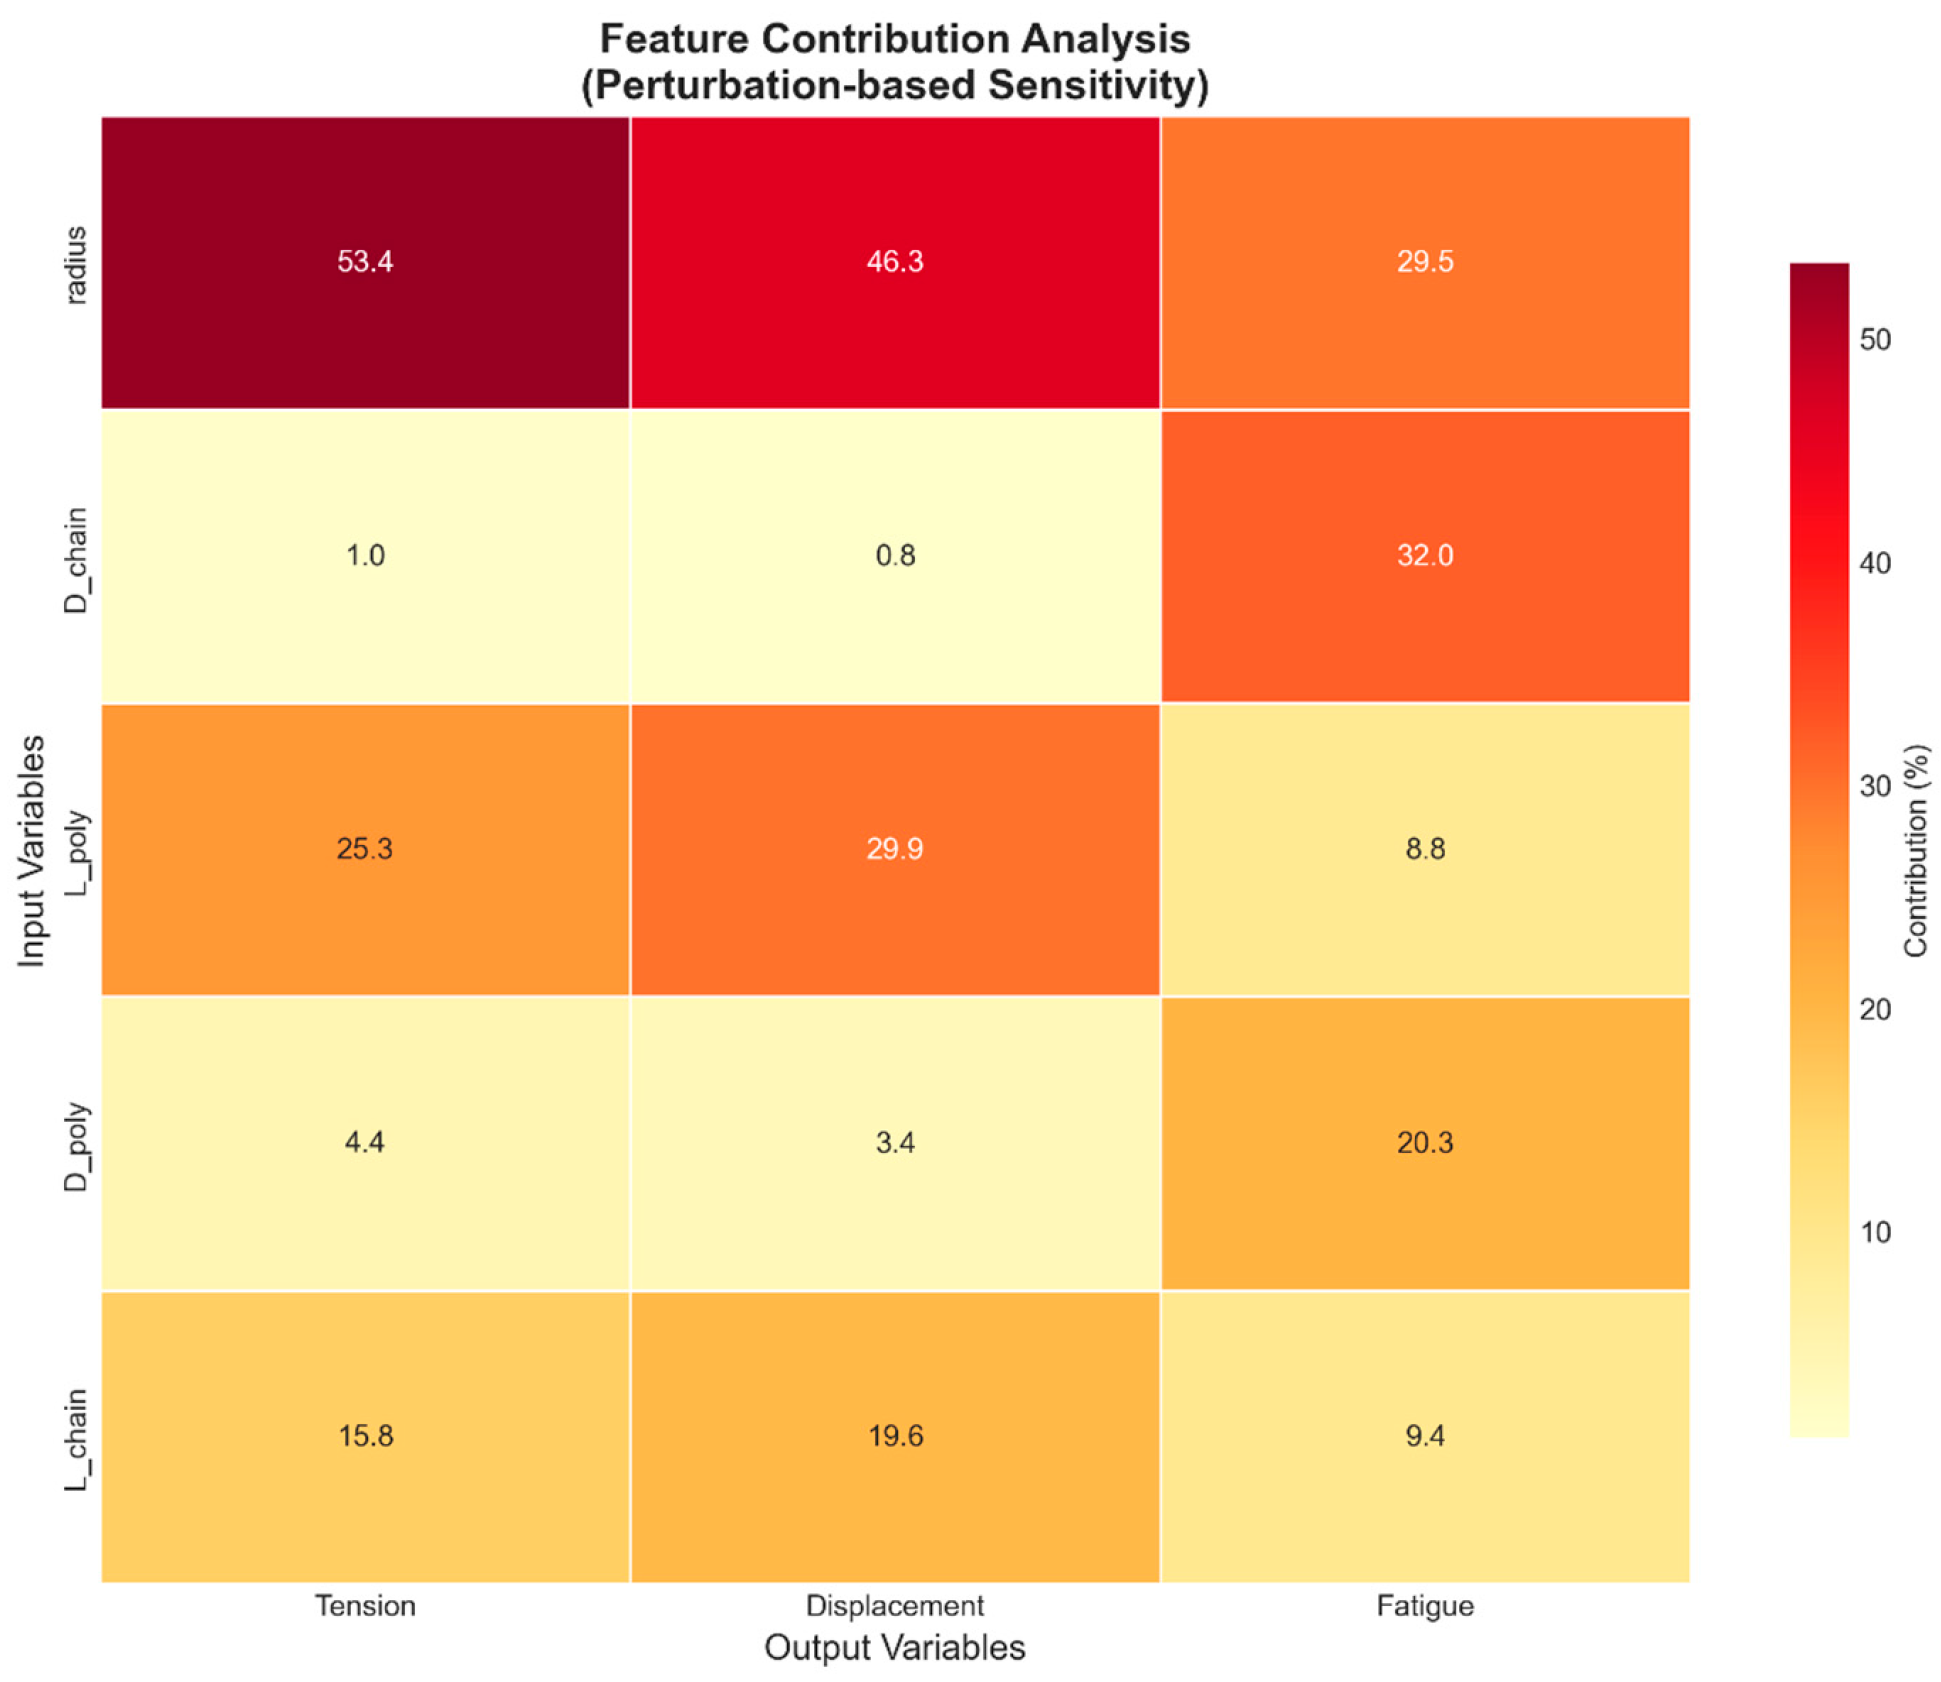
29]. This approach achieves high-precision and high-order continuous smooth fitting for strongly nonlinear mappings. Furthermore, it breaks through the ‘black-box’ limitation via automatic feature sparsification. This mechanism quantitatively reveals the physical coupling relationships between design variables and system responses. It thereby provides clear interpretability of the underlying engineering mechanisms. This makes KAN an effective surrogate model for capturing the dynamic responses of cylindrical FPSOs. Taking ‘Haikui No. 2’ as a case study, this optimization aims to balance four conflicting objectives. These objectives include reducing mooring tension, limiting platform displacement, minimizing system cost, and alleviating fatigue damage. By screening the solution space of the Pareto front, single-objective optimal solutions and balanced solutions are extracted to achieve comprehensive design optimization.
2. Methods and Models
2.1. Optimization Design Process of the Mooring System
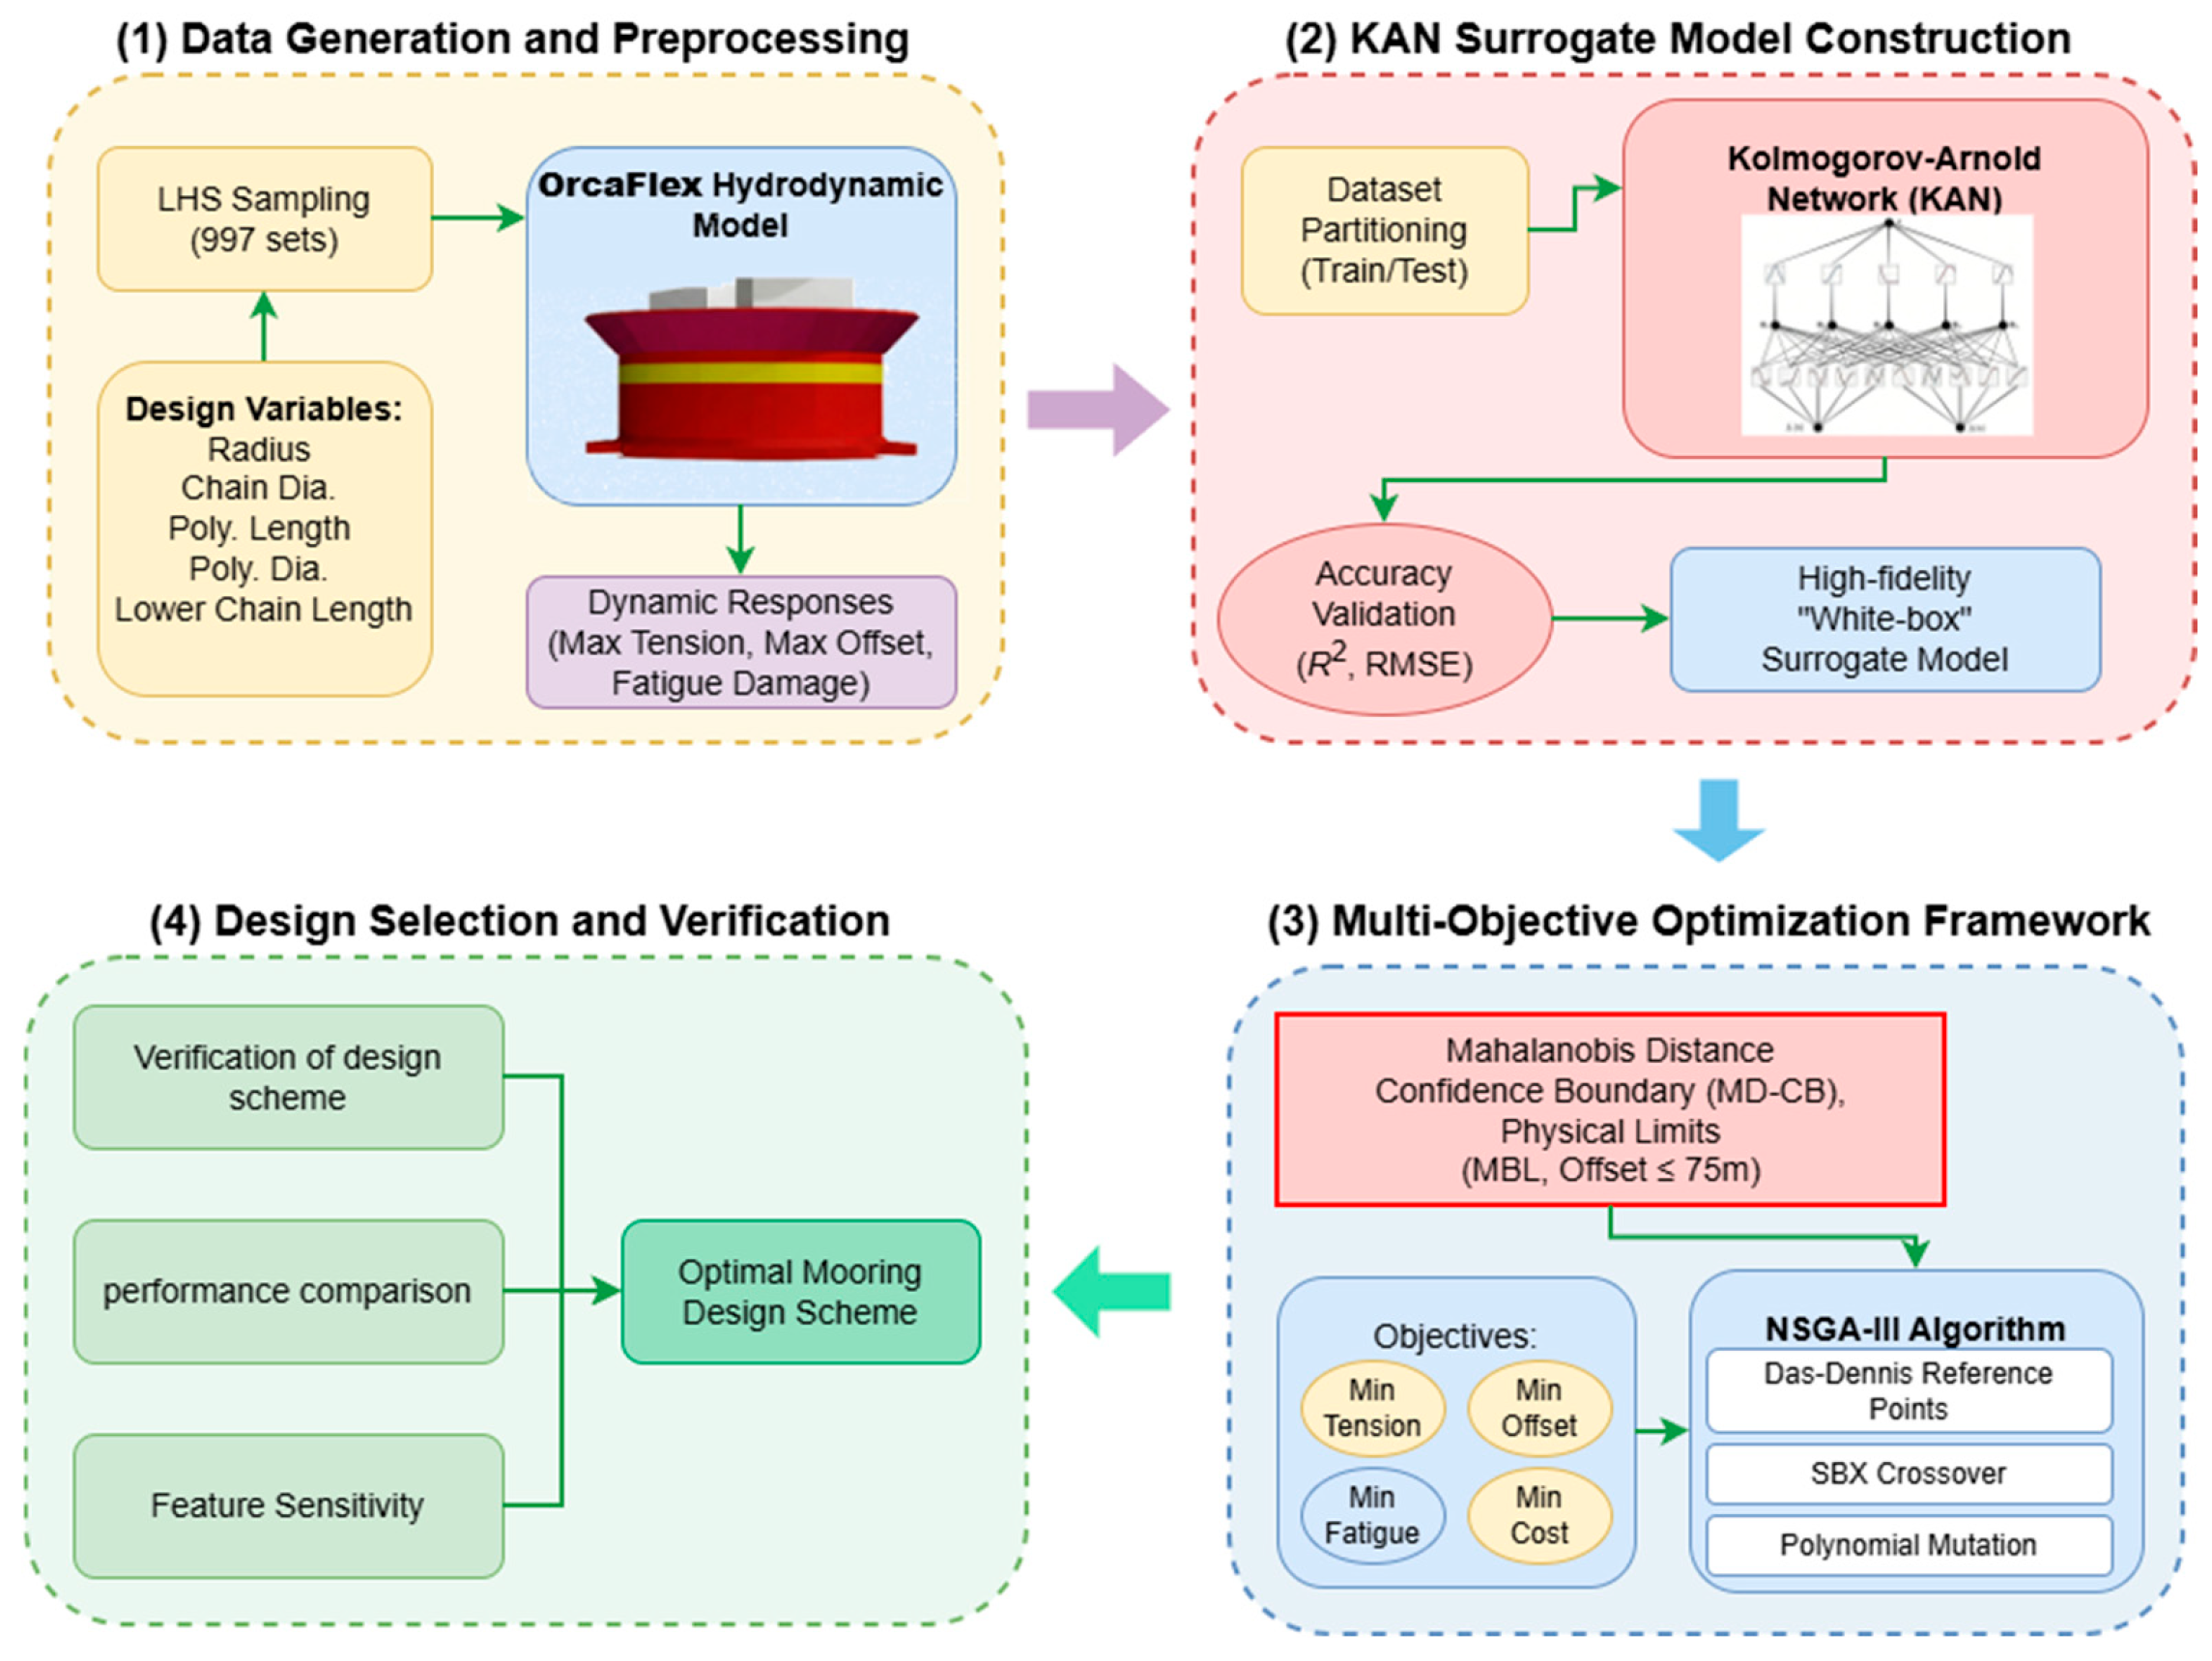
The overall optimization framework for the cylindrical FPSO mooring system proposed in this study is illustrated in
Figure 1. The systematic workflow is primarily divided into the following four sequential stages.
- (1)
Data Generation and Preprocessing
To construct a mapping dataset of mooring parameters and dynamic responses for cylindrical FPSOs, the design space was first defined by setting boundary ranges for design variables. Subsequently, the Latin Hypercube Sampling (LHS) technique was utilized to construct an initial sample set with uniform spatial distribution. After eliminating infeasible designs violating geometric constraints, OrcaFlex time-domain coupled analysis was performed on the valid samples. The maximum tension, maximum platform displacement, fatigue damage, and mooring cost were extracted as target responses. After pre-processing and standardization, the generated dataset was proportionally partitioned into two subsets: 80% allocated for training and 20% reserved for testing. This partition ratio ensures that the model receives ample data for comprehensive training, while reserving a sufficiently large subset to reliably evaluate its generalization capability.
- (2)
Surrogate Model Construction
In order to reduce the high computing cost of full time-domain simulation, a Kolmogorov–Arnold Network (KAN) was implemented to build a high-fidelity surrogate model, which improves the physical transparency of the architecture. Through careful calibration of B-spline coefficients and network weights, the prediction error is effectively reduced, thereby establishing a high-precision mapping correlation between the mooring input variables and the dynamic outputs of the system.
- (3)
Optimization Framework Implementation
The trained KAN surrogate model was integrated into the NSGA-III evolutionary framework to execute a four-dimensional objective optimization. Throughout this algorithmic searching phase, in addition to applying safety factor constraints based on DNV specifications, an innovative fitness domain constraint based on Mahalanobis distance was introduced. This mechanism confined the algorithm’s search trajectory within the high-confidence region of the KAN model until a uniformly distributed Pareto front solution set was generated.
- (4)
Design Selection and Verification
The optimal mooring system designs and balanced design solutions for each objective are selected from the generated Pareto frontier solution space. Subsequently, these optimal solutions are back-substituted into the OrcaFlex numerical model for time-domain verification to validate the accuracy and reliability of the proposed solutions.
2.2. Dynamic Modeling and Fatigue Assessment of the Mooring System
This study employed OrcaFlex to establish a fully coupled time-domain hydrodynamic analysis model for a cylindrical FPSO mooring system. External environmental excitations acting on the cylindrical FPSO are primarily categorized into wind loads above the water surface and submerged wave and current loads. Both the hydrodynamic response of the platform structure and the transient dynamics of the mooring system are computed and processed using OrcaFlex. Within this numerical model, the solver achieves real-time dynamic interaction between platform motion and mooring tension. Specifically, OrcaFlex calculates wave excitation forces on the platform surface, hydrodynamic added mass, and the instantaneous tension transmitted to the fairleads from each mooring line. Subsequently, the calculated forces and moments, alongside the added mass matrix, are aggregated and fed back to the platform’s center of mass. The final motion response of the platform is solved by numerical integration. The dynamic equation can be simply expressed as follows:
where
and
define the structural mass matrix and the hydrodynamic added mass matrix, respectively. The symbols
and
correspond to the system’s damping and restoring stiffness matrices, while
indicates the global displacement vector. Furthermore, the right-side vector consolidates all external environmental drivers—including aerodynamic and hydrodynamic loads—along with the nonlinear constraint forces provided by the station-keeping network.
2.2.1. Hydrodynamic Loads Based on the Morison Equation
During the fully coupled dynamic simulations, the cable components endure substantial fluid actions induced by combined wave and current fields. Because the cross-sectional diameter of these mooring lines is significantly smaller than the dominant wavelengths, wave radiation and diffraction phenomena can be safely ignored. Consequently, the generalized Morison’s equation is adopted to quantify the fluid–structure interaction on these slender bodies. The resulting force vector is computed as a superposition of a nonlinear viscous drag term and a linear inertial component [
30]:
where
denotes the seawater density,
specifies the projected drag area of the respective mooring segment, and
corresponds to its displaced fluid volume. Kinematically,
represents the instantaneous relative velocity between the surrounding water particles and the moving cable. Furthermore,
and
signify the absolute acceleration of the fluid particle and the relative acceleration between the fluid and the structural segment, respectively. To systematically account for the viscous flow separation and hydrodynamic inertial effects along the mooring line, the parameters
and
are incorporated as the normal drag and added mass coefficients, respectively.
2.2.2. Tension Analysis of Mooring Systems
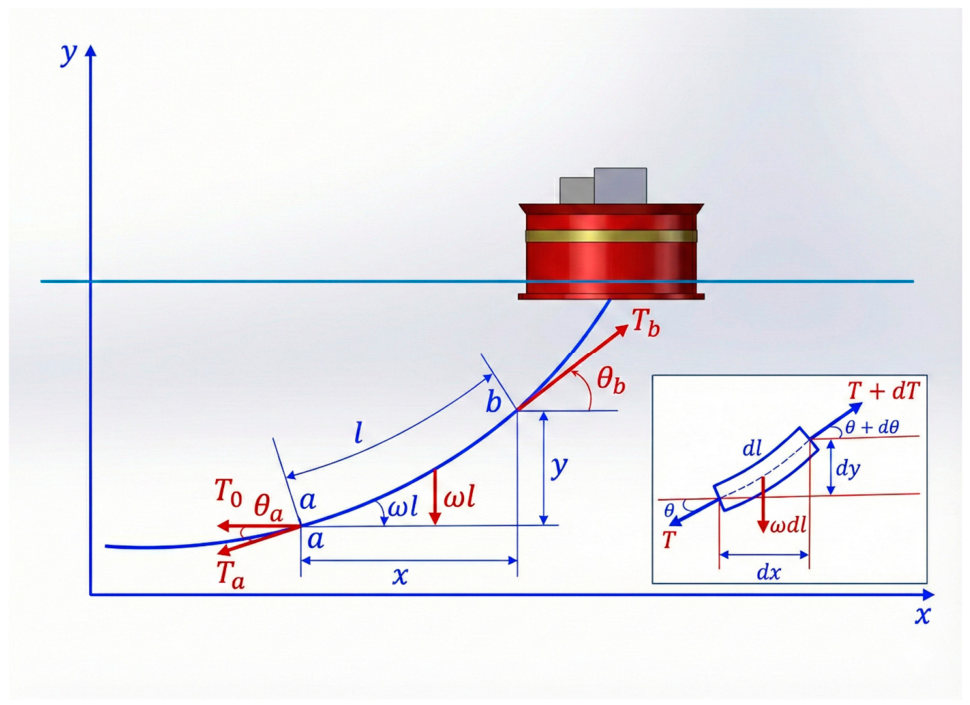
Analytical catenary theory provides a precise evaluation of the initial spatial configuration and restoring force characteristics of the mooring system during the static analysis phase. As illustrated in
Figure 2, a representative suspended segment ab is isolated from the complete mooring line for geometric and mechanical modeling.
The boundaries of this segment consist of the lower endpoint a and the upper endpoint b, with internal tensions at these locations denoted as
and
, respectively. The corresponding inclination angles of the tension vectors relative to the horizontal axis are defined as
and
. Because hydrodynamic forces are neglected in the static suspended state, the horizontal tension component remains strictly conserved across the entire span, defined as a constant
. Furthermore,
represents the unstrained physical arc length of the interval,
is the submerged unit weight of the cable material, and
and
describe the horizontal and vertical projected spans of segment
in the Cartesian coordinate system. Guided by classical static equilibrium criteria, an infinitesimal arc element is extracted along the cable. The force state at the lower end is governed by the instantaneous tension
and its inclination angle. Incorporating the element’s uniform effective gravity
into the two-dimensional force system, the static equilibrium conditions are rigorously formulated as a system of ordinary differential equations [
31]:
By performing analytical integration of this system of equations within the specified boundary node intervals, the continuous spatial coordinates of the catenary segment and its internal mechanical mapping relationship can be reconstructed. At this point, both the theoretical arc length l of the chain segment and its projections x and y in two orthogonal directions can be derived as nonlinear functions of the terminal inclination angle and the global horizontal tension [
32]:
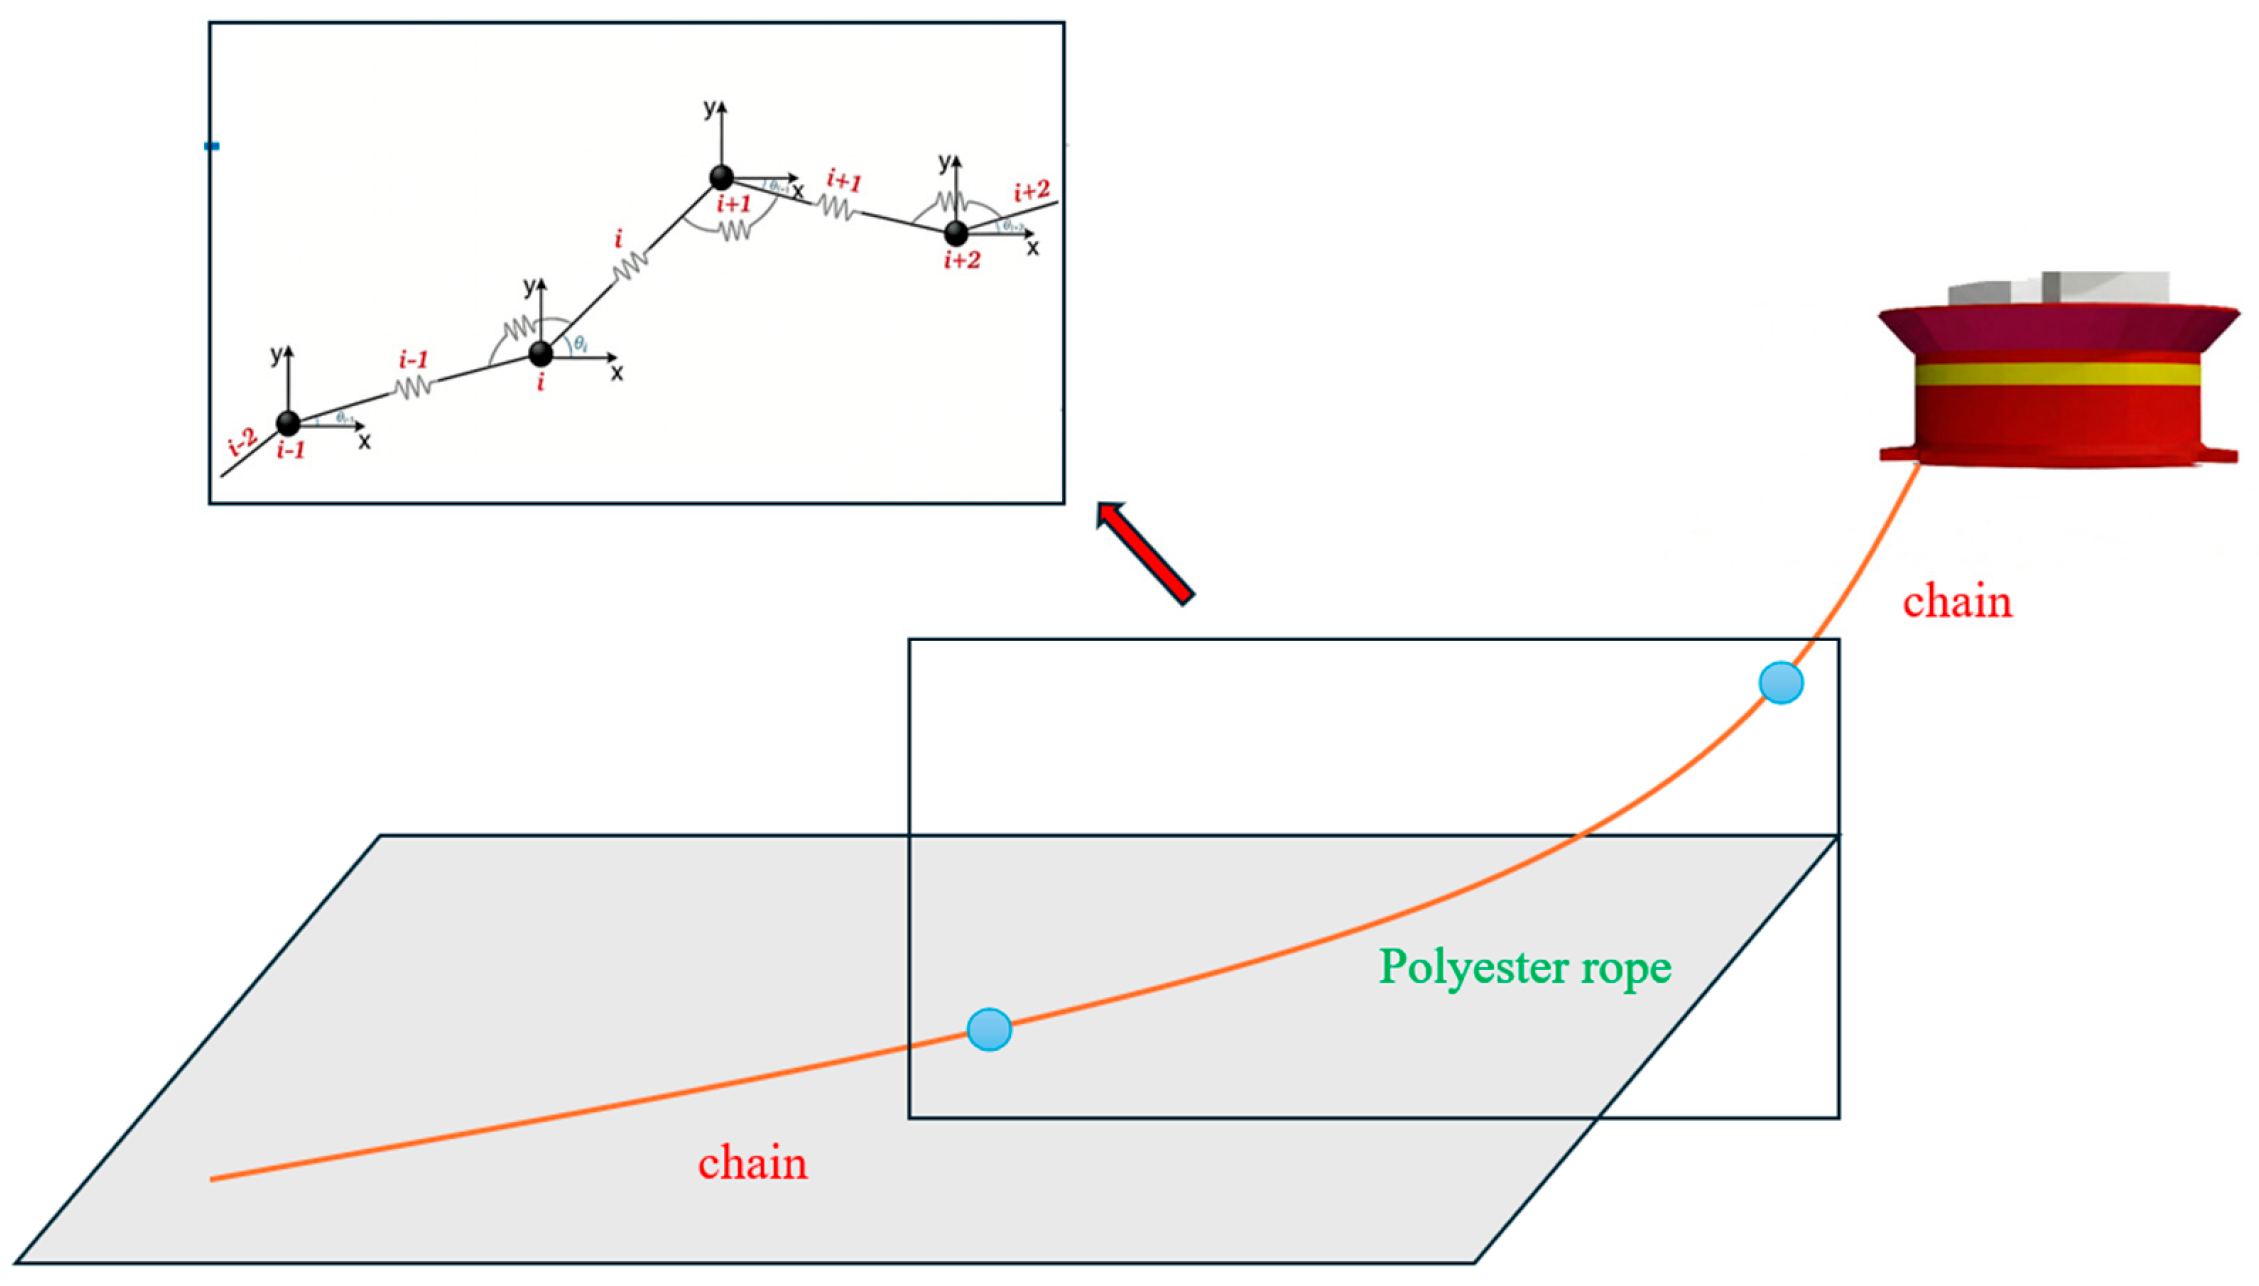
To assess the dynamic behavior of the mooring configurations, the lumped-mass approach is utilized during the time-domain simulations. Referring to
Figure 3, the entire length of the mooring line is divided geometrically into discrete, interconnected sections. This formulation models the physical cable using multiple point masses joined together through weightless spring and damper components. Within this numerical setup, half of the physical mass from neighboring sections, along with any external applied forces, is allocated equally to the corresponding boundary nodes. Each individual segment is simplified as a theoretical component lacking mass, possessing strictly axial and torsional stiffness. For the purpose of reproducing the actual geometric profile and bending behavior, rotational spring-damper devices are introduced at the segment junctions, functioning directly between the nodes and the adjacent elements. Furthermore, an axial spring-damper mechanism positioned at the midpoint of each segment produces a longitudinal force vector. The real-time magnitude of this force is defined as the effective tension
, governed by the expression below:
where the variables
and
indicate the fluid pressures acting on the outer and inner surfaces, respectively, while
and
define the corresponding cross-sectional areas exposed to these pressures. The term
reflects the segment’s effective axial rigidity. The parameter
corresponds to the transient stretched length,
represents the initial unstrained length, and
acts as the expansion coefficient. Additionally,
stands for Poisson’s ratio,
characterizes the material’s internal damping, and the temporal derivative
expresses the instantaneous velocity of segment elongation.
2.2.3. Fatigue Damage Analysis
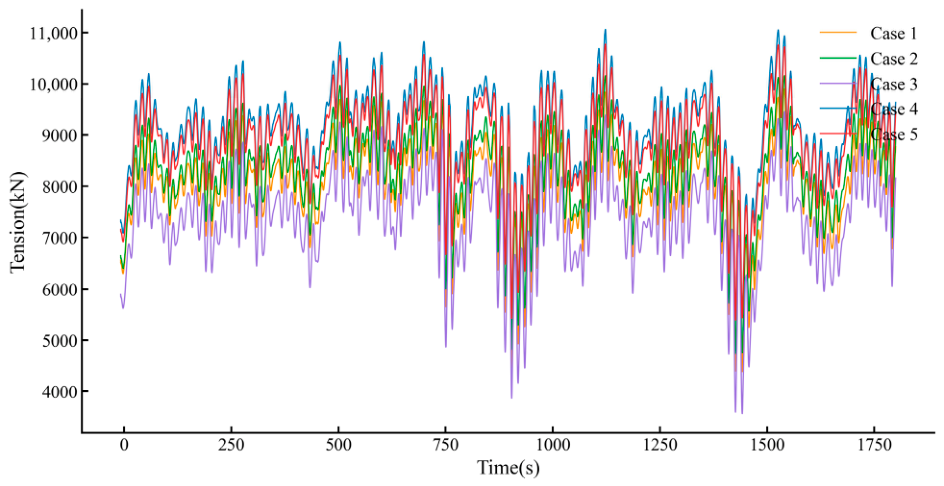
The fatigue assessment of the mooring system is directly driven by the transient dynamic responses obtained from the coupled time-domain analysis, with the instantaneous effective tension formulated by Equation (7) serving as the fundamental load input. To accurately capture the material’s fatigue response, the tension must be dynamically converted to structural stress. The effective tensile cross-sectional area of a studless chain link is calculated as , which subsequently yields the time-series dynamic stress .
By applying the rainflow counting method to
, the random dynamic stress is discretized into a series of regular stress ranges
and their corresponding number of stress cycles
. According to the DNV-OS-E301 standard for studless chains in a seawater free-corrosion environment, the S-N curve parameters are treated as deterministic constants rather than probabilistic random variables within this research framework. Specifically, the slope parameter is fixed at
, and the intercept parameter is set to
. Based on the Palmgren-Miner linear cumulative damage criterion, the short-term fatigue damage accumulated within a specific simulation period is calculated as follows:
The short-term fatigue damage extracted under the 100-year extreme sea conditions does not represent an absolute estimate of the annualized fatigue damage over the system’s entire life cycle. Rather, it serves as a relative indicator to quantify the system’s structural capacity to resist fatigue degradation under adverse conditions. By keeping the S-N curve parameters constant, the material properties are strictly controlled as a baseline, enabling the optimization algorithm to isolate and evaluate the true effects of hydrodynamic loads and mooring parameters. Consequently, minimizing this specific damage value as one of the design objectives within the optimization framework ensures that the final selected mooring scheme possesses superior overall fatigue resilience [
33].
2.3. Numerical Model Setup
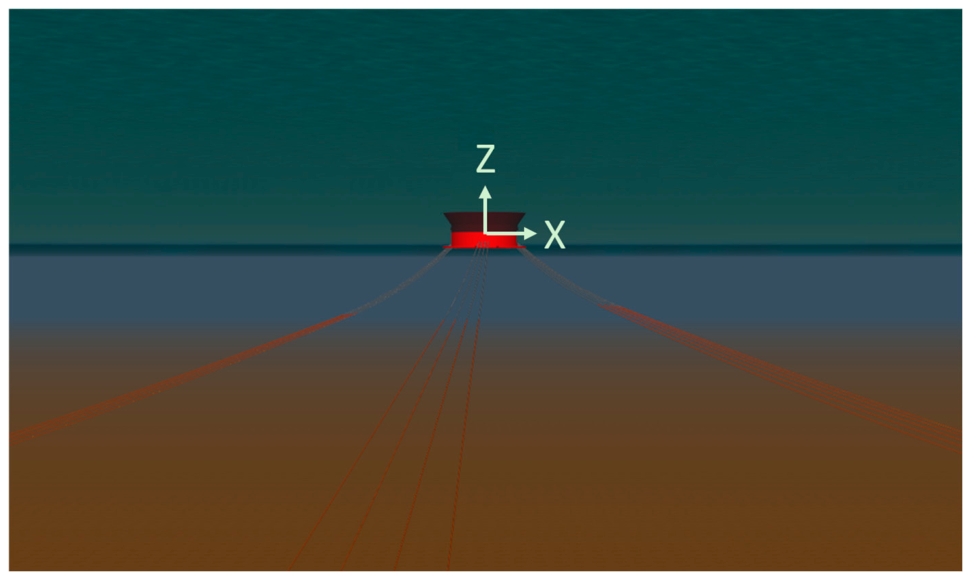
Selecting the “Haikui No. 2” cylindrical FPSO as the target structure, a fully coupled time-domain model was developed in OrcaFlex at a design operating water depth of 485.55 m, as shown in
Figure 4. The principal design parameters of the platform are detailed in
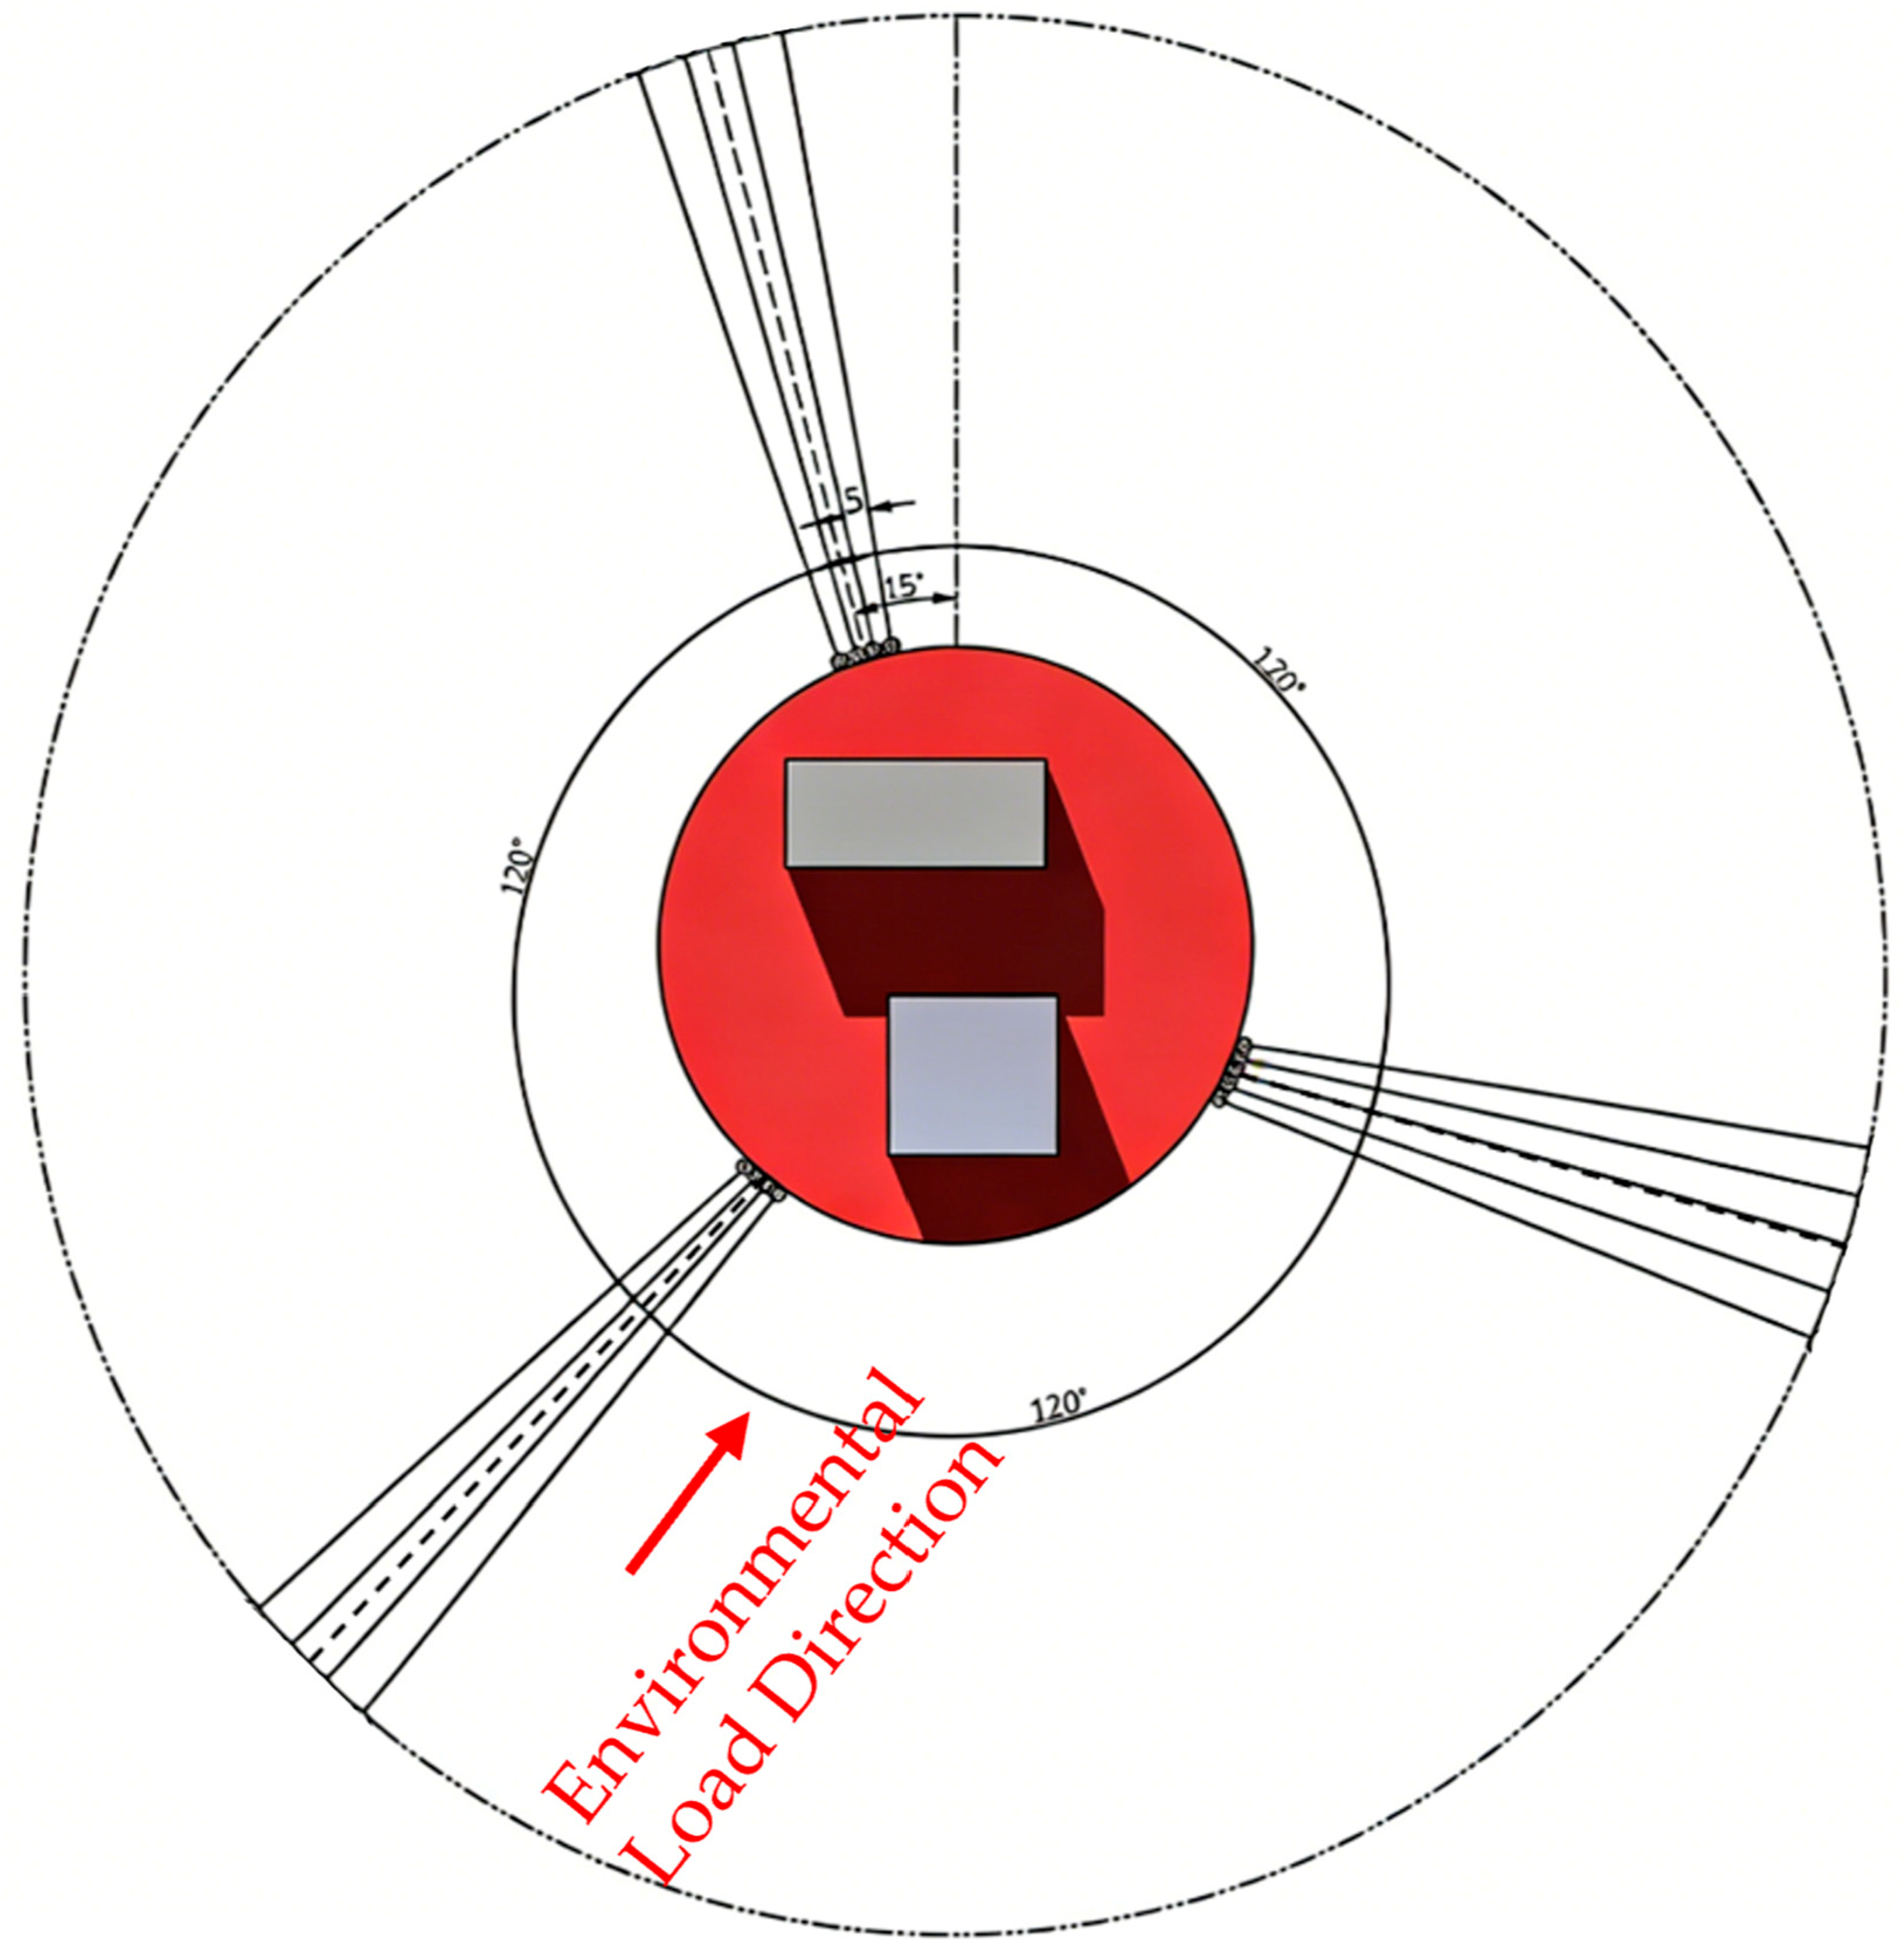
Table 1. A 5 + 4 + 4 asymmetric multi-point mooring system is adopted to maintain positioning (
Figure 5). This system consists of 13 mooring lines, with an inter-group angle of 120° and an intra-group line spacing of 5°, and an anchor radius of 2350 m. Each mooring line has a chain-polyester-chain structure: the chain segments at both ends provide weight and wear resistance, while the polyester rope in the middle absorbs dynamic loads. The physical properties of the mooring lines are shown in
Table 2 and
Table 3.
In the dynamic analysis, the FPSO is subjected to combined wind, wave, and current excitations. These conditions are based on the 100-year recurrence period extreme sea states in the South China Sea, utilizing site-specific metocean data provided for the actual operational area. The detailed environmental parameters are summarized in
Table 4.
3. Surrogate Modeling and Optimization Framework
This section proposes an automated, surrogate-assisted optimization framework, developed within a Python-based (version 3.12.2) environment, that integrates the Kolmogorov–Arnold Network (KAN) with the NSGA-III algorithm. The design variables for the optimization process comprise mooring radius, upper and lower anchor chain diameters, polyester cable segment length, polyester cable diameter, and lower chain length, whose boundaries were established by integrating the engineering baseline design, manufacturing specifications, and physical geometric constraints, with their ranges specified in
Table 5. Time-domain simulations under a 100-year return period extreme sea state were conducted using the Orcaflex numerical model introduced in
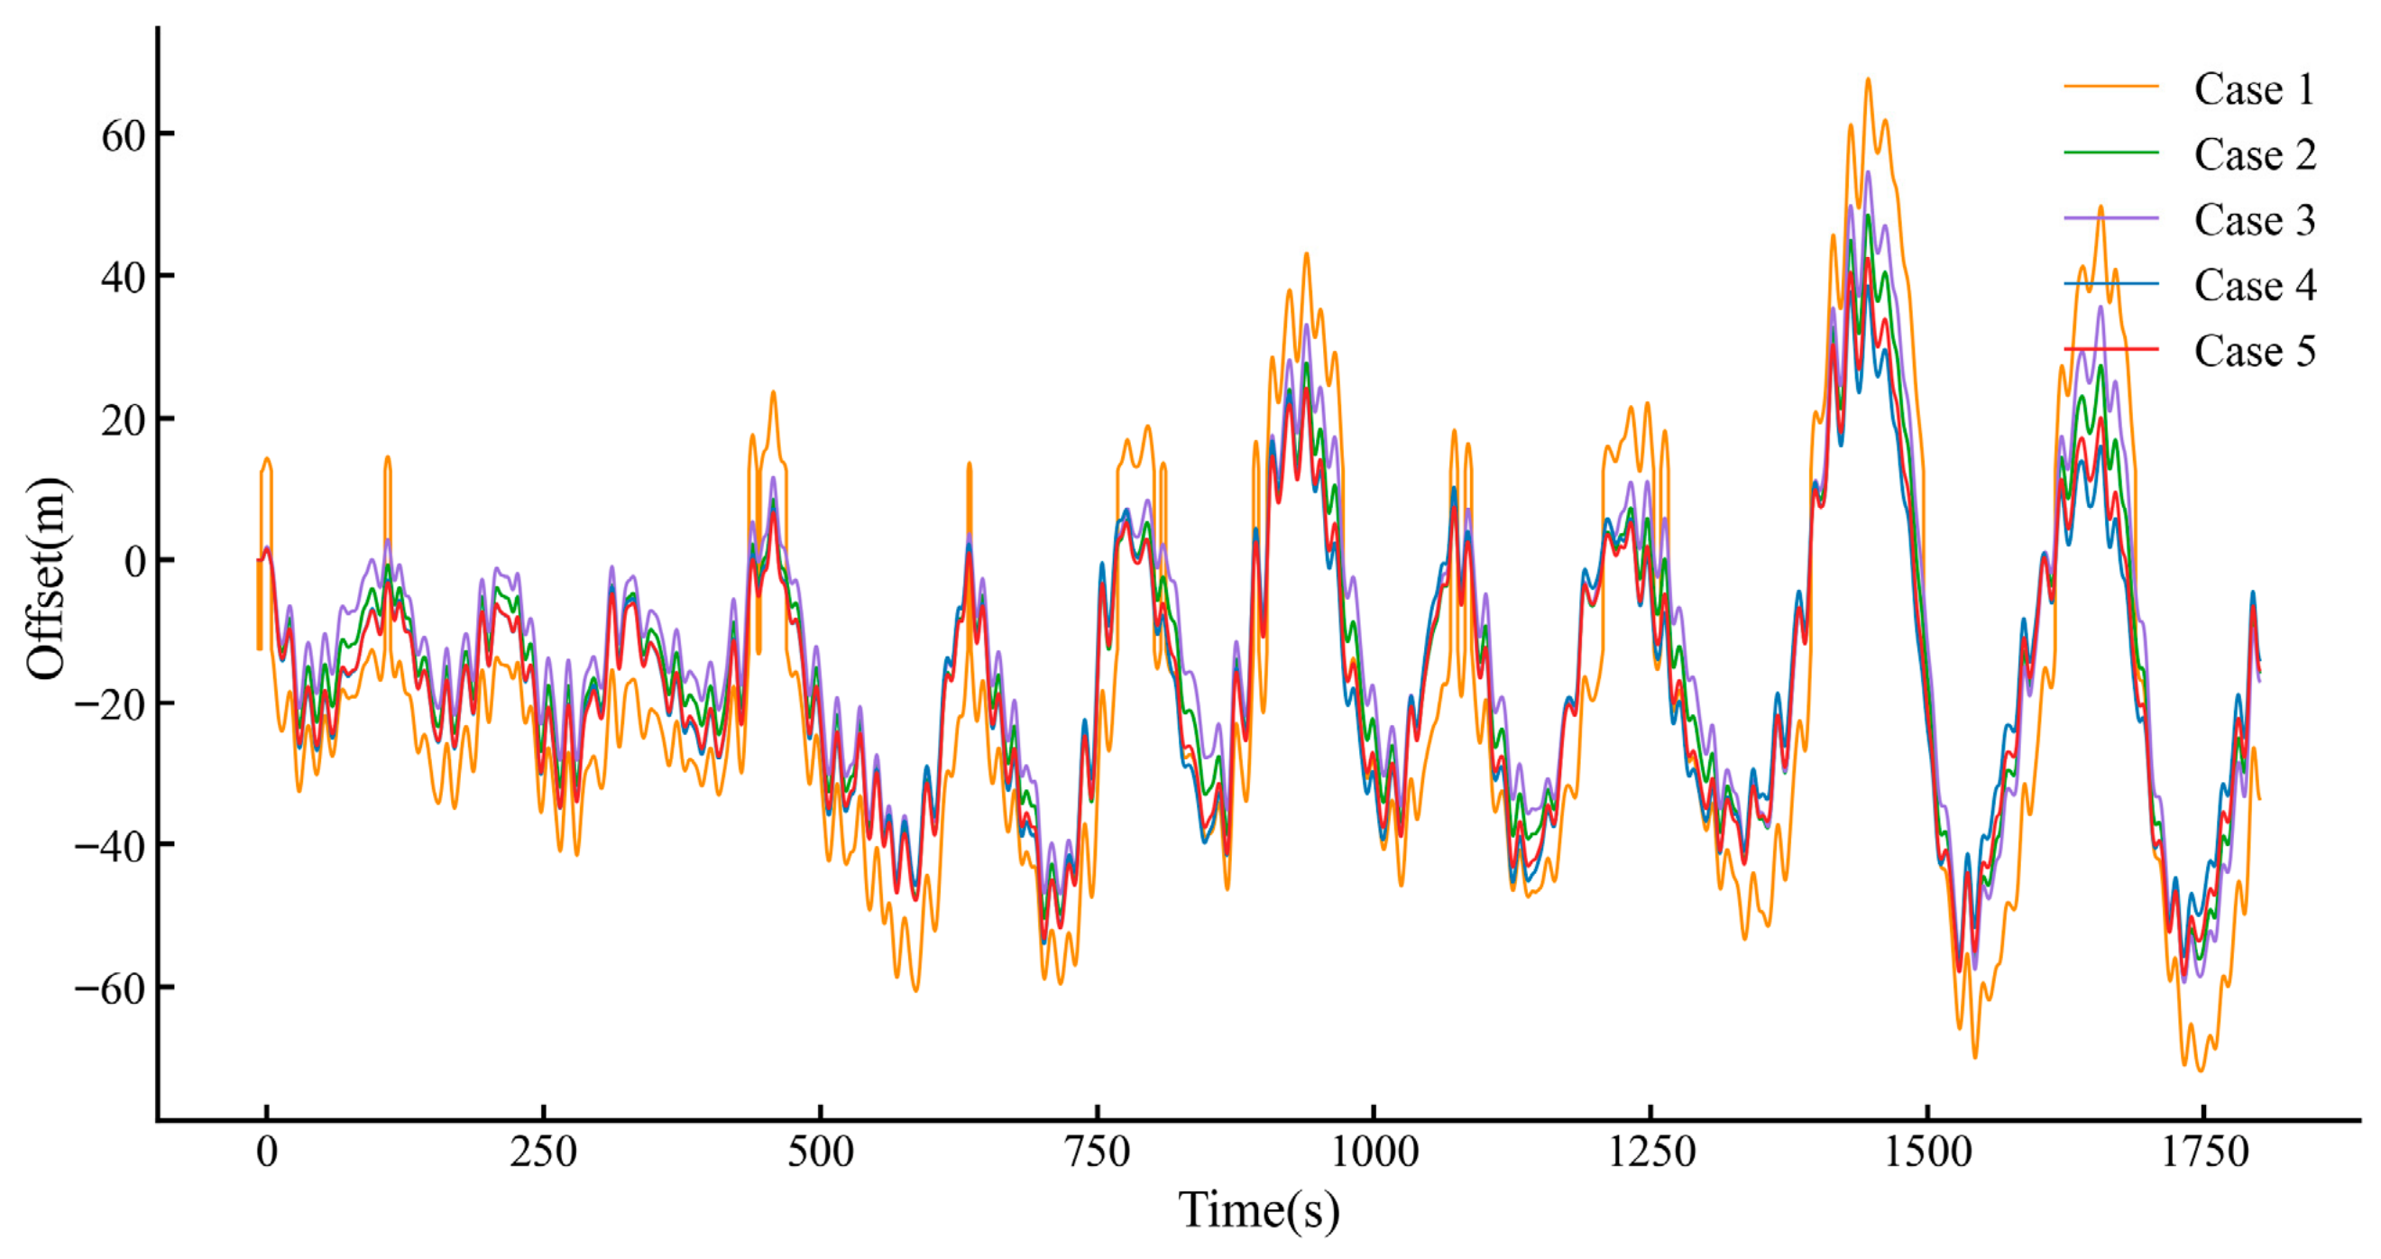
Section 2.3. The maximum lateral displacement of the platform, maximum mooring tension, and maximum cumulative fatigue damage were output as the KAN training dataset, and the NSGA-III algorithm was integrated for iterative optimization.
3.1. Data Generation and Pre-Processing
To construct a dispersed and uniform dataset, this study employed Latin hypercube sampling (LHS) within the design space. Compared to traditional Monte Carlo methods, LHS ensures more uniform multidimensional stratified sampling within predefined parameter boundaries, effectively preventing sample clustering and safeguarding the generalization capability of data-driven models [
34]. However, the random combination of multi-segment variables may lead to impractical mooring configurations that violate geometric constraints. Therefore, through static analysis, the design scheme that does not meet the response metrics were screened out, and a dataset containing 997 groups of valid sample pairs was finally established.
During model training, dimensional differences and numerical fluctuations among variables in the generated dataset may cause gradient anomalies. Normalizing the input and output labels to the [0, 1] interval through the bias standardization method can improve the data generalization ability, numerical stability, and convergence speed. Each sample undergoes 1800 s of time domain simulation, with the maximum transverse displacement, mooring tension, and fatigue damage as the output labels to form a complete dataset.
3.2. Kolmogorov–Arnold Network Architecture
The design variables and dynamic responses of mooring systems exhibit highly nonlinear characteristics, and there exists a high-dimensional and strongly coupled mapping relationship in the variable space. Traditional surrogate models (such as MLP) with fixed node activation functions and linear weight matrices tend to suffer from insufficient smoothness or local overfitting when fitting high-dimensional sparse spaces, which may lead to gradient vanishing problems in subsequent optimizations. To break through this limitation, this study introduces the KAN model based on the Kolmogorov–Arnold representation theorem, which proves that any multivariate continuous function can be precisely decomposed into the superposition of a finite number of univariate continuous functions.
where
and
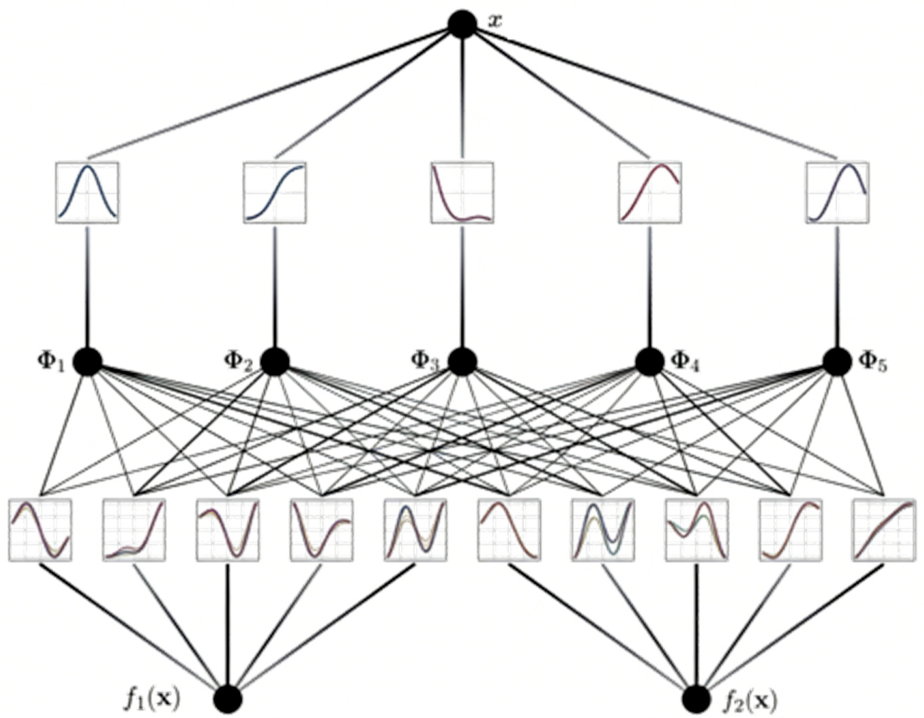
denote univariate functions. As depicted in
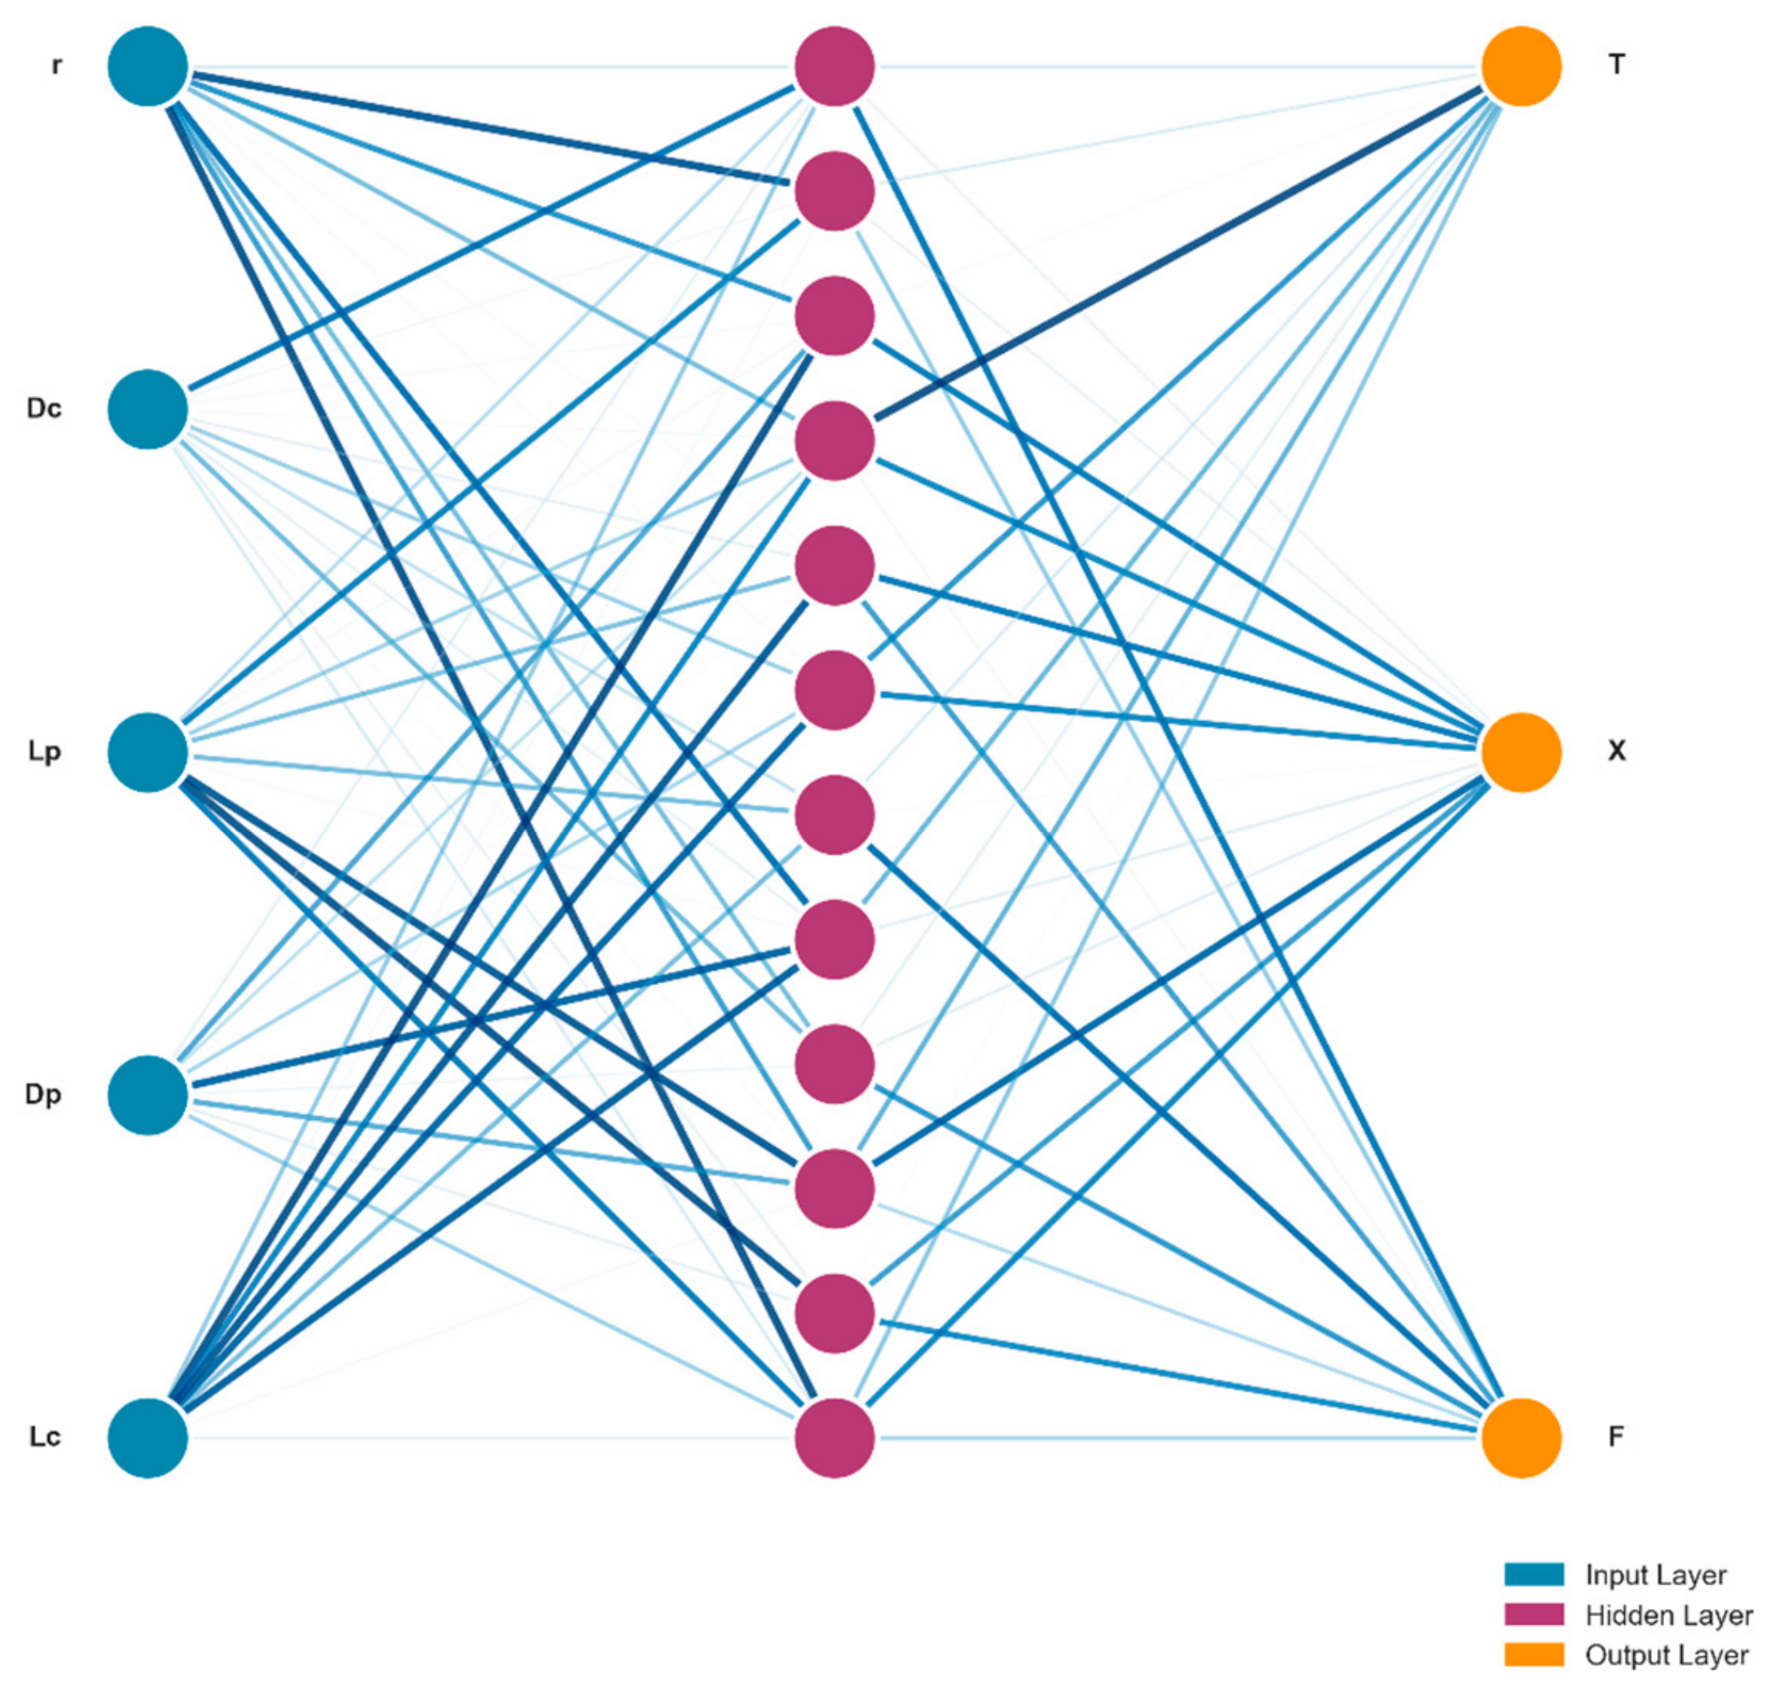
Figure 6, the KAN architecture inherently departs from the fixed node activations and linear weights characteristic of traditional MLPs. Instead, it innovatively deploys learnable univariate activation functions along the network edges, reserving the nodes strictly for summation operations. To achieve superior high-dimensional generalization capabilities despite the sparse samples generated via LHS, the edge activation function
within the KAN is parameterized as a synergistic combination of the SiLU basis function and a B-spline curve:
where
and
represent the control point coefficients and basis functions of the B-splines, respectively. By optimizing these edge splines, the KAN mitigates the curse of dimensionality more effectively than traditional MLP, yielding smooth and high-fidelity fitness response surfaces for the subsequent NSGA-III optimizer [
35]. The KAN structure is configured as [5, 12, 3]: 5 input nodes correspond to design variables, 12 hidden nodes, and 3 output nodes precisely mapping maximum stress, maximum displacement, and fatigue damage. To ensure second-order smoothness of the regression surface, the B-spline degree k = 3 and grid size Grid = 10 are set, resulting in 13 basis functions per edge. Traditional MLPs typically rely on Dropout techniques to prevent overfitting. However, such methods are mathematically unsuitable for KANs, as dropping nodes would disrupt the continuous B-spline edges. Consequently, this study implements a Sparse Regularization strategy to strictly control overfitting. By setting the regularization (entropy penalty) coefficient to 0.001, the network actively penalizes unnecessary structural complexity and forces redundant edge weights toward zero, inherently functioning as an advanced form of weight decay tailored for KAN.
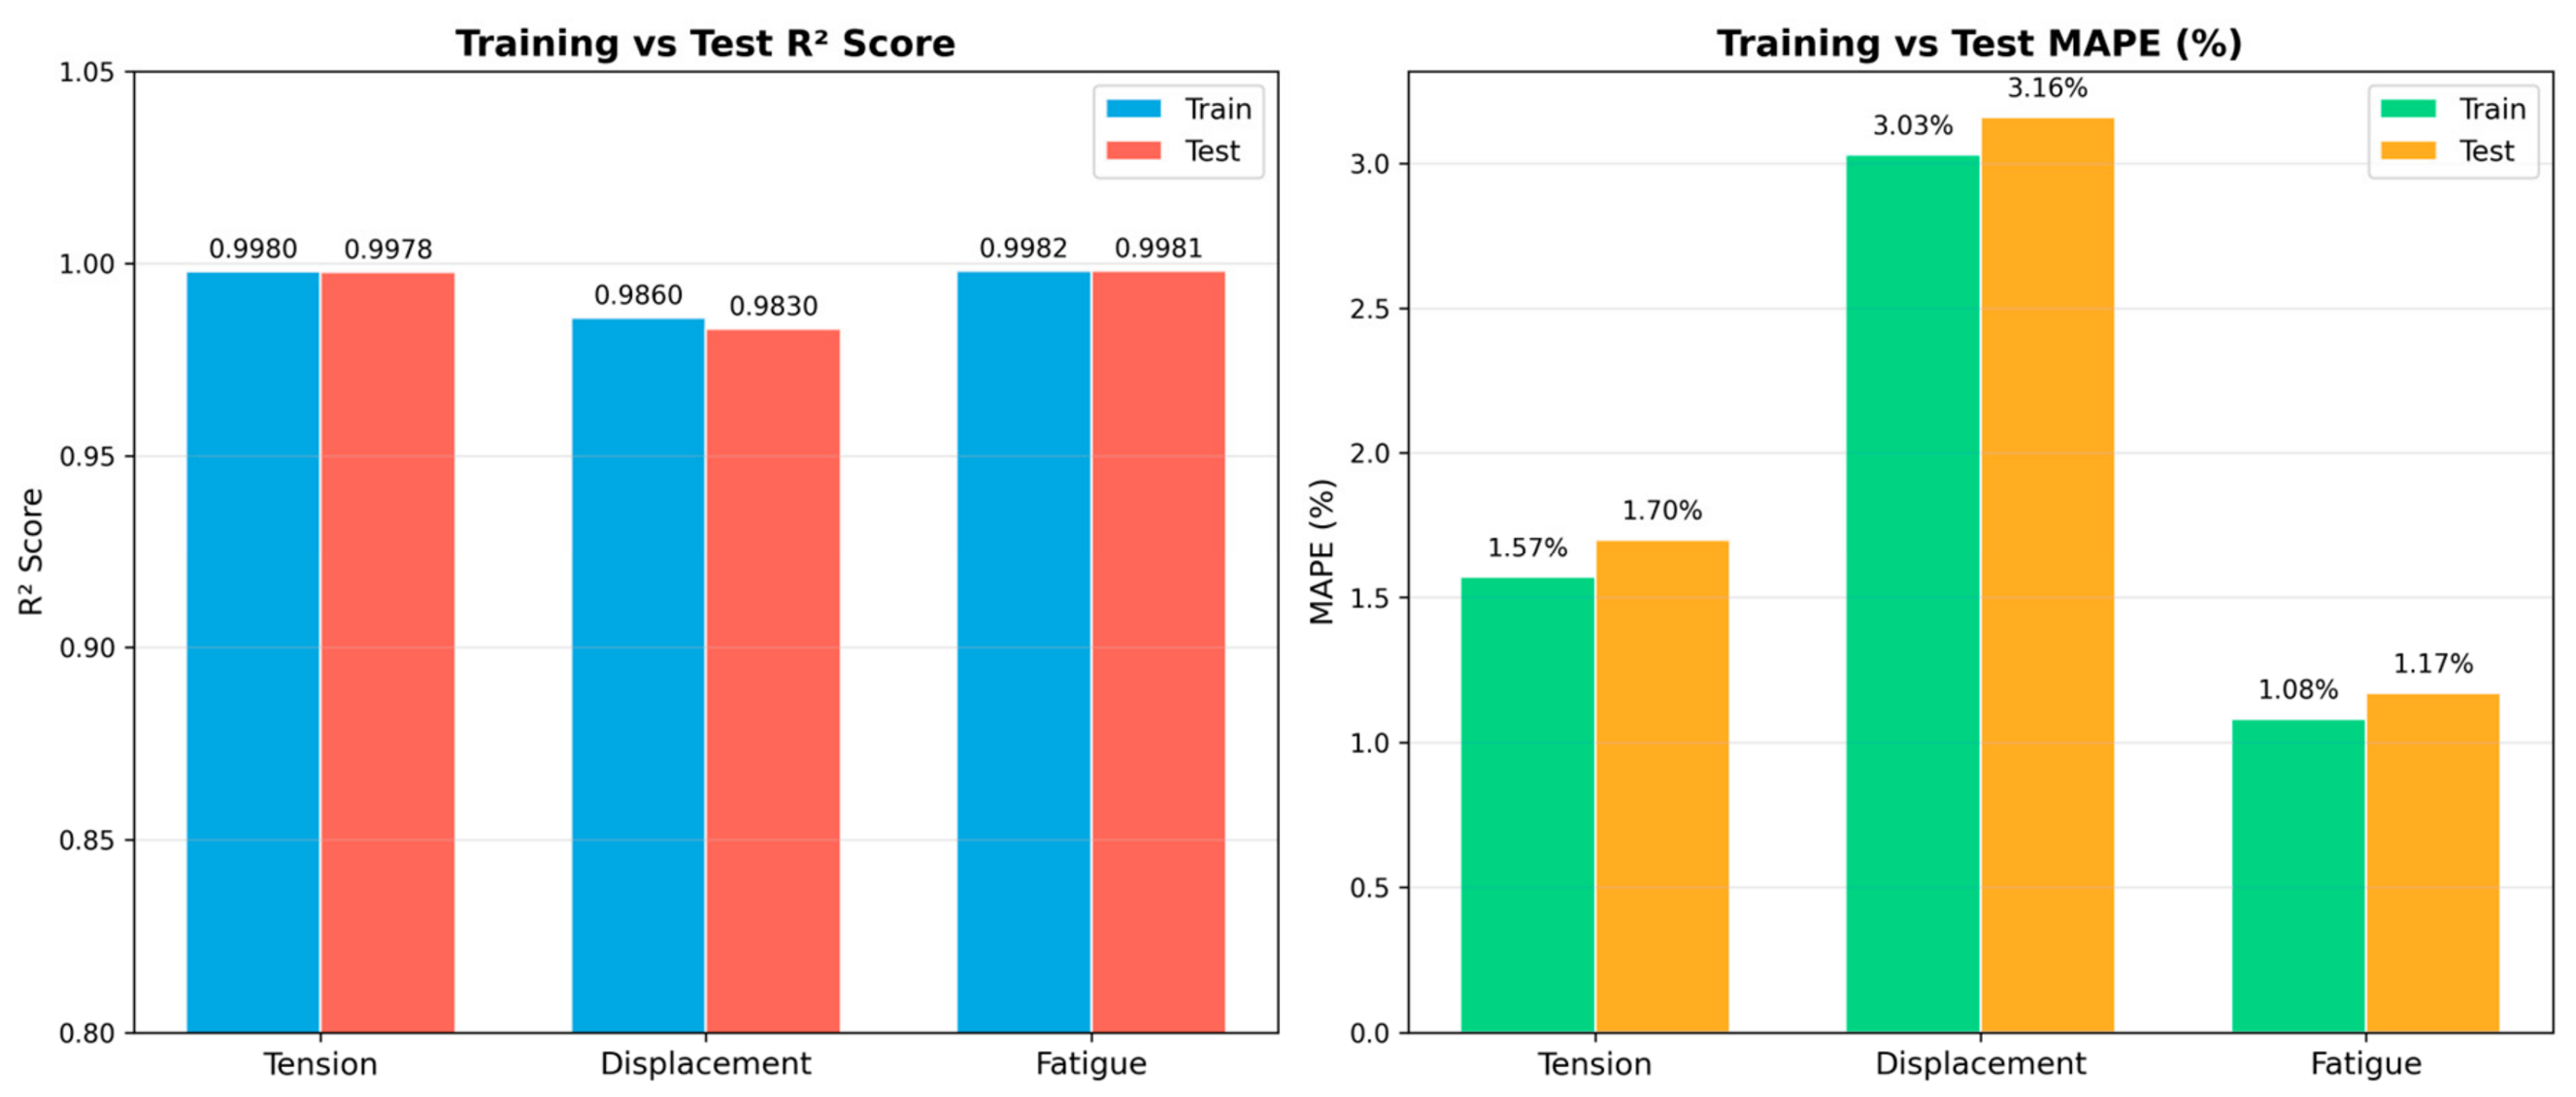
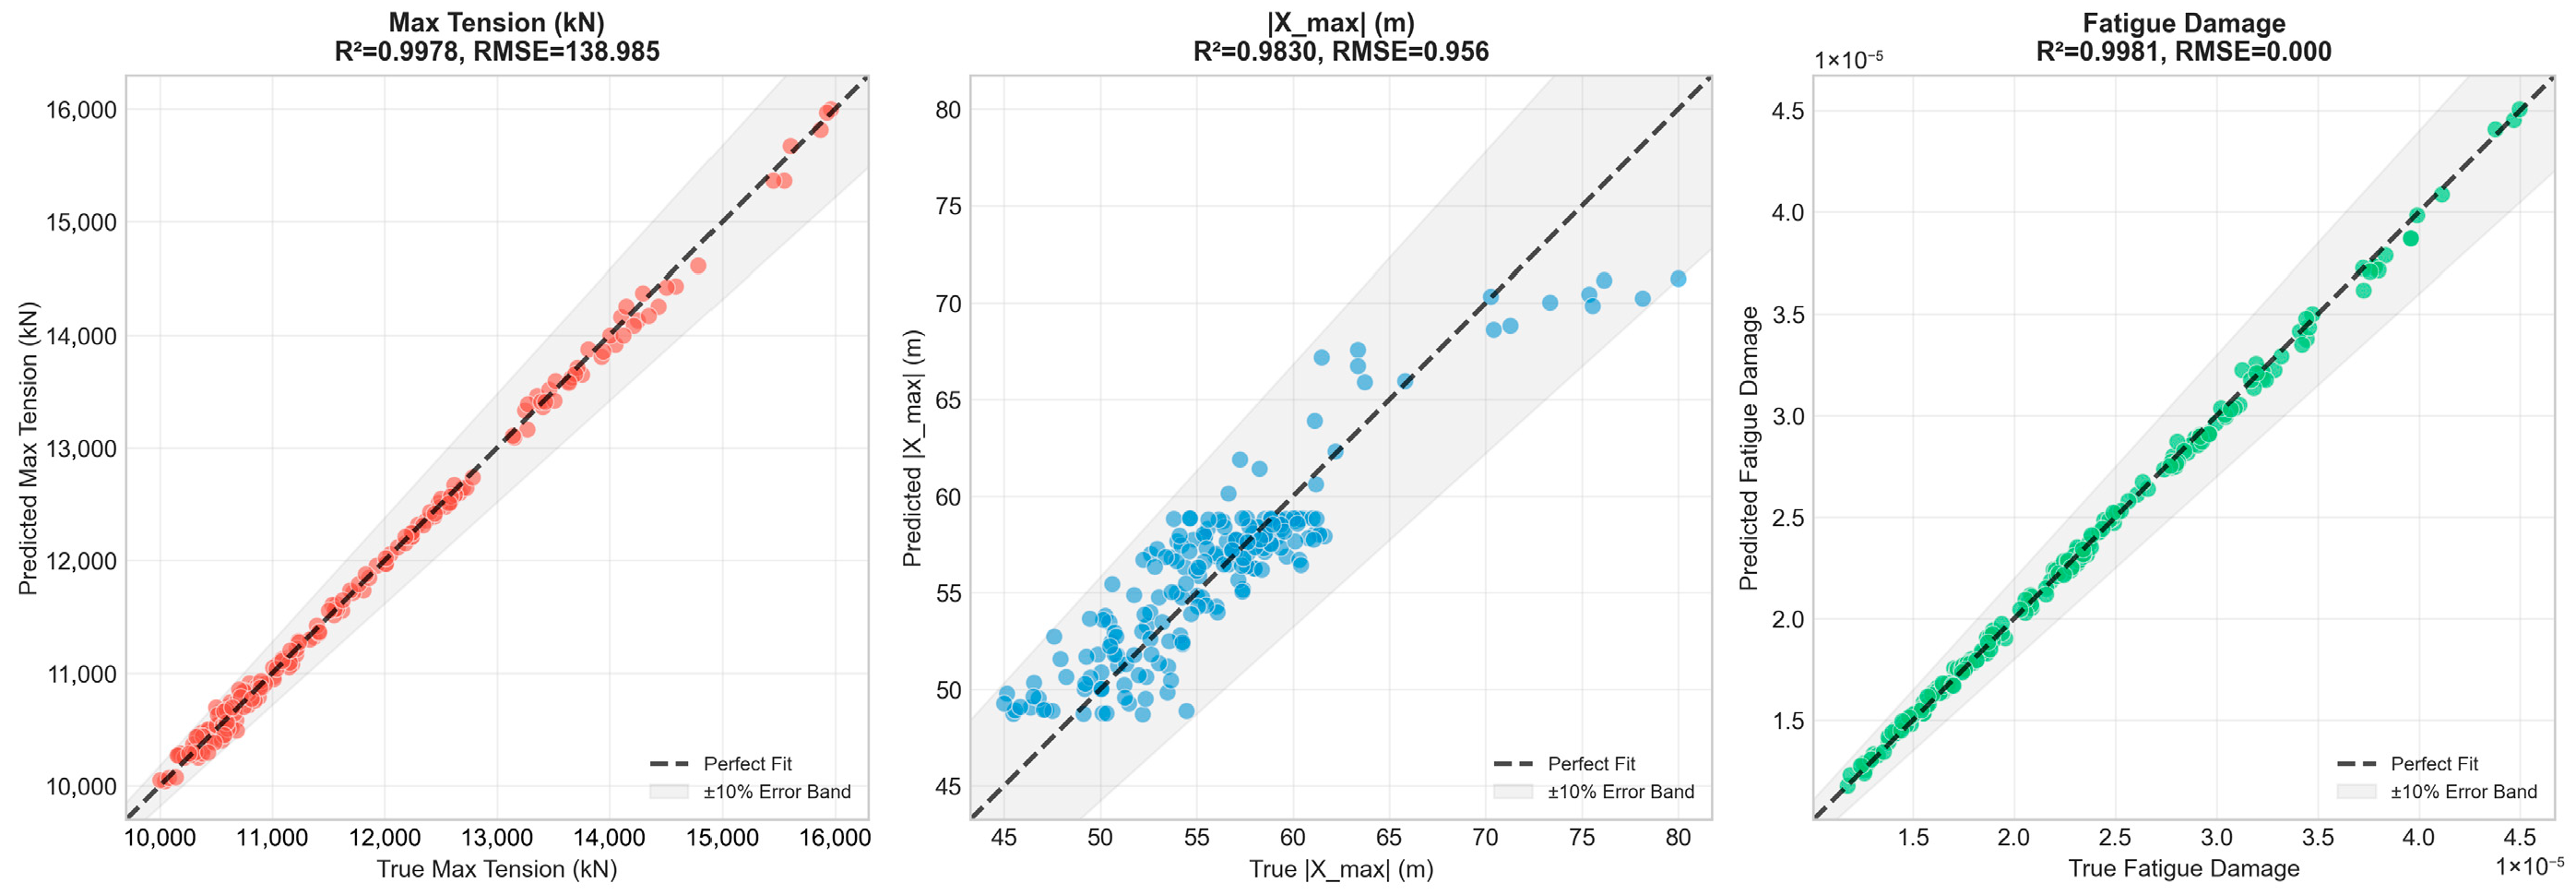
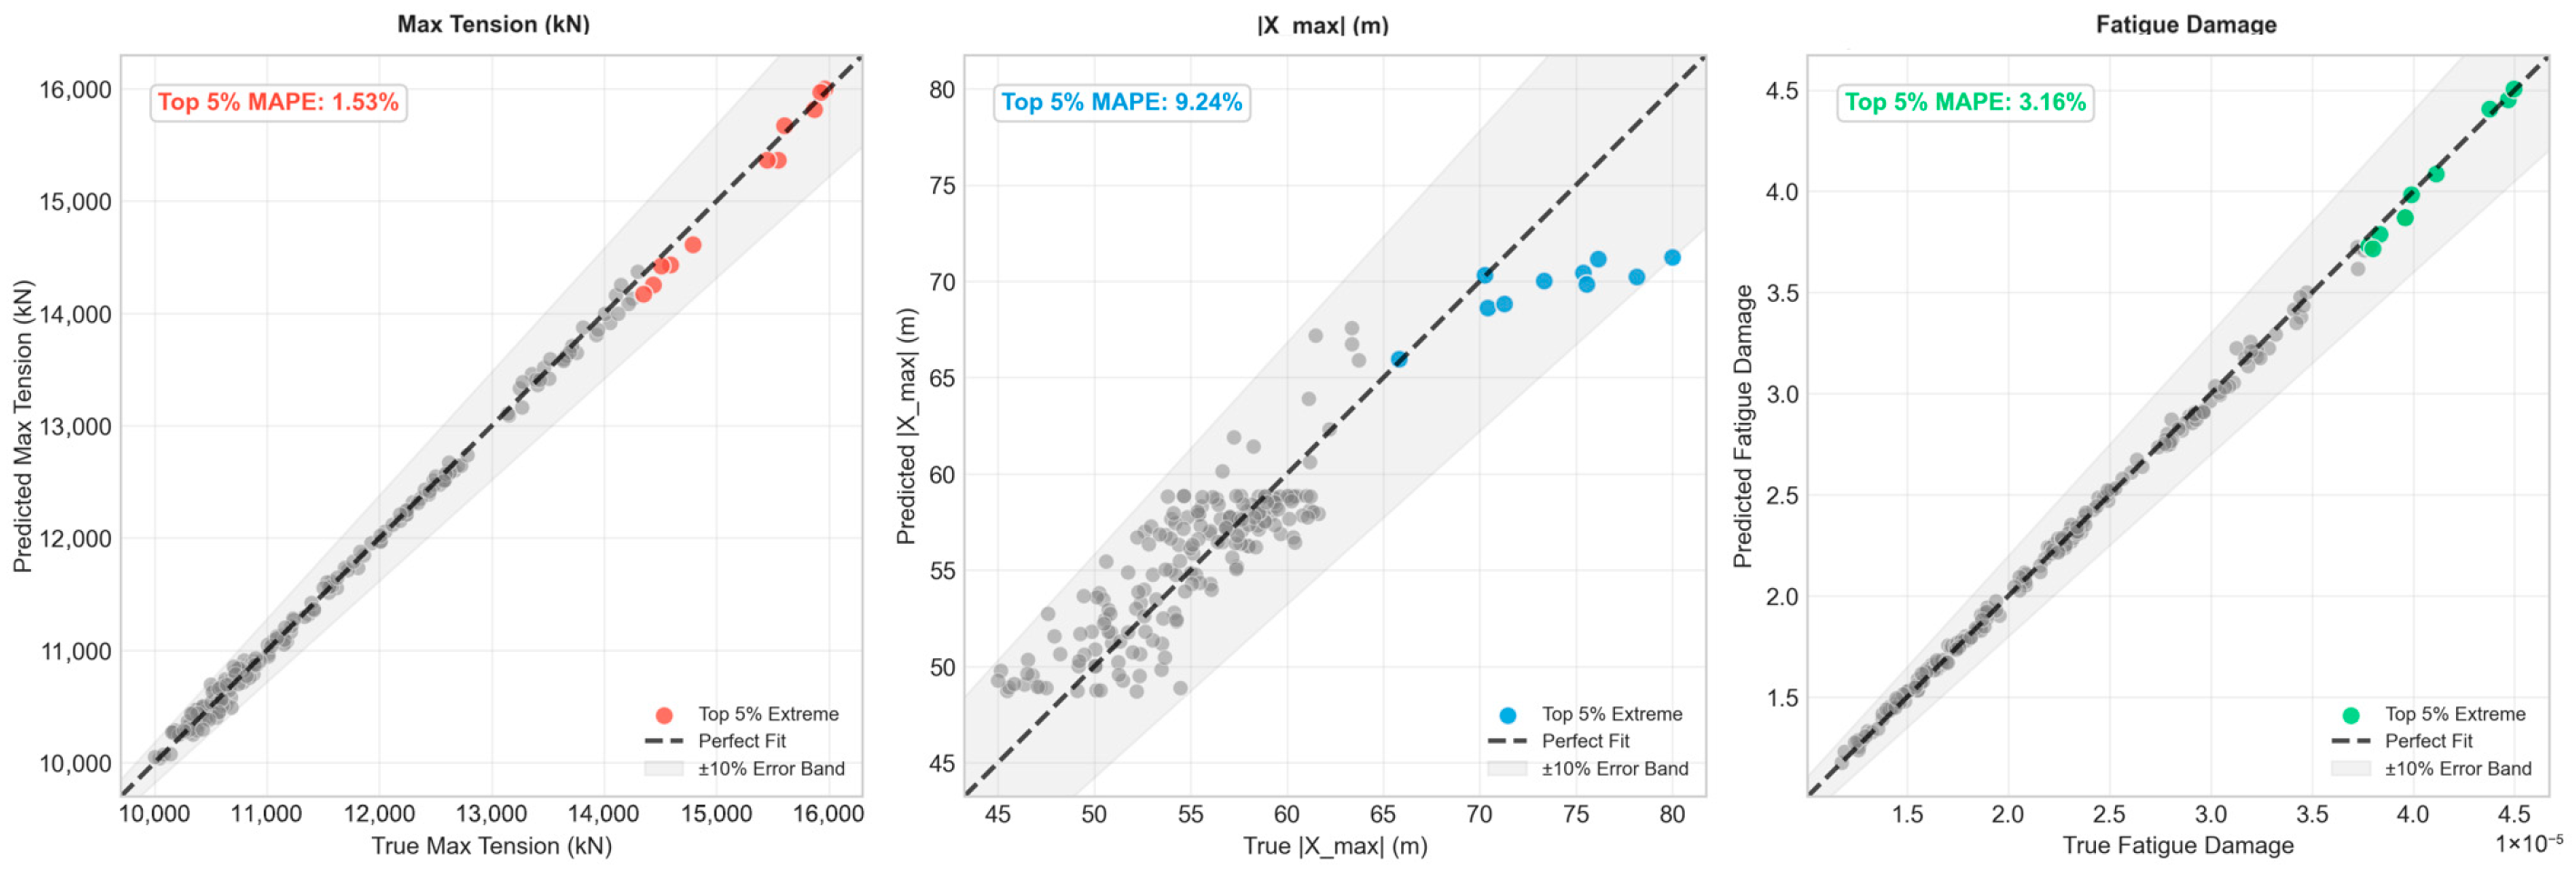
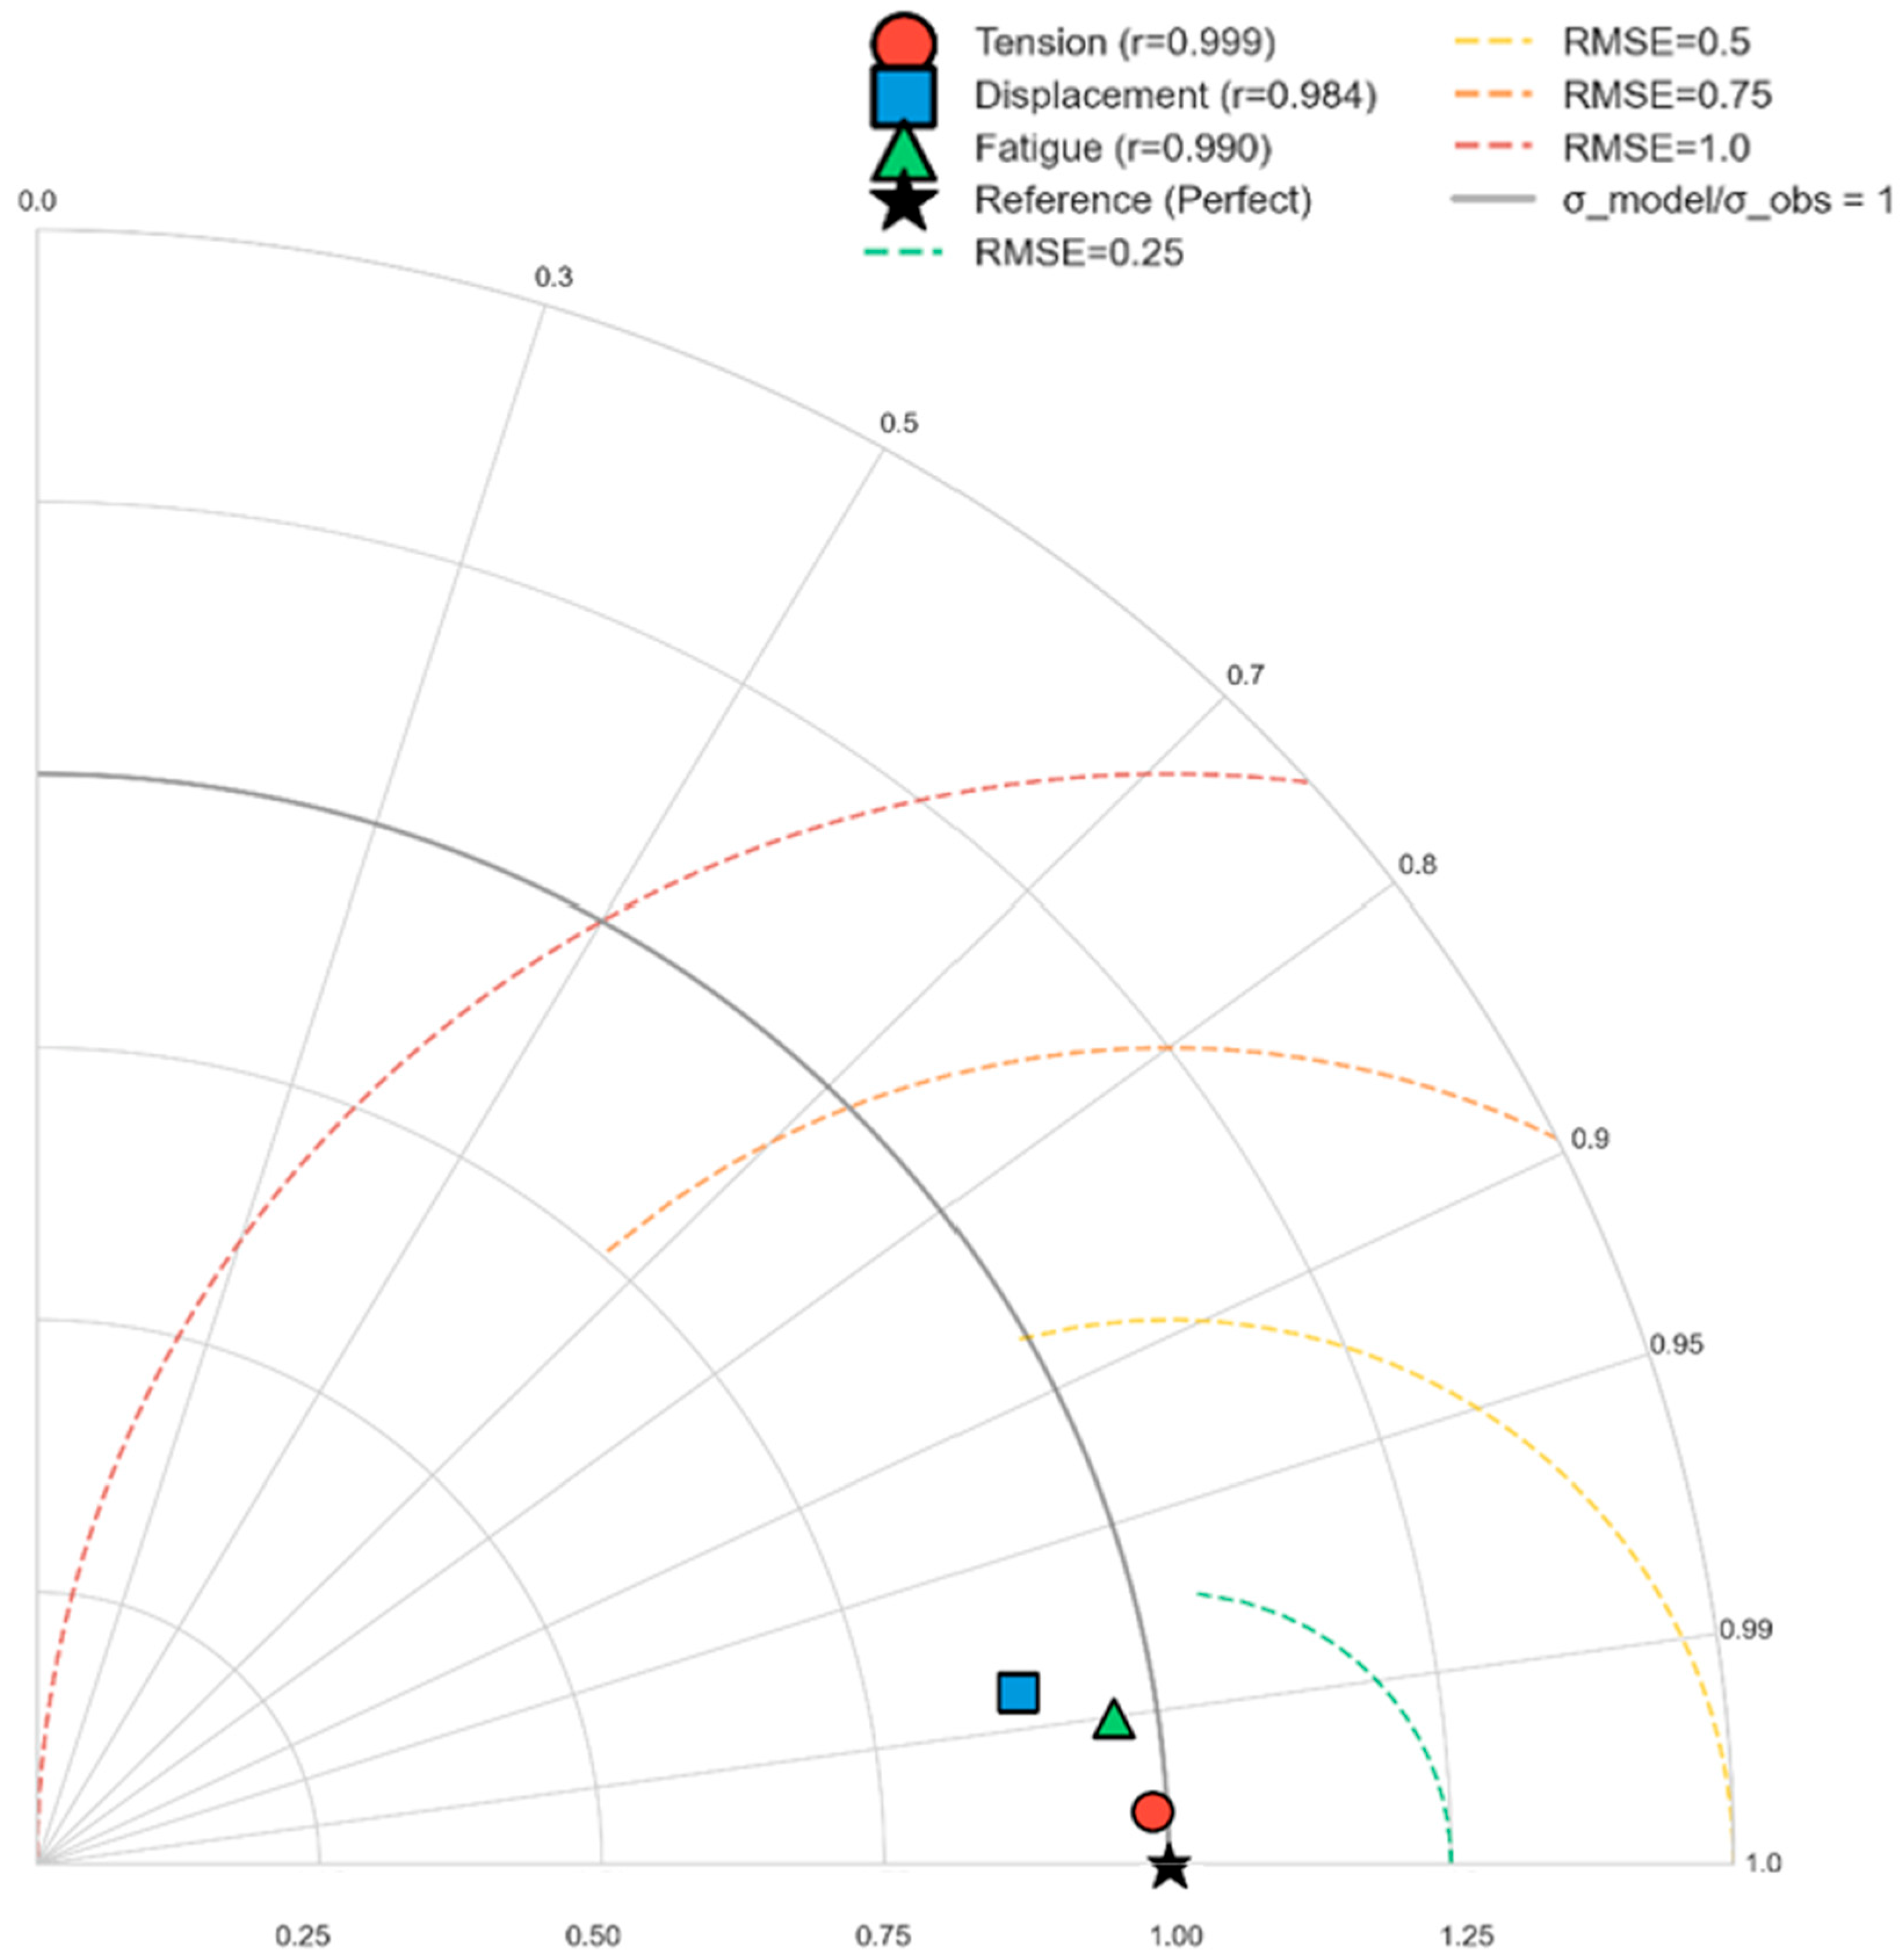
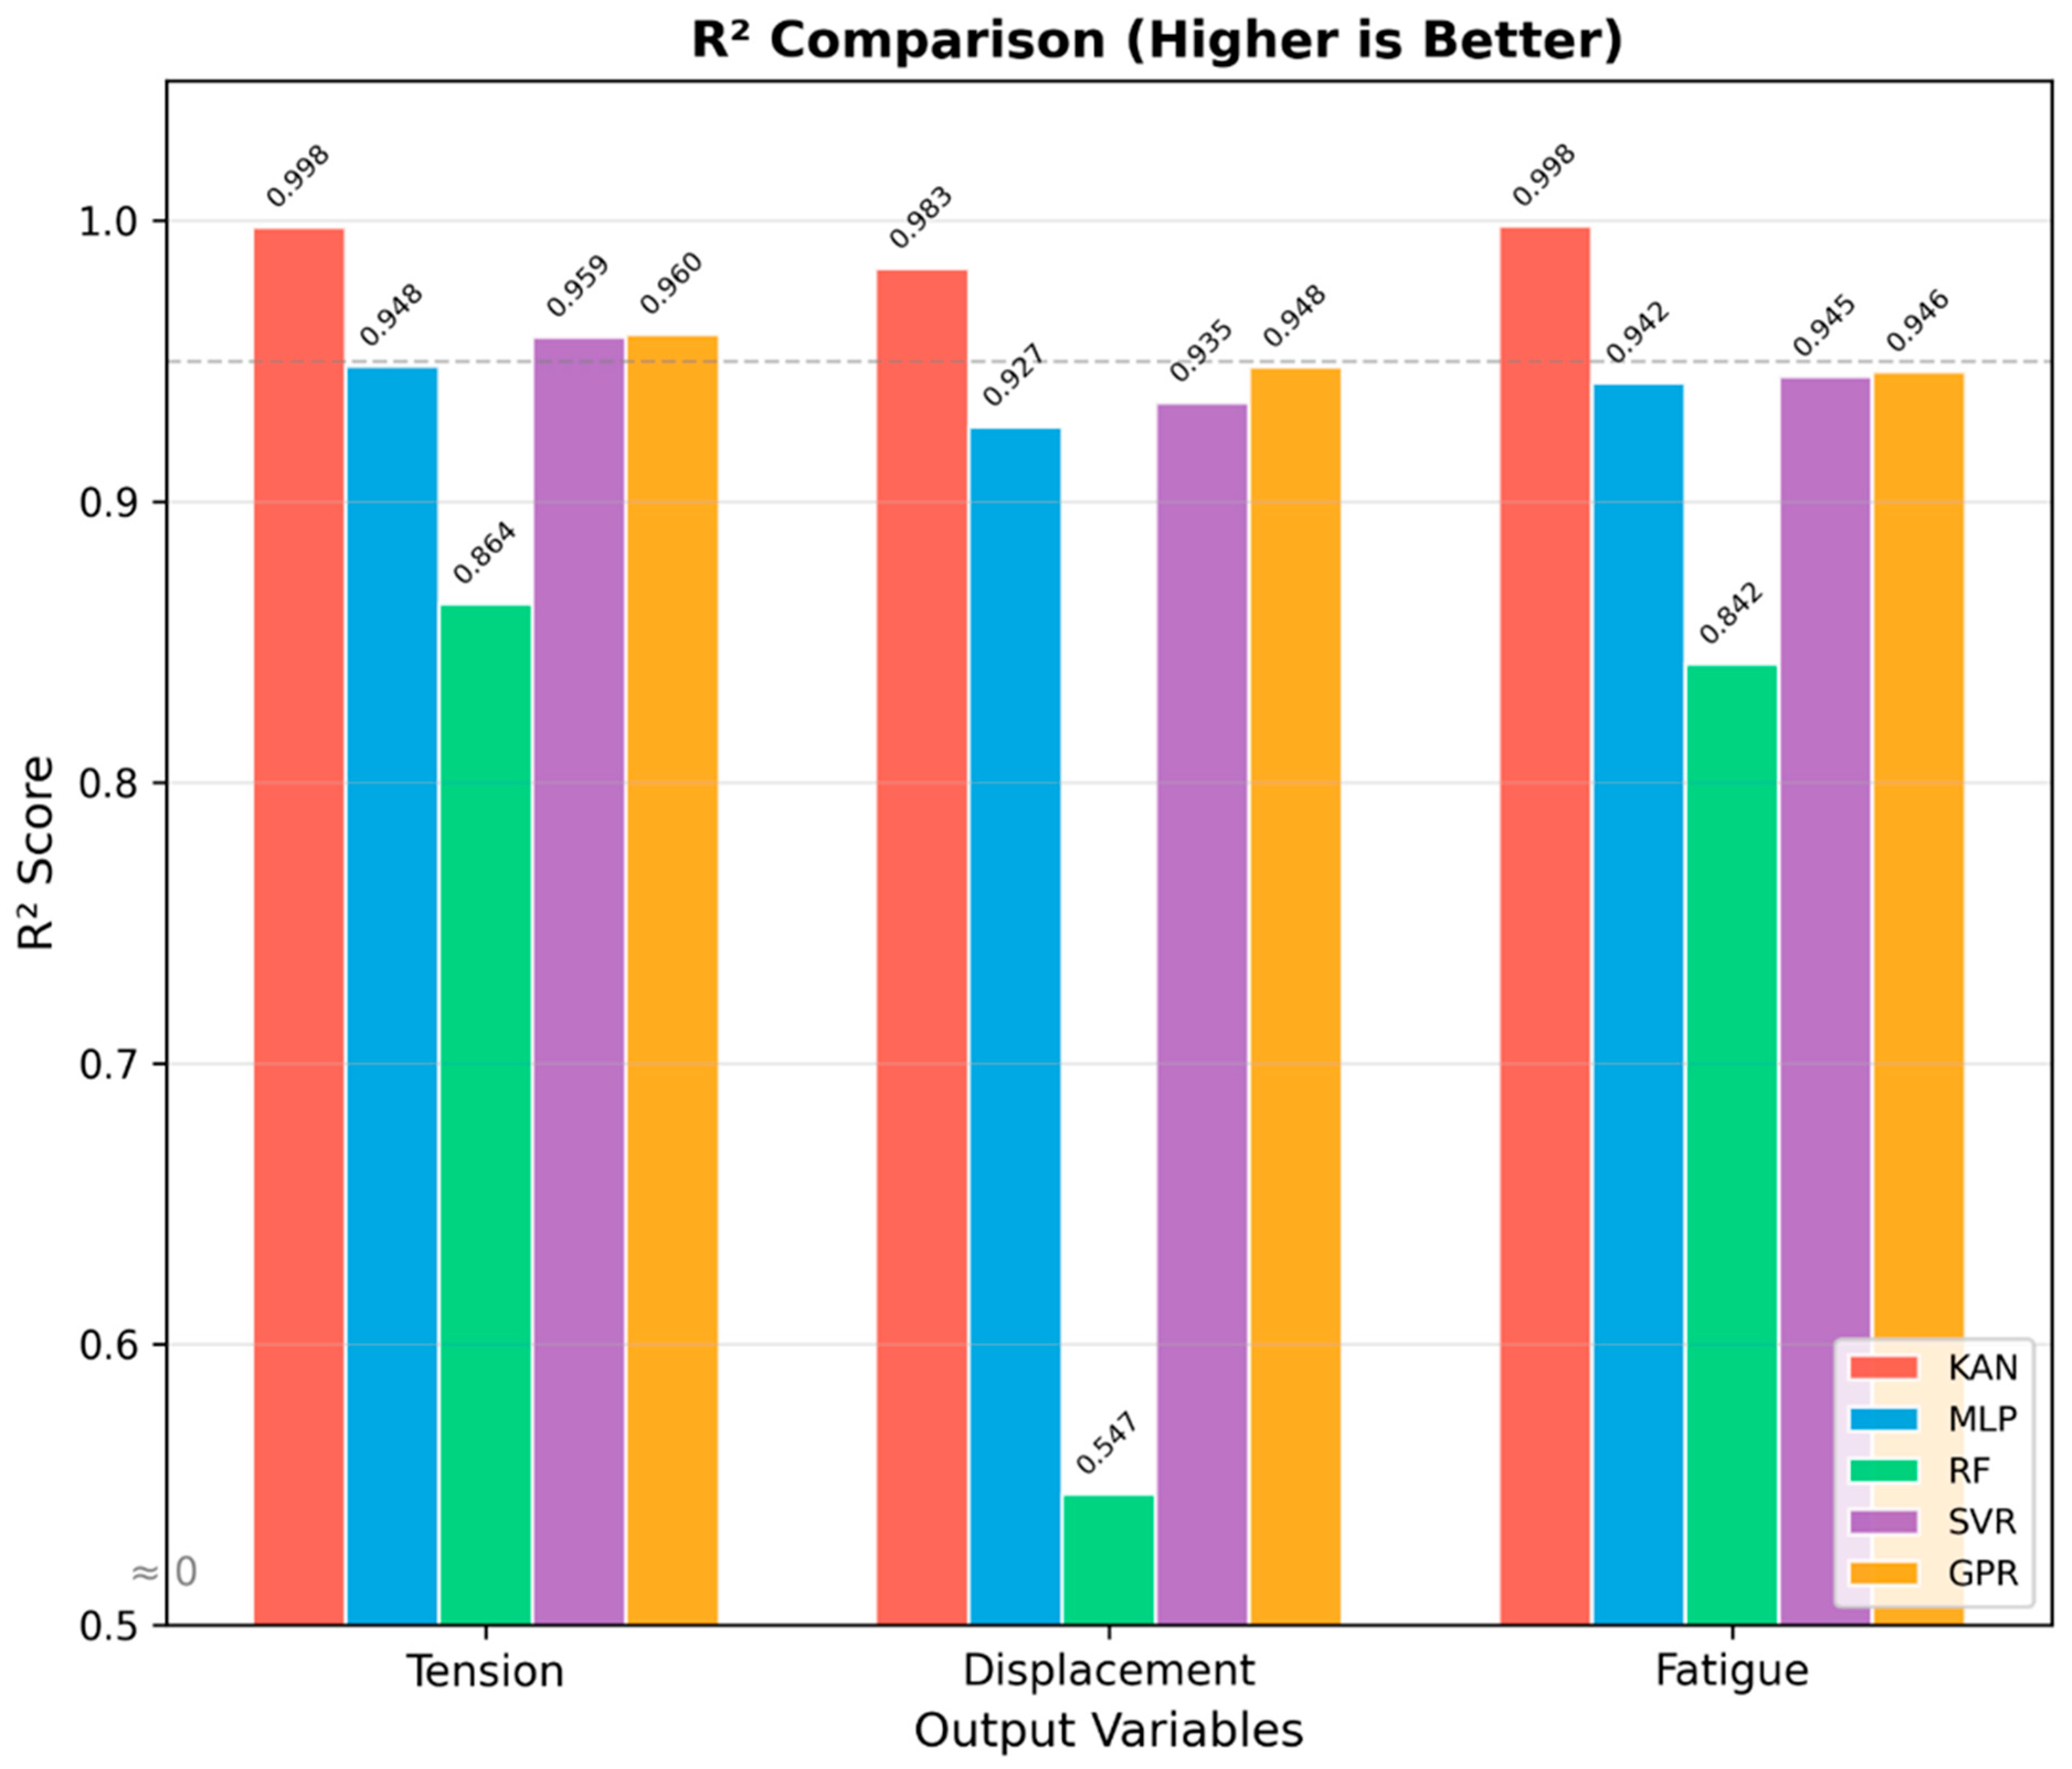
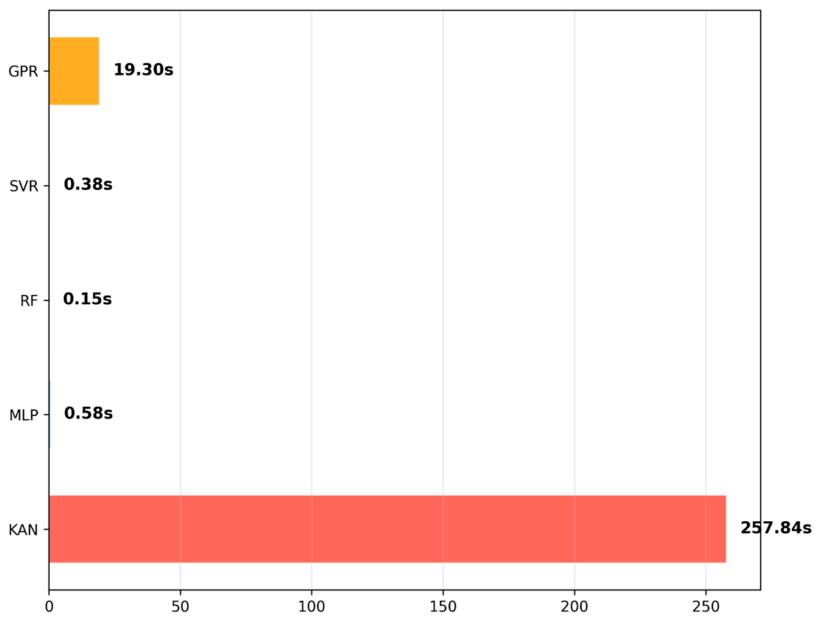
Given the smoothing properties of spline coefficients, Limited-memory Broyden-Fletcher-Goldfarb-Shanno (LBFGS) optimization (implemented via PyTorch (version 2.3.0+cu121) with a learning rate of 1.0) replaces the traditional Adam algorithm to approximate complex regression surfaces with faster convergence. During this training phase, an 80/20 train-test dataset partition was utilized for continuous loss monitoring. Driven by the LBFGS optimizer and the aforementioned sparse regularization, both the training and independent testing losses converged smoothly and plateaued synchronously. The ultimately minimal gap between the training and testing error metrics confirms that the model successfully captures the underlying physical dynamics of the mooring system rather than memorizing data noise.
3.3. Non-Dominated Sorting Genetic Algorithm III Algorithm Integration
3.3.1. Formulation of the Multi-Objective Optimization Model
In the design optimization of cylindrical FPSO mooring systems, the mooring radius, upper and lower anchor chain diameters, polyester cable segment length, polyester cable diameter, and lower chain length are selected as design variables. These are defined as the decision vector. This study aims to identify the optimal parameter combination while simultaneously minimizing both dynamic response and cost. The overall mathematical model for this multi-objective optimization problem can be expressed as:
where
,
, and
represent the maximum tension of the mooring system, the absolute value of the platform’s maximum horizontal displacement, and the cumulative fatigue damage of the mooring lines, respectively, as predicted by the KAN surrogate model. Meanwhile,
denotes the cost per mooring line in the system. For the “chain-polyester cable-chain” configuration, the cost objective function is specifically formulated as follows:
where
and
correspond to the nominal diameter design variables for steel anchor chain and polyester rope, respectively,
,
and
represent the design length variables for the top anchor chain, bottom anchor chain, and intermediate polyester rope section, respectively. The constant terms 40.336 and 2.447 in the formula represent equivalent unit price coefficients. These values incorporate the market unit prices of each material segment (steel anchor chain: ¥20,000/ton; polyester rope: ¥35,000/ton) and the conversion relationship between unit length mass and diameter squared. It should be explicitly clarified that the cost function defined in Equation (14) serves as a relative proxy indicator tailored specifically for the multi-objective optimization framework, rather than an absolute appraisal of the total project expenditure. During the cost estimation, fixed costs that do not vary with the mooring design parameters (e.g., installation and baseline operational costs) were deliberately excluded. Minimizing this specific cost indicator effectively steers the Pareto exploration process toward material-efficient configurations, ultimately yielding more cost-effective design solutions.
Multiple constraints were established during optimization. Standard physical constraints include: safety factors for each cable segment
, maximum tension
(capped by the minimum breaking load MBL), maximum platform horizontal displacement
, and fatigue damage index
throughout the entire lifecycle. To ensure the geometric rationality of the submerged profile, constraints were introduced: the total cable length variation must not exceed 10% of the median in the initial sample, and the diameter ratio
must be maintained to prevent the resulting optimization solution from being engineering-unfeasible. The risk prediction of the surrogate model in unfamiliar areas may be distorted, leading the optimization algorithm to converge to a false optimal solution. To address this, we innovatively introduce a confidence region boundary constraint based on the Mahalanobis distance:
where
denotes the mean vector of the KAN model training samples, and
represents the covariance matrix. This constraint uses the quantile
, a 5-dimensional chi-squared distribution with a confidence level of 99%. Since the training samples effectively cover the design space and strict physical constraints a priori dominate the evolution of the Pareto front, this conservative confidence level is selected as the statistical safety threshold. Its primary role is to serve as a reliability mechanism for the generalized optimization framework. This ensures that surrogate model extrapolation is effectively avoided in various engineering scenarios, thus improving the overall credibility of the optimization results.
3.3.2. Algorithm Parameter Settings and Search Strategy
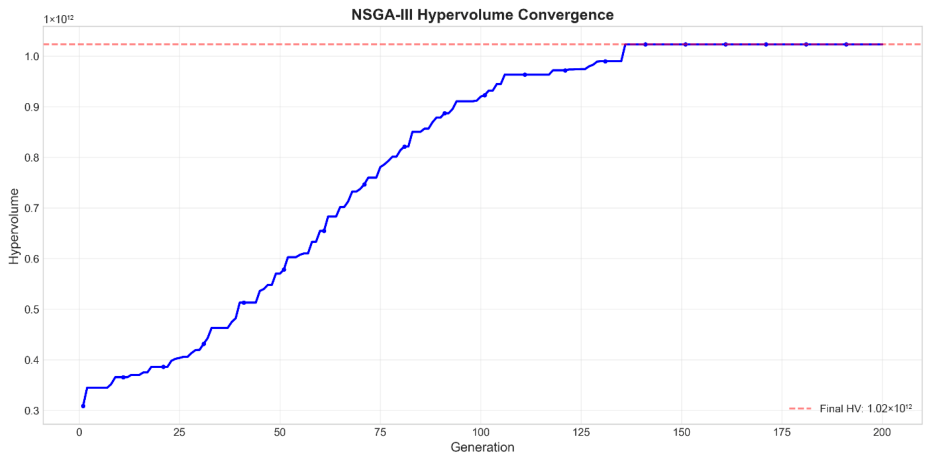
In a 4-dimensional objective space, sparse populations cannot fully map complex nonlinear trade-off surfaces, making it highly likely to overlook balanced solutions with engineering potential. Therefore, to ensure high resolution and uniform sampling in high-dimensional spaces, the algorithm employs the Das-Dennis criterion to generate reference points, setting the spatial partitioning layer count to , thereby precisely generating 1330 reference directions on the target-dimensional plane. To rigorously match the extensive reference point scale and guarantee global exploration capability during evolution, the population size is expanded to 1400, with a maximum iteration limit of 200 generations. Furthermore, to balance the algorithm’s global search and local exploitation capabilities, the core iteration strategies employ the classic Simulated Binary Crossover (crossing probability , distribution exponent ) and Polynomial Mutation (mutation probability , distribution exponent ) from continuous space optimization.
5. Conclusions
This research proposes a surrogate-assisted cylindrical FPSO mooring system optimization design method. This method innovatively combines the Kolmogorov–Arnold (KAN) neural network with the Non-dominated Sorting Genetic Algorithm III (NSGA-III) and applies it to surrogate optimization. By optimizing the mooring parameter configuration, it achieves system stress minimization and load mitigation while balancing economy, reliability, and safety. The optimization significantly limits the platform’s offset, thereby enhancing fatigue resistance and reducing overall costs. The research results show that:
- (1)
The LHS+KAN+NSGA-III optimization framework demonstrates exceptional performance. Latin hypercube sampling ensures the diversity of the training dataset, while the introduction of the surrogate model replaces time-consuming time-domain simulations. This approach also enhances the genetic algorithm’s ability to efficiently and accurately identify optimal solutions.
- (2)
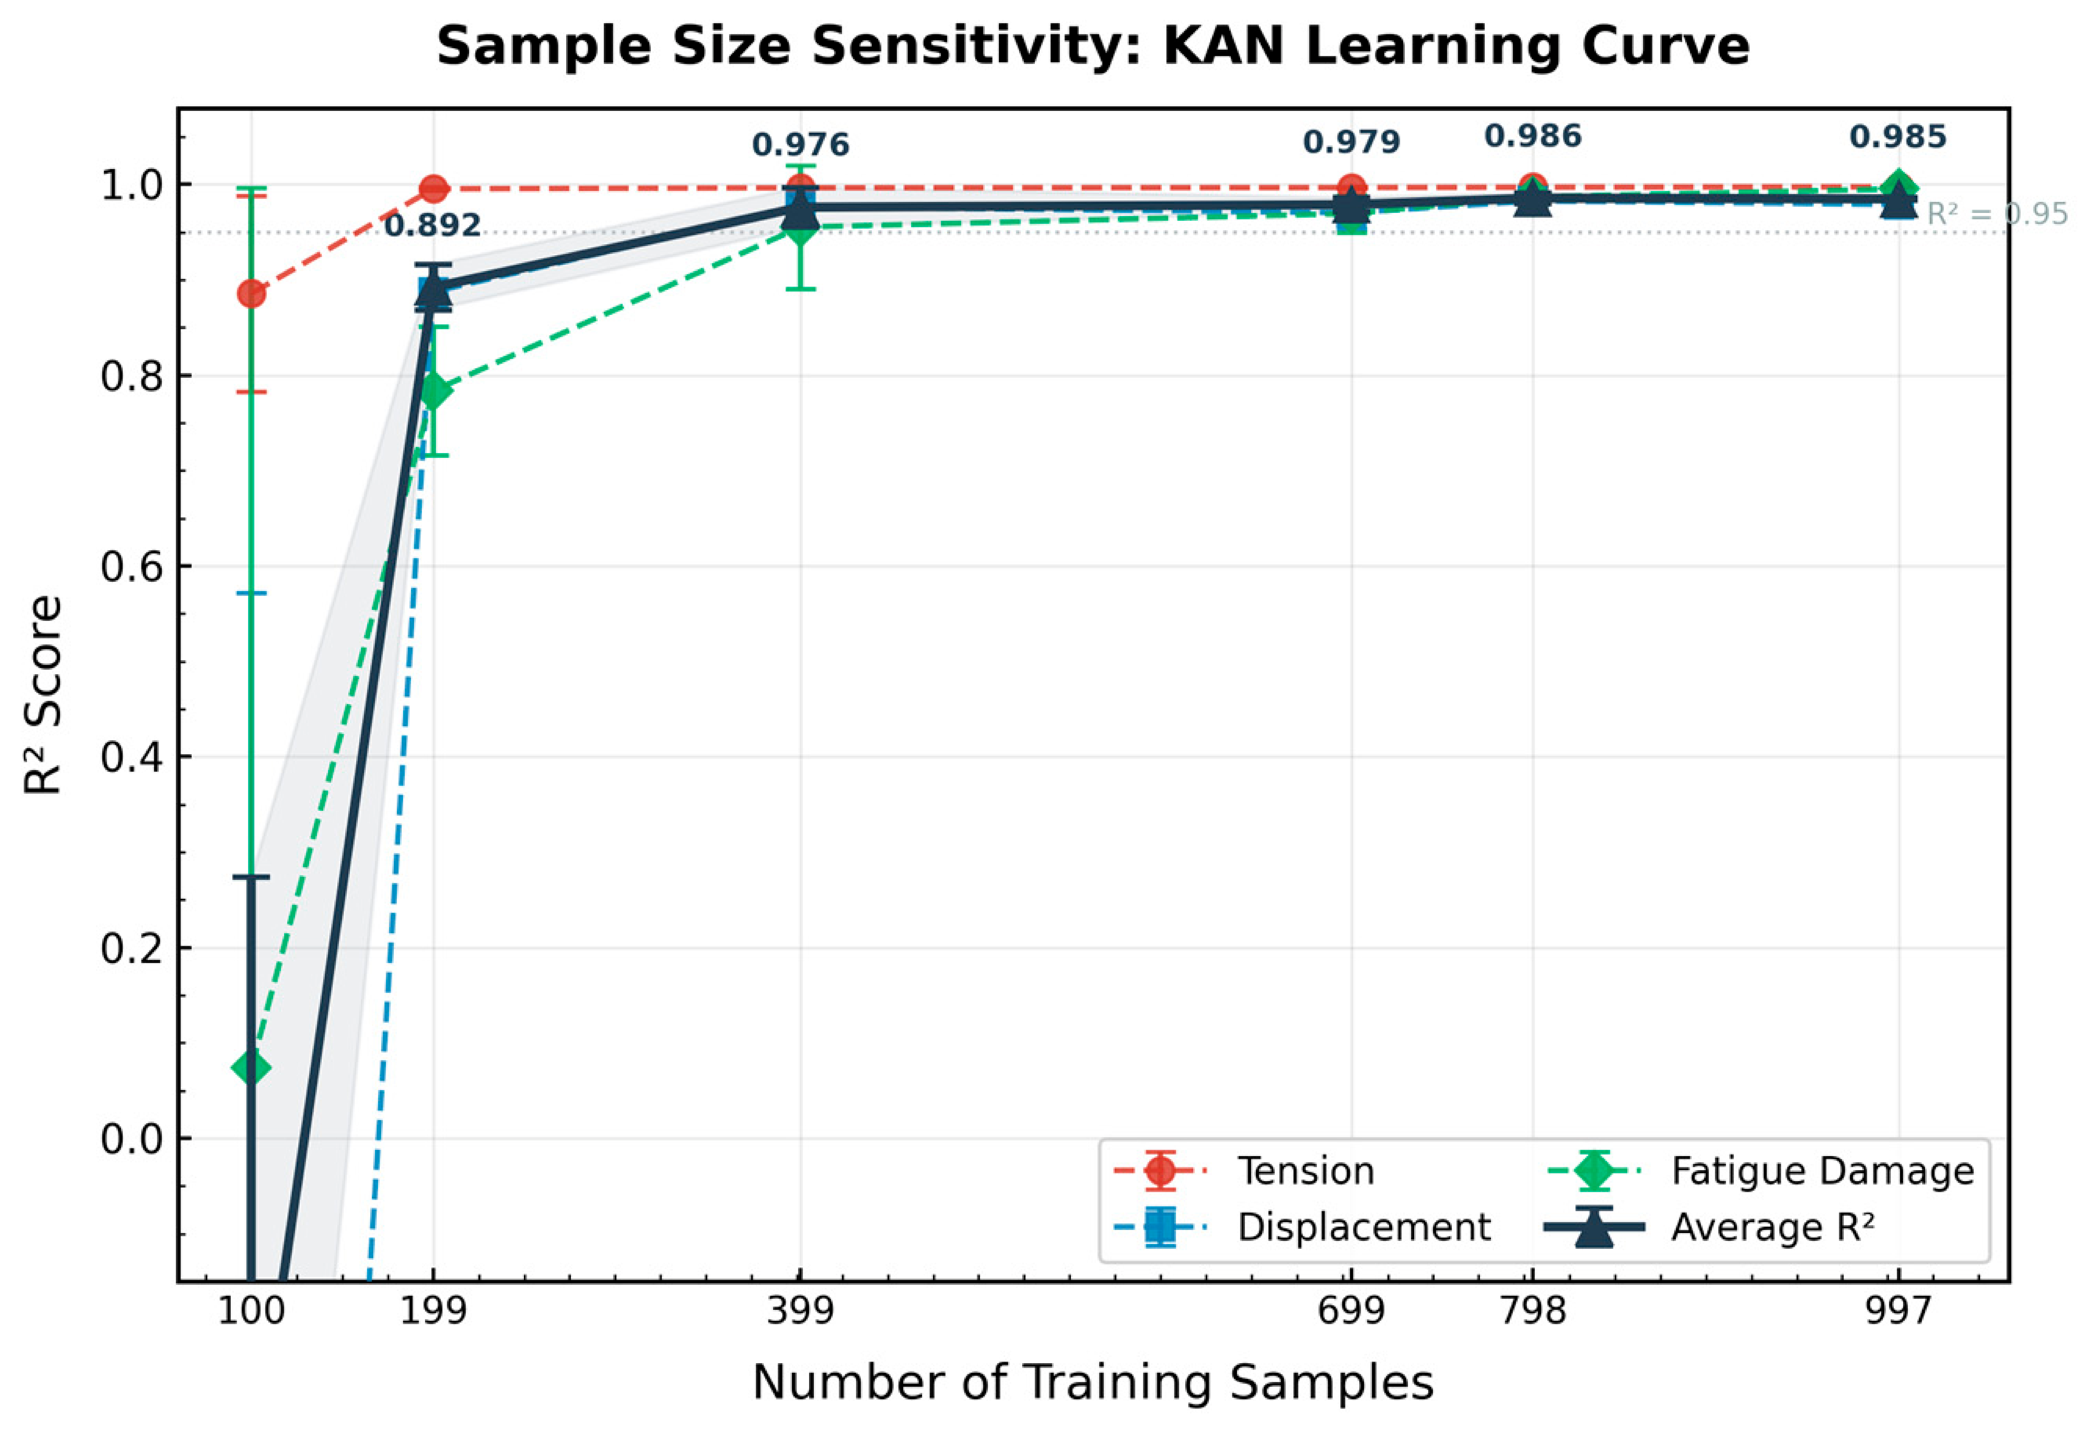
Adopting the KAN model as a surrogate model has significant advantages over the traditional surrogate model. Its architecture is completely different from that of conventional neural networks, so the KAN model is naturally suitable for such multi-input and multi-output nonlinear regression problems. The “white box” interpretability of the model can achieve a smoother fitting of the target function while avoiding the dimensional curse in the model training process. This enables it to achieve higher accuracy and efficiency when dealing with small sample problems.
- (3)
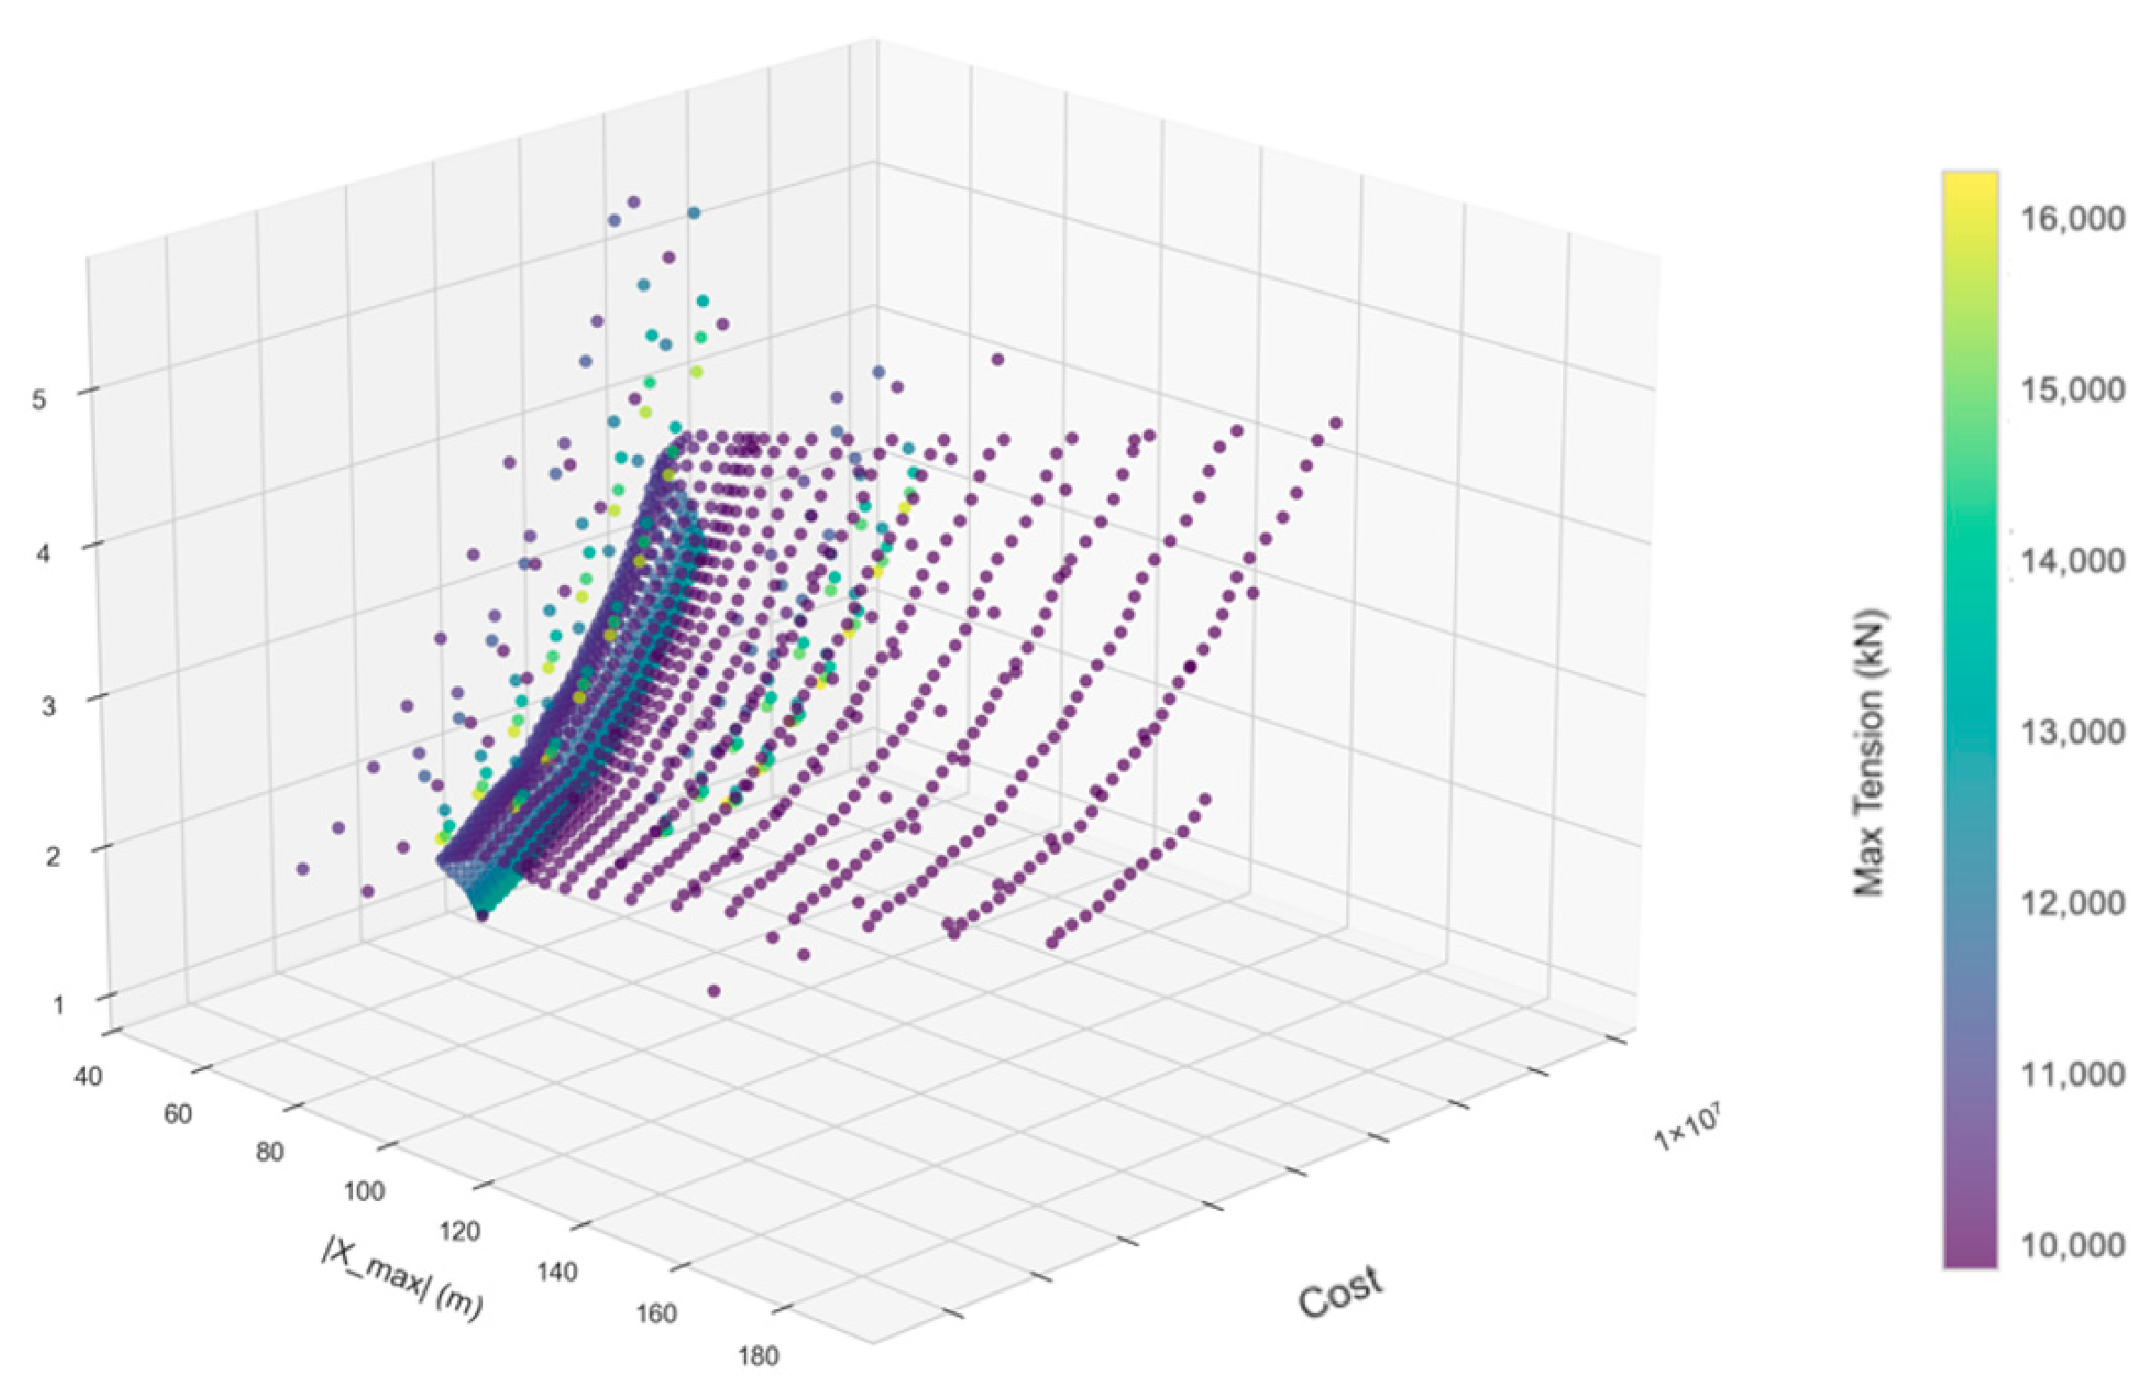
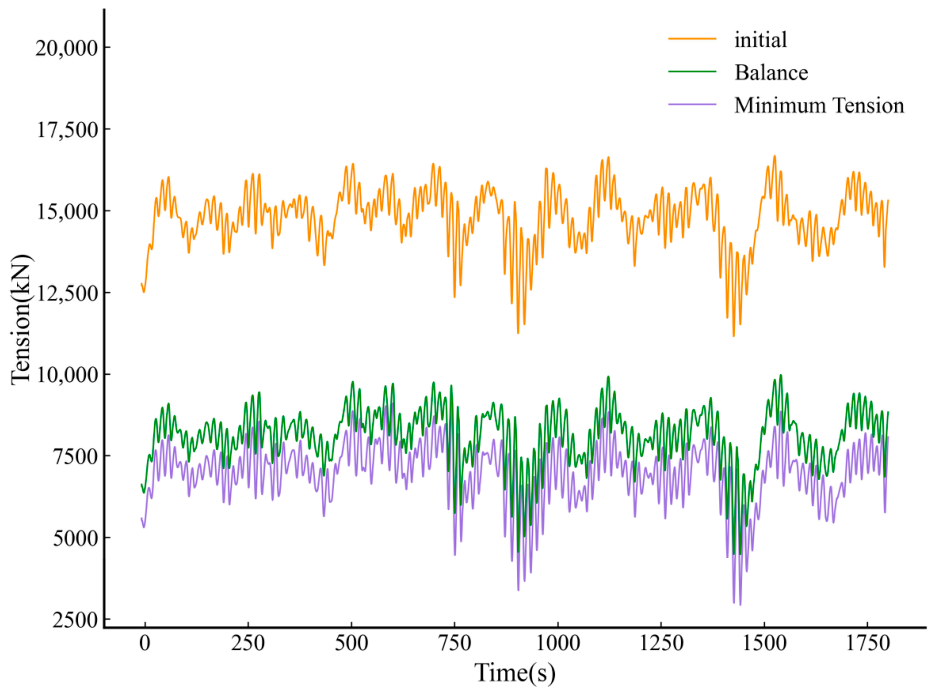
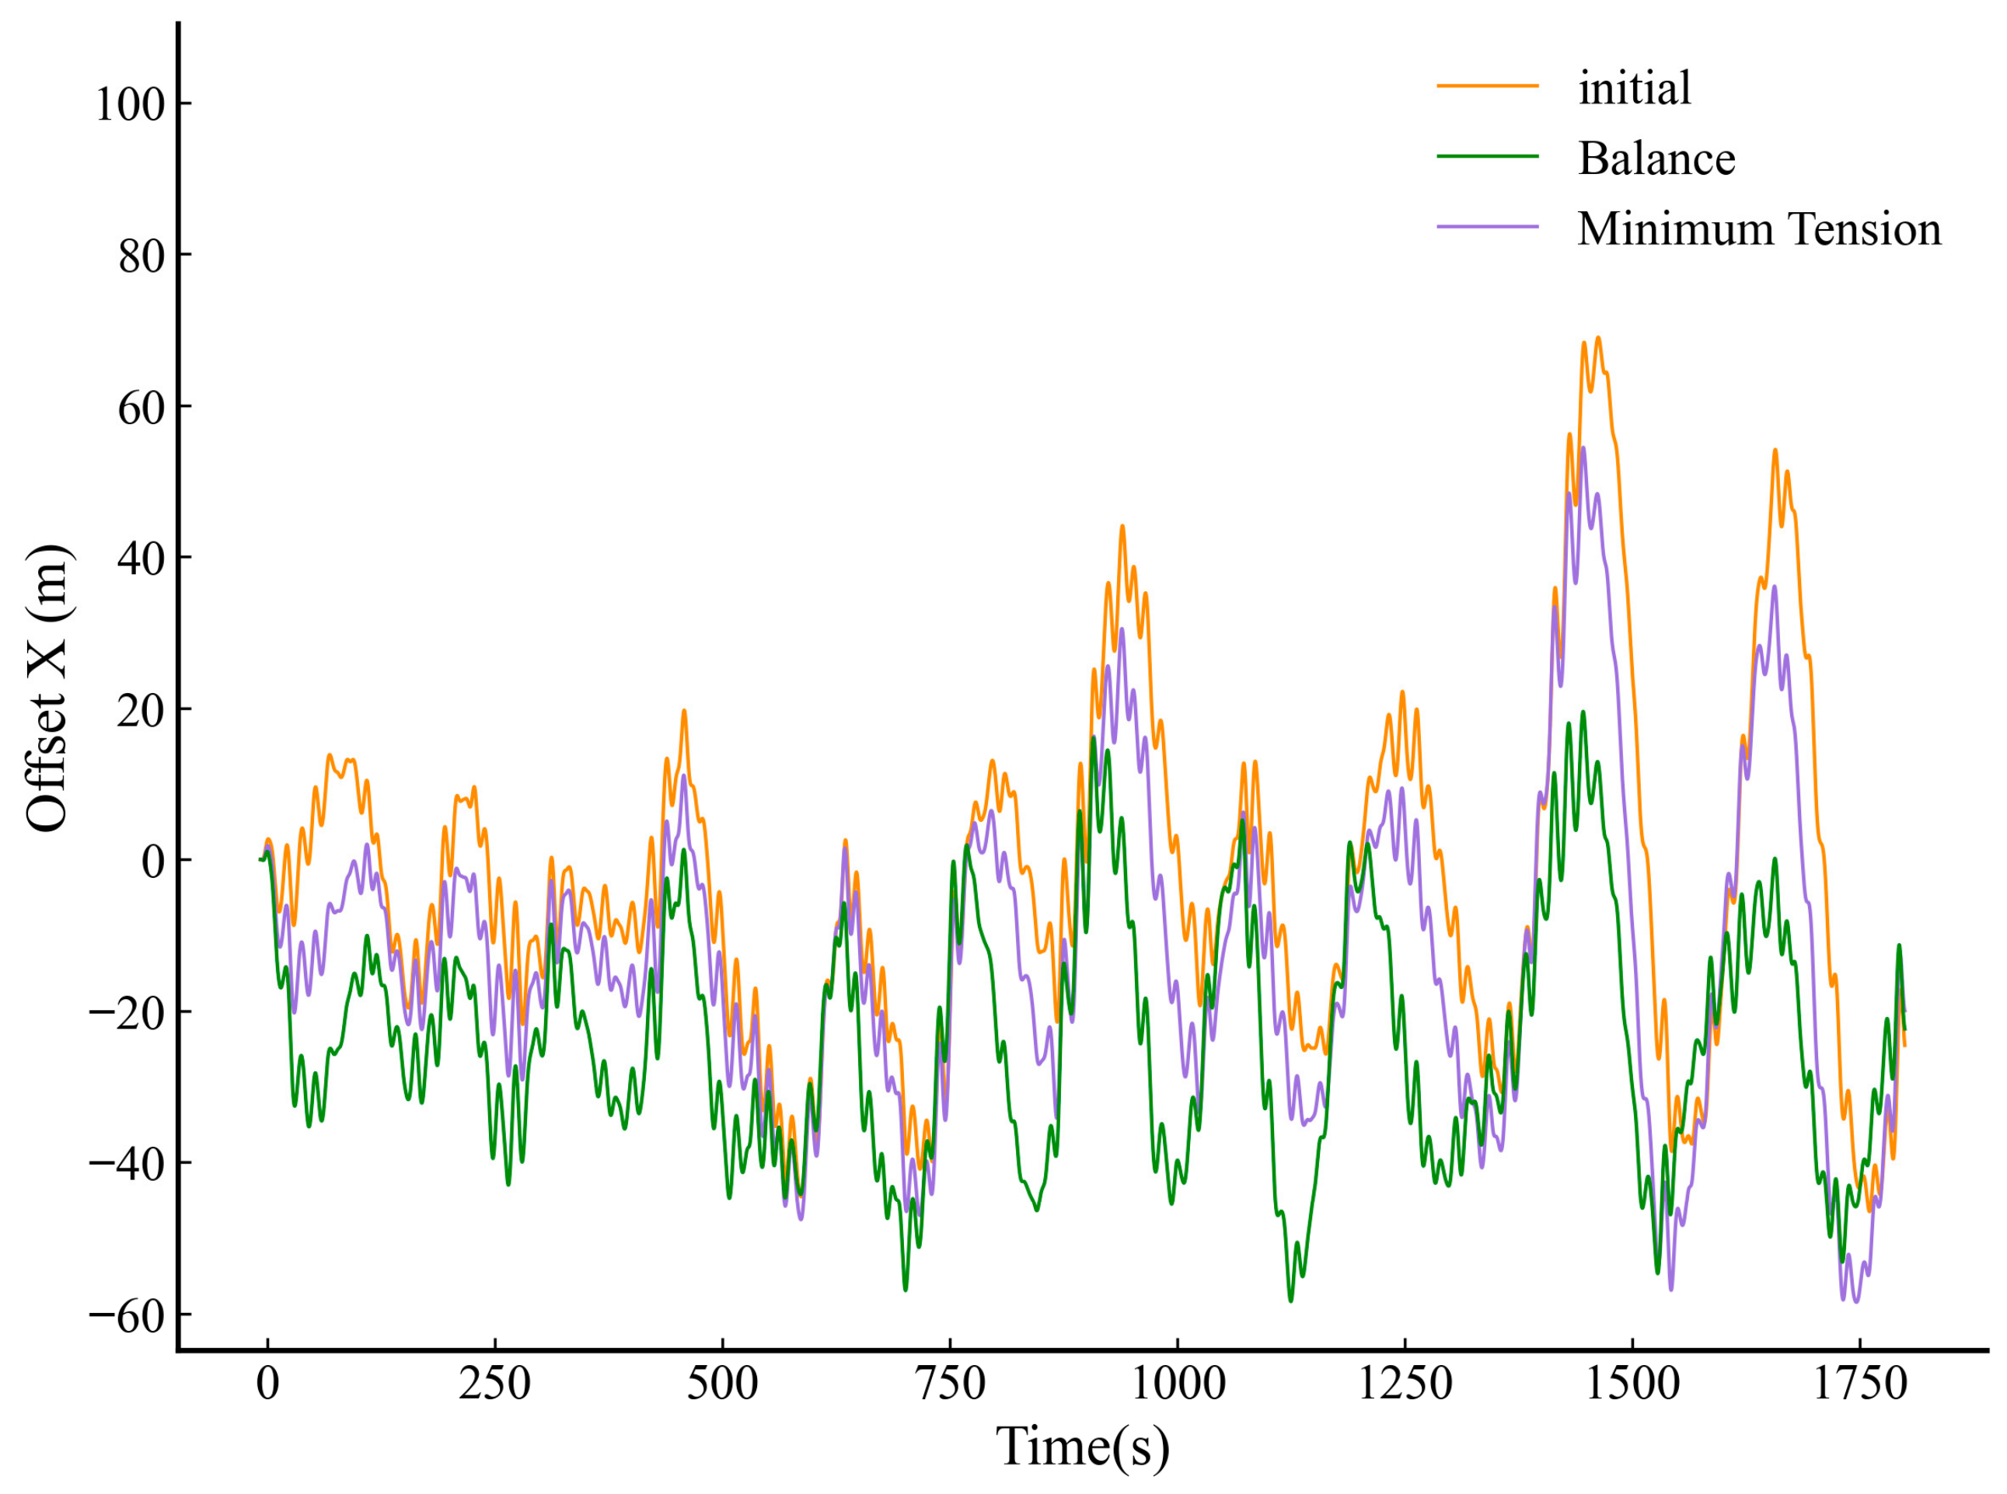
Simulated binary crossover (SBX) and polynomial mutation operators within the Non-dominated Sorting Genetic Algorithm III framework are used to ensure the validity of the Pareto optimal solution space and avoid falling into the local optimal trap. The Mahalanobis distance is used as a boundary constraint to ensure the reliability of the solution space. From the Pareto frontier, three single-objective extreme schemes (minimum tension, minimum offset, and minimum cost) were determined. Furthermore, a globally balanced solution was identified using the ideal point minimum distance method, providing a flexible decision-making reference for various engineering demands.
This study combines the KAN surrogate model with the NSGA-III algorithm to put forward an optimization method for the mooring system, which provides a reliable guarantee for design research. However, the current method is only applicable to a single deterministic sea state and reflects the system performance through the response results. It cannot accurately show the response characteristics under dynamic sea conditions. The KAN model has significant advantages in solving complex nonlinear problems and has a broad application prospect in the field of marine engineering. The follow-up research will incorporate the mooring response under different environmental conditions to build a more comprehensive and rigorous optimization framework.




 ,
,